Embed Size (px)
Citation preview
Instrument Reference Guide
Revision May 19th 2008
vb5™, vb6™, vb7™ and vb8™ Data Collectors and Analyzers
ii
COPYRIGHT © 2008 Commtest Instruments Ltd.
All rights reserved. No part of this document may be reproduced, stored in a retrieval system, or transmitted in any form or by any means, electronic, mechanical, photocopy, recording or otherwise without the prior written permission of Commtest Instruments Ltd. For information, contact:
Commtest Instruments Ltd 28B Moorhouse Avenue Christchurch New Zealand E-mail [email protected]
Printed in New Zealand.
Disclaimer
The information provided in this document is subject to change without notice. Names and data used in examples are fictitious unless otherwise noted. This document is distributed as is, without warranty of any kind, either expressed or implied, respecting the contents of this document, including but not limited to implied warranties for the document’s quality, performance, merchantability, or fitness for any particular purpose. Neither Commtest Instruments Ltd nor its employees, dealers, agents or distributors shall be liable to the user of this document or any other person or entity with respect to any liability, loss or damage caused or alleged to be caused directly or indirectly by this document.
Trademark Notice
vb™, vb1000v™, vb1000™, vb2000™, vb3000™, vb5™, vb6™, vb7™, vb8™, vbBalancer™, vbBalancer+™, 6Pack™, vbXManager™ and PROFLASH™ are trademarks of Commtest Instruments Ltd. vbSeries
®, Commtest
®,
vbOnline®
and Ascent® are registered
trademarks of Commtest Instruments Ltd. Other trademarks and registered trademarks are the property of their respective owners.
iii
Contents
Section 1: Introduction.................................................1
Standard Features .................................................................1 Standard Kit Items .................................................................2 Instrument Capabilities...........................................................3 Precautions............................................................................5 Hazardous Locations .............................................................7 Instrument Connections .........................................................9 Front Panel Buttons ............................................................. 10 LED Indicators ..................................................................... 11 Charging the Battery Pack ................................................... 12 Battery Features .................................................................. 12 Removing the Battery Pack.................................................. 13 Operating Overview ............................................................. 14
Onsite Analysis..........................................................................14 Recording Routes......................................................................15 Balancing ...................................................................................15 Keypad Entry .............................................................................16
Section 2: Instrument Basics.....................................18
Powering On/Off .................................................................. 18 Navigating Menus ................................................................ 19 Returning to a Previous Menu.............................................. 19 Using Navigation Keys and Icons......................................... 20 Selecting an Option from a List ............................................ 21 Canceling an Option ............................................................ 23 Displaying Hint Labels and Detailed Help ............................ 23 Displaying Alternative Options ............................................. 24 Entering Alphanumeric Characters ...................................... 25 Entering Punctuation, Spaces and Special Characters ........ 27 Using Other Icons ................................................................ 28
iv
Section 3: Using Sensors...........................................30
Supported Sensor Types ..................................................... 30 Connecting Sensors to the Instrument ................................. 31 Mounting Sensors................................................................ 32 Setting up the Accelerometer............................................... 33
Permanent Mounting .................................................................34 Setting up the Tachometer................................................... 34 Tachometer Signal from a Keyphasor® ............................... 36 Using a Strobe ..................................................................... 37
Section 4: Analyzing Measurements Onsite.............38
Tips for Taking Measurements............................................. 38 Walk-through: Taking Measurements................................... 39 Working with Charts............................................................. 42 Analyzing Measurements..................................................... 42
Using Cursors............................................................................43 Zooming.....................................................................................45
Viewing Multiple Charts........................................................ 46 Changing Chart View ........................................................... 46 Setting the Y Axis (Amplitude) Scale.................................... 47 Amplitude Display Units ....................................................... 48 Setting the RPM................................................................... 49 Viewing Orders .................................................................... 50 Viewing Revolutions............................................................. 51 Saving Measurements ......................................................... 51
Section 5: Setting Measurement Options .................53
Setting Measurement Units and Spectrum Scaling .............. 53 Setting Measurement Parameters........................................ 55 Creating Your Own Parameter Sets..................................... 56 Assigning Sensors to Channels ........................................... 57 Explaining Spectrum Parameters......................................... 58
Fmax..........................................................................................58 Spectral Lines............................................................................59 Fmin...........................................................................................59 Tach Trigger ..............................................................................60
v
Averaging...................................................................................60 Number of Averages ...........................................................60 Average Type ......................................................................60 Average Overlap..................................................................61
Window......................................................................................61 Explaining Waveform Parameters........................................ 62
Equivalent Fmax........................................................................62 Number of Samples...................................................................62 Duration .....................................................................................62
Other Measurement Parameters.......................................... 63
Section 6: Measurement Types and Their Uses.......64
Spectrum ............................................................................. 64 Waveform ............................................................................ 65 Demodulation Explained ...................................................... 66
Analyzing Demodulation Data ...................................................67 6Pack................................................................................... 68 Demod Spectrum................................................................. 70 Tachometer Display ............................................................. 70 Time Synchronous Averaging .............................................. 71 Bump Test ........................................................................... 72 Coast-down/Run up ............................................................. 73 Cross Channel Phase Explained.......................................... 74
Fault Types and their Phase Relationships...............................75 Measuring Cross Channel Phase..............................................76
Long Time Waveforms Explained ........................................ 78 Measuring Long Time Waveforms ............................................78 Viewing Long Time Waveforms on your PC..............................79
Keypad Entry ....................................................................... 80 Average Value Measurements............................................. 81 Taking Multi-channel Simultaneous Measurements ............. 82
Setting up Sensors and Channels.............................................82 Saving Multi-channel Measurements ........................................83
Section 7: Taking Recordings (Offsite Analysis) .....85
Walk-through: Taking Recordings ........................................ 85 Taking Individual and Multiple Recordings ........................... 86
vi
Saving Recordings............................................................... 87 Reviewing Recordings ......................................................... 88 Deleting Recordings............................................................. 89 Attaching Notes ................................................................... 90 Working with Baseline Recordings....................................... 90
Section 8: Sending and Receiving Information........92
Transferring Recordings to the Ascent Program .................. 92 Transferring Folders to the Instrument ................................. 93
Re-sending Updated Folders.....................................................93 Synchronizing the Timezone on the Instrument and PC....... 94
Section 9: Using Routes.............................................96
What is a Route? ................................................................. 96 Walk-through: Taking Recordings Using a Route................. 96 Recording Multiple Channels on a Route ............................. 98 Skipping Route Entries and Machines................................ 101 Locating Skipped Route Entries ......................................... 102 Tracking Your Progress Through a Route.......................... 102 Saving Route Recordings .................................................. 103
Selecting Recordings to Review..............................................104 Retaking Recordings.......................................................... 105 Deleting a Route Recording ............................................... 106 Taking Off-route Recordings .............................................. 106 Editing or Deleting a Route ................................................ 107
Section 10: Creating, Editing and Deleting Items ..108
Storage Capacity and Recording Volume .......................... 108 How are Recordings Organized and Stored?..................... 108 Working with Folders ......................................................... 110
Creating a Folder.....................................................................110 Renaming a Folder ..................................................................110 Deleting a Folder .....................................................................110 Restoring a Deleted or Over-Written Folder............................110
Working with Machines ...................................................... 111 Creating Machine Structures...................................................112
vii
Creating Parameter Sets .........................................................112 Adding Structures to Existing Machines..................................114 Copying Machine Structures ...................................................114 Renaming Machine Structures ................................................115 Deleting Machine Structures ...................................................115
Working with Sensors ........................................................ 116 Defining and Editing Sensors ..................................................116 Using the Bias Voltage Check.................................................118 Setting a Default Sensor..........................................................119 Deleting Sensors .....................................................................119
Working with Notes ............................................................ 120 Creating Notes.........................................................................120 Editing Notes ...........................................................................120 Attaching Notes .......................................................................120 Viewing Notes..........................................................................121 Removing Notes ......................................................................121 Deleting a Note Permanently...................................................121
Deleting all Recordings in a Folder .................................... 122 Deleting all Stored Information........................................... 122
Section 11: Balancing Rotors (vb7 and vb8 Instruments Only) .....................................................123
Methods for Balancing Rotors............................................ 123 The Balancing Process ...................................................... 124 Tips for Balancing .............................................................. 125 The Tachometer ................................................................ 126 Suggested Trial Weight Mass and Location ....................... 126 Manually Entering Balancing Information ........................... 126 Setting up a Balancing Job ................................................ 127
Balance Planes and Weight Positions.....................................128 Balance Planes..................................................................128 Weight Position (Reference Mark) ....................................128
# Sensors.................................................................................130 CH Position........................................................................130
Averages..................................................................................132 Machine Information ................................................................132
Rotor Weight, Diameter and Speed ..................................132 Reference Mark .................................................................133
viii
Weight Orientation...................................................................133 Tach Trigger ............................................................................134 Weight Lin Dist ........................................................................134 Store Units ...............................................................................134
Combining Trim Weights.................................................... 134 Step 3. Take a Trial Reading ............................................. 135 Reviewing Previous Balancing Jobs................................... 139
Section 12: Balancing Walk-through (vb7 and vb8 Instruments Only) .....................................................140
Step 1. Set Up a New Balance Job .................................... 140 Step 2. Take an Initial Reading .......................................... 141 Step 4. Balance the Rotor .................................................. 142 Step 5. Perform Trim Balancing ......................................... 143 Step 6. Viewing and Saving Balancing Jobs ...................... 145
Section 13: Utilities...................................................146
Setting the Date and Time ................................................. 146 Adjusting the Date Format.......................................................147
Selecting Your Local Timezone.......................................... 147 Adjusting Sound Volume.................................................... 147 Set the Instrument Language............................................. 147 Printing Directly to a Network Printer.................................. 148 Adjusting Screen Contrast ................................................. 149 Turning the Backlight On/Off.............................................. 149 Recharging the Instrument................................................. 150 Estimating Remaining Operating Time............................... 150 Conserving Battery Power ................................................. 150
Setting Backlight Timeout........................................................151 Setting Sleep Mode Timeout ...................................................151 Setting Complete Powerdown Timeout ...................................152
Checking How Much Memory is Available ......................... 152 Freeing Instrument Memory ............................................... 152 Upgrading Instrument Firmware (Proflashing).................... 153
ix
Section 14: Troubleshooting ...................................155
Contacting Technical Support ............................................ 155 Resetting an Unresponsive Instrument .............................. 155 Network Communications Problems .................................. 155 Ethernet Connection Lost in Windows Vista....................... 157
Appendix: Specifications .........................................159
vb5..................................................................................... 159 vb6..................................................................................... 161 vb7..................................................................................... 163 vb8..................................................................................... 165
Index ..........................................................................167

Section 1: Introduction
1
Section 1: Introduction
This Instrument Reference Guide is the companion manual to the Ascent Software Reference Guide. Please keep this book for future reference and read it before operating your instrument.
Although this book makes use of common vibration analysis and balancing concepts, it is not intended as a comprehensive guide or training manual. Please ensure you have the relevant knowledge and experience to carry out the procedures described. It is essential to follow all appropriate safety precautions when working near rotating machinery.
Product and support feedback If you any have questions that are not answered in this reference guide, or would like to make a suggestion, please contact us at www.commtest.com.
Standard Features
• DSP for fast, accurate calculations • 24-bit A/D converter providing high-precision measurements
• Displacement, velocity, acceleration and current measurements (vb6 and vb8 instrument models also support voltage and user defined measurements)
• Frequency and time domain measurements • 1 GB non-volatile flash memory providing almost unlimited
recording storage
• Time and date stamped recordings • vb firmware - upgradeable using Commtest PROFLASH • Temperature compensated graphical LCD (Liquid Crystal
Display) with 480 x 320 pixels and white LED backlight
• 4500 mAh custom Lithium Ion battery pack • Battery charger
• USB or Ethernet interface for PC communications • Ascent Windows® based vibration analysis software
Section 1: Introduction 2
• Tachometer and Keyphasor® input for speed and phase measurements (Keyphasor® not supported by the vb5 instrument model)
• Balancing analysis: single and dual plane (vb7 and vb8 instrument models only)
• Route and off-route recording modes
Standard Kit Items Note: Additional accelerometers and associated accessories are included with multi-channel instruments.
• vbSeries portable instrument (vb5, vb6, vb7 or vb8 analyzer) with carry strap and sensor bracket
• Power adapter 12 V 3 A output, center positive • DC car adapter 12 V DC output
• USB data transfer cable • Accelerometer(s) (IEPE/ICP
®-type)*
• Accelerometer coiled cable(s)* • Accelerometer magnetic mounting base(s)* • Triple BNC adapter (vb6 and vb8 instrument models only)
• Non-contact laser tachometer sensor • Ascent vibration analysis software on CD-ROM
• iLearn vibration training CD-ROM • Instrument Reference Guide
• Software Reference Guide • Quick Start Guide • Warranty card
• QA card • Carry bag
* Number provided varies according to instrument model. vb5: 1 unit, vb6/vb7: 2 units, vb8: 4 units.
Balancing kit items (vb7 and vb8 instrument models only)
• Reflective tape
• Adjustable tachometer stand with magnetic mount • Tachometer extension cable (5 meters)
• Accelerometer extension cables (5 meters)+
Section 1: Introduction
3
+ Number provided varies according to instrument model. vb7: 2
units, vb8: 4 units.
Note: Thoroughly inspect your instrument kit's contents upon receipt. If any kit items are missing, please contact Commtest customer support or your sales agent for assistance.
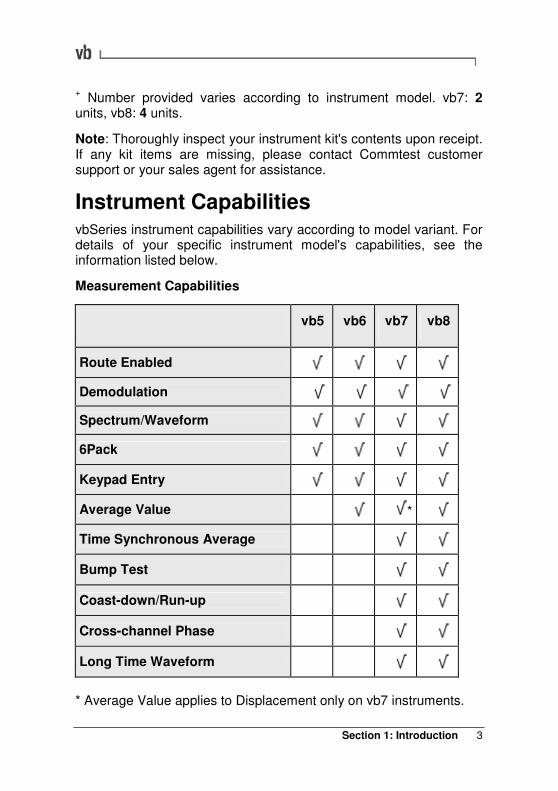
Instrument Capabilities vbSeries instrument capabilities vary according to model variant. For details of your specific instrument model's capabilities, see the information listed below.
Measurement Capabilities
vb5 vb6 vb7 vb8
Route Enabled
Demodulation
Spectrum/Waveform
6Pack
Keypad Entry
Average Value *
Time Synchronous Average
Bump Test
Coast-down/Run-up
Cross-channel Phase
Long Time Waveform
* Average Value applies to Displacement only on vb7 instruments.
Section 1: Introduction 4
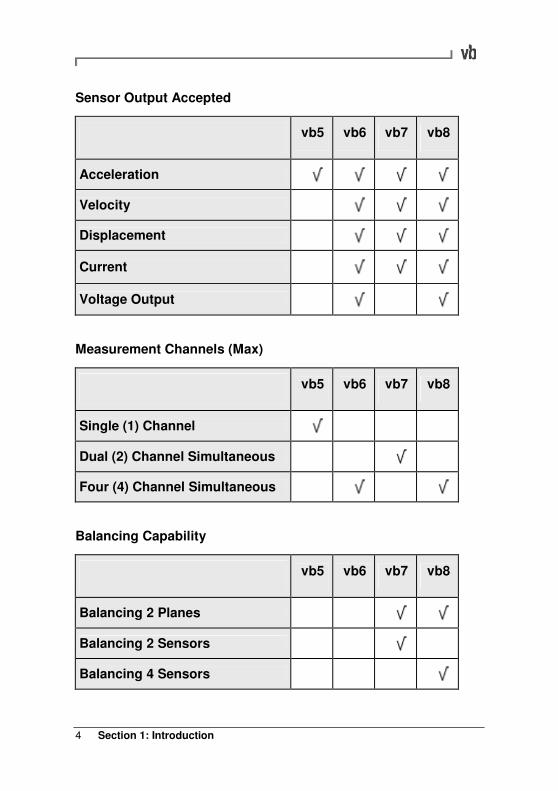
Sensor Output Accepted
vb5 vb6 vb7 vb8
Acceleration
Velocity
Displacement
Current
Voltage Output
Measurement Channels (Max)
vb5 vb6 vb7 vb8
Single (1) Channel
Dual (2) Channel Simultaneous
Four (4) Channel Simultaneous
Balancing Capability
vb5 vb6 vb7 vb8
Balancing 2 Planes
Balancing 2 Sensors
Balancing 4 Sensors
Section 1: Introduction
5
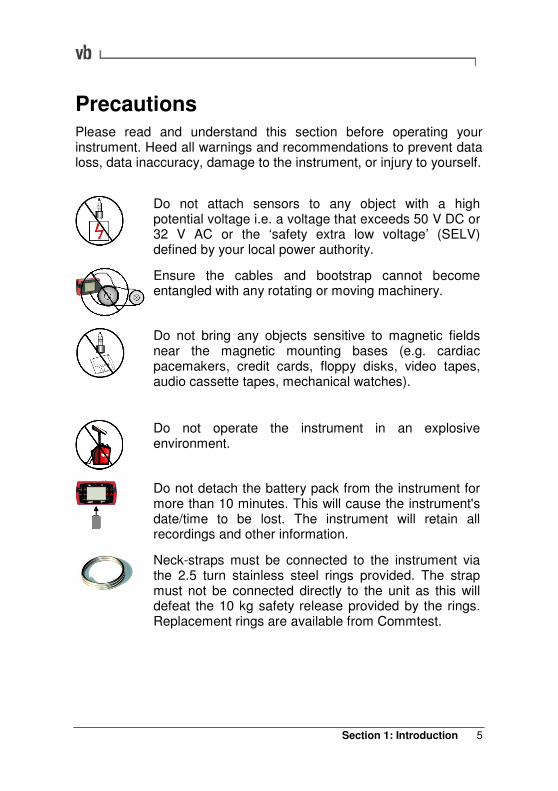
Precautions Please read and understand this section before operating your instrument. Heed all warnings and recommendations to prevent data loss, data inaccuracy, damage to the instrument, or injury to yourself.
Do not attach sensors to any object with a high potential voltage i.e. a voltage that exceeds 50 V DC or 32 V AC or the ‘safety extra low voltage’ (SELV) defined by your local power authority.
Ensure the cables and bootstrap cannot become entangled with any rotating or moving machinery.
Do not bring any objects sensitive to magnetic fields near the magnetic mounting bases (e.g. cardiac pacemakers, credit cards, floppy disks, video tapes, audio cassette tapes, mechanical watches).
Do not operate the instrument in an explosive environment.
Do not detach the battery pack from the instrument for more than 10 minutes. This will cause the instrument's date/time to be lost. The instrument will retain all recordings and other information.
Neck-straps must be connected to the instrument via the 2.5 turn stainless steel rings provided. The strap must not be connected directly to the unit as this will defeat the 10 kg safety release provided by the rings. Replacement rings are available from Commtest.
Section 1: Introduction 6
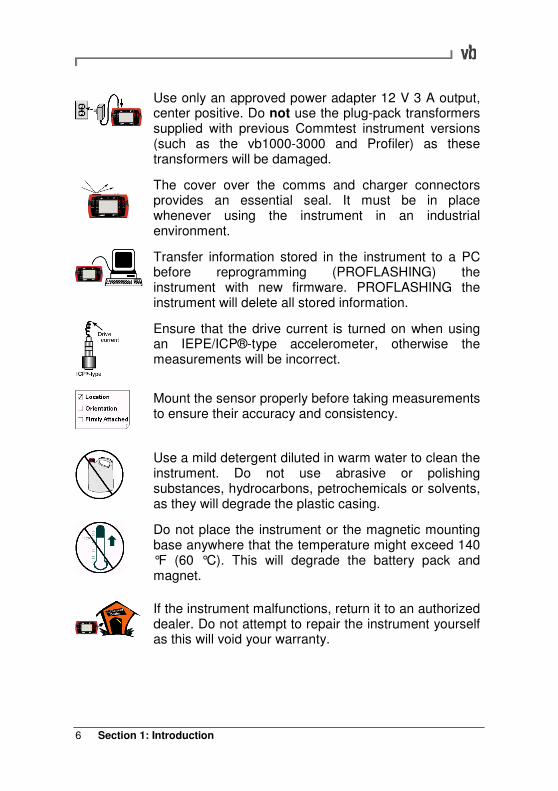
Use only an approved power adapter 12 V 3 A output, center positive. Do not use the plug-pack transformers supplied with previous Commtest instrument versions (such as the vb1000-3000 and Profiler) as these transformers will be damaged.
The cover over the comms and charger connectors provides an essential seal. It must be in place whenever using the instrument in an industrial environment.
Transfer information stored in the instrument to a PC before reprogramming (PROFLASHING) the instrument with new firmware. PROFLASHING the instrument will delete all stored information.
Ensure that the drive current is turned on when using an IEPE/ICP®-type accelerometer, otherwise the measurements will be incorrect.
Mount the sensor properly before taking measurements to ensure their accuracy and consistency.
Use a mild detergent diluted in warm water to clean the instrument. Do not use abrasive or polishing substances, hydrocarbons, petrochemicals or solvents, as they will degrade the plastic casing.
Do not place the instrument or the magnetic mounting base anywhere that the temperature might exceed 140 °F (60 °C). This will degrade the battery pack and magnet.
If the instrument malfunctions, return it to an authorized dealer. Do not attempt to repair the instrument yourself as this will void your warranty.
Section 1: Introduction
7
Hazardous Locations Selected models of the vbX range have been approved by the Canadian Standards Association (CSA) for use in hazardous locations meeting this classification: Class I, Division 2, Groups A,B,C,D.
Those models are clearly identified with the CSA logo and a Hazardous Location information panel. Models without those markings are NOT approved for operation in hazardous locations.
The Class I Div 2 classification is officially defined in the Canadian Electrical Code part 1, but can be summarized as:
A location in which volatile flammable gases or vapors are present but confined within closed systems from which they can escape only in case of accidental rupture or abnormal operation; or in which ignitable concentrations of gases are normally prevented by positive pressure or mechanical ventilation, and which might become hazardous through abnormal operation of the ventilation equipment.
The approval specifically covers use in the United States of America and also any other countries which recognize the CSA certification.
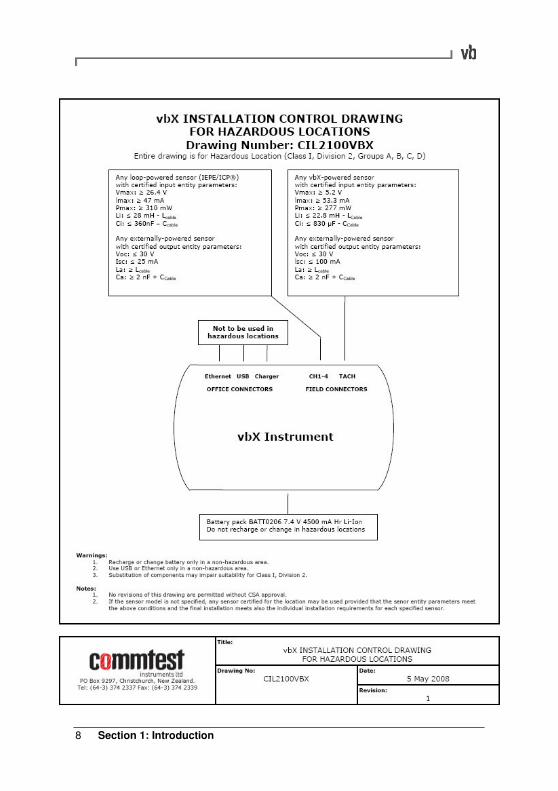
When using a certified vbX in a hazardous location, the installation must comply with the vbX Installation Control Drawing for Hazardous Locations, including all its foot-notes and warnings. This drawing, number CIL2100VBX, is inserted on the following page.
The vbX instrument will be supplied complete with appropriate sensors for use in Class I Div 2 environments. As indicated on the drawing, alternative sensors may be used, provided they are certified for use in these locations and their entity parameters meet the limits shown on the drawing.
Section 1: Introduction 8
Section 1: Introduction
9
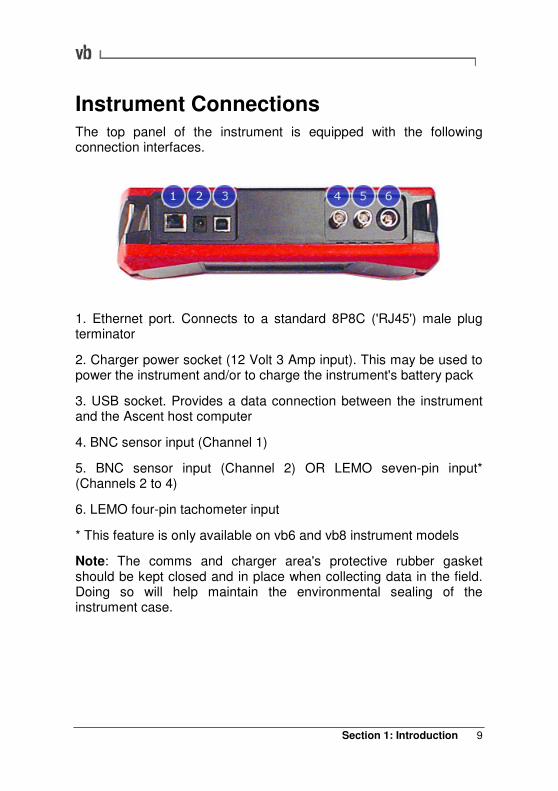
Instrument Connections The top panel of the instrument is equipped with the following connection interfaces.
1. Ethernet port. Connects to a standard 8P8C ('RJ45') male plug terminator
2. Charger power socket (12 Volt 3 Amp input). This may be used to power the instrument and/or to charge the instrument's battery pack
3. USB socket. Provides a data connection between the instrument and the Ascent host computer
4. BNC sensor input (Channel 1)
5. BNC sensor input (Channel 2) OR LEMO seven-pin input* (Channels 2 to 4)
6. LEMO four-pin tachometer input
* This feature is only available on vb6 and vb8 instrument models
Note: The comms and charger area's protective rubber gasket should be kept closed and in place when collecting data in the field. Doing so will help maintain the environmental sealing of the instrument case.
Section 1: Introduction 10
Front Panel Buttons
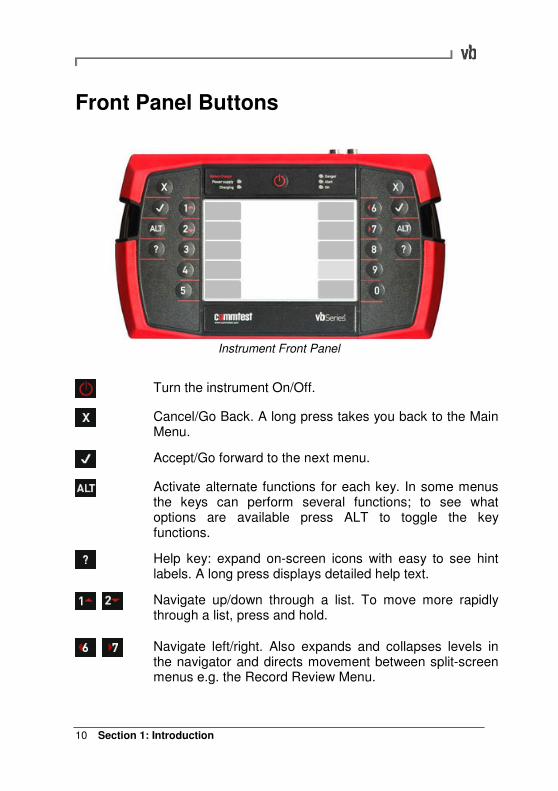
Instrument Front Panel
Turn the instrument On/Off.
Cancel/Go Back. A long press takes you back to the Main Menu.
Accept/Go forward to the next menu.
Activate alternate functions for each key. In some menus the keys can perform several functions; to see what options are available press ALT to toggle the key functions.
Help key: expand on-screen icons with easy to see hint labels. A long press displays detailed help text.
Navigate up/down through a list. To move more rapidly through a list, press and hold.
Navigate left/right. Also expands and collapses levels in the navigator and directs movement between split-screen menus e.g. the Record Review Menu.
Section 1: Introduction
11
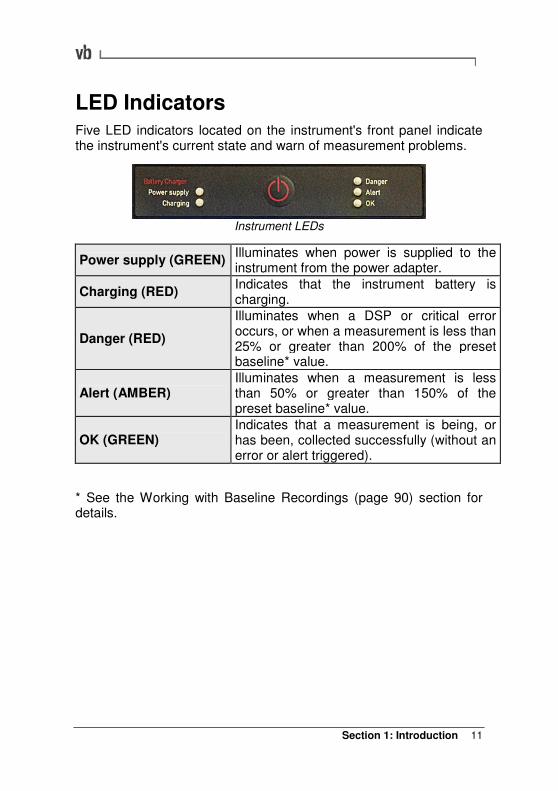
LED Indicators Five LED indicators located on the instrument's front panel indicate the instrument's current state and warn of measurement problems.
Instrument LEDs
Power supply (GREEN) Illuminates when power is supplied to the instrument from the power adapter.
Charging (RED) Indicates that the instrument battery is charging.
Danger (RED)
Illuminates when a DSP or critical error occurs, or when a measurement is less than 25% or greater than 200% of the preset baseline* value.
Alert (AMBER) Illuminates when a measurement is less than 50% or greater than 150% of the preset baseline* value.
OK (GREEN) Indicates that a measurement is being, or has been, collected successfully (without an error or alert triggered).
* See the Working with Baseline Recordings (page 90) section for details.

Section 1: Introduction 12
Charging the Battery Pack Warning: Before charging the battery pack, ensure that the power transformer used is an approved power adapter 12 V 3 A output, center positive. Do not use the plug-pack transformers supplied with previous Commtest portable analyzers such as the vb1000-3000 or Profiler instruments.
The power adapter supplied in the kit provides the correct DC voltage.
• Connect the AC power adapter included with the instrument to a powered outlet (100-240 Volt, 50/60 Hz ).
Note: The optional car adapter charging lead may also be used to charge the battery pack in a vehicle with a 12 V negative-chassis power system.
• Connect the adapter's DC output to the instrument's charger power socket. The instrument's Power supply and Charging LED indicators will illuminate indicating a charging state.
Notes: A full battery charge will complete in approximately 3 hours.
The fast-charge Lithium Ion-type battery pack should be charged for a minimum of 1 hour before or during its initial use.
Battery Features The instrument is powered by a rechargeable custom Lithium Ion battery pack with a normal operating range of 6.5 V to 8.4 V.
The instrument is equipped with an internal backup component that protects data and settings in case the battery pack is momentarily removed from the instrument. The backup component is kept charged by the battery pack if the battery pack is functioning normally. The instrument has a number of inbuilt features which help ensure that the battery pack is always sufficiently charged.
Section 1: Introduction
13
Below 7 Volts the instrument automatically turns off the backlight to prevent further power draining and displays a flashing battery icon as a reminder to recharge the battery.
At 6.5 Volts the instrument automatically powers down to conserve power.
With a battery charge of 25% or less the instrument will enter Complete Powerdown Mode when powered off.
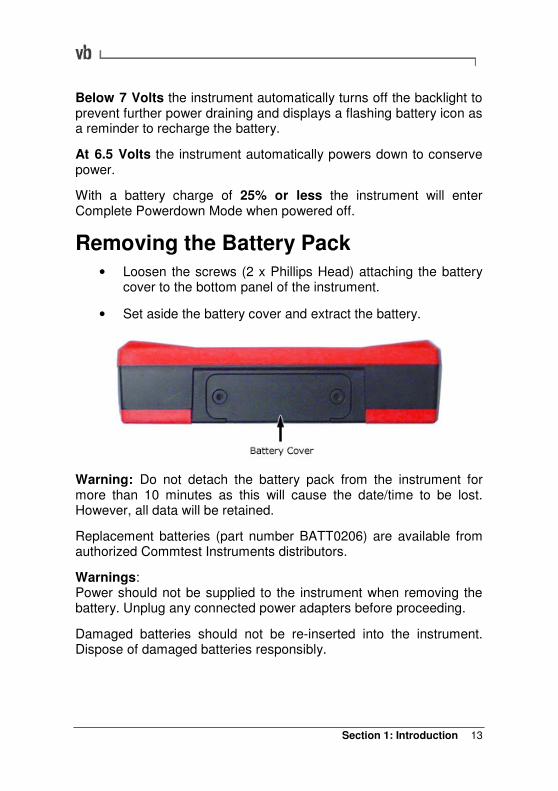
Removing the Battery Pack
• Loosen the screws (2 x Phillips Head) attaching the battery cover to the bottom panel of the instrument.
• Set aside the battery cover and extract the battery.
Warning: Do not detach the battery pack from the instrument for more than 10 minutes as this will cause the date/time to be lost. However, all data will be retained.
Replacement batteries (part number BATT0206) are available from authorized Commtest Instruments distributors.
Warnings: Power should not be supplied to the instrument when removing the battery. Unplug any connected power adapters before proceeding.
Damaged batteries should not be re-inserted into the instrument. Dispose of damaged batteries responsibly.
Section 1: Introduction 14
Operating Overview You can use the instrument to perform the following tasks:
• Take live, free run measurements for onsite analysis of vibration spectra and waveforms
• Record routes and store vibration data for transfer to a PC (offsite analysis)
• Use keypad entry to enter additional machine information and process inputs
• Balance machines using single and dual plane methods (vb7 and vb8 instrument models only)
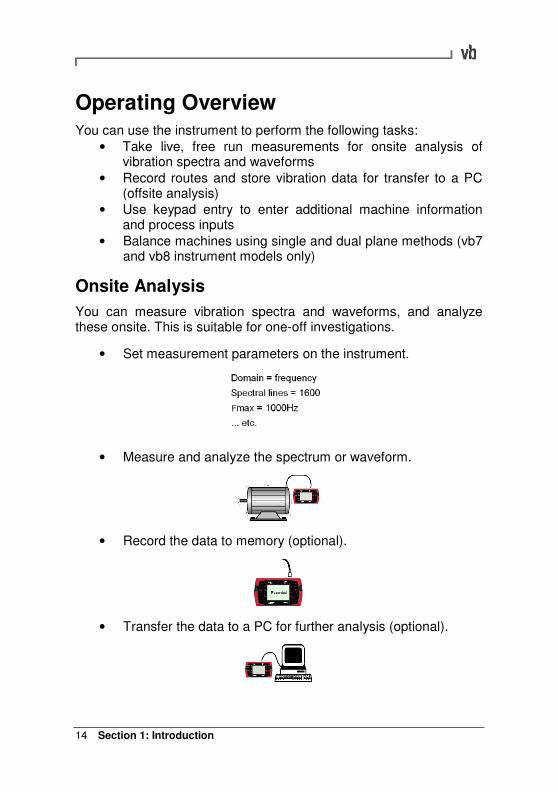
Onsite Analysis
You can measure vibration spectra and waveforms, and analyze these onsite. This is suitable for one-off investigations.
• Set measurement parameters on the instrument.
• Measure and analyze the spectrum or waveform.
• Record the data to memory (optional).
• Transfer the data to a PC for further analysis (optional).
Section 1: Introduction
15
Recording Routes
You can take vibration recordings for all monitored machines then transfer these to a PC for analysis.
The instrument guides you through a pre-defined data recording sequence known as a route, which you create on a PC then transfer to the instrument (see the Ascent Software Reference Guide for instructions). Recording routes are particularly useful if you routinely monitor a large number of machines.
• Create a recording route on a PC then transfer it to the instrument.
• Collect data for each item on the recording route as prompted by the instrument.
• Transfer the collected data to a PC for later analysis.
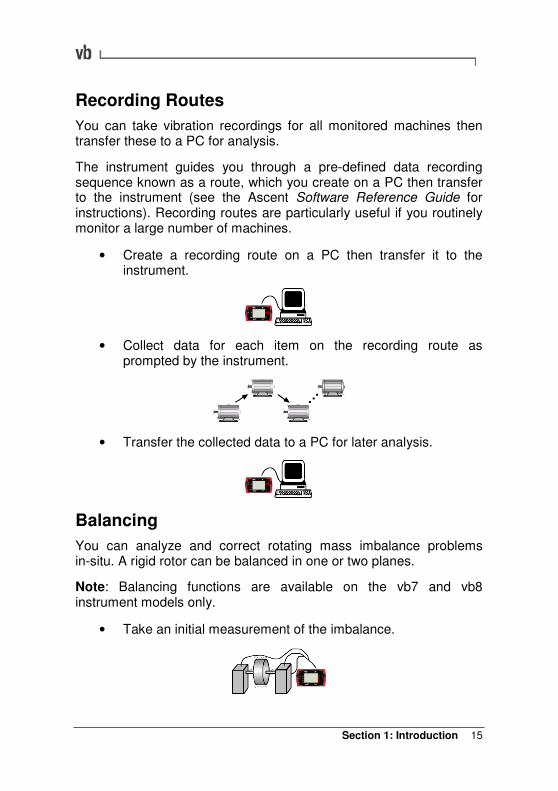
Balancing
You can analyze and correct rotating mass imbalance problems in-situ. A rigid rotor can be balanced in one or two planes.
Note: Balancing functions are available on the vb7 and vb8 instrument models only.
• Take an initial measurement of the imbalance.
Section 1: Introduction 16
• Attach a trial weight to the balancing plane and take another measurement. For dual plane balancing, do the same for the second plane.
• Attach correction weights to the balancing planes as recommended by the instrument.
• Take a measurement in each plane to confirm that the rotor is balanced. Any residual imbalance can be removed via trim balancing.
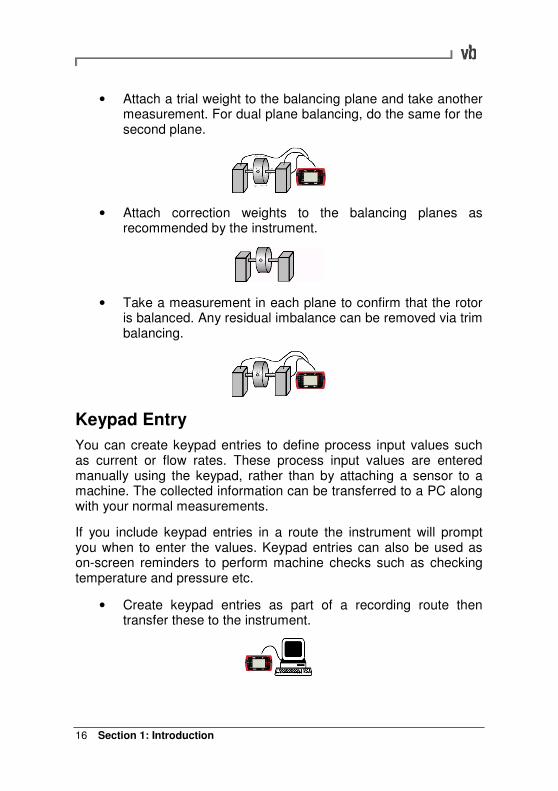
Keypad Entry
You can create keypad entries to define process input values such as current or flow rates. These process input values are entered manually using the keypad, rather than by attaching a sensor to a machine. The collected information can be transferred to a PC along with your normal measurements.
If you include keypad entries in a route the instrument will prompt you when to enter the values. Keypad entries can also be used as on-screen reminders to perform machine checks such as checking temperature and pressure etc.
• Create keypad entries as part of a recording route then transfer these to the instrument.
Section 1: Introduction
17
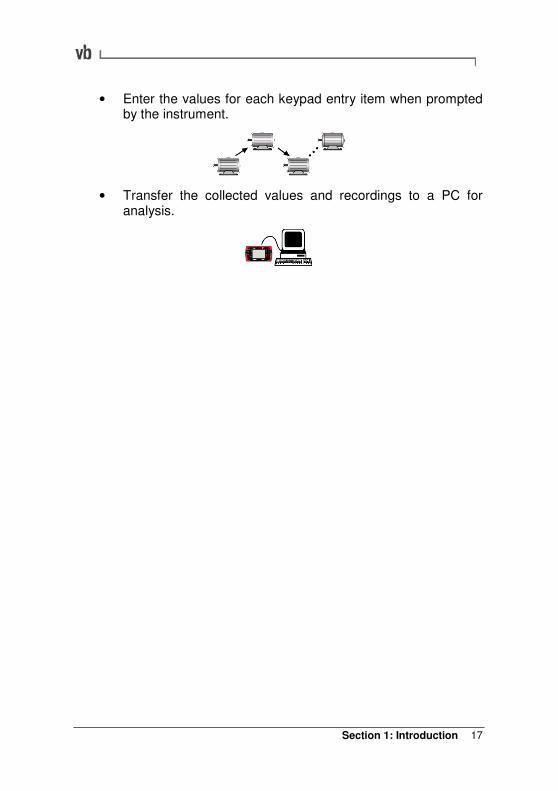
• Enter the values for each keypad entry item when prompted by the instrument.
• Transfer the collected values and recordings to a PC for analysis.
Section 2: Instrument Basics 18
Section 2: Instrument Basics
This section describes how to perform basic functions on your instrument.
You will learn to:
• Power up the instrument and turn it off
• Navigate menus and select options • Enter and edit characters and punctuation
• Replace the on-screen icons with hint labels • Display detailed help
Powering On/Off
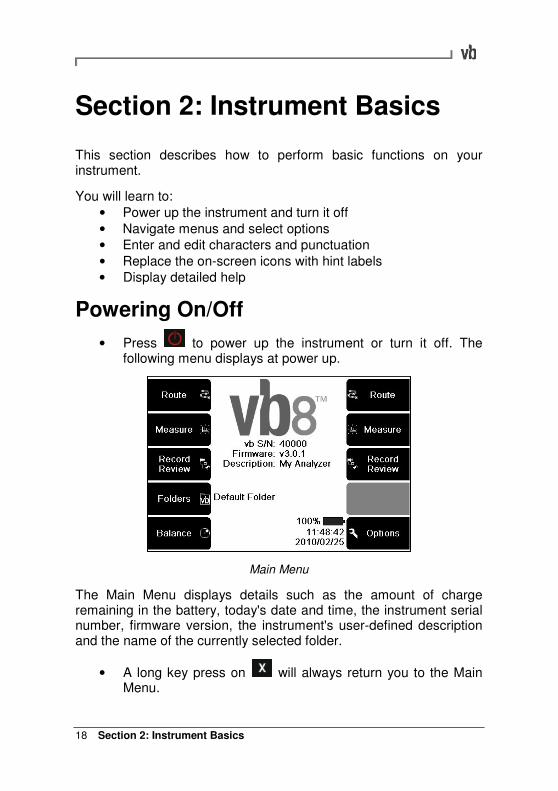
• Press to power up the instrument or turn it off. The following menu displays at power up.
Main Menu
The Main Menu displays details such as the amount of charge remaining in the battery, today's date and time, the instrument serial number, firmware version, the instrument's user-defined description and the name of the currently selected folder.
• A long key press on will always return you to the Main Menu.
Section 2: Instrument Basics
19
Note: Once powered up, and with a battery state above 25%,
pressing the button will place the instrument into Sleep Mode not Complete Powerdown Mode. If the battery state falls below 25% charge, the instrument will enter Complete Powerdown Mode immediately when turned off.
Navigating Menus
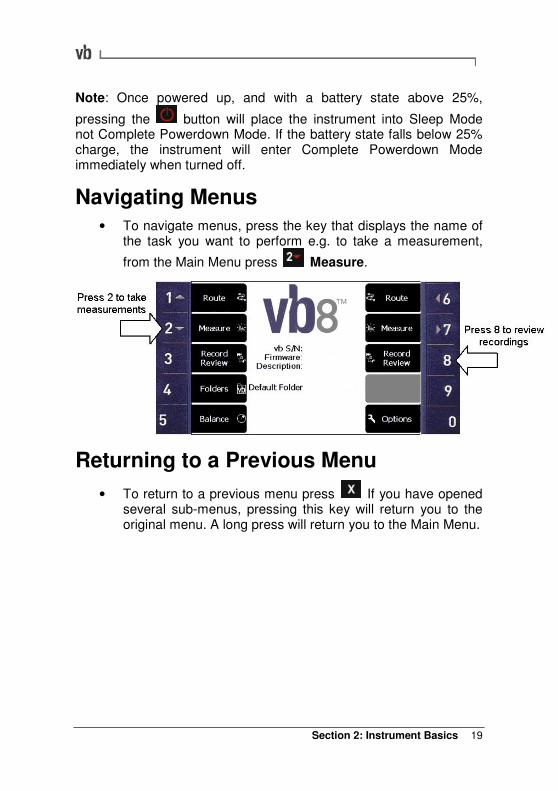
• To navigate menus, press the key that displays the name of the task you want to perform e.g. to take a measurement,
from the Main Menu press Measure.
Returning to a Previous Menu
• To return to a previous menu press If you have opened several sub-menus, pressing this key will return you to the original menu. A long press will return you to the Main Menu.
Section 2: Instrument Basics 20
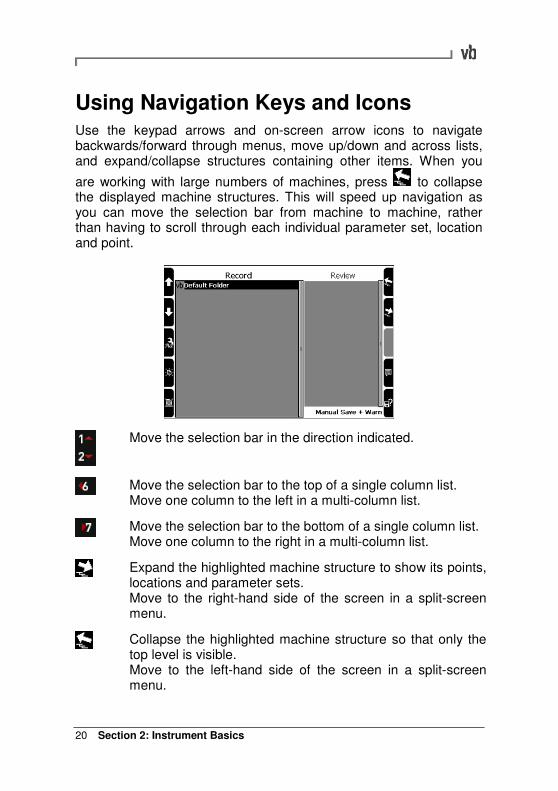
Using Navigation Keys and Icons Use the keypad arrows and on-screen arrow icons to navigate backwards/forward through menus, move up/down and across lists, and expand/collapse structures containing other items. When you
are working with large numbers of machines, press to collapse the displayed machine structures. This will speed up navigation as you can move the selection bar from machine to machine, rather than having to scroll through each individual parameter set, location and point.
Move the selection bar in the direction indicated.
Move the selection bar to the top of a single column list. Move one column to the left in a multi-column list.
Move the selection bar to the bottom of a single column list. Move one column to the right in a multi-column list.
Expand the highlighted machine structure to show its points, locations and parameter sets. Move to the right-hand side of the screen in a split-screen menu.
Collapse the highlighted machine structure so that only the top level is visible. Move to the left-hand side of the screen in a split-screen menu.
Section 2: Instrument Basics
21
Selecting an Option from a List When there are a large number of choices available they will display in list format. On-screen arrows allow you to scroll up, down, or across a multi-column list by pressing the arrow keys.
• To select an option from a list use the arrows keys to move the selection bar until your option is highlighted, then press
to select that option.
Example:
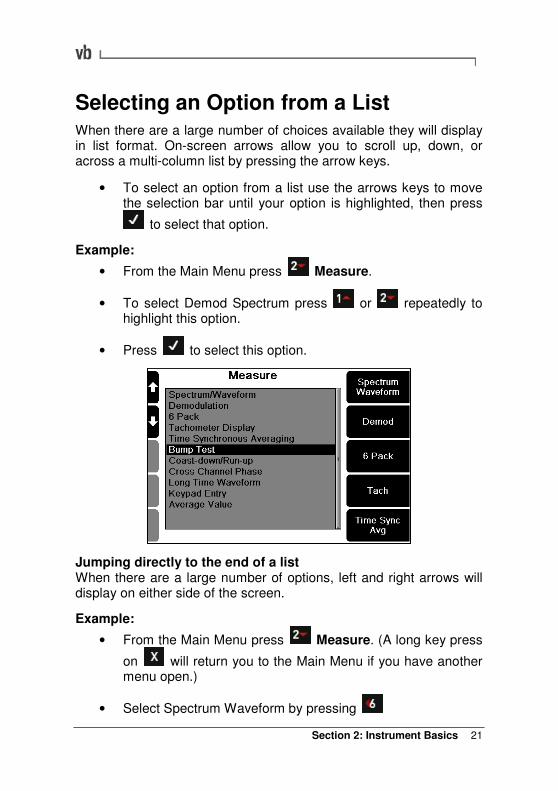
• From the Main Menu press Measure.
• To select Demod Spectrum press or repeatedly to highlight this option.
• Press to select this option.
Jumping directly to the end of a list When there are a large number of options, left and right arrows will display on either side of the screen.
Example:
• From the Main Menu press Measure. (A long key press
on will return you to the Main Menu if you have another menu open.)
• Select Spectrum Waveform by pressing
Section 2: Instrument Basics 22
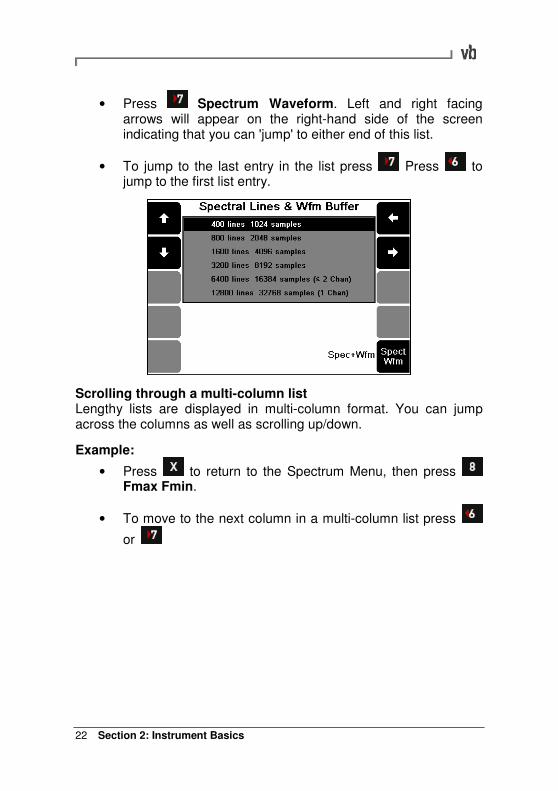
• Press Spectrum Waveform. Left and right facing arrows will appear on the right-hand side of the screen indicating that you can 'jump' to either end of this list.
• To jump to the last entry in the list press Press to jump to the first list entry.
Scrolling through a multi-column list Lengthy lists are displayed in multi-column format. You can jump across the columns as well as scrolling up/down.
Example:
• Press to return to the Spectrum Menu, then press Fmax Fmin.
• To move to the next column in a multi-column list press
or

Section 2: Instrument Basics
23
Canceling an Option
• To cancel an option press This will normally return you to the previous menu. If you have opened several sub-menus, pressing this key will return you to the original menu. A long press will return you to the Main Menu.
Displaying Hint Labels and Detailed Help Each on-screen icon can also display a hint label. Hint labels are turned off by default so that less screen space is used.
• To display hint labels press The hint labels will disappear when you press another key.
Section 2: Instrument Basics 24
Example:
• From the Main Menu press Record Review. (A long
press on will return you to the Main Menu if you have another menu open.)
• Press to display the hint labels and press this key again to hide them.
Press and hold to display more detailed help information.
Example:
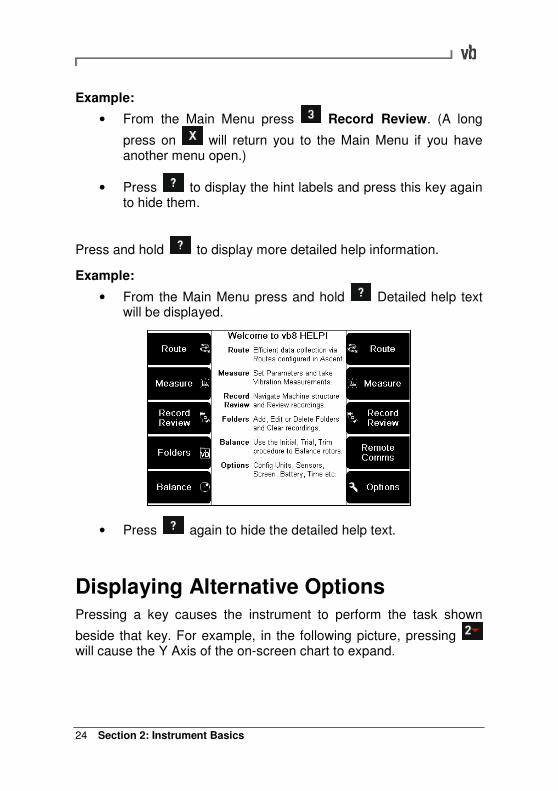
• From the Main Menu press and hold Detailed help text will be displayed.
• Press again to hide the detailed help text.
Displaying Alternative Options Pressing a key causes the instrument to perform the task shown
beside that key. For example, in the following picture, pressing will cause the Y Axis of the on-screen chart to expand.
Section 2: Instrument Basics
25
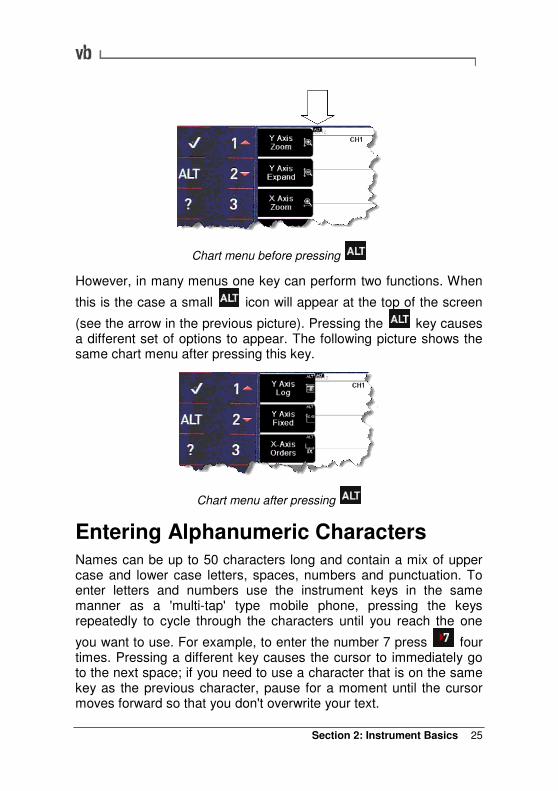
Chart menu before pressing
However, in many menus one key can perform two functions. When
this is the case a small icon will appear at the top of the screen
(see the arrow in the previous picture). Pressing the key causes a different set of options to appear. The following picture shows the same chart menu after pressing this key.
Chart menu after pressing
Entering Alphanumeric Characters Names can be up to 50 characters long and contain a mix of upper case and lower case letters, spaces, numbers and punctuation. To enter letters and numbers use the instrument keys in the same manner as a 'multi-tap' type mobile phone, pressing the keys repeatedly to cycle through the characters until you reach the one
you want to use. For example, to enter the number 7 press four times. Pressing a different key causes the cursor to immediately go to the next space; if you need to use a character that is on the same key as the previous character, pause for a moment until the cursor moves forward so that you don't overwrite your text.
Section 2: Instrument Basics 26
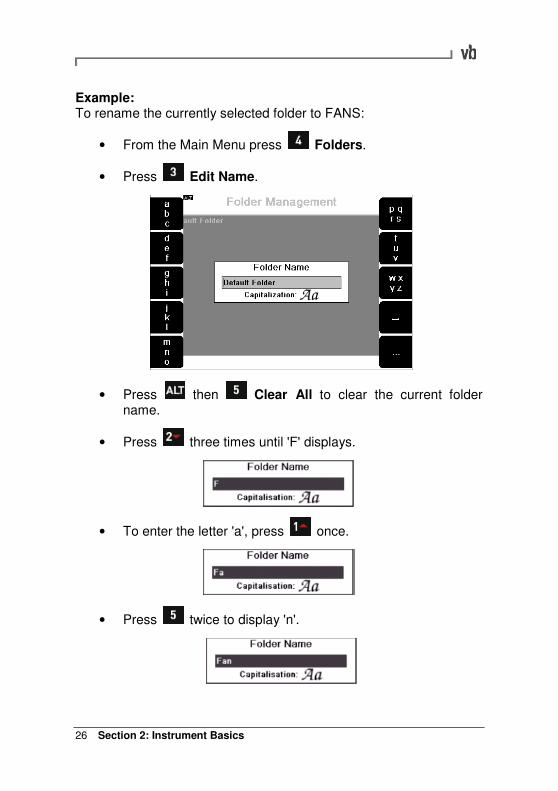
Example: To rename the currently selected folder to FANS:
• From the Main Menu press Folders.
• Press Edit Name.
• Press then Clear All to clear the current folder name.
• Press three times until 'F' displays.
• To enter the letter 'a', press once.
• Press twice to display 'n'.
Section 2: Instrument Basics
27
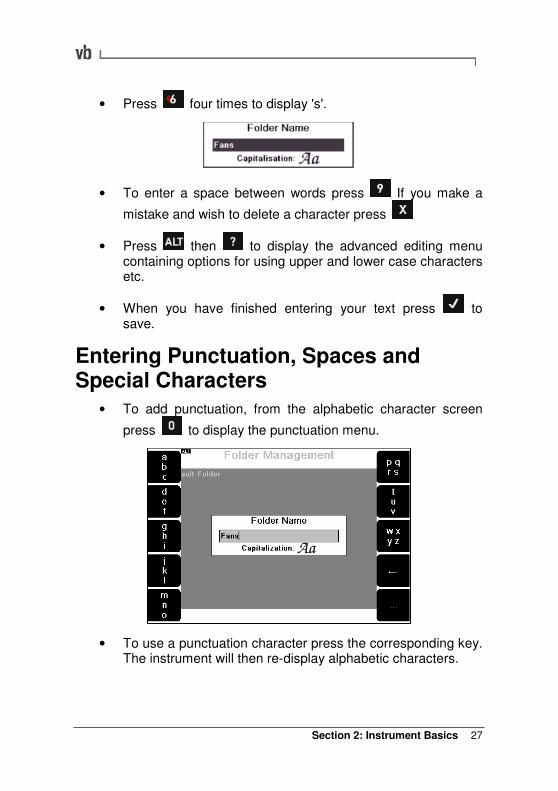
• Press four times to display 's'.
• To enter a space between words press If you make a
mistake and wish to delete a character press
• Press then to display the advanced editing menu containing options for using upper and lower case characters etc.
• When you have finished entering your text press to save.
Entering Punctuation, Spaces and Special Characters
• To add punctuation, from the alphabetic character screen
press to display the punctuation menu.
• To use a punctuation character press the corresponding key. The instrument will then re-display alphabetic characters.
Section 2: Instrument Basics 28
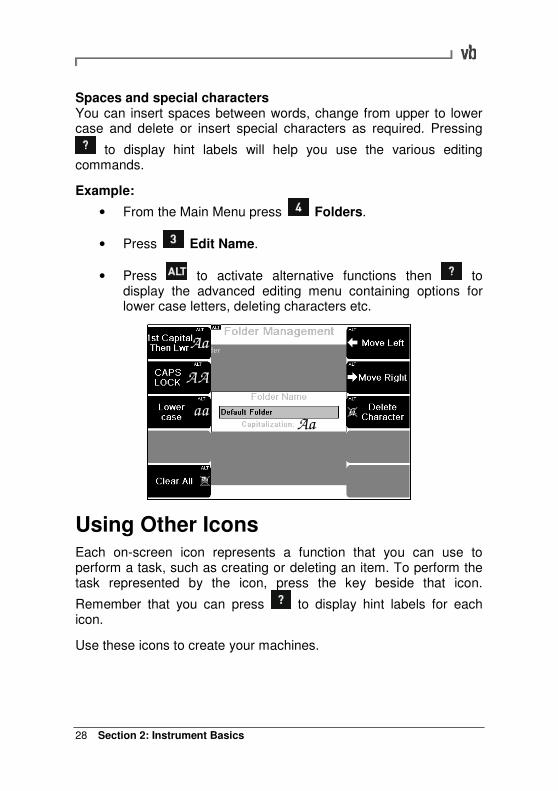
Spaces and special characters You can insert spaces between words, change from upper to lower case and delete or insert special characters as required. Pressing
to display hint labels will help you use the various editing commands.
Example:
• From the Main Menu press Folders.
• Press Edit Name.
• Press to activate alternative functions then to display the advanced editing menu containing options for lower case letters, deleting characters etc.
Using Other Icons Each on-screen icon represents a function that you can use to perform a task, such as creating or deleting an item. To perform the task represented by the icon, press the key beside that icon.
Remember that you can press to display hint labels for each icon.
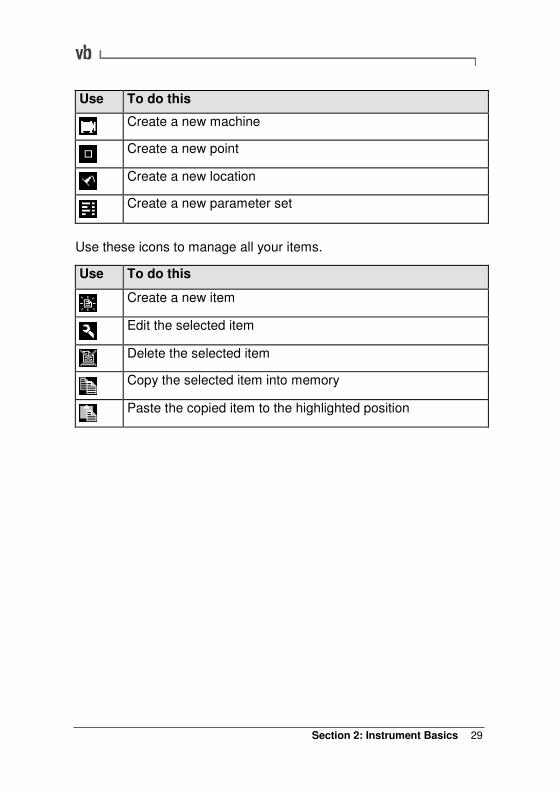
Use these icons to create your machines.
Section 2: Instrument Basics
29
Use To do this
Create a new machine
Create a new point
Create a new location
Create a new parameter set
Use these icons to manage all your items.
Use To do this
Create a new item
Edit the selected item
Delete the selected item
Copy the selected item into memory
Paste the copied item to the highlighted position
Section 3: Using Sensors 30
Section 3: Using Sensors
This section explains which sensors are compatible with your instrument and describes how to use them.
You will learn:
• What sensors may be used with your instrument
• How to use the supplied accelerometer and tachometer • How to correctly mount a sensor
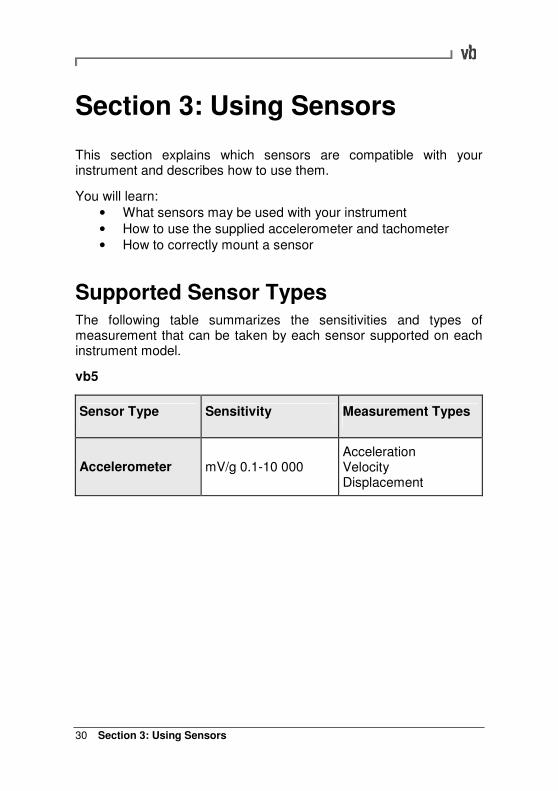
Supported Sensor Types The following table summarizes the sensitivities and types of measurement that can be taken by each sensor supported on each instrument model.
vb5
Sensor Type Sensitivity Measurement Types
Accelerometer mV/g 0.1-10 000 Acceleration Velocity Displacement
Section 3: Using Sensors
31
vb6, vb7 and vb8
Sensor Type Sensitivity Measurement Types
Accelerometer mV/g 0.1-10 000 Acceleration Velocity Displacement
Velocity Sensor mV/in/s 0.1-10 000 mV/mm/s 0.34-90.55
Velocity
Displacement Sensor (or prox probe)
mV/mil 0.1-10 000 mV/µm 0.34-90.55
Displacement
Current Sensor mV/amp 0.1-10 000 Current
You can define your sensors either in the Ascent software or in the instrument. For information on how to define a sensor using the instrument see Defining and Editing Sensors (page 116).
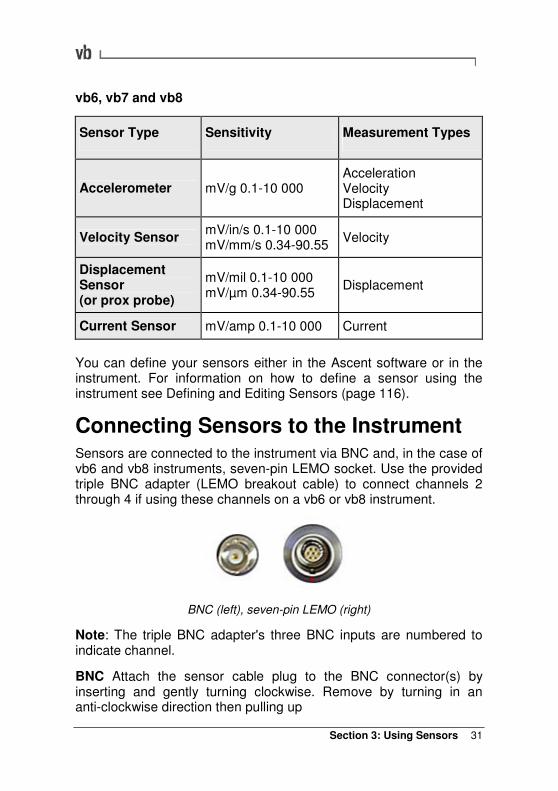
Connecting Sensors to the Instrument Sensors are connected to the instrument via BNC and, in the case of vb6 and vb8 instruments, seven-pin LEMO socket. Use the provided triple BNC adapter (LEMO breakout cable) to connect channels 2 through 4 if using these channels on a vb6 or vb8 instrument.
BNC (left), seven-pin LEMO (right)
Note: The triple BNC adapter's three BNC inputs are numbered to indicate channel.
BNC Attach the sensor cable plug to the BNC connector(s) by inserting and gently turning clockwise. Remove by turning in an anti-clockwise direction then pulling up
Section 3: Using Sensors 32
LEMO To attach a LEMO triple BNC adapter, line up the red dot on the LEMO connector with the red line on the instrument socket and insert. Remove by firmly gripping the connector and pulling away from the instrument without twisting.
Warning: Do not remove the LEMO connector by pulling the sensor cable. This may damage the cable. Always remove by gripping the end connector.
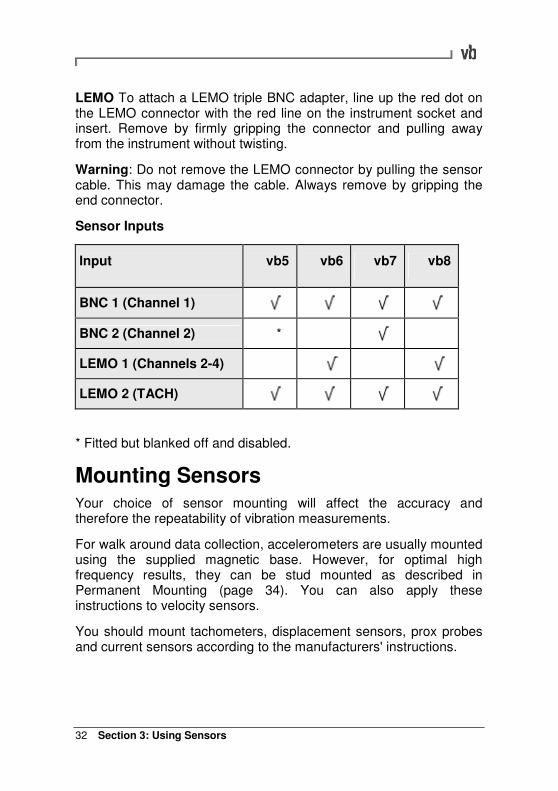
Sensor Inputs
Input vb5 vb6 vb7 vb8
BNC 1 (Channel 1)
BNC 2 (Channel 2) *
LEMO 1 (Channels 2-4)
LEMO 2 (TACH)
* Fitted but blanked off and disabled.
Mounting Sensors Your choice of sensor mounting will affect the accuracy and therefore the repeatability of vibration measurements.
For walk around data collection, accelerometers are usually mounted using the supplied magnetic base. However, for optimal high frequency results, they can be stud mounted as described in Permanent Mounting (page 34). You can also apply these instructions to velocity sensors.
You should mount tachometers, displacement sensors, prox probes and current sensors according to the manufacturers' instructions.
Section 3: Using Sensors
33
Setting up the Accelerometer Plug the accelerometer connector into an instrument BNC sensor input (or into a triple BNC adapter connected to the instrument if using a vb6 or vb8 instrument). Now screw the accelerometer into the magnetic base and attach it to the measurement point using these guidelines:
• Attach the accelerometer to a sturdy, rigidly mounted and non-flexible structure, where vibration from the rotating part of the machine will be accurately transmitted. Do not attach sensors to sheet metal, guards, or any machine structure which is not closely coupled to the source of vibration in the spinning rotor, as the vibration of such a structure will be different to the vibration source.
• The attachment structure must be at least 10 times heavier than the accelerometer itself. Do not mount the accelerometer on lightweight motors or similar parts as the weight of the accelerometer will distort the vibration signal. Use a smaller accelerometer for small structures.
• Attach the accelerometer as closely as possible to, and in line with, the centerline of the bearings in order to avoid distorted signals.
• The mounting surface should be flat and smooth where the accelerometer makes contact. Attach the accelerometer using the supplied magnetic accelerometer base or a threaded stud on the machine surface. The accelerometer should not move independently of the machine part it is attached to.
• Ensure the accelerometer is oriented correctly as vibration can differ greatly with respect to direction.
• If you are undertaking an ongoing study of a particular measurement point, always attach the accelerometer at exactly the same position used for previous measurements (mark the position if necessary).
Section 3: Using Sensors 34
• Keep the accelerometer clear from other cables, ensuring it is not twisted, kinked or tangled.
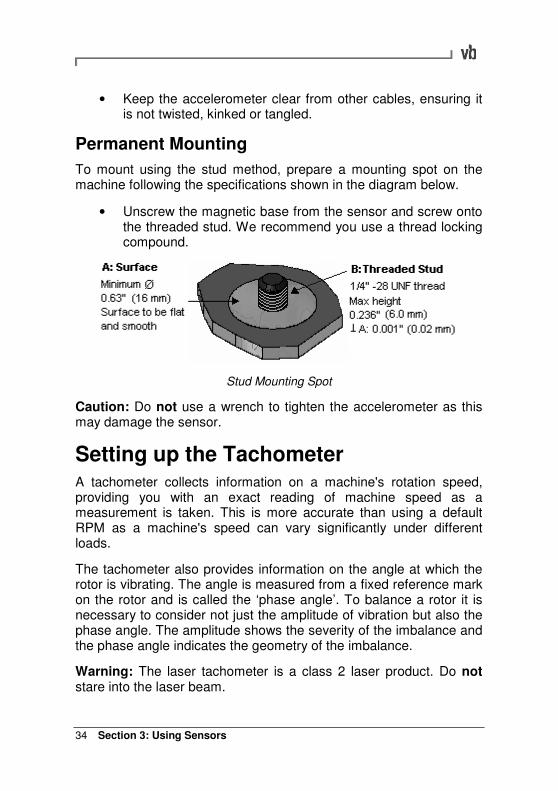
Permanent Mounting
To mount using the stud method, prepare a mounting spot on the machine following the specifications shown in the diagram below.
• Unscrew the magnetic base from the sensor and screw onto the threaded stud. We recommend you use a thread locking compound.
Stud Mounting Spot
Caution: Do not use a wrench to tighten the accelerometer as this may damage the sensor.
Setting up the Tachometer A tachometer collects information on a machine's rotation speed, providing you with an exact reading of machine speed as a measurement is taken. This is more accurate than using a default RPM as a machine's speed can vary significantly under different loads.
The tachometer also provides information on the angle at which the rotor is vibrating. The angle is measured from a fixed reference mark on the rotor and is called the ‘phase angle’. To balance a rotor it is necessary to consider not just the amplitude of vibration but also the phase angle. The amplitude shows the severity of the imbalance and the phase angle indicates the geometry of the imbalance.
Warning: The laser tachometer is a class 2 laser product. Do not stare into the laser beam.
Section 3: Using Sensors
35
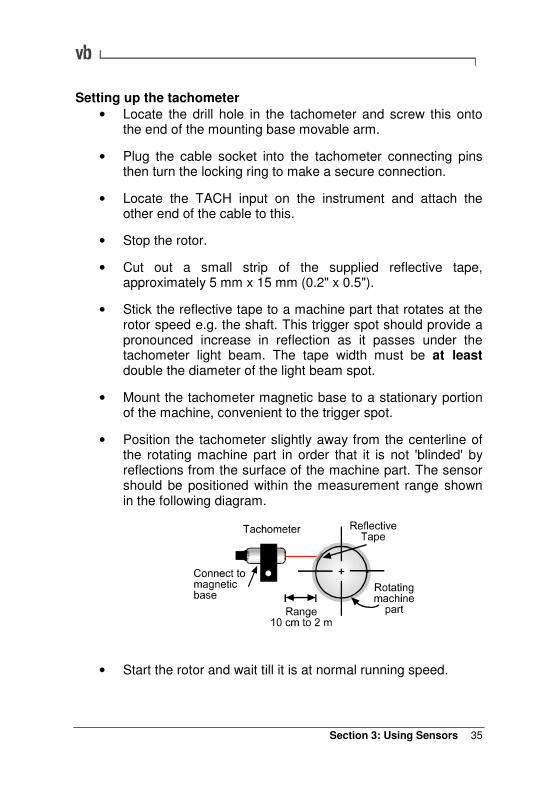
Setting up the tachometer
• Locate the drill hole in the tachometer and screw this onto the end of the mounting base movable arm.
• Plug the cable socket into the tachometer connecting pins then turn the locking ring to make a secure connection.
• Locate the TACH input on the instrument and attach the other end of the cable to this.
• Stop the rotor.
• Cut out a small strip of the supplied reflective tape, approximately 5 mm x 15 mm (0.2" x 0.5").
• Stick the reflective tape to a machine part that rotates at the rotor speed e.g. the shaft. This trigger spot should provide a pronounced increase in reflection as it passes under the tachometer light beam. The tape width must be at least double the diameter of the light beam spot.
• Mount the tachometer magnetic base to a stationary portion of the machine, convenient to the trigger spot.
• Position the tachometer slightly away from the centerline of the rotating machine part in order that it is not 'blinded' by reflections from the surface of the machine part. The sensor should be positioned within the measurement range shown in the following diagram.
• Start the rotor and wait till it is at normal running speed.
Section 3: Using Sensors 36
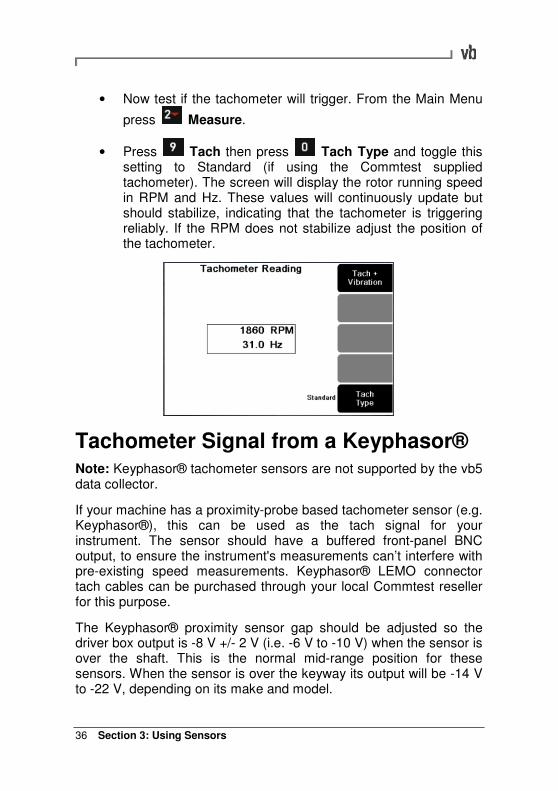
• Now test if the tachometer will trigger. From the Main Menu
press Measure.
• Press Tach then press Tach Type and toggle this setting to Standard (if using the Commtest supplied tachometer). The screen will display the rotor running speed in RPM and Hz. These values will continuously update but should stabilize, indicating that the tachometer is triggering reliably. If the RPM does not stabilize adjust the position of the tachometer.
Tachometer Signal from a Keyphasor® Note: Keyphasor® tachometer sensors are not supported by the vb5 data collector.
If your machine has a proximity-probe based tachometer sensor (e.g. Keyphasor®), this can be used as the tach signal for your instrument. The sensor should have a buffered front-panel BNC output, to ensure the instrument's measurements can’t interfere with pre-existing speed measurements. Keyphasor® LEMO connector tach cables can be purchased through your local Commtest reseller for this purpose.
The Keyphasor® proximity sensor gap should be adjusted so the driver box output is -8 V +/- 2 V (i.e. -6 V to -10 V) when the sensor is over the shaft. This is the normal mid-range position for these sensors. When the sensor is over the keyway its output will be -14 V to -22 V, depending on its make and model.
Section 3: Using Sensors
37
Using a Strobe If you have a strobe light with an output signal it should be possible to connect it to the tachometer input of the instrument. (However, there are many strobes on the market with different types of output signal and connectors). If your strobe light has a BNC connector and gives a TTL output (0 to 5) V you can purchase a suitable cable (with a LEMO connector) from Commtest Instruments Ltd via your distributor.
For other types of connectors and signals please consult the FAQ (Frequently Asked Questions) articles on the Commtest website www.commtest.com.
Section 4: Analyzing Measurements Onsite 38
Section 4: Analyzing Measurements Onsite
This section describes how to take measurements and perform onsite analysis.
You will learn to:
• Take a measurement • Change how a measurement is displayed
• Perform analysis using cursors and zooming • Set a measurement's RPM
• Store a measurement
Tips for Taking Measurements
• You should always take measurements using the machine operating mode that is typical for that machine (using a typical load and running speed). This will ensure that the loads on the components, such as bearings, are the same as those that define their wear. For multi-operating mode machines it is best to take measurements when the loads on the bearings are at a maximum and to take all future measurements in the same mode.
• When taking the measurement, try not to lean on the machine and do not put heavy objects (e.g. heavy tool boxes) on it since this will change the vibratory behavior of the machine.
• If there are machines operating nearby that might affect the vibration of the machine you are measuring, stop those surrounding machines if possible.
Section 4: Analyzing Measurements Onsite
39
• In addition to the measurements that you will be taking, if possible, stop and listen to the sound of the machine; look for loose bolts and oil leaks; take note of any machine parts that are vibrating visibly; feel for hot bearings and manually ‘feel’ the vibration (e.g. with a screwdriver) to look for symptoms that might later aid vibration analysis. This should be done only if it is safe to do so.
• If you have a stroboscope (not included in the instrument kit) you may wish to use it to ‘freeze’ rotating shafts, belts, couplings etc to observe their operating shapes and relative speeds in order to look for symptoms that might later aid vibration analysis.
Walk-through: Taking Measurements Onsite analysis involves watching a machine's vibration on-screen as it occurs, and analyzing the measurement on the instrument (rather than recording the vibration then transferring it to a PC for later analysis). This method of measuring allows you to take a quick look at a machine's vibration patterns without storing the measurement. (You can choose to save the measurement at any time by creating a machine to save it to, or by selecting an existing machine definition stored in the instrument.)
• Attach the sensor (and tachometer if you are taking rotor speed and phase angle measurements). Now start the machine and allow it to operate under its normal load and running speed.
• From the Main Menu press Measure.
Section 4: Analyzing Measurements Onsite 40
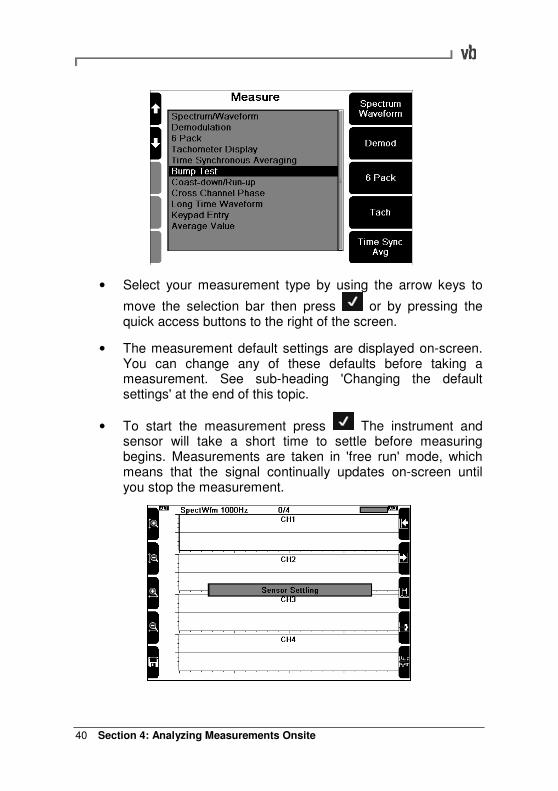
• Select your measurement type by using the arrow keys to
move the selection bar then press or by pressing the quick access buttons to the right of the screen.
• The measurement default settings are displayed on-screen. You can change any of these defaults before taking a measurement. See sub-heading 'Changing the default settings' at the end of this topic.
• To start the measurement press The instrument and sensor will take a short time to settle before measuring begins. Measurements are taken in 'free run' mode, which means that the signal continually updates on-screen until you stop the measurement.
Section 4: Analyzing Measurements Onsite
41
• To stop the measurement press You can now analyze the measurement on-screen, including displaying the amplitude of spectral peaks and identifying harmonics (see Analyzing Measurements).
OR
• To stop viewing the measurement and exit without saving
press OR
• To save the measurement press and select an existing machine location or create a new one (see Saving Measurements on page 51).
Changing the default settings
• To change any of the settings shown on the right of the screen, press the keys beside the on-screen icons.
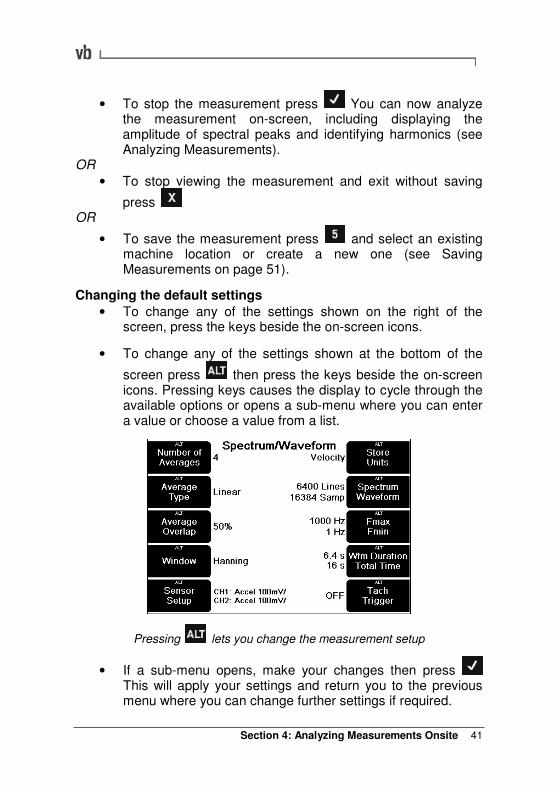
• To change any of the settings shown at the bottom of the
screen press then press the keys beside the on-screen icons. Pressing keys causes the display to cycle through the available options or opens a sub-menu where you can enter a value or choose a value from a list.
Pressing lets you change the measurement setup
• If a sub-menu opens, make your changes then press This will apply your settings and return you to the previous menu where you can change further settings if required.
Section 4: Analyzing Measurements Onsite 42
• To select a different sensor press then press Sensor Setup. Press the Change Sensor key opposite your chosen measuring channel then use the left-hand arrow keys
to highlight a sensor and to select it. Press the left-hand arrow key beside your chosen channel to enable it then
press twice to begin measuring.
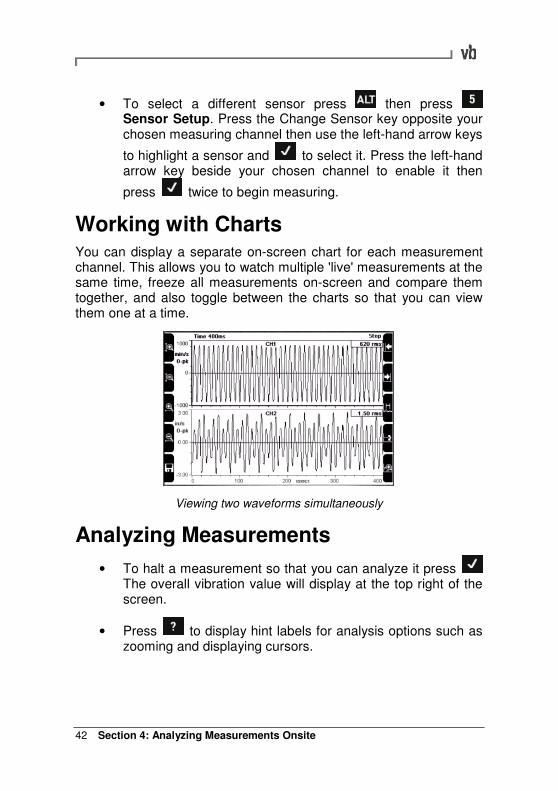
Working with Charts You can display a separate on-screen chart for each measurement channel. This allows you to watch multiple 'live' measurements at the same time, freeze all measurements on-screen and compare them together, and also toggle between the charts so that you can view them one at a time.
Viewing two waveforms simultaneously
Analyzing Measurements
• To halt a measurement so that you can analyze it press The overall vibration value will display at the top right of the screen.
• Press to display hint labels for analysis options such as zooming and displaying cursors.
Section 4: Analyzing Measurements Onsite
43
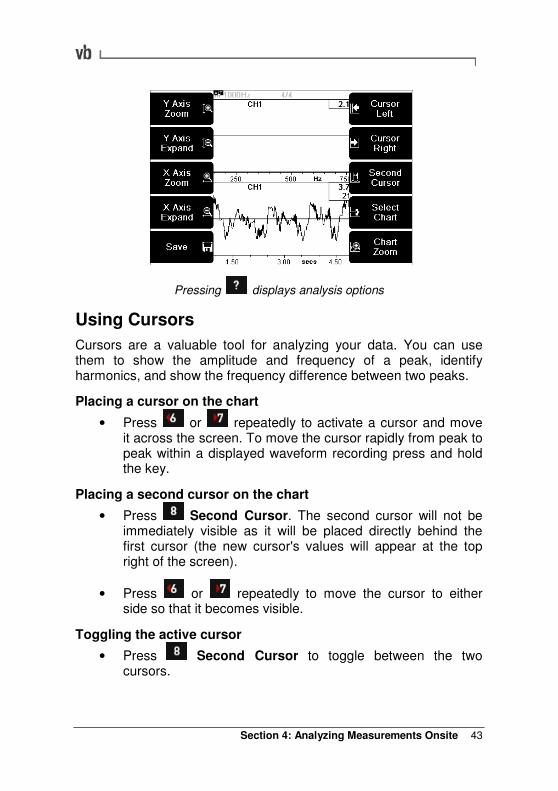
Pressing displays analysis options
Using Cursors
Cursors are a valuable tool for analyzing your data. You can use them to show the amplitude and frequency of a peak, identify harmonics, and show the frequency difference between two peaks.
Placing a cursor on the chart
• Press or repeatedly to activate a cursor and move it across the screen. To move the cursor rapidly from peak to peak within a displayed waveform recording press and hold the key.
Placing a second cursor on the chart
• Press Second Cursor. The second cursor will not be immediately visible as it will be placed directly behind the first cursor (the new cursor's values will appear at the top right of the screen).
• Press or repeatedly to move the cursor to either side so that it becomes visible.
Toggling the active cursor
• Press Second Cursor to toggle between the two cursors.
Section 4: Analyzing Measurements Onsite 44
Clearing cursors
• Press then Clear Cursors to remove all cursors and harmonics.
Displaying the amplitude/frequency of a peak
• Press or repeatedly to activate a cursor and move it across the screen. The frequency and amplitude values indicated by the cursor will display at the top right of the screen.
Displaying the frequency or time difference between peaks
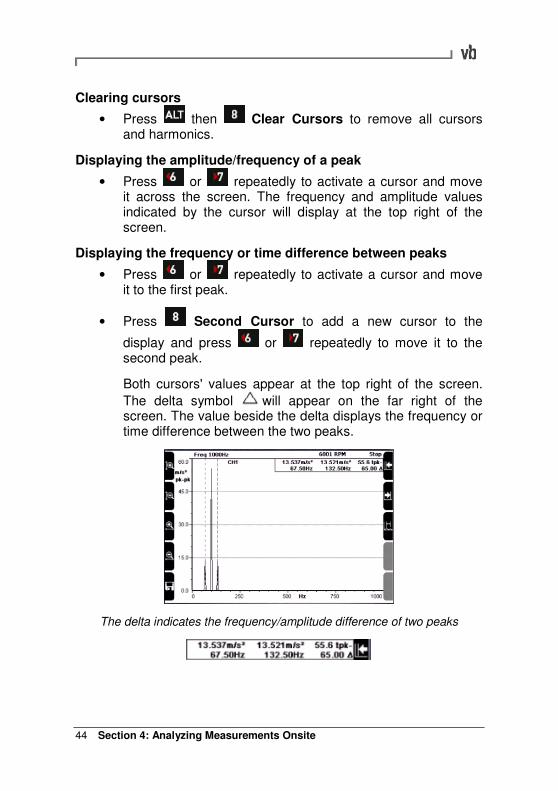
• Press or repeatedly to activate a cursor and move it to the first peak.
• Press Second Cursor to add a new cursor to the
display and press or repeatedly to move it to the second peak.
Both cursors' values appear at the top right of the screen.
The delta symbol will appear on the far right of the screen. The value beside the delta displays the frequency or time difference between the two peaks.
The delta indicates the frequency/amplitude difference of two peaks
Section 4: Analyzing Measurements Onsite
45
Displaying harmonics
• Press then press Harmonics Sidebands. Press
or repeatedly to move the cursor over different peaks.
Additional cursors will display at frequency or time values that are whole-number multiples of the frequency or time value indicated by the main cursor.
Turning harmonics off
• Press then press Clear Cursors to remove all harmonics and sidebands.
Zooming
Zooming allows you to take a closer look at a specific area of interest on a chart.
Chart zoom and expansion options
• Magnifying glass icons on the left of the screen indicate that zooming options are available. (If the magnifying glass icons
are not visible press toggle them on.) Press to display hint labels for zooming and expansion options.
Zooming horizontally (across the chart)
• To expand the peaks of a spectrum or waveform use the right-hand arrow keys to move the cursor to the position of
interest and press X Axis Zoom repeatedly to zoom in on the cursor position by a factor of two per key press. The more spectral lines or waveform sample points used, the more times you can zoom.
Zooming vertically and horizontally
• To see low amplitude peaks more clearly move the cursor to
the position of interest and press Y Axis Zoom to zoom in by a factor of two per key press.
• Press X Axis Zoom to expand the frequencies on either side of the cursor.
Section 4: Analyzing Measurements Onsite 46
Zooming out
• Press X Axis Expand repeatedly to zoom out
horizontally and to zoom out vertically.
Viewing Multiple Charts When you measure more than one channel simultaneously, or display both a spectrum and waveform, each chart will display on-screen. You can view the measurements on all charts at the same time (waveform or spectra only when viewing three of more measurements simultaneously, such as when viewing 6Pack recordings) or select a specific chart to work with. When using analysis options such as zooming, these will only be applied to the selected chart.
Selecting a chart
• With the charts displayed press (You don't have to display the hint labels but this will help.)
• Press Select Chart. The axes of the selected chart will become thicker and darker to indicate that this chart has the
focus. Press repeatedly to toggle which chart you wish to work with.
Displaying a single chart
• To make one chart fill the entire screen select the chart as
described in the previous instructions then press Chart Zoom.
• To re-display all charts press again.
Changing Chart View You can toggle between waveform and spectrum recordings, and set the default layout of multi-channel and single-channel onscreen measurements using the Change View and Multi Chart Layout functions.
Section 4: Analyzing Measurements Onsite
47
Note: The following functions are only available when viewing multi-channel (two or more) and multi-domain (spectrum+waveform) measurements.
Selecting a chart layout
• With the charts displayed press to display hint labels.
• Press Change View to alter the currently displayed chart type. Press repeatedly to toggle between waveform or spectrum displays for up to four channels, and spectrum+waveform to view both measurement types onscreen simultaneously for individual channels.
Changing how multi-chart layouts are displayed
• With the charts displayed press to display hint labels.
• Press then press Chart Data Change to open the Multi Chart Layout screen.
• Press to choose which channels will be displayed in your Multi Chart Layout.
• Press or to pick a layout from those listed. For single channel displays you may choose waveform, spectrum or spectrum+waveform. For multi-domain measurements using three or more channels and with all channels set to display simultaneously ('Show All Channels' in the previous step), you may only select waveform or spectrum for simultaneous display, not both.
Setting the Y Axis (Amplitude) Scale Toggling the left axis scale between Linear, Log and dB will increase or decrease the amplitude of displayed peaks allowing you to see either the bigger picture or a more detailed view of the data. The Linear scale is suitable for most cases. Log scaling (base 10) is more useful for displaying vibration with both very large and very small amplitudes.
Section 4: Analyzing Measurements Onsite 48
• With the spectrum measurement displayed on-screen (either
still measuring or stopped) and highlighted press then
Y Axis Log to set the Y axis (amplitude) scaling options.
• Press Linear Log dB repeatedly to toggle between Linear, Log, and dB scaling (vdB and adB scaling are only available when measuring velocity and acceleration respectively).
• Press Y Axis Max. This is the highest amplitude value that will be displayed on-screen. Use the arrow keys to
highlight a value then press to select.
• Press Y Axis Range repeatedly to toggle the Y Axis range. This selects the lowest amplitude value that will be displayed on-screen relative to your chosen Max Value.
• When you have finished press to return to the measurement screen.
Fixed Y Axis scale options Setting a Max dB Value sets the highest value that the amplitude axis can display, so if a peak goes above this value while you are measuring you will not see the top of the peak. When using Linear scaling you have two extra display options.
Automatic: This allows the instrument to auto-scale the left axis to accommodate the highest and lowest peaks.
Current: This fixes the Y axis to whatever amplitude is currently displaying, regardless of how large or small the peaks become.
Amplitude Display Units Your chosen Store Units (acceleration, velocity etc) determine which amplitude scaling options are available. The vdB scale is only available if you are taking velocity measurements and adB is only available if you are taking acceleration measurements. Linear and Log scaling are available for all measurement types. Choose from the following amplitude display units:
Section 4: Analyzing Measurements Onsite
49
Store Units Max dB Value
Linear Scale
Max dB Value
Log Scale
Acceleration m/s2, mm/s
2 m/s
2, mm/s
2
Velocity mm/s, µm/s mm/s, µm/s
Displacement mil, mm, µm mm, µm
Current mA, µA mA, µA
Store Units Y Axis Fixed
Linear Scale
Y Axis Fixed
Log Scale
Acceleration automatic, current, mm/s2 m/s
2, mm/s
2
Velocity automatic, current, µm/s mm/s, µm/s
Displacement automatic, current, m mm, µm
Current automatic, current, A mA, µA
vdB The vibration velocity level vdB is defined as 20 times the logarithmic of the ratio of the RMS velocity level to a reference velocity value (the vdB reference). The value 1e-6 mm/s is an abbreviation for 1x10
-6 mm/s and is the SI reference level. The value 1e-5 mm/s is
the reference level used by the US Navy and many American industries.
adB The vibration acceleration level adB (US) is defined as 20 times the logarithm of the ratio of the RMS acceleration level to 1 µg RMS.
The SI version of adB is less commonly used, and has a reference value of 1 µm/s
2.
Setting the RPM Setting the 1X RPM allows you to view the chart in orders (for spectra) or revs (for waveforms). You can enter the RPM manually (if you know it), or set the RPM from a spectral 1X peak.
Section 4: Analyzing Measurements Onsite 50
Entering the RPM manually
• With a measurement displayed press then Set RPM.
• Enter a value using the number keys then press
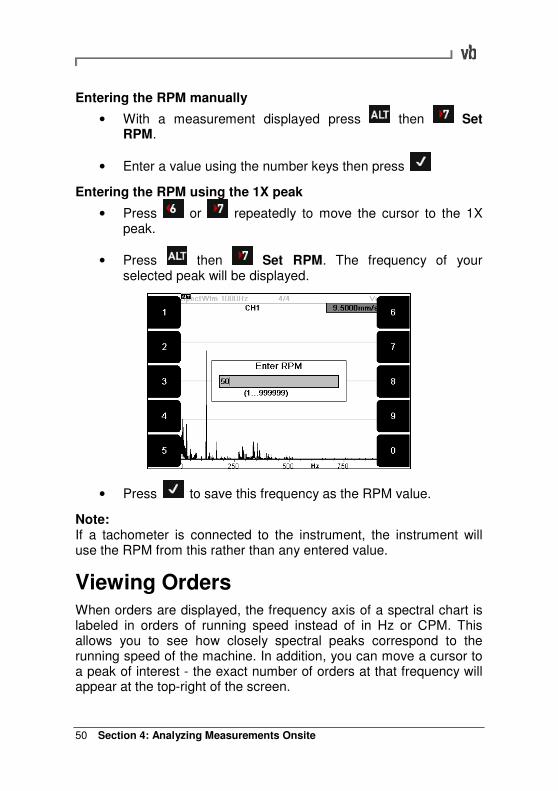
Entering the RPM using the 1X peak
• Press or repeatedly to move the cursor to the 1X peak.
• Press then Set RPM. The frequency of your selected peak will be displayed.
• Press to save this frequency as the RPM value.
Note: If a tachometer is connected to the instrument, the instrument will use the RPM from this rather than any entered value.
Viewing Orders When orders are displayed, the frequency axis of a spectral chart is labeled in orders of running speed instead of in Hz or CPM. This allows you to see how closely spectral peaks correspond to the running speed of the machine. In addition, you can move a cursor to a peak of interest - the exact number of orders at that frequency will appear at the top-right of the screen.
Section 4: Analyzing Measurements Onsite
51
• With a spectral chart displayed, set the RPM as described in
the previous topic and press then X Axis Orders.
• To de-activate orders repeat the previous step.
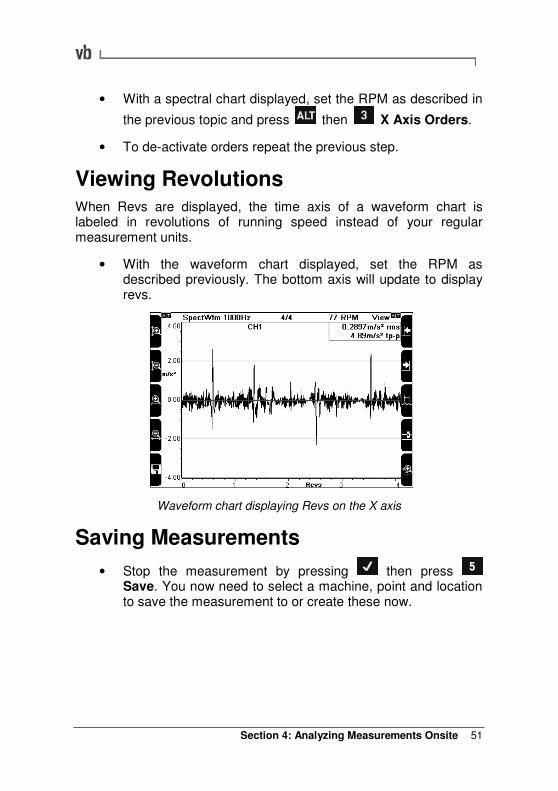
Viewing Revolutions When Revs are displayed, the time axis of a waveform chart is labeled in revolutions of running speed instead of your regular measurement units.
• With the waveform chart displayed, set the RPM as described previously. The bottom axis will update to display revs.
Waveform chart displaying Revs on the X axis
Saving Measurements
• Stop the measurement by pressing then press Save. You now need to select a machine, point and location to save the measurement to or create these now.
Section 4: Analyzing Measurements Onsite 52
Selecting an existing machine
• Press Save to.. (keys to depending on the number
of channels used for the measurement), then press or
to scroll up and down and press Expand Navigator repeatedly to expand out a machine so that its
points and locations become visible. Press to save the recording to your chosen location.
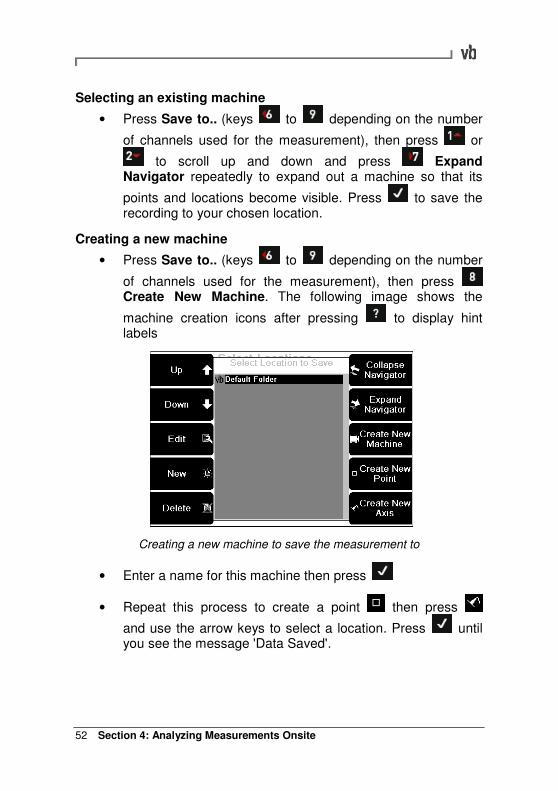
Creating a new machine
• Press Save to.. (keys to depending on the number
of channels used for the measurement), then press Create New Machine. The following image shows the
machine creation icons after pressing to display hint labels
Creating a new machine to save the measurement to
• Enter a name for this machine then press
• Repeat this process to create a point then press
and use the arrow keys to select a location. Press until you see the message 'Data Saved'.
Section 5: Setting Measurement Options
53
Section 5: Setting Measurement Options
This section describes the different parameters used to take measurements and how to apply them.
You will learn:
• What the various parameters are for spectra, waveforms and other measurement types
• How to create parameter sets for taking measurements
• What measurement units and overall scaling options are available
• How to assign sensors to channels
Setting Measurement Units and Spectrum Scaling You can choose the standard US or SI units, or choose your own preferences. The table below summarizes the options.
• To set a preference, from the Main Menu press
Options then press Measuring Units.
• Press repeatedly to toggle which unit set is displayed. To set your own preferences select Custom then press the keys beside the first option you wish to change.
• Most on-screen options will open a sub-menu; press the keys repeatedly to cycle through the various options. When
you have finished press to save and return to the Measurement Units Menu.
Section 5: Setting Measurement Options 54
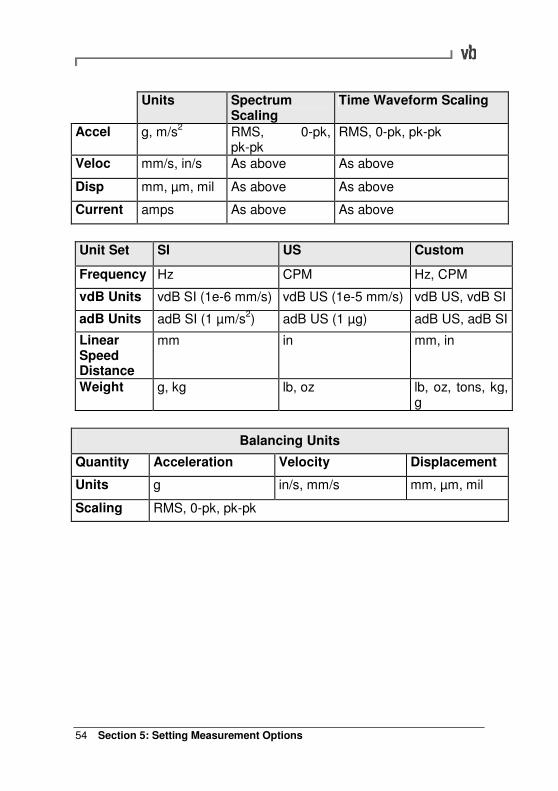
Units Spectrum Scaling
Time Waveform Scaling
Accel g, m/s2 RMS, 0-pk,
pk-pk RMS, 0-pk, pk-pk
Veloc mm/s, in/s As above As above
Disp mm, µm, mil As above As above
Current amps As above As above
Unit Set SI US Custom
Frequency Hz CPM Hz, CPM
vdB Units vdB SI (1e-6 mm/s) vdB US (1e-5 mm/s) vdB US, vdB SI
adB Units adB SI (1 µm/s2) adB US (1 µg) adB US, adB SI
Linear Speed Distance
mm in mm, in
Weight g, kg lb, oz lb, oz, tons, kg, g
Balancing Units
Quantity Acceleration Velocity Displacement
Units g in/s, mm/s mm, µm, mil
Scaling RMS, 0-pk, pk-pk
Section 5: Setting Measurement Options
55
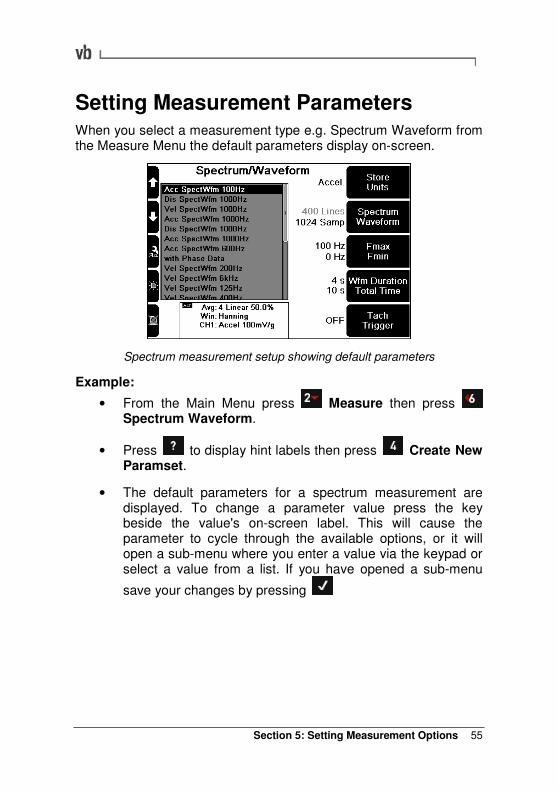
Setting Measurement Parameters When you select a measurement type e.g. Spectrum Waveform from the Measure Menu the default parameters display on-screen.
Spectrum measurement setup showing default parameters
Example:
• From the Main Menu press Measure then press Spectrum Waveform.
• Press to display hint labels then press Create New Paramset.
• The default parameters for a spectrum measurement are displayed. To change a parameter value press the key beside the value's on-screen label. This will cause the parameter to cycle through the available options, or it will open a sub-menu where you enter a value via the keypad or select a value from a list. If you have opened a sub-menu
save your changes by pressing
Section 5: Setting Measurement Options 56
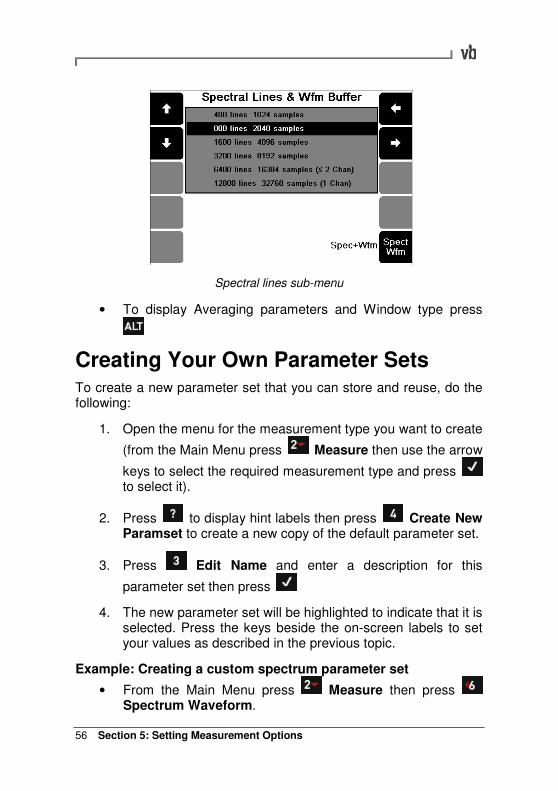
Spectral lines sub-menu
• To display Averaging parameters and Window type press
Creating Your Own Parameter Sets To create a new parameter set that you can store and reuse, do the following:
1. Open the menu for the measurement type you want to create
(from the Main Menu press Measure then use the arrow
keys to select the required measurement type and press to select it).
2. Press to display hint labels then press Create New Paramset to create a new copy of the default parameter set.
3. Press Edit Name and enter a description for this
parameter set then press
4. The new parameter set will be highlighted to indicate that it is selected. Press the keys beside the on-screen labels to set your values as described in the previous topic.
Example: Creating a custom spectrum parameter set
• From the Main Menu press Measure then press Spectrum Waveform.
Section 5: Setting Measurement Options
57
• Press Create New Paramset.
• Press Edit Name and enter a name for this parameter
set then press
• Change Store Units to Acceleration. Press and select
the Accel then press .
• Set the Fmax to 1500 CPM. Press Fmax Fmin then
press to set the RPM to 10 x the machine running speed.
• Set the number of Spectral Lines to 3200. Press Spectrum Waveform and use the arrow keys to highlight
'3200 lines 8192 samples' then press
• Set the Average Overlap to 62.5%. Press to display
Averaging and Window options and press Average Overlap repeatedly to cycle through the values, then press
• Your new parameter set is now ready to use. If you have already defined a sensor and enabled a channel you can
now take a measurement by pressing Assigning sensors to channels is explained in the next topic.
Assigning Sensors to Channels You must specify which sensor is assigned to each channel. When you take a measurement the instrument will know which sensor is being used and will offer you the appropriate measurement unit and overall scaling options for on-screen display. If you unplug a sensor in order to take a different type of measurement e.g. swapping an accelerometer for a current sensor, you will need to assign this new sensor to the channel.
• From the Main Menu press Options.
Section 5: Setting Measurement Options 58
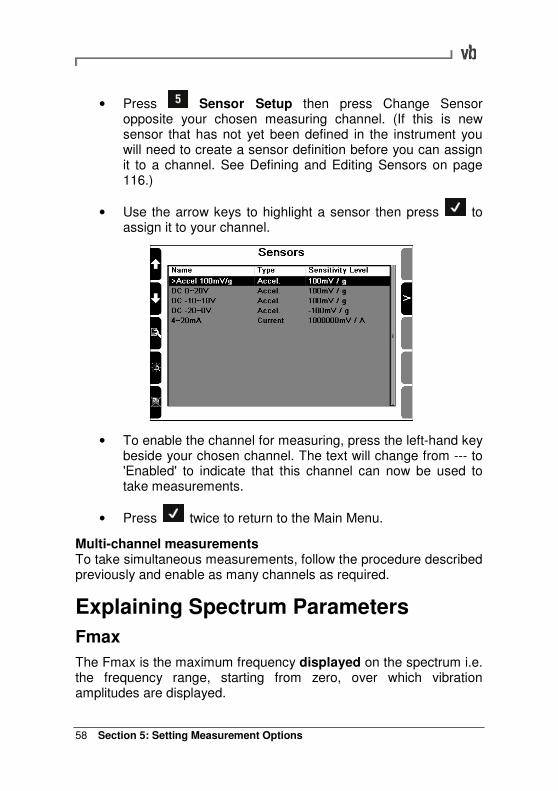
• Press Sensor Setup then press Change Sensor opposite your chosen measuring channel. (If this is new sensor that has not yet been defined in the instrument you will need to create a sensor definition before you can assign it to a channel. See Defining and Editing Sensors on page 116.)
• Use the arrow keys to highlight a sensor then press to assign it to your channel.
• To enable the channel for measuring, press the left-hand key beside your chosen channel. The text will change from --- to 'Enabled' to indicate that this channel can now be used to take measurements.
• Press twice to return to the Main Menu.
Multi-channel measurements To take simultaneous measurements, follow the procedure described previously and enable as many channels as required.
Explaining Spectrum Parameters
Fmax
The Fmax is the maximum frequency displayed on the spectrum i.e. the frequency range, starting from zero, over which vibration amplitudes are displayed.
Section 5: Setting Measurement Options
59
In general, the higher the operating speed of the machine, the higher the Fmax needs to be to capture all crucial information. For vibration involving fingered elements such as gear teeth, fan blades, pump vanes, and bearing elements, an Fmax equal to 3 times the number of fingers multiplied by the operating speed is usually sufficient. For vibration not involving fingered elements, an Fmax equal to 40 times the operating speed is usually sufficient.
You can specify the Fmax of a measurement either as an exact value or as a multiple (order) of a machine's running speed.
• Select your measurement type then press Fmax Fmin. The options labeled 40 X and 10 X represent orders of running speed. The option ? X allows you to enter your own number of orders.
• Press one of the orders keys and enter your machine's default RPM value.
• Press twice to return to the measurement setup.
When you take the measurement the resulting display will use an Fmax with the specified number of orders (the value will be rounded up to the closest Fmax if an exact match is not available).
Spectral Lines
The resolution of the spectrum increases with the number of spectral lines used i.e. the more spectral lines the more information the spectrum contains. However, the more spectral lines used, the longer the measurement takes. Use many spectral lines only when required e.g. when you need to distinguish between two closely-spaced vibration frequencies or when the Fmax is very large. For coast-down or run-up measurements we recommend a resolution of 400 lines.
Fmin
The purpose of the Fmin setting is to eliminate the 'ski-slope' effect from the low frequency end of the spectra. All spectral lines below the Fmin value will be set to zero and will not be included in the overall RMS calculation.
Section 5: Setting Measurement Options 60
Tach Trigger
When you select Tach Trigger, measuring begins only when a tachometer pulse is detected. If Tach Trigger is set to OFF the instrument will begin measuring as soon as the settling time has elapsed.
Averaging
When measuring vibration, several spectra are usually measured and averaged to produce an average vibration chart. The averaging process minimizes the effect of random variations or noise spikes that are inherent in vibration signals. Averaging is applied to amplitude values, not to the frequency range.
• From your chosen measurement setup menu press to display the various averaging options.
Number of Averages
The larger the number of spectra used for averaging, the more any noise spikes in vibration signals are reduced and the more accurately true spectral peaks are represented. However, the larger the number of averages, the more data needs to be collected and therefore the longer it takes to obtain the average spectrum. Four averages are sufficient for most cases. Set the number of averages to one if spectra averaging is not required, for example, with run-up and coast-down recordings.
Average Type
Linear averaging is suitable for most cases. The amplitude value at each frequency of a spectrum is added to the same frequency of the next spectrum. The sum is then divided by the number of averages taken.
Exponential averaging is occasionally used during manual measurements to give the advantage of a fast update rate, while maintaining some averaging. The most recent spectra have more influence on the average than earlier measurements. Averaging is continuous until the measurement is stopped.
Section 5: Setting Measurement Options
61
Peak hold is useful for measuring the maximum amplitude peak that occurs over a period of time, and for measuring resonances during a bump test. Peak hold does not actually average the amplitude values, but records and displays the maximum amplitude of each spectral line.
Average Overlap
Overlapping is a means of collecting and displaying data more quickly. As vibration measurements are collected a percentage of the new data is combined (overlapped) with each subsequent measurement. The higher the overlap percentage, the less newly acquired data is needed to generate a spectrum, and thus the faster the spectrum can be displayed. An overlap percentage of 50% is ideal for most cases.
Window
Note: Windowing is not available with waveforms.
Measured data is usually not directly used to generate a spectrum but is first modified using a 'Window' function. The purpose of windowing is to compensate for certain FFT algorithm limitations that cause signal leakage. Windowing involves multiplying 'blocks' of data values by a suitable mathematical function (window type) to ensure that the data block begins and ends with zero amplitude. This makes the data block appear like a complete wave.
Choosing a window type You can choose Hanning or Rectangular (no window). Each type of window has characteristics that make it better suited for some applications and less well suited for others. The following table is a general guide only; you should match the window type to the nature of the signal you are trying to capture such as random or transient signals etc.
Section 5: Setting Measurement Options 62
Window Type Purpose
Hanning window Provides the best frequency resolution. The Hanning window is a good general purpose window.
Rectangular The FFT is not adjusted i.e. this is equivalent to not using a window.
Explaining Waveform Parameters
Equivalent Fmax
This allows you to control the waveform sampling rate by expressing it in terms of the maximum frequency of interest. For example, if you want a waveform with frequency content (Equivalent Fmax) up to 1 kHz, the instrument will automatically sample at 2.56 kHz. Changing the Eq. Fmax directly affects the sampling rate, so it has an inverse effect on the duration of the waveform.
Number of Samples
The resolution of the waveform increases with the number of samples used i.e. the more samples, the more information the waveform contains. However, the more samples in a waveform, the more memory is used up to store the waveform.
Tip: An easy way to select the number of samples and duration is to let the instrument set them for you. Set the Equivalent Fmax so that it covers your required frequency range; the instrument will select the maximum number of samples and duration that can be used with this Fmax. You can then adjust these values as required.
Duration
The Duration of a waveform is its recording time. The duration value depends on the number of samples selected; increasing the number of samples increases the duration.
Section 5: Setting Measurement Options
63
Other Measurement Parameters Bandwidth (available with Demod Spectrum): the bandwidth you select determines which range of frequencies the demodulation process will use. Refer to the topics on demodulation for more information.
Machine speed (available with Cross Channel Phase): when measuring cross channel phase you need to specify which frequency you are investigating - this is typically the machine running speed.
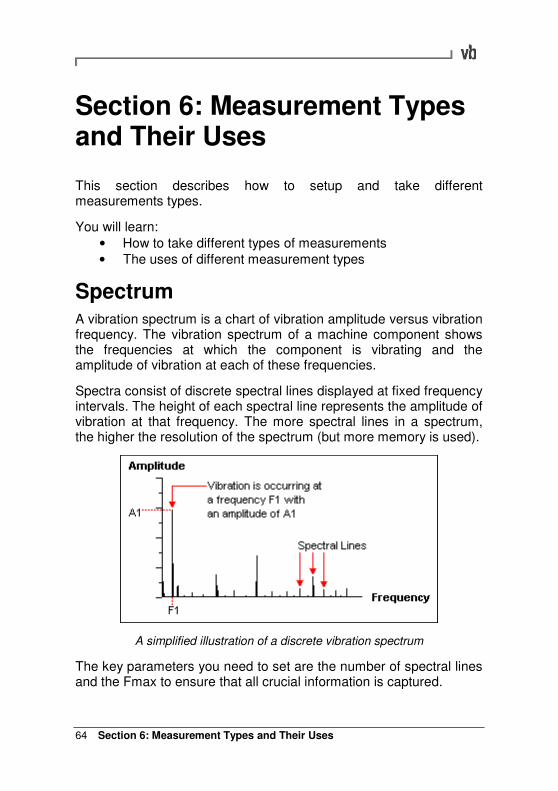
Section 6: Measurement Types and Their Uses 64
Section 6: Measurement Types and Their Uses
This section describes how to setup and take different measurements types.
You will learn:
• How to take different types of measurements • The uses of different measurement types
Spectrum A vibration spectrum is a chart of vibration amplitude versus vibration frequency. The vibration spectrum of a machine component shows the frequencies at which the component is vibrating and the amplitude of vibration at each of these frequencies.
Spectra consist of discrete spectral lines displayed at fixed frequency intervals. The height of each spectral line represents the amplitude of vibration at that frequency. The more spectral lines in a spectrum, the higher the resolution of the spectrum (but more memory is used).
A simplified illustration of a discrete vibration spectrum
The key parameters you need to set are the number of spectral lines and the Fmax to ensure that all crucial information is captured.
Section 6: Measurement Types and Their Uses
65
• From the Main Menu press Measure then press Spectrum Waveform.
• Use the left-hand arrow keys to select a parameter set or
create a new one by pressing and setting the parameters as required.
• Press to begin measuring.
Waveform Waveforms show how vibration levels change with time. A vibration waveform chart represents a series of equally spaced discrete sample points connected by straight lines. The chart shows the vibration level (amplitude) at each time interval during the measurement period. The more sample points in a spectrum the higher the resolution of the waveform (but the more memory used).
The key parameters you need to set are the duration and number of samples.
The duration determines the equivalent Fmax value. If the waveform is later transferred to the Ascent program and displayed as a spectrum this Fmax value will be used on the chart.
The number of samples controls the number of spectral lines used when the waveform is transferred to the Ascent program and displayed as a spectrum.
• From the Main Menu press Measure then press Spectrum Waveform.
• Use the left-hand arrow keys to select a parameter set or
create a new one by pressing and setting the parameters as required.
• Press to begin measuring.
Section 6: Measurement Types and Their Uses 66
Demodulation Explained The demodulation process looks for repetitive patterns created by impact events that lie embedded within a time waveform. The process works by extracting the low amplitude, high frequency impact signals and then tracing an 'envelope' around these signals to identify them as repetitions of the same fault. The resulting spectrum, with the low frequency data removed, will now clearly show the high frequency impact signals and harmonics.
Demodulation is also useful as an early warning device as it detects bearing tones before they are visible in a normal spectrum.
The high frequency signals that demodulation aims to extract are very localized, therefore extra care must be taken to ensure the accelerometer is set up correctly. Ensure that:
� The accelerometer is mounted close to the signal source.
� The accelerometer is well coupled, using either stud mounting or a very strong magnet on bare metal. A handheld probe or stinger is not recommended.
� The accelerometer mounting is consistent between visits otherwise trend plots of overall RMS values will be meaningless.
The bandwidth you select determines which range of frequencies the demodulation process will use. We recommend you use the following procedure to determine an appropriate bandwidth.
• First take a 'quick snapshot' spectrum measurement. From
the Main Menu press Measure then press Spectrum Waveform.
• Press to create a new parameter set then set the Store Units to Acceleration and Fmax to 20 000 Hz (1200 kCPM).
• Press to begin measuring.
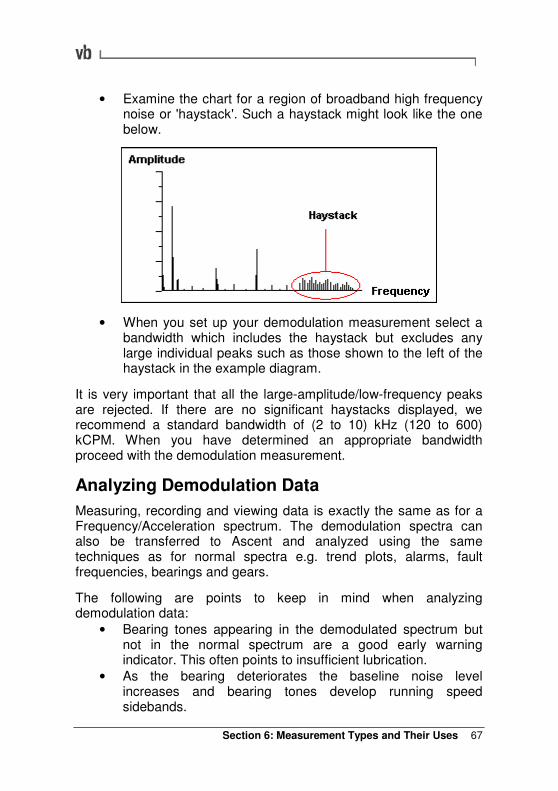
Section 6: Measurement Types and Their Uses
67
• Examine the chart for a region of broadband high frequency noise or 'haystack'. Such a haystack might look like the one below.
• When you set up your demodulation measurement select a bandwidth which includes the haystack but excludes any large individual peaks such as those shown to the left of the haystack in the example diagram.
It is very important that all the large-amplitude/low-frequency peaks are rejected. If there are no significant haystacks displayed, we recommend a standard bandwidth of (2 to 10) kHz (120 to 600) kCPM. When you have determined an appropriate bandwidth proceed with the demodulation measurement.
Analyzing Demodulation Data
Measuring, recording and viewing data is exactly the same as for a Frequency/Acceleration spectrum. The demodulation spectra can also be transferred to Ascent and analyzed using the same techniques as for normal spectra e.g. trend plots, alarms, fault frequencies, bearings and gears.
The following are points to keep in mind when analyzing demodulation data:
• Bearing tones appearing in the demodulated spectrum but not in the normal spectrum are a good early warning indicator. This often points to insufficient lubrication.
• As the bearing deteriorates the baseline noise level increases and bearing tones develop running speed sidebands.
Section 6: Measurement Types and Their Uses 68
• In the final stages of bearing wear the bearing tones may become less prominent as cracks and pits become more rounded and distributed over the race.
6Pack 6Pack allows up to six measurements to be taken simultaneously from a single data stream/channel. All standard condition monitoring data can be acquired in one step and in the time normally required to take a single conventional recording.
A 6Pack recording may include some or all of the following measurement types for each recorded channel:
� High Frequency Spectrum
� High Frequency Waveform
� Low Frequency Spectrum
� Low Frequency Waveform
� Demodulation Spectrum
� Demodulation Waveform
• From the Main Menu press Measure then press 6Pack.
• Use the left-hand arrow keys to select a parameter set or
press to create a new one and set the parameters as required.
• Press Spectrum Waveform, HF Fmax (Dmax) or
Demod Band (Dmin) then use keys , and to select the measurement types you wish to record.
• Press to begin sampling.
Section 6: Measurement Types and Their Uses
69
Note: The six recording types that comprise a 6Pack measurement are saved as a single recording for each channel, not as individual High Frequency, Low Frequency and Demodulation.
Streamlined parameter settings
The following simplifications have been applied to 6Pack measurements:
• The sensor type must be Accelerometer. • The High Frequency and Demodulation measurements are
measured in Acceleration units only. • All spectra and waveforms have the same resolution
(maximum 800 lines, 2048 samples).
• The Demod Bandwidth upper limit is automatically set to equal the HF Fmax.
• Averaging type, number and overlap are the same for all spectra.
• Fmin and Demodulation Fmin are the same.
• Fmax and Demod Fmax are the same. Note: There are many charts displayed when using the 6Pack feature, especially when measuring with two channels. See the Viewing Multiple Charts (page 46) section for more information on multi-chart layout options.
6Pack Demodulation Processing
6Pack measurements use a slightly different Demod algorithm to that used when taking ”Demod” measurements (the classic algorithm). The new algorithm performs ‘enveloping’ around the high frequency impact events, in much the same way a user does by eye when viewing a high frequency waveform. By contrast, classic Demod relies on rectification and low pass filtering to achieve a similar result. The new algorithm works very well over a wide range of impact signals, yet it uses far less computing power than classic Demod. This allows the 6Pack system to operate at full 40kHz speed on 2 channels simultaneously, providing twelve processed outputs.
The new algorithm has been carefully calibrated so its response to typical impacting signals is very close to that of classic Demod.
Section 6: Measurement Types and Their Uses 70
Users should not see a marked difference when switching to the 6Pack method.
Demod Spectrum
• From the Main Menu press Measure then press Demod.
• Use the left-hand arrow keys to select a parameter set or
press to create a new one and set the parameters as required. Set the bandwidth first as this will determine the range of available Fmax values.
• Press to begin measuring.
Tachometer Display Tachometer Display shows an updating readout of the machine speed. It can also display the amplitude and phase angle of the 1X vibration. This can be used to:
� Verify the machine running speed
� View the phase angle of the vibration relative to the tach signal
� Take a quick preview of the 'out of balance' level
• Connect the tachometer that will be used to measure the RPM. Attach a vibration sensor if you wish to see the vibration amplitude.
• From the Main Menu press Measure then press Tach.
• Select the Standard tachometer or Keyphasor® sensor by
pressing
• To see the amplitude and phase angle relative to the
tachometer signal press Tach + Vibration. Change any parameters as required.
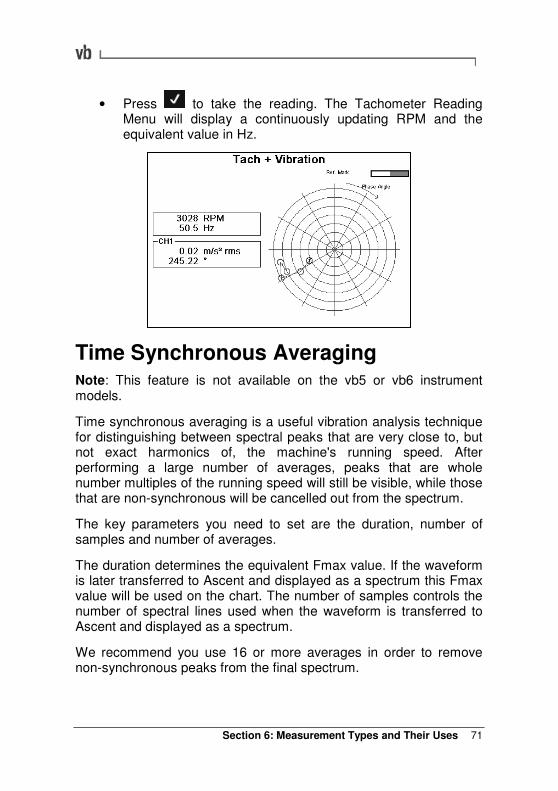
Section 6: Measurement Types and Their Uses
71
• Press to take the reading. The Tachometer Reading Menu will display a continuously updating RPM and the equivalent value in Hz.
Time Synchronous Averaging Note: This feature is not available on the vb5 or vb6 instrument models.
Time synchronous averaging is a useful vibration analysis technique for distinguishing between spectral peaks that are very close to, but not exact harmonics of, the machine's running speed. After performing a large number of averages, peaks that are whole number multiples of the running speed will still be visible, while those that are non-synchronous will be cancelled out from the spectrum.
The key parameters you need to set are the duration, number of samples and number of averages.
The duration determines the equivalent Fmax value. If the waveform is later transferred to Ascent and displayed as a spectrum this Fmax value will be used on the chart. The number of samples controls the number of spectral lines used when the waveform is transferred to Ascent and displayed as a spectrum.
We recommend you use 16 or more averages in order to remove non-synchronous peaks from the final spectrum.
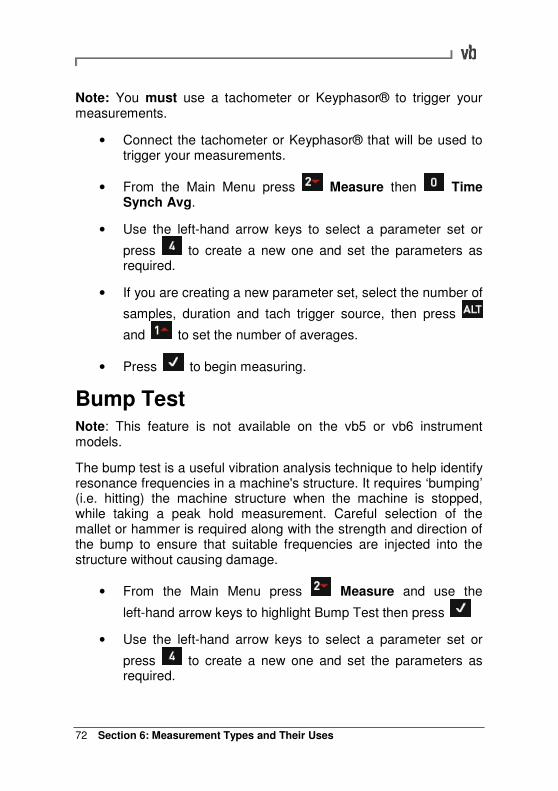
Section 6: Measurement Types and Their Uses 72
Note: You must use a tachometer or Keyphasor® to trigger your measurements.
• Connect the tachometer or Keyphasor® that will be used to trigger your measurements.
• From the Main Menu press Measure then Time Synch Avg.
• Use the left-hand arrow keys to select a parameter set or
press to create a new one and set the parameters as required.
• If you are creating a new parameter set, select the number of
samples, duration and tach trigger source, then press
and to set the number of averages.
• Press to begin measuring.
Bump Test Note: This feature is not available on the vb5 or vb6 instrument models.
The bump test is a useful vibration analysis technique to help identify resonance frequencies in a machine's structure. It requires ‘bumping’ (i.e. hitting) the machine structure when the machine is stopped, while taking a peak hold measurement. Careful selection of the mallet or hammer is required along with the strength and direction of the bump to ensure that suitable frequencies are injected into the structure without causing damage.
• From the Main Menu press Measure and use the
left-hand arrow keys to highlight Bump Test then press
• Use the left-hand arrow keys to select a parameter set or
press to create a new one and set the parameters as required.
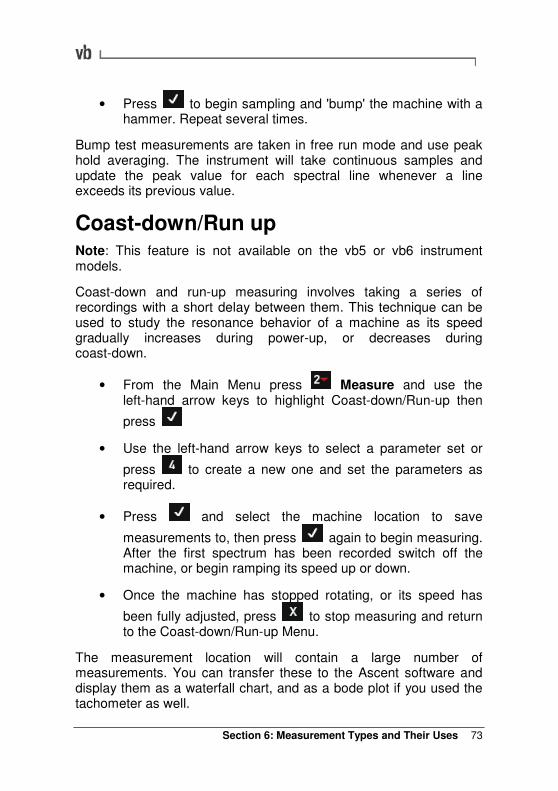
Section 6: Measurement Types and Their Uses
73
• Press to begin sampling and 'bump' the machine with a hammer. Repeat several times.
Bump test measurements are taken in free run mode and use peak hold averaging. The instrument will take continuous samples and update the peak value for each spectral line whenever a line exceeds its previous value.
Coast-down/Run up Note: This feature is not available on the vb5 or vb6 instrument models.
Coast-down and run-up measuring involves taking a series of recordings with a short delay between them. This technique can be used to study the resonance behavior of a machine as its speed gradually increases during power-up, or decreases during coast-down.
• From the Main Menu press Measure and use the left-hand arrow keys to highlight Coast-down/Run-up then
press
• Use the left-hand arrow keys to select a parameter set or
press to create a new one and set the parameters as required.
• Press and select the machine location to save
measurements to, then press again to begin measuring. After the first spectrum has been recorded switch off the machine, or begin ramping its speed up or down.
• Once the machine has stopped rotating, or its speed has
been fully adjusted, press to stop measuring and return to the Coast-down/Run-up Menu.
The measurement location will contain a large number of measurements. You can transfer these to the Ascent software and display them as a waterfall chart, and as a bode plot if you used the tachometer as well.
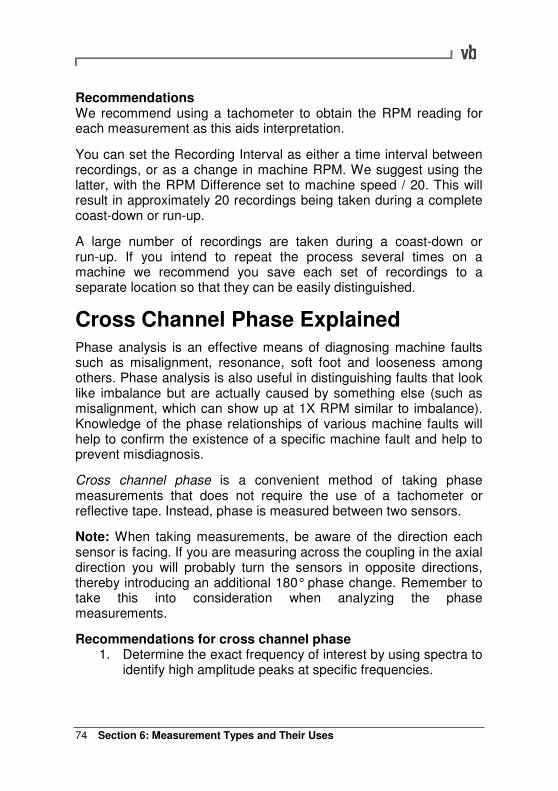
Section 6: Measurement Types and Their Uses 74
Recommendations We recommend using a tachometer to obtain the RPM reading for each measurement as this aids interpretation.
You can set the Recording Interval as either a time interval between recordings, or as a change in machine RPM. We suggest using the latter, with the RPM Difference set to machine speed / 20. This will result in approximately 20 recordings being taken during a complete coast-down or run-up.
A large number of recordings are taken during a coast-down or run-up. If you intend to repeat the process several times on a machine we recommend you save each set of recordings to a separate location so that they can be easily distinguished.
Cross Channel Phase Explained Phase analysis is an effective means of diagnosing machine faults such as misalignment, resonance, soft foot and looseness among others. Phase analysis is also useful in distinguishing faults that look like imbalance but are actually caused by something else (such as misalignment, which can show up at 1X RPM similar to imbalance). Knowledge of the phase relationships of various machine faults will help to confirm the existence of a specific machine fault and help to prevent misdiagnosis.
Cross channel phase is a convenient method of taking phase measurements that does not require the use of a tachometer or reflective tape. Instead, phase is measured between two sensors.
Note: When taking measurements, be aware of the direction each sensor is facing. If you are measuring across the coupling in the axial direction you will probably turn the sensors in opposite directions, thereby introducing an additional 180° phase change. Remember to take this into consideration when analyzing the phase measurements.
Recommendations for cross channel phase 1. Determine the exact frequency of interest by using spectra to
identify high amplitude peaks at specific frequencies.
Section 6: Measurement Types and Their Uses
75
2. Position the channel 1 sensor in a location which has high vibration at this frequency. Do not move this sensor once testing has started.
3. Try out different locations with the channel 2 sensor, noting the phase and amplitude relationships compared to the fixed channel 1 position.
4. Repeat steps 2 and 3 at any other locations of interest.
Fault Types and their Phase Relationships
Misalignment - High amplitude peaks will appear at 1X, 2X and sometimes 3X the running speed. Look for a 180° (± 30°) phase change across the coupling in the axial direction (for angular misalignment) or radial direction (for parallel (offset) misalignment). Bearing misalignment (cocked bearing) will cause a twisting motion in the axial direction. Look for a 180° (± 30°) phase change from the top to the bottom of the bearing housing or from one side to the other.
Imbalance - A high amplitude peak will appear at 1X the running speed. Confirm that the phase difference from horizontal to vertical on the bearing is close to 90° (± 40°). The phase difference between left and right horizontal locations should be within 30° of the phase difference between left and right vertical locations. If the phase is unstable there may be another reason for a large running speed vibration e.g. looseness or misalignment.
You can investigate the degree of couple imbalance versus force imbalance by looking at the phase difference between the two sides of the machine - if there is little couple imbalance then only a single plane correction may be required to balance the rotor.
Resonance (flexible structures) - High amplitude peaks will appear where natural resonance frequencies of the structure coincide with excitation frequencies (e.g. 1X, other low orders of running speed, blade pass frequency etc). Look for a 0° phase change when both sensors are positioned in the same direction between two stationary points. The phase change will be 180° when there is a stationary point between the sensors.
Section 6: Measurement Types and Their Uses 76
Resonance (variable speed machines) - To investigate resonance you can vary the machine speed. A phase shift of 180° will occur as machine speed is increased from below a resonance to above a resonance. A 90° phase shift will be present at the resonant frequency. If a machine is running close to resonance, any small speed variation will cause large phase shifts.
Resonance (at a bearing) - Look for a change from the normal 90° phase difference in the horizontal and vertical directions at 1X. When a natural frequency is close to 1X in either direction, that phase angle may be well be on the way towards its 90° phase change so the two phases may no longer be 90° apart (assuming that the structure has a different natural frequency in either direction).
Eccentric belt pulley - A high amplitude peak will appear at 1X the running speed of the pulley. Look for a phase change of either 0° or 180° between the horizontal and vertical readings, which indicates straight line motion instead of the usual 90° difference. This symptom is similar to bearing resonance (described above) but in this case the direction of maximum vibration will be in line with the two belts.
Mechanical looseness - High amplitude peaks will show up at many multiples of the running speed and sometimes even multiples of 0.5X running speed e.g. 1.5X, 2.5X etc. Look for fluctuating phase readings at a location from one recording to the next to the next. Also compare the phase readings at 30° increments around a bearing housing - the phase will be significantly different at each angle.
Mechanical foot looseness (soft foot) - A high amplitude peak will show up at 1X the running speed. Look for a 90° to 180° phase change between the machine foot and its concrete base. The soft foot may also have a different phase measurement from the other feet.
Measuring Cross Channel Phase
Note: This feature is not available on the vb5 or vb6 instrument models.
The key parameter you need to set is the machine speed. The machine speed can be the actual speed of the machine or the frequency of interest (these are usually the same as the most
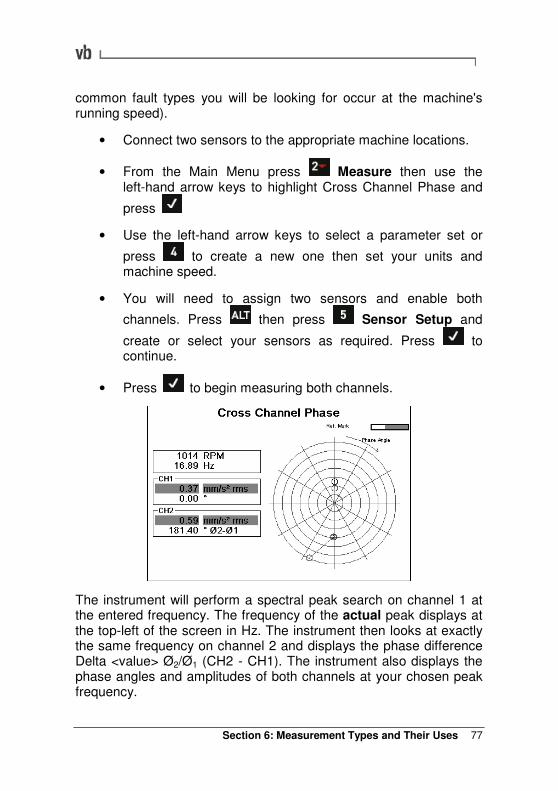
Section 6: Measurement Types and Their Uses
77
common fault types you will be looking for occur at the machine's running speed).
• Connect two sensors to the appropriate machine locations.
• From the Main Menu press Measure then use the left-hand arrow keys to highlight Cross Channel Phase and
press
• Use the left-hand arrow keys to select a parameter set or
press to create a new one then set your units and machine speed.
• You will need to assign two sensors and enable both
channels. Press then press Sensor Setup and
create or select your sensors as required. Press to continue.
• Press to begin measuring both channels.
The instrument will perform a spectral peak search on channel 1 at the entered frequency. The frequency of the actual peak displays at the top-left of the screen in Hz. The instrument then looks at exactly the same frequency on channel 2 and displays the phase difference Delta <value> Ø2/Ø1 (CH2 - CH1). The instrument also displays the phase angles and amplitudes of both channels at your chosen peak frequency.
Section 6: Measurement Types and Their Uses 78
Long Time Waveforms Explained Long time waveforms allow you to take a continuous recording over a very long time period (many hours if required), making it particularly useful for capturing transients. Once measuring has begun, recordings are taken continuously until your specified time period has elapsed or you manually stop the measurement. The amount of time you can record for depends on the Equivalent Fmax (which determines the sample rate/lines of resolution) and how much available memory is left in the instrument.
Measuring Long Time Waveforms
Note: This feature is not available on the vb5 or vb6 instrument models.
Duration is the total amount of time available for recording and is displayed in seconds. You can record for the full length of time available or set a shorter time period. Your chosen time period is shown on top, while the available time is shown in brackets below this value.
The Equivalent Fmax (which determines the maximum frequency displayed on-screen) will affect the available recording time; a high Fmax reduces recording time, while a low Fmax increases the total amount of time available for recording.
While the instrument is recording you can display the on-screen signal as a waveform, or convert it to a spectral display by pressing Display Type & Resolution and selecting your preferred display type.
• From the Main Menu press Measure then use the left-hand arrow keys to highlight Long Time Waveform and
press
• Use the left-hand arrow keys to select a parameter set or
press to create a new one and set the parameters as required.
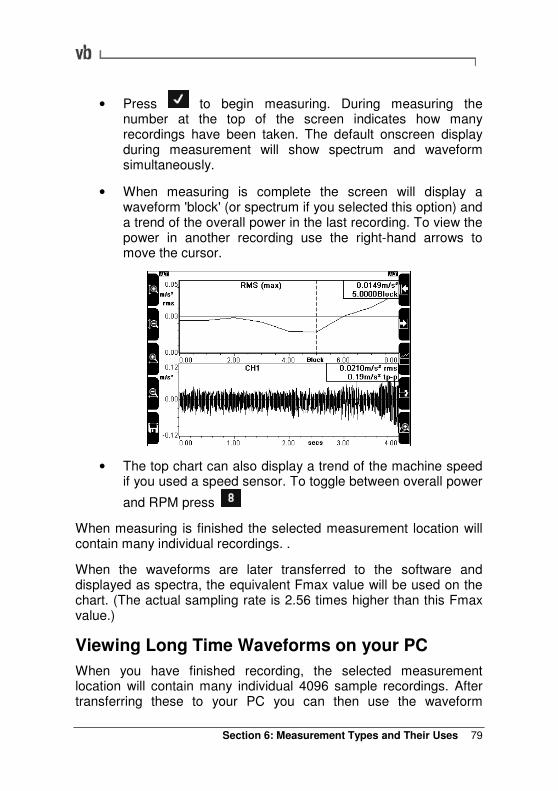
Section 6: Measurement Types and Their Uses
79
• Press to begin measuring. During measuring the number at the top of the screen indicates how many recordings have been taken. The default onscreen display during measurement will show spectrum and waveform simultaneously.
• When measuring is complete the screen will display a waveform 'block' (or spectrum if you selected this option) and a trend of the overall power in the last recording. To view the power in another recording use the right-hand arrows to move the cursor.
• The top chart can also display a trend of the machine speed if you used a speed sensor. To toggle between overall power
and RPM press
When measuring is finished the selected measurement location will contain many individual recordings. .
When the waveforms are later transferred to the software and displayed as spectra, the equivalent Fmax value will be used on the chart. (The actual sampling rate is 2.56 times higher than this Fmax value.)
Viewing Long Time Waveforms on your PC
When you have finished recording, the selected measurement location will contain many individual 4096 sample recordings. After transferring these to your PC you can then use the waveform
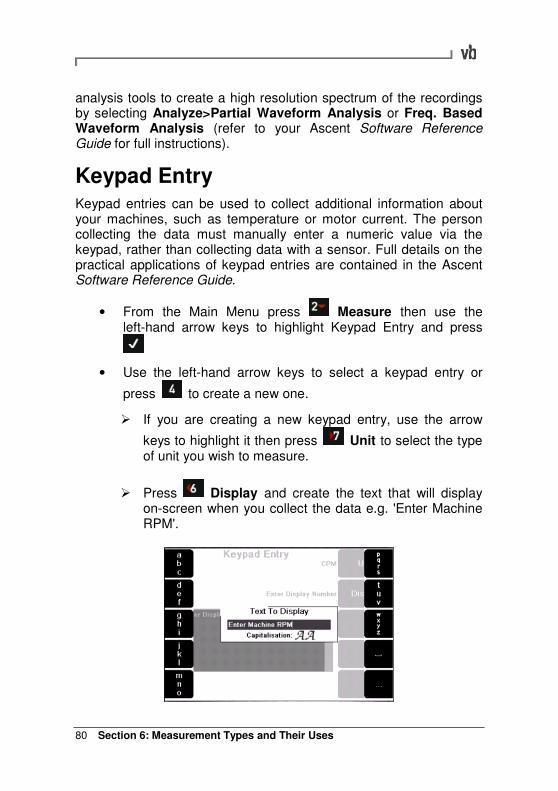
Section 6: Measurement Types and Their Uses 80
analysis tools to create a high resolution spectrum of the recordings by selecting Analyze>Partial Waveform Analysis or Freq. Based Waveform Analysis (refer to your Ascent Software Reference Guide for full instructions).
Keypad Entry Keypad entries can be used to collect additional information about your machines, such as temperature or motor current. The person collecting the data must manually enter a numeric value via the keypad, rather than collecting data with a sensor. Full details on the practical applications of keypad entries are contained in the Ascent Software Reference Guide.
• From the Main Menu press Measure then use the left-hand arrow keys to highlight Keypad Entry and press
• Use the left-hand arrow keys to select a keypad entry or
press to create a new one.
� If you are creating a new keypad entry, use the arrow
keys to highlight it then press Unit to select the type of unit you wish to measure.
� Press Display and create the text that will display on-screen when you collect the data e.g. 'Enter Machine RPM'.
Section 6: Measurement Types and Their Uses
81
• Now instead of taking a measurement, press and enter your value using the keypad.
• Press to select a machine location to save this data to. Use the left-hand arrow keys to scroll up and down and
press (Expand Navigator) repeatedly to expand out a machine so that its points and locations become visible.
Press to save the data to your chosen location.
Average Value Measurements Applies to DC coupled sensors only. Records the average DC value during a user-specified measurement period. The Average Value can be trended and alarmed in the Ascent software. For example, use this feature to measure proximity probe gap. For vb7 instruments this is the only likely application of Average Value measurement, as the other supported sensor types (Acc./Vel./Displ.) are typically AC coupled.
vb6 and vb8 instruments also support Frequency, Voltage, Temperature, Pressure, Power, Force, Volume Flow Rate, Mass Flow Rate and user-defined units. This capability allows these two instrument models to make the most use of Average Value measurements
• From the Main Menu press Measure then use the left-hand arrow keys to highlight Average Value then press
• Use the left-hand arrow keys to select an existing parameter
set or press to create a new one and set the recording parameters as required.
Note: This feature is not available on the vb5 instrument model. Ensure the sensor set up corresponds with the measurement type you wish to take. Create new sensors where necessary. The instrument will record values in the sensor's native units only.
• Press to begin recording.
Section 6: Measurement Types and Their Uses 82
Taking Multi-channel Simultaneous Measurements Taking a multi-channel measurement uses the same process as taking a single channel measurement. The only difference is that you must enable more than one channel, and save each measurement separately. You do not have to save each channel's measurements as you can selectively choose which ones to keep, e.g. you can save a measurement taken on channel 2 but discard the measurement taken on channel 1.
Setting up Sensors and Channels
• Select your measurement type and parameters as normal
and press then Sensor Setup.
• You will need to assign and enable a sensor to each channel you are measuring. Press Change Sensor opposite your chosen measuring channel. (If this is new sensor that has not yet been defined in the instrument you will need to create a sensor definition before you can assign it to a channel. See Defining and Editing Sensors on page 116.)
• Use the arrow keys to highlight a sensor then press to assign it to your channel.
• To enable the channel for measuring, press the left-hand key beside your chosen channel. The text will change from '---' to 'Enabled' to indicate that this channel can now be used to take measurements.
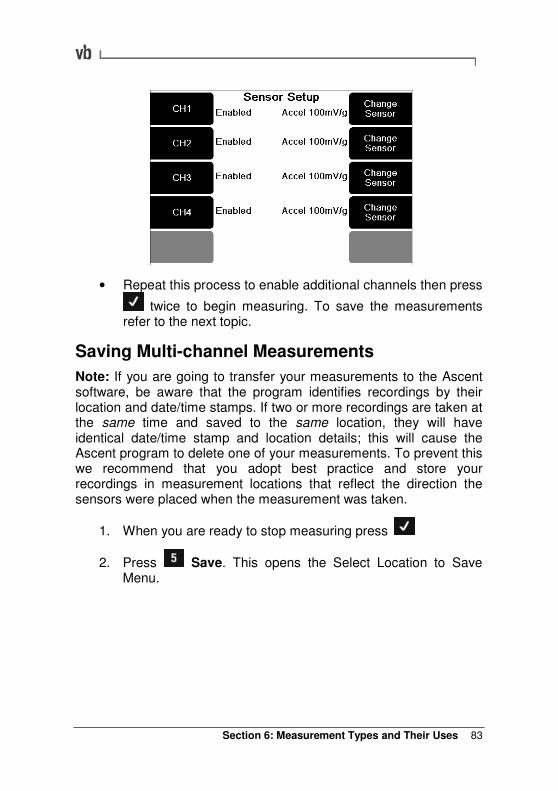
Section 6: Measurement Types and Their Uses
83
• Repeat this process to enable additional channels then press
twice to begin measuring. To save the measurements refer to the next topic.
Saving Multi-channel Measurements
Note: If you are going to transfer your measurements to the Ascent software, be aware that the program identifies recordings by their location and date/time stamps. If two or more recordings are taken at the same time and saved to the same location, they will have identical date/time stamp and location details; this will cause the Ascent program to delete one of your measurements. To prevent this we recommend that you adopt best practice and store your recordings in measurement locations that reflect the direction the sensors were placed when the measurement was taken.
1. When you are ready to stop measuring press
2. Press Save. This opens the Select Location to Save Menu.
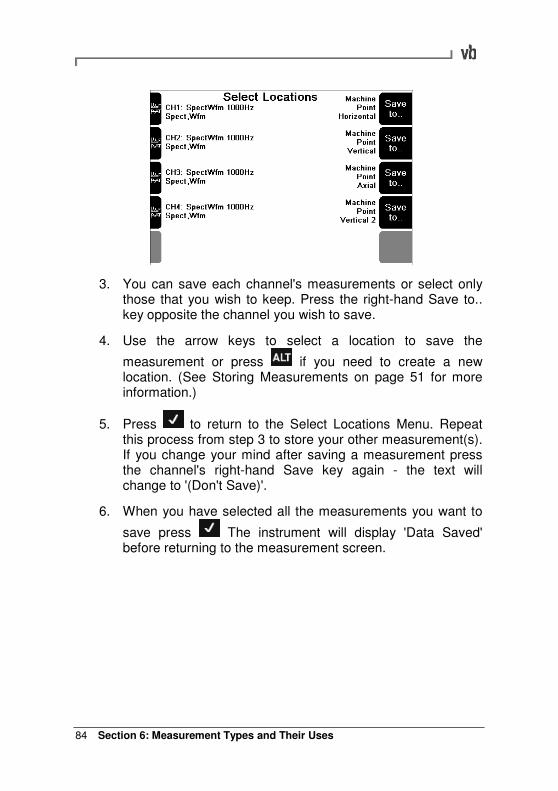
Section 6: Measurement Types and Their Uses 84
3. You can save each channel's measurements or select only those that you wish to keep. Press the right-hand Save to.. key opposite the channel you wish to save.
4. Use the arrow keys to select a location to save the
measurement or press if you need to create a new location. (See Storing Measurements on page 51 for more information.)
5. Press to return to the Select Locations Menu. Repeat this process from step 3 to store your other measurement(s). If you change your mind after saving a measurement press the channel's right-hand Save key again - the text will change to '(Don't Save)'.
6. When you have selected all the measurements you want to
save press The instrument will display 'Data Saved' before returning to the measurement screen.
Section 7: Taking Recordings (Offsite Analysis)
85
Section 7: Taking Recordings (Offsite Analysis)
This section describes how to take recordings with your instrument.
You will learn to:
• Take recordings
• Review and delete recordings • Attach notes to recordings • Create and display baselines
Walk-through: Taking Recordings The following instructions assume that you have already created your machine structures and have assigned parameter sets to the measurement locations.
1. Connect your sensors to the appropriate measurement locations. If you are taking tachometer readings, set up the tachometer also.
2. Ensure the folder containing the machines you want to monitor is selected; the name of the currently selected folder will display on the Main Menu beside the 'Folders' label. If
you need to select a different folder press Folders and
use the arrow keys to highlight your choice then press This loads the folder and all its machines into current memory and returns you to the Main Menu.
3. Press Record Review to display the machines within
this folder. If necessary, select Save by pressing (for a recording this should normally be set to Auto Save + Warn. Refer to Recording Save Options on page 87 for more information).
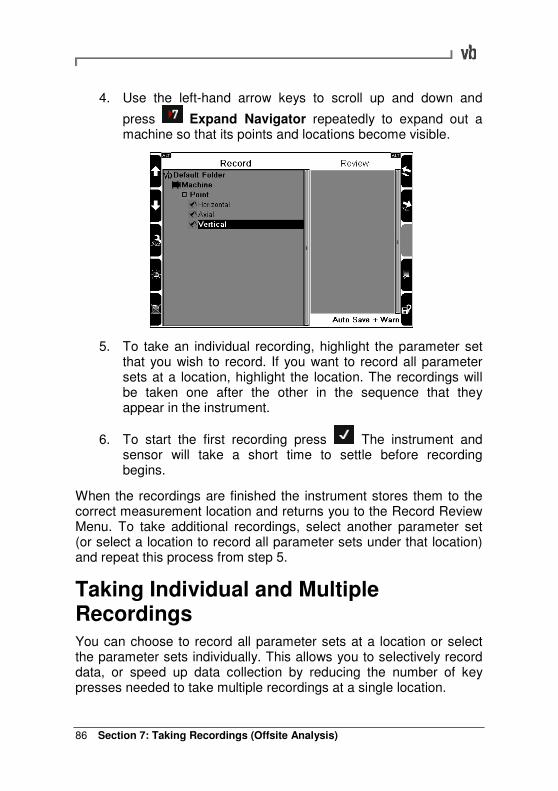
Section 7: Taking Recordings (Offsite Analysis) 86
4. Use the left-hand arrow keys to scroll up and down and
press Expand Navigator repeatedly to expand out a machine so that its points and locations become visible.
5. To take an individual recording, highlight the parameter set that you wish to record. If you want to record all parameter sets at a location, highlight the location. The recordings will be taken one after the other in the sequence that they appear in the instrument.
6. To start the first recording press The instrument and sensor will take a short time to settle before recording begins.
When the recordings are finished the instrument stores them to the correct measurement location and returns you to the Record Review Menu. To take additional recordings, select another parameter set (or select a location to record all parameter sets under that location) and repeat this process from step 5.
Taking Individual and Multiple Recordings You can choose to record all parameter sets at a location or select the parameter sets individually. This allows you to selectively record data, or speed up data collection by reducing the number of key presses needed to take multiple recordings at a single location.
Section 7: Taking Recordings (Offsite Analysis)
87
• To record an individual parameter set, highlight it and press
to begin recording.
• To record every parameter set under a location, highlight the
location and press to begin recording.
Saving Recordings When you are in the Record Review Menu you have several options for saving your recordings.
Auto Save The instrument momentarily displays the recorded information on-screen before returning you to the Record Review Menu.
Record/Review The instrument pauses after each recording so that you can review it on-screen.
• To take the next recording press This will either return you to the Record Review Menu or, if you have selected a location with multiple parameter sets underneath it, begin taking the next recording.
Free Run, Manual Save The instrument will continuously record the signal and update the on-screen display.
• To stop measuring press To save the recording press
• To record the next parameter set without saving this
recording press This will either return you to the Record Review Menu or, if you have selected a location with multiple parameter sets underneath it, begin taking the next recording.
Section 7: Taking Recordings (Offsite Analysis) 88
Reviewing Recordings To review recordings immediately after taking them you can set the instrument's save option to Record/Review; to do this, from the Main
Menu press Record Review then press repeatedly until Record/Review + Warn displays in the lower right-hand corner of the screen.
To review stored recordings
1. From the Main Menu press Record Review.
2. To select a recording for review, use the left-hand arrow
keys to scroll up and down and press Expand Navigator repeatedly to expand out a machine so that its locations and parameter sets become visible.
3. When you highlight a parameter set its associated recordings will appear in the Review column. The newest recording is highlighted at the top of the column. To display
the newest recording press Review Selected Recording.
4. To display older recordings press once more to select the Review column; a black border will appear around the column indicating that you can now move up/down through the recordings. Use the left-hand arrow keys to select a
recording then press to display your selection.
Note: An asterisk beside a recording indicates that more than one recording type is contained within the record (spectrum and waveform, or 6Pack combination measurements, for example).
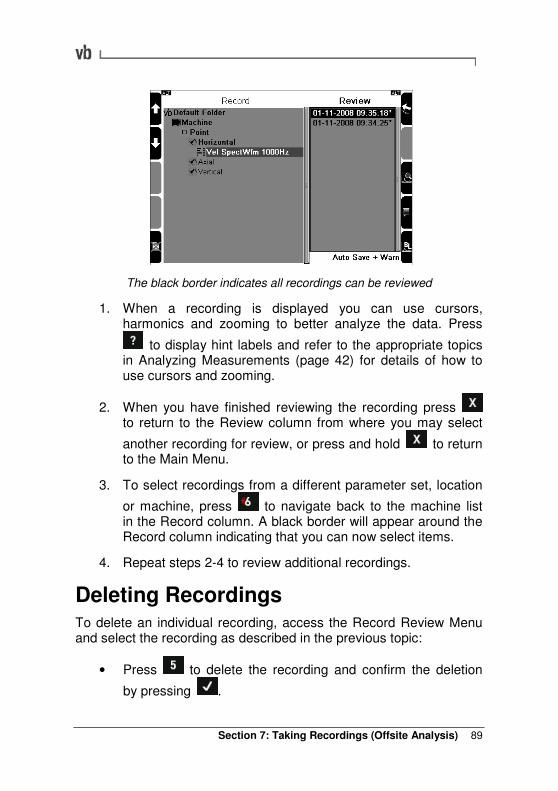
Section 7: Taking Recordings (Offsite Analysis)
89
The black border indicates all recordings can be reviewed
1. When a recording is displayed you can use cursors, harmonics and zooming to better analyze the data. Press
to display hint labels and refer to the appropriate topics in Analyzing Measurements (page 42) for details of how to use cursors and zooming.
2. When you have finished reviewing the recording press to return to the Review column from where you may select
another recording for review, or press and hold to return to the Main Menu.
3. To select recordings from a different parameter set, location
or machine, press to navigate back to the machine list in the Record column. A black border will appear around the Record column indicating that you can now select items.
4. Repeat steps 2-4 to review additional recordings.
Deleting Recordings To delete an individual recording, access the Record Review Menu and select the recording as described in the previous topic:
• Press to delete the recording and confirm the deletion
by pressing .
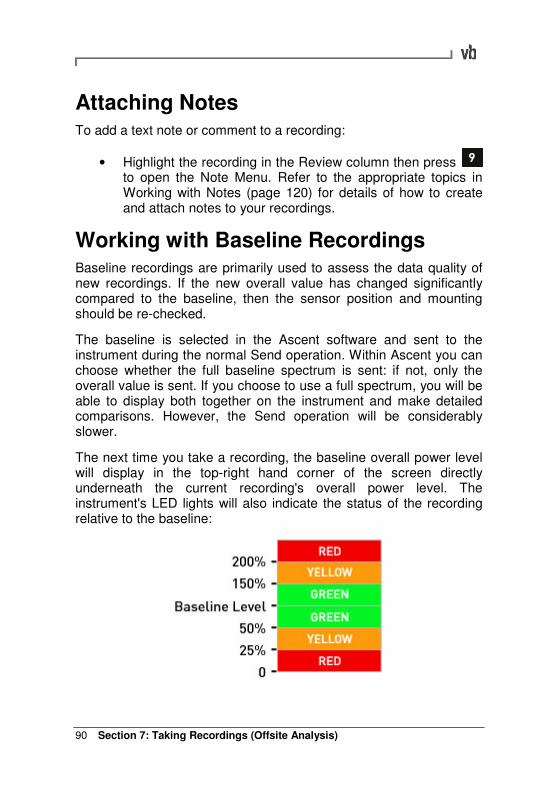
Section 7: Taking Recordings (Offsite Analysis) 90
Attaching Notes To add a text note or comment to a recording:
• Highlight the recording in the Review column then press to open the Note Menu. Refer to the appropriate topics in Working with Notes (page 120) for details of how to create and attach notes to your recordings.
Working with Baseline Recordings Baseline recordings are primarily used to assess the data quality of new recordings. If the new overall value has changed significantly compared to the baseline, then the sensor position and mounting should be re-checked.
The baseline is selected in the Ascent software and sent to the instrument during the normal Send operation. Within Ascent you can choose whether the full baseline spectrum is sent: if not, only the overall value is sent. If you choose to use a full spectrum, you will be able to display both together on the instrument and make detailed comparisons. However, the Send operation will be considerably slower.
The next time you take a recording, the baseline overall power level will display in the top-right hand corner of the screen directly underneath the current recording's overall power level. The instrument's LED lights will also indicate the status of the recording relative to the baseline:
Section 7: Taking Recordings (Offsite Analysis)
91
Note: You can only display baseline recordings when taking a recording from the Record Review Menu or from the Route Menu. You cannot display a baseline using the Measure Menu. Baseline recordings are identified by an arrow '>' to the left of the recording list.
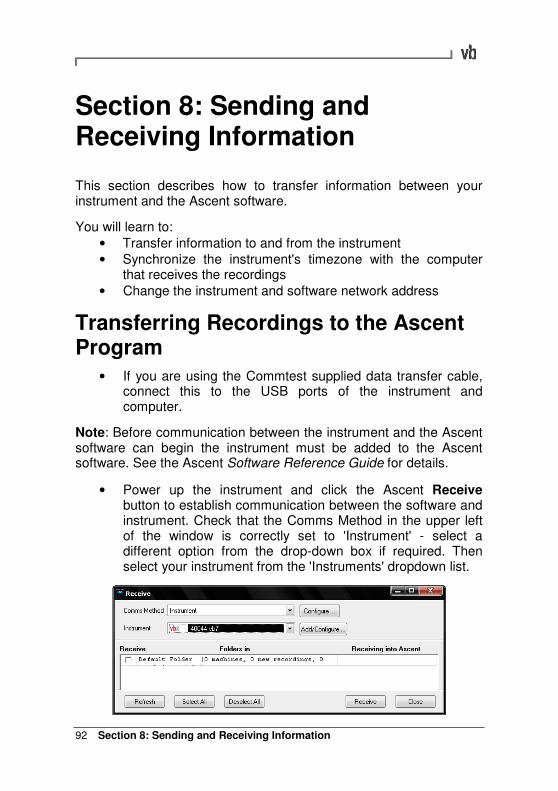
Section 8: Sending and Receiving Information 92
Section 8: Sending and Receiving Information
This section describes how to transfer information between your instrument and the Ascent software.
You will learn to:
• Transfer information to and from the instrument • Synchronize the instrument's timezone with the computer
that receives the recordings
• Change the instrument and software network address
Transferring Recordings to the Ascent Program
• If you are using the Commtest supplied data transfer cable, connect this to the USB ports of the instrument and computer.
Note: Before communication between the instrument and the Ascent software can begin the instrument must be added to the Ascent software. See the Ascent Software Reference Guide for details.
• Power up the instrument and click the Ascent Receive button to establish communication between the software and instrument. Check that the Comms Method in the upper left of the window is correctly set to 'Instrument' - select a different option from the drop-down box if required. Then select your instrument from the 'Instruments' dropdown list.
Section 8: Sending and Receiving Information
93
• The instrument transfers recordings by sending entire storage folders to the PC. Select which folders you wish to transfer by ticking the checkboxes beside their names.
• Click Receive near the bottom-right of the window to begin transferring recordings. When the transfer is complete click Close.
Transferring Folders to the Instrument
• If you are using the Commtest supplied data transfer cable, connect this to the USB ports of the instrument and computer.
Note: Before communication between the instrument and the Ascent software can begin the instrument must be added to the Ascent software. See the Ascent Software Reference Guide for details.
• Power up the instrument and open the Ascent program. Click the Ascent Send button to establish communication between the software and instrument. Check that the Comms Method in the upper left of the window is correct - select a different option from the drop-down box if required. Then select your instrument from the 'Instruments' dropdown list.
• Select which folders you wish to transfer by ticking the checkboxes beside their names. Click Send near the bottom-right of the window to begin transferring your folders.
• When the transfer is complete click Close.
Re-sending Updated Folders
Normally you will create all your machines in the Ascent software and send them to the instrument once only. However, if you add or change a route, machine or parameter set in the software, you will need to re-send that folder to the instrument so that it can update to include your changes.
Each time you re-send an existing folder from the Ascent software, the send process will overwrite the folder's contents in the instrument. Any machines, routes and parameter sets etc that you
Section 8: Sending and Receiving Information 94
have added or deleted in the software will also be added or deleted in the instrument. In addition, all stored recordings in the instrument are also deleted. This is designed to free up instrument memory and save you the task of manually deleting recordings and machine definitions etc.
Keeping stored recordings If you wish to keep any recordings stored in the instrument, re-name the folder either in the instrument or the software before re-sending. The instrument will treat this as a new folder so will not overwrite the contents of the existing folder.
Keeping baseline recordings in the instrument If a recording is marked as baseline in the Ascent software it will be transferred to the instrument when the folder is re-sent. If a different recording is marked as baseline in the instrument this will be replaced with the newly sent baseline.
Synchronizing the Timezone on the Instrument and PC The instrument's date and time may differ from that of the computer which receives the recordings, particularly if you are sending recordings to a country in a different timezone. You can synchronize the time clock of the instrument with a recipient computer by automatically updating the instrument's date/time each time you transfer data using Send or Receive.
To use this feature the receiving computer must have 'Synchronize VB Date and Time with the PC' turned on (see the Ascent Software Reference Guide, Synchronizing the Instrument Date/Time with your PC).
• From the Main Menu press twice.
• Press Ascent Time Sync to toggle the setting. The following options are available:
Auto Synchronize the date and time whenever data is transferred.
Section 8: Sending and Receiving Information
95
Off Do not synchronize the date and time i.e. the instrument will continue to use whatever date and time settings that you specify.
Manual Synchronize the date and time only if the timezone is different or the instrument timeclock differs from the computer by more than one minute.
• You will be prompted to update the instrument date/time only when Manual is selected. When the prompt appears press
to synchronize the time or to keep the instrument's date/time settings.
Section 9: Using Routes 96
Section 9: Using Routes
This section describes how to manage routes with your instrument.
You will learn to: • Use a route to take recordings
• Change the order in which recordings are collected • Review recordings during a route
• Take off-route recordings
What is a Route? A route is an ordered list of measurement locations and pre-defined measurement setups (parameter sets) that you follow when taking recordings. Using a route simplifies the task of taking recordings and minimizes the potential for mistakes. When the instrument is operating in route mode it guides you through each measurement location in sequence.
Before creating a route you must first create the machines and measurement setups, then create the routes by selecting these items and placing them in the desired order. A route can only be made up of machines that are stored within the same folder as the route. You will need to use the Ascent software to create and manage your route library then transfer your folders to the instrument (see the Ascent Software Reference Guide, Creating a Route).
There is no limit to the number of routes you can send to the instrument. Each folder can store any number of routes until the instrument's memory capacity is reached.
Walk-through: Taking Recordings Using a Route Once you have taken the first recording the instrument will continue to guide you through the remaining route entries. You can take recordings sequentially as they appear in the route list, or change the order as you go by skipping individual route entries or machines. This is particularly useful if a machine is temporarily off limits as it
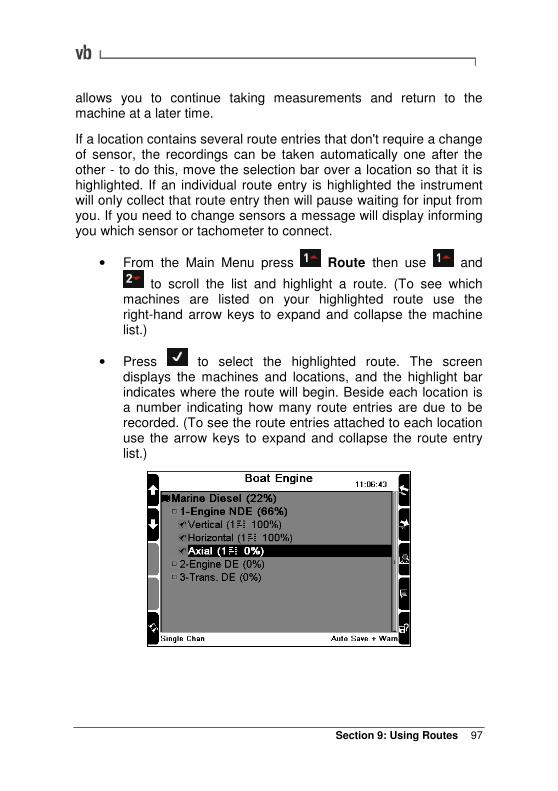
Section 9: Using Routes
97
allows you to continue taking measurements and return to the machine at a later time.
If a location contains several route entries that don't require a change of sensor, the recordings can be taken automatically one after the other - to do this, move the selection bar over a location so that it is highlighted. If an individual route entry is highlighted the instrument will only collect that route entry then will pause waiting for input from you. If you need to change sensors a message will display informing you which sensor or tachometer to connect.
• From the Main Menu press Route then use and
to scroll the list and highlight a route. (To see which machines are listed on your highlighted route use the right-hand arrow keys to expand and collapse the machine list.)
• Press to select the highlighted route. The screen displays the machines and locations, and the highlight bar indicates where the route will begin. Beside each location is a number indicating how many route entries are due to be recorded. (To see the route entries attached to each location use the arrow keys to expand and collapse the route entry list.)
Section 9: Using Routes 98
• Attach your sensor to the location indicated on the instrument screen. If you want to record all parameter sets at this location automatically (rather than manually starting each measurement) highlight the location rather than one of its parameter sets.
• Press to begin recording. When the first location's recordings are complete the Route Menu displays again with the next location highlighted. A percentage symbol indicates how many of the previous location's route entries were recorded.
• Press again to begin the next measurement. Continue to take recordings until all route entries have been recorded.
Recording Multiple Channels on a Route Routes in the Ascent software are single-channel sequences of measurement locations to be recorded. The ability has been added to the instrument to re-interpret these single channel sequences for multichannel acquisition.
When you collect the route measurements, if a multi-channel recording is required, the instrument will prompt you to place the required number of sensors on their respective locations. When you start the recording all measurements will be taken simultaneously.
Before you collect the first route recording you need to specify which channel will be used to record each point or axis e.g. 'use channel 1 to collect all recordings taken on the horizontal axis and channel 2 for vertical'.
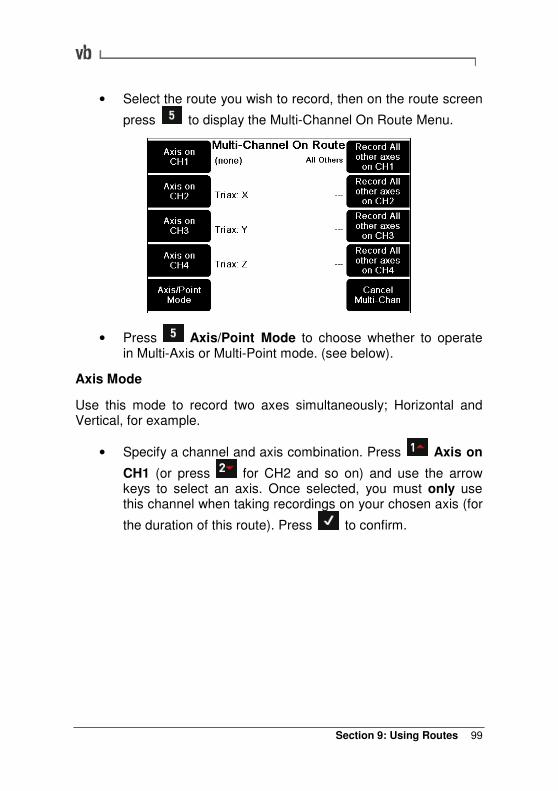
Section 9: Using Routes
99
• Select the route you wish to record, then on the route screen
press to display the Multi-Channel On Route Menu.
• Press Axis/Point Mode to choose whether to operate in Multi-Axis or Multi-Point mode. (see below).
Axis Mode
Use this mode to record two axes simultaneously; Horizontal and Vertical, for example.
• Specify a channel and axis combination. Press Axis on
CH1 (or press for CH2 and so on) and use the arrow keys to select an axis. Once selected, you must only use this channel when taking recordings on your chosen axis (for
the duration of this route). Press to confirm.
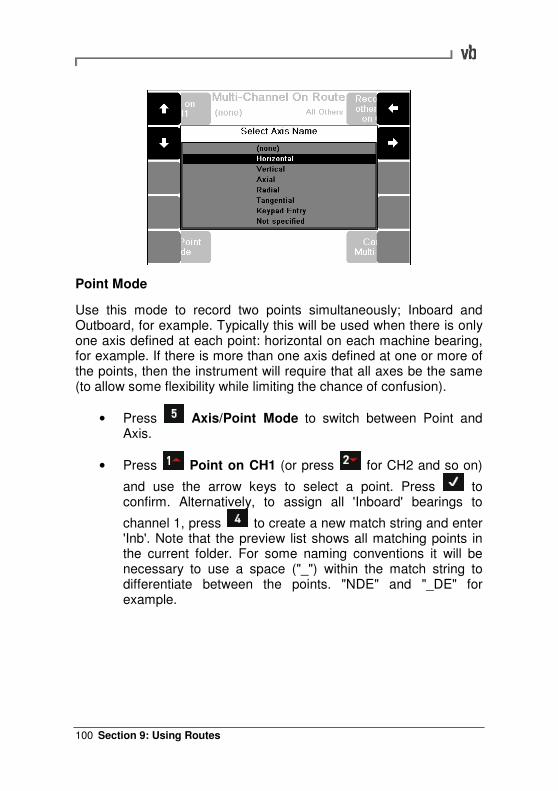
Section 9: Using Routes 100
Point Mode
Use this mode to record two points simultaneously; Inboard and Outboard, for example. Typically this will be used when there is only one axis defined at each point: horizontal on each machine bearing, for example. If there is more than one axis defined at one or more of the points, then the instrument will require that all axes be the same (to allow some flexibility while limiting the chance of confusion).
• Press Axis/Point Mode to switch between Point and Axis.
• Press Point on CH1 (or press for CH2 and so on)
and use the arrow keys to select a point. Press to confirm. Alternatively, to assign all 'Inboard' bearings to
channel 1, press to create a new match string and enter 'Inb'. Note that the preview list shows all matching points in the current folder. For some naming conventions it will be necessary to use a space ("_") within the match string to differentiate between the points. "NDE" and "_DE" for example.
Section 9: Using Routes
101
Axis and Point Modes
• Now you need to tell the instrument which channel to use for
any other axes/points (eg. axial). Press to select CH1,
to select CH2 and so on. The text 'All Others' will display.
• To cancel multi-channel recording press . The text '(none)' will display on the left-hand column, indicating that no channels are designated to a specific axis.
• Press to re-display your route then begin recording as normal.
Note: On the Route screen a summary of the multichannel configuration is displayed in the bottom-left corner. For example, 'Points: Dual Chan 1, 2' indicates dual channel acquisition in Points mode. 'Axes: Triax Chan 1, 2, 3' indicates triaxial acquisition in Axis mode (triaxial available on vb6 and vb8 models only).
Skipping Route Entries and Machines You can change the order in which you collect recordings by 'jumping' to a different position in the route. This allows you to skip individual route entries, locations or entire machines. This is particularly useful if a machine on your route is temporarily off limits but will be available for recording later that day.
The instrument pauses after each location's parameter sets have been recorded so that you can continue to follow the route as it has been defined, or manually choose the next route entry. Whenever you skip to a different position in the route the instrument will continue the route from that point forward.
To skip individual entries or entire machines you simply move the highlight bar to the next position where you want to begin recording.
• To skip an item, use the left-hand arrow keys to move the
selection bar up and down and press repeatedly to expand out a machine so that its locations and route entries become visible.
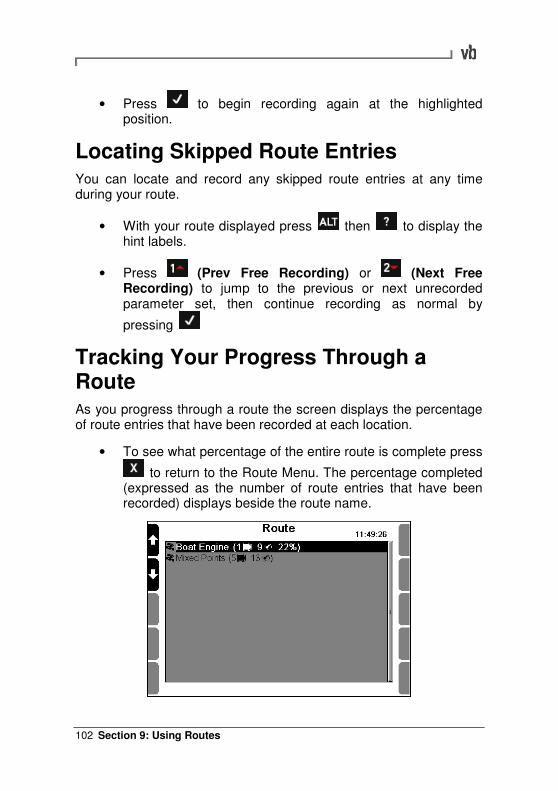
Section 9: Using Routes 102
• Press to begin recording again at the highlighted position.
Locating Skipped Route Entries You can locate and record any skipped route entries at any time during your route.
• With your route displayed press then to display the hint labels.
• Press (Prev Free Recording) or (Next Free Recording) to jump to the previous or next unrecorded parameter set, then continue recording as normal by
pressing
Tracking Your Progress Through a Route As you progress through a route the screen displays the percentage of route entries that have been recorded at each location.
• To see what percentage of the entire route is complete press
to return to the Route Menu. The percentage completed (expressed as the number of route entries that have been recorded) displays beside the route name.
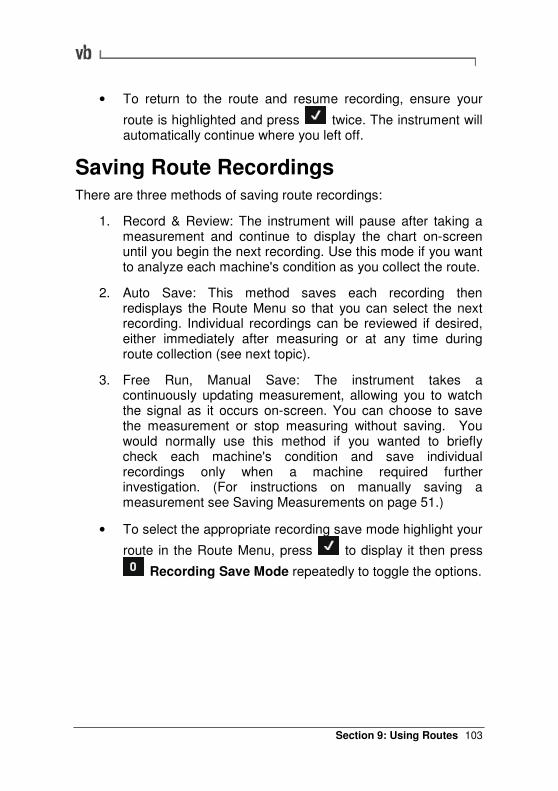
Section 9: Using Routes
103
• To return to the route and resume recording, ensure your
route is highlighted and press twice. The instrument will automatically continue where you left off.
Saving Route Recordings There are three methods of saving route recordings:
1. Record & Review: The instrument will pause after taking a measurement and continue to display the chart on-screen until you begin the next recording. Use this mode if you want to analyze each machine's condition as you collect the route.
2. Auto Save: This method saves each recording then redisplays the Route Menu so that you can select the next recording. Individual recordings can be reviewed if desired, either immediately after measuring or at any time during route collection (see next topic).
3. Free Run, Manual Save: The instrument takes a continuously updating measurement, allowing you to watch the signal as it occurs on-screen. You can choose to save the measurement or stop measuring without saving. You would normally use this method if you wanted to briefly check each machine's condition and save individual recordings only when a machine required further investigation. (For instructions on manually saving a measurement see Saving Measurements on page 51.)
• To select the appropriate recording save mode highlight your
route in the Route Menu, press to display it then press
Recording Save Mode repeatedly to toggle the options.
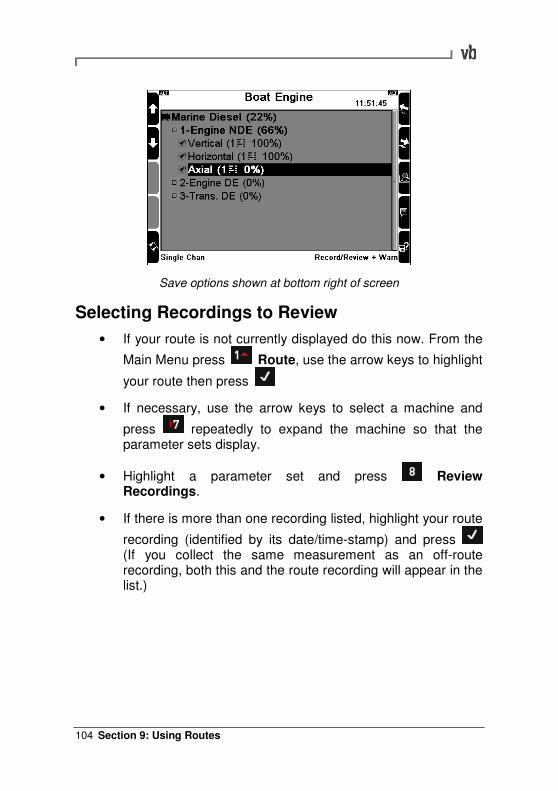
Section 9: Using Routes 104
Save options shown at bottom right of screen
Selecting Recordings to Review
• If your route is not currently displayed do this now. From the
Main Menu press Route, use the arrow keys to highlight
your route then press
• If necessary, use the arrow keys to select a machine and
press repeatedly to expand the machine so that the parameter sets display.
• Highlight a parameter set and press Review Recordings.
• If there is more than one recording listed, highlight your route
recording (identified by its date/time-stamp) and press (If you collect the same measurement as an off-route recording, both this and the route recording will appear in the list.)
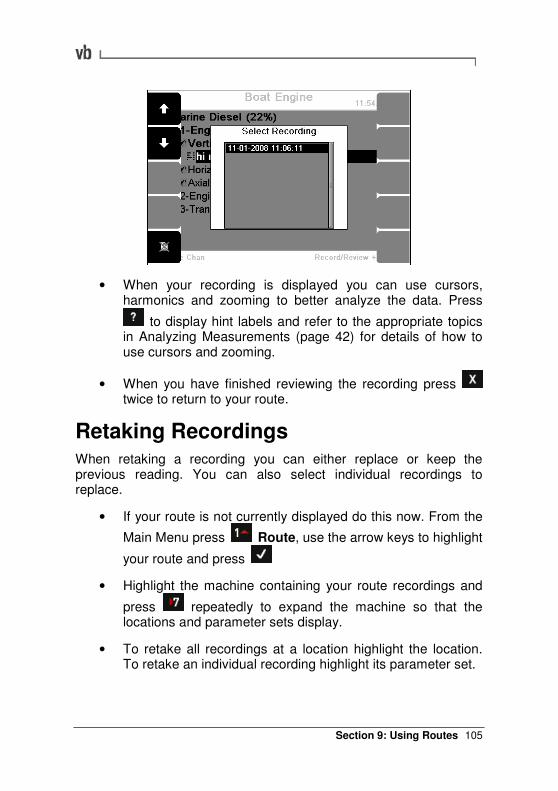
Section 9: Using Routes
105
• When your recording is displayed you can use cursors, harmonics and zooming to better analyze the data. Press
to display hint labels and refer to the appropriate topics in Analyzing Measurements (page 42) for details of how to use cursors and zooming.
• When you have finished reviewing the recording press twice to return to your route.
Retaking Recordings When retaking a recording you can either replace or keep the previous reading. You can also select individual recordings to replace.
• If your route is not currently displayed do this now. From the
Main Menu press Route, use the arrow keys to highlight
your route and press
• Highlight the machine containing your route recordings and
press repeatedly to expand the machine so that the locations and parameter sets display.
• To retake all recordings at a location highlight the location. To retake an individual recording highlight its parameter set.
Section 9: Using Routes 106
• Press You will be prompted to keep or replace
recordings, or cancel this action. Press to replace your earlier recordings.
Deleting a Route Recording
• If your route is not currently displayed do this now. From the
Main Menu press Route, use the arrow keys to highlight
your route then press
• Use the arrow keys to highlight the machine containing the
recording and press repeatedly to expand the machine so that the parameter sets display.
• Highlight the parameter set you recorded earlier and press
Review Recordings.
• If there is more than one recording in the list, highlight your route recording (identified by its date/timestamp) then press
to delete it.
• Press to return to your route.
Taking Off-route Recordings When collecting data, you may decide to take additional measurements that are not part of the route sequence. This might be necessary if a machine's vibration pattern does not look as expected when taking the measurement.
• Press and hold to temporarily step out of the route and return to the Main Menu. From here you can set up a new measurement.
• Take and review the measurement as normal, saving it to the machine location if desired. When you next transfer data to the computer, any additional recordings you've saved will be sent along with the collected route.
Section 9: Using Routes
107
• To return to the route, from the Main Menu Route. Use
the arrow keys to highlight your route and press A message will appear asking if you would like to continue.
Press to continue where you left off.
Editing or Deleting a Route Route creation, editing and deletion is carried out using the Ascent software. You cannot edit or delete routes directly in the instrument. To remove a route you must first delete it in the Ascent navigator, then send that folder to the instrument. Because the folder no longer contains the original route, this route will not appear in the instrument. To edit a route, make your changes in the Ascent navigator then re-send the folder to the instrument.
Note: Deleting a route does not delete the machines and parameter sets that make up the route. These will remain stored in the instrument.
Section 10: Creating, Editing and Deleting Items 108
Section 10: Creating, Editing and Deleting Items
This section describes the procedures for creating folders, machines and other items within the instrument.
You will learn to:
• Create and manage machine structures, sensors and notes • Copy and delete items
• Restore items • Rename and edit items
• Attach and remove notes
Storage Capacity and Recording Volume The instrument's storage capacity is determined by the amount of available memory space, which decreases as more recordings are stored. There is no limit to the number of routes, folders and machines that can be held in the instrument.
The number of recordings that can be stored depends on the type and setup of those recordings e.g. more 400 line spectra can be stored than 10 minute long time waveforms because the spectra take up less memory space.
How are Recordings Organized and Stored? In addition to analyzing recordings onsite you can also store recordings in your instrument then transfer them to a PC. These recordings can then be analyzed at a time of your choosing. Analysis is best carried out away from machines in a safe, quiet environment.
The instrument uses the following hierarchical data storage structure:
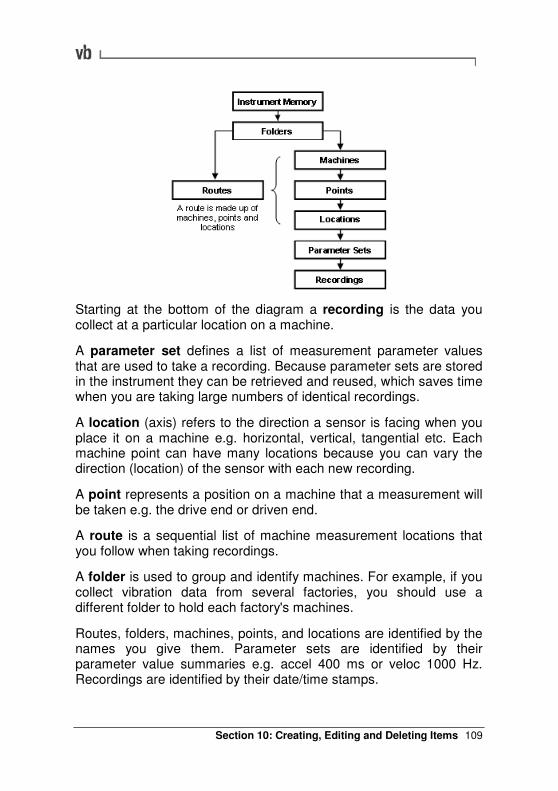
Section 10: Creating, Editing and Deleting Items
109
Starting at the bottom of the diagram a recording is the data you collect at a particular location on a machine.
A parameter set defines a list of measurement parameter values that are used to take a recording. Because parameter sets are stored in the instrument they can be retrieved and reused, which saves time when you are taking large numbers of identical recordings.
A location (axis) refers to the direction a sensor is facing when you place it on a machine e.g. horizontal, vertical, tangential etc. Each machine point can have many locations because you can vary the direction (location) of the sensor with each new recording.
A point represents a position on a machine that a measurement will be taken e.g. the drive end or driven end.
A route is a sequential list of machine measurement locations that you follow when taking recordings.
A folder is used to group and identify machines. For example, if you collect vibration data from several factories, you should use a different folder to hold each factory's machines.
Routes, folders, machines, points, and locations are identified by the names you give them. Parameter sets are identified by their parameter value summaries e.g. accel 400 ms or veloc 1000 Hz. Recordings are identified by their date/time stamps.
Section 10: Creating, Editing and Deleting Items 110
Working with Folders
Creating a Folder
• From the Main Menu press twice.
• Enter a name for the folder then press The newly
created folder will be highlighted. Press again to select and you will be returned to the Main Menu.
When you create new machines they will be placed in whichever folder is currently selected. To change a folder, from the Main Menu
press Folders, then use the arrow keys to select a folder then
press
Renaming a Folder
• From the Main Menu press Folders.
• Use the arrow keys to select the folder then press Edit Name.
• Edit the name as required then press
Deleting a Folder
• From the Main Menu press Folders.
• Use the arrow keys to select the folder then press Delete Folder.
Restoring a Deleted or Over-Written Folder
A folder backup is automatically generated every time a folder is deleted. If you wish to recover recordings or routes that were previously stored in a folder that has been deleted, the entire folder can be recovered using this backup. Note that this also applies to folders which have been overwritten by a Send operation from the
Section 10: Creating, Editing and Deleting Items
111
Ascent software. The folder's restore point will be the date and time of its original deletion.
• From the Main Menu press Folders.
• Press The Restore Folders screen will open.
• Use the left-hand menu arrows to select a folder to restore. The date beside the folder indicates when it was deleted.
• Press to restore the selected folder.
Note: If you have created a new folder with the same name as the backup folder, the existing folder will be overwritten during the restoration process. To prevent this, rename the current folder.
Warning: All folder backups will be erased during an instrument Proflash (page 153).
Note: The parameter set and sensor tables are global across all folders. The restore process will therefore be most successful if none of these have been deleted since the folder was overwritten or deleted.
Working with Machines If you intend to take large numbers of recordings on a regular basis you should create permanent machine structures so that you can save your recordings to named locations. You can group your machines within different folders so that they can be segregated by type, geographic location, or frequency of data collection etc.
The fastest and easiest way to create your machines is to use the Ascent software to first create your folders, machines and schedule entries, then send these to the instrument. Please refer to the Ascent Software Reference Guide, Section 2: Basic Operation, for more information.
When you create machines and measurement parameter sets in the instrument these are automatically added to the Ascent database when you transfer data from the instrument to your PC.
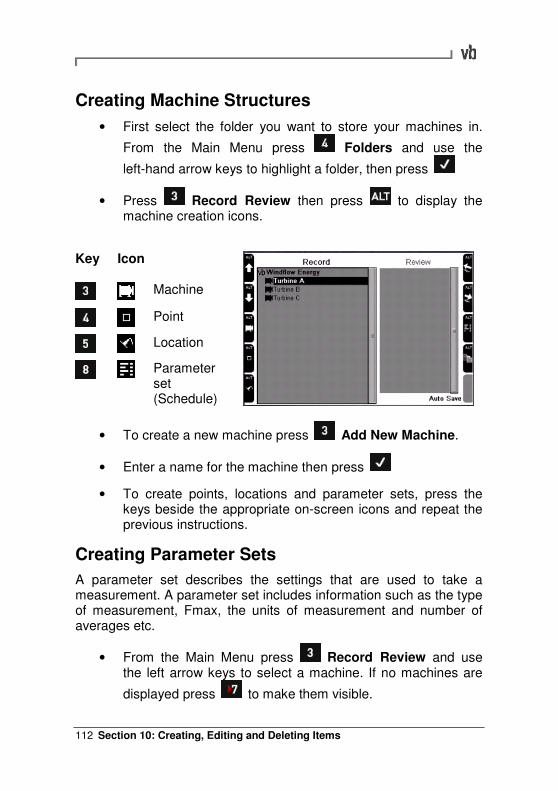
Section 10: Creating, Editing and Deleting Items 112
Creating Machine Structures
• First select the folder you want to store your machines in.
From the Main Menu press Folders and use the
left-hand arrow keys to highlight a folder, then press
• Press Record Review then press to display the machine creation icons.
Key
Icon
Machine
Point
Location
Parameter set (Schedule)
• To create a new machine press Add New Machine.
• Enter a name for the machine then press
• To create points, locations and parameter sets, press the keys beside the appropriate on-screen icons and repeat the previous instructions.
Creating Parameter Sets
A parameter set describes the settings that are used to take a measurement. A parameter set includes information such as the type of measurement, Fmax, the units of measurement and number of averages etc.
• From the Main Menu press Record Review and use the left arrow keys to select a machine. If no machines are
displayed press to make them visible.
Section 10: Creating, Editing and Deleting Items
113
• Press repeatedly to expand the machine until the required axis location is selected.
• Press to display the machine creation icons then press
Add New Schedule.
• Select a measurement type. The screen will display the default parameters for your measurement.
• To assign the default parameter set to this location press
, or to create a new parameter set press The new parameter set will appear at the top of the list ready for editing.
• To rename this parameter set press Edit Name. Enter a
name for this parameter set then press
• Edit the other parameters as required. To assign a different
sensor press and refer to the sub-heading below,
otherwise press to return to the Record Review Menu.
Changing the sensor
• To assign a different sensor press Sensor Setup then press Change Sensor opposite your measuring channel and
select a different sensor. (To define a new sensor press Create New Sensor. See Defining and Editing Sensors on page 116 for more information.)
• Press Select as Default to select which sensor to use for schedule entries which are sent from Ascent with Selected Sensor set to 'Use instrument's default sensor'.
• If required, press the left-hand key beside your chosen
channel so the text changes to 'Enabled' then press twice to return to the Record Review Menu.
Section 10: Creating, Editing and Deleting Items 114
Adding Structures to Existing Machines
• From the Main Menu press Record Review.
• If no machines are displayed press to make them visible.
• Use the left-hand arrow keys to select a machine and press
repeatedly to expand the machine so that its points and other lower level items are made visible.
• Select the machine, point or location where you want to add
the new structure then press to display the machine creation icons.
• Press the appropriate keys beside each icon to create that item.
Copying Machine Structures
You can copy an entire machine or just part of its structure, such as a point or parameter set, and add the copied items to other machines.
Note: Only the machine structure is copied when a new machine is created in this way - recordings are not copied.
• From the Main Menu press Review Record.
• If no machines are displayed press to make them visible.
• Use the left-hand arrow keys to select a machine. To make
the points and other lower level items visible press repeatedly.
• Highlight the item you wish to copy then press then Copy.
Section 10: Creating, Editing and Deleting Items
115
• Use the on-screen arrows to choose where your copied item
will be pasted then press Paste.
Renaming Machine Structures
Caution: The Ascent software identifies machines structures and sensors by their names. If you rename an item in the instrument the Ascent software will treat this as a new item when data is transferred.
Note: The default locations (horizontal, vertical etc) cannot be renamed. If you want to rename a location from horizontal to vertical, say, simply create a new vertical location on a point and copy any required parameter sets from the horizontal location, then delete the horizontal location.
• From the Main Menu press Record Review.
• If no machines are displayed press repeatedly to make them visible.
• Use the left-hand arrow keys to select a machine. To make
the points and other lower level items visible press repeatedly.
• Select the item you wish to rename then press Edit Name.
• Edit the name as required then press
Deleting Machine Structures
Note: Any parameter sets used by a deleted machine will not be removed but will remain stored in the instrument so they can be applied to future recordings.
• From the Main Menu press Record Review.
• If no machines are displayed press repeatedly to make them visible.
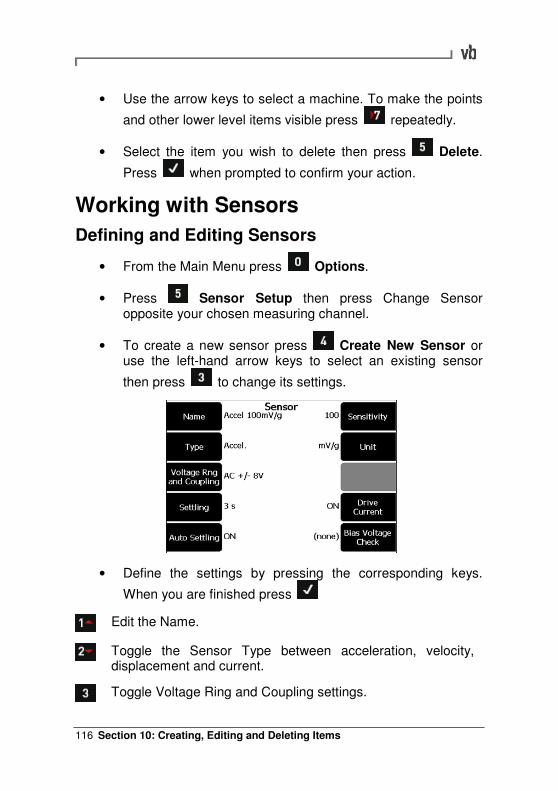
Section 10: Creating, Editing and Deleting Items 116
• Use the arrow keys to select a machine. To make the points
and other lower level items visible press repeatedly.
• Select the item you wish to delete then press Delete.
Press when prompted to confirm your action.
Working with Sensors
Defining and Editing Sensors
• From the Main Menu press Options.
• Press Sensor Setup then press Change Sensor opposite your chosen measuring channel.
• To create a new sensor press Create New Sensor or use the left-hand arrow keys to select an existing sensor
then press to change its settings.
• Define the settings by pressing the corresponding keys.
When you are finished press
Edit the Name.
Toggle the Sensor Type between acceleration, velocity, displacement and current.
Toggle Voltage Ring and Coupling settings.
Section 10: Creating, Editing and Deleting Items
117
Toggle Auto Settling ON/OFF. When Auto Settling is ON the instrument will ignore the user-specified settling time (see above) and will automatically select the most efficient settling time for your sensor type.
Edit the Sensitivity. The range of sensitivities will vary depending on the selected sensor's Store Unit. To enter a
decimal point press then
Toggle the Store Unit e.g between mV/g and mV/m/s2 for
accelerometers.
Toggle the sensor's Drive Current ON/OFF. (Drive Current is the 2.2 mA power supply for ICP
®-type accelerometers).
Toggle Bias Voltage Check on and off (none), and edit, create or delete this value.
Notes on defining and editing sensors:
• The Ascent software identifies sensors by their names. If you rename a sensor in the instrument then send the folder to your computer, the Ascent software will be identify this as a new sensor.
• Once a sensor has been defined as a particular sensor type, e.g. accelerometer, you will not be able to change the sensor's type if the instrument contains any recordings taken with that sensor; the instrument will associate these recordings with their sensor. If you need to redefine the sensor type, delete all the associated recordings in the instrument first.
• When you set the parameters for a measurement you cannot choose settings that conflict with the type of measurement you are trying to create e.g. if you are measuring acceleration you cannot select a current sensor. When you try to take the measurement the instrument will display a message similar to the following:
Incompatible Sensor Cannot take recording of type: Current When using a sensor type Acceleration
Section 10: Creating, Editing and Deleting Items 118
Using the Bias Voltage Check
The Bias Voltage Check allows the instrument to warn operators of errors or fault conditions such as short-circuits, faulty sensors or open-circuits by comparing the actual sensor bias voltage with the expected voltage range, as configured in the instrument.
Most accelerometers have an output voltage centered on 12 V DC, so the instruments have a default bias voltage range of 8 V to 16 V.
Some sensors may utilize a lower or higher bias voltage. If using such a sensor, review the manufacturer's documentation and create a new Bias Voltage range to suit.
To change the sensor's Bias Voltage range settings:
• From the Main Menu press Options.
• Press Sensor Setup.
• Press the Change Sensor button opposite the channel you will use.
• Press Edit Sensor to edit the configuration of an
existing sensor, or Create New Sensor. Configure the sensor's normal parameters (name, type, settling, units etc.).
• Press Bias Voltage Check to open the Bias Voltage
screen. Note that each press of toggles the Bias check on/off.
• Press Create New Bias Voltage.
• Press and enter a name. You may wish to use the
name of the sensor, then press
• Press Min Bias and enter the minimum bias Voltage
level then press
Section 10: Creating, Editing and Deleting Items
119
• Press Max Bias and enter the maximum bias voltage
level then press
• Press twice to select the new bias check configuration. The sensor will now use the new or edited bias values.
Setting a Default Sensor
When you specify a particular sensor as being the default (and enabled its measuring channel) the instrument will assume that you are using this sensor to take all further measurements. If you wish to change sensors you can do this in the measurement setup screen
(select the type of measurement you wish to take and press
then to temporarily switch to using a different sensor). To alter the default sensor, follow the steps below:
• From the Main Menu press Options.
• Press Sensor Setup then press Change Sensor opposite your chosen measuring channel.
• Press Select as Default to select which sensor to use for schedule entries which are sent from Ascent with Selected Sensor set to 'Use instrument's default sensor'.
Deleting Sensors
• From the Main Menu press Options.
• Press Sensor Setup then press Change Sensor opposite your chosen measuring channel.
• Use the left-hand arrows keys to highlight your sensor then
press Delete Sensor.
Section 10: Creating, Editing and Deleting Items 120
Working with Notes
Creating Notes
You can create and store notes up to 50 characters in length on the instrument. These can be attached to any part of a machine structure or route item (but not schedule entries) and are transferred with your collected data when recordings are sent to the Ascent database.
• From the Main Menu press Record Review.
• Press to display the Note Menu then press New Note.
• In the Note Entry Menu press and enter your text. Press
to enter punctuation and to enter a space, and
then to delete characters.
• Press to save the note.
Editing Notes
• From the Main Menu press Record Review.
• Press to display the Note Menu then press Create New Note.
• In the Note Entry Menu press Edit Note and enter your new text. If the note is attached to any items you will be prompted to create a new note.
• Press to enter punctuation and to enter a space.
• Press to save the note.
Attaching Notes
You can attach notes to the machines, points and axes within the machine structure.
Section 10: Creating, Editing and Deleting Items
121
• Use the arrow keys to highlight the item you want to attach the note to.
• Press to display the Note Menu then press Create New Note.
• Select a note then press to attach it to your chosen
item, or to create a new note. If you want to attach
additional notes press again and repeat this process.
• Press to return to the previous menu. The note icon will appear beside your chosen item to indicate that a note is attached.
Viewing Notes
• To view a note, use the arrow keys to highlight the item with
the note attached then press Notes.
Removing Notes
Removing a note only detaches it from a selected item. The note will remain in the Note Entry Menu where it can be selected and attached to other items. To permanently delete a note see the next topic.
• Use the arrow keys to highlight the item with the note attached.
• Press to display the Note Menu and highlight the note you want to remove.
• Press Delete Note then press to return to the previous menu.
Deleting a Note Permanently
• From the Main Menu press Record Review.
• Press to display the Note Menu then press
Section 10: Creating, Editing and Deleting Items 122
• In the Note Entry Menu use the arrow keys to select the note
then press Delete Note.
• If the note is attached to any items you will prompted to
confirm your action. Press to confirm.
Deleting all Recordings in a Folder To delete an individual recording please refer to topic Deleting Recordings on page 89.
• To delete every recording in a folder, from the Main Menu
press Folders.
• Use the arrow keys to select a folder then press Delete
Recording. Press to confirm.
Deleting all Stored Information All folders, machines, parameter sets, recordings and notes etc are stored in a single container called a database. To clear out all your machine structures, customized settings and recordings you can empty the vb instrument database. This restores the instrument to its factory default settings.
Use this procedure only if the database becomes corrupt, or if you are certain that you no longer require any of the information stored in the instrument e.g. if you plan to resell the instrument. Transfer any information you wish to save to the Ascent software before emptying the database.
Warning: Emptying the database removes all information stored in the instrument. You will lose all machines, routes, parameter sets and notes. Only the factory default settings such as axis names, parameter sets and notes will remain.
• From the Main Menu press Folders then Empty Database.
• Press twice to confirm.
Section 11: Balancing Rotors (vb7 and vb8 Instruments Only)
123
Section 11: Balancing Rotors (vb7 and vb8 Instruments Only)
This section describes the procedure for performing balancing operations with your instrument.
Note: The vb5 and vb6 instruments do not include balancing functionality. This section applies only to vb7 and vb8 instruments.
You will learn to:
• Understand the balancing process
• Select appropriate balancing settings • Set up a balancing job
• Manually enter balancing values • Use the instrument's suggested balance weight calculations
Methods for Balancing Rotors The instrument can balance rotors that are rigid and which do not flex significantly at their operating speeds.
An imbalanced rotor is one that has an uneven mass distribution that causes the rotor to vibrate when it is rotated. Balancing a rotor requires correcting the uneven mass distribution by adding or removing weight to/from precisely calculated positions on the rotor.
A rigid rotor can be balanced in one plane or two planes i.e. any uneven mass distribution in the rotor can be corrected by adding/removing weights to/from one or two selected cross-sectional planes on the rotor.
For single plane balancing the mid plane of the rotor is usually used as the balancing plane. For dual plane balancing, usually the planes at the extreme ends of the rotor are used; however, other planes on the rotor can be used also.
Since the effect of a rotating weight (i.e. the centrifugal force) increases with the radial distance of the weight, it is common to add weight to, or remove weight from, the rim of the rotor rather than a
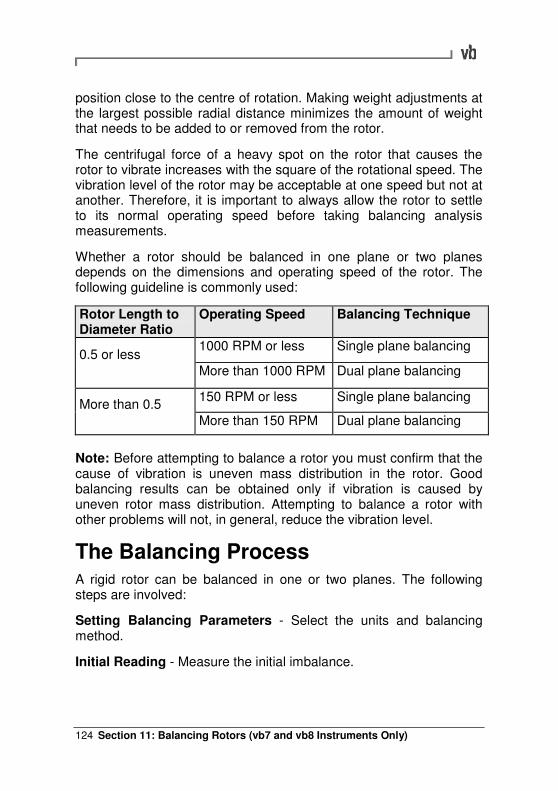
Section 11: Balancing Rotors (vb7 and vb8 Instruments Only) 124
position close to the centre of rotation. Making weight adjustments at the largest possible radial distance minimizes the amount of weight that needs to be added to or removed from the rotor.
The centrifugal force of a heavy spot on the rotor that causes the rotor to vibrate increases with the square of the rotational speed. The vibration level of the rotor may be acceptable at one speed but not at another. Therefore, it is important to always allow the rotor to settle to its normal operating speed before taking balancing analysis measurements.
Whether a rotor should be balanced in one plane or two planes depends on the dimensions and operating speed of the rotor. The following guideline is commonly used:
Rotor Length to Diameter Ratio
Operating Speed Balancing Technique
0.5 or less 1000 RPM or less Single plane balancing
More than 1000 RPM Dual plane balancing
More than 0.5 150 RPM or less Single plane balancing
More than 150 RPM Dual plane balancing
Note: Before attempting to balance a rotor you must confirm that the cause of vibration is uneven mass distribution in the rotor. Good balancing results can be obtained only if vibration is caused by uneven rotor mass distribution. Attempting to balance a rotor with other problems will not, in general, reduce the vibration level.
The Balancing Process A rigid rotor can be balanced in one or two planes. The following steps are involved:
Setting Balancing Parameters - Select the units and balancing method.
Initial Reading - Measure the initial imbalance.
Section 11: Balancing Rotors (vb7 and vb8 Instruments Only)
125
Trial Reading - Attach a trial weight to the balancing plane and take another measurement. For dual plane balancing, the same is also done for the second plane.
Balancing - Attach correction weights to the balancing plane(s) as recommended by the instrument.
Trim Balance - Take a measurement in each plane to confirm that the rotor is balanced. Any residual imbalance can be removed via additional trim balance cycles.
Tips for Balancing
• Before performing a balance job, clean the rotor removing any dirt or loose-hanging material such as rust, flaking paint etc, which may affect balancing results if they fall off later.
• Ensure that any weight(s) you add will not come loose at the normal rotor speed and that it will not obstruct machine motion. If possible, manually rotate the rotor to ensure that the weight does not clash with any part of the machine, keeping in mind that the rotor's center line may shift when operated at its normal speed.
• Ensure the weight of any mechanism used to hold the correction weights in place is included as part of the correction weight. If you are welding on the weight, make sure that the weight of the flux is not included (scrape the flux off before weighing the electrode).
• Ensure that the shape of the correction weight does not cause it to become a dirt trap since dirt accumulated on the weight may cause rotor imbalance.
• It is important to attach the correction weight(s) at the same radial distance that the trial weight was i.e. if the trial weight was attached 'n' mm/inches from the center of the rotor, the correction weight must also be attached 'n' mm/inches from the center of the rotor.
Section 11: Balancing Rotors (vb7 and vb8 Instruments Only) 126
The Tachometer The tachometer provides the instrument with information regarding the rotational speed of a rotor and the angle at which the rotor is vibrating. The angle is measured from a fixed reference mark on the rotor and is called the ‘phase angle’. To balance a rotor you must consider both the amplitude of vibration and also the phase angle. The amplitude shows the severity of the imbalance and the phase angle indicates the geometry of the imbalance (i.e. the location of the heavy spot). Setting up the Tachometer (page 34) contains information on how to set up the tachometer to measure phase angles.
Suggested Trial Weight Mass and Location The instrument can assist with balancing operations by calculating an appropriate trial weight mass and location for you. Please refer to topics CH Position and Reference Mark, for help with calculating the trial weight location, and Machine Information, for help with calculating the trial weight mass.
Manually Entering Balancing Information You have the option to manually enter amplitude and phase values for the initial, trial and trim readings. This allows you to:
� Interrupt the balancing process without saving the values, then re-enter them later and continue balancing.
� Experiment with different trial weight masses and placements to see the effect on the imbalance, without having to attach weights to the machine.
� Calculate the effect of further trim balances.
� Change the units used in a final balancing report by selecting different units then re-entering the collected values.
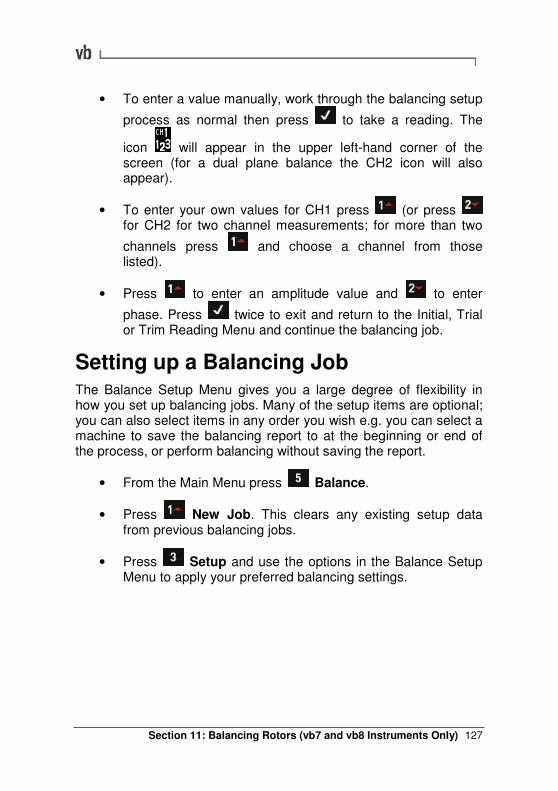
Section 11: Balancing Rotors (vb7 and vb8 Instruments Only)
127
• To enter a value manually, work through the balancing setup
process as normal then press to take a reading. The
icon will appear in the upper left-hand corner of the screen (for a dual plane balance the CH2 icon will also appear).
• To enter your own values for CH1 press (or press for CH2 for two channel measurements; for more than two
channels press and choose a channel from those listed).
• Press to enter an amplitude value and to enter
phase. Press twice to exit and return to the Initial, Trial or Trim Reading Menu and continue the balancing job.
Setting up a Balancing Job The Balance Setup Menu gives you a large degree of flexibility in how you set up balancing jobs. Many of the setup items are optional; you can also select items in any order you wish e.g. you can select a machine to save the balancing report to at the beginning or end of the process, or perform balancing without saving the report.
• From the Main Menu press Balance.
• Press New Job. This clears any existing setup data from previous balancing jobs.
• Press Setup and use the options in the Balance Setup Menu to apply your preferred balancing settings.
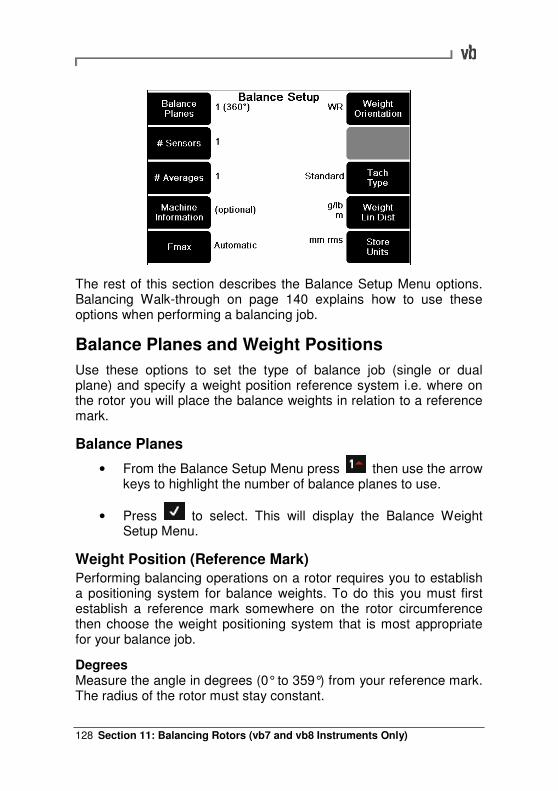
Section 11: Balancing Rotors (vb7 and vb8 Instruments Only) 128
The rest of this section describes the Balance Setup Menu options. Balancing Walk-through on page 140 explains how to use these options when performing a balancing job.
Balance Planes and Weight Positions
Use these options to set the type of balance job (single or dual plane) and specify a weight position reference system i.e. where on the rotor you will place the balance weights in relation to a reference mark.
Balance Planes
• From the Balance Setup Menu press then use the arrow keys to highlight the number of balance planes to use.
• Press to select. This will display the Balance Weight Setup Menu.
Weight Position (Reference Mark)
Performing balancing operations on a rotor requires you to establish a positioning system for balance weights. To do this you must first establish a reference mark somewhere on the rotor circumference then choose the weight positioning system that is most appropriate for your balance job.
Degrees Measure the angle in degrees (0° to 359°) from your reference mark. The radius of the rotor must stay constant.
Section 11: Balancing Rotors (vb7 and vb8 Instruments Only)
129
Circumference arc Measure the linear distance around the outside of the rotor from the reference mark to the balance weights.
# Fixed positions Create a fixed number of attachment positions, e.g. drilled and tapped holes, that are equally spaced on a fixed radius from the center of rotation.
To assist with the physical balancing setup you can use a different weight position system for each balancing plane if desired.
• From the main menu screen press Balance. Press
New Job to clear your setting or press Setup to use your existing configuration
• Press Balance Planes then use the arrow keys to highlight the number of balance planes to use.
• Press to select. This will display the Balance Weight Setup Menu.
• From the Balance Weight Setup Menu press Plane A Weight Position then use the arrow keys to highlight your
choice and press to select.
• If you select circumference arc or # fixed positions this will open the Circumference or # Fixed Position sub-menus where you need to specify the rotor circumference or the number of fixed positions. Enter the required value then
press
Note: The circumference units used (inches or mm) are set in the
Balance Setup screen by pressing Weight Lin Dist then Linear Distance.
• If you have selected dual plane balancing press Plane B Weight Position and repeat the previous steps for Plane B.
Section 11: Balancing Rotors (vb7 and vb8 Instruments Only) 130
• Press repeatedly if necessary to return to the Balance Setup Menu from where you will specify your sensor
settings. If you selected dual plane balancing, pressing will automatically take you to the Balance Sensor Setup Menu.
# Sensors
This option lets you specify the number and type of sensors you are using. This menu also contains an option that allows the instrument to recommend where to place trial weights (optional).
• If the Balance Sensor Setup Menu is not already displayed
press # Sensors from the Balance Setup Menu then
select the number of sensors required and press
• Press CH1 Sensor and select a sensor or Create New Sensor if a new one as required (refer to Defining and Editing Sensors on page 116 for more information).
• Press to return to the Balance Sensor Setup Menu. To specify a 2nd, 3rd or 4th sensor for dual plane balancing
press to as required and repeat the previous step.
Note: The vb8 allows full four-sensor simultaneous monitoring of both horizontal and vertical axes on each bearing. This ability provides confidence that a balance on any one axis has not worsened vibrations on the other. The vb7 allows simultaneous two channel dual plane monitoring.
• If you want the instrument to help you determine where to place your trial weights use the CH Position option on the left-hand side of the screen (see next topic), otherwise skip
this step and press to return to the Balance Setup Menu.
CH Position
Note: This item is optional.
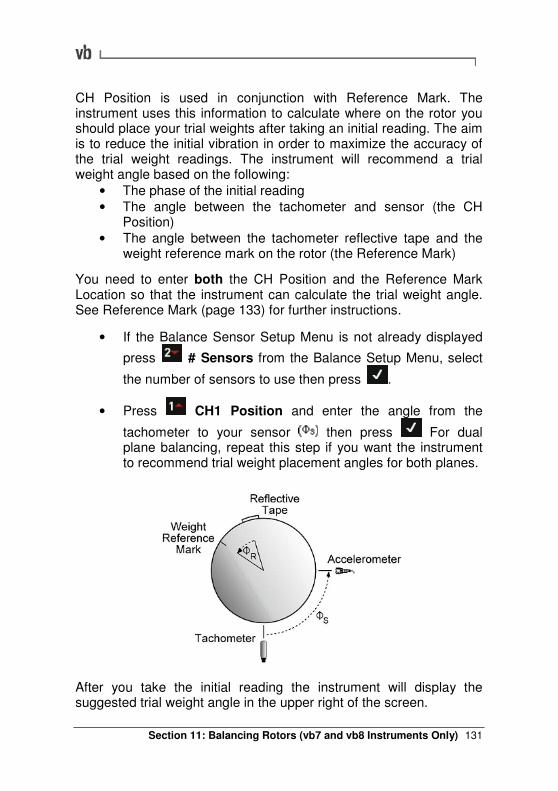
Section 11: Balancing Rotors (vb7 and vb8 Instruments Only)
131
CH Position is used in conjunction with Reference Mark. The instrument uses this information to calculate where on the rotor you should place your trial weights after taking an initial reading. The aim is to reduce the initial vibration in order to maximize the accuracy of the trial weight readings. The instrument will recommend a trial weight angle based on the following:
• The phase of the initial reading • The angle between the tachometer and sensor (the CH
Position) • The angle between the tachometer reflective tape and the
weight reference mark on the rotor (the Reference Mark)
You need to enter both the CH Position and the Reference Mark Location so that the instrument can calculate the trial weight angle. See Reference Mark (page 133) for further instructions.
• If the Balance Sensor Setup Menu is not already displayed
press # Sensors from the Balance Setup Menu, select
the number of sensors to use then press .
• Press CH1 Position and enter the angle from the
tachometer to your sensor then press For dual plane balancing, repeat this step if you want the instrument to recommend trial weight placement angles for both planes.
After you take the initial reading the instrument will display the suggested trial weight angle in the upper right of the screen.
Section 11: Balancing Rotors (vb7 and vb8 Instruments Only) 132
Notes: Angles are measured in the direction you designate as your Weight Orientation i.e. with rotation or against rotation.
If you are performing a dual plane balance you should only use this option in cases where each balance plane is physically close to its sensor, and the two planes are separated from each other by a distance greater than the rotor diameter. In particular for overhung rotors this option should only be used for single plane balancing on the closest bearing and balance plane, to help with reducing the static imbalance only. The CH2 or CH4 sensor and weight reference mark must be in line with those of CH1 or CH3.
Averages
Averaging the 'out of balance' values can increase the accuracy of your measurements, allowing the instrument to make more precise recommendations for the size and placement of balance weights. A higher number of averages produces more accurate measurements, but lengthens the recording time accordingly.
Machine Information
Entering machine information is optional. It allows you to specify some of the physical properties of the machine being balanced.
Rotor Weight, Diameter and Speed
Entering the rotor's weight, diameter and speed helps the instrument to calculate the appropriate size and placement of trial weights based on your machine's physical properties. The aim is to calculate a trial weight which will cause a significant change from the initial reading.
• From the Balance Setup Menu press Machine Information and use the on-screen options to enter your
values. If you need to enter a decimal point press then
Section 11: Balancing Rotors (vb7 and vb8 Instruments Only)
133
• If you need to change a measurement unit e.g. for rotor weight or diameter, return to the Balance Setup Menu and
press Weight Lin Dist. Change the units as required
then press
After you take the initial reading the instrument will display the suggested trial weight mass in the upper left of the screen.
Note: In Manual input mode and without a tachometer connected no suggested angle and weight will be provided by the instrument.
Reference Mark
Note: This item is optional.
Reference Mark is used in conjunction with CH Position. The instrument uses this information to calculate where on the rotor you should place your trial weights after taking an initial reading.
You need to enter both the Reference Mark Location and the CH Position so that the instrument can calculate the trial weight angle. Refer to topic CH Position for more information.
• If the Balance Machine Menu is not already displayed press
Machine Information from the Balance Setup Menu.
• Press Reference Mark and enter the angle from the tachometer reflective tape to your reference mark then press
If these marks are aligned with each other enter zero.
After you take the initial reading the instrument will display the suggested trial weight angle in the upper right of the screen.
Weight Orientation
Weight Orientation allows you to choose where to place balance weights on a rotor, relative to the rotor's direction of rotation.
With rotation (WR) means you choose a reference point then place your weights forward of that point in the direction of rotation (i.e. in the same direction as the rotor turns).
Section 11: Balancing Rotors (vb7 and vb8 Instruments Only) 134
Against rotation (AR) means that if the rotor is turning forward then you place your weights backwards from the reference point (i.e. in the opposite direction of the rotor’s rotation).
Ensure that with the rotor stationary you measure angles in the direction specified. Do not rotate the rotor in the direction specified.
Tach Trigger
Tach Trigger allows you to specify whether you are using a standard tachometer or a Keyphasor®.
Weight Lin Dist
Weight Lin Dist allows you to specify the measurement units for linear speed distance, balance weights and rotor weight.
• To change the displayed units press Weight Lin Dist
then press to cycle through the linear speed options or
to open the Weight Units Menu where you can set balance and rotor weight units.
• When you have set your units press to navigate back to the Balance Setup Menu.
Store Units
Store Units allows you to specify your preferred measurement units and overall scaling for balancing jobs.
Combining Trim Weights As you continue to fine-tune a balance job, you may end up with several trim weights fixed at various angles on the balancing planes. You can combine all trim weights for an individual plane into one weight/angle solution using the Adjust Weights calculator.
• After taking a trim reading press to display the Trim
Weight Menu (or from the Balancing Menu Balance Readings).
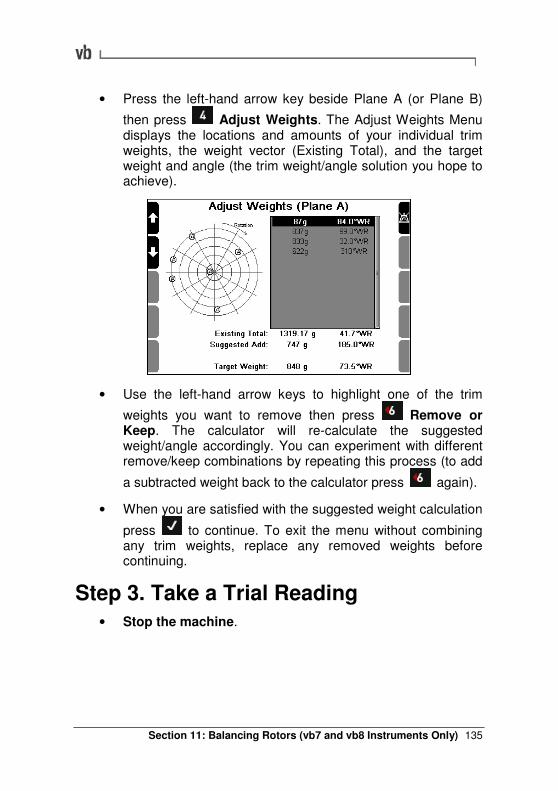
Section 11: Balancing Rotors (vb7 and vb8 Instruments Only)
135
• Press the left-hand arrow key beside Plane A (or Plane B)
then press Adjust Weights. The Adjust Weights Menu displays the locations and amounts of your individual trim weights, the weight vector (Existing Total), and the target weight and angle (the trim weight/angle solution you hope to achieve).
• Use the left-hand arrow keys to highlight one of the trim
weights you want to remove then press Remove or Keep. The calculator will re-calculate the suggested weight/angle accordingly. You can experiment with different remove/keep combinations by repeating this process (to add
a subtracted weight back to the calculator press again).
• When you are satisfied with the suggested weight calculation
press to continue. To exit the menu without combining any trim weights, replace any removed weights before continuing.
Step 3. Take a Trial Reading
• Stop the machine.
Section 11: Balancing Rotors (vb7 and vb8 Instruments Only) 136
• Establish a reference mark on the balancing plane. This will be used to measure the angular position of the trial weight and the final balance weights. The reference mark can be at any position around the balancing plane. It does not need to be referenced to the tachometer reflective tape position.
In dual plane balancing, establish a reference mark on Plane B also. It does not need to correspond with the Plane A reference mark.
• Attach a trial weight to the balancing plane. It is important that the trial weight is not too large, as this may damage machine bearings, and not too small as its effect will be imperceptible. Your trial weight must be of sufficient mass to change the imbalance by approximately 30% in amplitude or 30% in phase (these figures are the industry norm). This will allow the instrument to perform its calculations accurately.
• The trial weight position should be near the rim of the rotor but can be at any angular position. Starting at the reference mark, measure the angular position in the direction you specified for the Weight Orientation. This will be either WR (with rotation) or AR (against rotation).
• In the Trial Weight Menu press and enter the value for your trial weight. If you need to enter a decimal point press
then
• Press to return to the Trial Weight Menu then press and enter the position of your trial weight in relation to the reference mark.
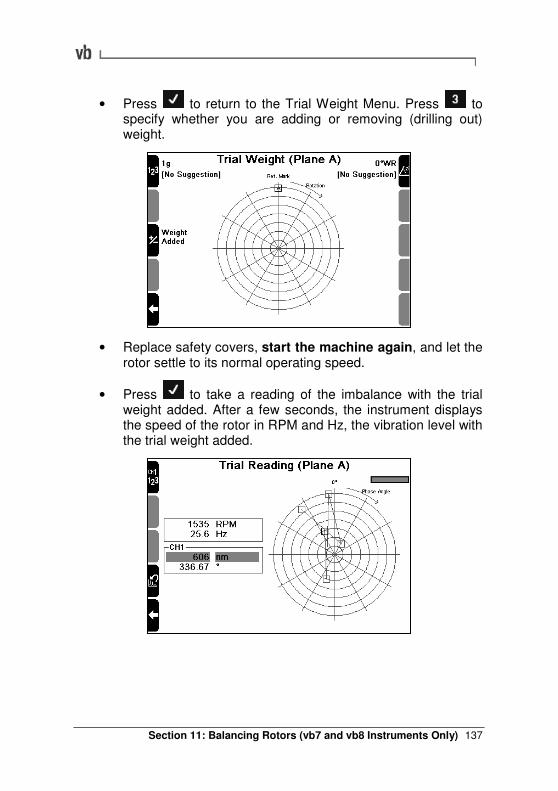
Section 11: Balancing Rotors (vb7 and vb8 Instruments Only)
137
• Press to return to the Trial Weight Menu. Press to specify whether you are adding or removing (drilling out) weight.
• Replace safety covers, start the machine again, and let the rotor settle to its normal operating speed.
• Press to take a reading of the imbalance with the trial weight added. After a few seconds, the instrument displays the speed of the rotor in RPM and Hz, the vibration level with the trial weight added.
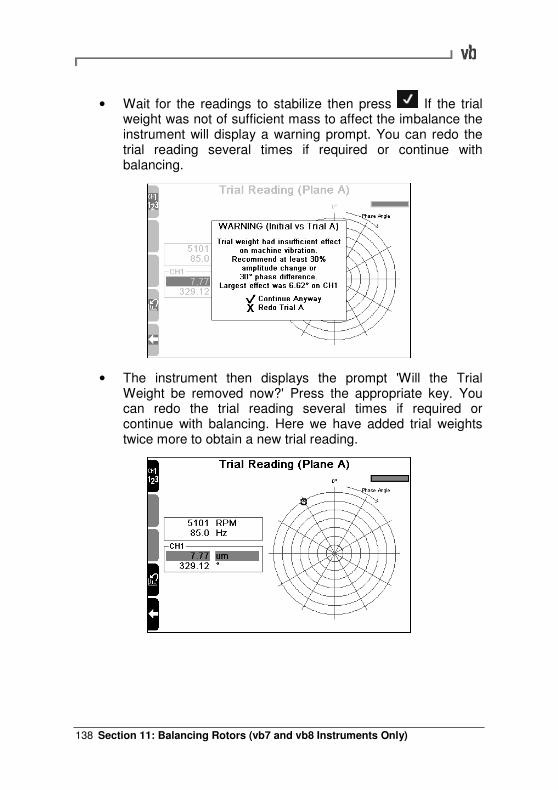
Section 11: Balancing Rotors (vb7 and vb8 Instruments Only) 138
• Wait for the readings to stabilize then press If the trial weight was not of sufficient mass to affect the imbalance the instrument will display a warning prompt. You can redo the trial reading several times if required or continue with balancing.
• The instrument then displays the prompt 'Will the Trial Weight be removed now?' Press the appropriate key. You can redo the trial reading several times if required or continue with balancing. Here we have added trial weights twice more to obtain a new trial reading.
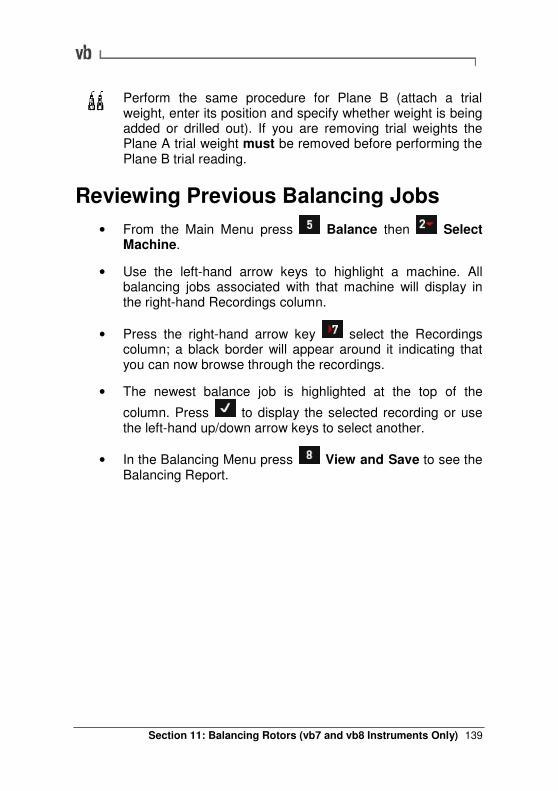
Section 11: Balancing Rotors (vb7 and vb8 Instruments Only)
139
Perform the same procedure for Plane B (attach a trial weight, enter its position and specify whether weight is being added or drilled out). If you are removing trial weights the Plane A trial weight must be removed before performing the Plane B trial reading.
Reviewing Previous Balancing Jobs
• From the Main Menu press Balance then Select Machine.
• Use the left-hand arrow keys to highlight a machine. All balancing jobs associated with that machine will display in the right-hand Recordings column.
• Press the right-hand arrow key select the Recordings column; a black border will appear around it indicating that you can now browse through the recordings.
• The newest balance job is highlighted at the top of the
column. Press to display the selected recording or use the left-hand up/down arrow keys to select another.
• In the Balancing Menu press View and Save to see the Balancing Report.
Section 12: Balancing Walk-through (vb7 and vb8 Instruments Only) 140
Section 12: Balancing Walk-through (vb7 and vb8 Instruments Only)
Note: The vb5 and vb6 instruments do not include balancing functionality. This section applies only to vb7 and vb8 instruments.
This walk-through guides you through the process of balancing a rotor using single and dual plane balancing. Dual plane balancing requires additional steps; these extra steps are indicated with this
symbol
You will learn to: • Take initial imbalance measurements
• Set up and apply trial weights • Balance the rotor using correction weights
• Perform trim balancing to further reduce the vibration • Save and review your balancing job
• Produce balancing reports
Step 1. Set Up a New Balance Job
• From the Main Menu press Balance then press New Job to clear any previous settings.
• Press Setup. Use the options in the Balance Setup Menu to choose the required settings for your balancing job.
The following screen shows the settings that were selected for this walk-through.
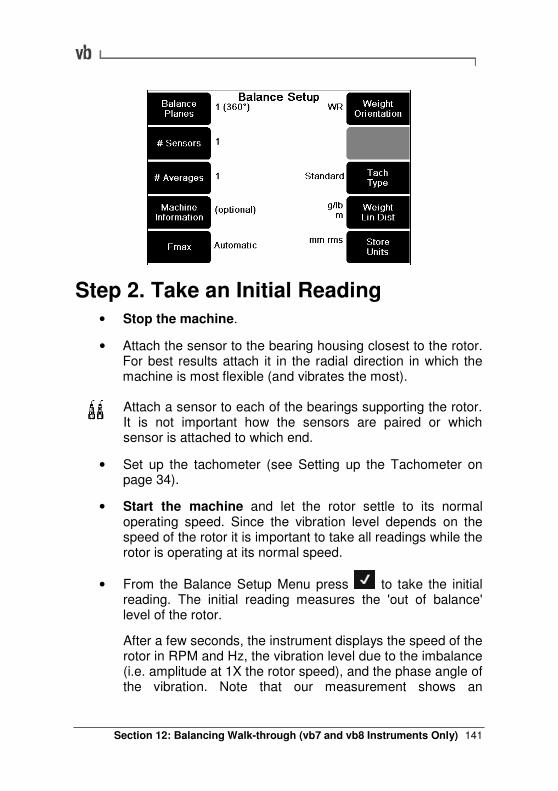
Section 12: Balancing Walk-through (vb7 and vb8 Instruments Only)
141
Step 2. Take an Initial Reading
• Stop the machine.
• Attach the sensor to the bearing housing closest to the rotor. For best results attach it in the radial direction in which the machine is most flexible (and vibrates the most).
Attach a sensor to each of the bearings supporting the rotor. It is not important how the sensors are paired or which sensor is attached to which end.
• Set up the tachometer (see Setting up the Tachometer on page 34).
• Start the machine and let the rotor settle to its normal operating speed. Since the vibration level depends on the speed of the rotor it is important to take all readings while the rotor is operating at its normal speed.
• From the Balance Setup Menu press to take the initial reading. The initial reading measures the 'out of balance' level of the rotor.
After a few seconds, the instrument displays the speed of the rotor in RPM and Hz, the vibration level due to the imbalance (i.e. amplitude at 1X the rotor speed), and the phase angle of the vibration. Note that our measurement shows an
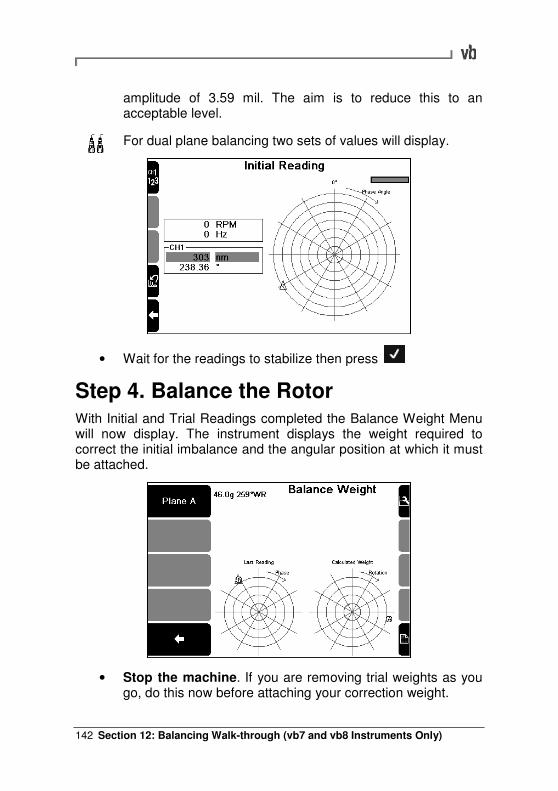
Section 12: Balancing Walk-through (vb7 and vb8 Instruments Only) 142
amplitude of 3.59 mil. The aim is to reduce this to an acceptable level.
For dual plane balancing two sets of values will display.
• Wait for the readings to stabilize then press
Step 4. Balance the Rotor With Initial and Trial Readings completed the Balance Weight Menu will now display. The instrument displays the weight required to correct the initial imbalance and the angular position at which it must be attached.
• Stop the machine. If you are removing trial weights as you go, do this now before attaching your correction weight.
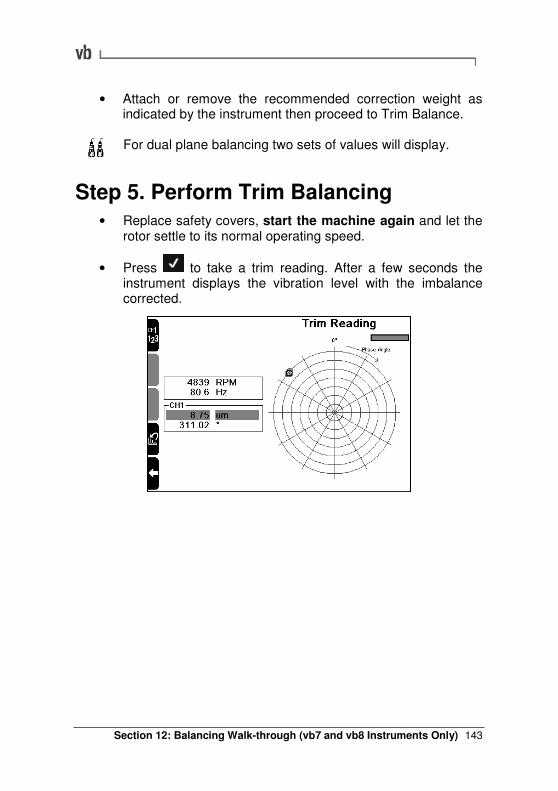
Section 12: Balancing Walk-through (vb7 and vb8 Instruments Only)
143
• Attach or remove the recommended correction weight as indicated by the instrument then proceed to Trim Balance.
For dual plane balancing two sets of values will display.
Step 5. Perform Trim Balancing
• Replace safety covers, start the machine again and let the rotor settle to its normal operating speed.
• Press to take a trim reading. After a few seconds the instrument displays the vibration level with the imbalance corrected.
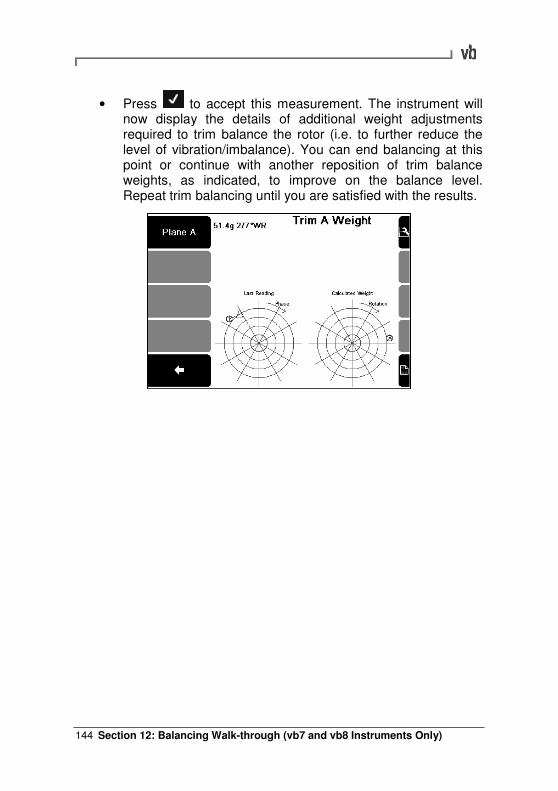
Section 12: Balancing Walk-through (vb7 and vb8 Instruments Only) 144
• Press to accept this measurement. The instrument will now display the details of additional weight adjustments required to trim balance the rotor (i.e. to further reduce the level of vibration/imbalance). You can end balancing at this point or continue with another reposition of trim balance weights, as indicated, to improve on the balance level. Repeat trim balancing until you are satisfied with the results.
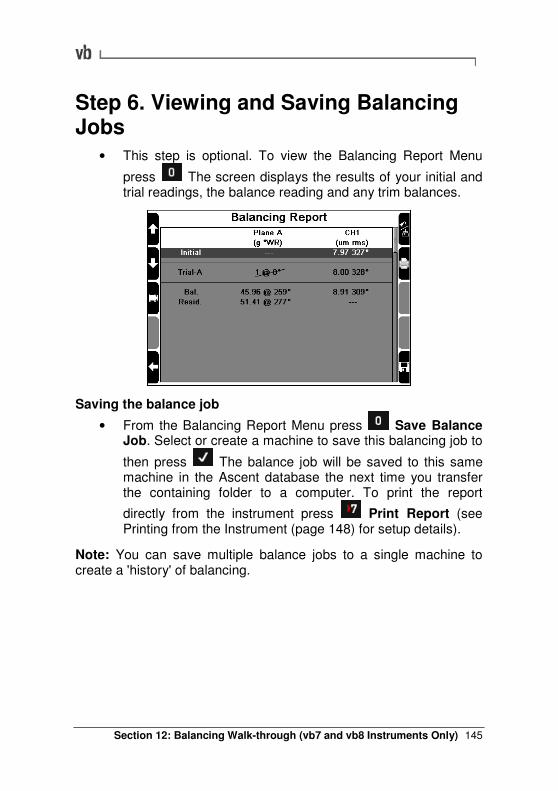
Section 12: Balancing Walk-through (vb7 and vb8 Instruments Only)
145
Step 6. Viewing and Saving Balancing Jobs
• This step is optional. To view the Balancing Report Menu
press The screen displays the results of your initial and trial readings, the balance reading and any trim balances.
Saving the balance job
• From the Balancing Report Menu press Save Balance Job. Select or create a machine to save this balancing job to
then press The balance job will be saved to this same machine in the Ascent database the next time you transfer the containing folder to a computer. To print the report
directly from the instrument press Print Report (see Printing from the Instrument (page 148) for setup details).
Note: You can save multiple balance jobs to a single machine to create a 'history' of balancing.
Section 13: Utilities 146
Section 13: Utilities
This section describes how to use the utility functions of your instrument.
You will learn to:
• Set the instrument date and time
• Synchronize the instrument date/time with the Ascent software
• Adjust the LCD display • Change the LCD interface language
• Set up direct printing from the instrument • Manage the battery pack
• Release instrument memory • Upgrade the instrument's firmware
Setting the Date and Time You can set the time in 12 hour or 24 hour format. Recordings are date- and time-stamped according to this clock. The instrument adjusts the date and time automatically to accommodate leap years and daylight savings. You can also select your local time zone automatically (see next topic).
• From the Main Menu press Options.
• Press Date/Time then press to set the date or to set the time.
• Press the number keys to enter your values; the cursor will automatically advance to the next position. If you enter an incorrect number press the key repeatedly until the cursor returns to the beginning of the line then start again.
• Press to save your changes.
Section 13: Utilities
147
Adjusting the Date Format
• From the Main Menu press Options.
• Press Date/Time.
• Press repeatedly to cycle between date display formats (from DD/MM/YYYY to MM/DD/YYYY, for example).
Selecting Your Local Timezone
• From the Main Menu press Options.
• Press Date/Time then press Edit Timezone.
• Use the arrow keys to highlight your local timezone then
press to select.
Note: You can jump to the top and bottom of the list using the
right-hand arrow keys and
Adjusting Sound Volume
• From the Main Menu press Options.
• Press Sound.
• Use the right-hand arrow keys to adjust the volume up
or down Press and hold to turn sound off.
• Press to test the volume then to save your setting.
Set the Instrument Language The language used by the instrument interface varies from region to region based upon the original purchase location. Some regions, such as North and South America, include more than one selectable language option. To change the language used by an instrument:
Section 13: Utilities 148
• From the Main Menu press Options.
• Press Language.
• Use the left-hand and arrow keys to select a language from the list of those available. The two windows at the bottom of the screen demonstrate how the language selected will appear.
• Press to save your language selection.
Printing Directly to a Network Printer vb7 and vb8 instruments can be configured to print balancing reports directly to PCL-enabled network printers. Configuring this feature requires an in-depth understanding of your network and printer configurations. If you are unfamiliar with either, you may require assistance from your network administrator or technical support department.
Printing can also be configured using the Ascent software.
• Connect the instrument to your printer or network switch/hub using an Ethernet cable. Turn on your network printer.
• From the Main Menu press Options.
• Press Network then Printer.
• Press Printer Type to toggle between printer types. Available options are Postscript, PCL and Disabled. The Disabled setting will disable the print function.
Note: PCL is the most widely supported printer language. Check your printer documentation to determine which option is most appropriate.
• Press Printer Address and enter the printer's IP
address. Press to save and return to the Printer Settings Menu. The default port is always 515.
Section 13: Utilities
149
Note: To obtain your printer's IP address, open your 'Printers and Faxes' folder (Start>Printers and Faxes in Windows XP). Right-click the printer and select Properties. Click the Ports tab. Scroll down the list of ports until you see your printer (it will have a checkbox selected beside it). The IP address will be listed under the 'Port' column.
• Press Queue Name and enter the printer's Queue
Name then
Note: The Queue Name is a unique identifier, sometimes known as a 'Printer ID'. Many printers have a factory-configured Queue Name that can be found in the printer's user manual, or printed on a label attached to the printer itself. If the printer was configured by a Windows Printer Wizard, the Queue Name may use the header 'IP_' followed by the IP address: 'IP_192.168.1.1', for example.
• Press Paper Size then select a paper sheet type using
the left-hand arrow keys and press
• Press Print Test Page. A test page will be printed if the instrument configuration is correct.
Adjusting Screen Contrast
• From the Main Menu press Options.
• Press LCD Contrast Backlight. The screen displays a chart and text so that you can preview the effect your adjustments will make on the display.
• Use the and keys to increase or decrease the
screen contrast then press
Turning the Backlight On/Off The backlight consumes a relatively high level of power and will automatically turn off after a timeout period (see Setting Backlight Timeout (page 151)).
Section 13: Utilities 150
• From the Main Menu press Options.
• Press LCD Contrast Backlight.
• Use the and keys to adjust the backlight brightness
or turn it off then press
Recharging the Instrument
• Plug the power transformer into a standard power outlet and attach the connector to the instrument's charger socket. You can continue to use the instrument while the battery is charging.
Estimating Remaining Operating Time The instrument can estimate its operating time based on the amount of current remaining in the battery and the average current usage. The true operating time before the battery runs flat will depend on how you use the instrument. You can check the estimated operating time in the Battery and Power Management Menu.
• From the Main Menu press Options.
• Press Battery Pwr Mngmnt. The estimated operating Time Left is displayed in the middle of this screen.
Conserving Battery Power The length of time you can operate the instrument will depend on how it is used and what settings you apply. You can adjust the following settings to reduce your power consumption and increase the instrument's operating time.
• Sound volume
• Screen brightness/contrast • Backlight brightness and timeout period
• Sleep Mode timeout • Shutdown timeout
Section 13: Utilities
151
Setting Backlight Timeout
The backlight will turn off automatically after the timeout period has elapsed (60 seconds by default). If a measuring period exceeds the backlight timeout, the backlight will remain on during measuring and will turn off when measuring is complete.
• From the Main Menu press Options.
• Press Battery Pwr Mngmnt.
• Press Turn Off Backlight. Enter a value in seconds
(minimum 1, maximum 9999) then press
Setting Sleep Mode Timeout
Sleep mode turns the instrument off if no keys are pressed for a set period of time (15 minutes by default). This method of auto-powering off the instrument conserves battery charge and allows for fast powering up (approximately 7 seconds). However, it is less battery efficient than using the Complete Powerdown option because the internal module remains on. The instrument will power down completely once the complete powerdown timeout period has elapsed (see next topic).
When recording a route, powering up the instrument from sleep mode will return you to the last displayed menu. In all other cases the instrument will display the Main Menu.
• From the Main Menu press Options.
• Press Battery Pwr Mngmnt.
• Press Enter Sleep Mode and enter a value in minutes
(minimum 1, maximum 9999) then press
Powering up the instrument
• To power up the instrument from sleep mode press Power as normal.
Section 13: Utilities 152
Note: If the battery level drops to 25% or less, sleep mode is disabled. The instrument will immediately enter Complete
Powerdown Mode when Power is pressed, or at the completion of the Sleep Mode Timeout period.
Setting Complete Powerdown Timeout
Complete powerdown turns the instrument off after a set period of time (1 hour by default) in Sleep Mode.
• From the Main Menu press Options.
• Press Battery Pwr Mngmnt.
• Press Complete Powerdown and enter a value in
hours (minimum 1, maximum 9999) then press
Checking How Much Memory is Available The Memory Menu displays information on the instrument's memory capacity, the amount of memory in use, and the number of folders, schedule entries and recordings stored in the instrument.
• From the Main Menu press Options.
• Press Memory to display the instrument's memory
usage. Press to return to the Options Menu.
Freeing Instrument Memory The instrument has a standard memory size of 1 GB, providing virtually unlimited storage capacity for routes, recordings and notes etc.
To increase free memory, we recommend you regularly transfer recordings to a PC and delete those that are not required. The easiest way to do this is to re-send the folder from the Ascent
Section 13: Utilities
153
software. Refer to the appropriate topics in Creating, Editing and Deleting Items (page 108).
Upgrading Instrument Firmware (Proflashing) From time to time Commtest will release new versions of instrument firmware. These firmware upgrades allow you to take advantage of product enhancements and new features that were created after your instrument was purchased. To re-program an instrument with newer firmware you must PROFLASH the instrument with a new firmware file.
Warning: PROFLASHING will restore the instrument to the factory default state and delete all stored information. This includes folders, routes, machines, parameter sets, recordings and balance jobs. If you wish to save any of this information, please transfer all folders to the software before PROFLASHING your instrument.
• To check if a newer firmware version is available, visit our website at www.commtest.com and check the Info and Downloads page. You will need to register your instrument before you can download the latest software. Firmware files are included with the Ascent software, not provided individually. Therefore you must update your Ascent software to access new instrument firmware.
Proflash Procedure
Note: The steps below assume your instrument is already configured in Ascent for connection. See the Ascent Reference Guide for details.
• Connect the instrument to the PC using the supplied USB cable or any Ethernet cable. If you want to save any information that is still stored in the instrument you should transfer this now.
• Start the Ascent software.
Section 13: Utilities 154
• Select Edit>Manage>vb Instruments... from the Ascent menu. The Manager window will open.
• Double-click your instrument (identifiable by its serial number) in the new window. The instrument properties window will open.
• Click the Proflash button under the Setup tab. The Proflash window will appear, listing the available firmware version(s) stored on your PC.
• With the newest 'recommended' firmware version highlighted, click the Proflash button. When prompted press
on the instrument. PROFLASHING may take several minutes during which the instrument will display a series of progress messages.
Note: Do not interrupt the PROFLASH process as this may damage the instrument.
• Once Proflashing has completed, restart the instrument by
pressing and together.
Section 14: Troubleshooting
155
Section 14: Troubleshooting
Contacting Technical Support If you have any problems please contact Commtest support staff directly for assistance. Our e-mail address is [email protected].
We also provide a searchable knowledge base of frequently asked questions (FAQ) on our website at www.commtest.com.
Resetting an Unresponsive Instrument Warning: An unresponsive instrument (one that does not respond to key presses) will continue drawing power until it is reset or turned off. To conserve power you must therefore reset the instrument as soon as possible.
Note: Resetting the instrument will not delete previously stored data or settings.
• Hold then press The instrument will power off and re-start immediately.
Network Communications Problems The instrument and the Ascent program use a default network address to communicate. Normally it will not need to be changed. However, it is possible that this address may interact negatively with other devices on a network. This conflict may result in other network connections being lost while the instrument is connected to your computer.
To resolve this conflict, change the USB or Ethernet network settings in the instrument and Ascent program.
Notes: Your changes will only take effect once the instrument hardware has been reset.
Section 14: Troubleshooting 156
If you change the network address you must change it in both the instrument and software so that they can communicate (this does not apply if you are only changing the last digit of the IP address).
Setting the USB Network Address
• From the instrument's Main Menu press Options then
Network.
• Press USB and use the number keys to enter your new
IP address, netmask and gateway. Press after you enter each item.
• Press + to reset the instrument hardware and apply your changes.
• Connect the Commtest supplied data transfer cable to the USB ports of the instrument and computer and power up the instrument.
• In the Ascent program select Edit>Manage>vb Instruments...
• Double-click the instrument from the list of those available. If no instrument is shown see the Ascent Reference Guide for instructions on adding your instrument to Ascent.
• Enter the new IP address into the IP address: field in the USB area. Click Apply to save the change.
Setting the Ethernet Network Address
• From the instrument's Main Menu press Options then
Network.
• Press Ethernet. A message will appear asking if you wish to use a DHCP server to assign an IP address to the instrument.
Section 14: Troubleshooting
157
� Press to use DHCP then press + to reset and apply your changes, or;
� Press and enter your new network IP values
manually. Press + to reset the instrument hardware and apply your changes.
Note: Dynamic Host Configuration Protocol (DHCP) is a network protocol that automatically configures TCP/IP networked devices.
Ethernet Connection Lost in Windows Vista Computers using the Microsoft Vista Ultimate operating system may lose Ethernet communications with vbSeries instruments following communication via USB. This is the result of a network protocol incompatibility. To resolve this problem disable support for the IPv6 network protocol in Vista.
• Navigate to Start>Control Panel>View network status (this is located under the Network and Internet heading).
• Click Manage network connections on the left-hand menu.
• Right-click the Local Area Connection #X icon (the correct icon can be identified by the sub-heading 'vbX #X' where 'X' is the USB port number) and select Properties.
• Under the heading 'This connection uses the followng items:' deselect the checkbox beside Internet Protocol Version 6 (TCP/IPv6).
• Click OK.
Note: Disabling IPv6 will prevent you from using Windows Meeting Space or any application that relies on the Windows Peer-to-Peer Networking platform or the Teredo transition technology. If you wish to use these applications, simply re-enable IPv6 support. Ethernet instrument connections will be unaffected by the reactivation of IPv6
Section 14: Troubleshooting 158
support as the compatibility problem is resolved by the initial performance of the procedure above.
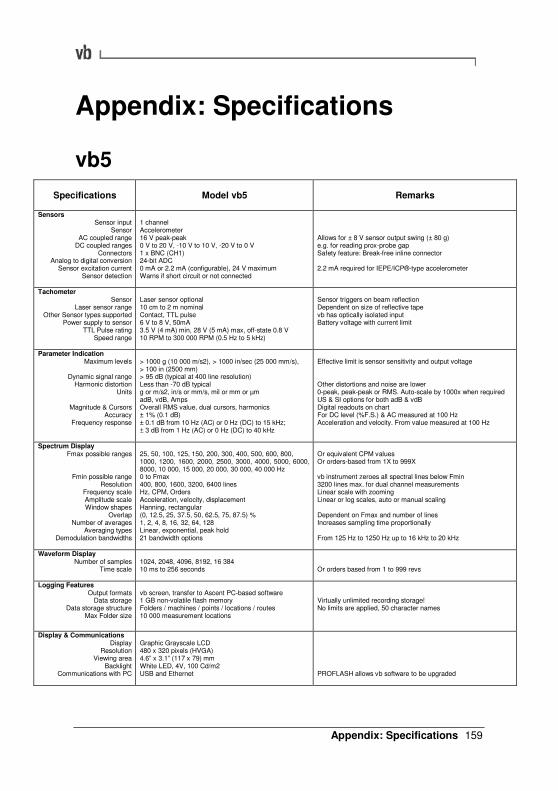
Appendix: Specifications
159
Appendix: Specifications
vb5
Specifications Model vb5 Remarks
Sensors Sensor input
Sensor AC coupled range
DC coupled ranges Connectors
Analog to digital conversion Sensor excitation current
Sensor detection
1 channel Accelerometer 16 V peak-peak 0 V to 20 V, -10 V to 10 V, -20 V to 0 V 1 x BNC (CH1) 24-bit ADC 0 mA or 2.2 mA (configurable), 24 V maximum Warns if short circuit or not connected
Allows for ± 8 V sensor output swing (± 80 g) e.g. for reading prox-probe gap Safety feature: Break-free inline connector 2.2 mA required for IEPE/ICP®-type accelerometer
Tachometer Sensor
Laser sensor range Other Sensor types supported
Power supply to sensor TTL Pulse rating
Speed range
Laser sensor optional 10 cm to 2 m nominal Contact, TTL pulse 6 V to 8 V, 50mA 3.5 V (4 mA) min, 28 V (5 mA) max, off-state 0.8 V 10 RPM to 300 000 RPM (0.5 Hz to 5 kHz)
Sensor triggers on beam reflection Dependent on size of reflective tape vb has optically isolated input Battery voltage with current limit
Parameter Indication Maximum levels
Dynamic signal range
Harmonic distortion Units
Magnitude & Cursors
Accuracy Frequency response
> 1000 g (10 000 m/s2), > 1000 in/sec (25 000 mm/s), > 100 in (2500 mm) > 95 dB (typical at 400 line resolution) Less than -70 dB typical g or m/s2, in/s or mm/s, mil or mm or µm adB, vdB, Amps Overall RMS value, dual cursors, harmonics ± 1% (0.1 dB) ± 0.1 dB from 10 Hz (AC) or 0 Hz (DC) to 15 kHz; ± 3 dB from 1 Hz (AC) or 0 Hz (DC) to 40 kHz
Effective limit is sensor sensitivity and output voltage Other distortions and noise are lower 0-peak, peak-peak or RMS. Auto-scale by 1000x when required US & SI options for both adB & vdB Digital readouts on chart For DC level (%F.S.) & AC measured at 100 Hz Acceleration and velocity. From value measured at 100 Hz
Spectrum Display Fmax possible ranges
Fmin possible range Resolution
Frequency scale Amplitude scale Window shapes
Overlap Number of averages
Averaging types Demodulation bandwidths
25, 50, 100, 125, 150, 200, 300, 400, 500, 600, 800, 1000, 1200, 1600, 2000, 2500, 3000, 4000, 5000, 6000, 8000, 10 000, 15 000, 20 000, 30 000, 40 000 Hz 0 to Fmax 400, 800, 1600, 3200, 6400 lines Hz, CPM, Orders Acceleration, velocity, displacement Hanning, rectangular (0, 12.5, 25, 37.5, 50, 62.5, 75, 87.5) % 1, 2, 4, 8, 16, 32, 64, 128 Linear, exponential, peak hold 21 bandwidth options
Or equivalent CPM values Or orders-based from 1X to 999X vb instrument zeroes all spectral lines below Fmin 3200 lines max. for dual channel measurements Linear scale with zooming Linear or log scales, auto or manual scaling Dependent on Fmax and number of lines Increases sampling time proportionally From 125 Hz to 1250 Hz up to 16 kHz to 20 kHz
Waveform Display Number of samples
Time scale
1024, 2048, 4096, 8192, 16 384 10 ms to 256 seconds
Or orders based from 1 to 999 revs
Logging Features Output formats
Data storage Data storage structure
Max Folder size
vb screen, transfer to Ascent PC-based software 1 GB non-volatile flash memory Folders / machines / points / locations / routes 10 000 measurement locations
Virtually unlimited recording storage! No limits are applied, 50 character names
Display & Communications Display
Resolution Viewing area
Backlight Communications with PC
Graphic Grayscale LCD 480 x 320 pixels (HVGA) 4.6” x 3.1” (117 x 79) mm White LED, 4V, 100 Cd/m2 USB and Ethernet
PROFLASH allows vb software to be upgraded
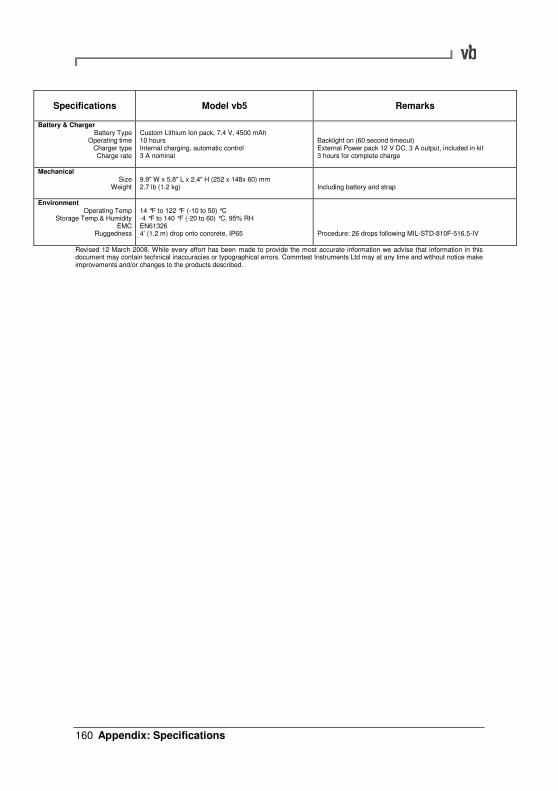
Appendix: Specifications 160
Specifications Model vb5 Remarks
Battery & Charger Battery Type
Operating time Charger type Charge rate
Custom Lithium Ion pack, 7.4 V, 4500 mAh 10 hours Internal charging, automatic control 3 A nominal
Backlight on (60 second timeout) External Power pack 12 V DC, 3 A output, included in kit 3 hours for complete charge
Mechanical Size
Weight
9.9" W x 5.8" L x 2.4" H (252 x 148x 60) mm 2.7 lb (1.2 kg)
Including battery and strap
Environment Operating Temp
Storage Temp & Humidity EMC
Ruggedness
14 °F to 122 °F (-10 to 50) °C -4 °F to 140 °F (-20 to 60) °C, 95% RH EN61326 4’ (1.2 m) drop onto concrete, IP65
Procedure: 26 drops following MIL-STD-810F-516.5-IV
Revised 12 March 2008. While every effort has been made to provide the most accurate information we advise that information in this document may contain technical inaccuracies or typographical errors. Commtest Instruments Ltd may at any time and without notice make improvements and/or changes to the products described.
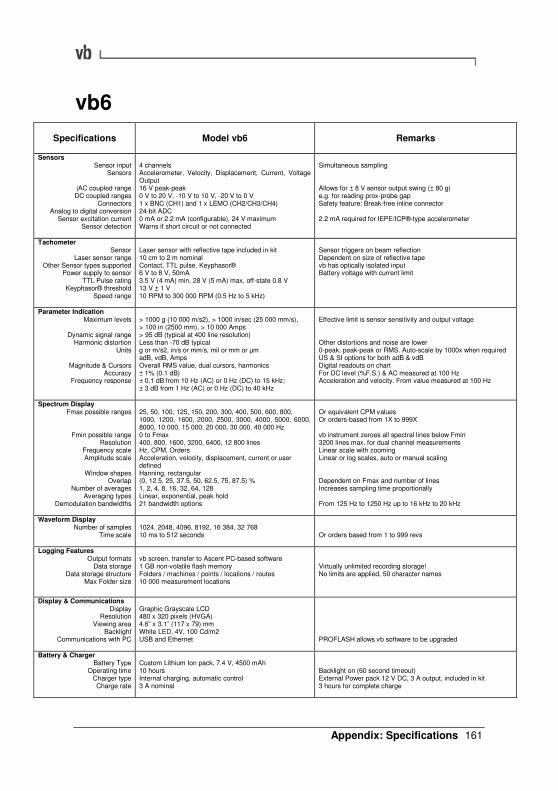
Appendix: Specifications
161
vb6
Specifications Model vb6 Remarks
Sensors Sensor input
Sensors
|AC coupled range DC coupled ranges
Connectors Analog to digital conversion
Sensor excitation current Sensor detection
4 channels Accelerometer, Velocity, Displacement, Current, Voltage Output 16 V peak-peak 0 V to 20 V, -10 V to 10 V, -20 V to 0 V 1 x BNC (CH1) and 1 x LEMO (CH2/CH3/CH4) 24-bit ADC 0 mA or 2.2 mA (configurable), 24 V maximum Warns if short circuit or not connected
Simultaneous sampling Allows for ± 8 V sensor output swing (± 80 g) e.g. for reading prox-probe gap Safety feature: Break-free inline connector 2.2 mA required for IEPE/ICP®-type accelerometer
Tachometer Sensor
Laser sensor range Other Sensor types supported
Power supply to sensor TTL Pulse rating
Keyphasor® threshold Speed range
Laser sensor with reflective tape included in kit 10 cm to 2 m nominal Contact, TTL pulse, Keyphasor® 6 V to 8 V, 50mA 3.5 V (4 mA) min, 28 V (5 mA) max, off-state 0.8 V 13 V ± 1 V 10 RPM to 300 000 RPM (0.5 Hz to 5 kHz)
Sensor triggers on beam reflection Dependent on size of reflective tape vb has optically isolated input Battery voltage with current limit
Parameter Indication Maximum levels
Dynamic signal range
Harmonic distortion Units
Magnitude & Cursors
Accuracy Frequency response
> 1000 g (10 000 m/s2), > 1000 in/sec (25 000 mm/s), > 100 in (2500 mm), > 10 000 Amps > 95 dB (typical at 400 line resolution) Less than -70 dB typical g or m/s2, in/s or mm/s, mil or mm or µm adB, vdB, Amps Overall RMS value, dual cursors, harmonics ± 1% (0.1 dB) ± 0.1 dB from 10 Hz (AC) or 0 Hz (DC) to 15 kHz; ± 3 dB from 1 Hz (AC) or 0 Hz (DC) to 40 kHz
Effective limit is sensor sensitivity and output voltage Other distortions and noise are lower 0-peak, peak-peak or RMS. Auto-scale by 1000x when required US & SI options for both adB & vdB Digital readouts on chart For DC level (%F.S.) & AC measured at 100 Hz Acceleration and velocity. From value measured at 100 Hz
Spectrum Display Fmax possible ranges
Fmin possible range Resolution
Frequency scale Amplitude scale
Window shapes
Overlap Number of averages
Averaging types Demodulation bandwidths
25, 50, 100, 125, 150, 200, 300, 400, 500, 600, 800, 1000, 1200, 1600, 2000, 2500, 3000, 4000, 5000, 6000, 8000, 10 000, 15 000, 20 000, 30 000, 40 000 Hz 0 to Fmax 400, 800, 1600, 3200, 6400, 12 800 lines Hz, CPM, Orders Acceleration, velocity, displacement, current or user defined Hanning, rectangular (0, 12.5, 25, 37.5, 50, 62.5, 75, 87.5) % 1, 2, 4, 8, 16, 32, 64, 128 Linear, exponential, peak hold 21 bandwidth options
Or equivalent CPM values Or orders-based from 1X to 999X vb instrument zeroes all spectral lines below Fmin 3200 lines max. for dual channel measurements Linear scale with zooming Linear or log scales, auto or manual scaling Dependent on Fmax and number of lines Increases sampling time proportionally From 125 Hz to 1250 Hz up to 16 kHz to 20 kHz
Waveform Display Number of samples
Time scale
1024, 2048, 4096, 8192, 16 384, 32 768 10 ms to 512 seconds
Or orders based from 1 to 999 revs
Logging Features Output formats
Data storage Data storage structure
Max Folder size
vb screen, transfer to Ascent PC-based software 1 GB non-volatile flash memory Folders / machines / points / locations / routes 10 000 measurement locations
Virtually unlimited recording storage! No limits are applied, 50 character names
Display & Communications Display
Resolution Viewing area
Backlight Communications with PC
Graphic Grayscale LCD 480 x 320 pixels (HVGA) 4.6” x 3.1” (117 x 79) mm White LED, 4V, 100 Cd/m2 USB and Ethernet
PROFLASH allows vb software to be upgraded
Battery & Charger Battery Type
Operating time Charger type Charge rate
Custom Lithium Ion pack, 7.4 V, 4500 mAh 10 hours Internal charging, automatic control 3 A nominal
Backlight on (60 second timeout) External Power pack 12 V DC, 3 A output, included in kit 3 hours for complete charge
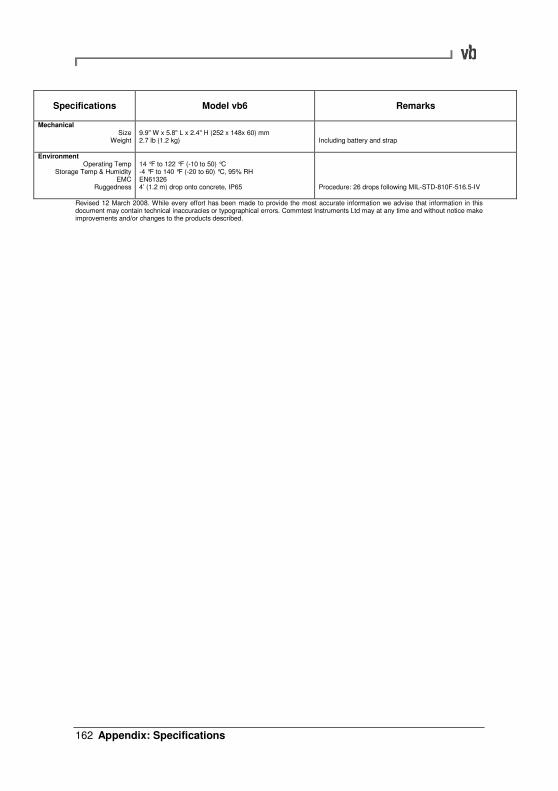
Appendix: Specifications 162
Specifications Model vb6 Remarks
Mechanical Size
Weight
9.9" W x 5.8" L x 2.4" H (252 x 148x 60) mm 2.7 lb (1.2 kg)
Including battery and strap
Environment Operating Temp
Storage Temp & Humidity EMC
Ruggedness
14 °F to 122 °F (-10 to 50) °C -4 °F to 140 °F (-20 to 60) °C, 95% RH EN61326 4’ (1.2 m) drop onto concrete, IP65
Procedure: 26 drops following MIL-STD-810F-516.5-IV
Revised 12 March 2008. While every effort has been made to provide the most accurate information we advise that information in this document may contain technical inaccuracies or typographical errors. Commtest Instruments Ltd may at any time and without notice make improvements and/or changes to the products described.
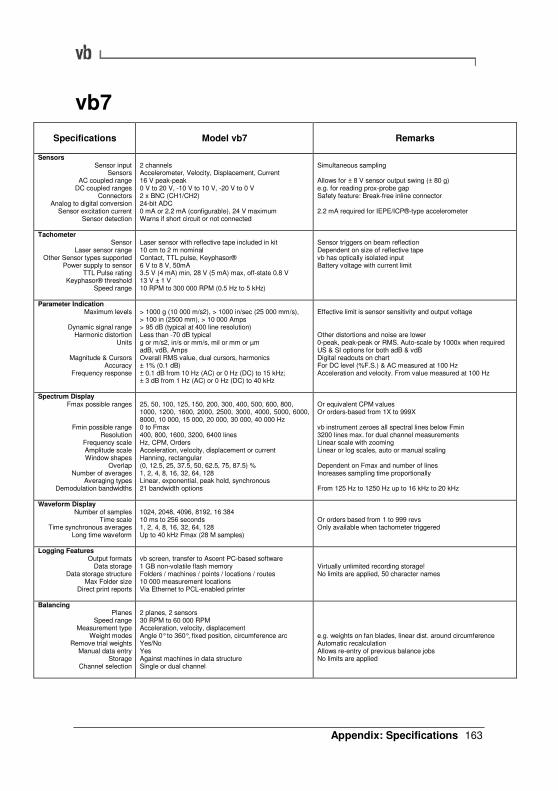
Appendix: Specifications
163
vb7
Specifications Model vb7 Remarks
Sensors Sensor input
Sensors AC coupled range
DC coupled ranges Connectors
Analog to digital conversion Sensor excitation current
Sensor detection
2 channels Accelerometer, Velocity, Displacement, Current 16 V peak-peak 0 V to 20 V, -10 V to 10 V, -20 V to 0 V 2 x BNC (CH1/CH2) 24-bit ADC 0 mA or 2.2 mA (configurable), 24 V maximum Warns if short circuit or not connected
Simultaneous sampling Allows for ± 8 V sensor output swing (± 80 g) e.g. for reading prox-probe gap Safety feature: Break-free inline connector 2.2 mA required for IEPE/ICP®-type accelerometer
Tachometer Sensor
Laser sensor range Other Sensor types supported
Power supply to sensor TTL Pulse rating
Keyphasor® threshold Speed range
Laser sensor with reflective tape included in kit 10 cm to 2 m nominal Contact, TTL pulse, Keyphasor® 6 V to 8 V, 50mA 3.5 V (4 mA) min, 28 V (5 mA) max, off-state 0.8 V 13 V ± 1 V 10 RPM to 300 000 RPM (0.5 Hz to 5 kHz)
Sensor triggers on beam reflection Dependent on size of reflective tape vb has optically isolated input Battery voltage with current limit
Parameter Indication Maximum levels
Dynamic signal range
Harmonic distortion Units
Magnitude & Cursors
Accuracy Frequency response
> 1000 g (10 000 m/s2), > 1000 in/sec (25 000 mm/s), > 100 in (2500 mm), > 10 000 Amps > 95 dB (typical at 400 line resolution) Less than -70 dB typical g or m/s2, in/s or mm/s, mil or mm or µm adB, vdB, Amps Overall RMS value, dual cursors, harmonics ± 1% (0.1 dB) ± 0.1 dB from 10 Hz (AC) or 0 Hz (DC) to 15 kHz; ± 3 dB from 1 Hz (AC) or 0 Hz (DC) to 40 kHz
Effective limit is sensor sensitivity and output voltage Other distortions and noise are lower 0-peak, peak-peak or RMS. Auto-scale by 1000x when required US & SI options for both adB & vdB Digital readouts on chart For DC level (%F.S.) & AC measured at 100 Hz Acceleration and velocity. From value measured at 100 Hz
Spectrum Display Fmax possible ranges
Fmin possible range Resolution
Frequency scale Amplitude scale Window shapes
Overlap Number of averages
Averaging types Demodulation bandwidths
25, 50, 100, 125, 150, 200, 300, 400, 500, 600, 800, 1000, 1200, 1600, 2000, 2500, 3000, 4000, 5000, 6000, 8000, 10 000, 15 000, 20 000, 30 000, 40 000 Hz 0 to Fmax 400, 800, 1600, 3200, 6400 lines Hz, CPM, Orders Acceleration, velocity, displacement or current Hanning, rectangular (0, 12.5, 25, 37.5, 50, 62.5, 75, 87.5) % 1, 2, 4, 8, 16, 32, 64, 128 Linear, exponential, peak hold, synchronous 21 bandwidth options
Or equivalent CPM values Or orders-based from 1X to 999X vb instrument zeroes all spectral lines below Fmin 3200 lines max. for dual channel measurements Linear scale with zooming Linear or log scales, auto or manual scaling Dependent on Fmax and number of lines Increases sampling time proportionally From 125 Hz to 1250 Hz up to 16 kHz to 20 kHz
Waveform Display Number of samples
Time scale Time synchronous averages
Long time waveform
1024, 2048, 4096, 8192, 16 384 10 ms to 256 seconds 1, 2, 4, 8, 16, 32, 64, 128 Up to 40 kHz Fmax (28 M samples)
Or orders based from 1 to 999 revs Only available when tachometer triggered
Logging Features Output formats
Data storage Data storage structure
Max Folder size Direct print reports
vb screen, transfer to Ascent PC-based software 1 GB non-volatile flash memory Folders / machines / points / locations / routes 10 000 measurement locations Via Ethernet to PCL-enabled printer
Virtually unlimited recording storage! No limits are applied, 50 character names
Balancing Planes
Speed range Measurement type
Weight modes Remove trial weights
Manual data entry Storage
Channel selection
2 planes, 2 sensors 30 RPM to 60 000 RPM Acceleration, velocity, displacement Angle 0° to 360°, fixed position, circumference arc Yes/No Yes Against machines in data structure Single or dual channel
e.g. weights on fan blades, linear dist. around circumference Automatic recalculation Allows re-entry of previous balance jobs No limits are applied
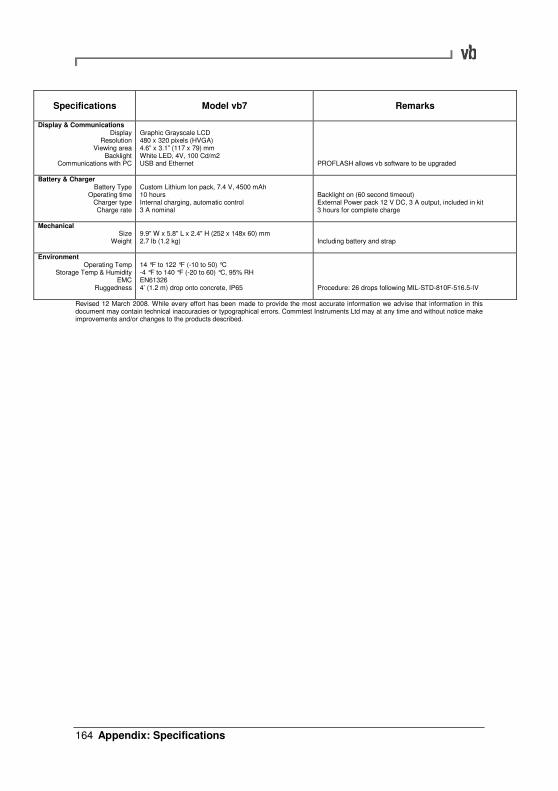
Appendix: Specifications 164
Specifications Model vb7 Remarks
Display & Communications Display
Resolution Viewing area
Backlight Communications with PC
Graphic Grayscale LCD 480 x 320 pixels (HVGA) 4.6” x 3.1” (117 x 79) mm White LED, 4V, 100 Cd/m2 USB and Ethernet
PROFLASH allows vb software to be upgraded
Battery & Charger Battery Type
Operating time Charger type Charge rate
Custom Lithium Ion pack, 7.4 V, 4500 mAh 10 hours Internal charging, automatic control 3 A nominal
Backlight on (60 second timeout) External Power pack 12 V DC, 3 A output, included in kit 3 hours for complete charge
Mechanical Size
Weight
9.9" W x 5.8" L x 2.4" H (252 x 148x 60) mm 2.7 lb (1.2 kg)
Including battery and strap
Environment Operating Temp
Storage Temp & Humidity EMC
Ruggedness
14 °F to 122 °F (-10 to 50) °C -4 °F to 140 °F (-20 to 60) °C, 95% RH EN61326 4’ (1.2 m) drop onto concrete, IP65
Procedure: 26 drops following MIL-STD-810F-516.5-IV
Revised 12 March 2008. While every effort has been made to provide the most accurate information we advise that information in this document may contain technical inaccuracies or typographical errors. Commtest Instruments Ltd may at any time and without notice make improvements and/or changes to the products described.
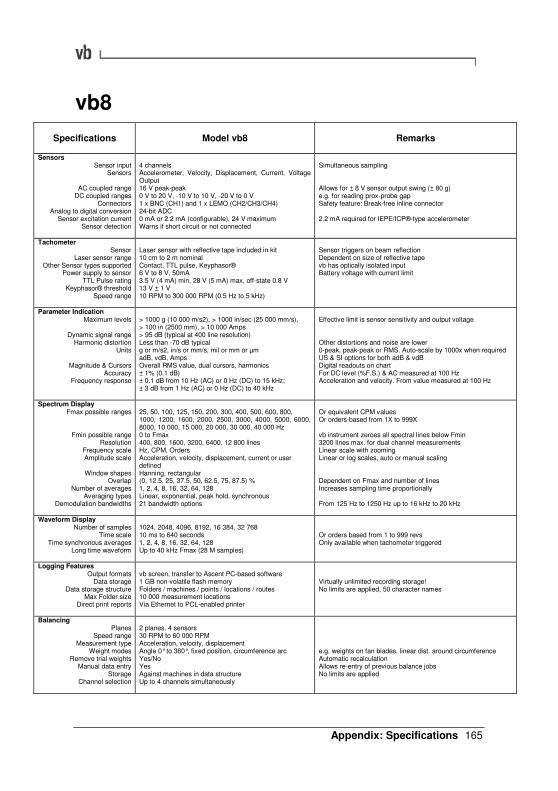
Appendix: Specifications
165
vb8
Specifications Model vb8 Remarks
Sensors Sensor input
Sensors
AC coupled range DC coupled ranges
Connectors Analog to digital conversion
Sensor excitation current Sensor detection
4 channels Accelerometer, Velocity, Displacement, Current, Voltage Output 16 V peak-peak 0 V to 20 V, -10 V to 10 V, -20 V to 0 V 1 x BNC (CH1) and 1 x LEMO (CH2/CH3/CH4) 24-bit ADC 0 mA or 2.2 mA (configurable), 24 V maximum Warns if short circuit or not connected
Simultaneous sampling Allows for ± 8 V sensor output swing (± 80 g) e.g. for reading prox-probe gap Safety feature: Break-free inline connector 2.2 mA required for IEPE/ICP®-type accelerometer
Tachometer Sensor
Laser sensor range Other Sensor types supported
Power supply to sensor TTL Pulse rating
Keyphasor® threshold Speed range
Laser sensor with reflective tape included in kit 10 cm to 2 m nominal Contact, TTL pulse, Keyphasor® 6 V to 8 V, 50mA 3.5 V (4 mA) min, 28 V (5 mA) max, off-state 0.8 V 13 V ± 1 V 10 RPM to 300 000 RPM (0.5 Hz to 5 kHz)
Sensor triggers on beam reflection Dependent on size of reflective tape vb has optically isolated input Battery voltage with current limit
Parameter Indication Maximum levels
Dynamic signal range
Harmonic distortion Units
Magnitude & Cursors
Accuracy Frequency response
> 1000 g (10 000 m/s2), > 1000 in/sec (25 000 mm/s), > 100 in (2500 mm), > 10 000 Amps > 95 dB (typical at 400 line resolution) Less than -70 dB typical g or m/s2, in/s or mm/s, mil or mm or µm adB, vdB, Amps Overall RMS value, dual cursors, harmonics ± 1% (0.1 dB) ± 0.1 dB from 10 Hz (AC) or 0 Hz (DC) to 15 kHz; ± 3 dB from 1 Hz (AC) or 0 Hz (DC) to 40 kHz
Effective limit is sensor sensitivity and output voltage Other distortions and noise are lower 0-peak, peak-peak or RMS. Auto-scale by 1000x when required US & SI options for both adB & vdB Digital readouts on chart For DC level (%F.S.) & AC measured at 100 Hz Acceleration and velocity. From value measured at 100 Hz
Spectrum Display Fmax possible ranges
Fmin possible range Resolution
Frequency scale Amplitude scale
Window shapes
Overlap Number of averages
Averaging types Demodulation bandwidths
25, 50, 100, 125, 150, 200, 300, 400, 500, 600, 800, 1000, 1200, 1600, 2000, 2500, 3000, 4000, 5000, 6000, 8000, 10 000, 15 000, 20 000, 30 000, 40 000 Hz 0 to Fmax 400, 800, 1600, 3200, 6400, 12 800 lines Hz, CPM, Orders Acceleration, velocity, displacement, current or user defined Hanning, rectangular (0, 12.5, 25, 37.5, 50, 62.5, 75, 87.5) % 1, 2, 4, 8, 16, 32, 64, 128 Linear, exponential, peak hold, synchronous 21 bandwidth options
Or equivalent CPM values Or orders-based from 1X to 999X vb instrument zeroes all spectral lines below Fmin 3200 lines max. for dual channel measurements Linear scale with zooming Linear or log scales, auto or manual scaling Dependent on Fmax and number of lines Increases sampling time proportionally From 125 Hz to 1250 Hz up to 16 kHz to 20 kHz
Waveform Display Number of samples
Time scale Time synchronous averages
Long time waveform
1024, 2048, 4096, 8192, 16 384, 32 768 10 ms to 640 seconds 1, 2, 4, 8, 16, 32, 64, 128 Up to 40 kHz Fmax (28 M samples)
Or orders based from 1 to 999 revs Only available when tachometer triggered
Logging Features Output formats
Data storage Data storage structure
Max Folder size Direct print reports
vb screen, transfer to Ascent PC-based software 1 GB non-volatile flash memory Folders / machines / points / locations / routes 10 000 measurement locations Via Ethernet to PCL-enabled printer
Virtually unlimited recording storage! No limits are applied, 50 character names
Balancing Planes
Speed range Measurement type
Weight modes Remove trial weights
Manual data entry Storage
Channel selection
2 planes, 4 sensors 30 RPM to 60 000 RPM Acceleration, velocity, displacement Angle 0° to 360°, fixed position, circumference arc Yes/No Yes Against machines in data structure Up to 4 channels simultaneously
e.g. weights on fan blades, linear dist. around circumference Automatic recalculation Allows re-entry of previous balance jobs No limits are applied

Appendix: Specifications 166
Specifications Model vb8 Remarks
Display & Communications Display
Resolution Viewing area
Backlight Communications with PC
Graphic Grayscale LCD 480 x 320 pixels (HVGA) 4.6” x 3.1” (117 x 79) mm White LED, 4V, 100 Cd/m2 USB and Ethernet
PROFLASH allows vb software to be upgraded
Battery & Charger Battery Type
Operating time Charger type Charge rate
Custom Lithium Ion pack, 7.4 V, 4500 mAh 10 hours Internal charging, automatic control 3 A nominal
Backlight on (60 second timeout) External Power pack 12 V DC, 3 A output, included in kit 3 hours for complete charge
Mechanical Size
Weight
9.9" W x 5.8" L x 2.4" H (252 x 148x 60) mm 2.7 lb (1.2 kg)
Including battery and strap
Environment Operating Temp
Storage Temp & Humidity EMC
Ruggedness
14 °F to 122 °F (-10 to 50) °C -4 °F to 140 °F (-20 to 60) °C, 95% RH EN61326 4’ (1.2 m) drop onto concrete, IP65
Procedure: 26 drops following MIL-STD-810F-516.5-IV
Revised 12 March 2008. While every effort has been made to provide the most accurate information we advise that information in this document may contain technical inaccuracies or typographical errors. Commtest Instruments Ltd may at any time and without notice make improvements and/or changes to the products described.
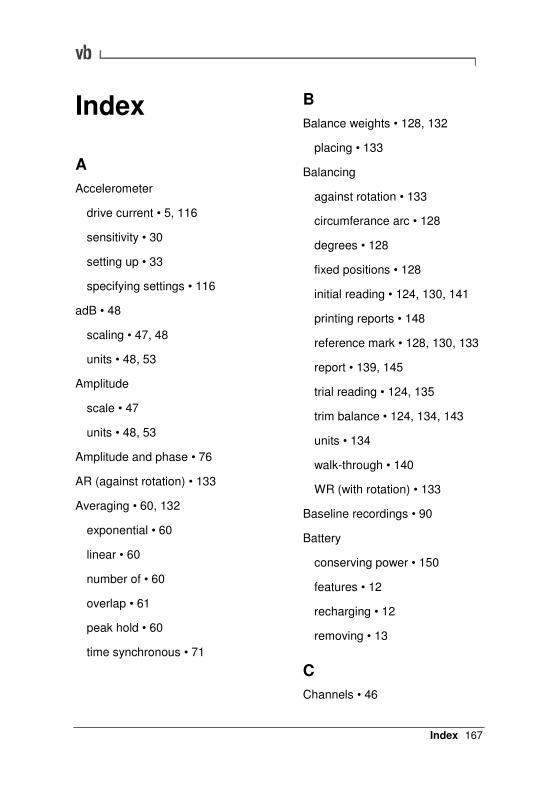
Index
167
Index
A
Accelerometer
drive current • 5, 116
sensitivity • 30
setting up • 33
specifying settings • 116
adB • 48
scaling • 47, 48
units • 48, 53
Amplitude
scale • 47
units • 48, 53
Amplitude and phase • 76
AR (against rotation) • 133
Averaging • 60, 132
exponential • 60
linear • 60
number of • 60
overlap • 61
peak hold • 60
time synchronous • 71
B
Balance weights • 128, 132
placing • 133
Balancing
against rotation • 133
circumferance arc • 128
degrees • 128
fixed positions • 128
initial reading • 124, 130, 141
printing reports • 148
reference mark • 128, 130, 133
report • 139, 145
trial reading • 124, 135
trim balance • 124, 134, 143
units • 134
walk-through • 140
WR (with rotation) • 133
Baseline recordings • 90
Battery
conserving power • 150
features • 12
recharging • 12
removing • 13
C
Channels • 46
Index 168
assigning sensors to • 57, 82
multi-channel measuring • 82, 83, 98
Charts • 42
scaling • 47, 48, 53
working with multiple charts • 46
zooming • 45
Zooming charts • 45
Copying items • 28, 114
Crosss channel phase • 76
Cursors • 43
D
Date and time • 146, 147
Deleting items • 115
all stored information • 122
folders • 110
notes • 121
recordings • 89, 106, 122
restoring • 110
routes • 107
sensors • 119
Delta • 43, 76
Demodulation • 66, 67, 70
bandwidth • 63
Drive current • 5, 116
E
Exponential averaging • 60
F
Fixed positions • 128
Fmax • 58, 59
equivalent Fmax • 62
Fmin • 59
Folders, defining, working with • 108, 110
transferring to the software • 92
H
Harmonic cursors • 43
I
Incompatible sensor • 116
Initial reading • 124, 141
Instrument capabilities by model • 3
Instrument I/O ports • 9
K
Keypad entries • 16, 80
Keyphasor • 36
L
LCD screen • 147, 149
Linear averaging • 60
Index
169
Log range • 47
M
Machines, defining, working with • 111
Measurements
measurements analyzing • 42
saving • 51
taking • 38, 39
Memory, capacity • 108, 152
available amount • 152
deleting all information • 122
freeing up • 152
use of • 59, 62
N
Notes • 120
O
Off-route recordings • 106
Orders • 50
Overall (power level) • 53, 90
Overlap percentage • 61
P
Parameter sets, defining, working with • 55, 56
Peak hold averaging • 60
Phase angles • 70, 74, 75, 76
PROFLASH, firmware upgrading • 153
R
Recordings
deleting • 89, 122
multi-channel • 82, 83
reviewing • 88
saving • 87
taking • 85
Report, balancing • 139, 145
Resetting the instrument • 155
Resolution • 59, 62
Revs, waveforms • 51
Routes, working with • 96
off-route recordings • 106
skipping route entries • 101
RPM, setting • 49
rpm displaying • 70
S
Sensors
bias voltage • 118
connecting • 31
mounting • 32, 33
sensitivity • 30
supported types • 30
Index 170
Settling time • 116
Spectral lines • 59
Strobe, using • 37
T
Tachometer • 34, 70
triggering • 60
Time synchronous averaging • 71
Trial reading • 124, 135
Trim balance • 124, 143
U
Upgrading the instrument • 153
V
vdB • 48
scaling • 47, 48
units • 47, 48
W
Windowing • 61
WR (with rotation) • 133