Embed Size (px)
Citation preview
Integrated Food Security Phase Classifi cation
Technical ManualVersion 1.1
The Integrated Food Security Phase Classification (IPC) Global Partners
Integrated Food Security Phase Classifi cation
Technical ManualVersion 1.1
Updates to this manual are available at: www.ipcinfo.org
IPC Global Partners:
Funding Agencies:
The European Union
The FAO-Netherlands Partnership Program
Version 1 of this manual was prepared by FAO/FSAU in 2006:
The Food and Agriculture Organization of the United Nations. Rome. 2008
Prepared by the IPC Global Partners
The designations employed and the presentation of material in this information product
do not imply the expression of any opinion whatsoever on the part of the Food and Ag-
riculture Organization of the United Nations, the IPC Global Partners and the European
Union concerning the legal or development status of any country, territory, city or area
or of its authorities, or concerning the delimitation of its frontiers or boundaries. The
views expressed in this publication are those of the author(s) and do not necessarily
refl ect the views of the Food and Agriculture Organization of the United Nations, the
IPC Global Partners, and the European Union.
All rights reserved. FAO encourages reproduction and dissemination of material in
this information product. Non-commercial uses will be authorized free of charge upon
request. Reproduction for resale or other commercial purposes, including educational
purposes, may incur fees. Applications for permission to reproduce or disseminate FAO
copyright materials and all other queries on rights and licences, should be addressed
by e-mail to [email protected] or to the Chief, Publishing Policy and Support Branch,
Offi ce of Knowledge Exchange, Research and Extension, FAO, Viale delle Terme di
Caracalla, 00153 Rome, Italy.
© FAO 2008
Reprinted 2009, 2010
Version 1 of this manual was originally prepared in 2006 by FAO/FSAU.
Please cite this previous version as : FAO/FSAU 2006. Integrated Food
Security and Humanitarian Phase Classifi cation: Technical Manual
Version 1. Nairobi, FAO/FSAU Technical Series IV
A revised version was published by FAO in 2007.
Please cite this current manual as:
IPC Global Partners. 2008. Integrated Food Security Phase Classifi cation Technical
Manual. Version 1.1. FAO. Rome.
ISBN: 978-92-5-106027-8
IPC Technical Manual Version 1.1 results from the joint effort of the IPC Global Partners, a group of eight agencies and international NGOs including: Care International, the Food and Agriculture Organization of the United Nations (FAO), the Famine Early Warning Systems Network (FEWS NET), the Joint Research Centre of the European Commission (EC-JRC), Oxfam Great Britain, Save the Children UK, Save the Children US, and the United Nations World Food Programme (WFP). IPC Technical Manual Version 1.1 is based on Version 1 which was prepared by FAO /FSAU. Revisions have been conducted on behalf of the IPC Global Partners by the IPC Technical Working Group composed of: Suleiman Mohamed (FEWSNET), Agnès Dhur (WFP), Valérie Ceylon (WFP), Nicholas Haan (FAO) and Cindy Holleman (FSAU/FAO). Nicholas Haan coordinated the revision process and edited this manual.
iii
ORIGINAL FOREWORD AND ACKNOWLEDGEMENTS MAY 2006
Since 1994, FSAU has been investing considerable energy in improving the rigour of the unit’s food security, nutrition,
and livelihoods analysis, and its relevance for decision making. To help meet the goals of rigor and relevance, FSAU
has been developing and using a tool called the Integrated Food Security and Humanitarian Phase Classifi cation (IPC)
since February 2004. In addition to consistently improving analysis and facilitating effective response in the context
of Somalia, there are strong indications that the IPC is relevant on a wider scale, as it serves as a “common currency”
for food security and humanitarian analysis.
This manual provides technical guidance on the use of the IPC for FSAU analysts and technical partners. It will hope-
fully contribute to on-going global efforts to standardize core elements of humanitarian analysis and response (e.g.,
the SMART, Benchmarking, Needs Analysis Framework, Humanitarian Tracking Service, and Sphere Project).
The IPC builds on aspects of many existing classifi cation systems and academic literature. The practical strength of
the IPC, however, is that it was developed through the everyday realities of conducting food security analysis and
linking it to action within the context of a complex emergency. In addition, IPC development has benefi ted from
technical feedback from expert practitioners and high level decision makers through dozens of forums in Africa,
Asia, Europe, and the USA. Appendix A lists just some of these meetings. We are extremely grateful for participants’
technical input.
Within FSAU, there has been an on-going technical dialogue on the IPC among all of our Nairobi based analysts in-
cluding: Noreen Prendiville, Cindy Holleman, Yusuf Mohamed, Ali Duale, Thomas Gabrielle, Simon Narbeth, Veena
Sam-pathkumar, Zainab Jama, James Kingori, Sicily Matu, Ahono Busili, Bernard Owadi, Tom Oguta, Achoka Luduba,
Carol Kingori and Francis Barasa. FSAU has a close partnership with FEWS NET Somalia, and both Mohamed Aw-
Dahir and Sidow Addou have been directly involved in the IPC development. FSAU fi eld staff has also made substantial
input. Special thanks to Cindy, Noreen, Thomas, and Veena for their technical editing of this manual.
Thank you to the FSAU technical partners from WFP, UNICEF, OCHA, SC-UK, CARE, the Somalia Transitional
Federal Government, authorities from Somaliland and Puntland, and numerous others for their technical input and
continued support towards the development and usage of the IPC. The Greater Horn of Africa Regional Food Se-
curity and Nutrition Working Group has provided valuable feedback and support for wider application of the IPC.
Wolfgang Herbinger and many other colleagues from WFP Rome have also made substantial contributions to the
IPC revisions.
Many warm thanks to FAO colleagues for their technical insight and continued support, including Prabhu Pingali,
Anne Bauer, Margarita Flores, Mark Smulders, Luca Alinovi, Richard China, Graham Farmer, Daniele Donati,
Guenter Hemrich, Suzanne Raswant, Giovanni Simonelli, Alessandro DeMatteis, Florence Egal, Henri Josserand,
Shukri Ahmed, and Christian Lovendal.
And lastly, many thanks to the FSAU donors, the European Commission and the United States Agency for International
Development, for their ongoing commitment to FSAU and encouragement to develop new ideas.
Nicholas Haan, Ph.D.
Author
FAO Chief Technical Advisor to the FSAU
Nairobi, Kenya, May 2006
v
2ND FOREWORD AND ACKNOWLEDGEMENTSMAY 2008
This IPC Technical Manual Version 1.1 is a revision and update of the original IPC Manual Version 1 issued in 2006.
Version 1.1 introduces priority revisions and clarifi es key concepts arising from extensive fi eld testing and inter-
agency technical consultations. IPC users are encouraged to adopt the revisions documented in this revised version.
Following the release of Version 1.1, a more comprehensive revision of the IPC Manual will be prepared in 2009,
resulting in a Version 2 of the manual. Visit the IPC website at www.ipcinfo.org for a list of priority revisions and an
action plan for Version 2.
Appendix H provides further explanations of the rationale for and usage of revisions introduced in Version 1.1. The
text of the manual has been updated to refl ect these revisions. Users are notifi ed where revisions have been made with
“call-out boxes” entitled “Revision”, and advised to go to Appendix H for further explanations.
Revisions include:
• changing the name from the “Integrated Food Security and Humanitarian Phase Classifi cation” to the “Inte-
grated Food Security Phase Classifi cation”
• adding an optional division of Phase 1 into two phases: Phase 1A and 1B. This is a provisional solution towards
the future development and insertion of a Phase between the current Phase 1 and 2.
• changing the name of Phase 2 from “Chronically Food Insecure” to “Moderately/Borderline Food Insecure”
• changing the terminology from “Early Warning Levels” to “Risk of Worsening Phase”
• making changes to the design of the Analysis Templates
• making changes in the cartographic protocols
Section 3 of the IPC Manual has been updated with several new sections that clarify key issues.
Areas for Clarifi cation include:
• Focus of the IPC
• Analysis Process
• Data Adequacy and Reliability
• When and how often to do IPC analysis
• Time Horizon for IPC analysis
• Early Warning
• Inclusion of “imminent” in the Phase Classifi cation
• Spatial scale of analysis
• Under 5 mortality rate
• Institutional ownership and processes
• Core elements of an “IPC analysis”
Interest and support for the IPC as a common classifi cation framework for food security situation analysis continues
to gain momentum among government, UN, NGO, donor, and academic organizations. The IPC has been introduced
in several parts of Africa, Asia, Central America, and the Caribbean. This ranges from full implementation to pilot
exercises to training activities. For more details on specifi c country experiences visit www.ipcinfo.org.
A number of food security-oriented agencies have formed an initial global partnership for the further development
and roll-out of the IPC. These include: FAO, WFP, USAID-funded FEWS NET, Oxfam GB, CARE, Save the Children
UK, Save the Children US, and the Joint Research Center of the European Union. Together with national governments,
these international agencies and many others at the regional and national level are collaborating on the development
and roll-out of the IPC. The IPC roll-out will be a demand-driven process, and its further development will be driven
by country experiences and feedback.
vi
There is a need to ensure that the IPC can accommodate a wide variety of country and institutional settings. Innova-
tive ideas on how to improve the rigor and user-friendliness of the IPC are constantly generated each time the IPC is
applied. Version 1.1 is based on extensive feedback from technical experts in countries involved in the IPC roll-out.
In addition to country implementation feedback, revisions are based on technical discussions which took place during
the IPC On-Line Forum (a month-long web based discussion on the IPC held in February 2007), an IPC International
Workshop in Rome in March 2007, direct feedback from IPC global partner agencies, and consultations with the
Greater Horn of Africa Regional Food Security and Nutrition Working Group. Numerous technical experts in the
nutrition and food security community have also made contributions.
The revisions refl ect the strong consensus between national governments and partner agencies who have been consulted
so far, and have been endorsed by the IPC Global Partner agencies.
The efforts of the following members of the global IPC Technical Working Group are highly appreciated:
Suleiman Mohamed FEWSNET Regional Representative
Agnès Dhur Senior Food Security Offi cer
Valérie Ceylon Programme Adviser
Nicholas Haan FAO Senior IPC Technical Advisor
Cindy Holleman FAO Chief Technical Advisor to the FSAU
The inputs from the many people who have contributed feedback to this Addendum are greatly appreciated.
For further information on the IPC including technical support, country reports, and contact information, visit:
www.ipcinfo.org
May 2008
The Global IPC Steering Committee:
Care International
Food and Agriculture Organization of the United Nations (FAO)
Famine Early Warning Systems Network (FEWS NET)
Joint Research Center of the European Commission (EC-JRC)
Oxfam Great Britain
Save the Children UK
Save the Children US
United Nations World Food Programme (WFP)
vii
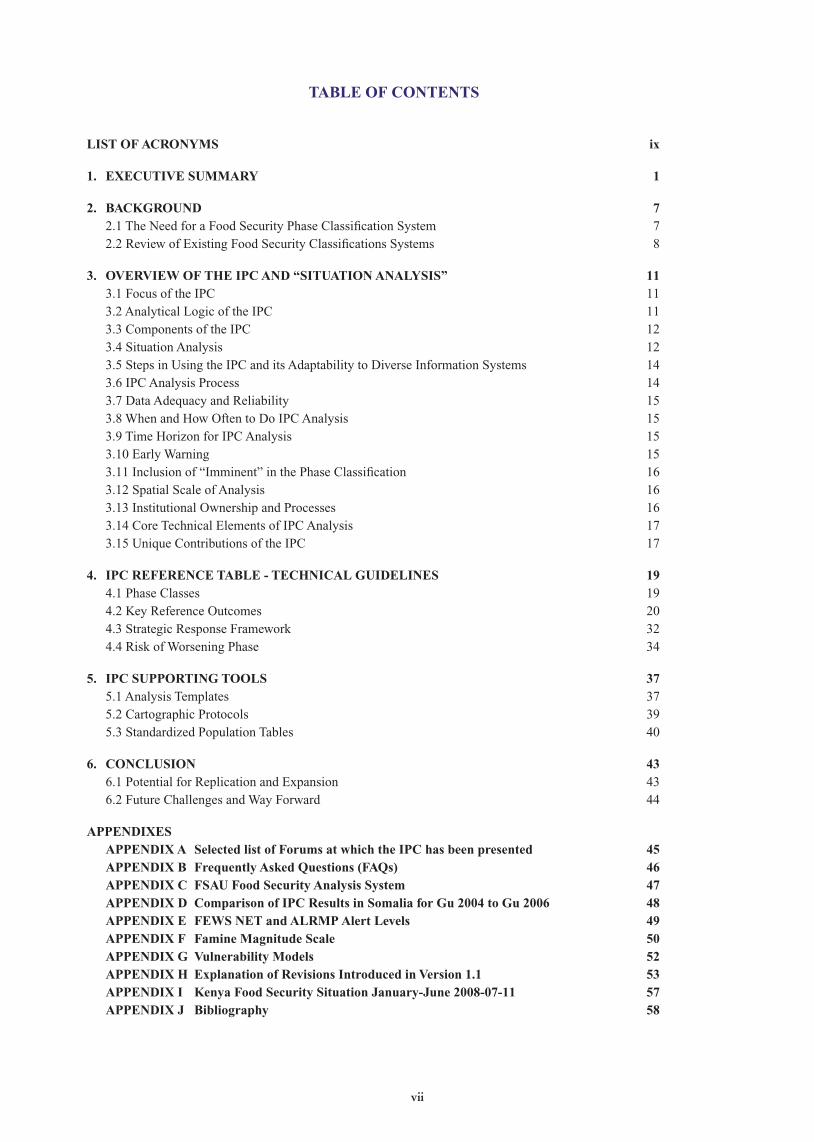
TABLE OF CONTENTS
LIST OF ACRONYMS ix
1. EXECUTIVE SUMMARY 1
2. BACKGROUND 72.1 The Need for a Food Security Phase Classifi cation System 7
2.2 Review of Existing Food Security Classifi cations Systems 8
3. OVERVIEW OF THE IPC AND “SITUATION ANALYSIS” 113.1 Focus of the IPC 11
3.2 Analytical Logic of the IPC 11
3.3 Components of the IPC 12
3.4 Situation Analysis 12
3.5 Steps in Using the IPC and its Adaptability to Diverse Information Systems 14
3.6 IPC Analysis Process 14
3.7 Data Adequacy and Reliability 15
3.8 When and How Often to Do IPC Analysis 15
3.9 Time Horizon for IPC Analysis 15
3.10 Early Warning 15
3.11 Inclusion of “Imminent” in the Phase Classifi cation 16
3.12 Spatial Scale of Analysis 16
3.13 Institutional Ownership and Processes 16
3.14 Core Technical Elements of IPC Analysis 17
3.15 Unique Contributions of the IPC 17
4. IPC REFERENCE TABLE - TECHNICAL GUIDELINES 194.1 Phase Classes 19
4.2 Key Reference Outcomes 20
4.3 Strategic Response Framework 32
4.4 Risk of Worsening Phase 34
5. IPC SUPPORTING TOOLS 375.1 Analysis Templates 37
5.2 Cartographic Protocols 39
5.3 Standardized Population Tables 40
6. CONCLUSION 436.1 Potential for Replication and Expansion 43
6.2 Future Challenges and Way Forward 44
APPENDIXESAPPENDIX A Selected list of Forums at which the IPC has been presented 45APPENDIX B Frequently Asked Questions (FAQs) 46APPENDIX C FSAU Food Security Analysis System 47APPENDIX D Comparison of IPC Results in Somalia for Gu 2004 to Gu 2006 48APPENDIX E FEWS NET and ALRMP Alert Levels 49APPENDIX F Famine Magnitude Scale 50APPENDIX G Vulnerability Models 52APPENDIX H Explanation of Revisions Introduced in Version 1.1 53APPENDIX I Kenya Food Security Situation January-June 2008-07-11 57APPENDIX J Bibliography 58
viii
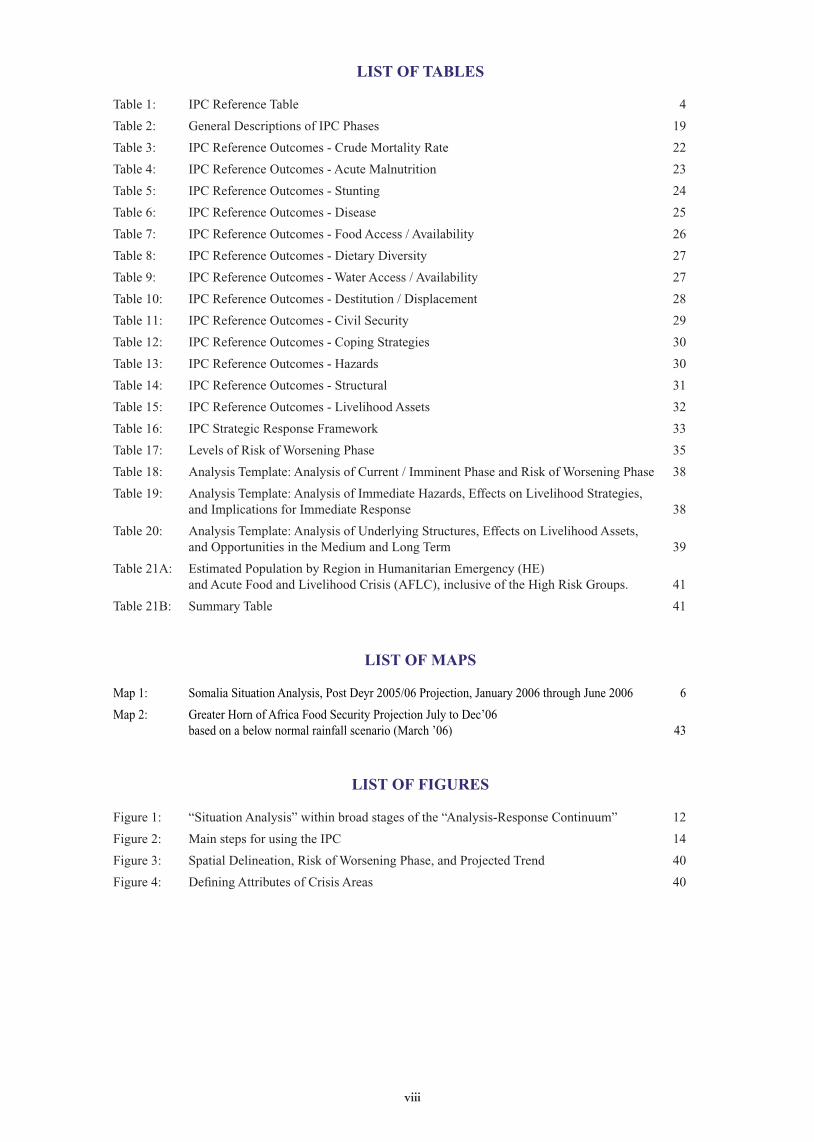
LIST OF TABLES
Table 1: IPC Reference Table 4
Table 2: General Descriptions of IPC Phases 19
Table 3: IPC Reference Outcomes - Crude Mortality Rate 22
Table 4: IPC Reference Outcomes - Acute Malnutrition 23
Table 5: IPC Reference Outcomes - Stunting 24
Table 6: IPC Reference Outcomes - Disease 25
Table 7: IPC Reference Outcomes - Food Access / Availability 26
Table 8: IPC Reference Outcomes - Dietary Diversity 27
Table 9: IPC Reference Outcomes - Water Access / Availability 27
Table 10: IPC Reference Outcomes - Destitution / Displacement 28
Table 11: IPC Reference Outcomes - Civil Security 29
Table 12: IPC Reference Outcomes - Coping Strategies 30
Table 13: IPC Reference Outcomes - Hazards 30
Table 14: IPC Reference Outcomes - Structural 31
Table 15: IPC Reference Outcomes - Livelihood Assets 32
Table 16: IPC Strategic Response Framework 33
Table 17: Levels of Risk of Worsening Phase 35
Table 18: Analysis Template: Analysis of Current / Imminent Phase and Risk of Worsening Phase 38
Table 19: Analysis Template: Analysis of Immediate Hazards, Effects on Livelihood Strategies,
and Implications for Immediate Response 38
Table 20: Analysis Template: Analysis of Underlying Structures, Effects on Livelihood Assets,
and Opportunities in the Medium and Long Term 39
Table 21A: Estimated Population by Region in Humanitarian Emergency (HE)
and Acute Food and Livelihood Crisis (AFLC), inclusive of the High Risk Groups. 41
Table 21B: Summary Table 41
LIST OF MAPS
Map 1: Somalia Situation Analysis, Post Deyr 2005/06 Projection, January 2006 through June 2006 6
Map 2: Greater Horn of Africa Food Security Projection July to Dec’06
based on a below normal rainfall scenario (March ’06) 43
LIST OF FIGURES
Figure 1: “Situation Analysis” within broad stages of the “Analysis-Response Continuum” 12
Figure 2: Main steps for using the IPC 14
Figure 3: Spatial Delineation, Risk of Worsening Phase, and Projected Trend 40
Figure 4: Defi ning Attributes of Crisis Areas 40
ix
LIST OF ACRONYMS
ACF Action Against Hunger (Action Contre la Faim)
ALRMP Arid Lands Resource Management Project
ALRMP ALRMP Associated Press
BBC British Broadcasting Corporation
CAP Consolidated Appeal Process
CDC Center for Disease Control
CILSS Committee for Drought Control in the Sahel
(Comité Inter-Etats de Lutte Contre la Sécheresse au Sahel)
CILSS Committee for Drought Control in the Sahel
CMR Crude Mortality Rate
CNN Cable News Network
CSI Coping Strategies Index
DFID UK Department for International Development
EC European Commission
EFNA Emergency Food Needs Assessment
FANTA USAID Food and Nutrition Technical Assistance
FAO Food and Agriculture Organization of the United Nations
FAQs Frequently Asked Questions
FEWS NET Famine Early Warning Systems Network.
FIVIMS Food Insecurity and Vulnerability Information and Mapping Systems
FNPP FAO/Netherlands Partnership Programme
FSAS Food Security Analysis System
FSAU Food Security Analysis Unit - Somalia
GAM Global Acute Malnutrition
GHA Greater Horn of Africa
GIEWS Global Information Early Warning System
HEA Household Economy Approach
HPG Humanitarian Policy Group
IASC UN Inter-agency Standing Committee
ICRC International Committee of the Red Cross
IDS Institute of Development Studies
IPC Integrated Food Security and Humanitarian Phase Classifi cation
IRIN Integrated Regional Information Networks
Kcal Kilo calories
LRRD Linking Relief, Recovery, and Development
LUCC Land Use and Land Cover Change
MSF Medecins Sans Frontieres (Doctors Without Borders)
MUAC Mid-Upper Arm Circumference
NAF Needs Analysis Framework
NGO Non-governmental Organization
ODI Overseas Development Institute
SCF - UK Save the Children - United Kingdom
SCN - UN Standing Committee on Nutrition
SENAC Strengthening Emergency Needs Assessment Capacity
SLA Sustainable Livelihoods Approach
SMART Standardized Monitoring and Assessment of Relief and Transitions
UN/OCHA United Nations Offi ce for the Coordination of Humanitarian Affairs
UNAIDS The Joint United Nations Programme on HIV/AIDS
UNDP United Nations Development Programme
UNHCR United Nations High Commissioner for Refugees
UNICEF United Nations Children’s Fund
USAID United States Agency for International Development
VOA Voice of America
WFP United Nations World Food Programme
WFS World Food Summit
1
1. EXECUTIVE SUMMARY
Within the cross-cutting fi eld of food security analysis there are increasingly strong calls for improved analysis. These
include: the greater comparability of results from one place to another, increased rigour, greater transparency
of evidence to support fi ndings, increased relevance to strategic decision making, and stronger linkages between
information and action. Improving analysis along these lines would enable food security and humanitarian interventions
to be more needs-based, strategic, and timely.
Central to meeting these challenges is the development of a classifi cation system that is generic enough to be utilized
in a vast array of food security situations, disaster types, and livelihood systems; simple enough to be practical in the
fi eld and understood by multiple stakeholders; and rigorous enough to meet international standards.
Since February 2004, the Food Security Analysis Unit for Somalia (FSAU1) has been using and progressively developing
a tool to meet these challenges called the Integrated Food Security Phase Classifi cation (IPC2). Drawing from
extensive literature on international humanitarian guidelines, aspects of existing classifi cation systems, and in situ
analysis of food security in Somalia, the IPC has consistently proven to improve analysis and enable more effective
response.
Since the original release of the IPC manual in 2006, many countries in Africa, Asia, and Central America have
introduced the IPC for improved food security analysis. Based on these fi eld experiences, and wider technical
consultations among governments, UN agencies, donors, NGOs, and academic agencies, this revised IPC Manual
Version 1.1 introduces key structural changes and provides clarifi cation on select issues. See the foreword of this
Version 1.1 for a summary of these revisions and clarifi cations.
The IPC is a set of protocols for consolidating and summarizing Situation Analysis, a distinct, yet often overlooked
(or assumed) stage of the food security analysis-response continuum. Situation Analysis is a foundation stage where
the fundamental aspects (severity, causes, magnitude, etc.) of a situation are identifi ed. These aspects have received
an optimal broad-based consensus from key stakeholders including governments, UN agencies and NGOs, donors,
the media, and target communities.
The analytical logic of the IPC is that varying phases of food security and humanitarian situations are classifi ed based
on outcomes on lives and livelihoods. Outcomes are a function of both immediate hazard events and underlying causes,
as well as the specifi c vulnerabilities of livelihood systems (including both livelihood assets and livelihood strategies).
The outcomes are referenced against internationally accepted standards, and their convergence substantiates a phase
classifi cation for any given area. Each phase is associated with a unique strategic response framework, while the
outcome confi guration for any given situation guides the creation of a tailored response unique to that situation. While
the phase classifi cation describes the current or imminent situation for a given area, levels of Risk for Worsening Phase
are a predictive tool to communicate the likelihood and severity of a potential further deterioration of the situation
beyond the Phase Classifi cation itself.
The IPC consists of four components including the Reference Table, Analysis Templates, Cartographic Protocols
and Population Tables.
The IPC Reference Table guides analysis for both the Phase Classifi cation and Risk of Worsening Phase. The
Phase Classifi cation is divided into fi ve Phases - Generally Food Secure (1A and 1B), Moderately/Borderline Food
Insecure, Acute Food and Livelihood Crisis, Humanitarian Emergency, and Famine/Humanitarian Catastrophe.
The fi ve phases are general enough to accommodate a wide range of causes, livelihood systems, and political/economic
contexts - yet their distinction captures essential differences in implications for action (including strategic design,
urgency, and ethical imperative).
Each Phase is linked to a comprehensive set of Key Reference Outcomes on human welfare and livelihoods which
guide the classifi cation. These include: crude mortality rate, acute malnutrition, disease, food access/availability, dietary diversity, water access/availability, destitution and displacement, civil security, coping, and livelihood assets.
The breadth of outcomes enables triangulation and ensures the adaptability of the IPC to a wide variety of situations.
Referencing outcomes to international standards ensures comparability and consistency of the phase classifi cation in
different countries and contexts.
executive summ
ary
Footnotes:
1 FSAU is implemented by the Food and Agriculture Organization of the United Nations (FAO), and funded by the European Commission (EC) and the United States
Agency for International Development (USAID)2 IPC is a short-hand acronym including the terms integrated phase classifi cation..
2
Each Phase is also linked to a tailored Strategic Response Framework that provides strategic, non-prescriptive
guidance to achieve three objectives: (1) mitigate immediate negative outcomes, (2) support livelihoods, and (3)
address underlying/structural causes.
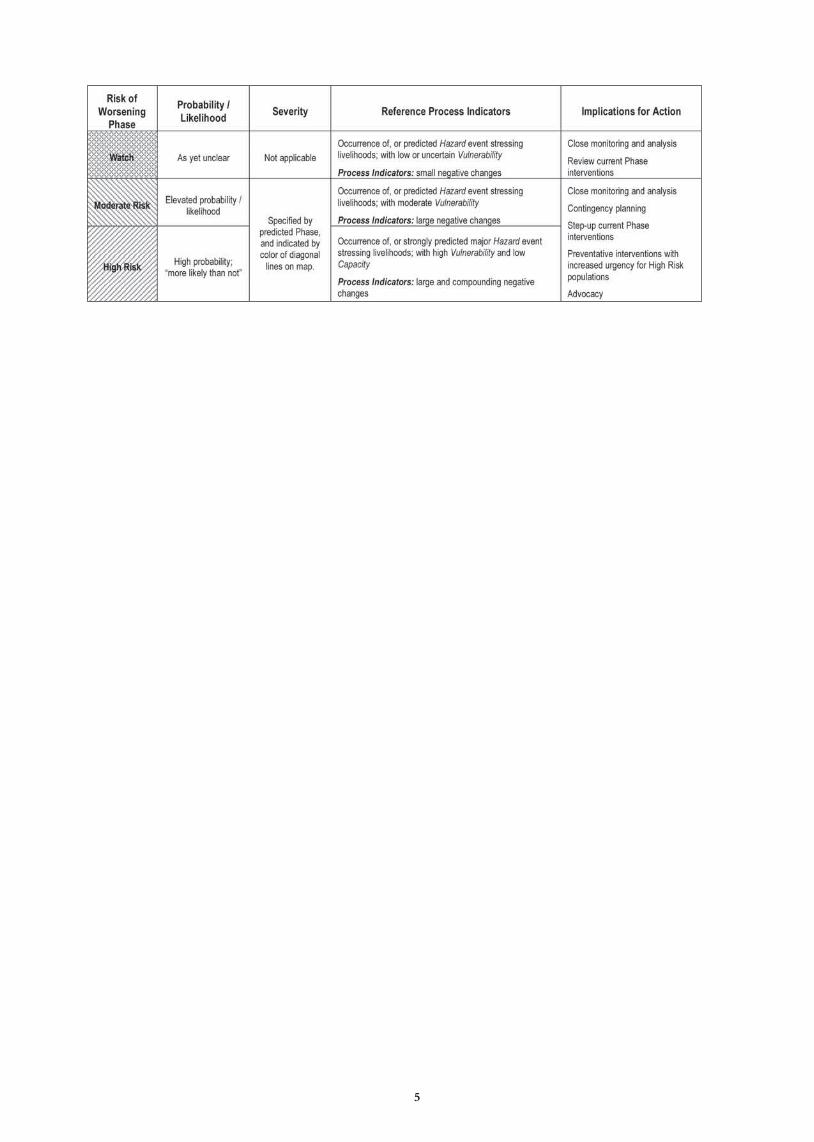
The Reference Table also includes three levels for Risk of Worsening Phase: (1) Watch, (2) Moderate Risk, (3) High
Risk. Each of these is associated with key information required for the effective early warning of a potential further
deterioration of the situation: Probability, Severity, Reference Indicators, Implications for Action, and Timeline.
The Analysis Templates are tables which organize key pieces of information in a transparent manner. They facilitate
analysis to substantiate a Phase Classifi cation and guide response analysis. The Cartographic Protocols are a set of
standardized mapping and visual communication conventions which are designed to effectively convey key information
concerning situation analysis on a single map. The Population Tables are a means to consistently and effectively
communicate population estimates by administrative boundaries, livelihood systems, and livelihood types.
The IPC is not an assessment method, per se, but a classifi cation system and a set of protocols for Situation Analysis
that integrate multiple data sources, methods, and analyses (options for specifi c assessment methodologies include
those endorsed by WFP, ICRC, Save the Children UK, and many others). Effective use of the IPC encourages a mixed-
method approach which is obligatory given the complexity of the analysis and the need for triangulation. In this manner,
the IPC gives a consistent and meaningful structure to the fi nal statement. To substantiate an IPC statement, whatever
the specifi c methodologies used, the legitimacy of data sources and analytical methods is rigorously evaluated and
refl ected in the overall confi dence level.
The IPC does not replace existing food security information systems or methodologies. It is a complimentary “add-
on” that draws from and provides focus to existing analytical systems, enables comparability, and explicitly links
analysis to action. The IPC can be adapted to a broad range of information systems with regards to data availability,
methodological approach, and human capacity.
The IPC emphasizes food security analysis through a livelihoods approach, but recognizes that it is impossible to
separate food insecurity from associated sectoral crises in the fi elds of health, water, protection, sanitation, shelter,
and others. There is highly dynamic interplay between these sectors; deteriorating situations often co-exist, and stress
on one most likely leads to stresses on others.
Thus, the IPC emphasizes food security analysis while integrating related humanitarian concerns. The IPC is not
meant, however, to substitute for a more refi ned analysis of any particular sector.
The IPC draws together and seeks to integrate:
• aspects of existing classifi cation systems
• the breadth of food security phases, not just emergency situations
• food security and nutrition
• lives and livelihoods
• process indicators and outcomes
• information and action
• relief, rehabilitation, recovery, and development
• immediate and longer term perspectives
• concepts and practice
• academic standards and fi eld practicalities
• accountability of analysis and response
Both within Somalia and the Greater Horn of Africa, the IPC has proven to be an effective means for communicating
complex analysis to UN agencies, NGOs, governments, donors and media. It has been consistently demonstrated
to increase technical consensus, comparability over space and time, transparency through evidence-based analysis,
accountability, and the effectiveness of early warning and strategic response.
exec
utiv
e su
mm
ary
Perhaps most importantly, the IPC provides a much needed
common currency for food security analysis.
3
In the context of the FSAU, the IPC fi ts within the overall conceptual, operational, and analytic framework of the Food
Security Analysis System (FSAS), as a means of conducting multi-faceted aspects of food security analysis through
a livelihoods and evidence-based approach3 (see diagram in Appendix C).
The highly dynamic and complex nature of food security analysis in the context of Somalia has provided a vibrant
“developing-ground” for the IPC - with multiple livelihood systems ranging from cropping to fi shing to pastoral-
ism, and a variety of hazards ranging from fl oods to drought to civil insecurity to the Tsunami (FSAU 2005). Most
importantly, the IPC has been developed in-situ - drawing from academic literature and international guidelines,
but driven fi rst and foremost by the realities of conducting food security analysis on a day-to-day basis and linking
information to action (see Appendix D).
Overall, this technical manual has three main objectives:
(1) to provide technical guidance on the use of the IPC for food security and humanitarian analysis
(2) to contribute to global developments related to improving and standardizing food security and humanitarian
analysis
(3) to solicit feedback on from the broad food security and humanitarian community to inform the development
of future versions of the manual.
The manual begins with a discussion of why a common classifi cation system is needed as well as a brief review of
existing classifi cation systems. The manual also provides technical details of the concepts and use of the IPC, and
ends with a discussion on the potential for the broader applicability of the IPC to other country, regional, and global
contexts and future challenges.
Footnotes:
3 FSAU’s Food Security Analysis System (FSAS) is an overarching framework to integrate conceptual, analytical, and operational components of food security analysis
through a livelihoods approach. Core analytical components of the FSAS include: Baseline Livelihoods Analysis, Seasonal Food Security Projections, Emergency Food
Security and Nutrition Assessments, Key Indicator Monitoring, Nutrition Analysis, and Applied Research. Other core components include: Information Management
System, Communication Strategy, Management, and Partner Networking. Core analytical sectors include: climate, agriculture, livestock, markets, nutrition, and civil
security (FSAU 2004b). For more details visit www.fsausomali.org
executive summ
ary
4
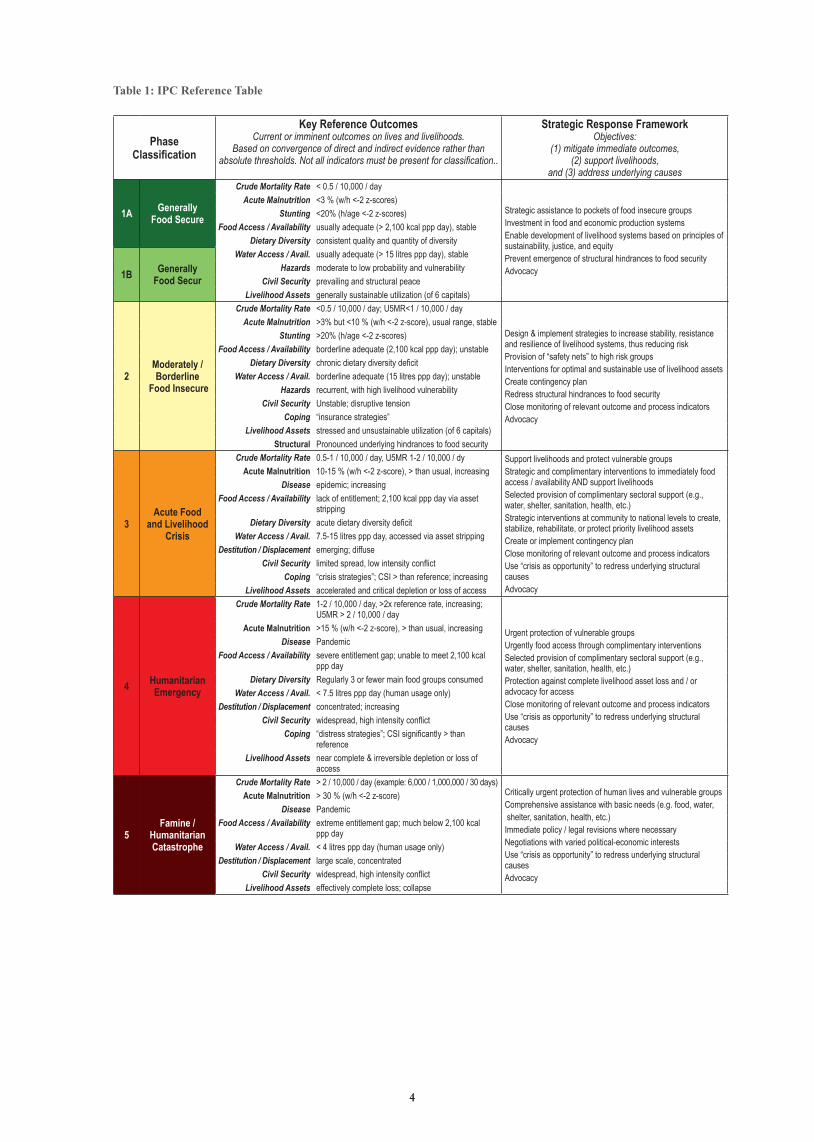
Table 1: IPC Reference Table
PhaseClassifi cation
Key Reference OutcomesCurrent or imminent outcomes on lives and livelihoods.
Based on convergence of direct and indirect evidence rather than absolute thresholds. Not all indicators must be present for classifi cation..
Strategic Response Framework Objectives:
(1) mitigate immediate outcomes, (2) support livelihoods,
and (3) address underlying causes
1A Generally Food Secure
Crude Mortality Rate < 0.5 / 10,000 / day
Strategic assistance to pockets of food insecure groupsInvestment in food and economic production systemsEnable development of livelihood systems based on principles of sustainability, justice, and equityPrevent emergence of structural hindrances to food securityAdvocacy
Acute Malnutrition <3 % (w/h <-2 z-scores)Stunting <20% (h/age <-2 z-scores)
Food Access / Availability usually adequate (> 2,100 kcal ppp day), stableDietary Diversity consistent quality and quantity of diversity
1B Generally Food Secur
Water Access / Avail. usually adequate (> 15 litres ppp day), stableHazards moderate to low probability and vulnerability
Civil Security prevailing and structural peaceLivelihood Assets generally sustainable utilization (of 6 capitals)
2Moderately / Borderline
Food Insecure
Crude Mortality Rate <0.5 / 10,000 / day; U5MR<1 / 10,000 / day
Design & implement strategies to increase stability, resistance and resilience of livelihood systems, thus reducing riskProvision of “safety nets” to high risk groupsInterventions for optimal and sustainable use of livelihood assetsCreate contingency planRedress structural hindrances to food securityClose monitoring of relevant outcome and process indicatorsAdvocacy
Acute Malnutrition >3% but <10 % (w/h <-2 z-score), usual range, stableStunting >20% (h/age <-2 z-scores)
Food Access / Availability borderline adequate (2,100 kcal ppp day); unstableDietary Diversity chronic dietary diversity defi cit
Water Access / Avail. borderline adequate (15 litres ppp day); unstableHazards recurrent, with high livelihood vulnerability
Civil Security Unstable; disruptive tensionCoping “insurance strategies”
Livelihood Assets stressed and unsustainable utilization (of 6 capitals)Structural Pronounced underlying hindrances to food security
3Acute Food
and Livelihood Crisis
Crude Mortality Rate 0.5-1 / 10,000 / day, U5MR 1-2 / 10,000 / dy Support livelihoods and protect vulnerable groupsStrategic and complimentary interventions to immediately food access / availability AND support livelihoodsSelected provision of complimentary sectoral support (e.g., water, shelter, sanitation, health, etc.)Strategic interventions at community to national levels to create, stabilize, rehabilitate, or protect priority livelihood assetsCreate or implement contingency planClose monitoring of relevant outcome and process indicatorsUse “crisis as opportunity” to redress underlying structural causesAdvocacy
Acute Malnutrition 10-15 % (w/h <-2 z-score), > than usual, increasingDisease epidemic; increasing
Food Access / Availability lack of entitlement; 2,100 kcal ppp day via asset stripping
Dietary Diversity acute dietary diversity defi citWater Access / Avail. 7.5-15 litres ppp day, accessed via asset stripping
Destitution / Displacement emerging; diffuseCivil Security limited spread, low intensity confl ict
Coping “crisis strategies”; CSI > than reference; increasingLivelihood Assets accelerated and critical depletion or loss of access
4 Humanitarian Emergency
Crude Mortality Rate 1-2 / 10,000 / day, >2x reference rate, increasing; U5MR > 2 / 10,000 / day
Urgent protection of vulnerable groupsUrgently food access through complimentary interventionsSelected provision of complimentary sectoral support (e.g., water, shelter, sanitation, health, etc.)Protection against complete livelihood asset loss and / or advocacy for accessClose monitoring of relevant outcome and process indicatorsUse “crisis as opportunity” to redress underlying structural causesAdvocacy
Acute Malnutrition >15 % (w/h <-2 z-score), > than usual, increasingDisease Pandemic
Food Access / Availability severe entitlement gap; unable to meet 2,100 kcal ppp day
Dietary Diversity Regularly 3 or fewer main food groups consumedWater Access / Avail. < 7.5 litres ppp day (human usage only)
Destitution / Displacement concentrated; increasingCivil Security widespread, high intensity confl ict
Coping “distress strategies”; CSI signifi cantly > than reference
Livelihood Assets near complete & irreversible depletion or loss of access
5Famine /
HumanitarianCatastrophe
Crude Mortality Rate > 2 / 10,000 / day (example: 6,000 / 1,000,000 / 30 days)Critically urgent protection of human lives and vulnerable groupsComprehensive assistance with basic needs (e.g. food, water, shelter, sanitation, health, etc.)Immediate policy / legal revisions where necessaryNegotiations with varied political-economic interestsUse “crisis as opportunity” to redress underlying structural causesAdvocacy
Acute Malnutrition > 30 % (w/h <-2 z-score)Disease Pandemic
Food Access / Availability extreme entitlement gap; much below 2,100 kcal ppp day
Water Access / Avail. < 4 litres ppp day (human usage only)Destitution / Displacement large scale, concentrated
Civil Security widespread, high intensity confl ictLivelihood Assets effectively complete loss; collapse
5
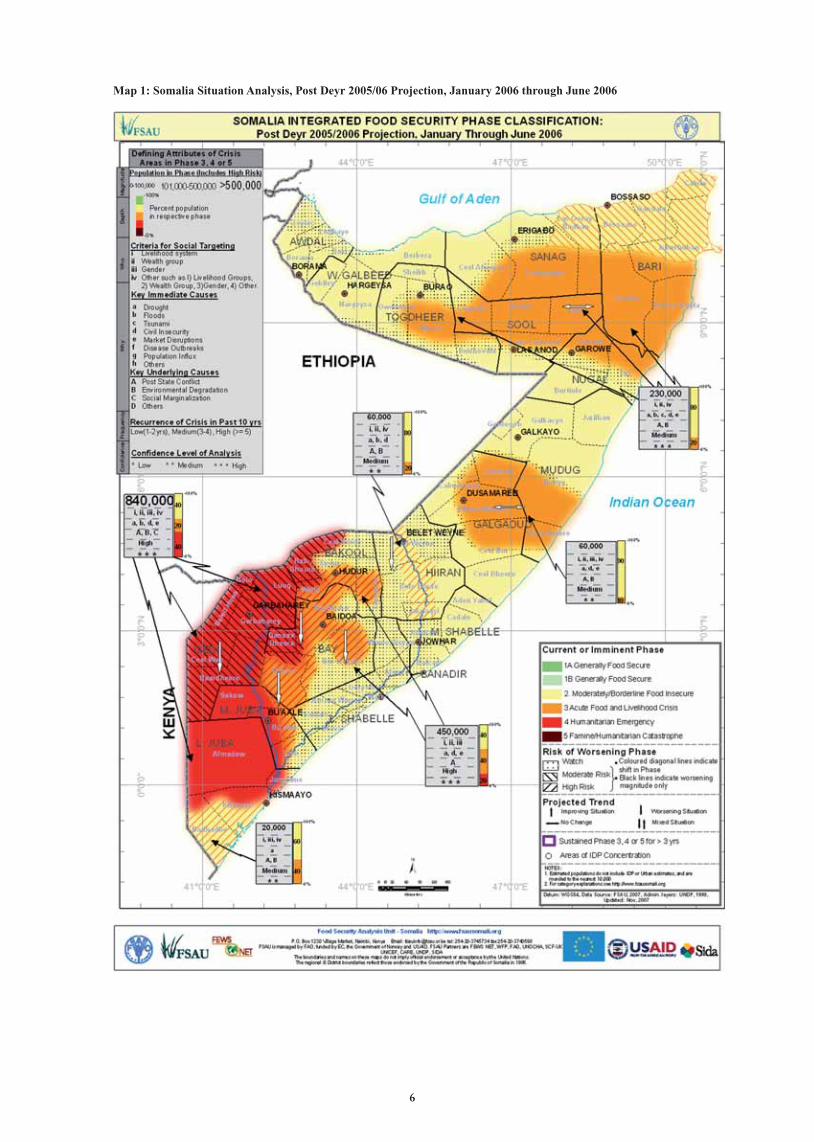
6
Map 1: Somalia Situation Analysis, Post Deyr 2005/06 Projection, January 2006 through June 2006
7
background
2. BACKGROUND
2.1 The Need for a Food Security Phase Classifi cation System
Based on a global review of needs assessment practice, the Overseas Development Institute (ODI) HPG Report
“According to Need? - Needs assessment and decision-making in the humanitarian sector” (Darcy and Hofmann, 2003),
identifi es a critical gap in food security and needs assessment practice. While there is a broadly accepted defi nition of
food security1, there is a lack of clarity and common defi nitions for classifying various situations in terms of varying
severity and implications for action. This lack of clarity is operationally problematic because the way in which a
situation is classifi ed determines not only the form of response, but the source of funding and its scale, the planning
timeframe and the organizational roles of different stakeholders. There is an urgent practical and operational need for
a broadly accepted food security classifi cation system.
This “gap” and resulting lack of clarity is well recognized by analysts, donors, governments, implementing agencies,
academics and the media. Projects such as the EC/WFP Strengthening Emergency Needs Assessment Capacity
(SENAC) project, the EC/FAO Programme for Linking Information to Action, and the FAO/Netherlands Partnership
Programme (FNPP) are all focused on improving food security assessment practices in order to elicit more effective
response. NGO’s, including Save the Children, Oxfam, CARE, World Vision and others are also investing in improving
assessment practices. Academic institutions such as Institute of Development Studies (IDS) in Sussex, Tufts University,
Tulane University, and ODI also guide and contribute to this dialogue.
There are a number of ongoing initiatives to improve and develop global food security classifi cations systems. Inter-
agency and global initiatives include the Standardized Monitoring and Assessment of Relief and Transitions SMART
(SMART 2006), the DFID sponsored Benchmarking effort (DFID 2005), and the WHO led Humanitarian Tracking
System. Coming to an agreement on a means of classifying humanitarian situations is also identifi ed as a priority
activity in the UN Inter-Agency Standing Committee as part of the ongoing humanitarian reform efforts (OCHA
2006). In practice, the food security and humanitarian communities are working towards a consensus on classifying
food security situations with increasing attention to humanitarian principles and accountability.
Lessons learned from the last decade of food security crisis assessment and response highlight several key challenges
that can help inform the development of a global food security classifi cation system. In summary, a classifi cation
system needs to enable:
• Technical Consensus: Food security crises always involve multiple stakeholders, and response is much more
effective (whether for leveraging resources or coordination) if there is technical consensus on the situation
analysis. Without common terminology and criteria, such consensus is very diffi cult to build, and can be
undermined by non-technical agendas.
• Comparability Over Space: In order to ensure the best use of limited resources, decision makers need to know how
the severity of crisis situations compares from one place to another. Only when such a comparison can be made,
using commonly adopted criteria, can humanitarian assistance be best directed to the people most in need.
• Comparability over Time: Decision makers need to be able to understand the evolution of a crisis as it worsens
or improves in order to increase, decrease, or change the strategic focus of the response as well as identify exit
criteria.
• Transparency through Evidence-Based Analysis: Analysts should be fully transparent in how conclusions
are made, and decision makers should demand evidence to support fi ndings. Without reference criteria the
requirements for an adequate evidence base remain ambiguous.
• Accountability: Without consensual standards in reference characteristics, “analytical” accountability is not
possible. There is a strong need for reference characteristics to avoid errors of commission (i.e., exaggerating
a crisis which can lead to over-response) or errors of omission (i.e., “missing” or understating a crisis which
can lead to lack of response). The former can waste resources and undermine livelihoods, while the latter can
lead to loss of human lives and chronic poverty. With reference criteria and evidence standards, it is possible
to enforce accountability from those responsible for analysis through peer review and public challenges to
questionable fi ndings.
Footnotes:
1 “Food security exists when all people, at all times, have physical and economic access to suffi cient, safe and nutritious food for a healthy and active life”, World Food
Summit Plan of Action, 1996. The four pillars of food security analysis include: access, availability, utilization, and stability.
8
• Effective Early Warning: Decision makers need to know the potential severity, likelihood and timing of a
pending crisis. Without a common technical understanding for describing crises, early warning messages can
be ambiguous and go unheeded.
• More Strategic Response: Depending on the specifi c severity level of a given food security or humanitarian
situation, there is a need for fundamentally different emphases in strategic response. Furthermore, the menu
of options for mitigating a crisis needs to be fully evaluated, rather than resorting to a “supply-side” driven
response.
2.2 Review of Existing Food Security Classifi cations Systems
Classifi cation systems are not new, as means of classifying famines date back to the 1880’s Indian Famine Codes
(Brennan 1984, Howe and Devereux 2004). In practice, classifi cation of some type is necessary in order to make sense
of situation analyses and communicate this to decision makers. Currently there are numerous ways in which food
security situations are defi ned and classifi ed. Agencies such as Oxfam, WFP, FAO GIEWS, MSF, FEWS NET, and
many others have developed different systems for classifying food security crisis situations. Depending on the country,
institutions involved, and persons doing the analysis, classifi cation systems differ. Current operational systems can
be roughly divided into four broad types: “relative terms”, “guiding defi nitions”, “specifi c aspect” and “referenced
threshold” classifi cations. A comprehensive review of the different systems is not presented here. Instead, a brief
review that identifi es aspects of selected systems and illustrates their differences and weaknesses is given (see and
Darcy and Hoffman 2003 for a comprehensive comparative review).
Classifi cation Systems Based on “Specifi c Aspects”
Specifi c aspect classifi cation systems are designed to distinguish meaningful categories of specifi c variables such as
malnutrition, confl ict, and coping strategies. One example is the MSF nutrition guidelines (2000), where stages of
food insecurity are referenced against stages of coping strategies including Insurance Strategies, Crisis Strategies,
and Distress Strategies. Other examples of a specifi c classifi cation system are the confl ict typologies developed
by Samarasinghe, et al. (1999) for USAID and the Swiss Peace FAST confl ict early warning system developed by
Krummenacher et al (2001).
These systems are effective for providing a more detailed and nuanced understanding of particular variables. Bringing
these specifi c-aspect classifi cation systems together in an integrated system reveals complex inter-relationships between
variables and allows for a more comprehensive and robust analysis.
Classifi cation Systems Based on “Relative Terms” The most often used classifi cation system utilizes adjective variations on terms such as “vulnerable”, “food insecure”,
“hotspot”, etc. to describe or classify different food insecurity situations. While striving to capture the overall essence
of a crisis, this type of classifi cation system is based on relative terms whose meaning is open to interpretation (even if
the analysts themselves are clear about their meanings). This classifi cation approach can have internal integrity when
used within a particular country or context, enabling people or geographic areas to be identifi ed and prioritized. Thus,
they can be effective in drawing attention to priority areas within a given system, and imply a degree of severity.
These “relative terms” are generally not accompanied, however, by uniform reference characteristics - thus opening their
use to bias and leading to ambiguous or subjective categorizations. As such, systems based on relative terms typically
do not enable technical consensus and are not comparable over space and time. The ambiguity inherent in relative terms
and the lack of clear reference characteristics often means that transparency and accountability are not achieved.
Classifi cation Systems Based on “Guiding Defi nitions”
Other classifi cation systems utilize consistent “guiding defi nitions” to arrive at a classifi cation. An example of guiding
defi nitions are the current FEWS NET alert levels (FEWSNET, 2005), whereby geographic areas and countries are
divided into levels of Emergency, Warning, Watch, Concern, or No Alert3. Associated with each of these terms is a
defi nition that guides its consistent usage (Appendix E). Furthermore, the choice of classifi cation terms is meant to
evoke different actions, and the guiding defi nition has broad implications for decision making.
Another example of a system using guiding defi nitions is the Kenya Arid Lands Resource Management Project (AL-
RMP), where stages of Normal, Alert, Alarm, and Emergency are associated with guiding defi nitions (Appendix E).
Additional examples of systems using guiding defi nitions are Oxfam’s severity typology that uses Type 1, Type 2,
back
grou
nd
Footnotes:
3 FEWS NET is currently developing a revised version of this alert system..
9
and Type 3, which describes varying levels of food and nutrition crisis, and FAO’s Global Information Early Warning
System (GIEWS) which categorizes countries based on shortfalls of food supply and access.
While intended to provide guidance on their usage, the “guiding defi nitions” are generally descriptive and open to
interpretation, limiting the comparability over space and time. For example, some places may be classifi ed as an
“emergency” but are actually less severe than a different place being analyzed by different analysts, and vice-versa.
The lack of clear reference characteristics associated with the guiding defi nitions limits the degree of comparability
of analysis over space and time and does not explicitly set targets for evidence-based analysis.
Classifi cation Systems Based on “Referenced Thresholds”
“Referenced Threshold” classifi cation systems identify measurable indicators of food insecurity and set cut-off limits for
determining various stages. Typically, these “measurable” indicators are outcome oriented and based on anthropometry,
including malnutrition and mortality. Examples of this approach are the Famine Magnitude Scale developed by Howe
and Devereux (2004) and the Food Insecurity Classifi cation developed by Darcy and Hoffman (2003).
The Famine Magnitude Scale of Howe and Devereux includes six levels of famine intensity including: Food Security
Conditions, Food Insecurity Conditions, Food Crisis Conditions, Famine Conditions, Severe Famine Conditions, and
Extreme Famine Conditions. Each level is referenced against specifi c malnutrition and mortality thresholds as well as
general descriptors of livelihoods. This scale of intensity is further complimented with a magnitude scale that identifi es
various categories of magnitude according to mortality fi gures resulting from a crisis (Appendix F).
Darcy and Hoffman’s classifi cation of food insecurity includes four levels: Chronic Food Insecurity, Acute Food Crisis,
Long-term Food Crisis, and Famine. Each of these levels is associated with specifi c malnutrition and mortality rates,
as well as general food security indicators. This classifi cation also associates each level with general responses.
Both of these initiatives explicitly strive to make the classifi cation comparable over space and time by referencing the
classifi cation to internationally accepted, quantifi able criteria. The IPC builds on this approach of linking categories
to measurable indicators and integrates a more comprehensive set of outcomes on lives and livelihoods. It also links
these to response, early warning, analysis procedures, mapping conventions and population table conventions.
background
11
3. OVERVIEW OF THE IPC AND “SITUATION ANALYSIS”
To address the key challenges noted previously the FSAU has
developed the Integrated Food Security Phase Classifi cation (IPC)
which builds on the strengths of the main types of classifi cation
systems and makes some unique contributions.
The IPC enables a composite analytical statement on food security
situations, drawing together multiple indicators of human welfare and
livelihoods to guide consistent and meaningful analysis. Use of the IPC builds upon, but is a separate process from,
specifi c methodologies used to collect and analyze specifi c data sets. In this way, the IPC enables meta-analysis of
existing data and information from a variety of sources to summarize Situation Analysis.
The IPC helps meet the goals of the Humanitarian Charter (Sphere 2004), as well as numerous international conventions
asserting human rights such as the World Food Summit Plan of Action (FAO 1996). The IPC is designed around broad
conceptual frameworks for food security analysis including the four pillars of access, availability, utilization, and
stability; the UNICEF model of nutrition analysis (UNICEF 1996); and Sen’s entitlement analysis (1981). Analytically,
the IPC draws from a broad interpretation of a livelihoods approach (FSAU 2004) which includes both livelihood
strategies, drawn from the Household Economy Approach (SCF-UK 2000), and livelihood assets, drawn from the
Sustainable Livelihoods Approach (Frankenburger 1992, DFID 2001).
3.1 Focus of the IPC
The IPC is a set of tools for guiding and communicating food security Situation Analysis. The name change described in
the previous section should further clarify the focus on food security analysis as opposed to multi-sectoral humanitarian
analysis. The IPC includes a Reference Table to serve as a base for classifi cations using common standards. Its
supporting tools include Analysis Templates, Cartographic Protocols, and Population Tables. While the IPC fi lls a
critical component in overall food security analysis and response, it is not a panacea for the multiple challenges of
conducting food security analysis.
While the IPC can contribute to improving data collection, monitoring, and information systems, methodologies, capacity
building of analysts, and other important prerequisites for food security analysis, it is not a tool that directly meets
these challenges. Moreover, while the IPC can support improved response analysis, planning, response implementation,
and project monitoring, it can only be considered a strong and consistent input into these processes.
The Situation Analysis of the IPC has strong linkages to, but is not, Response Analysis. Indeed, Response Analysis
is considered a separate, but linked, step from the IPC. This distinction better ensures that IPC analysis is done in an
unbiased manner - i.e., insulated as much as possible from the institutional, fi nancial, and political pressures that can
infl uence humanitarian interventions. Keeping Situation and Response Analysis separate better ensures that there will
be a strong commonly accepted foundation upon which to plan and implement interventions.
The IPC links to Response Analysis in four main ways: (1) the Strategic Response Framework, which provides generic
guidance for what to do in each Phase, (2) the Analysis Templates, which both document unique characteristics of a
projected Phase and Risk of Worsening Phase as well as identify opportunities for short and long-term interventions,
(3) the Cartographic Protocols, which graphically present core aspects of Situation Analysis, and (4) IPC analysis
reporting, which provides more depth and detail to complement the standard outputs of IPC analysis. Note that the
Analysis Templates identify “opportunities for interventions” without making actual planning recommendations -
the latter requires subsequent Response Analysis that considers technical as well as operational issues. Building on
the notion of creating standards, there is also scope for the future development of common protocols for Response
Analysis.
3.2 Analytical Logic of the IPC
The IPC is a means for classifying various stages of food security situations based on outcomes on lives and livelihoods.
Outcomes are a function of both immediate hazard events and underlying causes, as well as the specifi c vulnerabilities
of livelihood systems (including both livelihood assets and livelihood strategies). Outcomes are referenced against
internationally accepted standards, and their convergence substantiates a phase classifi cation for any given area. Each
phase is associated with a unique strategic response framework, while the outcome confi guration for any given situation
guides the development of the most appropriate responses within that framework. While the phase classifi cation
describes the current or imminent situation for a given area, levels of Risk of Worsening Phase are a predictive tool
to communicate the potential for further deterioration of the situation.
overview of the ipc and “situation analysis”
RevisionThe name of the IPC has been revised
to omit the term “humanitarian”.
See Appendix H for explanation.
12
3.3 Components of the IPC
The IPC integrates a suite of tools including the Reference Table,
Analysis Templates, Cartographic Protocols, and Population Tables.
The IPC Reference Table guides analysis for both the Phase Classification and Risk of Worsening Phase. The Phase
Classifi cation classifi es geographic areas and social groups into one
of fi ve Phases - Generally Food Secure (1A and 1B), Moderately/Borderline Food Insecure, Acute Food and Livelihood Crisis, Humanitarian Emergency and Famine/Humanitarian Catastrophe.
A set of Key Reference Outcomes are associated with each Phase to
guide the analytical statement. These are drawn from internationally
accepted standards, and represent a breadth of outcomes on human
welfare and livelihoods that enable triangulation and ensure the
adaptability of the IPC to a wide variety of situations.
To facilitate linking information to action, each Phase is associated
with a Strategic Response Framework that provides strategic, yet
generic, guidance for achieving three objectives:
(1) Mitigate immediate negative outcomes
(2) Support livelihoods
(3) Address underlying/structural causes
The Reference Table also includes protocols for providing the Risk of Worsening Phase, which are divided into three levels: (1) Watch, (2)
Moderate Risk, and (3) High Risk. Each of these levels is associated
with key information required for effective early warning: Probability, Severity, Changes in Process Indicators, and Implications for Action
(the expected duration of the Situation Analysis is included in the
cartographic protocols).
The Analysis Templates are tables which organize key pieces of information in a transparent manner to substantiate
a Phase Classifi cation statement. They include additional important information to guide effective response. The
Cartographic Protocols are a set of standardized mapping and visual communication conventions that effectively
convey key information concerning situation analysis on a single map. The Population Tables are a means to
consistently and effectively communicate population estimates by administrative boundaries, livelihood systems,
and livelihood types.
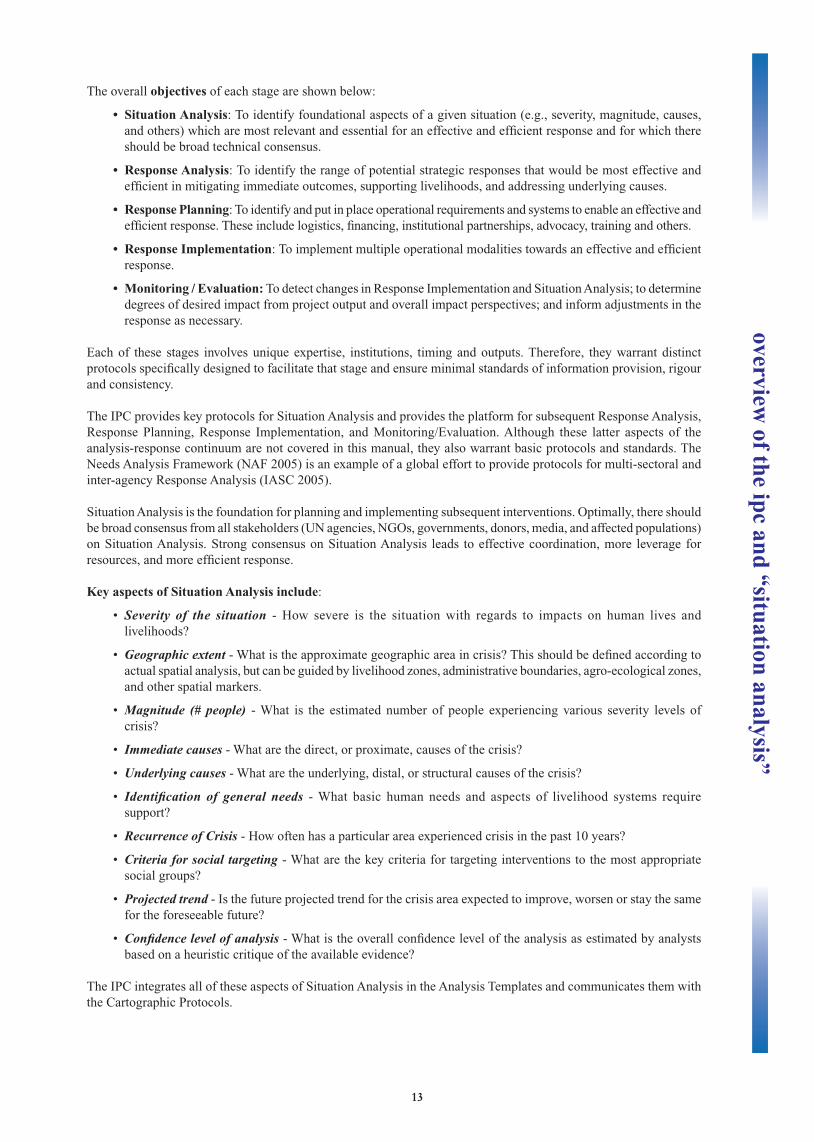
3.4 Situation Analysis
The IPC enables consistent analysis and communication of Situation Analysis -a distinct yet often overlooked,
or assumed, stage in the “analysis-response continuum”. The diagram below illustrates its relationship with other
broad stages, which include: Response Analysis, Response Planning, Response Implementation and Monitoring/
Evaluation.
Figure 1: “Situation Analysis” within broad stages of the “Analysis-Response Continuum”
SituationAnalysis
ResponseAnalysis
ResponsePlanning
ResponseImplementation
Monitoring / Evaluation
over
view
of
the
ipc
and
“sit
uati
on a
naly
sis”
RevisionThe terminology of
“Early Warning Levels”
has been revised to
“Risk of Worsening Phase”.
See Appendix H for explanation.
RevisionThe Phase ”Generally Food Secure”
has been provisionally revised to give
users the option of two different levels:
1A and 1B. Based on fi eld trials,
Version 2 of the IPC Manual will most
likely introduce a new Phase between
the current 1 and 2.
See Appendix H for an explanation
and Appendix I for a sample map from
Kenya.
RevisionThe Phase name of
“Chronically Food Insecure”
has been revised to “Moderately/
Borderline Food Insecure”.
See Appendix H for explanation.
13
The overall objectives of each stage are shown below:
• Situation Analysis: To identify foundational aspects of a given situation (e.g., severity, magnitude, causes,
and others) which are most relevant and essential for an effective and effi cient response and for which there
should be broad technical consensus.
• Response Analysis: To identify the range of potential strategic responses that would be most effective and
effi cient in mitigating immediate outcomes, supporting livelihoods, and addressing underlying causes.
• Response Planning: To identify and put in place operational requirements and systems to enable an effective and
effi cient response. These include logistics, fi nancing, institutional partnerships, advocacy, training and others.
• Response Implementation: To implement multiple operational modalities towards an effective and effi cient
response.
• Monitoring / Evaluation: To detect changes in Response Implementation and Situation Analysis; to determine
degrees of desired impact from project output and overall impact perspectives; and inform adjustments in the
response as necessary.
Each of these stages involves unique expertise, institutions, timing and outputs. Therefore, they warrant distinct
protocols specifi cally designed to facilitate that stage and ensure minimal standards of information provision, rigour
and consistency.
The IPC provides key protocols for Situation Analysis and provides the platform for subsequent Response Analysis,
Response Planning, Response Implementation, and Monitoring/Evaluation. Although these latter aspects of the
analysis-response continuum are not covered in this manual, they also warrant basic protocols and standards. The
Needs Analysis Framework (NAF 2005) is an example of a global effort to provide protocols for multi-sectoral and
inter-agency Response Analysis (IASC 2005).
Situation Analysis is the foundation for planning and implementing subsequent interventions. Optimally, there should
be broad consensus from all stakeholders (UN agencies, NGOs, governments, donors, media, and affected populations)
on Situation Analysis. Strong consensus on Situation Analysis leads to effective coordination, more leverage for
resources, and more effi cient response.
Key aspects of Situation Analysis include:
• Severity of the situation - How severe is the situation with regards to impacts on human lives and
livelihoods?
• Geographic extent - What is the approximate geographic area in crisis? This should be defi ned according to
actual spatial analysis, but can be guided by livelihood zones, administrative boundaries, agro-ecological zones,
and other spatial markers.
• Magnitude (# people) - What is the estimated number of people experiencing various severity levels of
crisis?
• Immediate causes - What are the direct, or proximate, causes of the crisis?
• Underlying causes - What are the underlying, distal, or structural causes of the crisis?
• Identifi cation of general needs - What basic human needs and aspects of livelihood systems require
support?
• Recurrence of Crisis - How often has a particular area experienced crisis in the past 10 years?
• Criteria for social targeting - What are the key criteria for targeting interventions to the most appropriate
social groups?
• Projected trend - Is the future projected trend for the crisis area expected to improve, worsen or stay the same
for the foreseeable future?
• Confi dence level of analysis - What is the overall confi dence level of the analysis as estimated by analysts
based on a heuristic critique of the available evidence?
The IPC integrates all of these aspects of Situation Analysis in the Analysis Templates and communicates them with
the Cartographic Protocols.
overview of the ipc and “situation analysis”
14
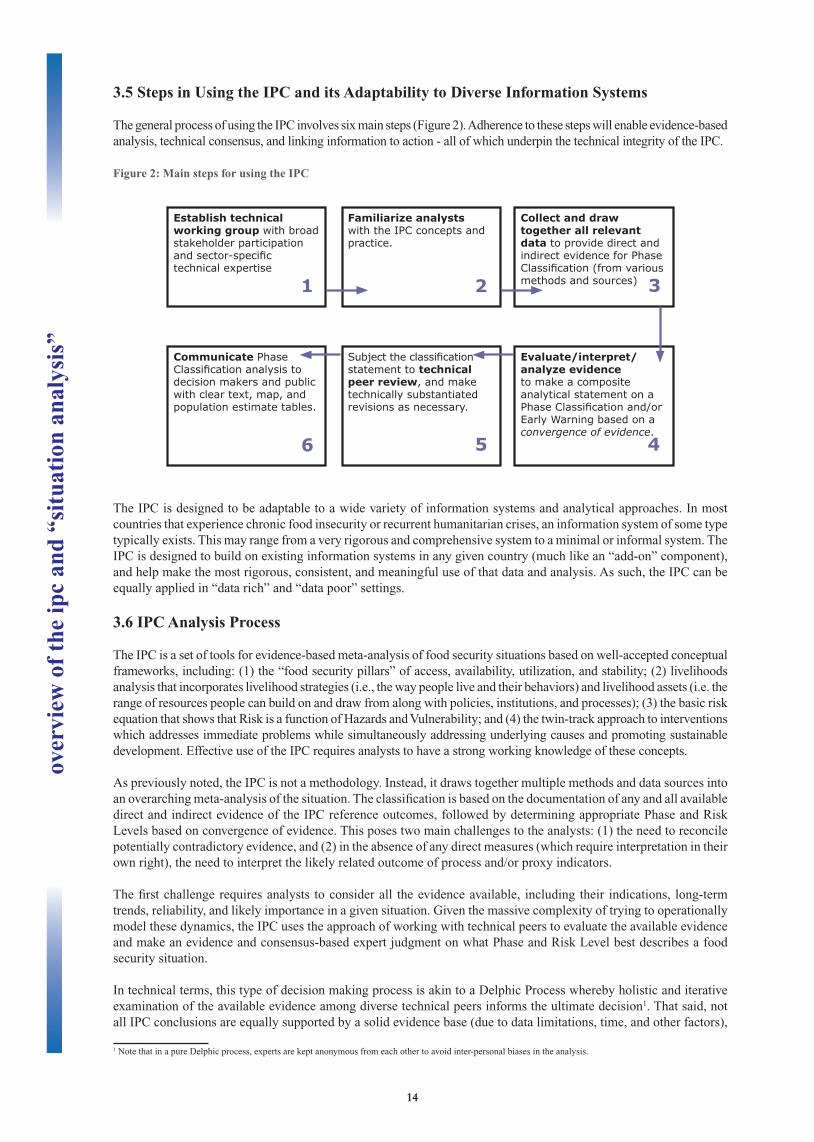
3.5 Steps in Using the IPC and its Adaptability to Diverse Information Systems
The general process of using the IPC involves six main steps (Figure 2). Adherence to these steps will enable evidence-based
analysis, technical consensus, and linking information to action - all of which underpin the technical integrity of the IPC.
Figure 2: Main steps for using the IPC
Establish technical working group with broad stakeholder participation and sector-specifi c technical expertise
Familiarize analysts with the IPC concepts and practice.
Collect and draw together all relevant data to provide direct and indirect evidence for Phase Classifi cation (from various methods and sources)
Evaluate/interpret/analyze evidence to make a composite analytical statement on a Phase Classifi cation and/or Early Warning based on a convergence of evidence.
Subject the classifi cation statement to technical peer review, and make technically substantiated revisions as necessary.
1 2 3
5 4
Communicate Phase Classifi cation analysis to decision makers and public with clear text, map, and population estimate tables.
6
The IPC is designed to be adaptable to a wide variety of information systems and analytical approaches. In most
countries that experience chronic food insecurity or recurrent humanitarian crises, an information system of some type
typically exists. This may range from a very rigorous and comprehensive system to a minimal or informal system. The
IPC is designed to build on existing information systems in any given country (much like an “add-on” component),
and help make the most rigorous, consistent, and meaningful use of that data and analysis. As such, the IPC can be
equally applied in “data rich” and “data poor” settings.
3.6 IPC Analysis Process
The IPC is a set of tools for evidence-based meta-analysis of food security situations based on well-accepted conceptual
frameworks, including: (1) the “food security pillars” of access, availability, utilization, and stability; (2) livelihoods
analysis that incorporates livelihood strategies (i.e., the way people live and their behaviors) and livelihood assets (i.e. the
range of resources people can build on and draw from along with policies, institutions, and processes); (3) the basic risk
equation that shows that Risk is a function of Hazards and Vulnerability; and (4) the twin-track approach to interventions
which addresses immediate problems while simultaneously addressing underlying causes and promoting sustainable
development. Effective use of the IPC requires analysts to have a strong working knowledge of these concepts.
As previously noted, the IPC is not a methodology. Instead, it draws together multiple methods and data sources into
an overarching meta-analysis of the situation. The classifi cation is based on the documentation of any and all available
direct and indirect evidence of the IPC reference outcomes, followed by determining appropriate Phase and Risk
Levels based on convergence of evidence. This poses two main challenges to the analysts: (1) the need to reconcile
potentially contradictory evidence, and (2) in the absence of any direct measures (which require interpretation in their
own right), the need to interpret the likely related outcome of process and/or proxy indicators.
The fi rst challenge requires analysts to consider all the evidence available, including their indications, long-term
trends, reliability, and likely importance in a given situation. Given the massive complexity of trying to operationally
model these dynamics, the IPC uses the approach of working with technical peers to evaluate the available evidence
and make an evidence and consensus-based expert judgment on what Phase and Risk Level best describes a food
security situation.
In technical terms, this type of decision making process is akin to a Delphic Process whereby holistic and iterative
examination of the available evidence among diverse technical peers informs the ultimate decision1. That said, not
all IPC conclusions are equally supported by a solid evidence base (due to data limitations, time, and other factors),
1 Note that in a pure Delphic process, experts are kept anonymous from each other to avoid inter-personal biases in the analysis.
over
view
of
the
ipc
and
“sit
uati
on a
naly
sis”
15
and the IPC allows this variation in rigor to be communicated through the Confi dence Levels of the analysis which
show low, medium, and high confi dence for each IPC statement.
The second challenge - interpreting indirect evidence such as process or proxy indicators - requires analysts to put into
practice the livelihoods approach and the risk, hazard, vulnerability equation. Proxy or process indicators by defi nition
do not directly measure an outcome, and need to be interpreted according to their livelihood and historical context. The
IPC Reference Table provides a common reference for outcomes that they should be compared to, and it is up to the
analysts to make the appropriate association between specifi c indirect evidence and the IPC reference outcomes.
The IPC does not provide thresholds for interpreting indirect evidence (e.g., market prices, crop production, rainfall,
etc.) because these will entirely be dependent on local environmental and livelihood contexts, and are thus not
comparable from place to place. That said, it would be possible to develop reference thresholds for indirect evidence
for specifi c livelihood zones in a given country, and to use those thresholds to internally guide a phase classifi cation
for that area. Having baseline information of the livelihood system and benchmark values of key indicators is very
useful for interpreting indirect evidence.
3.7 Data Adequacy and Reliability
While the ideal is to have adequate and reliable data to inform IPC analysis, the practical reality is that data is not fully
available and reliable. The IPC approach is to recognize that with or without optimal data, decisions are made and would
be better informed through the systematic analysis of that data which does exist. Initial attempts at documenting data can be
further improved upon as the body of evidence grows. Thus, IPC analysis can be done with scanty or very comprehensive
data, and that difference should be clearly indicated through the Confi dence Levels of the analysis. The confi dence
level of the analysis is informed through overall evaluation of a completed Analysis Template with consideration for the
comprehensiveness of the evidence, its strength in indicating a reference outcome, and its reliability (note that each piece
of evidence is assigned a reliability score). Future IPC revisions will aim towards making this process more quantifi able
and systematic, but for now the overall confi dence level is an assessment made by technical consensus among analysts.
3.8 When and How Often to Do IPC Analysis
IPC analysis can be initiated at any time, but subsequently should be updated whenever evidence indicates the food
security situation has changed or may change in the future. Thus, the IPC is a “living analysis” that is constantly and
dynamically updated as the food security situation changes or new potential hazard/shock data becomes evident. The
historical record of previous IPC Analysis Templates and Cartographic maps provides an invaluable resource towards
informing IPC analysis and understanding the evolution of food security over time.
At a minimum, the IPC should be updated whenever new evidence indicates that the food security situation has or
may change in the future. If the IPC analysis is conducted according to seasons, the situation can change in between
analysis due to new hazard events or further deterioration, and the IPC statement should be updated accordingly.
3.9 Time Horizon for IPC Analysis
The IPC Phase Classifi cation is a projection of the most likely Phase for a given area within the stated time period
of the analysis. It is up to analysts to determine an appropriate time horizon for the projection, and this should be
infl uenced primarily by the needs of decision makers. Thus, the analysis can project the most likely situation up until
the next known event that will most likely change the food security situation (e.g. a rainy season), or it can project
beyond that event.
IPC analysis can be conducted for numerous different time periods, including short term projections, longer term
projections, and even retrospectively. Analysts should clearly defi ne the time period their analysis covers. In some
situations distinct IPC analyses can be conducted for multiple consecutive periods. For example, an IPC analysis could
be undertaken projecting anticipated food security conditions for the next 6 months, and a separate complementary
analysis for the 3 months following that period could be undertaken to provide longer range early warning.
3.10 Early Warning
In the most basic sense, early warning occurs anytime analysis projects into the future. It is a function of the amount of
time between the date the analysis is conducted and the end date of the projection. The IPC Phase classifi cation itself,
in as much as it is projecting into the future, is an early warning statement. The “Risk of Worsening Phase” is also an
early warning statement that the situation could further deteriorate in the stated time period of the projection.
overview of the ipc and “situation analysis”
16
3.11 Inclusion of “Imminent” in the Phase Classifi cation
The Phase Classifi cation is referenced against the outcome indicators in the IPC Reference Table and is based on the
currently evident presence of those indicators and/or their imminent presence within the time period of the analysis.
The inclusion of imminent in the projection is critical to ensuring that appropriate actions are taken in a timely manner.
By including imminent in a Phase classifi cation, analysts are communicating that if the outcomes are not yet present
they are likely to be so in the time period specifi ed (meaning very high probability with very high confi dence), and
thus the area should be treated as being in that Phase with regards to programming and planning urgency.
3.12 Spatial Scale of Analysis
IPC analysis can be conducted at any scale - from country-wide to individual villages - depending on the geographic
dimensions of a crisis, the needs of decision makers, and the practicalities of conducting analysis. Typically, however, IPC
analysis is conducted at a meso-scale of analysis that is informed by the geographic features of a hazard event and the
underlying bio-social conditions (e.g., agro-ecological zones, livelihood zones, crop production zones, topography, etc.).
3.13 Institutional Ownership and Processes
Key to the IPC’s technical integrity is the process in which it is conducted, which requires diverse technical experts
from a range of stakeholder agencies to reach technical consensus based on a convergence of evidence. Consistent with
the Rights Based approach, whereby national governments have fi rst and foremost responsibility for ensuring food
security, the IPC emphasizes a role for national governments to lead IPC analysis, with the support of international
technical experts as necessary. This ensures understanding and ownership of the IPC results.
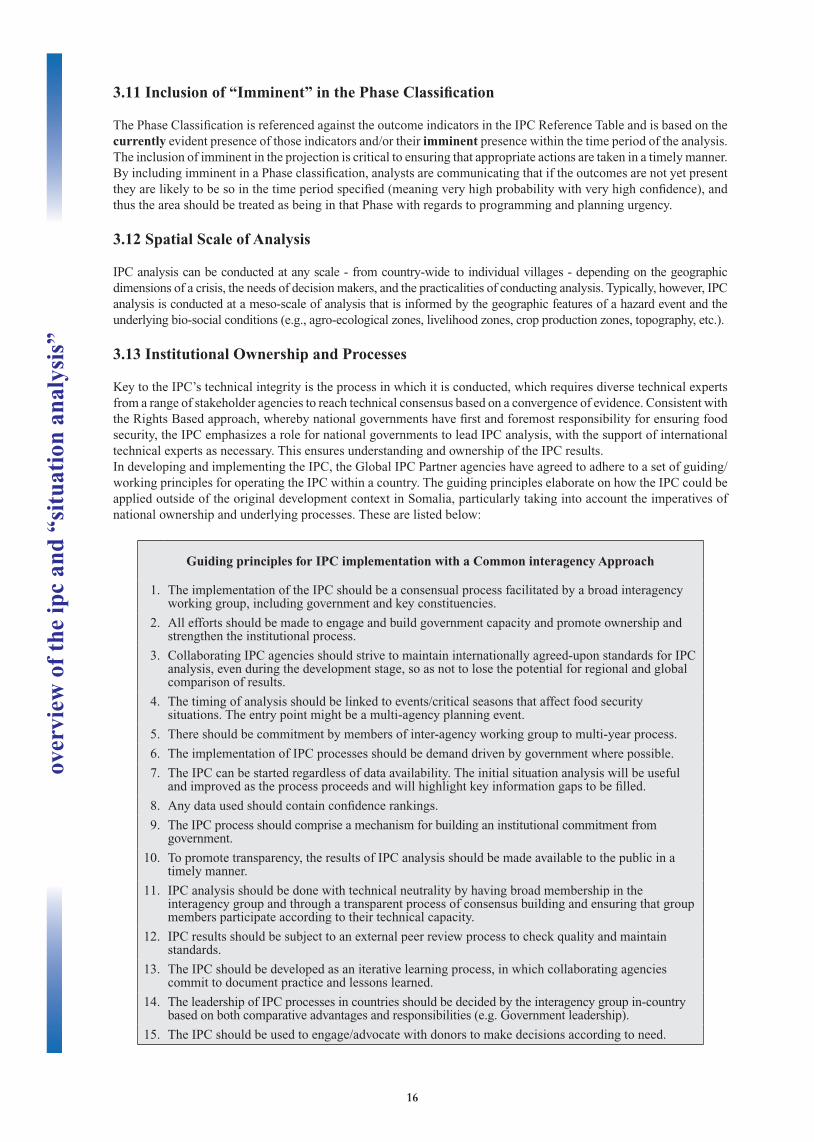
In developing and implementing the IPC, the Global IPC Partner agencies have agreed to adhere to a set of guiding/
working principles for operating the IPC within a country. The guiding principles elaborate on how the IPC could be
applied outside of the original development context in Somalia, particularly taking into account the imperatives of
national ownership and underlying processes. These are listed below:
Guiding principles for IPC implementation with a Common interagency Approach
1. The implementation of the IPC should be a consensual process facilitated by a broad interagency working group, including government and key constituencies.
2. All efforts should be made to engage and build government capacity and promote ownership and strengthen the institutional process.
3. Collaborating IPC agencies should strive to maintain internationally agreed-upon standards for IPC analysis, even during the development stage, so as not to lose the potential for regional and global comparison of results.
4. The timing of analysis should be linked to events/critical seasons that affect food security situations. The entry point might be a multi-agency planning event.
5. There should be commitment by members of inter-agency working group to multi-year process.
6. The implementation of IPC processes should be demand driven by government where possible.
7. The IPC can be started regardless of data availability. The initial situation analysis will be useful and improved as the process proceeds and will highlight key information gaps to be fi lled.
8. Any data used should contain confi dence rankings.
9. The IPC process should comprise a mechanism for building an institutional commitment from government.
10. To promote transparency, the results of IPC analysis should be made available to the public in a timely manner.
11. IPC analysis should be done with technical neutrality by having broad membership in the interagency group and through a transparent process of consensus building and ensuring that group members participate according to their technical capacity.
12. IPC results should be subject to an external peer review process to check quality and maintain standards.
13. The IPC should be developed as an iterative learning process, in which collaborating agencies commit to document practice and lessons learned.
14. The leadership of IPC processes in countries should be decided by the interagency group in-country based on both comparative advantages and responsibilities (e.g. Government leadership).
15. The IPC should be used to engage/advocate with donors to make decisions according to need.
over
view
of
the
ipc
and
“sit
uati
on a
naly
sis”
17
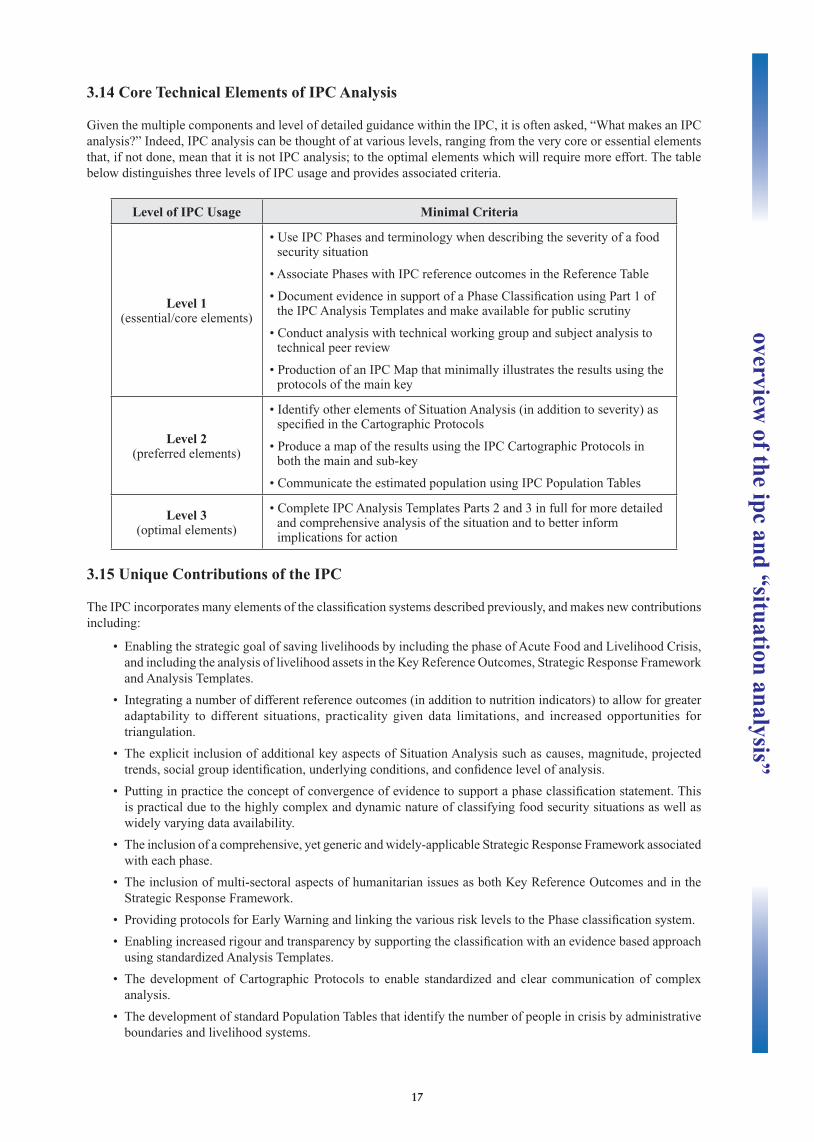
3.14 Core Technical Elements of IPC Analysis
Given the multiple components and level of detailed guidance within the IPC, it is often asked, “What makes an IPC
analysis?” Indeed, IPC analysis can be thought of at various levels, ranging from the very core or essential elements
that, if not done, mean that it is not IPC analysis; to the optimal elements which will require more effort. The table
below distinguishes three levels of IPC usage and provides associated criteria.
Level of IPC Usage Minimal Criteria
Level 1 (essential/core elements)
• Use IPC Phases and terminology when describing the severity of a food security situation
• Associate Phases with IPC reference outcomes in the Reference Table
• Document evidence in support of a Phase Classifi cation using Part 1 of the IPC Analysis Templates and make available for public scrutiny
• Conduct analysis with technical working group and subject analysis to technical peer review
• Production of an IPC Map that minimally illustrates the results using the protocols of the main key
Level 2 (preferred elements)
• Identify other elements of Situation Analysis (in addition to severity) as specifi ed in the Cartographic Protocols
• Produce a map of the results using the IPC Cartographic Protocols in both the main and sub-key
• Communicate the estimated population using IPC Population Tables
Level 3 (optimal elements)
• Complete IPC Analysis Templates Parts 2 and 3 in full for more detailed and comprehensive analysis of the situation and to better inform implications for action
3.15 Unique Contributions of the IPC
The IPC incorporates many elements of the classifi cation systems described previously, and makes new contributions
including:
• Enabling the strategic goal of saving livelihoods by including the phase of Acute Food and Livelihood Crisis,
and including the analysis of livelihood assets in the Key Reference Outcomes, Strategic Response Framework
and Analysis Templates.
• Integrating a number of different reference outcomes (in addition to nutrition indicators) to allow for greater
adaptability to different situations, practicality given data limitations, and increased opportunities for
triangulation.
• The explicit inclusion of additional key aspects of Situation Analysis such as causes, magnitude, projected
trends, social group identifi cation, underlying conditions, and confi dence level of analysis.
• Putting in practice the concept of convergence of evidence to support a phase classifi cation statement. This
is practical due to the highly complex and dynamic nature of classifying food security situations as well as
widely varying data availability.
• The inclusion of a comprehensive, yet generic and widely-applicable Strategic Response Framework associated
with each phase.
• The inclusion of multi-sectoral aspects of humanitarian issues as both Key Reference Outcomes and in the
Strategic Response Framework.
• Providing protocols for Early Warning and linking the various risk levels to the Phase classifi cation system.
• Enabling increased rigour and transparency by supporting the classifi cation with an evidence based approach
using standardized Analysis Templates.
• The development of Cartographic Protocols to enable standardized and clear communication of complex
analysis.
• The development of standard Population Tables that identify the number of people in crisis by administrative
boundaries and livelihood systems.
overview of the ipc and “situation analysis”
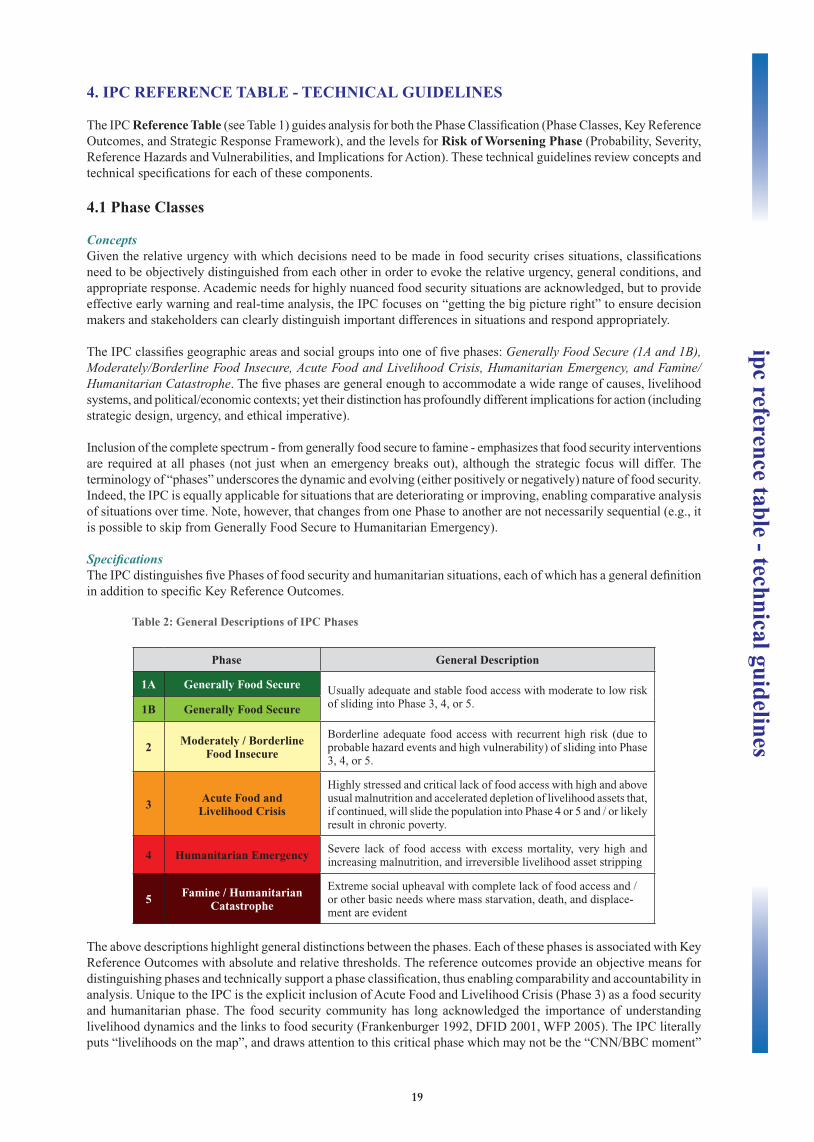
19
4. IPC REFERENCE TABLE - TECHNICAL GUIDELINES
The IPC Reference Table (see Table 1) guides analysis for both the Phase Classifi cation (Phase Classes, Key Reference
Outcomes, and Strategic Response Framework), and the levels for Risk of Worsening Phase (Probability, Severity,
Reference Hazards and Vulnerabilities, and Implications for Action). These technical guidelines review concepts and
technical specifi cations for each of these components.
4.1 Phase Classes
Concepts
Given the relative urgency with which decisions need to be made in food security crises situations, classifi cations
need to be objectively distinguished from each other in order to evoke the relative urgency, general conditions, and
appropriate response. Academic needs for highly nuanced food security situations are acknowledged, but to provide
effective early warning and real-time analysis, the IPC focuses on “getting the big picture right” to ensure decision
makers and stakeholders can clearly distinguish important differences in situations and respond appropriately.
The IPC classifi es geographic areas and social groups into one of fi ve phases: Generally Food Secure (1A and 1B), Moderately/Borderline Food Insecure, Acute Food and Livelihood Crisis, Humanitarian Emergency, and Famine/Humanitarian Catastrophe. The fi ve phases are general enough to accommodate a wide range of causes, livelihood
systems, and political/economic contexts; yet their distinction has profoundly different implications for action (including
strategic design, urgency, and ethical imperative).
Inclusion of the complete spectrum - from generally food secure to famine - emphasizes that food security interventions
are required at all phases (not just when an emergency breaks out), although the strategic focus will differ. The
terminology of “phases” underscores the dynamic and evolving (either positively or negatively) nature of food security.
Indeed, the IPC is equally applicable for situations that are deteriorating or improving, enabling comparative analysis
of situations over time. Note, however, that changes from one Phase to another are not necessarily sequential (e.g., it
is possible to skip from Generally Food Secure to Humanitarian Emergency).
Specifi cations
The IPC distinguishes fi ve Phases of food security and humanitarian situations, each of which has a general defi nition
in addition to specifi c Key Reference Outcomes.
Table 2: General Descriptions of IPC Phases
Phase General Description
1A Generally Food SecureUsually adequate and stable food access with moderate to low risk of sliding into Phase 3, 4, or 5.1B Generally Food Secure
2 Moderately / BorderlineFood Insecure
Borderline adequate food access with recurrent high risk (due to probable hazard events and high vulnerability) of sliding into Phase 3, 4, or 5.
3 Acute Food and Livelihood Crisis
Highly stressed and critical lack of food access with high and above usual malnutrition and accelerated depletion of livelihood assets that, if continued, will slide the population into Phase 4 or 5 and / or likely result in chronic poverty.
4 Humanitarian Emergency Severe lack of food access with excess mortality, very high and increasing malnutrition, and irreversible livelihood asset stripping
5 Famine / Humanitarian Catastrophe
Extreme social upheaval with complete lack of food access and / or other basic needs where mass starvation, death, and displace-ment are evident
The above descriptions highlight general distinctions between the phases. Each of these phases is associated with Key
Reference Outcomes with absolute and relative thresholds. The reference outcomes provide an objective means for
distinguishing phases and technically support a phase classifi cation, thus enabling comparability and accountability in
analysis. Unique to the IPC is the explicit inclusion of Acute Food and Livelihood Crisis (Phase 3) as a food security
and humanitarian phase. The food security community has long acknowledged the importance of understanding
livelihood dynamics and the links to food security (Frankenburger 1992, DFID 2001, WFP 2005). The IPC literally
puts “livelihoods on the map”, and draws attention to this critical phase which may not be the “CNN/BBC moment”
ipc reference table - technical guidelines
20
with stark images of starvation, but nonetheless requires urgent interventions to prevent highly stressed food access
from slipping into Humanitarian Emergencies. It also supports the stabilization/recovery from livelihood asset
deterioration. Thus, Phase 3 is both an early warning precursor to an impending Humanitarian Emergency as well as
a critical phase in its own right that warrants urgent livelihood support.
Although the terminology used to label each Phase is emotive and purposely selected to elicit calls for urgent action,
the IPC strives to move beyond the use of these terms as adjectives and metaphors open to relative interpretations by
various interests. Rather, each phase is explicitly linked to a set of consistent, internationally accepted, and objective
criteria (see section 4.2 on Key Reference Outcomes). Each term therefore has a specifi c technical meaning that
becomes a common currency for analysts and other stakeholders (governments, decision makers, implementing
agencies, donors, media, etc.).
4.2 Key Reference Outcomes
Concepts
The Phase classifi cation is a composite analytical statement based on a convergence of evidence of Key Reference Outcomes representing operative common denominators of human welfare and livelihoods. For each IPC Phase
there is a set of Key Reference Outcomes which cover a breadth of outcomes on human well being, including: Crude Mortality Rate, Wasting, Stunting, Disease, Food Access/ Availability, Dietary Diversity, Water Access/Availability, Destitution/Displacement, Civil Security, Hazards, Coping, Structural Conditions, and Livelihood Assets. Although
the reference outcomes are interpreted and adjusted to fi t the IPC phases, they are drawn from well recognized
international standards and other classifi cation systems.
The selection of individual reference outcomes for inclusion in the IPC is based on the following criteria:
• Outcome rather than Process Indicators: This is a critical distinction which gives the IPC comparability over
space and time as well as accountability. The IPC Reference Outcomes are based on outcome indicators of
resulting impact. Irrespective of the uniqueness of a given situation (the livelihood system, the socio-economic
context, the history, the type of hazard, etc.), the international community can generally agree on which outcomes
food security and humanitarian interventions should avoid, and which outcomes to work towards. The phase
classifi cation reference outcomes are as much as possible oriented around outcome indicators, although even
these represent different stages of outcomes (on an individual scale, mortality, for example, would come after
distress coping strategies).
Process indicators represent the dynamics that lead to a particular outcome. These include a wide range of
indicators such as market prices, climate indicators, crop production, livestock conditions, and many others.
While process indicators are essential for analysis, they work together in a highly dynamic and integrated
manner and their ultimate impact (outcome) depends on the nuances of a given situation including its livelihood
systems, socio-economic context, history, type of hazard, etc. For example, a 50 percent increase in the market
price of milk (a process indicator) has a completely different outcome in a livelihood system that produces
milk than in a livelihood system that is a net purchaser of milk, potentially being benefi cial for the former and
detrimental for the latter.
While outcome indicators provide direct evidence for a phase classifi cation, the use of process indicators
as indirect evidence can also be used to substantiate a phase classifi cation (see the next section on usage for
further explanation).
• Breadth of Outcomes: The reference outcomes include a breadth of outcomes that are either directly or indirectly
related to food security. The IPC emphasizes food security analysis, but recognizes that it is impossible to
separate severe food insecurity from associated sectoral crises in the fi elds of health, water, sanitation, shelter,
and others. There is a highly dynamic interplay between these sectors, especially as situations deteriorate - for
they often co-exist and any stress on one most likely leads to stresses on others. Thus, the IPC emphasizes food
security analysis, but integrates other humanitarian concerns. The IPC is not meant, however, to substitute for
more refi ned analysis of any particular sector.
• Fewest Possible: While aiming to include a broad spectrum of food security outcomes, the reference outcomes
are selected to be as few as possible. Keeping their numbers to a minimum contributes to greater consistency
and simplicity in analysis. Indeed, the reference outcomes are not meant to be full descriptions of all the
dynamics occurring in a given Phase, but are identifi ed only for their salient ability to signify Phase severity.
ipc
refe
renc
e ta
ble
- te
chni
cal g
uide
lines
21
• Lives and Livelihoods: The reference outcomes include outcomes on both human lives and livelihoods.
While saving lives is an immediate strategic objective, relief and response should mitigate the vulnerability
of individuals and communities to future hazards. Without strategic attention given to supporting livelihoods,
people may slide into chronic poverty and perpetual high vulnerability to future hazards, and thus become unable
to meaningfully contribute to national development (Sphere 2004 and DFID 2001). Supporting livelihoods is
a strategic goal in itself.
The IPC integrates livelihoods into the reference outcomes through the basic framework of the Sustainable
Livelihoods Approach which identifi es fi ve main livelihood capitals: human, fi nancial, social, physical, and
natural. One current and future challenge for the IPC is that the status of these capitals, which can be legitimately
be seen as outcomes in their own right, are diffi cult to measure in a consistent and objective manner. Developing
objective indicators for analysis of livelihood assets is an area for future development.
• Measurable/Practical: Notwithstanding the challenges related to livelihoods noted above, the reference
outcomes are selected based on the ability to objectively measure them in a reasonably practical manner.
While the reference outcomes are as objective as possible (e.g., anthropometric thresholds), there are still
some qualitative descriptions (e.g., displacement levels). For each of the reference outcomes, there is a range
of specifi c methodologies that provide the objectivity and rigour for that particular reference characteristic.
Use of the reference outcomes to substantiate a Phase Classifi cation is based on:
• Current or Imminent Outcomes: The Phase Classifi cation is based on reference outcomes that are either
currently present in a given situation or imminent. Imminent outcomes include the notions of immediate/
foreseeable future as well as the level of confi dence that they will occur. Inclusion of imminent in the defi nition
of outcomes is important to ensure timely response and appropriate action before negative outcomes occur.
• Convergence of Evidence: Although the IPC strives for objectivity and consistency, the extremely complex
nature of food security analysis makes the strict application of single indicator thresholds both impractical and
technically questionable in their application to a wide array of situations. To overcome this, the IPC supports a
Phase classifi cation statement based on convergence of evidence from multiple sources (not limited to single
assessment fi ndings) as evaluated by analysts. Analysts use the reference outcomes as a guide, but ultimately
make a classifi cation statement based on the convergence of evidence from all available sources. This can
include direct and/or indirect1 evidence of outcomes from a variety of sources and process indicators, depending
on data availability and practicality.
This evidence based approach is not only practical in a wide range of situations, it also focuses the burden of
proof on the analysts, who must demonstrate/defend to all stakeholders (as if in a court of law) the validity
and relevance of evidence in support of a classifi cation statement, even if that statement is based on their “own
best judgment”. Such a process enables accountability and accessibility for critique. An additional component
of the IPC, the Analysis Templates, guides the organization of the pieces of evidence to facilitate analysis and
increase the transparency of conclusions (see further discussion below).
• Mixed Signals of Indicators: Given the complexity and diversity of food security and humanitarian situations,
individual indicators may not consistently support the same Phase Classifi cation. While this is a practical reality,
the approach of the IPC is to make these differences explicit, examine them in their broader context and strive
to make an overall Phase Classifi cation statement using a convergence of evidence. Any notable deviations
for particular indicators will be highlighted in the Analysis Templates, and should be explained.
• Direct and Indirect Evidence: The Phase Classifi cation can be substantiated with both direct and indirect
evidence. Direct evidence includes data sources and methods that specifi cally indicate the key reference
outcomes associated with each Phase. Indirect evidence, however, includes proxy indicators that substantiate
the key reference outcomes without direct measurement. Akin to corroborating evidence, indirect evidence
typically cannot stand on its own, but can be used to substantiate a Phase Classifi cation. Even though indirect
evidence is one step removed from the key reference outcomes, they are still valid and useful in supporting the
Phase classifi cation statement, albeit with lower confi dence than direct evidence. For example, direct evidence
of GAM could include a random sample nutrition survey, whereas indirect evidence could include marked
increases in attendance at therapeutic feeding centers.
The classifi cation itself, however, is stronger if referenced against outcomes which can be widely agreed upon
and are applicable in a wide range of situations. For a comprehensive listing of different types of process and
outcome indicators, see FAO/FIVIMS 2002 and Riely et al. 1999.
ipc reference table - technical guidelines
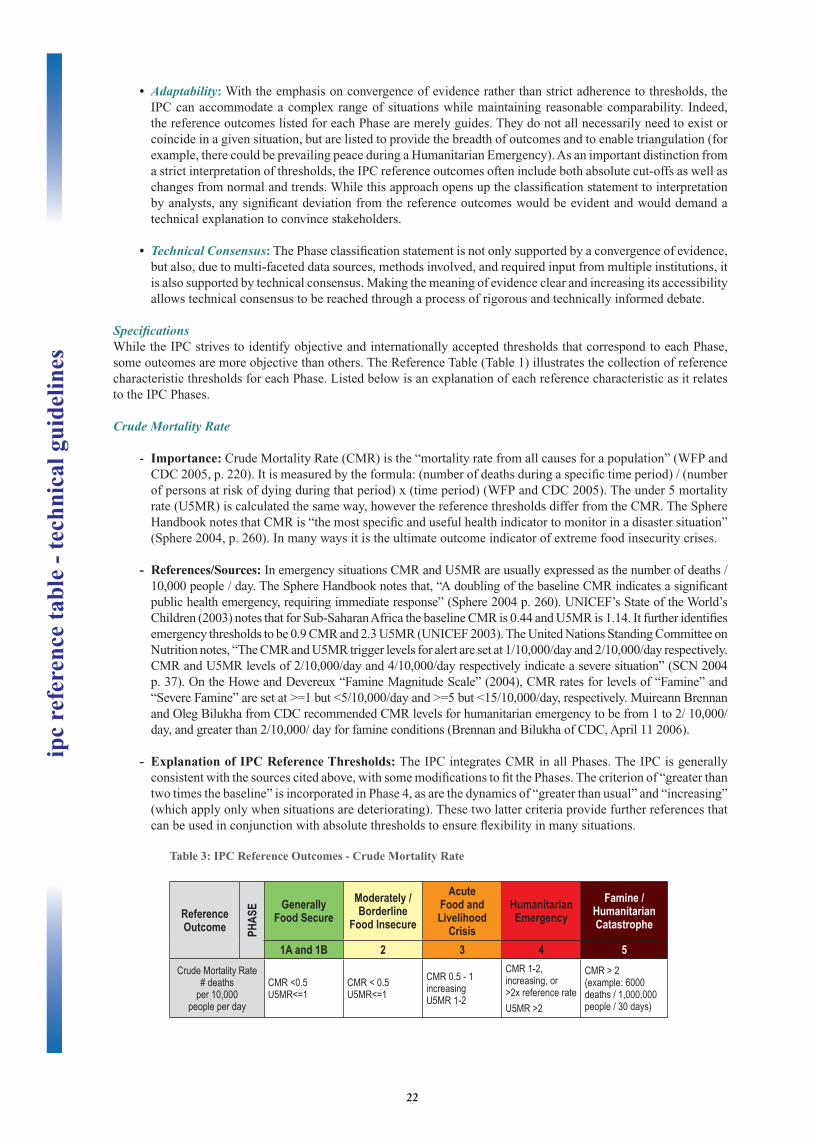
22
• Adaptability: With the emphasis on convergence of evidence rather than strict adherence to thresholds, the
IPC can accommodate a complex range of situations while maintaining reasonable comparability. Indeed,
the reference outcomes listed for each Phase are merely guides. They do not all necessarily need to exist or
coincide in a given situation, but are listed to provide the breadth of outcomes and to enable triangulation (for
example, there could be prevailing peace during a Humanitarian Emergency). As an important distinction from
a strict interpretation of thresholds, the IPC reference outcomes often include both absolute cut-offs as well as
changes from normal and trends. While this approach opens up the classifi cation statement to interpretation
by analysts, any signifi cant deviation from the reference outcomes would be evident and would demand a
technical explanation to convince stakeholders.
• Technical Consensus: The Phase classifi cation statement is not only supported by a convergence of evidence,
but also, due to multi-faceted data sources, methods involved, and required input from multiple institutions, it
is also supported by technical consensus. Making the meaning of evidence clear and increasing its accessibility
allows technical consensus to be reached through a process of rigorous and technically informed debate.
Specifi cations
While the IPC strives to identify objective and internationally accepted thresholds that correspond to each Phase,
some outcomes are more objective than others. The Reference Table (Table 1) illustrates the collection of reference
characteristic thresholds for each Phase. Listed below is an explanation of each reference characteristic as it relates
to the IPC Phases.
Crude Mortality Rate
- Importance: Crude Mortality Rate (CMR) is the “mortality rate from all causes for a population” (WFP and
CDC 2005, p. 220). It is measured by the formula: (number of deaths during a specifi c time period) / (number
of persons at risk of dying during that period) x (time period) (WFP and CDC 2005). The under 5 mortality
rate (U5MR) is calculated the same way, however the reference thresholds differ from the CMR. The Sphere
Handbook notes that CMR is “the most specifi c and useful health indicator to monitor in a disaster situation”
(Sphere 2004, p. 260). In many ways it is the ultimate outcome indicator of extreme food insecurity crises.
- References/Sources: In emergency situations CMR and U5MR are usually expressed as the number of deaths /
10,000 people / day. The Sphere Handbook notes that, “A doubling of the baseline CMR indicates a signifi cant
public health emergency, requiring immediate response” (Sphere 2004 p. 260). UNICEF’s State of the World’s
Children (2003) notes that for Sub-Saharan Africa the baseline CMR is 0.44 and U5MR is 1.14. It further identifi es
emergency thresholds to be 0.9 CMR and 2.3 U5MR (UNICEF 2003). The United Nations Standing Committee on
Nutrition notes, “The CMR and U5MR trigger levels for alert are set at 1/10,000/day and 2/10,000/day respectively.
CMR and U5MR levels of 2/10,000/day and 4/10,000/day respectively indicate a severe situation” (SCN 2004
p. 37). On the Howe and Devereux “Famine Magnitude Scale” (2004), CMR rates for levels of “Famine” and
“Severe Famine” are set at >=1 but <5/10,000/day and >=5 but <15/10,000/day, respectively. Muireann Brennan
and Oleg Bilukha from CDC recommended CMR levels for humanitarian emergency to be from 1 to 2/ 10,000/
day, and greater than 2/10,000/ day for famine conditions (Brennan and Bilukha of CDC, April 11 2006).
- Explanation of IPC Reference Thresholds: The IPC integrates CMR in all Phases. The IPC is generally
consistent with the sources cited above, with some modifi cations to fi t the Phases. The criterion of “greater than
two times the baseline” is incorporated in Phase 4, as are the dynamics of “greater than usual” and “increasing”
(which apply only when situations are deteriorating). These two latter criteria provide further references that
can be used in conjunction with absolute thresholds to ensure fl exibility in many situations.
Table 3: IPC Reference Outcomes - Crude Mortality Rate
Reference Outcome PH
ASE Generally
Food SecureModerately / Borderline
Food Insecure
AcuteFood and Livelihood
Crisis
Humanitarian Emergency
Famine / Humanitarian Catastrophe
1A and 1B 2 3 4 5Crude Mortality Rate
# deaths per 10,000
people per day
CMR <0.5U5MR<=1
CMR < 0.5U5MR<=1
CMR 0.5 - 1increasingU5MR 1-2
CMR 1-2, increasing, or>2x reference rateU5MR >2
CMR > 2(example: 6000 deaths / 1,000,000 people / 30 days)
ipc
refe
renc
e ta
ble
- te
chni
cal g
uide
lines
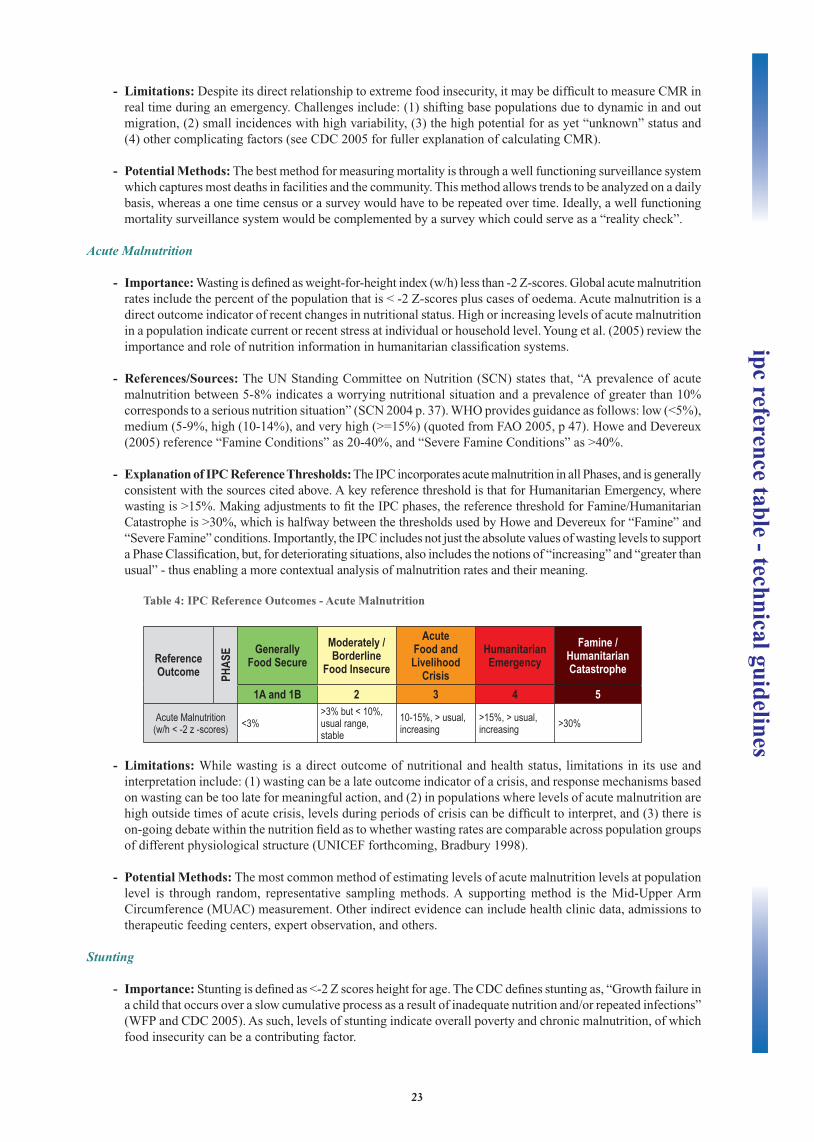
23
- Limitations: Despite its direct relationship to extreme food insecurity, it may be diffi cult to measure CMR in
real time during an emergency. Challenges include: (1) shifting base populations due to dynamic in and out
migration, (2) small incidences with high variability, (3) the high potential for as yet “unknown” status and
(4) other complicating factors (see CDC 2005 for fuller explanation of calculating CMR).
- Potential Methods: The best method for measuring mortality is through a well functioning surveillance system
which captures most deaths in facilities and the community. This method allows trends to be analyzed on a daily
basis, whereas a one time census or a survey would have to be repeated over time. Ideally, a well functioning
mortality surveillance system would be complemented by a survey which could serve as a “reality check”.
Acute Malnutrition
- Importance: Wasting is defi ned as weight-for-height index (w/h) less than -2 Z-scores. Global acute malnutrition
rates include the percent of the population that is < -2 Z-scores plus cases of oedema. Acute malnutrition is a
direct outcome indicator of recent changes in nutritional status. High or increasing levels of acute malnutrition
in a population indicate current or recent stress at individual or household level. Young et al. (2005) review the
importance and role of nutrition information in humanitarian classifi cation systems.
- References/Sources: The UN Standing Committee on Nutrition (SCN) states that, “A prevalence of acute
malnutrition between 5-8% indicates a worrying nutritional situation and a prevalence of greater than 10%
corresponds to a serious nutrition situation” (SCN 2004 p. 37). WHO provides guidance as follows: low (<5%),
medium (5-9%, high (10-14%), and very high (>=15%) (quoted from FAO 2005, p 47). Howe and Devereux
(2005) reference “Famine Conditions” as 20-40%, and “Severe Famine Conditions” as >40%.
- Explanation of IPC Reference Thresholds: The IPC incorporates acute malnutrition in all Phases, and is generally
consistent with the sources cited above. A key reference threshold is that for Humanitarian Emergency, where
wasting is >15%. Making adjustments to fi t the IPC phases, the reference threshold for Famine/Humanitarian
Catastrophe is >30%, which is halfway between the thresholds used by Howe and Devereux for “Famine” and
“Severe Famine” conditions. Importantly, the IPC includes not just the absolute values of wasting levels to support
a Phase Classifi cation, but, for deteriorating situations, also includes the notions of “increasing” and “greater than
usual” - thus enabling a more contextual analysis of malnutrition rates and their meaning.
Table 4: IPC Reference Outcomes - Acute Malnutrition
Reference Outcome PH
ASE Generally
Food SecureModerately / Borderline
Food Insecure
AcuteFood and Livelihood
Crisis
Humanitarian Emergency
Famine / Humanitarian Catastrophe
1A and 1B 2 3 4 5
Acute Malnutrition(w/h < -2 z -scores) <3%
>3% but < 10%, usual range, stable
10-15%, > usual, increasing
>15%, > usual, increasing >30%
- Limitations: While wasting is a direct outcome of nutritional and health status, limitations in its use and
interpretation include: (1) wasting can be a late outcome indicator of a crisis, and response mechanisms based
on wasting can be too late for meaningful action, and (2) in populations where levels of acute malnutrition are
high outside times of acute crisis, levels during periods of crisis can be diffi cult to interpret, and (3) there is
on-going debate within the nutrition fi eld as to whether wasting rates are comparable across population groups
of different physiological structure (UNICEF forthcoming, Bradbury 1998).
- Potential Methods: The most common method of estimating levels of acute malnutrition levels at population
level is through random, representative sampling methods. A supporting method is the Mid-Upper Arm
Circumference (MUAC) measurement. Other indirect evidence can include health clinic data, admissions to
therapeutic feeding centers, expert observation, and others.
Stunting
- Importance: Stunting is defi ned as <-2 Z scores height for age. The CDC defi nes stunting as, “Growth failure in
a child that occurs over a slow cumulative process as a result of inadequate nutrition and/or repeated infections”
(WFP and CDC 2005). As such, levels of stunting indicate overall poverty and chronic malnutrition, of which
food insecurity can be a contributing factor.
ipc reference table - technical guidelines
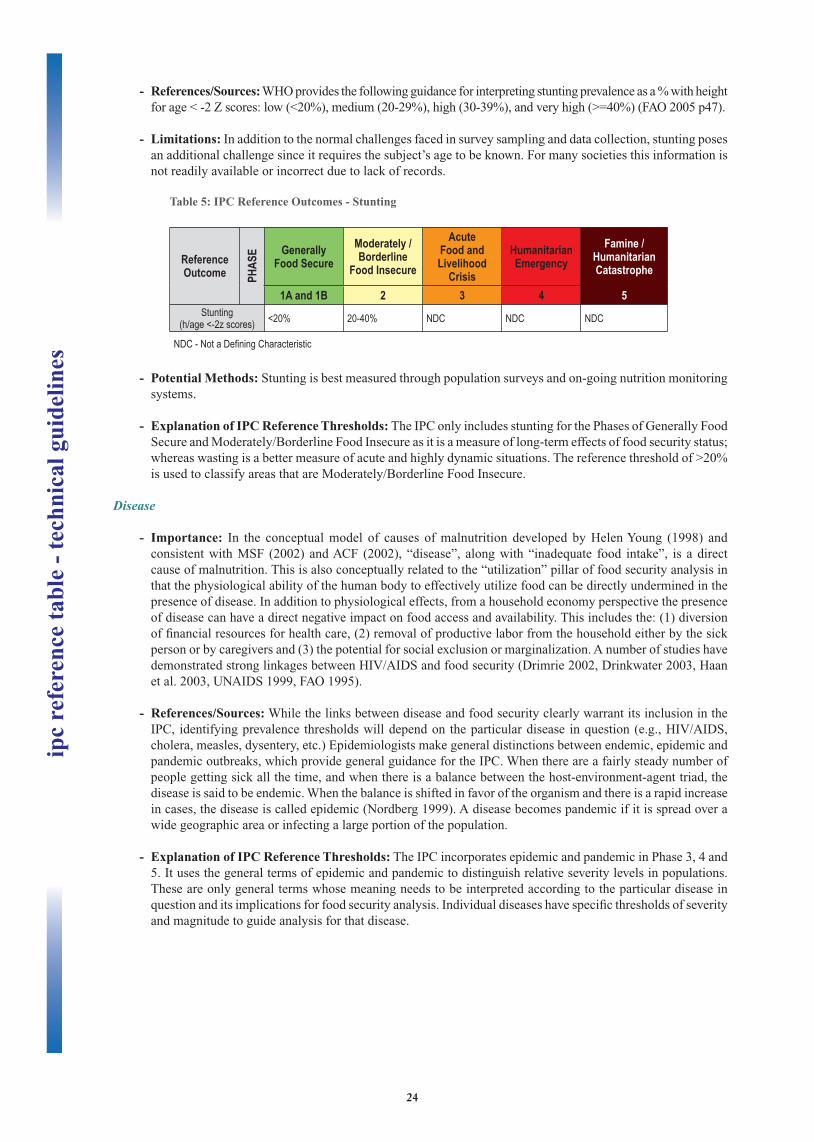
24
- References/Sources: WHO provides the following guidance for interpreting stunting prevalence as a % with height
for age < -2 Z scores: low (<20%), medium (20-29%), high (30-39%), and very high (>=40%) (FAO 2005 p47).
- Limitations: In addition to the normal challenges faced in survey sampling and data collection, stunting poses
an additional challenge since it requires the subject’s age to be known. For many societies this information is
not readily available or incorrect due to lack of records.
Table 5: IPC Reference Outcomes - Stunting
ReferenceOutcome PH
ASE Generally
Food SecureModerately /Borderline
Food Insecure
AcuteFood and Livelihood
Crisis
Humanitarian Emergency
Famine / Humanitarian Catastrophe
1A and 1B 2 3 4 5Stunting
(h/age <-2z scores) <20% 20-40% NDC NDC NDC
NDC - Not a Defi ning Characteristic
- Potential Methods: Stunting is best measured through population surveys and on-going nutrition monitoring
systems.
- Explanation of IPC Reference Thresholds: The IPC only includes stunting for the Phases of Generally Food
Secure and Moderately/Borderline Food Insecure as it is a measure of long-term effects of food security status;
whereas wasting is a better measure of acute and highly dynamic situations. The reference threshold of >20%
is used to classify areas that are Moderately/Borderline Food Insecure.
Disease
- Importance: In the conceptual model of causes of malnutrition developed by Helen Young (1998) and
consistent with MSF (2002) and ACF (2002), “disease”, along with “inadequate food intake”, is a direct
cause of malnutrition. This is also conceptually related to the “utilization” pillar of food security analysis in
that the physiological ability of the human body to effectively utilize food can be directly undermined in the
presence of disease. In addition to physiological effects, from a household economy perspective the presence
of disease can have a direct negative impact on food access and availability. This includes the: (1) diversion
of fi nancial resources for health care, (2) removal of productive labor from the household either by the sick
person or by caregivers and (3) the potential for social exclusion or marginalization. A number of studies have
demonstrated strong linkages between HIV/AIDS and food security (Drimrie 2002, Drinkwater 2003, Haan
et al. 2003, UNAIDS 1999, FAO 1995).
- References/Sources: While the links between disease and food security clearly warrant its inclusion in the
IPC, identifying prevalence thresholds will depend on the particular disease in question (e.g., HIV/AIDS,
cholera, measles, dysentery, etc.) Epidemiologists make general distinctions between endemic, epidemic and
pandemic outbreaks, which provide general guidance for the IPC. When there are a fairly steady number of
people getting sick all the time, and when there is a balance between the host-environment-agent triad, the
disease is said to be endemic. When the balance is shifted in favor of the organism and there is a rapid increase
in cases, the disease is called epidemic (Nordberg 1999). A disease becomes pandemic if it is spread over a
wide geographic area or infecting a large portion of the population.
- Explanation of IPC Reference Thresholds: The IPC incorporates epidemic and pandemic in Phase 3, 4 and
5. It uses the general terms of epidemic and pandemic to distinguish relative severity levels in populations.
These are only general terms whose meaning needs to be interpreted according to the particular disease in
question and its implications for food security analysis. Individual diseases have specifi c thresholds of severity
and magnitude to guide analysis for that disease.
ipc
refe
renc
e ta
ble
- te
chni
cal g
uide
lines
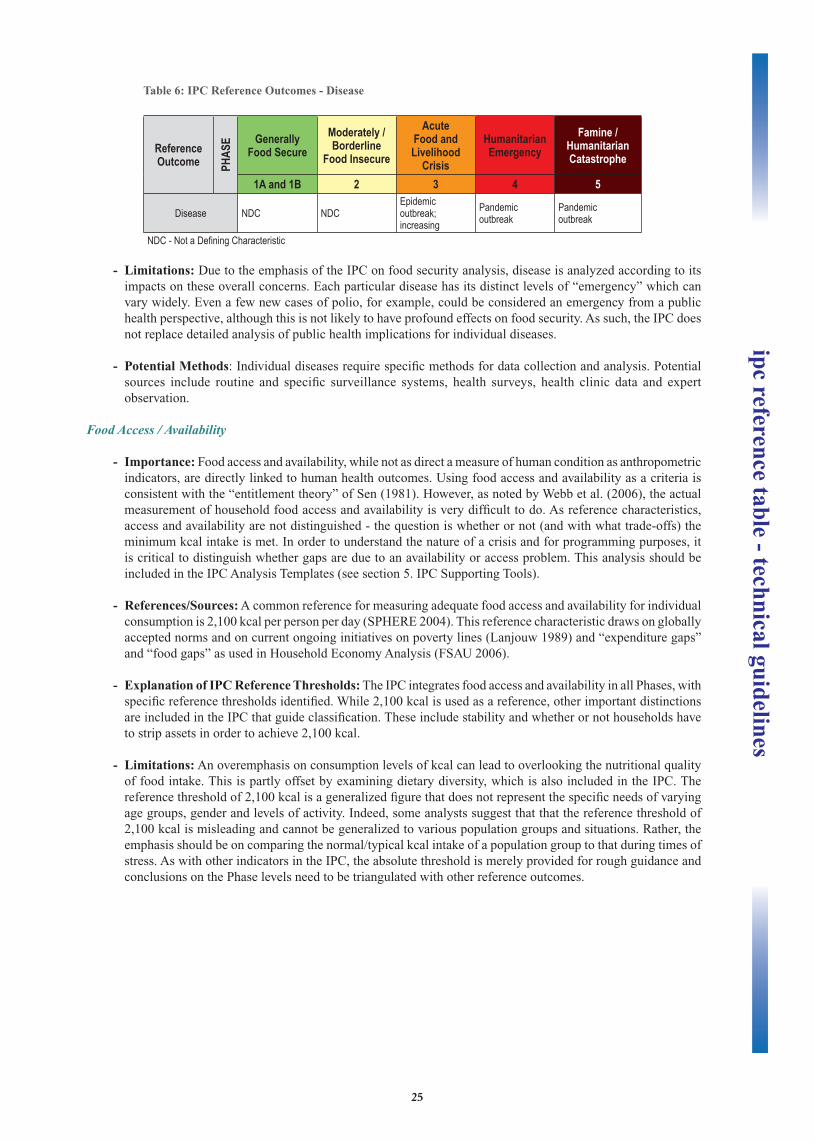
25
Table 6: IPC Reference Outcomes - Disease
Reference Outcome PH
ASE Generally
Food SecureModerately /Borderline
Food Insecure
AcuteFood and Livelihood
Crisis
Humanitarian Emergency
Famine / Humanitarian Catastrophe
1A and 1B 2 3 4 5
Disease NDC NDCEpidemic outbreak; increasing
Pandemic outbreak
Pandemic outbreak
NDC - Not a Defi ning Characteristic
- Limitations: Due to the emphasis of the IPC on food security analysis, disease is analyzed according to its
impacts on these overall concerns. Each particular disease has its distinct levels of “emergency” which can
vary widely. Even a few new cases of polio, for example, could be considered an emergency from a public
health perspective, although this is not likely to have profound effects on food security. As such, the IPC does
not replace detailed analysis of public health implications for individual diseases.
- Potential Methods: Individual diseases require specifi c methods for data collection and analysis. Potential
sources include routine and specifi c surveillance systems, health surveys, health clinic data and expert
observation.
Food Access / Availability
- Importance: Food access and availability, while not as direct a measure of human condition as anthropometric
indicators, are directly linked to human health outcomes. Using food access and availability as a criteria is
consistent with the “entitlement theory” of Sen (1981). However, as noted by Webb et al. (2006), the actual
measurement of household food access and availability is very diffi cult to do. As reference characteristics,
access and availability are not distinguished - the question is whether or not (and with what trade-offs) the
minimum kcal intake is met. In order to understand the nature of a crisis and for programming purposes, it
is critical to distinguish whether gaps are due to an availability or access problem. This analysis should be
included in the IPC Analysis Templates (see section 5. IPC Supporting Tools).
- References/Sources: A common reference for measuring adequate food access and availability for individual
consumption is 2,100 kcal per person per day (SPHERE 2004). This reference characteristic draws on globally
accepted norms and on current ongoing initiatives on poverty lines (Lanjouw 1989) and “expenditure gaps”
and “food gaps” as used in Household Economy Analysis (FSAU 2006).
- Explanation of IPC Reference Thresholds: The IPC integrates food access and availability in all Phases, with
specifi c reference thresholds identifi ed. While 2,100 kcal is used as a reference, other important distinctions
are included in the IPC that guide classifi cation. These include stability and whether or not households have
to strip assets in order to achieve 2,100 kcal.
- Limitations: An overemphasis on consumption levels of kcal can lead to overlooking the nutritional quality
of food intake. This is partly offset by examining dietary diversity, which is also included in the IPC. The
reference threshold of 2,100 kcal is a generalized fi gure that does not represent the specifi c needs of varying
age groups, gender and levels of activity. Indeed, some analysts suggest that that the reference threshold of
2,100 kcal is misleading and cannot be generalized to various population groups and situations. Rather, the
emphasis should be on comparing the normal/typical kcal intake of a population group to that during times of
stress. As with other indicators in the IPC, the absolute threshold is merely provided for rough guidance and
conclusions on the Phase levels need to be triangulated with other reference outcomes.
ipc reference table - technical guidelines
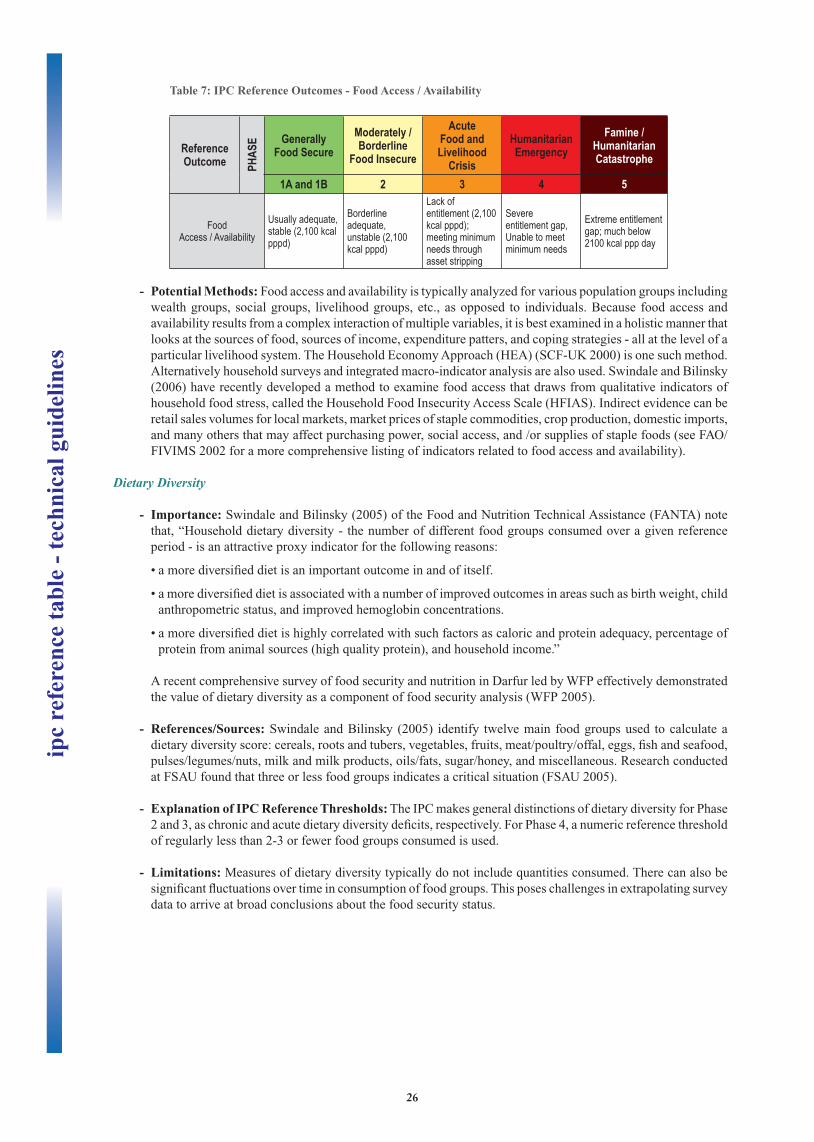
26
Table 7: IPC Reference Outcomes - Food Access / Availability
Reference Outcome PH
ASE Generally
Food SecureModerately / Borderline
Food Insecure
AcuteFood and Livelihood
Crisis
Humanitarian Emergency
Famine / Humanitarian Catastrophe
1A and 1B 2 3 4 5
Food Access / Availability
Usually adequate, stable (2,100 kcal pppd)
Borderline adequate, unstable (2,100 kcal pppd)
Lack of entitlement (2,100 kcal pppd); meeting minimum needs through asset stripping
Severe entitlement gap,Unable to meet minimum needs
Extreme entitlement gap; much below 2100 kcal ppp day
- Potential Methods: Food access and availability is typically analyzed for various population groups including
wealth groups, social groups, livelihood groups, etc., as opposed to individuals. Because food access and
availability results from a complex interaction of multiple variables, it is best examined in a holistic manner that
looks at the sources of food, sources of income, expenditure patters, and coping strategies - all at the level of a
particular livelihood system. The Household Economy Approach (HEA) (SCF-UK 2000) is one such method.
Alternatively household surveys and integrated macro-indicator analysis are also used. Swindale and Bilinsky
(2006) have recently developed a method to examine food access that draws from qualitative indicators of
household food stress, called the Household Food Insecurity Access Scale (HFIAS). Indirect evidence can be
retail sales volumes for local markets, market prices of staple commodities, crop production, domestic imports,
and many others that may affect purchasing power, social access, and /or supplies of staple foods (see FAO/
FIVIMS 2002 for a more comprehensive listing of indicators related to food access and availability).
Dietary Diversity
- Importance: Swindale and Bilinsky (2005) of the Food and Nutrition Technical Assistance (FANTA) note
that, “Household dietary diversity - the number of different food groups consumed over a given reference
period - is an attractive proxy indicator for the following reasons:
• a more diversifi ed diet is an important outcome in and of itself.
• a more diversifi ed diet is associated with a number of improved outcomes in areas such as birth weight, child
anthropometric status, and improved hemoglobin concentrations.
• a more diversifi ed diet is highly correlated with such factors as caloric and protein adequacy, percentage of
protein from animal sources (high quality protein), and household income.”
A recent comprehensive survey of food security and nutrition in Darfur led by WFP effectively demonstrated
the value of dietary diversity as a component of food security analysis (WFP 2005).
- References/Sources: Swindale and Bilinsky (2005) identify twelve main food groups used to calculate a
dietary diversity score: cereals, roots and tubers, vegetables, fruits, meat/poultry/offal, eggs, fi sh and seafood,
pulses/legumes/nuts, milk and milk products, oils/fats, sugar/honey, and miscellaneous. Research conducted
at FSAU found that three or less food groups indicates a critical situation (FSAU 2005).
- Explanation of IPC Reference Thresholds: The IPC makes general distinctions of dietary diversity for Phase
2 and 3, as chronic and acute dietary diversity defi cits, respectively. For Phase 4, a numeric reference threshold
of regularly less than 2-3 or fewer food groups consumed is used.
- Limitations: Measures of dietary diversity typically do not include quantities consumed. There can also be
signifi cant fl uctuations over time in consumption of food groups. This poses challenges in extrapolating survey
data to arrive at broad conclusions about the food security status.
ipc
refe
renc
e ta
ble
- te
chni
cal g
uide
lines
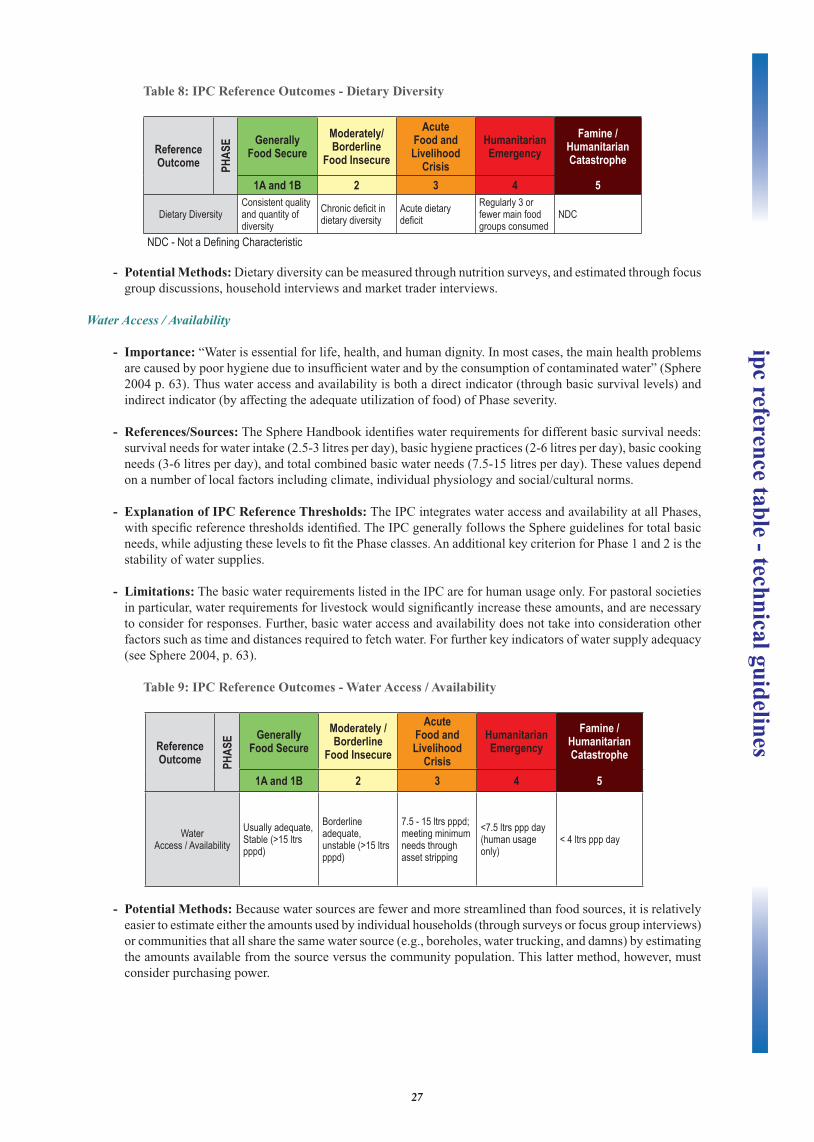
27
Table 8: IPC Reference Outcomes - Dietary Diversity
Reference Outcome PH
ASE Generally
Food SecureModerately/ Borderline
Food Insecure
AcuteFood and Livelihood
Crisis
Humanitarian Emergency
Famine / Humanitarian Catastrophe
1A and 1B 2 3 4 5
Dietary DiversityConsistent quality and quantity of diversity
Chronic defi cit in dietary diversity
Acute dietary defi cit
Regularly 3 or fewer main food groups consumed
NDC
NDC - Not a Defi ning Characteristic
- Potential Methods: Dietary diversity can be measured through nutrition surveys, and estimated through focus
group discussions, household interviews and market trader interviews.
Water Access / Availability
- Importance: “Water is essential for life, health, and human dignity. In most cases, the main health problems
are caused by poor hygiene due to insuffi cient water and by the consumption of contaminated water” (Sphere
2004 p. 63). Thus water access and availability is both a direct indicator (through basic survival levels) and
indirect indicator (by affecting the adequate utilization of food) of Phase severity.
- References/Sources: The Sphere Handbook identifi es water requirements for different basic survival needs:
survival needs for water intake (2.5-3 litres per day), basic hygiene practices (2-6 litres per day), basic cooking
needs (3-6 litres per day), and total combined basic water needs (7.5-15 litres per day). These values depend
on a number of local factors including climate, individual physiology and social/cultural norms.
- Explanation of IPC Reference Thresholds: The IPC integrates water access and availability at all Phases,
with specifi c reference thresholds identifi ed. The IPC generally follows the Sphere guidelines for total basic
needs, while adjusting these levels to fi t the Phase classes. An additional key criterion for Phase 1 and 2 is the
stability of water supplies.
- Limitations: The basic water requirements listed in the IPC are for human usage only. For pastoral societies
in particular, water requirements for livestock would signifi cantly increase these amounts, and are necessary
to consider for responses. Further, basic water access and availability does not take into consideration other
factors such as time and distances required to fetch water. For further key indicators of water supply adequacy
(see Sphere 2004, p. 63).
Table 9: IPC Reference Outcomes - Water Access / Availability
Reference Outcome PH
ASE Generally
Food SecureModerately /Borderline
Food Insecure
AcuteFood and Livelihood
Crisis
Humanitarian Emergency
Famine / Humanitarian Catastrophe
1A and 1B 2 3 4 5
Water Access / Availability
Usually adequate,Stable (>15 ltrs pppd)
Borderline adequate, unstable (>15 ltrs pppd)
7.5 - 15 ltrs pppd; meeting minimum needs through asset stripping
<7.5 ltrs ppp day (human usage only)
< 4 ltrs ppp day
- Potential Methods: Because water sources are fewer and more streamlined than food sources, it is relatively
easier to estimate either the amounts used by individual households (through surveys or focus group interviews)
or communities that all share the same water source (e.g., boreholes, water trucking, and damns) by estimating
the amounts available from the source versus the community population. This latter method, however, must
consider purchasing power.
ipc reference table - technical guidelines
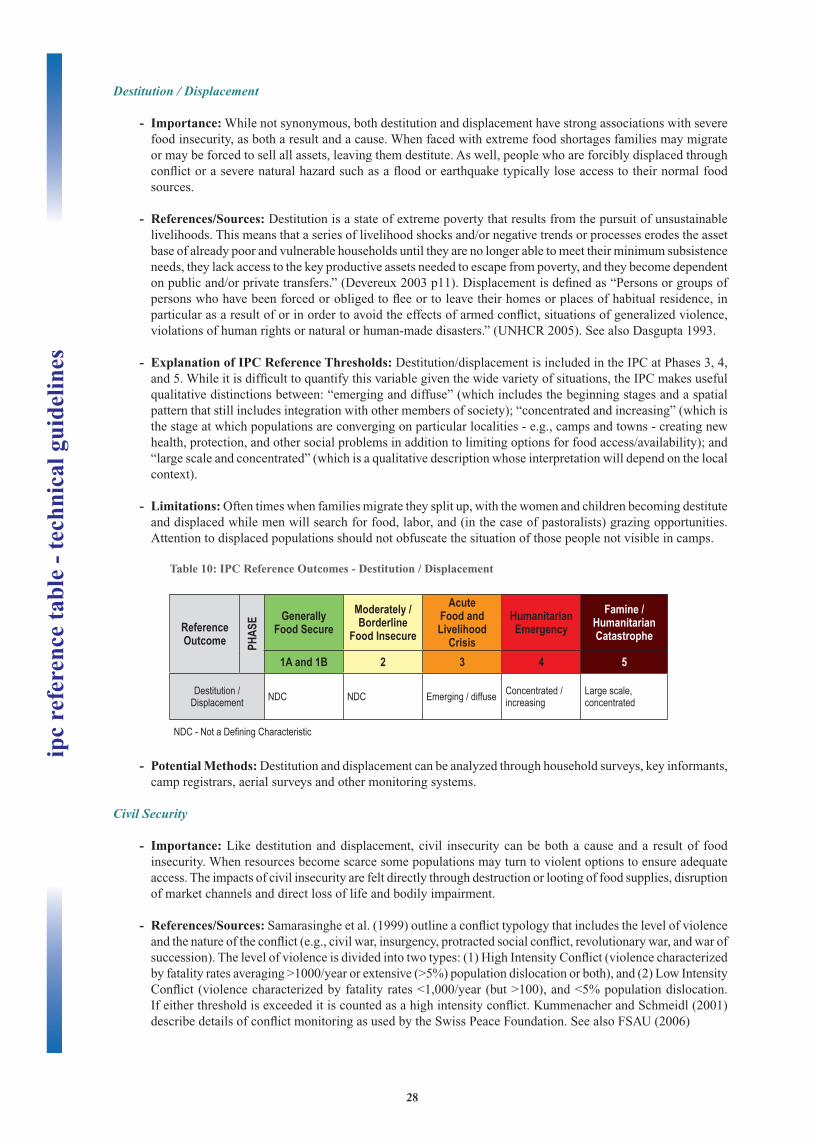
28
Destitution / Displacement
- Importance: While not synonymous, both destitution and displacement have strong associations with severe
food insecurity, as both a result and a cause. When faced with extreme food shortages families may migrate
or may be forced to sell all assets, leaving them destitute. As well, people who are forcibly displaced through
confl ict or a severe natural hazard such as a fl ood or earthquake typically lose access to their normal food
sources.
- References/Sources: Destitution is a state of extreme poverty that results from the pursuit of unsustainable
livelihoods. This means that a series of livelihood shocks and/or negative trends or processes erodes the asset
base of already poor and vulnerable households until they are no longer able to meet their minimum subsistence
needs, they lack access to the key productive assets needed to escape from poverty, and they become dependent
on public and/or private transfers.” (Devereux 2003 p11). Displacement is defi ned as “Persons or groups of
persons who have been forced or obliged to fl ee or to leave their homes or places of habitual residence, in
particular as a result of or in order to avoid the effects of armed confl ict, situations of generalized violence,
violations of human rights or natural or human-made disasters.” (UNHCR 2005). See also Dasgupta 1993.
- Explanation of IPC Reference Thresholds: Destitution/displacement is included in the IPC at Phases 3, 4,
and 5. While it is diffi cult to quantify this variable given the wide variety of situations, the IPC makes useful
qualitative distinctions between: “emerging and diffuse” (which includes the beginning stages and a spatial
pattern that still includes integration with other members of society); “concentrated and increasing” (which is
the stage at which populations are converging on particular localities - e.g., camps and towns - creating new
health, protection, and other social problems in addition to limiting options for food access/availability); and
“large scale and concentrated” (which is a qualitative description whose interpretation will depend on the local
context).
- Limitations: Often times when families migrate they split up, with the women and children becoming destitute
and displaced while men will search for food, labor, and (in the case of pastoralists) grazing opportunities.
Attention to displaced populations should not obfuscate the situation of those people not visible in camps.
Table 10: IPC Reference Outcomes - Destitution / Displacement
Reference Outcome PH
ASE Generally
Food SecureModerately /Borderline
Food Insecure
AcuteFood and Livelihood
Crisis
Humanitarian Emergency
Famine / Humanitarian Catastrophe
1A and 1B 2 3 4 5
Destitution / Displacement NDC NDC Emerging / diffuse Concentrated /
increasingLarge scale, concentrated
NDC - Not a Defi ning Characteristic
- Potential Methods: Destitution and displacement can be analyzed through household surveys, key informants,
camp registrars, aerial surveys and other monitoring systems.
Civil Security
- Importance: Like destitution and displacement, civil insecurity can be both a cause and a result of food
insecurity. When resources become scarce some populations may turn to violent options to ensure adequate
access. The impacts of civil insecurity are felt directly through destruction or looting of food supplies, disruption
of market channels and direct loss of life and bodily impairment.
- References/Sources: Samarasinghe et al. (1999) outline a confl ict typology that includes the level of violence
and the nature of the confl ict (e.g., civil war, insurgency, protracted social confl ict, revolutionary war, and war of
succession). The level of violence is divided into two types: (1) High Intensity Confl ict (violence characterized
by fatality rates averaging >1000/year or extensive (>5%) population dislocation or both), and (2) Low Intensity
Confl ict (violence characterized by fatality rates <1,000/year (but >100), and <5% population dislocation.
If either threshold is exceeded it is counted as a high intensity confl ict. Kummenacher and Schmeidl (2001)
describe details of confl ict monitoring as used by the Swiss Peace Foundation. See also FSAU (2006)
ipc
refe
renc
e ta
ble
- te
chni
cal g
uide
lines
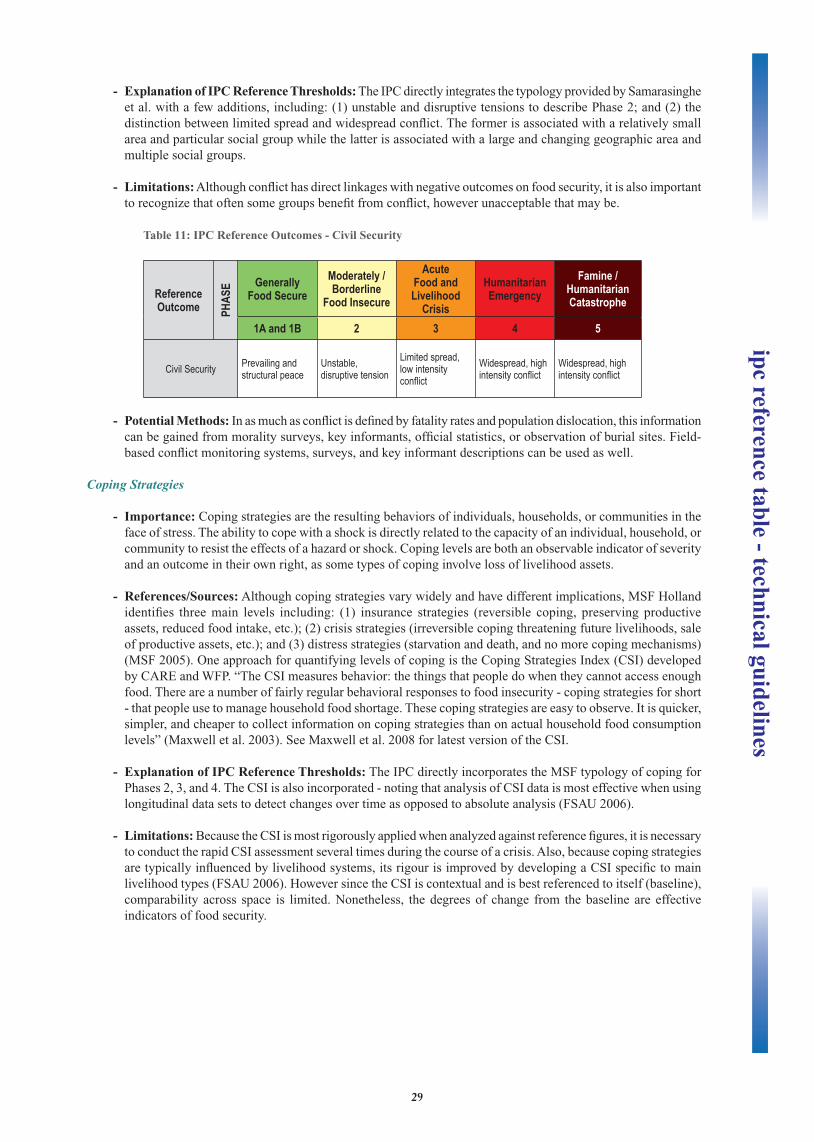
29
- Explanation of IPC Reference Thresholds: The IPC directly integrates the typology provided by Samarasinghe
et al. with a few additions, including: (1) unstable and disruptive tensions to describe Phase 2; and (2) the
distinction between limited spread and widespread confl ict. The former is associated with a relatively small
area and particular social group while the latter is associated with a large and changing geographic area and
multiple social groups.
- Limitations: Although confl ict has direct linkages with negative outcomes on food security, it is also important
to recognize that often some groups benefi t from confl ict, however unacceptable that may be.
Table 11: IPC Reference Outcomes - Civil Security
Reference Outcome PH
ASE Generally
Food SecureModerately /Borderline
Food Insecure
AcuteFood and Livelihood
Crisis
Humanitarian Emergency
Famine / Humanitarian Catastrophe
1A and 1B 2 3 4 5
Civil Security Prevailing and structural peace
Unstable, disruptive tension
Limited spread, low intensity confl ict
Widespread, high intensity confl ict
Widespread, high intensity confl ict
- Potential Methods: In as much as confl ict is defi ned by fatality rates and population dislocation, this information
can be gained from morality surveys, key informants, offi cial statistics, or observation of burial sites. Field-
based confl ict monitoring systems, surveys, and key informant descriptions can be used as well.
Coping Strategies
- Importance: Coping strategies are the resulting behaviors of individuals, households, or communities in the
face of stress. The ability to cope with a shock is directly related to the capacity of an individual, household, or
community to resist the effects of a hazard or shock. Coping levels are both an observable indicator of severity
and an outcome in their own right, as some types of coping involve loss of livelihood assets.
- References/Sources: Although coping strategies vary widely and have different implications, MSF Holland
identifi es three main levels including: (1) insurance strategies (reversible coping, preserving productive
assets, reduced food intake, etc.); (2) crisis strategies (irreversible coping threatening future livelihoods, sale
of productive assets, etc.); and (3) distress strategies (starvation and death, and no more coping mechanisms)
(MSF 2005). One approach for quantifying levels of coping is the Coping Strategies Index (CSI) developed
by CARE and WFP. “The CSI measures behavior: the things that people do when they cannot access enough
food. There are a number of fairly regular behavioral responses to food insecurity - coping strategies for short
- that people use to manage household food shortage. These coping strategies are easy to observe. It is quicker,
simpler, and cheaper to collect information on coping strategies than on actual household food consumption
levels” (Maxwell et al. 2003). See Maxwell et al. 2008 for latest version of the CSI.
- Explanation of IPC Reference Thresholds: The IPC directly incorporates the MSF typology of coping for
Phases 2, 3, and 4. The CSI is also incorporated - noting that analysis of CSI data is most effective when using
longitudinal data sets to detect changes over time as opposed to absolute analysis (FSAU 2006).
- Limitations: Because the CSI is most rigorously applied when analyzed against reference fi gures, it is necessary
to conduct the rapid CSI assessment several times during the course of a crisis. Also, because coping strategies
are typically infl uenced by livelihood systems, its rigour is improved by developing a CSI specifi c to main
livelihood types (FSAU 2006). However since the CSI is contextual and is best referenced to itself (baseline),
comparability across space is limited. Nonetheless, the degrees of change from the baseline are effective
indicators of food security.
ipc reference table - technical guidelines
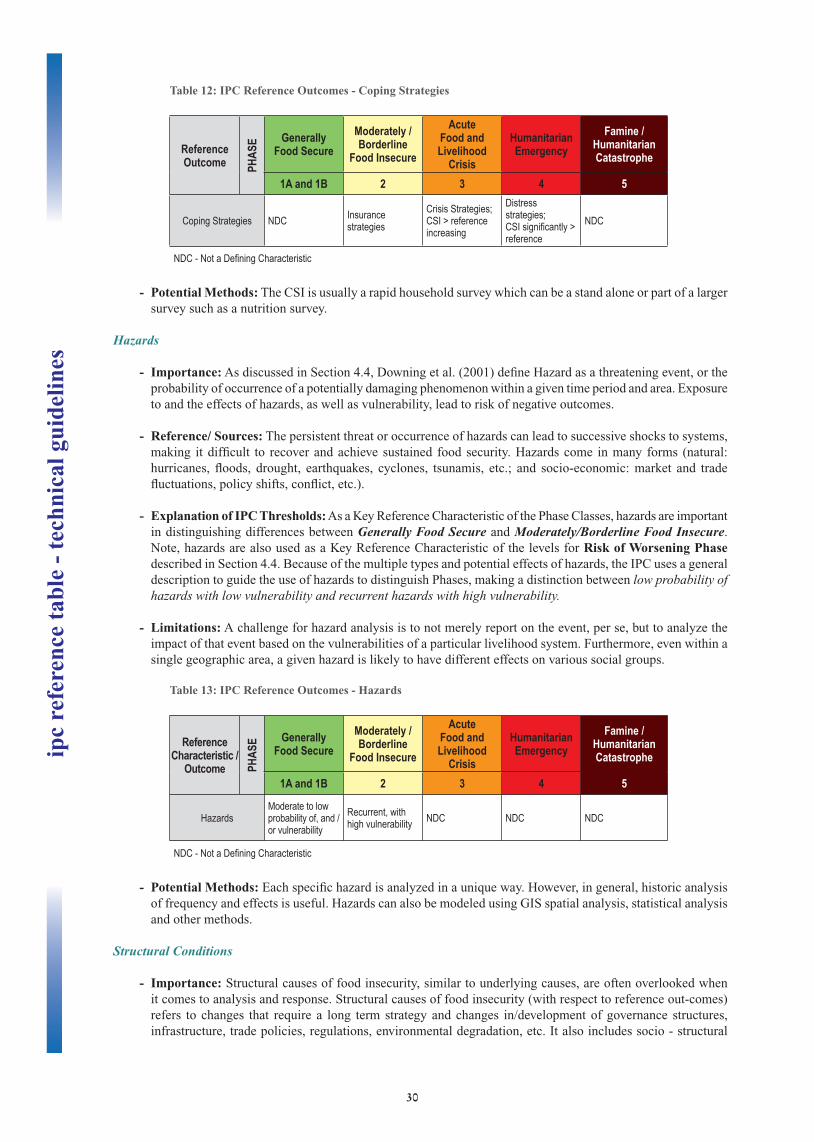
30
Table 12: IPC Reference Outcomes - Coping Strategies
Reference Outcome PH
ASE Generally
Food SecureModerately /Borderline
Food Insecure
AcuteFood and Livelihood
Crisis
Humanitarian Emergency
Famine / Humanitarian Catastrophe
1A and 1B 2 3 4 5
Coping Strategies NDC Insurance strategies
Crisis Strategies; CSI > reference increasing
Distress strategies;CSI signifi cantly > reference
NDC
NDC - Not a Defi ning Characteristic
- Potential Methods: The CSI is usually a rapid household survey which can be a stand alone or part of a larger
survey such as a nutrition survey.
Hazards
- Importance: As discussed in Section 4.4, Downing et al. (2001) defi ne Hazard as a threatening event, or the
probability of occurrence of a potentially damaging phenomenon within a given time period and area. Exposure
to and the effects of hazards, as well as vulnerability, lead to risk of negative outcomes.
- Reference/ Sources: The persistent threat or occurrence of hazards can lead to successive shocks to systems,
making it diffi cult to recover and achieve sustained food security. Hazards come in many forms (natural:
hurricanes, fl oods, drought, earthquakes, cyclones, tsunamis, etc.; and socio-economic: market and trade
fl uctuations, policy shifts, confl ict, etc.).
- Explanation of IPC Thresholds: As a Key Reference Characteristic of the Phase Classes, hazards are important
in distinguishing differences between Generally Food Secure and Moderately/Borderline Food Insecure.
Note, hazards are also used as a Key Reference Characteristic of the levels for Risk of Worsening Phase
described in Section 4.4. Because of the multiple types and potential effects of hazards, the IPC uses a general
description to guide the use of hazards to distinguish Phases, making a distinction between low probability of hazards with low vulnerability and recurrent hazards with high vulnerability.
- Limitations: A challenge for hazard analysis is to not merely report on the event, per se, but to analyze the
impact of that event based on the vulnerabilities of a particular livelihood system. Furthermore, even within a
single geographic area, a given hazard is likely to have different effects on various social groups.
Table 13: IPC Reference Outcomes - Hazards
Reference Characteristic /
Outcome PHAS
E Generally Food Secure
Moderately /Borderline
Food Insecure
AcuteFood and Livelihood
Crisis
Humanitarian Emergency
Famine / Humanitarian Catastrophe
1A and 1B 2 3 4 5
HazardsModerate to low probability of, and / or vulnerability
Recurrent, with high vulnerability NDC NDC NDC
NDC - Not a Defi ning Characteristic
- Potential Methods: Each specifi c hazard is analyzed in a unique way. However, in general, historic analysis
of frequency and effects is useful. Hazards can also be modeled using GIS spatial analysis, statistical analysis
and other methods.
Structural Conditions
- Importance: Structural causes of food insecurity, similar to underlying causes, are often overlooked when
it comes to analysis and response. Structural causes of food insecurity (with respect to reference out-comes)
refers to changes that require a long term strategy and changes in/development of governance structures,
infrastructure, trade policies, regulations, environmental degradation, etc. It also includes socio - structural
ipc
refe
renc
e ta
ble
- te
chni
cal g
uide
lines
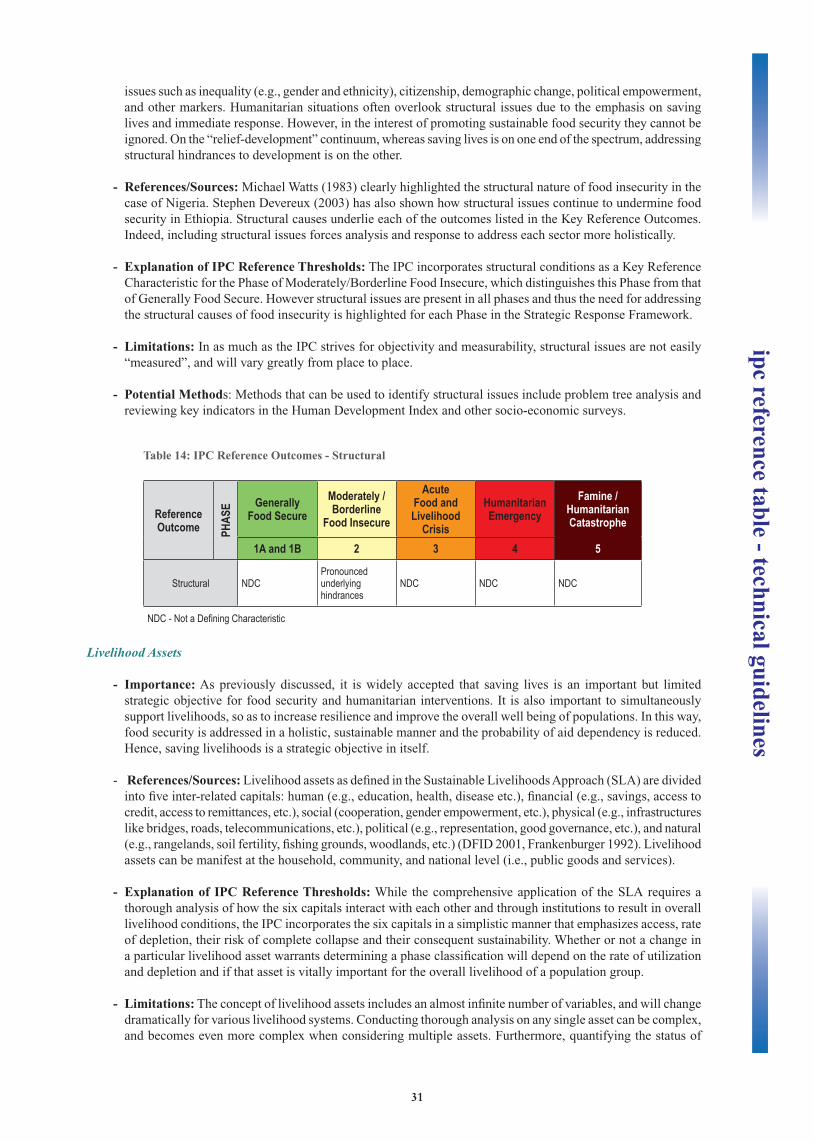
31
issues such as inequality (e.g., gender and ethnicity), citizenship, demographic change, political empowerment,
and other markers. Humanitarian situations often overlook structural issues due to the emphasis on saving
lives and immediate response. However, in the interest of promoting sustainable food security they cannot be
ignored. On the “relief-development” continuum, whereas saving lives is on one end of the spectrum, addressing
structural hindrances to development is on the other.
- References/Sources: Michael Watts (1983) clearly highlighted the structural nature of food insecurity in the
case of Nigeria. Stephen Devereux (2003) has also shown how structural issues continue to undermine food
security in Ethiopia. Structural causes underlie each of the outcomes listed in the Key Reference Outcomes.
Indeed, including structural issues forces analysis and response to address each sector more holistically.
- Explanation of IPC Reference Thresholds: The IPC incorporates structural conditions as a Key Reference
Characteristic for the Phase of Moderately/Borderline Food Insecure, which distinguishes this Phase from that
of Generally Food Secure. However structural issues are present in all phases and thus the need for addressing
the structural causes of food insecurity is highlighted for each Phase in the Strategic Response Framework.
- Limitations: In as much as the IPC strives for objectivity and measurability, structural issues are not easily
“measured”, and will vary greatly from place to place.
- Potential Methods: Methods that can be used to identify structural issues include problem tree analysis and
reviewing key indicators in the Human Development Index and other socio-economic surveys.
Table 14: IPC Reference Outcomes - Structural
Reference Outcome PH
ASE Generally
Food SecureModerately /Borderline
Food Insecure
AcuteFood and Livelihood
Crisis
Humanitarian Emergency
Famine / Humanitarian Catastrophe
1A and 1B 2 3 4 5
Structural NDCPronounced underlying hindrances
NDC NDC NDC
NDC - Not a Defi ning Characteristic
Livelihood Assets
- Importance: As previously discussed, it is widely accepted that saving lives is an important but limited
strategic objective for food security and humanitarian interventions. It is also important to simultaneously
support livelihoods, so as to increase resilience and improve the overall well being of populations. In this way,
food security is addressed in a holistic, sustainable manner and the probability of aid dependency is reduced.
Hence, saving livelihoods is a strategic objective in itself.
- References/Sources: Livelihood assets as defi ned in the Sustainable Livelihoods Approach (SLA) are divided
into fi ve inter-related capitals: human (e.g., education, health, disease etc.), fi nancial (e.g., savings, access to
credit, access to remittances, etc.), social (cooperation, gender empowerment, etc.), physical (e.g., infrastructures
like bridges, roads, telecommunications, etc.), political (e.g., representation, good governance, etc.), and natural
(e.g., rangelands, soil fertility, fi shing grounds, woodlands, etc.) (DFID 2001, Frankenburger 1992). Livelihood
assets can be manifest at the household, community, and national level (i.e., public goods and services).
- Explanation of IPC Reference Thresholds: While the comprehensive application of the SLA requires a
thorough analysis of how the six capitals interact with each other and through institutions to result in overall
livelihood conditions, the IPC incorporates the six capitals in a simplistic manner that emphasizes access, rate
of depletion, their risk of complete collapse and their consequent sustainability. Whether or not a change in
a particular livelihood asset warrants determining a phase classifi cation will depend on the rate of utilization
and depletion and if that asset is vitally important for the overall livelihood of a population group.
- Limitations: The concept of livelihood assets includes an almost infi nite number of variables, and will change
dramatically for various livelihood systems. Conducting thorough analysis on any single asset can be complex,
and becomes even more complex when considering multiple assets. Furthermore, quantifying the status of
ipc reference table - technical guidelines
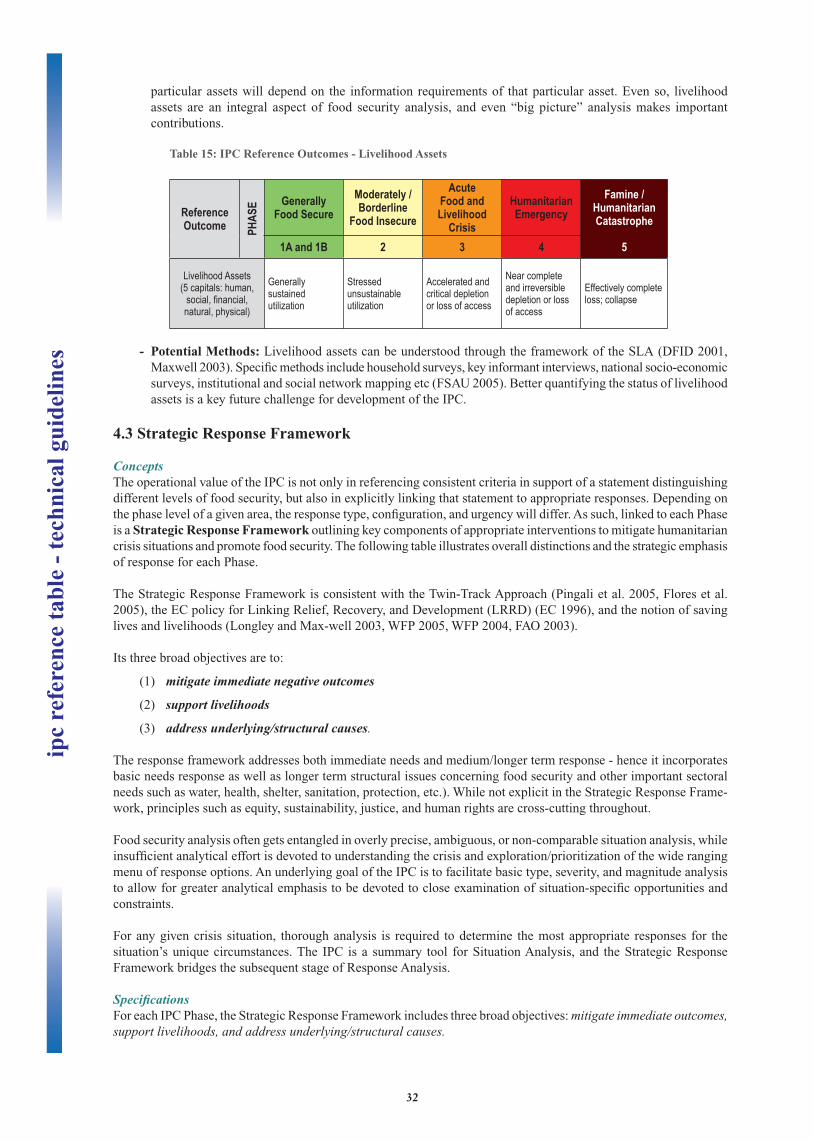
32
particular assets will depend on the information requirements of that particular asset. Even so, livelihood
assets are an integral aspect of food security analysis, and even “big picture” analysis makes important
contributions.
Table 15: IPC Reference Outcomes - Livelihood Assets
Reference Outcome PH
ASE Generally
Food SecureModerately /Borderline
Food Insecure
AcuteFood and Livelihood
Crisis
Humanitarian Emergency
Famine / Humanitarian Catastrophe
1A and 1B 2 3 4 5
Livelihood Assets(5 capitals: human,
social, fi nancial, natural, physical)
Generally sustained utilization
Stressed unsustainable utilization
Accelerated and critical depletion or loss of access
Near complete and irreversible depletion or loss of access
Effectively complete loss; collapse
- Potential Methods: Livelihood assets can be understood through the framework of the SLA (DFID 2001,
Maxwell 2003). Specifi c methods include household surveys, key informant interviews, national socio-economic
surveys, institutional and social network mapping etc (FSAU 2005). Better quantifying the status of livelihood
assets is a key future challenge for development of the IPC.
4.3 Strategic Response Framework
Concepts
The operational value of the IPC is not only in referencing consistent criteria in support of a statement distinguishing
different levels of food security, but also in explicitly linking that statement to appropriate responses. Depending on
the phase level of a given area, the response type, confi guration, and urgency will differ. As such, linked to each Phase
is a Strategic Response Framework outlining key components of appropriate interventions to mitigate humanitarian
crisis situations and promote food security. The following table illustrates overall distinctions and the strategic emphasis
of response for each Phase.
The Strategic Response Framework is consistent with the Twin-Track Approach (Pingali et al. 2005, Flores et al.
2005), the EC policy for Linking Relief, Recovery, and Development (LRRD) (EC 1996), and the notion of saving
lives and livelihoods (Longley and Max-well 2003, WFP 2005, WFP 2004, FAO 2003).
Its three broad objectives are to:
(1) mitigate immediate negative outcomes
(2) support livelihoods
(3) address underlying/structural causes.
The response framework addresses both immediate needs and medium/longer term response - hence it incorporates
basic needs response as well as longer term structural issues concerning food security and other important sectoral
needs such as water, health, shelter, sanitation, protection, etc.). While not explicit in the Strategic Response Frame-
work, principles such as equity, sustainability, justice, and human rights are cross-cutting throughout.
Food security analysis often gets entangled in overly precise, ambiguous, or non-comparable situation analysis, while
insuffi cient analytical effort is devoted to understanding the crisis and exploration/prioritization of the wide ranging
menu of response options. An underlying goal of the IPC is to facilitate basic type, severity, and magnitude analysis
to allow for greater analytical emphasis to be devoted to close examination of situation-specifi c opportunities and
constraints.
For any given crisis situation, thorough analysis is required to determine the most appropriate responses for the
situation’s unique circumstances. The IPC is a summary tool for Situation Analysis, and the Strategic Response
Framework bridges the subsequent stage of Response Analysis.
Specifi cations
For each IPC Phase, the Strategic Response Framework includes three broad objectives: mitigate immediate outcomes, support livelihoods, and address underlying/structural causes.
ipc
refe
renc
e ta
ble
- te
chni
cal g
uide
lines
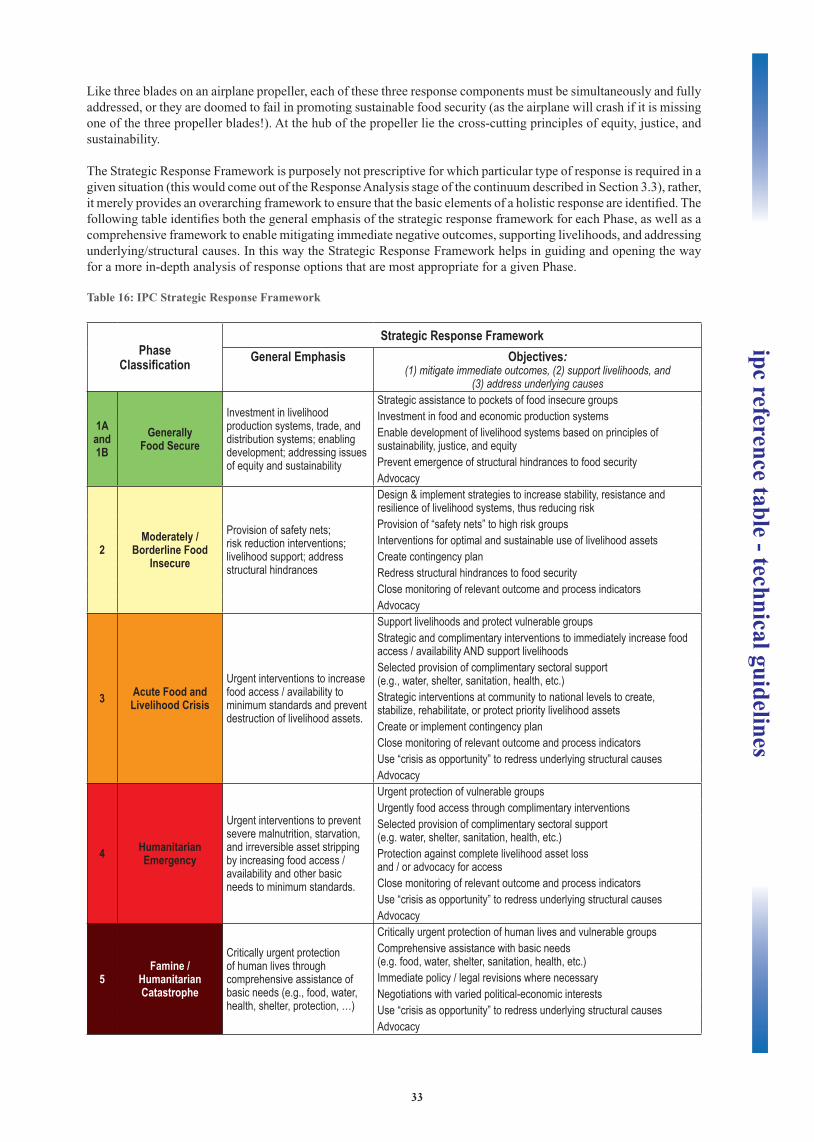
33
Like three blades on an airplane propeller, each of these three response components must be simultaneously and fully
addressed, or they are doomed to fail in promoting sustainable food security (as the airplane will crash if it is missing
one of the three propeller blades!). At the hub of the propeller lie the cross-cutting principles of equity, justice, and
sustainability.
The Strategic Response Framework is purposely not prescriptive for which particular type of response is required in a
given situation (this would come out of the Response Analysis stage of the continuum described in Section 3.3), rather,
it merely provides an overarching framework to ensure that the basic elements of a holistic response are identifi ed. The
following table identifi es both the general emphasis of the strategic response framework for each Phase, as well as a
comprehensive framework to enable mitigating immediate negative outcomes, supporting livelihoods, and addressing
underlying/structural causes. In this way the Strategic Response Framework helps in guiding and opening the way
for a more in-depth analysis of response options that are most appropriate for a given Phase.
Table 16: IPC Strategic Response Framework
PhaseClassifi cation
Strategic Response FrameworkGeneral Emphasis Objectives:
(1) mitigate immediate outcomes, (2) support livelihoods, and (3) address underlying causes
1A and 1B
GenerallyFood Secure
Investment in livelihood production systems, trade, and distribution systems; enabling development; addressing issues of equity and sustainability
Strategic assistance to pockets of food insecure groupsInvestment in food and economic production systemsEnable development of livelihood systems based on principles of sustainability, justice, and equityPrevent emergence of structural hindrances to food securityAdvocacy
2Moderately /
Borderline Food Insecure
Provision of safety nets; risk reduction interventions; livelihood support; address structural hindrances
Design & implement strategies to increase stability, resistance and resilience of livelihood systems, thus reducing riskProvision of “safety nets” to high risk groupsInterventions for optimal and sustainable use of livelihood assetsCreate contingency planRedress structural hindrances to food securityClose monitoring of relevant outcome and process indicatorsAdvocacy
3 Acute Food and Livelihood Crisis
Urgent interventions to increase food access / availability to minimum standards and prevent destruction of livelihood assets.
Support livelihoods and protect vulnerable groupsStrategic and complimentary interventions to immediately increase food access / availability AND support livelihoodsSelected provision of complimentary sectoral support (e.g., water, shelter, sanitation, health, etc.)Strategic interventions at community to national levels to create, stabilize, rehabilitate, or protect priority livelihood assetsCreate or implement contingency planClose monitoring of relevant outcome and process indicatorsUse “crisis as opportunity” to redress underlying structural causesAdvocacy
4 Humanitarian Emergency
Urgent interventions to prevent severe malnutrition, starvation, and irreversible asset stripping by increasing food access / availability and other basic needs to minimum standards.
Urgent protection of vulnerable groupsUrgently food access through complimentary interventionsSelected provision of complimentary sectoral support (e.g. water, shelter, sanitation, health, etc.)Protection against complete livelihood asset loss and / or advocacy for accessClose monitoring of relevant outcome and process indicatorsUse “crisis as opportunity” to redress underlying structural causesAdvocacy
5Famine /
HumanitarianCatastrophe
Critically urgent protection of human lives through comprehensive assistance of basic needs (e.g., food, water, health, shelter, protection, …)
Critically urgent protection of human lives and vulnerable groupsComprehensive assistance with basic needs (e.g. food, water, shelter, sanitation, health, etc.)Immediate policy / legal revisions where necessaryNegotiations with varied political-economic interestsUse “crisis as opportunity” to redress underlying structural causesAdvocacy
ipc reference table - technical guidelines
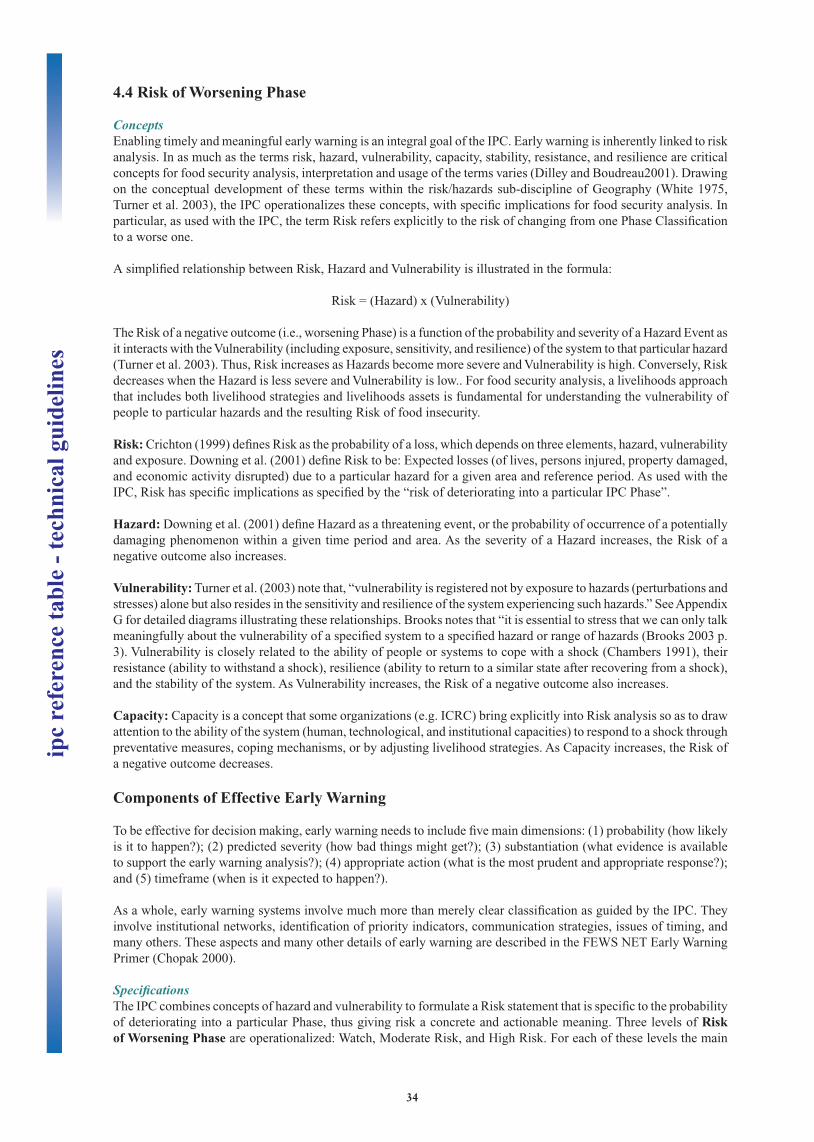
34
4.4 Risk of Worsening Phase
Concepts
Enabling timely and meaningful early warning is an integral goal of the IPC. Early warning is inherently linked to risk
analysis. In as much as the terms risk, hazard, vulnerability, capacity, stability, resistance, and resilience are critical
concepts for food security analysis, interpretation and usage of the terms varies (Dilley and Boudreau2001). Drawing
on the conceptual development of these terms within the risk/hazards sub-discipline of Geography (White 1975,
Turner et al. 2003), the IPC operationalizes these concepts, with specifi c implications for food security analysis. In
particular, as used with the IPC, the term Risk refers explicitly to the risk of changing from one Phase Classifi cation
to a worse one.
A simplifi ed relationship between Risk, Hazard and Vulnerability is illustrated in the formula:
Risk = (Hazard) x (Vulnerability)
The Risk of a negative outcome (i.e., worsening Phase) is a function of the probability and severity of a Hazard Event as
it interacts with the Vulnerability (including exposure, sensitivity, and resilience) of the system to that particular hazard
(Turner et al. 2003). Thus, Risk increases as Hazards become more severe and Vulnerability is high. Conversely, Risk
decreases when the Hazard is less severe and Vulnerability is low.. For food security analysis, a livelihoods approach
that includes both livelihood strategies and livelihoods assets is fundamental for understanding the vulnerability of
people to particular hazards and the resulting Risk of food insecurity.
Risk: Crichton (1999) defi nes Risk as the probability of a loss, which depends on three elements, hazard, vulnerability
and exposure. Downing et al. (2001) defi ne Risk to be: Expected losses (of lives, persons injured, property damaged,
and economic activity disrupted) due to a particular hazard for a given area and reference period. As used with the
IPC, Risk has specifi c implications as specifi ed by the “risk of deteriorating into a particular IPC Phase”.
Hazard: Downing et al. (2001) defi ne Hazard as a threatening event, or the probability of occurrence of a potentially
damaging phenomenon within a given time period and area. As the severity of a Hazard increases, the Risk of a
negative outcome also increases.
Vulnerability: Turner et al. (2003) note that, “vulnerability is registered not by exposure to hazards (perturbations and
stresses) alone but also resides in the sensitivity and resilience of the system experiencing such hazards.” See Appendix
G for detailed diagrams illustrating these relationships. Brooks notes that “it is essential to stress that we can only talk
meaningfully about the vulnerability of a specifi ed system to a specifi ed hazard or range of hazards (Brooks 2003 p.
3). Vulnerability is closely related to the ability of people or systems to cope with a shock (Chambers 1991), their
resistance (ability to withstand a shock), resilience (ability to return to a similar state after recovering from a shock),
and the stability of the system. As Vulnerability increases, the Risk of a negative outcome also increases.
Capacity: Capacity is a concept that some organizations (e.g. ICRC) bring explicitly into Risk analysis so as to draw
attention to the ability of the system (human, technological, and institutional capacities) to respond to a shock through
preventative measures, coping mechanisms, or by adjusting livelihood strategies. As Capacity increases, the Risk of
a negative outcome decreases.
Components of Effective Early Warning
To be effective for decision making, early warning needs to include fi ve main dimensions: (1) probability (how likely
is it to happen?); (2) predicted severity (how bad things might get?); (3) substantiation (what evidence is available
to support the early warning analysis?); (4) appropriate action (what is the most prudent and appropriate response?);
and (5) timeframe (when is it expected to happen?).
As a whole, early warning systems involve much more than merely clear classifi cation as guided by the IPC. They
involve institutional networks, identifi cation of priority indicators, communication strategies, issues of timing, and
many others. These aspects and many other details of early warning are described in the FEWS NET Early Warning
Primer (Chopak 2000).
Specifi cations
The IPC combines concepts of hazard and vulnerability to formulate a Risk statement that is specifi c to the probability
of deteriorating into a particular Phase, thus giving risk a concrete and actionable meaning. Three levels of Risk of Worsening Phase are operationalized: Watch, Moderate Risk, and High Risk. For each of these levels the main
ipc
refe
renc
e ta
ble
- te
chni
cal g
uide
lines
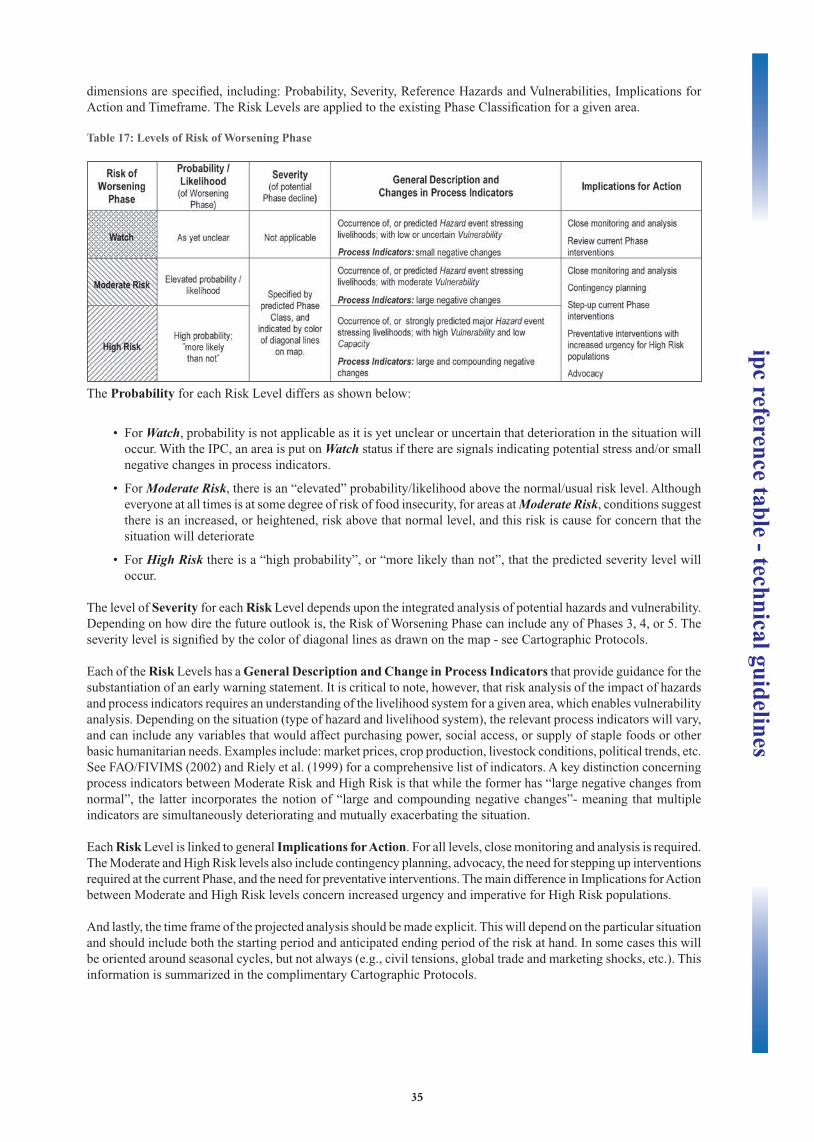
35
dimensions are specifi ed, including: Probability, Severity, Reference Hazards and Vulnerabilities, Implications for
Action and Timeframe. The Risk Levels are applied to the existing Phase Classifi cation for a given area.
Table 17: Levels of Risk of Worsening Phase
The Probability for each Risk Level differs as shown below:
• For Watch, probability is not applicable as it is yet unclear or uncertain that deterioration in the situation will
occur. With the IPC, an area is put on Watch status if there are signals indicating potential stress and/or small
negative changes in process indicators.
• For Moderate Risk, there is an “elevated” probability/likelihood above the normal/usual risk level. Although
everyone at all times is at some degree of risk of food insecurity, for areas at Moderate Risk, conditions suggest
there is an increased, or heightened, risk above that normal level, and this risk is cause for concern that the
situation will deteriorate
• For High Risk there is a “high probability”, or “more likely than not”, that the predicted severity level will
occur.
The level of Severity for each Risk Level depends upon the integrated analysis of potential hazards and vulnerability.
Depending on how dire the future outlook is, the Risk of Worsening Phase can include any of Phases 3, 4, or 5. The
severity level is signifi ed by the color of diagonal lines as drawn on the map - see Cartographic Protocols.
Each of the Risk Levels has a General Description and Change in Process Indicators that provide guidance for the
substantiation of an early warning statement. It is critical to note, however, that risk analysis of the impact of hazards
and process indicators requires an understanding of the livelihood system for a given area, which enables vulnerability
analysis. Depending on the situation (type of hazard and livelihood system), the relevant process indicators will vary,
and can include any variables that would affect purchasing power, social access, or supply of staple foods or other
basic humanitarian needs. Examples include: market prices, crop production, livestock conditions, political trends, etc.
See FAO/FIVIMS (2002) and Riely et al. (1999) for a comprehensive list of indicators. A key distinction concerning
process indicators between Moderate Risk and High Risk is that while the former has “large negative changes from
normal”, the latter incorporates the notion of “large and compounding negative changes”- meaning that multiple
indicators are simultaneously deteriorating and mutually exacerbating the situation.
Each Risk Level is linked to general Implications for Action. For all levels, close monitoring and analysis is required.
The Moderate and High Risk levels also include contingency planning, advocacy, the need for stepping up interventions
required at the current Phase, and the need for preventative interventions. The main difference in Implications for Action
between Moderate and High Risk levels concern increased urgency and imperative for High Risk populations.
And lastly, the time frame of the projected analysis should be made explicit. This will depend on the particular situation
and should include both the starting period and anticipated ending period of the risk at hand. In some cases this will
be oriented around seasonal cycles, but not always (e.g., civil tensions, global trade and marketing shocks, etc.). This
information is summarized in the complimentary Cartographic Protocols.
ipc reference table - technical guidelines
37
5. IPC SUPPORTING TOOLS
To increase the rigour and communication effectiveness of the IPC, FSAU has developed a set of complimentary and
supporting tools. These include:
A Analysis Templates - a tool to organize evidence to support a phase classifi cation statement in a logical, transparent,
and accessible manner
B Cartographic Protocols - standardized mapping conventions to convey essential Situation Analysis information
C Population Tables - a standardized approach and format for identifying the number of people facing crisis by
administrative boundaries and livelihood systems
5.1 Analysis Templates
Concepts
Due to the profound implications on many people (sometimes millions) and the multiple stakeholders involved in
food security response, whatever the method and however complex the analysis may be, the fi nal results should be
understandable and accessible to critique. Key to achieving the overall goals of accountability and transparency is
the development of a simple format for organizing key pieces of evidence in support of fi ndings as well as additional
information required to inform effective response.
This evidence-based approach enables critical evaluation of fi ndings by analysts, peers and decision makers. It opens
the analytical process up to informed critique and subjects the results to an almost judicial (i.e. court of law) process
whereby the “burden of proof” is incumbent on the analysts.
The Analysis Templates are designed to increase transparency and have the strong effect of facilitating key data
access and report writing. They serve three main purposes:
(1) to guide rigorous, evidence-based analysis
(2) to enhance transparency by documenting key information for ease of access and historical archiving
(3) to simplify writing reports and presentation creation by providing the core elements of information in a
consistent and logical manner
Specifi cations
The Analysis Templates contain three parts:
(1) Phase Classifi cation statement
(2) Key Information for Mitigating Immediate Outcomes
(3) Key Information for Supporting Livelihoods and Addressing Underlying Causes
1) Phase Classifi cation Statement: This part guides the listing of: (1)
the affected area, (2) its phase classifi cation, (3) which Key Reference
Outcomes (from the IPC Reference Table) are applicable, (4) direct
evidence supporting the classifi cation, and (5) indirect evidence
supporting the classifi cation. Evidence is collected from a plethora
of sources, depending on the situation. Since evidence has varying
degrees of reliability, each individual piece of evidence is assigned
a reliability score of 1, 2, or 3 depending on whether the evidence is
very reliable, somewhat reliable, or unconfi rmed. These scores are
considered when assessing the overall confi dence of the analysis.
ipc supporting tools
RevisionAnalysis Template Part 1 has been
revised to combine direct and indirect
evidence and to separate the analysis
of Risk of Worsening Phase from the
Phase Classifi cation.
See Appendix H for more explanation.
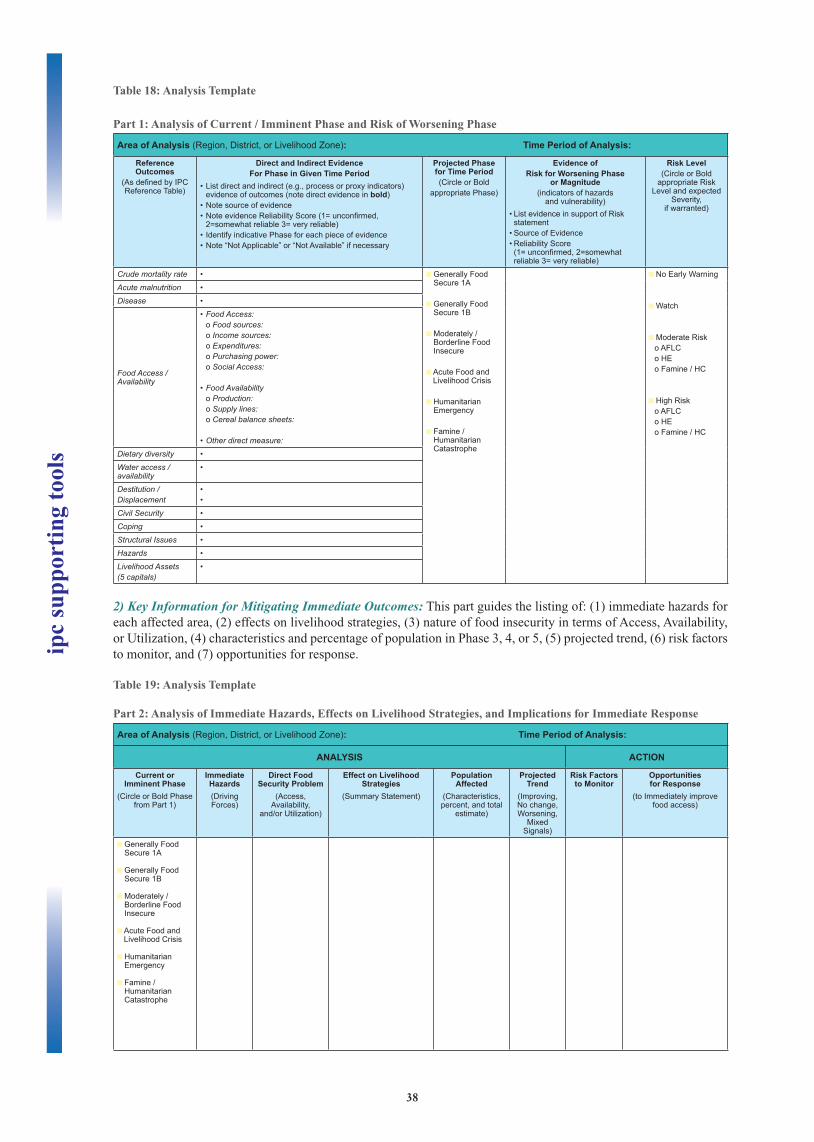
38
Table 18: Analysis Template
Part 1: Analysis of Current / Imminent Phase and Risk of Worsening Phase
Area of Analysis (Region, District, or Livelihood Zone): Time Period of Analysis:
Reference Outcomes
(As defi ned by IPC Reference Table)
Direct and Indirect EvidenceFor Phase in Given Time Period
• List direct and indirect (e.g., process or proxy indicators) evidence of outcomes (note direct evidence in bold)
• Note source of evidence• Note evidence Reliability Score (1= unconfi rmed,
2=somewhat reliable 3= very reliable)• Identify indicative Phase for each piece of evidence• Note “Not Applicable” or “Not Available” if necessary
Projected Phase for Time Period(Circle or Bold
appropriate Phase)
Evidence of Risk for Worsening Phase
or Magnitude(indicators of hazards
and vulnerability)• List evidence in support of Risk
statement• Source of Evidence• Reliability Score
(1= unconfi rmed, 2=somewhat reliable 3= very reliable)
Risk Level(Circle or Bold
appropriate Risk Level and expected
Severity, if warranted)
Crude mortality rate • Generally Food Secure 1A
Generally Food Secure 1B
Moderately / Borderline Food Insecure
Acute Food and Livelihood Crisis
Humanitarian Emergency
Famine / Humanitarian Catastrophe
No Early Warning
Watch
Moderate Risko AFLCo HEo Famine / HC
High Risko AFLCo HEo Famine / HC
Acute malnutrition •
Disease •
Food Access / Availability
• Food Access:o Food sources:o Income sources:o Expenditures:o Purchasing power:o Social Access:
• Food Availabilityo Production:o Supply lines:o Cereal balance sheets:
• Other direct measure:
Dietary diversity •
Water access / availability
•
Destitution / Displacement
• •
Civil Security •
Coping •
Structural Issues •
Hazards •
Livelihood Assets(5 capitals)
•
2) Key Information for Mitigating Immediate Outcomes: This part guides the listing of: (1) immediate hazards for
each affected area, (2) effects on livelihood strategies, (3) nature of food insecurity in terms of Access, Availability,
or Utilization, (4) characteristics and percentage of population in Phase 3, 4, or 5, (5) projected trend, (6) risk factors
to monitor, and (7) opportunities for response.
Table 19: Analysis Template
Part 2: Analysis of Immediate Hazards, Effects on Livelihood Strategies, and Implications for Immediate Response
Area of Analysis (Region, District, or Livelihood Zone): Time Period of Analysis:
ANALYSIS ACTION
Current or Imminent Phase
(Circle or Bold Phase from Part 1)
Immediate Hazards(Driving Forces)
Direct Food Security Problem
(Access, Availability,
and/or Utilization)
Effect on Livelihood Strategies
(Summary Statement)
Population Affected
(Characteristics, percent, and total
estimate)
Projected Trend
(Improving, No change, Worsening,
Mixed Signals)
Risk Factors to Monitor
Opportunities for Response
(to Immediately improve food access)
Generally Food Secure 1A
Generally Food Secure 1B
Moderately / Borderline Food Insecure
Acute Food and Livelihood Crisis
Humanitarian Emergency
Famine / Humanitarian Catastrophe
ipc
supp
orti
ng t
ools
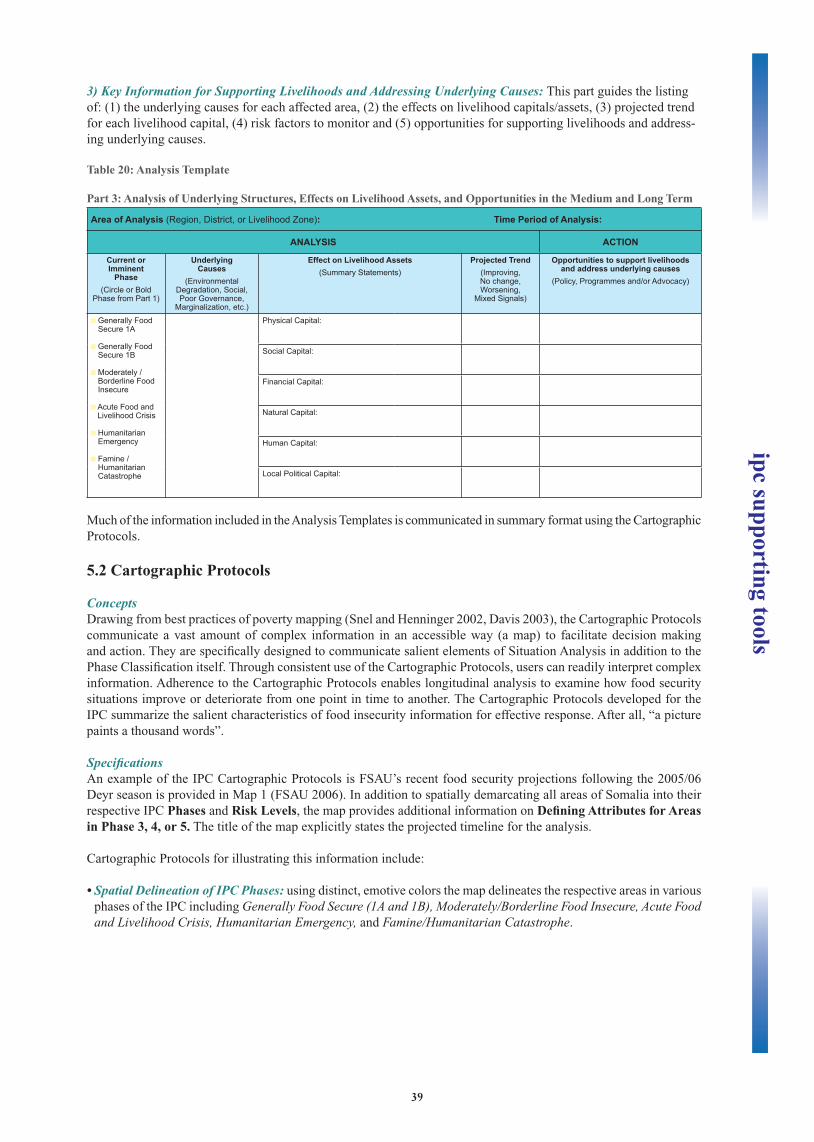
39
3) Key Information for Supporting Livelihoods and Addressing Underlying Causes: This part guides the listing
of: (1) the underlying causes for each affected area, (2) the effects on livelihood capitals/assets, (3) projected trend
for each livelihood capital, (4) risk factors to monitor and (5) opportunities for supporting livelihoods and address-
ing underlying causes.
Table 20: Analysis Template
Part 3: Analysis of Underlying Structures, Effects on Livelihood Assets, and Opportunities in the Medium and Long Term
Area of Analysis (Region, District, or Livelihood Zone): Time Period of Analysis:
ANALYSIS ACTION
Current or Imminent
Phase (Circle or Bold
Phase from Part 1)
UnderlyingCauses
(Environmental Degradation, Social, Poor Governance,
Marginalization, etc.)
Effect on Livelihood Assets(Summary Statements)
Projected Trend(Improving, No change, Worsening,
Mixed Signals)
Opportunities to support livelihoods and address underlying causes
(Policy, Programmes and/or Advocacy)
Generally Food Secure 1A
Generally Food Secure 1B
Moderately / Borderline Food Insecure
Acute Food and Livelihood Crisis
Humanitarian Emergency
Famine / Humanitarian Catastrophe
Physical Capital:
Social Capital:
Financial Capital:
Natural Capital:
Human Capital:
Local Political Capital:
Much of the information included in the Analysis Templates is communicated in summary format using the Cartographic
Protocols.
5.2 Cartographic Protocols
Concepts
Drawing from best practices of poverty mapping (Snel and Henninger 2002, Davis 2003), the Cartographic Protocols
communicate a vast amount of complex information in an accessible way (a map) to facilitate decision making
and action. They are specifi cally designed to communicate salient elements of Situation Analysis in addition to the
Phase Classifi cation itself. Through consistent use of the Cartographic Protocols, users can readily interpret complex
information. Adherence to the Cartographic Protocols enables longitudinal analysis to examine how food security
situations improve or deteriorate from one point in time to another. The Cartographic Protocols developed for the
IPC summarize the salient characteristics of food insecurity information for effective response. After all, “a picture
paints a thousand words”.
Specifi cations
An example of the IPC Cartographic Protocols is FSAU’s recent food security projections following the 2005/06
Deyr season is provided in Map 1 (FSAU 2006). In addition to spatially demarcating all areas of Somalia into their
respective IPC Phases and Risk Levels, the map provides additional information on Defi ning Attributes for Areas in Phase 3, 4, or 5. The title of the map explicitly states the projected timeline for the analysis.
Cartographic Protocols for illustrating this information include:
• Spatial Delineation of IPC Phases: using distinct, emotive colors the map delineates the respective areas in various
phases of the IPC including Generally Food Secure (1A and 1B), Moderately/Borderline Food Insecure, Acute Food and Livelihood Crisis, Humanitarian Emergency, and Famine/Humanitarian Catastrophe.
ipc supporting tools
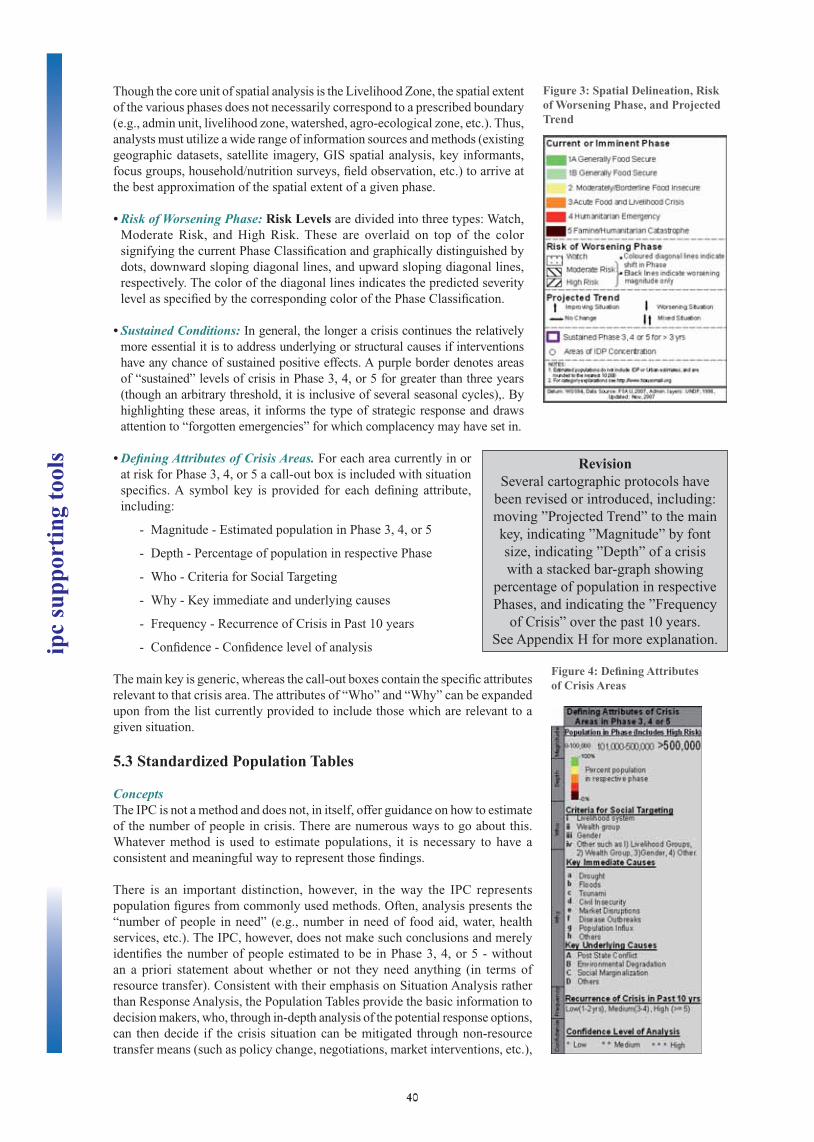
40
Though the core unit of spatial analysis is the Livelihood Zone, the spatial extent
of the various phases does not necessarily correspond to a prescribed boundary
(e.g., admin unit, livelihood zone, watershed, agro-ecological zone, etc.). Thus,
analysts must utilize a wide range of information sources and methods (existing
geographic datasets, satellite imagery, GIS spatial analysis, key informants,
focus groups, household/nutrition surveys, fi eld observation, etc.) to arrive at
the best approximation of the spatial extent of a given phase.
• Risk of Worsening Phase: Risk Levels are divided into three types: Watch,
Moderate Risk, and High Risk. These are overlaid on top of the color
signifying the current Phase Classifi cation and graphically distinguished by
dots, downward sloping diagonal lines, and upward sloping diagonal lines,
respectively. The color of the diagonal lines indicates the predicted severity
level as specifi ed by the corresponding color of the Phase Classifi cation.
• Sustained Conditions: In general, the longer a crisis continues the relatively
more essential it is to address underlying or structural causes if interventions
have any chance of sustained positive effects. A purple border denotes areas
of “sustained” levels of crisis in Phase 3, 4, or 5 for greater than three years
(though an arbitrary threshold, it is inclusive of several seasonal cycles),. By
highlighting these areas, it informs the type of strategic response and draws
attention to “forgotten emergencies” for which complacency may have set in.
• Defi ning Attributes of Crisis Areas. For each area currently in or
at risk for Phase 3, 4, or 5 a call-out box is included with situation
specifi cs. A symbol key is provided for each defi ning attribute,
including:
- Magnitude - Estimated population in Phase 3, 4, or 5
- Depth - Percentage of population in respective Phase
- Who - Criteria for Social Targeting
- Why - Key immediate and underlying causes
- Frequency - Recurrence of Crisis in Past 10 years
- Confi dence - Confi dence level of analysis
The main key is generic, whereas the call-out boxes contain the specifi c attributes
relevant to that crisis area. The attributes of “Who” and “Why” can be expanded
upon from the list currently provided to include those which are relevant to a
given situation.
5.3 Standardized Population Tables
Concepts
The IPC is not a method and does not, in itself, offer guidance on how to estimate
of the number of people in crisis. There are numerous ways to go about this.
Whatever method is used to estimate populations, it is necessary to have a
consistent and meaningful way to represent those fi ndings.
There is an important distinction, however, in the way the IPC represents
population fi gures from commonly used methods. Often, analysis presents the
“number of people in need” (e.g., number in need of food aid, water, health
services, etc.). The IPC, however, does not make such conclusions and merely
identifi es the number of people estimated to be in Phase 3, 4, or 5 - without
an a priori statement about whether or not they need anything (in terms of
resource transfer). Consistent with their emphasis on Situation Analysis rather
than Response Analysis, the Population Tables provide the basic information to
decision makers, who, through in-depth analysis of the potential response options,
can then decide if the crisis situation can be mitigated through non-resource
transfer means (such as policy change, negotiations, market interventions, etc.),
ipc
supp
orti
ng t
ools
Figure 3: Spatial Delineation, Risk of Worsening Phase, and Projected Trend
Figure 4: Defi ning Attributes of Crisis Areas
RevisionSeveral cartographic protocols have
been revised or introduced, including:
moving ”Projected Trend” to the main
key, indicating ”Magnitude” by font
size, indicating ”Depth” of a crisis
with a stacked bar-graph showing
percentage of population in respective
Phases, and indicating the ”Frequency
of Crisis” over the past 10 years.
See Appendix H for more explanation.
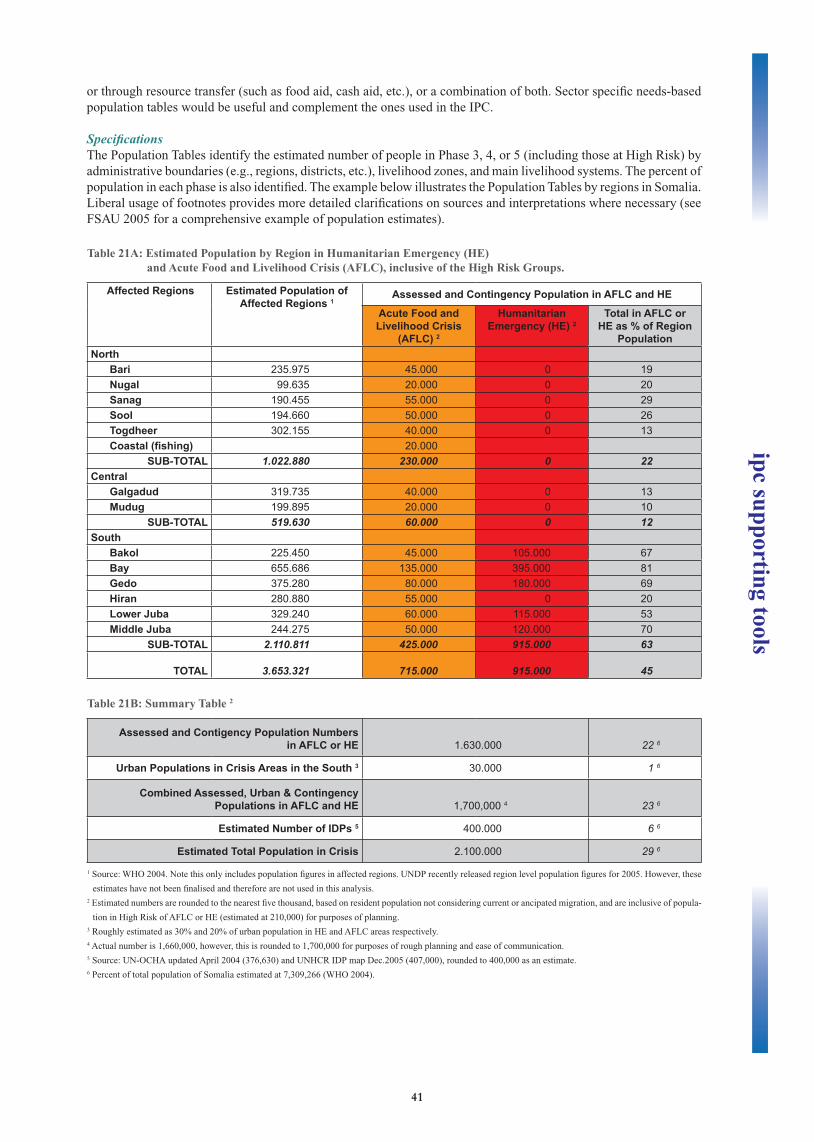
41
or through resource transfer (such as food aid, cash aid, etc.), or a combination of both. Sector specifi c needs-based
population tables would be useful and complement the ones used in the IPC.
Specifi cations
The Population Tables identify the estimated number of people in Phase 3, 4, or 5 (including those at High Risk) by
administrative boundaries (e.g., regions, districts, etc.), livelihood zones, and main livelihood systems. The percent of
population in each phase is also identifi ed. The example below illustrates the Population Tables by regions in Somalia.
Liberal usage of footnotes provides more detailed clarifi cations on sources and interpretations where necessary (see
FSAU 2005 for a comprehensive example of population estimates).
Table 21A: Estimated Population by Region in Humanitarian Emergency (HE) and Acute Food and Livelihood Crisis (AFLC), inclusive of the High Risk Groups.
Affected Regions Estimated Population of Affected Regions 1
Assessed and Contingency Population in AFLC and HE
Acute Food and Livelihood Crisis
(AFLC) 2
Humanitarian Emergency (HE) 2
Total in AFLC or HE as % of Region
Population North
Bari 235.975 45.000 0 19Nugal 99.635 20.000 0 20Sanag 190.455 55.000 0 29Sool 194.660 50.000 0 26Togdheer 302.155 40.000 0 13Coastal (fi shing) 20.000
SUB-TOTAL 1.022.880 230.000 0 22Central
Galgadud 319.735 40.000 0 13Mudug 199.895 20.000 0 10
SUB-TOTAL 519.630 60.000 0 12South
Bakol 225.450 45.000 105.000 67Bay 655.686 135.000 395.000 81Gedo 375.280 80.000 180.000 69Hiran 280.880 55.000 0 20Lower Juba 329.240 60.000 115.000 53Middle Juba 244.275 50.000 120.000 70
SUB-TOTAL 2.110.811 425.000 915.000 63
TOTAL 3.653.321 715.000 915.000 45
Table 21B: Summary Table 2
Assessed and Contigency Population Numbers in AFLC or HE 1.630.000 22 6
Urban Populations in Crisis Areas in the South 3 30.000 1 6
Combined Assessed, Urban & Contingency Populations in AFLC and HE 1,700,000 4 23 6
Estimated Number of IDPs 5 400.000 6 6
Estimated Total Population in Crisis 2.100.000 29 6
1 Source: WHO 2004. Note this only includes population fi gures in affected regions. UNDP recently released region level population fi gures for 2005. However, these
estimates have not been fi nalised and therefore are not used in this analysis.
2 Estimated numbers are rounded to the nearest fi ve thousand, based on resident population not considering current or ancipated migration, and are inclusive of popula-
tion in High Risk of AFLC or HE (estimated at 210,000) for purposes of planning.
3 Roughly estimated as 30% and 20% of urban population in HE and AFLC areas respectively.
4 Actual number is 1,660,000, however, this is rounded to 1,700,000 for purposes of rough planning and ease of communication.
5 Source: UN-OCHA updated April 2004 (376,630) and UNHCR IDP map Dec.2005 (407,000), rounded to 400,000 as an estimate.
6 Percent of total population of Somalia estimated at 7,309,266 (WHO 2004).
ipc supporting tools
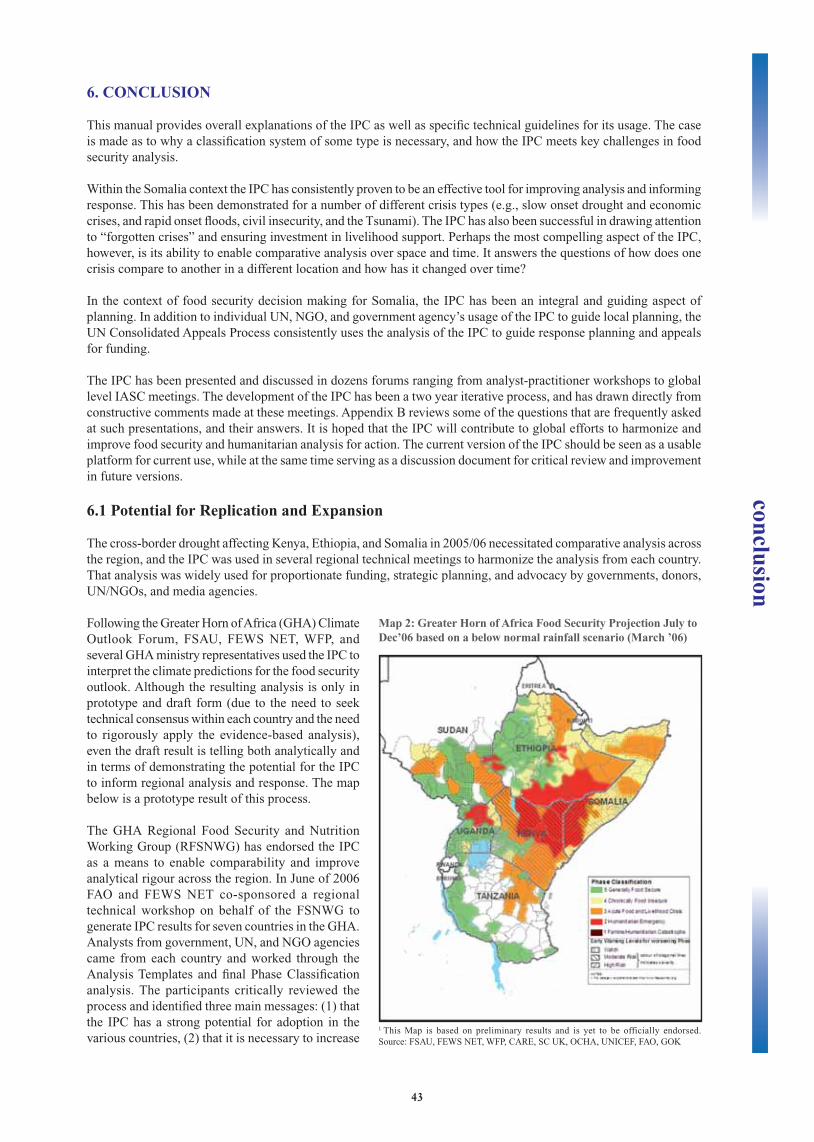
43
6. CONCLUSION
This manual provides overall explanations of the IPC as well as specifi c technical guidelines for its usage. The case
is made as to why a classifi cation system of some type is necessary, and how the IPC meets key challenges in food
security analysis.
Within the Somalia context the IPC has consistently proven to be an effective tool for improving analysis and informing
response. This has been demonstrated for a number of different crisis types (e.g., slow onset drought and economic
crises, and rapid onset fl oods, civil insecurity, and the Tsunami). The IPC has also been successful in drawing attention
to “forgotten crises” and ensuring investment in livelihood support. Perhaps the most compelling aspect of the IPC,
however, is its ability to enable comparative analysis over space and time. It answers the questions of how does one
crisis compare to another in a different location and how has it changed over time?
In the context of food security decision making for Somalia, the IPC has been an integral and guiding aspect of
planning. In addition to individual UN, NGO, and government agency’s usage of the IPC to guide local planning, the
UN Consolidated Appeals Process consistently uses the analysis of the IPC to guide response planning and appeals
for funding.
The IPC has been presented and discussed in dozens forums ranging from analyst-practitioner workshops to global
level IASC meetings. The development of the IPC has been a two year iterative process, and has drawn directly from
constructive comments made at these meetings. Appendix B reviews some of the questions that are frequently asked
at such presentations, and their answers. It is hoped that the IPC will contribute to global efforts to harmonize and
improve food security and humanitarian analysis for action. The current version of the IPC should be seen as a usable
platform for current use, while at the same time serving as a discussion document for critical review and improvement
in future versions.
6.1 Potential for Replication and Expansion
The cross-border drought affecting Kenya, Ethiopia, and Somalia in 2005/06 necessitated comparative analysis across
the region, and the IPC was used in several regional technical meetings to harmonize the analysis from each country.
That analysis was widely used for proportionate funding, strategic planning, and advocacy by governments, donors,
UN/NGOs, and media agencies.
Following the Greater Horn of Africa (GHA) Climate
Outlook Forum, FSAU, FEWS NET, WFP, and
several GHA ministry representatives used the IPC to
interpret the climate predictions for the food security
outlook. Although the resulting analysis is only in
prototype and draft form (due to the need to seek
technical consensus within each country and the need
to rigorously apply the evidence-based analysis),
even the draft result is telling both analytically and
in terms of demonstrating the potential for the IPC
to inform regional analysis and response. The map
below is a prototype result of this process.
The GHA Regional Food Security and Nutrition
Working Group (RFSNWG) has endorsed the IPC
as a means to enable comparability and improve
analytical rigour across the region. In June of 2006
FAO and FEWS NET co-sponsored a regional
technical workshop on behalf of the FSNWG to
generate IPC results for seven countries in the GHA.
Analysts from government, UN, and NGO agencies
came from each country and worked through the
Analysis Templates and fi nal Phase Classifi cation
analysis. The participants critically reviewed the
process and identifi ed three main messages: (1) that
the IPC has a strong potential for adoption in the
various countries, (2) that it is necessary to increase
conclusion
Map 2: Greater Horn of Africa Food Security Projection July to Dec’06 based on a below normal rainfall scenario (March ’06)
1 This Map is based on preliminary results and is yet to be officially endorsed.
Source: FSAU, FEWS NET, WFP, CARE, SC UK, OCHA, UNICEF, FAO, GOK
44
conc
lusi
onexposure of the IPC among national stakeholders to generate “buy-in”, and (3) that the technical use of the IPC is most
effective if done at the national level fi rst (with a more representative technical working group), and then integrated
into a regional analysis.
The design of the IPC is based on internationally accepted standards, and meant to build from existing methodologies
and information systems - thus the IPC can be adopted with current systems with minimal adjustment and used as
an “add on” component. While the IPC brings together commonly required information for Situation Analysis,
individual organizations and agencies will still want and need to tailor the end-use of the IPC results to meet their
specifi c organization goals and interests, while using the IPC results as a common platform.
To ensure that the IPC fosters technical consensus, it is best applied at the country level and by drawing from, or
creating, a forum for technical coordination and consensus building. In most countries such forums already exist (e.g.,
the Vulnerability Assessment Committees throughout Southern Africa, the Kenya Food Security Steering Group, the
Disaster Preparedness and Prevention Agency in Ethiopia, CILSS in West Africa, the Livelihood Analysis Forum in
South Sudan, and others).
6.2 Future Challenges and Way Forward
The IPC, if widely applied, has great potential to better rationalize humanitarian assistance in terms of reaching people
most in need and ensuring effective use of resources. Ensuring its technical integrity however, will require adherence
to a rigorous, evidence-based approach. Usage of the IPC would be undermined over time if users classify situations
without appropriate substantiation (either direct or indirect evidence), and the Analysis Templates are designed to
promote rigorous analysis.
Further development and revisions of the IPC is a near certainty. FAO encourages critical feedback on the IPC and
anticipates that a revised version of the manual will be produced in 2009 This will occur through technical feedback
on this Manual as well as further piloting and testing in different country and regional contexts.
The overall vision of the IPC is consistent with existing efforts such as the Good Humanitarian Donorship (GHD),
SMART, Benchmarking, and Humanitarian Tracking System initiatives, and the Sphere Project to better harmonize food
security and humanitarian analysis. The recently launched Central Emergency Response Fund (CERF) (OCHA 2006)
will need some basis for making objective decisions for humanitarian assistance, and the IPC meets that need well.
In order to achieve this greater vision, the broad food security and humanitarian community must come together in
forums, such as the Inter-agency Standing Committee and others, to technically review and eventually adopt a common
classifi cation system that meets international standards, is adaptable to a wide array of situations and contexts, and is
practical in the fi eld. It is hoped that the IPC will contribute to this debate and development.
45
APPENDIX ASelected list of Forums at which the IPC has been presented
While the IPC’s development over the past two years has been driven fi rst and foremost by the day to day realities
of applied analysis, there have also been dozens of opportunities to present the IPC at a wide range of meetings and
workshops. Each of these presentations has generated considerable interest and constructive feedback, which has
directly led to further development of the IPC. Listed below are just a few of these forums, which are followed by
answers to some of the frequently asked questions.
Somalia Humanitarian Response Group Meetings (Nairobi)
Somalia Food Security and Rural Development Meetings (Nairobi)
FSAU Analysis Workshops (Somalia)
OCHA GHA Regional Scenario Development Workshops (Nairobi)
OCHA GHA Regional CAP Workshops (Nairobi)
GHA Drought Crisis Media Briefi ngs (Nairobi)
GHA Climate Outlook Forums (Nairobi)
UNICEF Regional Workshop (Nairobi)
GHA Food Security and Nutrition Working Group Meetings (Nairobi)
Save the Children HEA Practitioners Workshop (Nairobi)
FAO Emergency Coordinators Workshop (Nairobi)
FAO ESAF Out posted Offi cers Workshop (Rome)
FAO/WFP Needs Analysis Framework Workshop (Nairobi)
FAO Sustainable Livelihoods Seminar (Rome)
FAO TCE Seminar (Rome)
FAO Emergency Needs Assessment Workshop (Nairobi)
WFP ODAN/VAM Seminar (Nairobi)
GHA Cross Border Analysis Workshop (Nairobi)
FEWS NET II Workshop (Johannesburg)
Southern Africa Vulnerability Assessment Committee Methodology Review Workshop (Johannesburg)
Asian FIVIMS Workshop (Bangkok)
USAID GHA Regional Analysis Workshop (Nairobi)
IASC 64th Meeting (Rome) GHA Appeal Launch to Permanent Representatives of Donor Countries (Geneva)
European Forum on International Disaster Response Laws, Rules and Principles (IDRL)
RC/RC National Societies, UN and IOs, and NGOs. Senior Managers of the IFRC Federation
WFP SENAC Board Meeting (Rome)
ALNAP Meeting (Nairobi)
Oxfam UK (Oxford)
World Food Summit - Conference on Food Security (Rome)
Technical seminar on Integration of socio-economic and remote sensing information for food security and vulner-
ability analyses (Ispra, Italy)
appendixes
46
APPENDIX BFrequently Asked Questions (FAQs)
• Is the IPC too technically complex for decision makers to understand? While any classifi cation system will have
some degree of complexity, based on repeated experiences using the IPC (well over one hundred) describing food se-
curity situations in Somalia and the Greater Horn of Africa to a broad range of analysts and high level decision makers
(including Presidents, Permanent Secretaries, Ministers, the Special Envoy, the UN Under Secretary for Humanitarian
Affairs, and heads of UN, NGO, and donor agencies), this is not the case. On the contrary, without exception each of
these decision makers has readily understood the main thrust of the IPC, the logic behind it, and the implications for
action. Further, numerous members of the media (from Reuters, AP, BBC, VOA, CNN, IRIN, Le Monde, Financial
Times, and others) have positively welcomed the IPC as a means of clear communication to mass audiences. While
underpinning the IPC are layers of complex analyses, the situation analysis and implications for action are presented in
a simple manner. This broad accessibility enables technical consensus not just among analysts, but with other stakehold-
ers as well. The IPC is like a tree with a complex root structure (analysis) that forms the foundation of a much simpler
trunk (the situation classifi cation).
• What if some of the Key Reference Outcomes “benchmarks” are reached but not others? The overarching strategy
of the IPC is not based on thresholds and benchmarks as much as it is based on analysts” interpretation of all avail-
able evidence with clear reference to the IPC Key Reference Outcomes. This “convergence of evidence” approach is
different from approaches that rely on clear cutoffs of limited indicators. While the ideal goal is to have rigorous and
measurable thresholds to defi ne Phase Classifi cations, from a practical and fi eld perspective (including issues of crisis
complexity, livelihoods complexity, information urgency, widely varying data availability, analysis capacity, and oth-
ers) it is eminently more practical to classify overall food security situations with a convergence of evidence approach.
An academic purist may insist on absolute thresholds, but this is not always feasible from a fi eld perspective. The IPC
bridges academic and internationally accepted thresholds with fi eld practicality.
• What if variation of severity is greater within a specifi ed area than across areas? The point of mapping areas is to
capture the general situation in a given area for planning purposes - surely there is great variation within a given area
which does pose special challenges for analysis and targeting humanitarian assistance. The IPC accommodates this to
some degree by (1) identifying specifi c social groups within a geographic area who are at risk, and (2) identifying, where
necessary, numbers of people in conditions of Humanitarian Emergency as well as in Acute Food and Livelihood Crisis
if they co-exist in a given area. Even for areas that are classifi ed as “Generally Food Secure” the IPC recognizes that
pockets of food insecurity can still exist, and in the Strategic Response Framework the fi rst action listed is to address
those pockets. If small area analysis is necessary, it is equally possible to apply the IPC to limited geographic areas as
small as individual villages if desired.
• Isn’t it adequate to just monitor the outcomes as measured by nutrition indicators? No. With regards to nutrition
indicators, the IPC explicitly draws from this information, but, importantly, not exclusively. This is critical from both a
practical perspective (as such nutrition data is not always available and needs to be triangulated with other food security
data), as well as a conceptual perspective (it is well accepted that nutrition is a late outcome indicator of food insecurity,
which means that responses that are solely based on such data are likely to either (1) be too late to save lives that could
have been saved, and/or (2) miss out on the opportunity (if not imperative) to initiate appropriate responses earlier so
as to prevent livelihood destruction, and thus entry into a poverty trap. Thus, the IPC draws from nutrition data, but also
draws from indicators that provide both triangulation and earlier indications that crisis is imminent.
• Can the IPC be applied in country settings where a comprehensive data collection and analysis unit like the FSAU
does not exist? Yes. FSAU operates in a context where there is no central government to maintain and provide basic
statistical data sets, and for which fi eld access is often times limited due to security restrictions. Most other countries in
the world regularly collect important data that can be used to support the IPC. Further, in countries of recurrent crises,
there are a plethora of UN and NGO agencies that regularly conduct surveys and have monitoring systems that would
support the IPC. The challenge is to draw from existing data availability and make the best use of it, while prioritizing
future data collection efforts to have the most meaningful use.
• Since the IPC was developed in the Somalia context, isn’t it “Somalia-specifi c”? No. The concepts and reference
outcomes of the IPC are explicitly drawn from internationally accepted standards (e.g., the Sphere standards), which are
equally applicable any where in the world. Different contexts, however, will require some fl exibility, which is “built-in”
to the IPC, while providing a framework for rigour and reasonable comparability.
appe
ndix
es
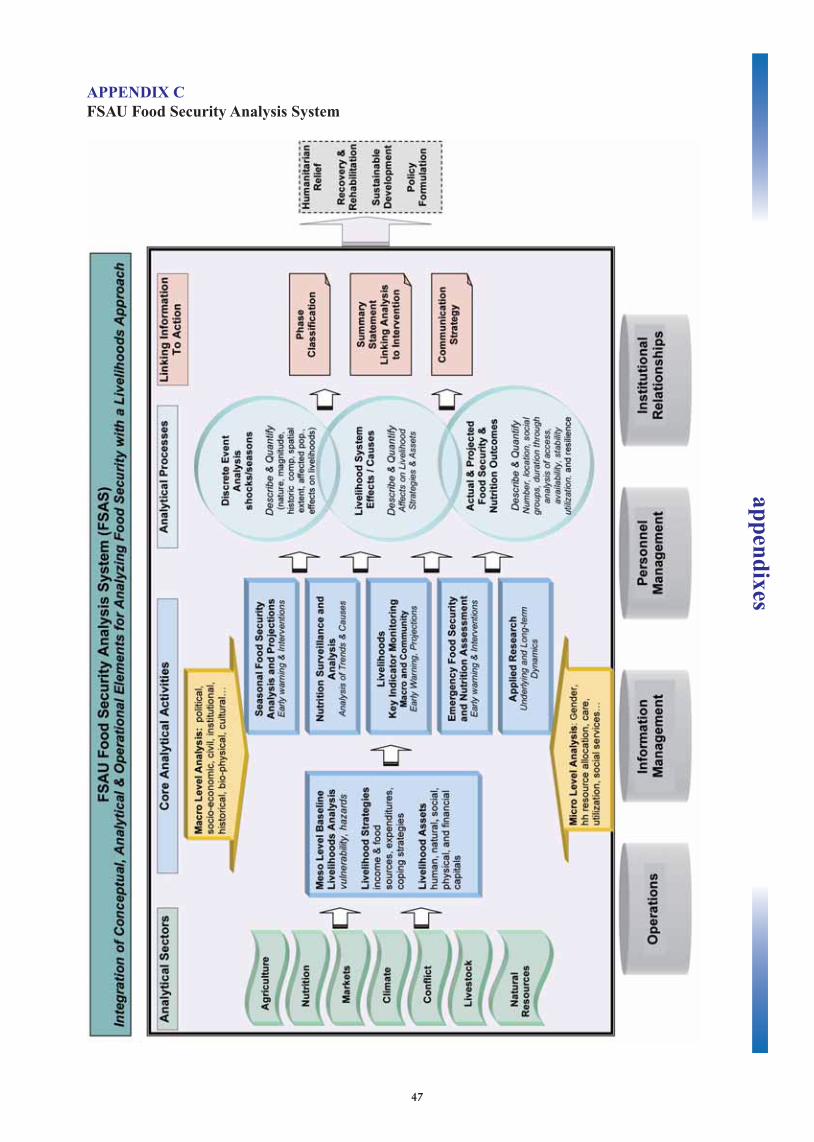
47
APPENDIX CFSAU Food Security Analysis System
appendixes
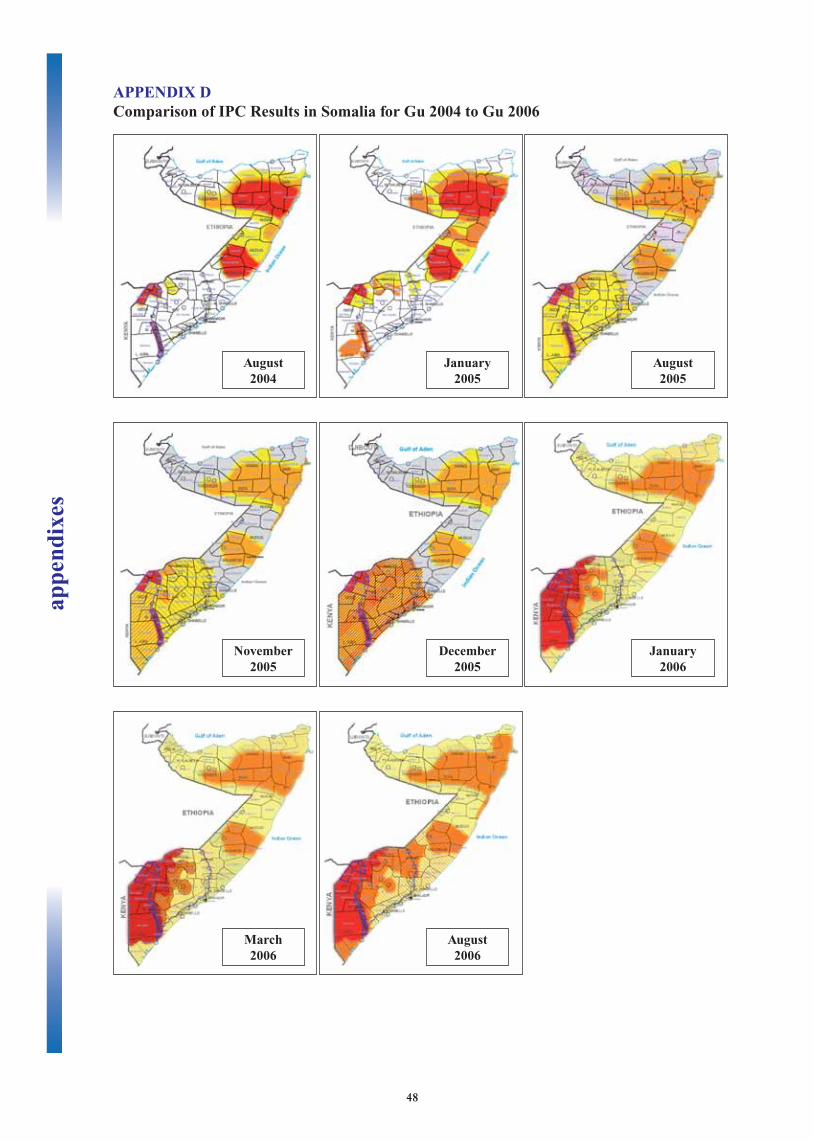
48
APPENDIX DComparison of IPC Results in Somalia for Gu 2004 to Gu 2006
August2004
January2005
August2005
November2005
December2005
January2006
March2006
August2006
appe
ndix
es
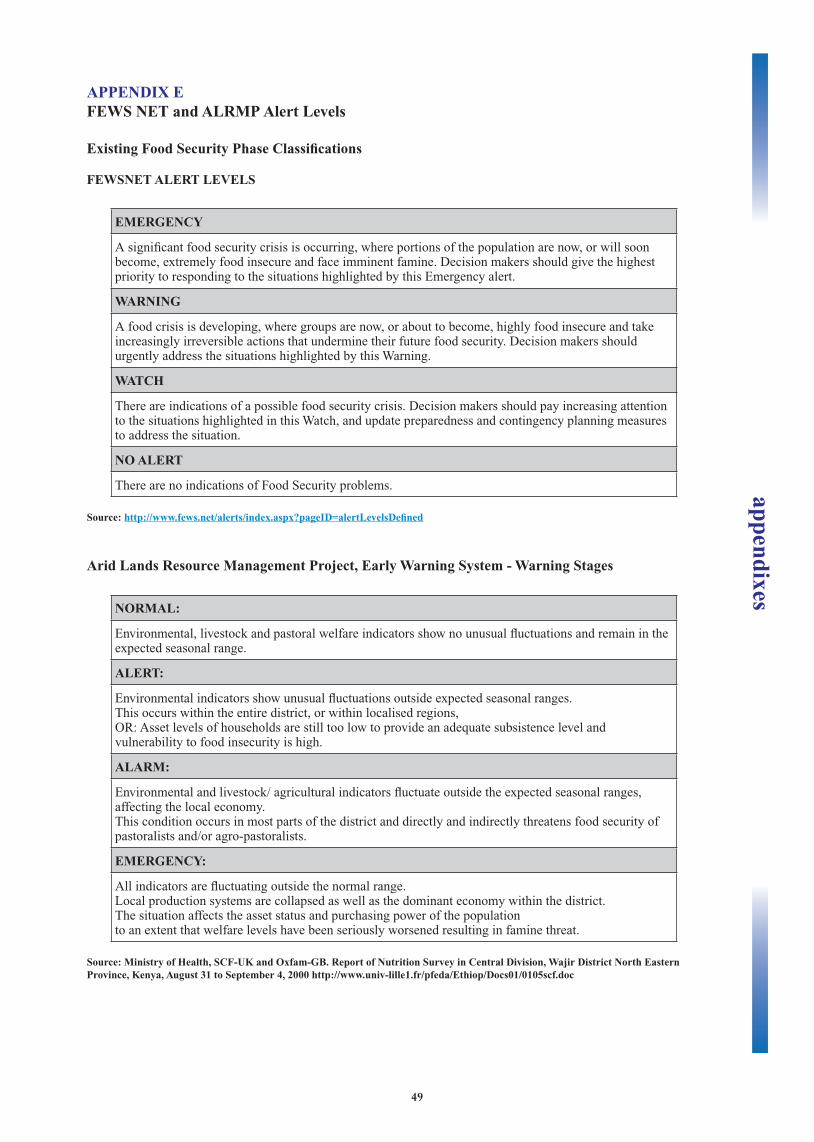
49
APPENDIX EFEWS NET and ALRMP Alert Levels
Existing Food Security Phase Classifi cations
FEWSNET ALERT LEVELS
EMERGENCY
A signifi cant food security crisis is occurring, where portions of the population are now, or will soon become, extremely food insecure and face imminent famine. Decision makers should give the highest priority to responding to the situations highlighted by this Emergency alert.
WARNING
A food crisis is developing, where groups are now, or about to become, highly food insecure and take increasingly irreversible actions that undermine their future food security. Decision makers should urgently address the situations highlighted by this Warning.
WATCH
There are indications of a possible food security crisis. Decision makers should pay increasing attention to the situations highlighted in this Watch, and update preparedness and contingency planning measures to address the situation.
NO ALERT
There are no indications of Food Security problems.
Source: http://www.fews.net/alerts/index.aspx?pageID=alertLevelsDefi ned
Arid Lands Resource Management Project, Early Warning System - Warning Stages
NORMAL:
Environmental, livestock and pastoral welfare indicators show no unusual fl uctuations and remain in the expected seasonal range.
ALERT:
Environmental indicators show unusual fl uctuations outside expected seasonal ranges. This occurs within the entire district, or within localised regions, OR: Asset levels of households are still too low to provide an adequate subsistence level and vulnerability to food insecurity is high.
ALARM:
Environmental and livestock/ agricultural indicators fl uctuate outside the expected seasonal ranges, affecting the local economy. This condition occurs in most parts of the district and directly and indirectly threatens food security of pastoralists and/or agro-pastoralists.
EMERGENCY:
All indicators are fl uctuating outside the normal range. Local production systems are collapsed as well as the dominant economy within the district. The situation affects the asset status and purchasing power of the population to an extent that welfare levels have been seriously worsened resulting in famine threat.
Source: Ministry of Health, SCF-UK and Oxfam-GB. Report of Nutrition Survey in Central Division, Wajir District North Eastern Province, Kenya, August 31 to September 4, 2000 http://www.univ-lille1.fr/pfeda/Ethiop/Docs01/0105scf.doc
appendixes
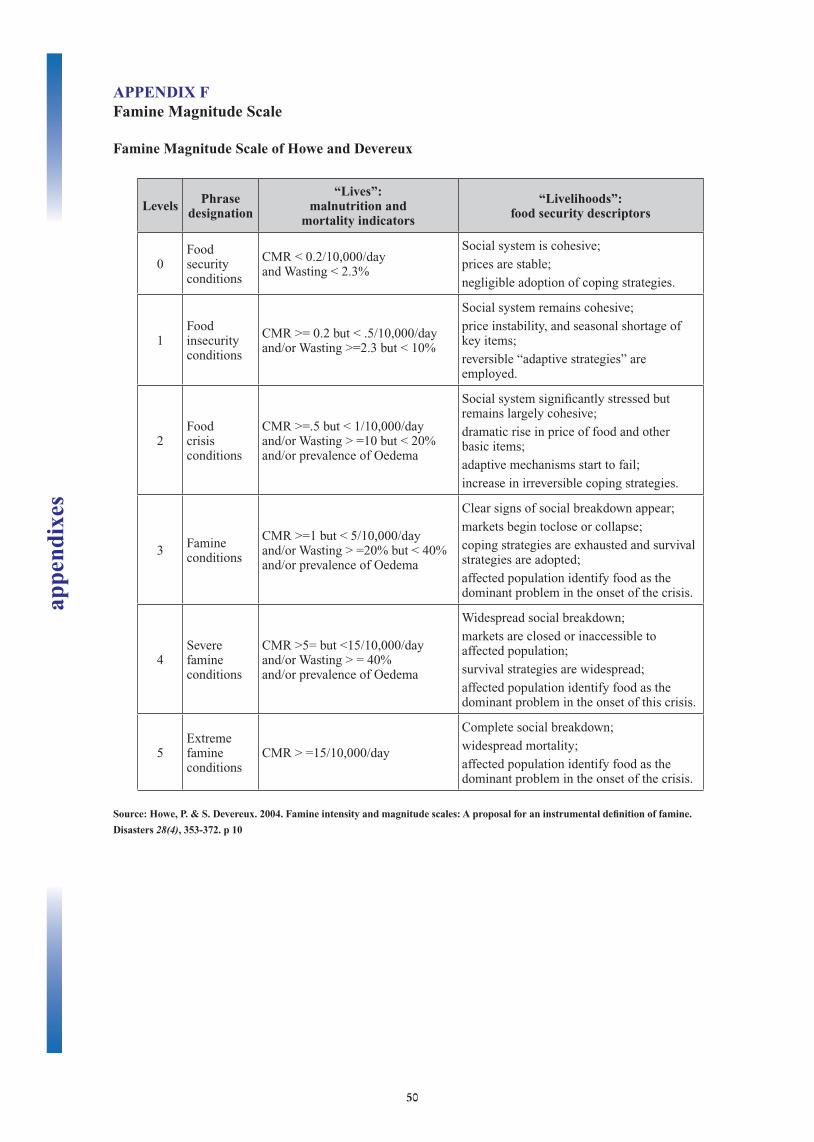
50
APPENDIX FFamine Magnitude Scale
Famine Magnitude Scale of Howe and Devereux
Levels Phrase designation
“Lives”: malnutrition and
mortality indicators
“Livelihoods”: food security descriptors
0Food security conditions
CMR < 0.2/10,000/day and Wasting < 2.3%
Social system is cohesive;
prices are stable;
negligible adoption of coping strategies.
1Food insecurity conditions
CMR >= 0.2 but < .5/10,000/day and/or Wasting >=2.3 but < 10%
Social system remains cohesive;
price instability, and seasonal shortage of key items;
reversible “adaptive strategies” are employed.
2Food crisis conditions
CMR >=.5 but < 1/10,000/day and/or Wasting > =10 but < 20% and/or prevalence of Oedema
Social system signifi cantly stressed but remains largely cohesive;
dramatic rise in price of food and other basic items;
adaptive mechanisms start to fail;
increase in irreversible coping strategies.
3Famine conditions
CMR >=1 but < 5/10,000/day and/or Wasting > =20% but < 40% and/or prevalence of Oedema
Clear signs of social breakdown appear;
markets begin toclose or collapse;
coping strategies are exhausted and survival strategies are adopted;
affected population identify food as the dominant problem in the onset of the crisis.
4Severe famineconditions
CMR >5= but <15/10,000/day and/or Wasting > = 40% and/or prevalence of Oedema
Widespread social breakdown;
markets are closed or inaccessible to affected population;
survival strategies are widespread;
affected population identify food as the dominant problem in the onset of this crisis.
5Extreme famineconditions
CMR > =15/10,000/day
Complete social breakdown;
widespread mortality;
affected population identify food as the dominant problem in the onset of the crisis.
Source: Howe, P. & S. Devereux. 2004. Famine intensity and magnitude scales: A proposal for an instrumental defi nition of famine.
Disasters 28(4), 353-372. p 10
appe
ndix
es
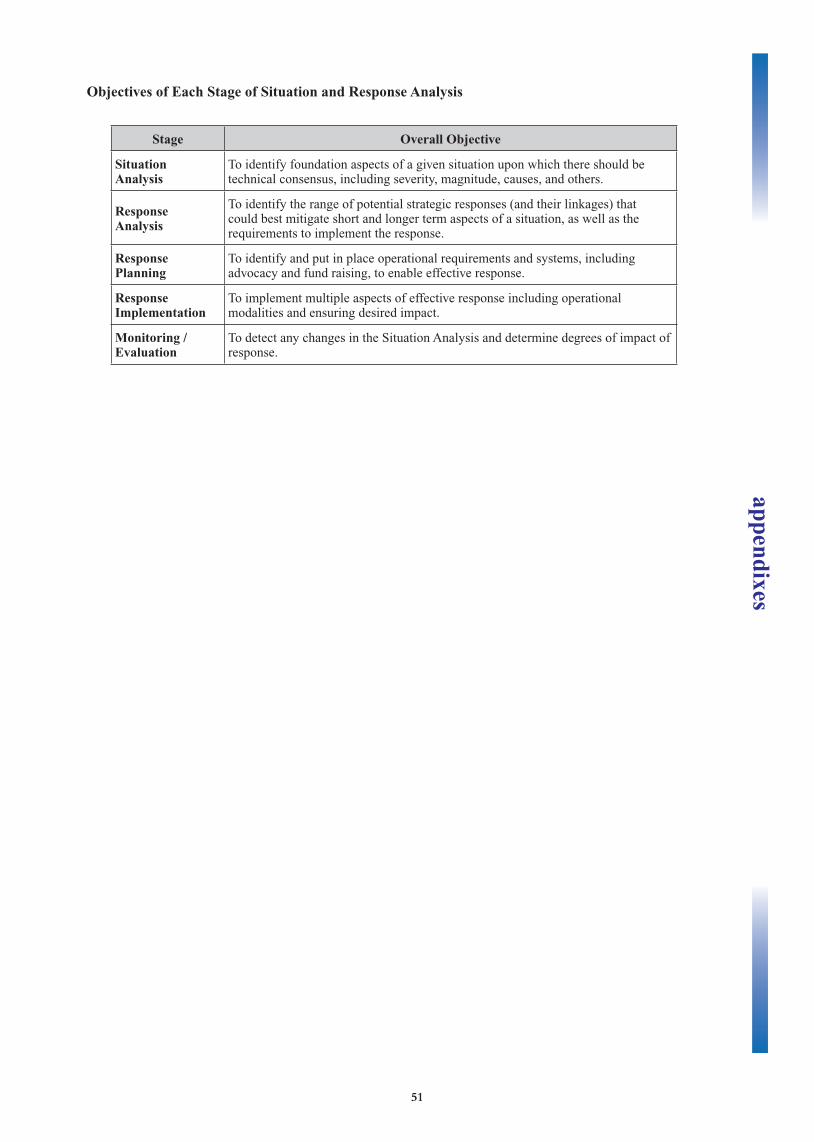
51
Objectives of Each Stage of Situation and Response Analysis
Stage Overall Objective
Situation Analysis
To identify foundation aspects of a given situation upon which there should be technical consensus, including severity, magnitude, causes, and others.
Response Analysis
To identify the range of potential strategic responses (and their linkages) that could best mitigate short and longer term aspects of a situation, as well as the requirements to implement the response.
Response Planning
To identify and put in place operational requirements and systems, including advocacy and fund raising, to enable effective response.
Response Implementation
To implement multiple aspects of effective response including operational modalities and ensuring desired impact.
Monitoring / Evaluation
To detect any changes in the Situation Analysis and determine degrees of impact of response.
appendixes
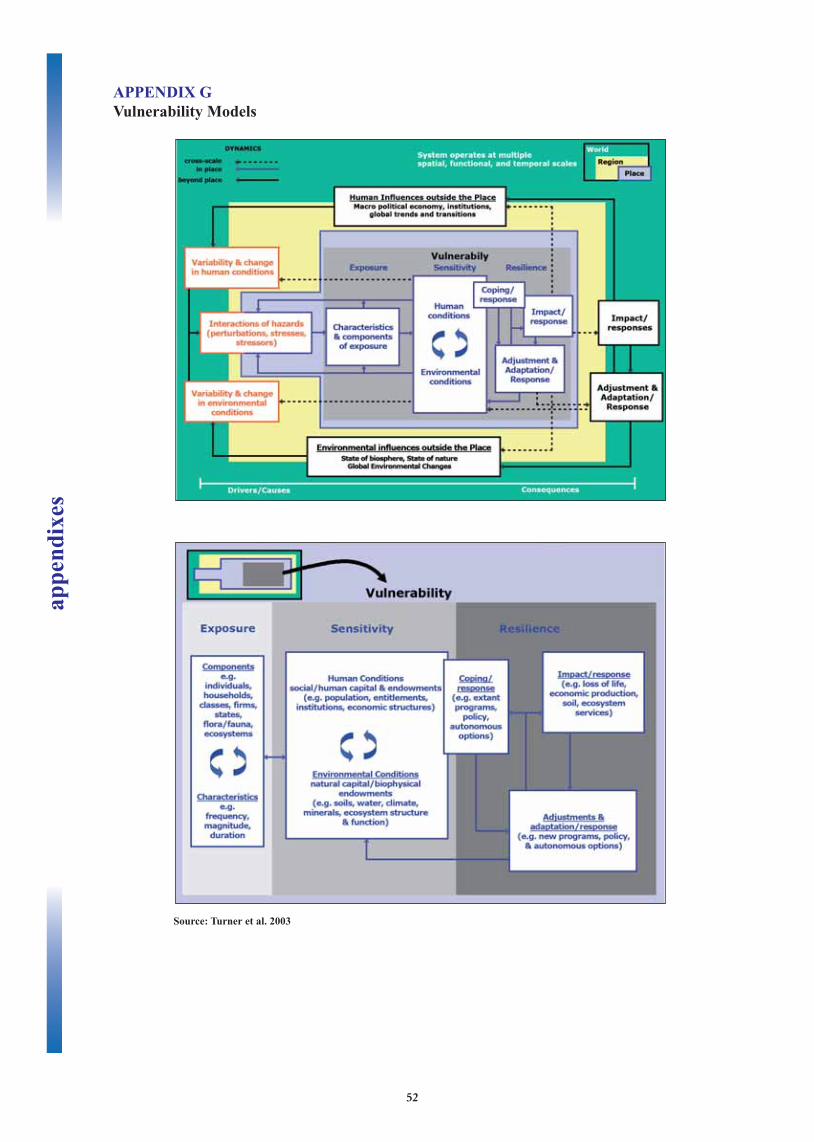
52
APPENDIX GVulnerability Models
Source: Turner et al. 2003
appe
ndix
es
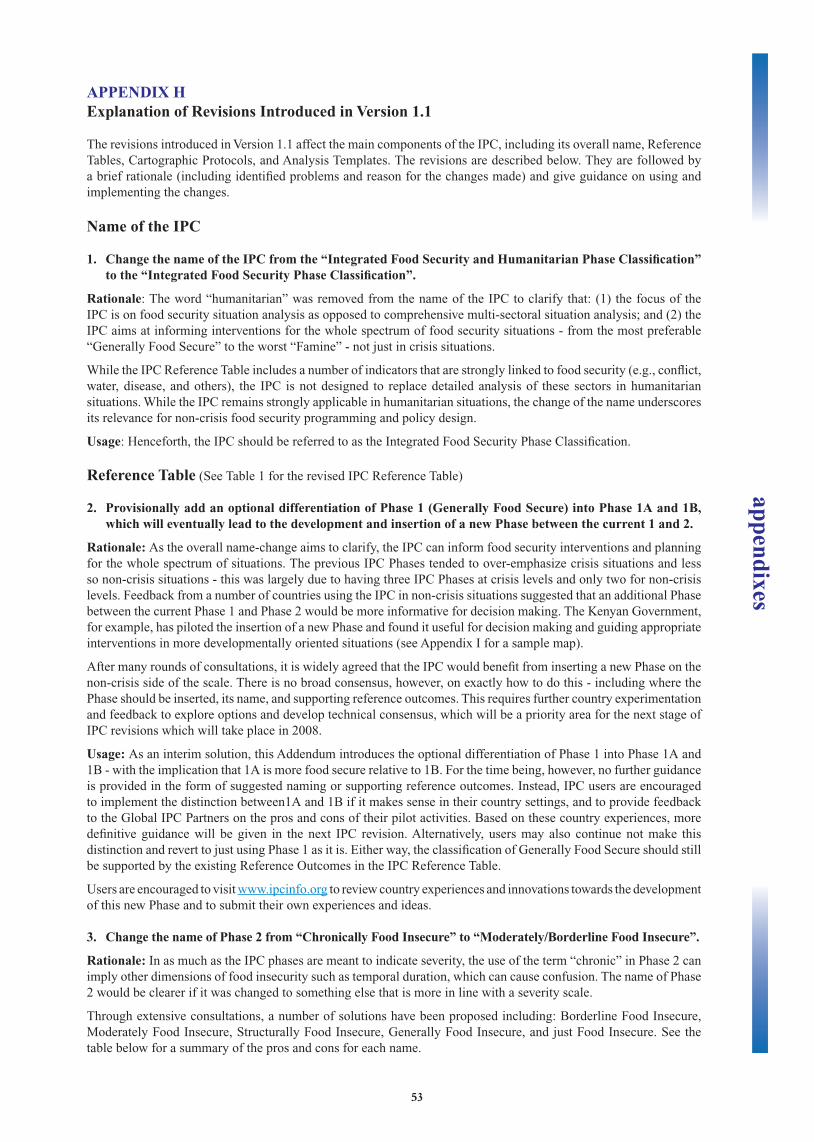
53
APPENDIX HExplanation of Revisions Introduced in Version 1.1
The revisions introduced in Version 1.1 affect the main components of the IPC, including its overall name, Reference
Tables, Cartographic Protocols, and Analysis Templates. The revisions are described below. They are followed by
a brief rationale (including identifi ed problems and reason for the changes made) and give guidance on using and
implementing the changes.
Name of the IPC
1. Change the name of the IPC from the “Integrated Food Security and Humanitarian Phase Classifi cation” to the “Integrated Food Security Phase Classifi cation”.
Rationale: The word “humanitarian” was removed from the name of the IPC to clarify that: (1) the focus of the
IPC is on food security situation analysis as opposed to comprehensive multi-sectoral situation analysis; and (2) the
IPC aims at informing interventions for the whole spectrum of food security situations - from the most preferable
“Generally Food Secure” to the worst “Famine” - not just in crisis situations.
While the IPC Reference Table includes a number of indicators that are strongly linked to food security (e.g., confl ict,
water, disease, and others), the IPC is not designed to replace detailed analysis of these sectors in humanitarian
situations. While the IPC remains strongly applicable in humanitarian situations, the change of the name underscores
its relevance for non-crisis food security programming and policy design.
Usage: Henceforth, the IPC should be referred to as the Integrated Food Security Phase Classifi cation.
Reference Table (See Table 1 for the revised IPC Reference Table)
2. Provisionally add an optional differentiation of Phase 1 (Generally Food Secure) into Phase 1A and 1B, which will eventually lead to the development and insertion of a new Phase between the current 1 and 2.
Rationale: As the overall name-change aims to clarify, the IPC can inform food security interventions and planning
for the whole spectrum of situations. The previous IPC Phases tended to over-emphasize crisis situations and less
so non-crisis situations - this was largely due to having three IPC Phases at crisis levels and only two for non-crisis
levels. Feedback from a number of countries using the IPC in non-crisis situations suggested that an additional Phase
between the current Phase 1 and Phase 2 would be more informative for decision making. The Kenyan Government,
for example, has piloted the insertion of a new Phase and found it useful for decision making and guiding appropriate
interventions in more developmentally oriented situations (see Appendix I for a sample map).
After many rounds of consultations, it is widely agreed that the IPC would benefi t from inserting a new Phase on the
non-crisis side of the scale. There is no broad consensus, however, on exactly how to do this - including where the
Phase should be inserted, its name, and supporting reference outcomes. This requires further country experimentation
and feedback to explore options and develop technical consensus, which will be a priority area for the next stage of
IPC revisions which will take place in 2008.
Usage: As an interim solution, this Addendum introduces the optional differentiation of Phase 1 into Phase 1A and
1B - with the implication that 1A is more food secure relative to 1B. For the time being, however, no further guidance
is provided in the form of suggested naming or supporting reference outcomes. Instead, IPC users are encouraged
to implement the distinction between1A and 1B if it makes sense in their country settings, and to provide feedback
to the Global IPC Partners on the pros and cons of their pilot activities. Based on these country experiences, more
defi nitive guidance will be given in the next IPC revision. Alternatively, users may also continue not make this
distinction and revert to just using Phase 1 as it is. Either way, the classifi cation of Generally Food Secure should still
be supported by the existing Reference Outcomes in the IPC Reference Table.
Users are encouraged to visit www.ipcinfo.org to review country experiences and innovations towards the development
of this new Phase and to submit their own experiences and ideas.
3. Change the name of Phase 2 from “Chronically Food Insecure” to “Moderately/Borderline Food Insecure”.
Rationale: In as much as the IPC phases are meant to indicate severity, the use of the term “chronic” in Phase 2 can
imply other dimensions of food insecurity such as temporal duration, which can cause confusion. The name of Phase
2 would be clearer if it was changed to something else that is more in line with a severity scale.
Through extensive consultations, a number of solutions have been proposed including: Borderline Food Insecure,
Moderately Food Insecure, Structurally Food Insecure, Generally Food Insecure, and just Food Insecure. See the
table below for a summary of the pros and cons for each name.
appendixes
54
Possible Name for Phase 2 Pros Cons
Borderline Food Insecure
More in line with a severity scale than the term “chronic”. Connotes the grey area between being food secure and being in crisis.
The term “borderline” can suggest being nearly, but not yet, food insecure, whereas in fact areas meeting the criteria are already food insecure. Does not imply guidance for action.
ModeratelyFood Insecure
More in line with a severity scale than the term “chronic”, and can indicate transitions from Phase 1 to Phase 3 and vice-versa. Connotes a degree of being food insecure.
The term “moderately” is a relative term whereas the IPC aims to be a more absolute scale. Would imply a “high” and “low” food insecurity status which is not included in the IPC scale. Does not imply guidance for action.
Structurally Food Insecure
Draws attention to the often intractable and underlying causes of food insecurity at this level. Communicates overall guidance for action to address the structural causes of food insecurity rather than superfi cial actions.
While an improvement on the term “chronic”, it is still not fully in line with a severity scale. Could cause confusion for areas that are transitioning through this Phase. Can imply that it is only this Phase where structural issues are relevant.
Generally Food Insecure
More in line with a severity scale than the term “chronic”. Correctly connotes already being in a condition of food insecurity. Has a logical fl ow from Phase 1 “Generally Food Secure” to Phase 2 “Generally Food Insecure” to the subsequent crisis Phases.
Does not imply or communicate guidance for action. Language is not strong enough to draw attention to the holistic efforts required to improve food security situations at this Phase. It is not clear whether magnitude, i.e. the majority of the population, or severity are key defi ning criteria.
Food Insecure
It is brief and easy to use in written and oral communication. Has a logical fl ow from being “Generally Food Secure” to being “Food Insecure”
The term is already widely used in multiple contexts and can refer to the whole range of crisis and non-crisis food insecurity, which would lead to confusion in its usage.
Considering the pros and cons of each option above, both of the terms “moderately” and “borderline” capture the
essence of Phase 2. Indeed, some fi eld users are already using these terms although there is no strong consensus yet
on which of the two terms should be used. As a preliminary solution, the combined name of “moderately/borderline
food insecure” has been introduced in Version 1.1. Further consultations will continue with fi eld users and other
stakeholders during the development of Version 2 of the IPC Technical Manual.
Usage: The name of Phase 2 has been changed from “Chronically Food Insecure” to “Moderately/Borderline Food
Insecure”. Users can chose to use either the combined name or either of the two names on their own, depending on
what makes most sense in their individual country context. The reference outcomes to support the classifi cation of
Phase 2 remain the same.
4. Change the name of the accompanying reference table for early warning from “Early Warning Levels” to “Risk of Worsening Phase”.
Rationale: The projected period of analysis for the IPC Phases and their relation to early warning levels has been
unclear. An IPC Phase classifi cation is defi ned as the current or imminent presence of reference outcomes for the
projected time period of analysis. In situations where reference outcomes are not yet present, the Phase classifi cation
itself is an early warning statement for the projected period of analysis. The term “imminent” is an essential aspect
of a Phase classifi cation emphasizing that it is more forward looking and thus useful for decision making. In short,
the IPC Phase classifi cation is a projection referenced against either current or imminently expected outcomes. For
further clarifi cation on the early warning functions of the IPC, refer to section III.
Within the projection time period, and although the Phase Classifi cation gives current or imminent outcomes, the
situation could further deteriorate into a Phase that is worse than what was projected. This can be communicated
using the protocols for “Risk of Worsening Phase”.
Usage: The name “Early Warning Levels” has been changed to “Risk of Worsening Phase” on the Reference Table,
Analysis Templates, and Cartographic Protocols. Users are encouraged to use these Risk protocols when the evidence
suggests that there is the potential for the Phase to worsen during the time period of the projection.
appe
ndix
es
55
Analysis Templates (See Tables 18-20 for revised Analysis Templates)
5. In Part 1 of the Analysis Template, combine the list of direct and indirect evidence into a single column, and highlight the distinction between direct and indirect evidence by marking direct evidence in bold.
Rationale: Although the IPC Reference Table provides the common reference outcomes associated with each Phase,
the actual evidence in support of a Phase Classifi cation can either be direct evidence (which directly measures the
outcome) or indirect (which indirectly indicates the reference outcome, for example with proxy or process indicators).
While this is an important distinction, it is not necessary to have them listed in separate columns.
Usage: To increase the usability of the Analysis Templates, direct and indirect evidence are now combined into a
single column (see Figure 1 below), and the user is advised to make the distinction between the two by marking direct
evidence in bold typeface.
6. Insert a separate column into Part 1 of the Analysis Template that documents evidence in support of a statement on the Risk of a Worsening Phase.
Rationale: The previous IPC Analysis Templates did not explicitly include a column to document evidence in
support of a statement on the Risk of a Worsening Phase during the time period of analysis. There is a need to keep
this evidence separate from that for the Phase Classifi cation itself so that it can be evaluated independently.
Usage: The revised Analysis Templates include a separate column for documenting evidence in support of a statement
on the Risk of a Worsening Phase (see Figure 1). The evidence listed should include any applicable hazard and
process/leading indicators that may substantiate a further risk statement. The early warning statement can be for
either a change in magnitude (number of people in crisis) or severity or both. If it is Risk for a Worsening Phase, the
expected Phase change should be indicated along with the Risk level.
Cartographic Protocols (See Map 1 for an example of revised Cartographic Protocols)
7. Move “Projected Trend” from the call-out boxes to the white arrows directly on each crisis area of the map.
Rationale: Projected trend is a critical dimension of situation analysis because it indicates if a situation is expected
to improve, stay the same, worsen, or if there are mixed signals. Whereas the previous IPC protocols included this in
the call-out boxes, this dimension should be given greater visibility by shifting the arrows directly onto the map.
Usage: The new protocols shift the Projected Trend into the main legend with white colored arrows directly on the
map for each crisis area.
8. Within the key for the Defi ning Attributes of Crisis Areas, rearrange the order of the variables and add a basic description of the variables on the left to highlight: magnitude, depth, who, why, frequency, date, and confi dence.
Rationale: To increase the impact and logic of the cartographic protocols, the order of the variables in the Key
Defi ning Attributes key should be rearranged. Greater prominence should be given to the basic variables of magnitude
(number of people in crisis) and depth (the percentage of people in crisis) by putting them fi rst on the list. Overall, the
main dimensions of each of the variables can be highlighted by adding a basic description to the left side of the key.
Usage: The Cartographic Protocols for the Key Defi ning Attributes have been updated - they have a new order and a
brief description on the left side of the key.
9. Add a new option to visually distinguish the broad categories of magnitude (i.e., numbers of people in crisis) using different font sizes for populations ranging from 0-100,000, 101,000-500,000, and >500,000.
Rationale: Magnitude (number of people in crisis) is a basic dimension of food security situation analysis and should
be given greater visual prominence in the cartographic protocols. The previous IPC protocols included magnitude as
a number in the call-out boxes but did not show this in a visually distinctive manner.
Usage: The revised protocols categorize magnitude into three basic groups (0-100,000, 101,000-500,000, and >=
500,000). The actual numbers in the call-out boxes - i.e. the estimates of numbers of people in Phase 3, 4, or 5 for
a given area -should be in different font sizes according to which category they fall into. The font sizes should be 7
for 0-100,000, 8 for 101,000-500,000, and 12 for >=500,000. Consistent usage of these font sizes will enable easy
comparison of rough magnitude both within and across countries.
appendixes
56
10. Add a new protocol to the call-out boxes to indicate the depth of a crisis by inserting a stacked bar graph on the right side of each call-out box that displays the estimated population percentage in Phase 1 to 5.
Rationale: Along with severity and magnitude, the depth of a crisis is a basic dimension of situation analysis. Depth
can be indicated by the percentage of the total population in a given area that is facing varying degrees of crisis, and
is critical for decision making. For example, Area A could have a total population of, 500,000 people; with 100,000
of those people (20% of the total population) in Humanitarian Emergency. Area B could have a total population of
100,000 people; with 90,000 of those people (90% of the total population) in Humanitarian Emergency. While the
severity and magnitude of both Area A and B are roughly equivalent, the depth of the crisis is dramatically worse in
Area B than in Area A. This difference would not determine, but would most likely infl uence, the urgency, strategic
design, and operational modalities for interventions.
This new protocol will also better communicate that a given area may be experiencing multiple “layers” of crisis
for different vulnerable groups (i.e. multiple Phases for different social groups in the same area). A portion of the
population could be in say, Phase 4 while others are in Phase 3, and others still in Phases 1 and 2. Although estimates
of the population in each Phase are indicated in the IPC Population Tables, multiple Phase areas should be clearly
indicated on the map to avoid misinterpretation. Note that in situations with multiple layers of crisis groups, the
protocol is to color the area according to the worst Phase.
Usage: A new stacked bar graph has been added to the right side of each of the call-out boxes and the key (See Map 1
for an example of revised Cartographic Protocols). The graph ranges from 0% to 100%, and each stack indicates the
percentage of the population in that area estimated to be in each of the IPC Phases 1-5. The calculation of percentages
should be based on the total estimated number of people in each Phase for that area divided by the total estimated
number of people currently resident in that same area.
11. Add a new protocol to the call-out boxes to indicate the Frequency or Recurrence of Crisis over the past ten years, with categories of Low (1-2 years), Medium (3-4 years), and High (>=5 years).
Rationale: Another key dimension of situation analysis is the degree to which a given area in crisis tends to be
frequently in crisis or not. This difference should infl uence programme design, and put an even greater focus on
addressing the underlying causes of recurrent crisis - without such efforts these areas will likely be in cyclical crisis.
Also, areas that have not been, or are very rarely in crisis will most likely have a different type of institutional set-up
then areas with frequent crises.
Usage: A new variable is added to the call-out boxes and the key that indicates the frequency or Recurrence of Crisis
over the past ten years. This is a rolling-calculation, which means that it should include the ten years previous to
and including the current analysis year. Note that the Recurrence of Crisis should not be confused with protocols to
signify areas in Sustained Phase 3, 4, or 5 for >3 years - the former represents cumulative years in crisis over the past
ten years, whereas the latter highlights areas that are in a drawn-out, ongoing crisis.
The key divides the number of years into three main categories: Low (1-2 years), Moderate (3-4 years), and High
(>=5 years) (See Figure 4). The defi nition of a crisis would be whenever the area has been fully or partially in Phase
3, 4, or 5 according to the IPC scale. For countries beginning to use the IPC, since the IPC would not have been used
in the previous ten years it will be necessary to make a an initial estimate based on expert opinion and historical
documents.
appe
ndix
es
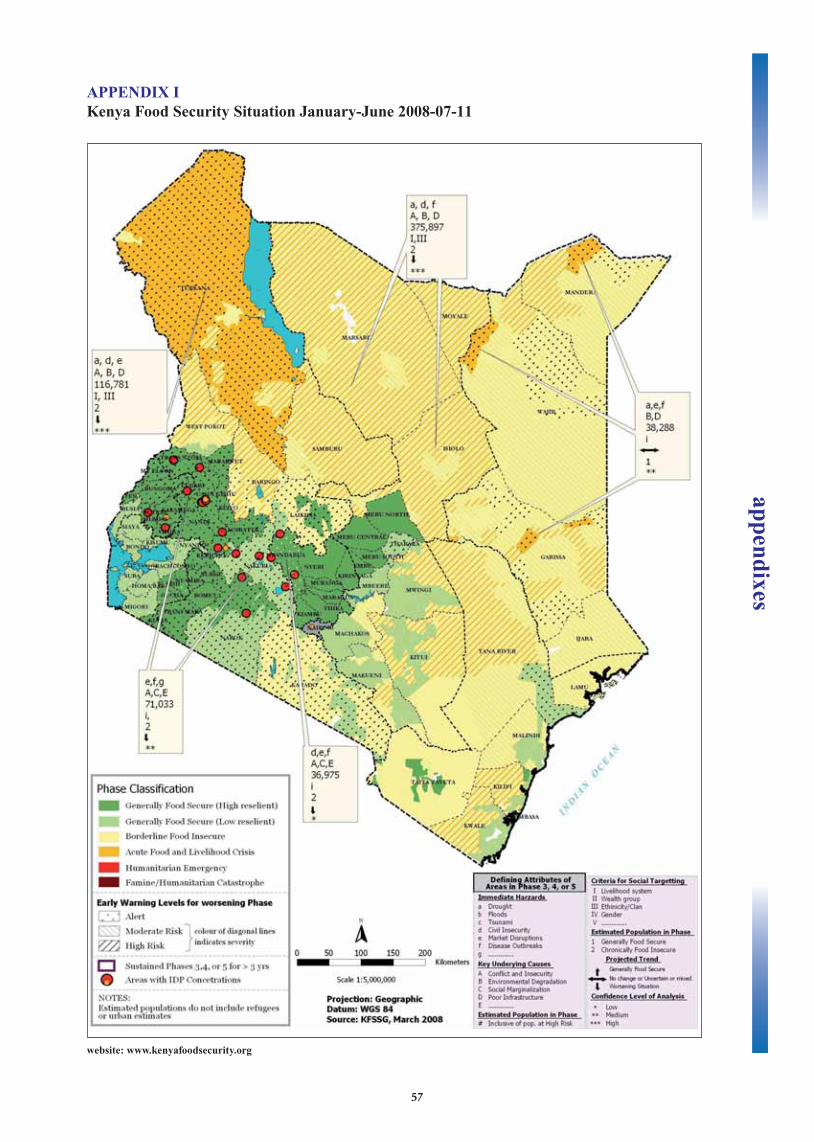
57
APPENDIX I Kenya Food Security Situation January-June 2008-07-11
website: www.kenyafoodsecurity.org
appendixes
58
APPENDIX JBibliography
Alexander, L. & Smith, D. 2004. Evidence and Analysis: Tackling the structural causes of confl ict in Africa and strengthening preventive responses London, International Alert.
Bradbury, M. 1998. Normalizing the crisis in Africa. Journal of Humanitarian Crisis. http://www.jha.ac/articles/a043.htm
Brennan, L. 1984. The development of the Indian famine codes: Personalities, politics, and policies. In Famine as a Geographical Phenomenon (eds) B. Currey & G. Hugo. Dordrecht, Reidel Publishing.
Cahn, M. 2002. Sustainable livelihoods approach - Concepts and practice. Massey University.
Carney, D., Drinkwater, M., Rusinow, T., Neefjes, K., Wanmali, S. & Singh, N. 1999. Livelihoods approaches compared- A brief comparison of livelihood approaches of DFID, CARE, Oxfam and UNDP. London: UK Department
for International Development (DFID).
Chambers, R and Conway, G. 1991. Sustainable rural livelihoods: Practical concepts for the 21st century. IDS
Discussion Paper 296. Sussex: Institute of Development Studies.
Chopak, C. 2000. Early Warning Primer: An Overview of Monitoring and Reporting. Washington DC: Famine Early
Warning Systems Network.
Darcy, J. & Hofmann, C.A.. 2003. According to need? Needs assessment and decision making in the Humanitarian Sector. HPG Report 15. London: Overseas Development Institute.
Dasgupta, P. 1993. An enquiry into well-being and destitution. Oxford: Oxford University Press.
Davis, B. 2003. Choosing a method for poverty mapping. Rome: FAO.
Devereux, S. 2003. Conceptualizing destitution. IDS Working Paper 216. Brighton, Institute of Development Studies.
Devereux, S. 2004. Food Security issues in Ethiopia: Comparisons and contrasts between lowland and highland
areas. Paper presented to the Seminar of the Pastoralist Communication Initiative, UNOCHA, Addis Ababa, 2004.
Devereux, S., Baulch, B., Hussein, K., Shoham, J., Sida, H & Wilcock, D.. 2004. Improving the analysis of food insecurity - Food insecurity measurement, livelihoods approaches and policy. Rome, Food Insecurity and Vulnerability
Information and Mapping Systems (FIVIMS) Secretariat.
Devereux, S.. 2006. Desk review: Identifi cation of methods and tools for emergency assessments to distinguish between chronic and transitionary food insecurity and to evaluate the effects of various types and combinations of shocks on these different groups. Rome, WFP.
Dilley, M. & Boudreau, T.E.. 2001. Coming to terms with vulnerability: A critique of the food security defi nition.
Food Policy 26(3): 229-247.
DFID (UK Department for International Development). 2001. Sustainable Livelihoods: Guidance Sheets. London.
DFID. 2005. “Benchmarking” humanitarian action: Towards global targets, standards and indicators, Information Note 17 August 2005. London.
Drimie S. 2002. The Impact of HIV/AIDS on rural households and land issues in Southern and Eastern Africa. A
Background Paper prepared for the FAO Sub-Regional Offi ce for Southern and Eastern Africa. South Africa, FAO.
Drinkwater, M. 2003. HIV/AIDS and agrarian change in Southern Africa. Paper presented to the UN Regional
Interagency Coordination and Support Offi ce Technical consultation in the light of an HIV/AIDS pandemic,
Johannesburg, South Africa, 2003.
European Commission. 1996. Communication from the commission to the Council and the European parliament on
linking relief, rehabilitation and development (LRRD) /* COM/96/0153 FINAL */
appe
ndix
es
59
Famine Early Warning Systems Network. 2005. FEWSNET Alert Levels: FEWSNET. Available at http://www.fews.
net/alerts/index.aspx?pageID=alertLevelsDefi ned
FAO and DFID. 2000. Proceeding from the Forum on Operationalizing Sustainable Livelihoods Approaches. Paper
presented to the Forum on Operationalizing Sustainable Livelihoods Approaches, Pontignano, Siena.
FAO. 1996. World Food Summit – Rome Declaration on World Food Security and WFS Plan of Action. Rome.
FAO. 2002. Understanding food insecurity and vulnerability: FIVIMS tools and tips. Rome.
FAO. 1995. The effects of HIV/AIDS on farming systems in Eastern Africa. Rome.
FAO/ FIVIMS. 2002. Making FIVIMS Work for You - Tools and tips. Rome.
FAO/ FIVIMS. 2002. Selecting Indicators for National FIVIMS. Rome.
Flores, M., Khwaja, Y. & White, P.. 2005. Food security in protracted crises: Building more effective policy
frameworks. Disasters 29(s1), S25-S51.
Frankenberger, T. 1992. “Indicators and data collection methods for assessing household food security”. In Household food security: concepts, indicators, measurements: A technical review, edited by S. Maxwell & T. Frankenberger.
New York and Rome: UNICEF and IFAD.
Frankenberger, T.R., Drinkwater, M. and Maxwell, D. 2000. “Operationalising household livelihood security:
A holistic approach for addressing poverty and vulnerability”. Proceedings from the forum on operationalising livelihood security approaches. Rome, FAO.
FSAU. 2004. Technical Series report on 2004 Post Gu Analysis. Technical Report No. IV.2. Nairobi.
FSAU. 2005. Technical Series report on 2004/05 Post Deyr Analysis. Technical Report No. IV.3. Nairobi.
FSAU. 2005. Technical Series report on 2005 Interagency assessment mission: Hafuun to Gar”aad, Northeast Somali
coast. Technical Report No IV.4. Nairobi.
FSAU. 2005. Technical Series report on 2005 Post Gu Analysis. Technical Report No IV.7. Nairobi.
FSAU. 2006. Technical Series report on 2005/06 Post Deyr Analysis. Technical Report No IV.8. Nairobi.
FSAU. 2006 (draft, forthcoming). Technical Series report on Coping Strategies Index. Nairobi.
FSAU. 2006 (draft, forthcoming). Technical Series report on Somali integrated spreadsheet - Operational Manual.
Nairobi.
FSAU. 2006 (draft, forthcoming). Technical Series report on Confl ict monitoring and food security analysis. Nairobi.
Guarnieri, V. 2003. Food aid and livelihoods: Challenges and opportunities in complex emergencies. Paper presented
to the FAO international workshop on food security in complex emergencies: Building policy frameworks to address
longer-term programming challenges, Tivoli, Italy, 2003.
Haan, N., Marsland N., Oliveira L. 2003. The impacts of HIV/AIDS on food security in Southern Africa: Regional analysis based on data collected from National VAC emergency food security assessments in Malawi, Zambia, and Zimbabwe. Harare: South Africa Development Community.
Hemrich, G. 2005. Matching food security analysis to context: The experience of the Somalia Food Security
Assessment Unit. Disasters 29(s1), S67-S91.
Howe, P. & Devereux, S.. 2004. Famine intensity and magnitude scales: A proposal for an instrumental defi nition of
famine. Disasters 28(4), 353-372.
HPG. 2005. Humanitarian issues in Niger. London, Overseas Development Institute.
appendixes
60
Hulme, D., Moore, K. & Shepherd, A.. 2001. Chronic poverty: Meanings and analytical frameworks: CPRC Working
Paper 2. Manchester, Chronic Poverty Research Center: University of Manchester.
IASC (Inter-agency standing Committee) CAP Sub Working Group. 2005. The needs analysis framework - Strengthening the process of analysis and presentation. Geneva.
IASC. 2006. Draft 2 - Measuring life and death in humanitarian crises: Proposal for an Humanitarian Tracking service through mortality, health, nutrition assessment and monitoring. Geneva.
ICRC. 2005. How to conduct a food security assessment: A step-by-step guide for National societies in Africa. Geneva.
J.Geist, H. & Lambin, E. F.. 2001. What drives tropical deforestation? - A meta-analysis of proximate and underlying causes of deforestation based on sub-national case study evidence. LUCC Report Series No. 4. Louvain-la-Neuve,
Land Use and Land Cover Change (LUCC).
Kasperson, J. & Kasperson, R. E. 2001. Workshop Summary - International workshop on vulnerability and global environmental change. Stockholm, Stockholm Environmental Institute.
Krummenacher, H. and Schmeidl, S. 2001: Practical challenges in predicting violent confl ict - FAST: An example of
a comprehensive early-warning methodology Working Paper No. 34. Bern, Schweizerische Friedensstiftung.
Lanjouw, J.O.1999. Demystifying Poverty Lines. New York, UNDP.
Longley, C. & Maxwell D.. 2003. Livelihoods, chronic confl ict and humanitarian response: A synthesis of current practice. Working Paper 182. London: Overseas Development Institute.
Maire, B. & F. Delpeuch. 2005. Nutrition Indicators for Development. Rome: Food and Agriculture Organization.
Maxwell D Caldwell R, 2008. The Coping Strategies Index: Field Methods Manual, second edition, CARE. First
edition 2003 on ftp://ftp.fao.org/docrep/fao/meeting/009/ae513e.pdf
Maxwell, D., Watkins, B., Wheeler, R. & Collins, G.. 2003. The Coping Strategies Index: Field methods manual. Nairobi: CARE and WFP.
Nordberg, N. 1999. Communicable Diseases - A manual for health workers in Sub Saharan Africa. Nairobi, African
Medical and Research Foundation.
Pingali, P., Alinovi, L. & Sutton, J.. 2005. Food security in complex emergencies: Enhancing food system resilience.
Disasters 29(s1), S5-24.
Riely, F., Mock, N., Cogil, B., Bailey, L. & Kenefi ck, E.. 1999. Food security indicators and framework for use in the monitoring and evaluation of food aid programs. Washington DC, FANTA.
Samarasinghe, S., Donaldson, B. & McGinn, C. 1999. Confl ict vulnerability analysis. New Orleans: Tulane Institute
for International Development.
Save the Children UK. 2000. Household Economy Approach: A resource manual for practitioners. London.
SCN. 20004 UN System Standing Committee on Nutrition- Nutrition Information in Crisis Situations. UN System
Standing Committee on Nutrition Report No. 3. Geneva, SCN Secretariat.
Scones, I.. 1998. Sustainable Rural livelihoods: A framework for Analysis. Brighton, Institute of Development Studies.
Sen, A. 1981. Poverty and famines: An essay on entitlement and deprivation. Oxford: Clarendon Press.
Swindale, A. and P. Bilinsky. 2005. Household Dietary Diversity Score (HDDS) for measurement of Household Food Access: Indicator Guide. Food and Nutrition Technical Assistance (FANTA) Project. Washington DC.
Swindale, A. and P. Bilinsky. 2006. Development of a Universally Applicable Household food Insecurity Measurment Tool: Process, Current Status, and Outstanding Issues. Food and Nutrition Technical Assistance (FANTA) Project.
Washington DC.
appe
ndix
es
61
Standardized Monitoring and Assessment of Relief and Transitions (SMART) www.smartindicators.org.
The Sphere Project. 2004. The Sphere Project: Humanitarian Charter and Minimum Standards in Disaster Response. Oxford: Oxfam Publishing.
Turner, B.L., Kasperson, R., Matson P. et al. 2003. A framework for vulnerability analysis in sustainability science.
Proceedings of the National Academy of Sciences of the United States of America 100 (14), 8074-8079.
UNAIDS. 1999. A review of household and community responses to the HIV/AIDS epidemic in the rural areas of sub-Saharan Africa.
UNHCR. 2005. An introduction to International Protection: Protecting persons of concern to UNHCR. Geneva.
UNICEF. 1986. Assisting in emergencies: A resource handbook for UNICEF staff. New York.
UNICEF. 1990. Strategy for improved nutrition of children and women in developing countries. New York.
UNICEF. 2003. State of the Worlds Children 2003. New York.
UNICEF. forthcoming. Assessment of child nutrition in the Greater Horn of Africa: Recent trends and future developments. Nairobi and New York.
Van DerKam, S. 2000. Revised MSF Guidelines. In Field Exchange 10.
Watts, M.J. 1983. Silent Violence. Berkeley: University of California Press.
Webb, P., J. Coates, E. Frongillo, B. Rogers, A. Swindale, and P. Bilinsky. 2006. Measuring Household Food Insecurity: Why It’s So Important and Yet So Diffi cult to Do. Food and Nutrition Technical Assistance (FANTA)
Project. Washington DC.
WFP and CDC. 2005. A Manual : Measuring and interpreting malnutrition and mortality. Rome.
WFP. 2000. A collaborative emergency food needs assessment in Uganda - Part III EFNA methodology and tools. Kampala.
WFP. 2002. VAM Standard Analytical Framework-Role and Objectives of VAM Activities to support WFP food oriented interventions. Rome.
WFP. 2004. Consolidated Framework of WFP Policies. Agenda item presented to the WFP Executive Board Third
Regular Session, 11-14 October 2004. Rome.
WFP. 2005. Emergency food security and nutrition in Darfur, Sudan 2005. Rome.
WFP. 2005. Emergency Food Security Assessment Handbook. Rome.
Young, H., Jaspars, S., Khara T. & Collins, S.. 2005. Acute malnutrition: Benchmarking system for global humanitarian response. London, Valid International.
appendixes

9 7 8 9 2 5 1 0 6 0 2 7 8
I0275E/3/02.10/1000
ISBN 978-92-5-106027-8