Embed Size (px)
Citation preview
Page 1 of 23
Integrated Geospatial Information Service for Disaster
Management in China’s Wenchuan Earthquake
Jun Chen1, Gang Han
1,2, Lijun Chen
1, Yong Zhao
1, Shuping Jin
1, Faliang Wang
1National Geomatics Center of China
No. 28, Lianhuachi Road(West), Haidian District, Beijing City, P. R. China, 100830
2College of Resource Science and Technology, Beijing Normal University
No. 19, Xinjiekou Wai Street, Beijing City, P. R. China, 100875
Abstract
An integrated geospatial information system was established immediately after
Wenchuan Earthquake, which struck on 12 May 2008, in order to support disaster
relief, damage assessment, and post-earthquake restoration and reconstruction. Built
upon China‟s national Spatial Data Infrastructure (SDI), the geospatial information
system comprised three essential components: geospatial data acquisition and
updating, cartographic support, and ad-hoc spatial decision support systems (SDSSs).
Administrative boundary maps, topographic data, and orthophotos were provided to
rescue operators and disaster staff immediately after the earthquake. Updated data
were provided by acquiring large-scale new images and creating image maps covering
the affected area. Numerous thematic maps were produced to accommodate the
requirements of government officials, relief staff, disaster researchers, and local
municipalities. Three ad hoc spatial decision support systems were designed and
1 Corresponding author. Email: [email protected]
Page 2 of 23
developed to facilitate rescue operations, damage assessment, and reconstruction
planning. The availability of this geospatial information service has substantially
improved the efficiency of operational disaster management in Wenchuan Earthquake.
This study demonstrates the usefulness of a national SDI for disaster management.
Key words: Spatial Data Infrastructure, Image Map, On-demand Thematic Mapping,
Spatial Decision Support System
1. Introduction
A strong earthquake with the magnitude of Ms8.0 struck on 12 May 2008, with the
epicenter near Yingxiu, Wenchuan County, Sichuan Province, China (hereafter
referring as Wenchuan Earthquake). The major affected area by this earthquake was
located between the Qinghai-Tibet Plateau and Sichuan Basin with rolling relief and
complicated alpine valleys. It is in a transitional area between wettish subtropical
monsoon climate and semi-arid warm temperate continental monsoon climate, and
thus heavy rainfall and storms occur frequently. Stratigraphically, the affected area
mainly comprises loose phyllite and gneiss, thus favoring the development of
earthquakes and related secondary disasters. The tremendous energy released from the
earthquake has resulted in the collapse of numerous buildings and the death of nearly
80,000 people throughout China‟s provinces of Sichuan, Gansu and Shaanxi.
Moreover, the earthquake and its aftershocks have triggered numerous secondary
disasters, such as landslides, mudflows, and quake lakes (Wang et al. 2009).
Page 3 of 23
Immediately after the earthquake, a geospatial information service was launched in
order to support citizens, troops, and government departments at different levels, as
well as oversea volunteers for disaster relief (Chen et al. 2009a, Li 2009, Zhang et al.
2009). This integrated geospatial information service was built upon China‟s national
Spatial Data Infrastructures (SDIs). It comprised three essential components:
geospatial data acquisition and updating, cartographic support, and ad-hoc spatial
decision support systems (SDSSs). With this geospatial information service, better
situation awareness, adequate crisis response, and optimal spatial decision-making
were achieved during the phases of disaster relief, damage assessment, and
post-disaster reconstruction. The efficiency of operational disaster management in the
Wenchuan Earthquake has been significantly improved. This is an excellent example
of the successful application of Spatial Data Infrastructures (SDIs) enabled geo-spatial
information for disaster management. The methodology developed here can be used
for the management of other types of disasters.
This paper is organized into several sections. Section 2 introduces the overall
methodology for SDI-enabled geospatial information service development. Section 3
explains the data services emphasizing rapid generation of image maps. Section 4
discusses the on-demand thematic mapping. Section 5 examines the development and
utilization of an ad-hoc SDSSs through three different stages for disaster management.
Some future research needs are discussed in section 6.
Page 4 of 23
2. SDI-enabled geospatial information service
A SDI refers as an integrated geospatial information framework consisting of
geospatial data sets, access network, technology, standards, policies, institutions, and
human resources. Since the last twenty years, the SDI development has became a top
priority for governments at different levels in the world (Masser 2005, Hjelmager et al.
2008). The Australian SDI, Canadian Geo-spatial data infrastructure, China‟s SDI,
and US national SDI are among the examples of national SDIs. The Infrastructure for
Spatial Information in the European Community (INSPIRE), the United Nation SDI,
and the Global Mapping project are examples of regional and global SDI initiatives
(Armenakis 2008, Boccardo et al. 2008).
Substantial human and financial resources have been invested in China during the past
twenty years to establish geospatial databases, to set up institutional frameworks, to
formulate SDI-related policies, to develop technical systems and standards, as well as
to develop network-based geo-information services (Chen and Chen 2002).
Geo-spatial databases for operational uses normally include vector-based topographic
data at different scales, multi-resolution orthophotos and digital elevation models, as
well as multi-level administrative boundary data and geographic names. The
capability of geo-spatial data acquisition, processing, management and dissemination
has also been enhanced due to the introduction of advanced techniques, such as digital
airborne sensors, digital photogrammetric grid, unmanned aerial vehicles, among
Page 5 of 23
others (Zhang et al. 2009, Li et al. 2008). Nowadays SDIs have become an
underpinning component of national development strategy in many countries and
serve as an enabling platform for promoting geospatial data sharing and for
supporting the vast majority of the society (Masser et al. 2008).
The utilization of SDIs for disaster management and emergency response has been
reported (Zlatanova et al. 2007). The International Charter on „Space and Major
Disasters‟ is an international operational network of collaborative remote sensed data
acquisition and has provided successful emergency service to many disaster events.
The Global Monitoring for Environment and Security (GMES) initiative is another
European initiative for promoting integrated access to space-based data assets and in
situ data networks. The United Nations has decided to establish the United Nations
Platform for Space-based Information for Disaster Management and Emergency
Response (UN-SPIDER) as a new program „to ensure that all countries have the
access to use all types of space-based information to support the full disaster
management cycle (Boccardo and Tonolo 2008). A number of successful applications
of geo-spatial information in disaster management have been implemented, such as
the relief support of the Tsunami in December 2004. Technical progresses in this area
include the integration of remote sensing into the operational workflow of rapid
emergency response, three dimensional data modeling and visualization for
emergency response, change detection in large-size multi-temporal images,
web-based disaster information dissemination, and sensor networks, communication
Page 6 of 23
and navigation solutions for first responders, early warning systems (ORCHESTRA
2005, Bovolo and Bruzzone 2007, Zlatanova 2008, Brunner et al. 2009).
As one of the most destructive earthquakes since the founding of the People‟s
Republic of China in 1949, Wenchuan Earthquake had seriously destroyed the
transportation and communication systems, especially in surrounding mountainous
areas. It was very difficult to deliver disaster relief teams and facilities to some worst
affected areas. Reliable and updated geospatial information was therefore critical for
understanding the scope and severity of this large-scale catastrophic event and for
making timely spatial decisions during the cycle of disaster management. An
integrated geospatial information service was then designed and implemented by
China‟s National Geomatics Center on the basis of the national SDIs and in
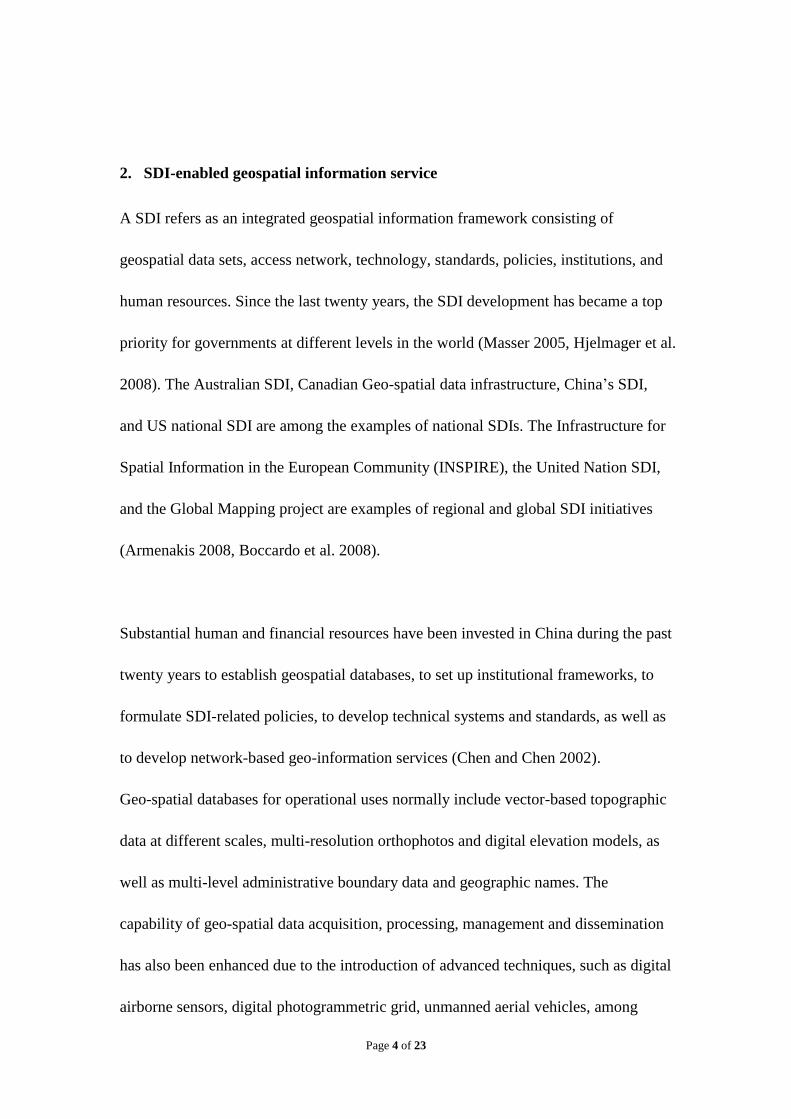
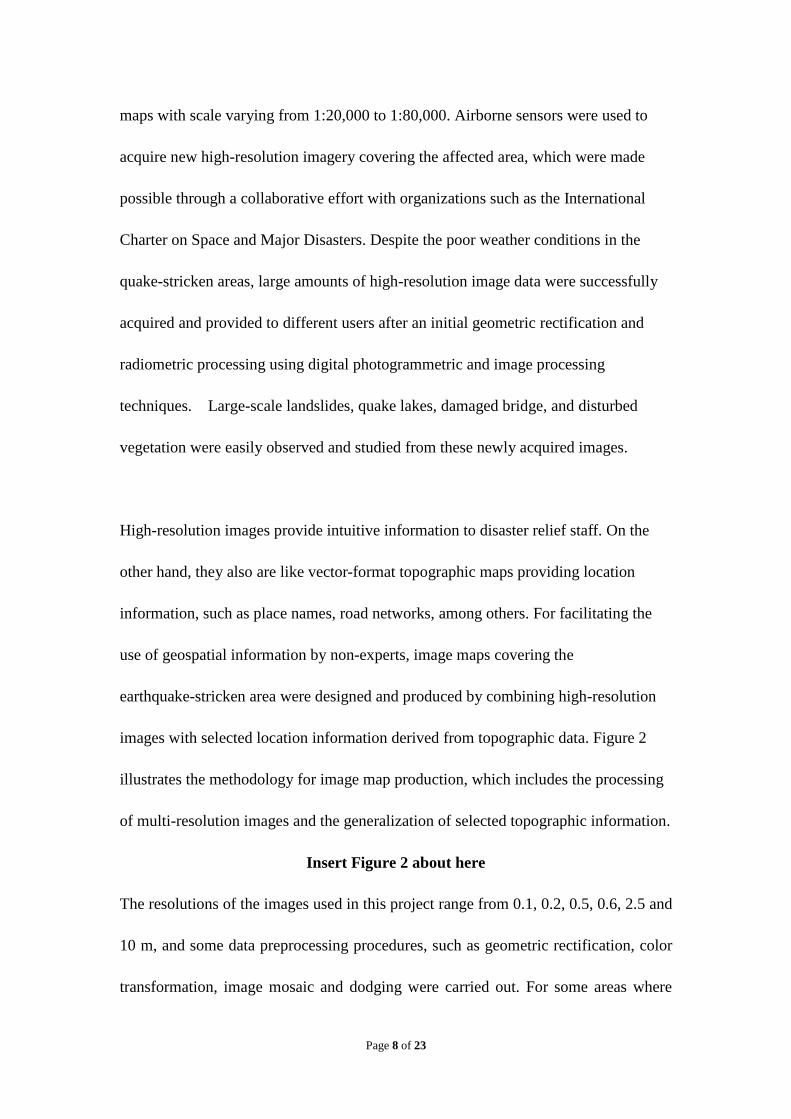
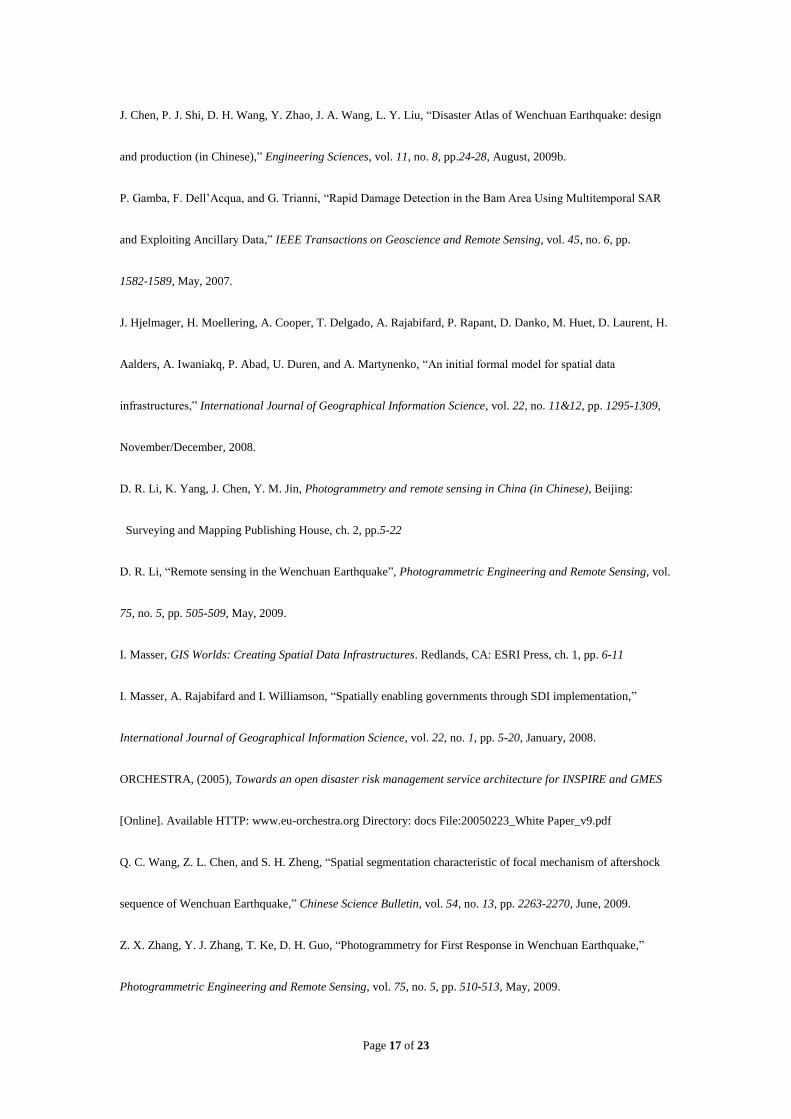
collaboration with some other relevant government agencies and organizations. Figure
1 illustrates the overall framework of this integrated geospatial information service
with data service, cartographic support and ad hoc Spatial decision Support System
(SDSS) as the three major components.
Insert Figure 1 about here
Data services were organized immediately after the earthquake by assembling all the
achieved administrative maps, topographic data and orthophotos and acquiring new
images covering the earthquake stricken area. Updated information was provided after
conducting some necessary data pre-processing, such as geometric rectification and
semantic integration of data from different sources. Image maps at scales 1:25,000
Page 7 of 23
and 1:5,000 were further produced to accommodate non-expert users.
Cartographic maps are useful for visualizing earthquake disaster development,
intermediate and final damage evaluation results, emergency response, and the
reconstruction plan. Four levels of cartographic units were defined by the geographic
characteristics in quake-affected areas. Hundreds of thematic maps were designed and
produced at the request of decision makers, rescue operators, disaster researchers, as
well as local municipalities.
An ad-hoc SDSS was developed to help understand the geographic environment in the
earthquake-stricken area, to facilitate disaster assessment, and to assist formulate
reconstruction plan. All available geospatial data were integrated, and specialized
functionalities were developed by combining geographic processing and
domain-specific knowledge.
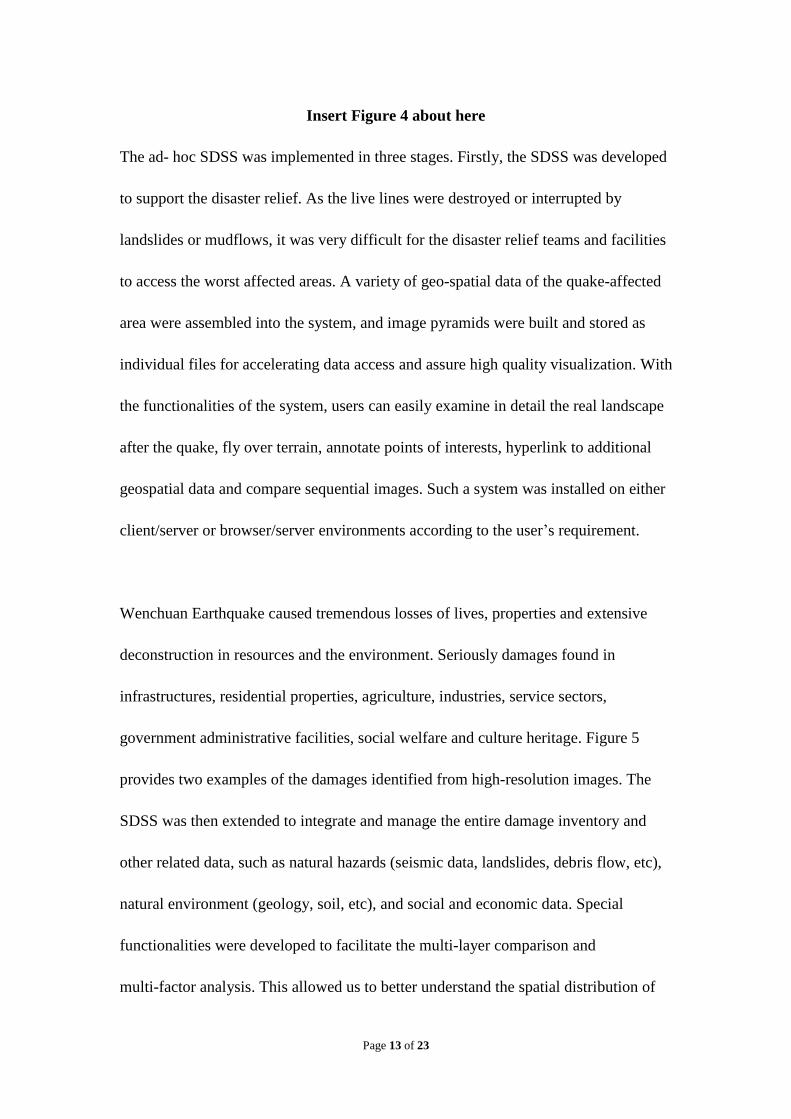
3. Image map production
Wenchuan Earthquake affected an area of approximately 500,000 km2, which covers
417 counties in 10 provinces including Sichuan, Shaanxi and Gansu. All archived
geo-spatial data covering this affected area were assembled and made available to
rescue operators and decision makers immediately after the earthquake. They include
vector-format topographic data at scales ranging from 1:50,000 to 1:250,000, digital
orthophotos with resolutions from 2.5 to 10 meters, and country-level administrative
Page 8 of 23
maps with scale varying from 1:20,000 to 1:80,000. Airborne sensors were used to
acquire new high-resolution imagery covering the affected area, which were made
possible through a collaborative effort with organizations such as the International
Charter on Space and Major Disasters. Despite the poor weather conditions in the
quake-stricken areas, large amounts of high-resolution image data were successfully
acquired and provided to different users after an initial geometric rectification and
radiometric processing using digital photogrammetric and image processing
techniques. Large-scale landslides, quake lakes, damaged bridge, and disturbed
vegetation were easily observed and studied from these newly acquired images.
High-resolution images provide intuitive information to disaster relief staff. On the
other hand, they also are like vector-format topographic maps providing location
information, such as place names, road networks, among others. For facilitating the
use of geospatial information by non-experts, image maps covering the
earthquake-stricken area were designed and produced by combining high-resolution
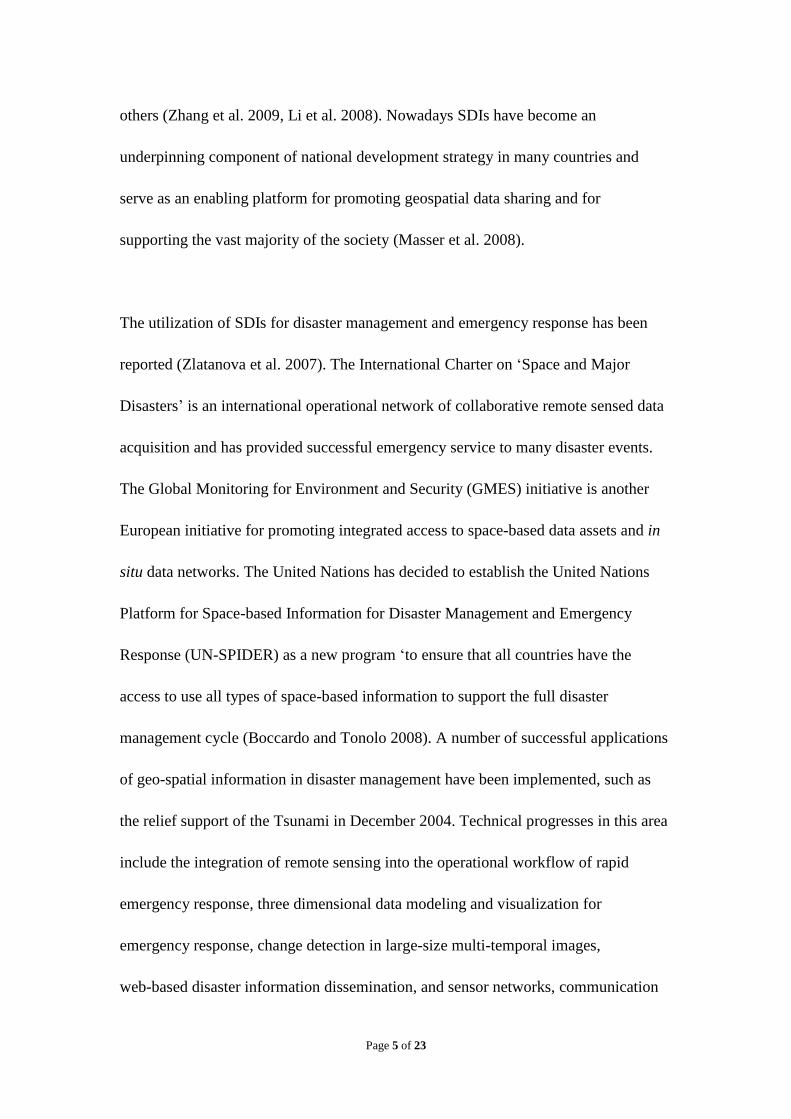
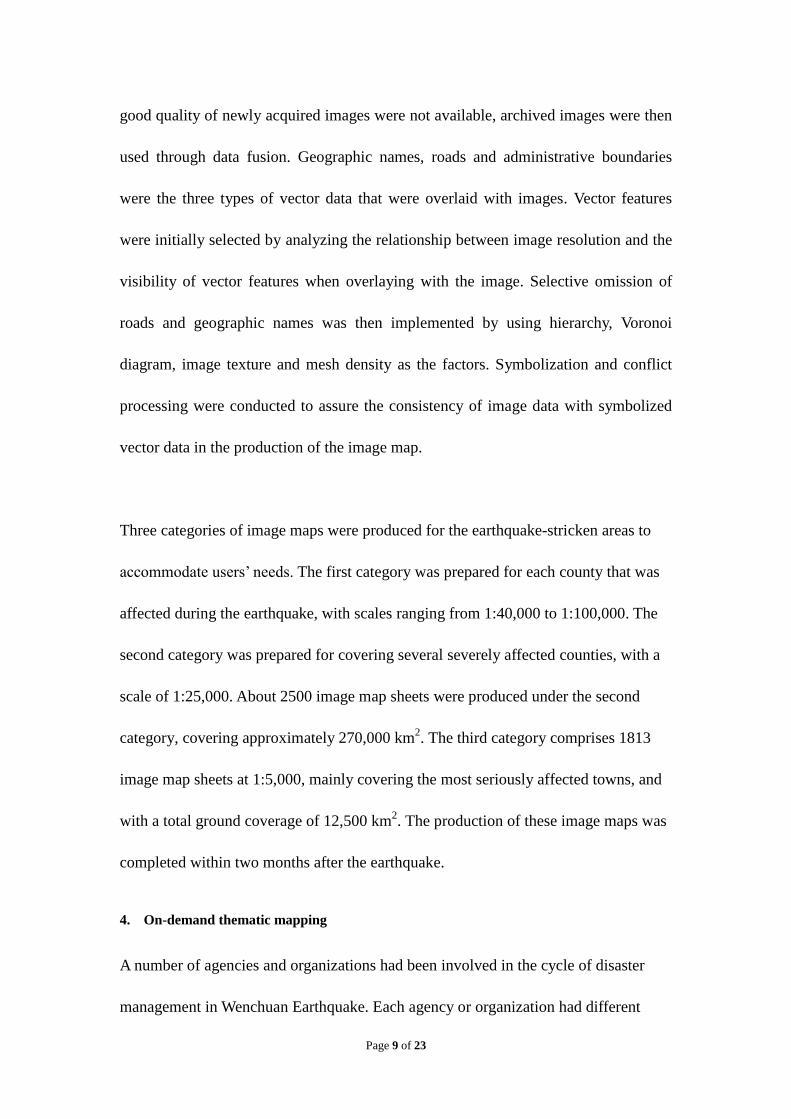
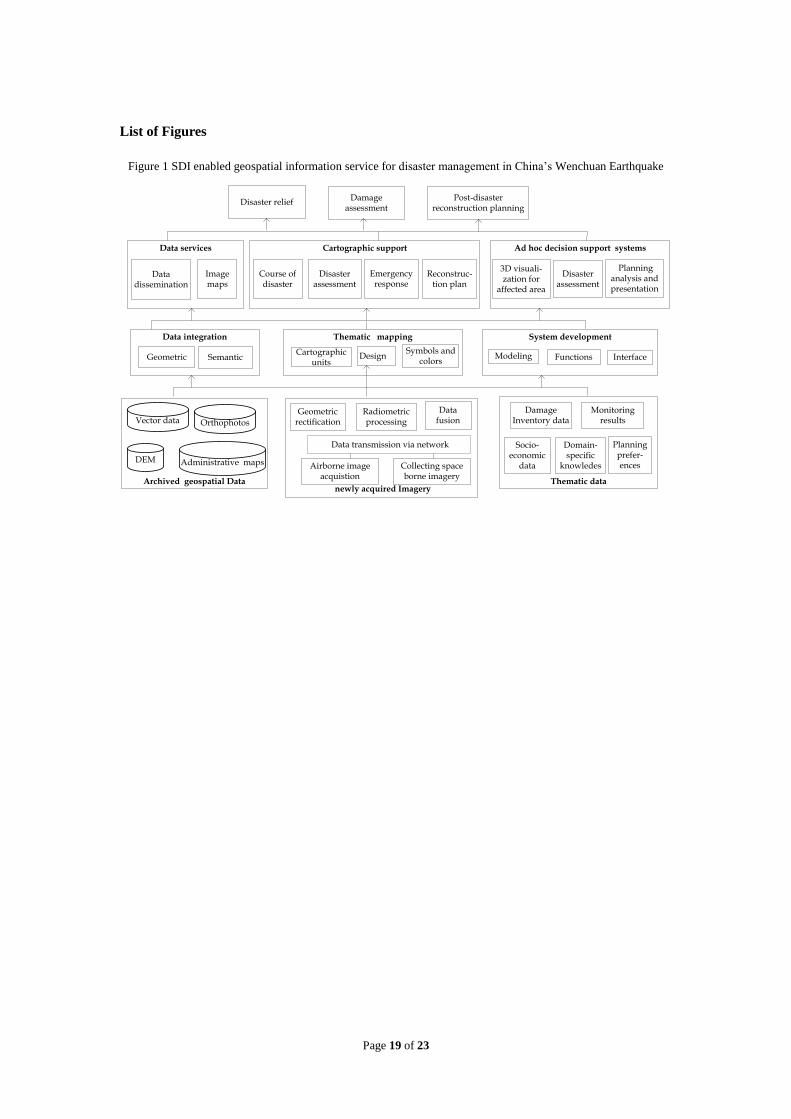
images with selected location information derived from topographic data. Figure 2
illustrates the methodology for image map production, which includes the processing
of multi-resolution images and the generalization of selected topographic information.
Insert Figure 2 about here
The resolutions of the images used in this project range from 0.1, 0.2, 0.5, 0.6, 2.5 and
10 m, and some data preprocessing procedures, such as geometric rectification, color
transformation, image mosaic and dodging were carried out. For some areas where
Page 9 of 23
good quality of newly acquired images were not available, archived images were then
used through data fusion. Geographic names, roads and administrative boundaries
were the three types of vector data that were overlaid with images. Vector features
were initially selected by analyzing the relationship between image resolution and the
visibility of vector features when overlaying with the image. Selective omission of
roads and geographic names was then implemented by using hierarchy, Voronoi
diagram, image texture and mesh density as the factors. Symbolization and conflict
processing were conducted to assure the consistency of image data with symbolized
vector data in the production of the image map.
Three categories of image maps were produced for the earthquake-stricken areas to
accommodate users‟ needs. The first category was prepared for each county that was
affected during the earthquake, with scales ranging from 1:40,000 to 1:100,000. The
second category was prepared for covering several severely affected counties, with a
scale of 1:25,000. About 2500 image map sheets were produced under the second
category, covering approximately 270,000 km2. The third category comprises 1813
image map sheets at 1:5,000, mainly covering the most seriously affected towns, and
with a total ground coverage of 12,500 km2. The production of these image maps was
completed within two months after the earthquake.
4. On-demand thematic mapping
A number of agencies and organizations had been involved in the cycle of disaster
management in Wenchuan Earthquake. Each agency or organization had different
Page 10 of 23
emphases according to their obligations , and produced their own outputs.
Cartographic mapping was used as a primary mechanism to visualize the outputs,
highlight the proposed solutions, and communicate with others (Armstrong et al.
2008). On-demand thematic mapping service was provided in collaboration with other
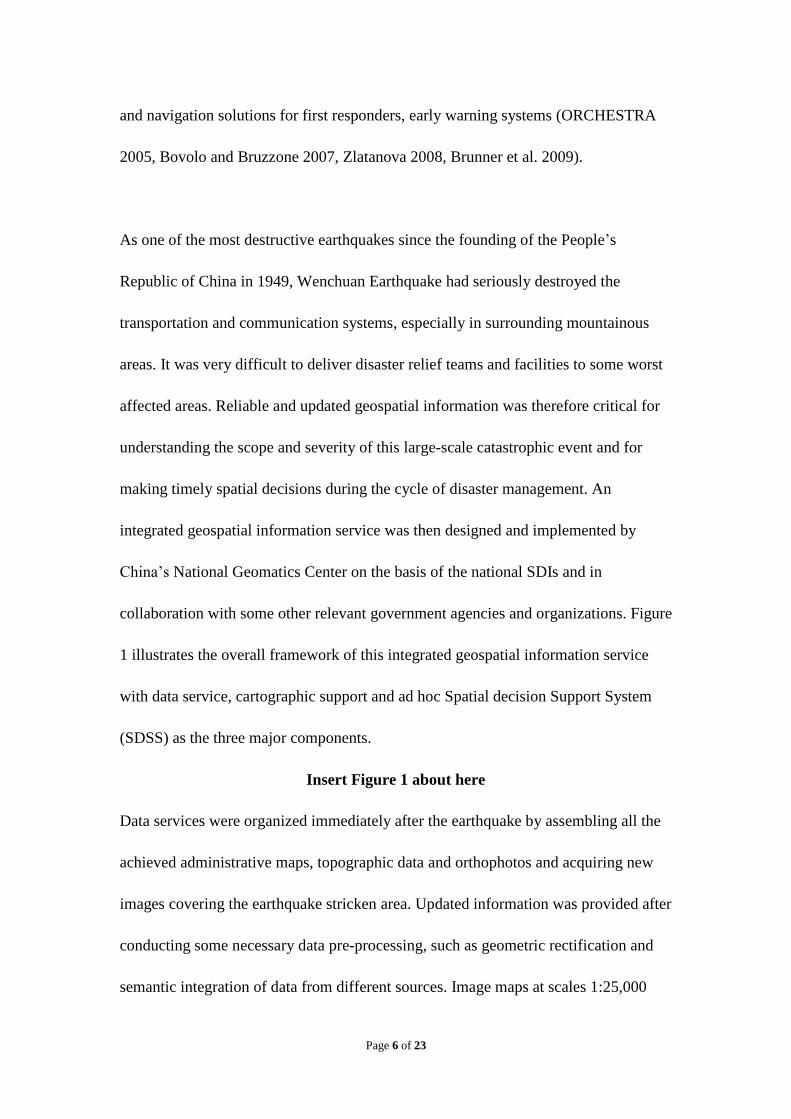
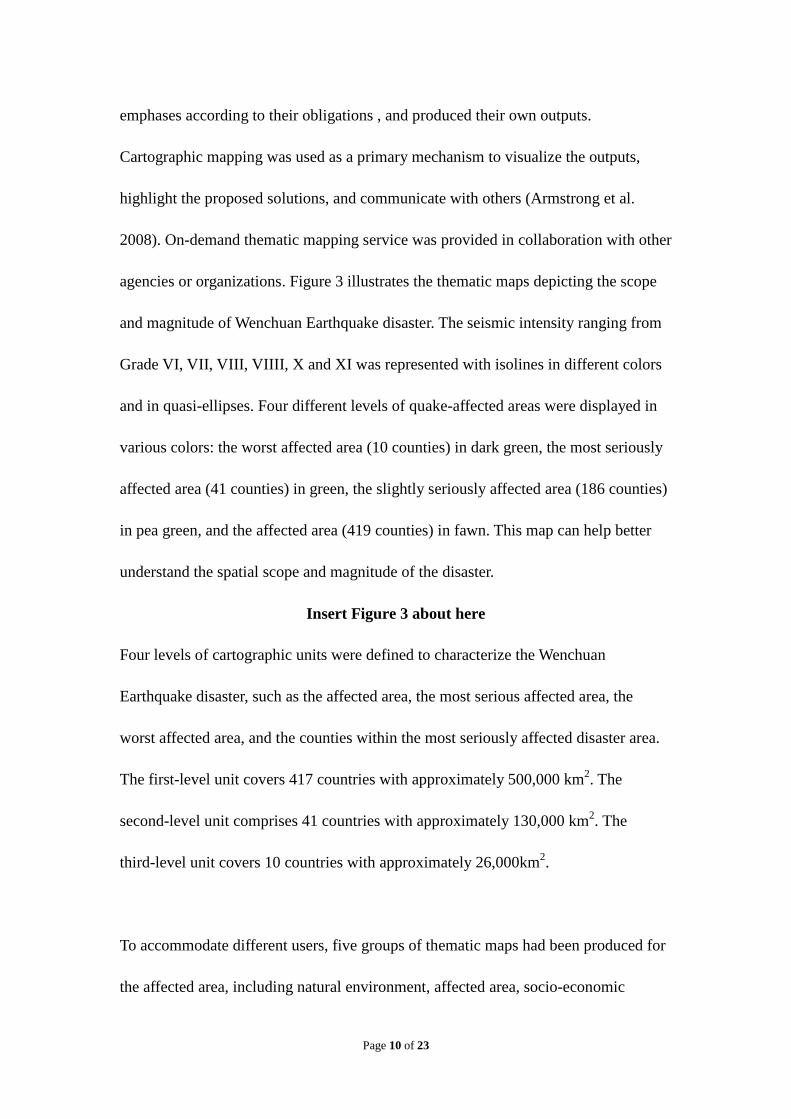
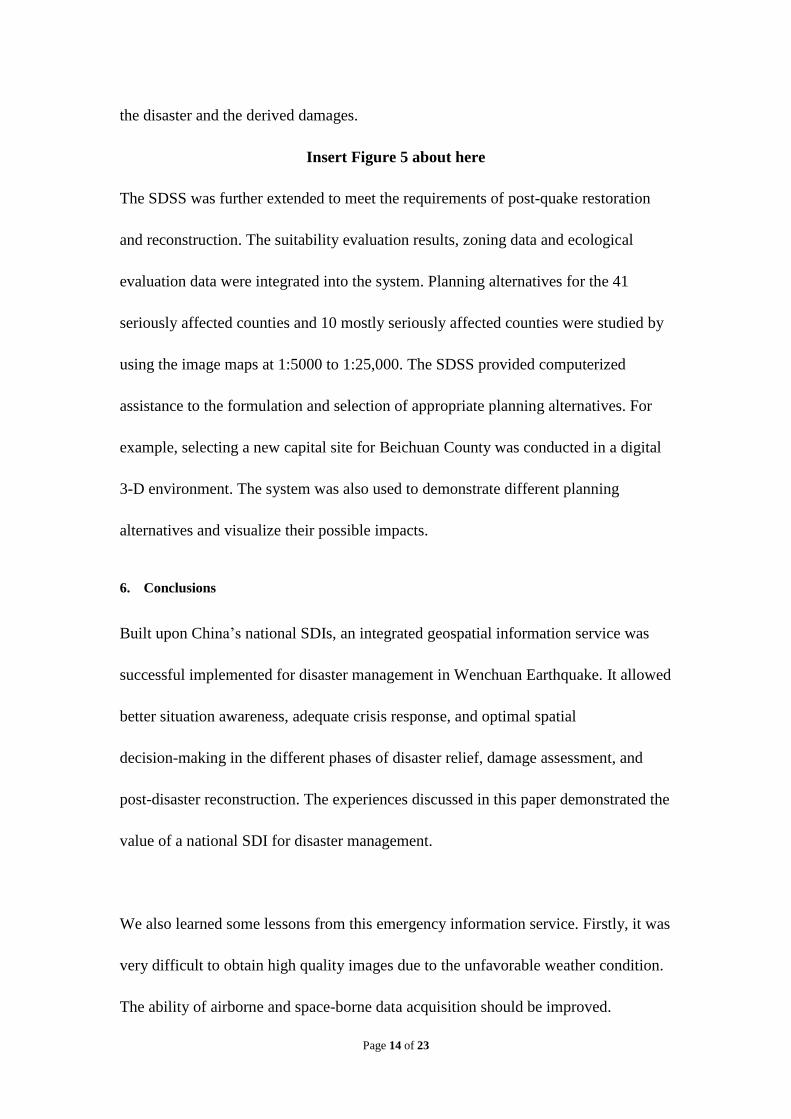
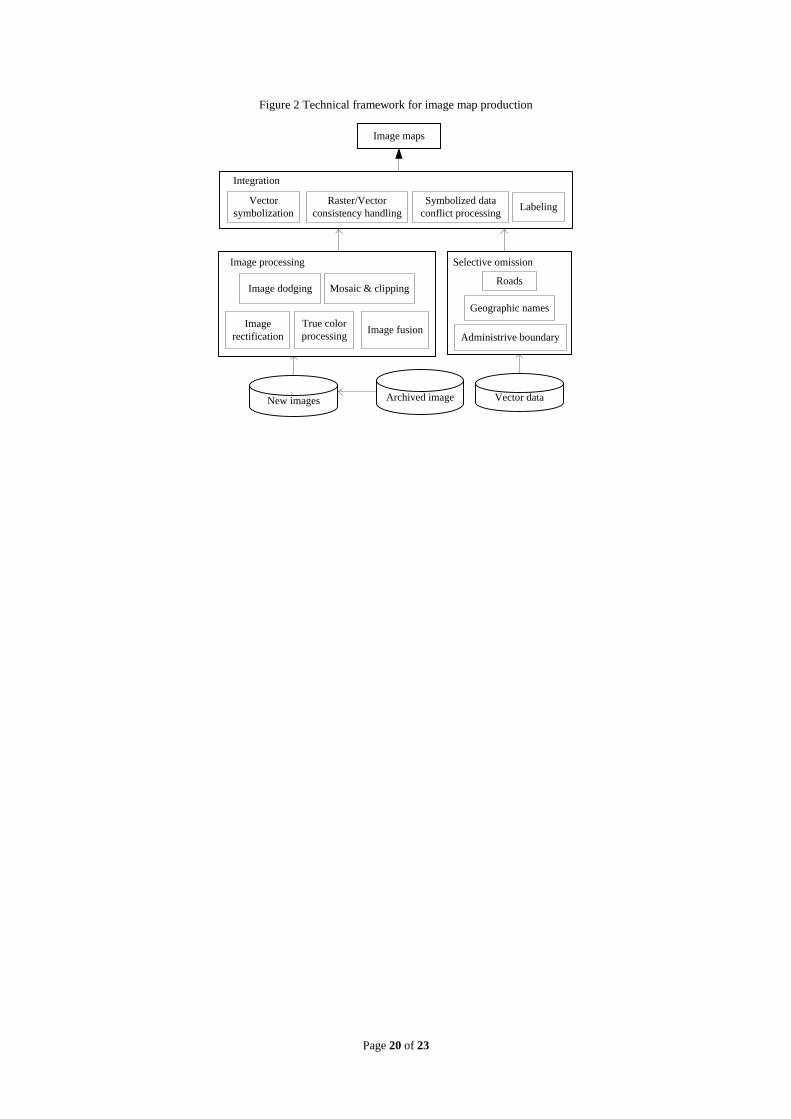
agencies or organizations. Figure 3 illustrates the thematic maps depicting the scope
and magnitude of Wenchuan Earthquake disaster. The seismic intensity ranging from
Grade VI, VII, VIII, VIIII, X and XI was represented with isolines in different colors
and in quasi-ellipses. Four different levels of quake-affected areas were displayed in
various colors: the worst affected area (10 counties) in dark green, the most seriously
affected area (41 counties) in green, the slightly seriously affected area (186 counties)
in pea green, and the affected area (419 counties) in fawn. This map can help better
understand the spatial scope and magnitude of the disaster.
Insert Figure 3 about here
Four levels of cartographic units were defined to characterize the Wenchuan
Earthquake disaster, such as the affected area, the most serious affected area, the
worst affected area, and the counties within the most seriously affected disaster area.
The first-level unit covers 417 countries with approximately 500,000 km2. The
second-level unit comprises 41 countries with approximately 130,000 km2. The
third-level unit covers 10 countries with approximately 26,000km2.
To accommodate different users, five groups of thematic maps had been produced for
the affected area, including natural environment, affected area, socio-economic
Page 11 of 23
system, natural hazards, disaster assessment, and restoration and reconstruction. Maps
about the natural environment mainly show the geographic boundary of the impacted
areas by Wenchuan Earthquake as well as the basic information about natural
environment, geological structure, and land cover, among others. The socio-economic
system was mapped as “hazard-affected bodies” showing the information concerning
population, administrative units, transportation, communication, irrigation, resource,
economy, etc. The natural hazards maps illustrate the earthquake disaster and the
related secondary disasters. The disaster assessment maps show the temporal and
spatial distribution of casualties, loss of properties, and damage to the resource and
environment for each county. The restoration and reconstruction maps provide the
information concerning the reconstruction plan and the designated supporting forces.
Advanced spatio-temporal representation techniques were used for the on-demand
thematic mapping, such as three dimensional landscape models, specific symbols for
the earthquake disaster.
It should be pointed out that effective information sharing among various agencies
involved in the disaster management was critical for us to access reliable data sources
for the on-demand thematic mapping. For example, large amounts of first-hand data
were collected by the earthquake relief expert group affiliated with China‟s National
Disaster Reduction Committee and Ministry of Science and Technology; disaster
assessment data were collected by Ministry of Civil Affairs; earthquake monitoring
results were acquired by National Earthquake Administration; and the recovery and
reconstruction plans were made by National Committees for Planning and
Page 12 of 23
Development. A disaster atlas for Wenchuan Earthquake was compiled and published
in early 2009, with the use of the on-demand thematic maps (Chen et al. 2009b). This
atlas illustrates the comprehensive mechanisms controlling the Wenchuan Earthquake,
the major derived disaster, the emergency response, and the reconstruction plan. It is
considered as an essential reference for the studies of natural disasters, disaster
recovery, and public awareness of natural disasters.
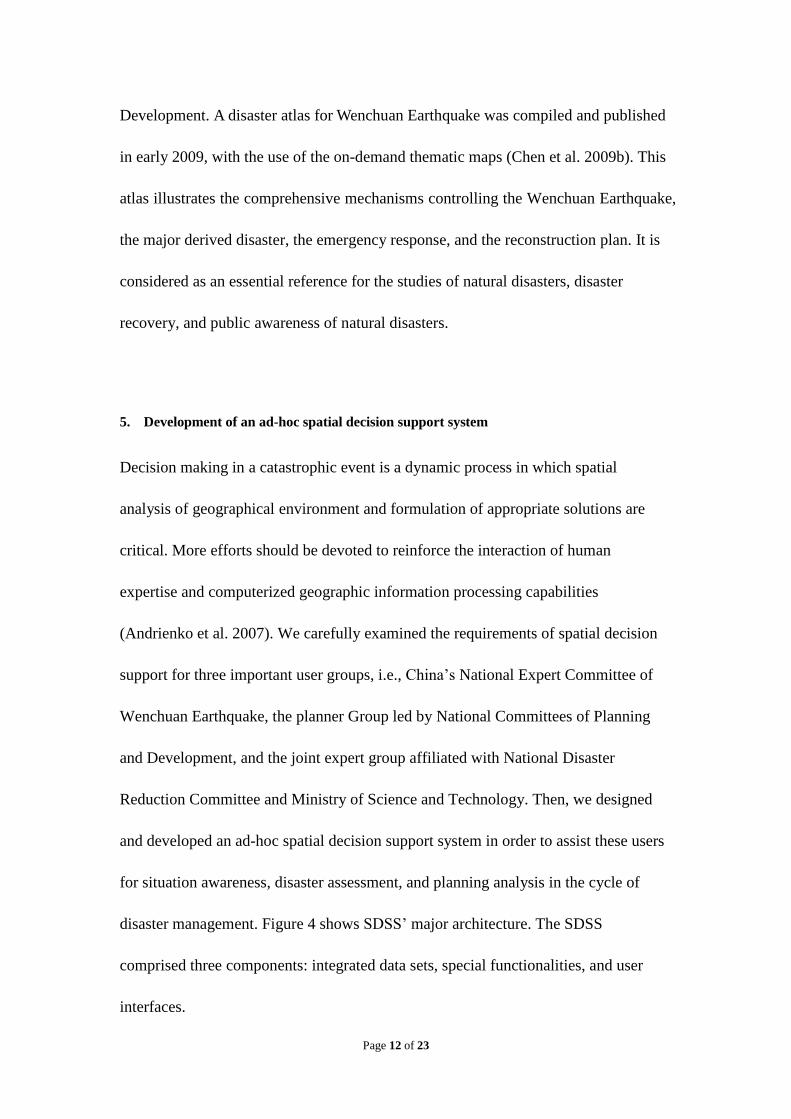
5. Development of an ad-hoc spatial decision support system
Decision making in a catastrophic event is a dynamic process in which spatial
analysis of geographical environment and formulation of appropriate solutions are
critical. More efforts should be devoted to reinforce the interaction of human
expertise and computerized geographic information processing capabilities
(Andrienko et al. 2007). We carefully examined the requirements of spatial decision
support for three important user groups, i.e., China‟s National Expert Committee of
Wenchuan Earthquake, the planner Group led by National Committees of Planning
and Development, and the joint expert group affiliated with National Disaster
Reduction Committee and Ministry of Science and Technology. Then, we designed
and developed an ad-hoc spatial decision support system in order to assist these users
for situation awareness, disaster assessment, and planning analysis in the cycle of
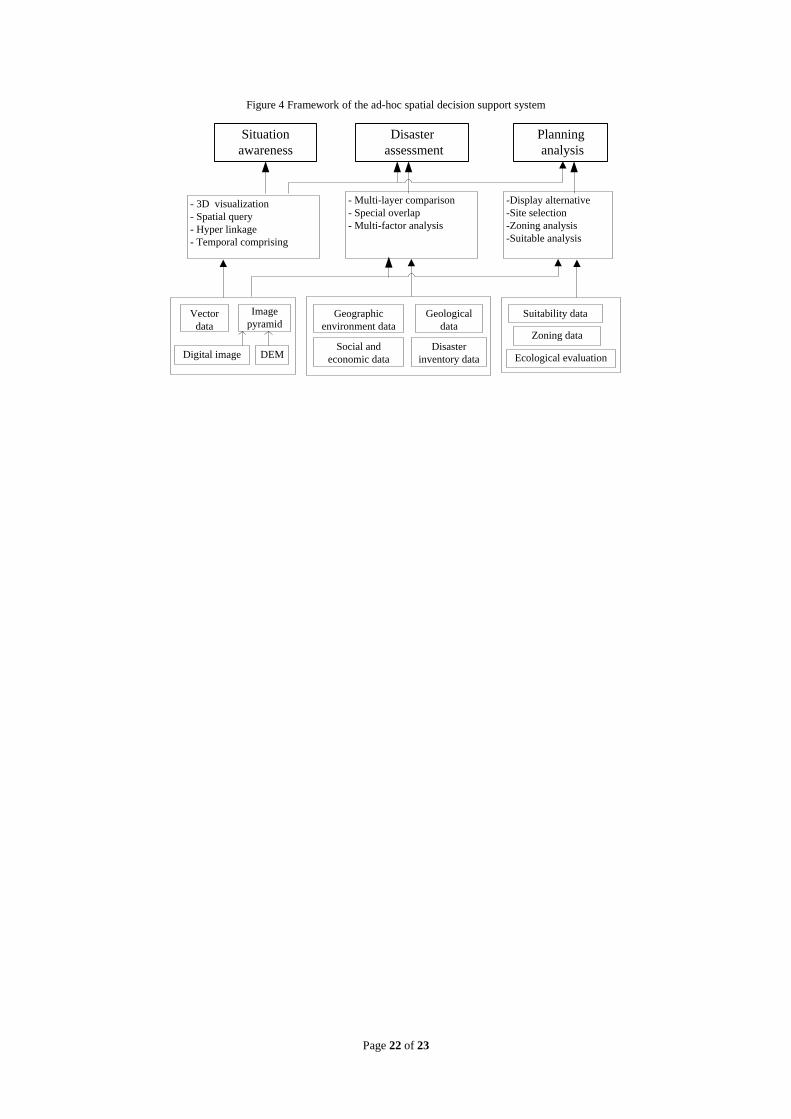
disaster management. Figure 4 shows SDSS‟ major architecture. The SDSS
comprised three components: integrated data sets, special functionalities, and user
interfaces.
Page 13 of 23
Insert Figure 4 about here
The ad- hoc SDSS was implemented in three stages. Firstly, the SDSS was developed
to support the disaster relief. As the live lines were destroyed or interrupted by
landslides or mudflows, it was very difficult for the disaster relief teams and facilities
to access the worst affected areas. A variety of geo-spatial data of the quake-affected
area were assembled into the system, and image pyramids were built and stored as
individual files for accelerating data access and assure high quality visualization. With
the functionalities of the system, users can easily examine in detail the real landscape
after the quake, fly over terrain, annotate points of interests, hyperlink to additional
geospatial data and compare sequential images. Such a system was installed on either
client/server or browser/server environments according to the user‟s requirement.
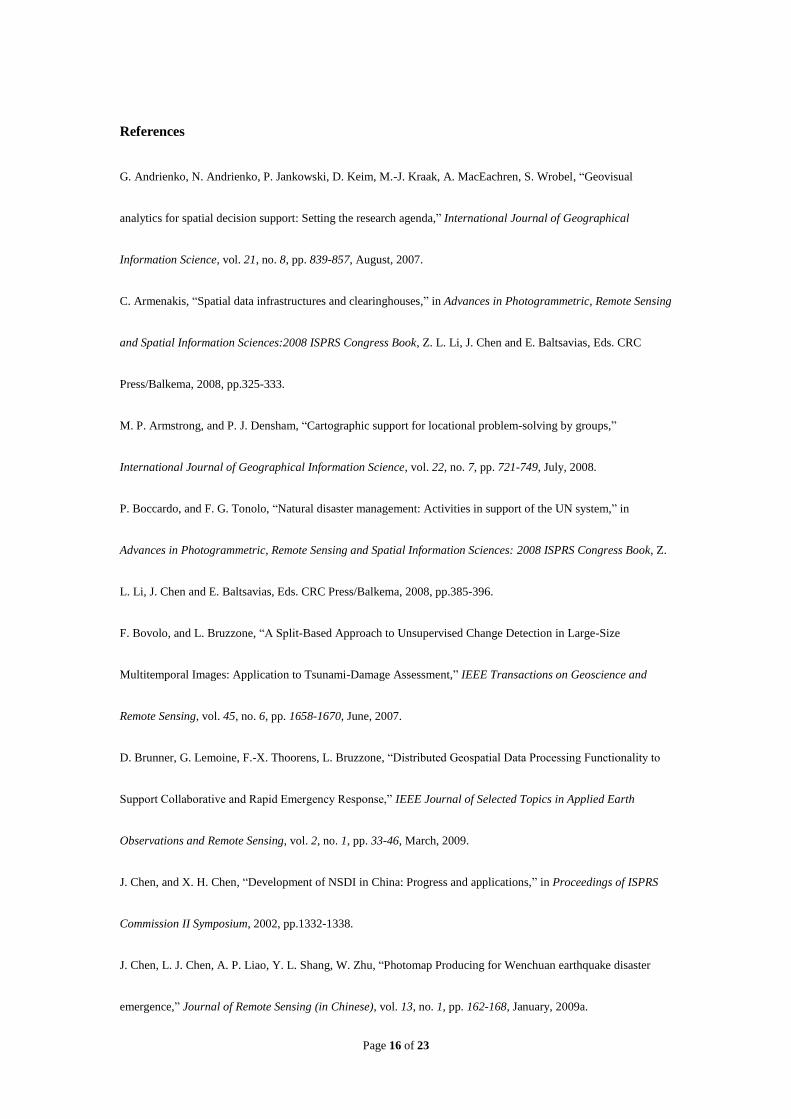
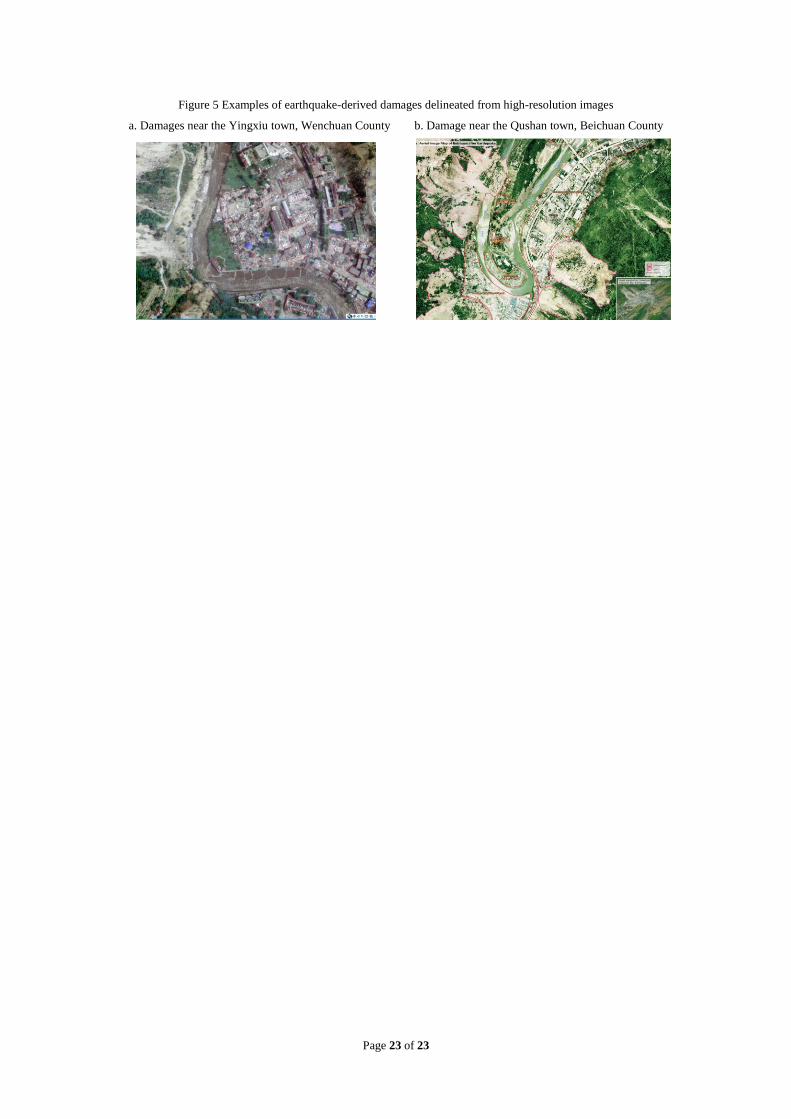
Wenchuan Earthquake caused tremendous losses of lives, properties and extensive
deconstruction in resources and the environment. Seriously damages found in
infrastructures, residential properties, agriculture, industries, service sectors,
government administrative facilities, social welfare and culture heritage. Figure 5
provides two examples of the damages identified from high-resolution images. The
SDSS was then extended to integrate and manage the entire damage inventory and
other related data, such as natural hazards (seismic data, landslides, debris flow, etc),
natural environment (geology, soil, etc), and social and economic data. Special
functionalities were developed to facilitate the multi-layer comparison and
multi-factor analysis. This allowed us to better understand the spatial distribution of
Page 14 of 23
the disaster and the derived damages.
Insert Figure 5 about here
The SDSS was further extended to meet the requirements of post-quake restoration
and reconstruction. The suitability evaluation results, zoning data and ecological
evaluation data were integrated into the system. Planning alternatives for the 41
seriously affected counties and 10 mostly seriously affected counties were studied by
using the image maps at 1:5000 to 1:25,000. The SDSS provided computerized
assistance to the formulation and selection of appropriate planning alternatives. For
example, selecting a new capital site for Beichuan County was conducted in a digital
3-D environment. The system was also used to demonstrate different planning
alternatives and visualize their possible impacts.
6. Conclusions
Built upon China‟s national SDIs, an integrated geospatial information service was
successful implemented for disaster management in Wenchuan Earthquake. It allowed
better situation awareness, adequate crisis response, and optimal spatial
decision-making in the different phases of disaster relief, damage assessment, and
post-disaster reconstruction. The experiences discussed in this paper demonstrated the
value of a national SDI for disaster management.
We also learned some lessons from this emergency information service. Firstly, it was
very difficult to obtain high quality images due to the unfavorable weather condition.
The ability of airborne and space-borne data acquisition should be improved.

Page 15 of 23
Secondly, information systems of some agencies and organizations were separated
and fast data sharing could not be guaranteed. An SOA (service-oriented architecture)
and web-based information sharing platform needs to be extended to connect all
related agencies and organizations for facilitating spatial data sharing and utilization
during the cycle of disaster management.
Page 16 of 23
References
G. Andrienko, N. Andrienko, P. Jankowski, D. Keim, M.-J. Kraak, A. MacEachren, S. Wrobel, “Geovisual
analytics for spatial decision support: Setting the research agenda,” International Journal of Geographical
Information Science, vol. 21, no. 8, pp. 839-857, August, 2007.
C. Armenakis, “Spatial data infrastructures and clearinghouses,” in Advances in Photogrammetric, Remote Sensing
and Spatial Information Sciences:2008 ISPRS Congress Book, Z. L. Li, J. Chen and E. Baltsavias, Eds. CRC
Press/Balkema, 2008, pp.325-333.
M. P. Armstrong, and P. J. Densham, “Cartographic support for locational problem-solving by groups,”
International Journal of Geographical Information Science, vol. 22, no. 7, pp. 721-749, July, 2008.
P. Boccardo, and F. G. Tonolo, “Natural disaster management: Activities in support of the UN system,” in
Advances in Photogrammetric, Remote Sensing and Spatial Information Sciences: 2008 ISPRS Congress Book, Z.
L. Li, J. Chen and E. Baltsavias, Eds. CRC Press/Balkema, 2008, pp.385-396.
F. Bovolo, and L. Bruzzone, “A Split-Based Approach to Unsupervised Change Detection in Large-Size
Multitemporal Images: Application to Tsunami-Damage Assessment,” IEEE Transactions on Geoscience and
Remote Sensing, vol. 45, no. 6, pp. 1658-1670, June, 2007.
D. Brunner, G. Lemoine, F.-X. Thoorens, L. Bruzzone, “Distributed Geospatial Data Processing Functionality to
Support Collaborative and Rapid Emergency Response,” IEEE Journal of Selected Topics in Applied Earth
Observations and Remote Sensing, vol. 2, no. 1, pp. 33-46, March, 2009.
J. Chen, and X. H. Chen, “Development of NSDI in China: Progress and applications,” in Proceedings of ISPRS
Commission II Symposium, 2002, pp.1332-1338.
J. Chen, L. J. Chen, A. P. Liao, Y. L. Shang, W. Zhu, “Photomap Producing for Wenchuan earthquake disaster
emergence,” Journal of Remote Sensing (in Chinese), vol. 13, no. 1, pp. 162-168, January, 2009a.
Page 17 of 23
J. Chen, P. J. Shi, D. H. Wang, Y. Zhao, J. A. Wang, L. Y. Liu, “Disaster Atlas of Wenchuan Earthquake: design
and production (in Chinese),” Engineering Sciences, vol. 11, no. 8, pp.24-28, August, 2009b.
P. Gamba, F. Dell‟Acqua, and G. Trianni, “Rapid Damage Detection in the Bam Area Using Multitemporal SAR
and Exploiting Ancillary Data,” IEEE Transactions on Geoscience and Remote Sensing, vol. 45, no. 6, pp.
1582-1589, May, 2007.
J. Hjelmager, H. Moellering, A. Cooper, T. Delgado, A. Rajabifard, P. Rapant, D. Danko, M. Huet, D. Laurent, H.
Aalders, A. Iwaniakq, P. Abad, U. Duren, and A. Martynenko, “An initial formal model for spatial data
infrastructures,” International Journal of Geographical Information Science, vol. 22, no. 11&12, pp. 1295-1309,
November/December, 2008.
D. R. Li, K. Yang, J. Chen, Y. M. Jin, Photogrammetry and remote sensing in China (in Chinese), Beijing:
Surveying and Mapping Publishing House, ch. 2, pp.5-22
D. R. Li, “Remote sensing in the Wenchuan Earthquake”, Photogrammetric Engineering and Remote Sensing, vol.
75, no. 5, pp. 505-509, May, 2009.
I. Masser, GIS Worlds: Creating Spatial Data Infrastructures. Redlands, CA: ESRI Press, ch. 1, pp. 6-11
I. Masser, A. Rajabifard and I. Williamson, “Spatially enabling governments through SDI implementation,”
International Journal of Geographical Information Science, vol. 22, no. 1, pp. 5-20, January, 2008.
ORCHESTRA, (2005), Towards an open disaster risk management service architecture for INSPIRE and GMES
[Online]. Available HTTP: www.eu-orchestra.org Directory: docs File:20050223_White Paper_v9.pdf
Q. C. Wang, Z. L. Chen, and S. H. Zheng, “Spatial segmentation characteristic of focal mechanism of aftershock
sequence of Wenchuan Earthquake,” Chinese Science Bulletin, vol. 54, no. 13, pp. 2263-2270, June, 2009.
Z. X. Zhang, Y. J. Zhang, T. Ke, D. H. Guo, “Photogrammetry for First Response in Wenchuan Earthquake,”
Photogrammetric Engineering and Remote Sensing, vol. 75, no. 5, pp. 510-513, May, 2009.

Page 18 of 23
S. Zlatanova, D. Holweg, and M. Stratakis, “Framework for multi-risk emergency response,” in Advances in
MobileMapping Technology, C. V. Tao and J. Li, Eds. London: Taylor & Francis, 2007, pp. 159-171.
S. Zlatanova, “SII for Emergency Response: the 3D Challenges,” in XXI ISPRS Congress, 2008, pp. 1631-1637.
Page 19 of 23
List of Figures
Figure 1 SDI enabled geospatial information service for disaster management in China‟s Wenchuan Earthquake
Archived geospatial Data
Vector data Orthophotos
DEM Administrative maps
Data transmission via network
Airborne image acquistion
newly acquired Imagery
Image maps
Course of disaster
Disaster assessment
3D visuali-zation for
affected area
Disaster assessment
Planning analysis and presentation
Disaster reliefDamage
assessmentPost-disaster
reconstruction planning
Collecting space borne imagery
Data fusion
Data integration System development
Cartographic supportData services Ad hoc decision support systems
Geometric Semantic Functions
Data dissemination
Emergency response
Reconstruc-tion plan
Radiometric processing
Geometric rectification
Interface
DamageInventory data
Socio-economic
data
Monitoring results
Thematic mapping
Cartographic units
Symbols and colors
Design
Planning prefer-ences
Domain- specific
knowledes
Thematic data
Modeling
Page 20 of 23
Figure 2 Technical framework for image map production
Archived image
Image processing
Image
rectification
True color
processingImage fusion
Image dodging Mosaic & clipping
Integration
Raster/Vector
consistency handling
Vector
symbolization
Symbolized data
conflict processing Labeling
Vector data
Selective omission
Geographic names
Roads
Administrive boundary
New images
Image maps
Page 21 of 23
Figure 3 The scope and magnitude of the Wenchuan Earthquake disaster
Page 22 of 23
Figure 4 Framework of the ad-hoc spatial decision support system
Situation
awareness
Disaster
assessment
Planning
analysis
- 3D visualization
- Spatial query
- Hyper linkage
- Temporal comprising
-Display alternative
-Site selection
-Zoning analysis
-Suitable analysis
Geographic
environment data
- Multi-layer comparison
- Special overlap
- Multi-factor analysis
Image
pyramid
Digital image DEM
Vector
data
Geological
data
Social and
economic data
Disaster
inventory data
Suitability data
Zoning data
Ecological evaluation
Page 23 of 23
Figure 5 Examples of earthquake-derived damages delineated from high-resolution images
a. Damages near the Yingxiu town, Wenchuan County b. Damage near the Qushan town, Beichuan County