Embed Size (px)
Citation preview
1
The annotated briefing titled Integrated HSI-System Model Demonstration* demonstrated that different mission performance estimates can be obtained from a traditional constructive simulation used to support acquisition trade-studies versus an integrated simulation environment in which a detailed model of a human operator** is combined with the traditional constructive simulation. In response to those findings, the U. S. Coast Guard (USCG) Research & Development Center (RDC) developed this briefing to share this information with the Coast Guard acquisition community to underscore the importance of using human performance modeling in the acquisition process to provide a better representation of the total system under consideration. This briefing presents the information in the context of a notional acquisition situation and illustrates how human performance modeling can enhance acquisition decision-making. *Available from the USCG RDC (RDC UDI 1033, Dec. 2010) **This type of model is referred to as a human systems integration (HSI) model or, alternatively, as a human performance model (HPM).
UNCLAS | IMPRINT-CGTME Model: Notional Acquisition Problem | RDC | Brett et al. | Public | September 2011
Report Documentation Page Form ApprovedOMB No. 0704-0188
Public reporting burden for the collection of information is estimated to average 1 hour per response, including the time for reviewing instructions, searching existing data sources, gathering andmaintaining the data needed, and completing and reviewing the collection of information. Send comments regarding this burden estimate or any other aspect of this collection of information,including suggestions for reducing this burden, to Washington Headquarters Services, Directorate for Information Operations and Reports, 1215 Jefferson Davis Highway, Suite 1204, ArlingtonVA 22202-4302. Respondents should be aware that notwithstanding any other provision of law, no person shall be subject to a penalty for failing to comply with a collection of information if itdoes not display a currently valid OMB control number.
1. REPORT DATE SEP 2011 2. REPORT TYPE
3. DATES COVERED 00-00-2011 to 00-00-2011
4. TITLE AND SUBTITLE Use Of The IMPRINT-CGTME Model: Notional Acquisition Problem
5a. CONTRACT NUMBER
5b. GRANT NUMBER
5c. PROGRAM ELEMENT NUMBER
6. AUTHOR(S) 5d. PROJECT NUMBER
5e. TASK NUMBER
5f. WORK UNIT NUMBER
7. PERFORMING ORGANIZATION NAME(S) AND ADDRESS(ES) Acquisition Directorate,Research & Development Center,New London,CT,06320
8. PERFORMING ORGANIZATIONREPORT NUMBER
9. SPONSORING/MONITORING AGENCY NAME(S) AND ADDRESS(ES) 10. SPONSOR/MONITOR’S ACRONYM(S)
11. SPONSOR/MONITOR’S REPORT NUMBER(S)
12. DISTRIBUTION/AVAILABILITY STATEMENT Approved for public release; distribution unlimited
13. SUPPLEMENTARY NOTES
14. ABSTRACT The annotated briefing titled Integrated HSI-System Model Demonstration* demonstrated that differentmission performance estimates can be obtained from a traditional constructive simulation used to supportacquisition trade-studies versus an integrated simulation environment in which a detailed model of ahuman operator** is combined with the traditional constructive simulation. In response to those findings,the U. S. Coast Guard (USCG) Research & Development Center (RDC) developed this briefing to sharethis information with the Coast Guard acquisition community to underscore the importance of usinghuman performance modeling in the acquisition process to provide a better representation of the totalsystem under consideration. This briefing presents the information in the context of a notional acquisitionsituation and illustrates how human performance modeling can enhance acquisition decision-making.
15. SUBJECT TERMS
16. SECURITY CLASSIFICATION OF: 17. LIMITATION OF ABSTRACT Same as
Report (SAR)
18. NUMBEROF PAGES
44
19a. NAME OFRESPONSIBLE PERSON
a. REPORT unclassified
b. ABSTRACT unclassified
c. THIS PAGE unclassified
Standard Form 298 (Rev. 8-98) Prescribed by ANSI Std Z39-18
The work reported in this briefing is a follow-on to the Integrated HSI-System Model Demonstration referenced above. As part of that prior work, a simulation environment was created that represented an unmanned aerial system (UAS) conducting a smuggling surveillance mission in the Florida Straits. One component of the simulation was the Coast Guard Tactical Modeling Environment (CGTME), which modeled the UAS platform and the surface traffic. Another component was an IMproved Performance Research INtegration Tool (IMPRINT) human performance model (HPM) that embodied a Sensor System Operator (SSO) employing and managing the sensors on the UAS. The IMPRINT SSO model was developed with reference to current-generation sensor suites and their associated perceptual, cognitive, and psychomotor performance requirements. As a complete UAS representation in a complex, realistic mission environment, the Integrated HSI-System Model Demonstration simulation environment provided a low-cost, low-risk setting for expanding the demonstration of human performance modeling in the acquisition process.
In the new work reported here, the original IMPRINT SSO model was modified to reflect an advanced sensor system interface concept. Mission performance obtained in the integrated IMPRINT-CGTME simulation using the new sensor system interface was compared with mission performance predicted by the original model. The objective was to demonstrate that by representing the performance requirements associated with specific user interface (UI) concepts, HPMs can provide acquisition teams with insight into the mission performance potential of the alternative UI. Equally important, they also can provide insight into why differences are obtained.
In addition to comparing SSO UI alternatives, a demonstration and assessment of two alternative schemes for prioritizing vessels to be classified and identified are provided. The purpose of this demonstration is two-fold. First, it shows how human performance modeling can be used to implement the human side of tactics and concepts of operations (CONOPs). Generally, the information-gathering, processing, and decision-making required to execute tactics and elements of CONOPs are performed by people. Human performance modeling can represent these processes in the context of other human performance requirements associated with system operation and provide insight into the impacts on overall operator performance. Also, to the extent that tactics and CONOPs represent elemental components of the overall system, the assessment of prioritization schemes illustrates how human performance modeling can be used to isolate individual elements of the UI or other performance demands and adjust them to generate maximum mission performance.
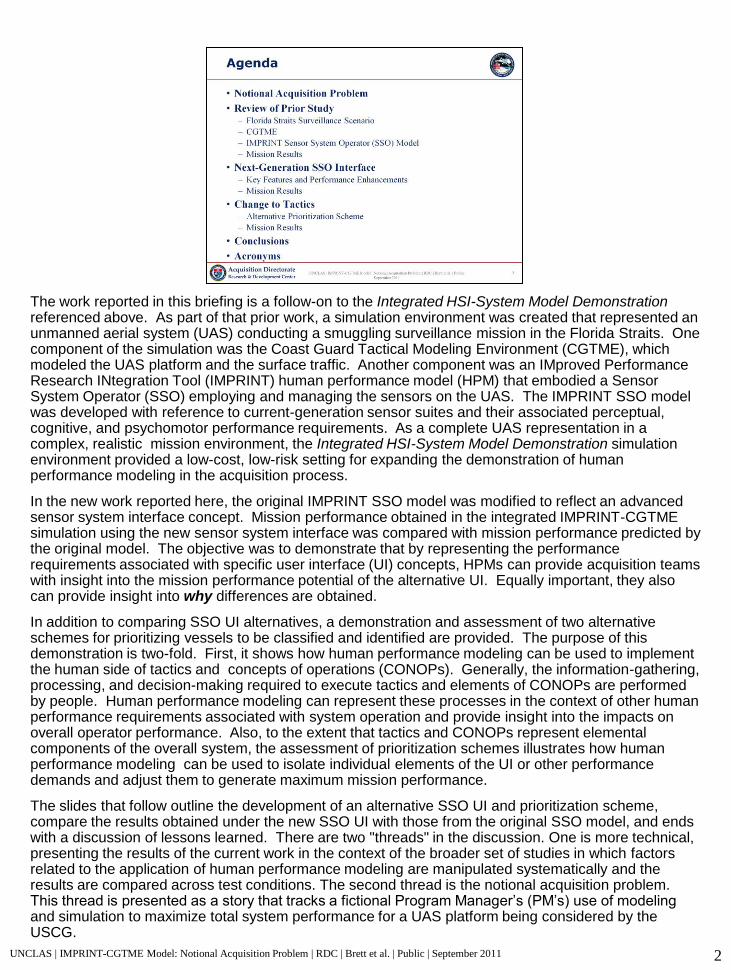
The slides that follow outline the development of an alternative SSO UI and prioritization scheme, compare the results obtained under the new SSO UI with those from the original SSO model, and ends with a discussion of lessons learned. There are two "threads" in the discussion. One is more technical, presenting the results of the current work in the context of the broader set of studies in which factors related to the application of human performance modeling are manipulated systematically and the results are compared across test conditions. The second thread is the notional acquisition problem. This thread is presented as a story that tracks a fictional Program Manager’s (PM’s) use of modeling and simulation to maximize total system performance for a UAS platform being considered by the USCG. UNCLAS | IMPRINT-CGTME Model: Notional Acquisition Problem | RDC | Brett et al. | Public | September 2011 2
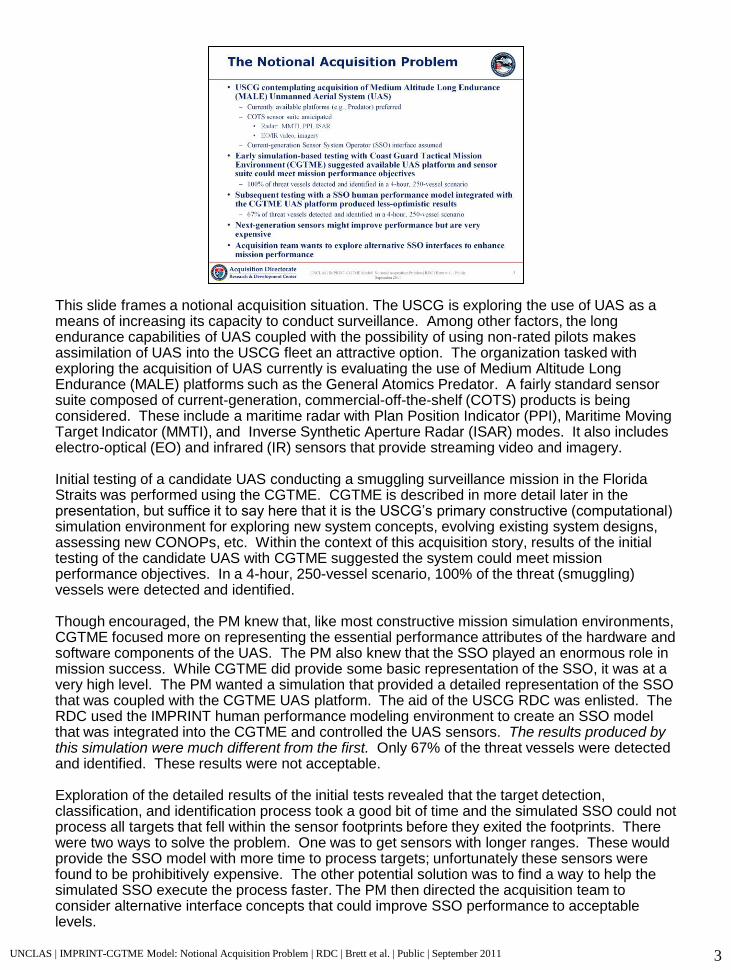
This slide frames a notional acquisition situation. The USCG is exploring the use of UAS as a means of increasing its capacity to conduct surveillance. Among other factors, the long endurance capabilities of UAS coupled with the possibility of using non-rated pilots makes assimilation of UAS into the USCG fleet an attractive option. The organization tasked with exploring the acquisition of UAS currently is evaluating the use of Medium Altitude Long Endurance (MALE) platforms such as the General Atomics Predator. A fairly standard sensor suite composed of current-generation, commercial-off-the-shelf (COTS) products is being considered. These include a maritime radar with Plan Position Indicator (PPI), Maritime Moving Target Indicator (MMTI), and Inverse Synthetic Aperture Radar (ISAR) modes. It also includes electro-optical (EO) and infrared (IR) sensors that provide streaming video and imagery. Initial testing of a candidate UAS conducting a smuggling surveillance mission in the Florida Straits was performed using the CGTME. CGTME is described in more detail later in the presentation, but suffice it to say here that it is the USCG’s primary constructive (computational) simulation environment for exploring new system concepts, evolving existing system designs, assessing new CONOPs, etc. Within the context of this acquisition story, results of the initial testing of the candidate UAS with CGTME suggested the system could meet mission performance objectives. In a 4-hour, 250-vessel scenario, 100% of the threat (smuggling) vessels were detected and identified. Though encouraged, the PM knew that, like most constructive mission simulation environments, CGTME focused more on representing the essential performance attributes of the hardware and software components of the UAS. The PM also knew that the SSO played an enormous role in mission success. While CGTME did provide some basic representation of the SSO, it was at a very high level. The PM wanted a simulation that provided a detailed representation of the SSO that was coupled with the CGTME UAS platform. The aid of the USCG RDC was enlisted. The RDC used the IMPRINT human performance modeling environment to create an SSO model that was integrated into the CGTME and controlled the UAS sensors. The results produced by this simulation were much different from the first. Only 67% of the threat vessels were detected and identified. These results were not acceptable. Exploration of the detailed results of the initial tests revealed that the target detection, classification, and identification process took a good bit of time and the simulated SSO could not process all targets that fell within the sensor footprints before they exited the footprints. There were two ways to solve the problem. One was to get sensors with longer ranges. These would provide the SSO model with more time to process targets; unfortunately these sensors were found to be prohibitively expensive. The other potential solution was to find a way to help the simulated SSO execute the process faster. The PM then directed the acquisition team to consider alternative interface concepts that could improve SSO performance to acceptable levels.
UNCLAS | IMPRINT-CGTME Model: Notional Acquisition Problem | RDC | Brett et al. | Public | September 2011 3
The purpose of the prior Integrated HSI-System Model Demonstration was to model a USCG operation using a stand-alone constructive simulation (CGTME) and then to compare its results with those generated by a simulation that integrated a human performance model (IMPRINT) with the constructive model. This section first briefly reviews the simulation developed under that task and the Florida Straits scenario that drove testing of both the CGTME in a stand-alone mode and the integrated IMPRINT-CGTME simulation. It then discusses the results of that testing. In the notional acquisition problem description, the work described in this section pertains to the two test events already conducted. For complete details on the prior study, the reader is referred to the annotated briefing titled Integrated HSI-System Model Demonstration (RDC UDI 1033, Dec. 2010).
UNCLAS | IMPRINT-CGTME Model: Notional Acquisition Problem | RDC | Brett et al. | Public | September 2011 4
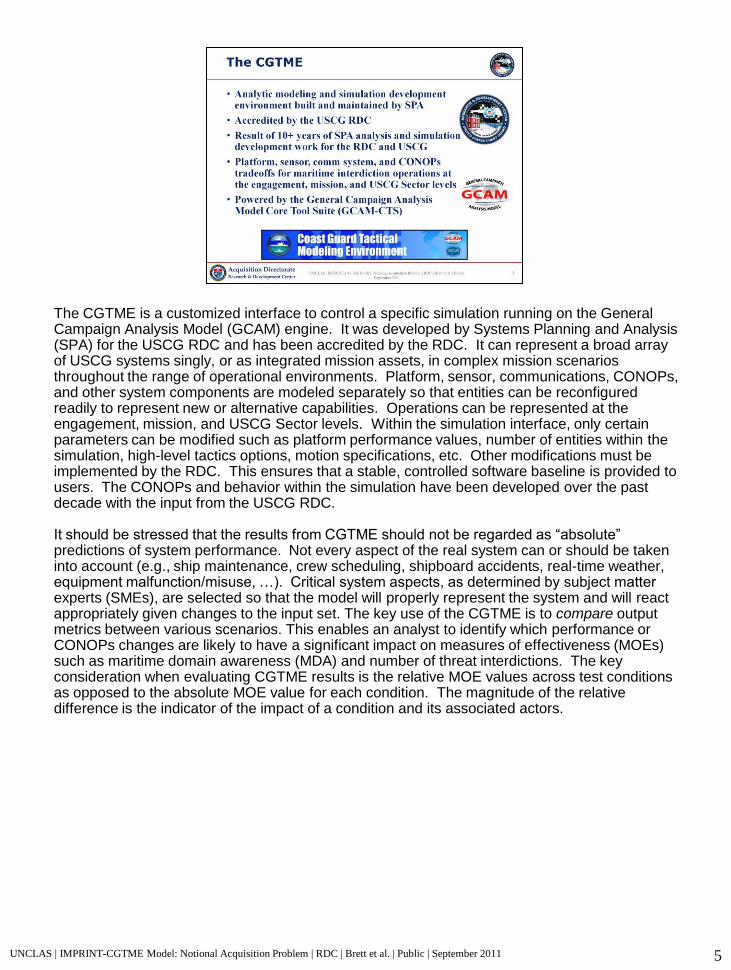
The CGTME is a customized interface to control a specific simulation running on the General Campaign Analysis Model (GCAM) engine. It was developed by Systems Planning and Analysis (SPA) for the USCG RDC and has been accredited by the RDC. It can represent a broad array of USCG systems singly, or as integrated mission assets, in complex mission scenarios throughout the range of operational environments. Platform, sensor, communications, CONOPs, and other system components are modeled separately so that entities can be reconfigured readily to represent new or alternative capabilities. Operations can be represented at the engagement, mission, and USCG Sector levels. Within the simulation interface, only certain parameters can be modified such as platform performance values, number of entities within the simulation, high-level tactics options, motion specifications, etc. Other modifications must be implemented by the RDC. This ensures that a stable, controlled software baseline is provided to users. The CONOPs and behavior within the simulation have been developed over the past decade with the input from the USCG RDC. It should be stressed that the results from CGTME should not be regarded as “absolute” predictions of system performance. Not every aspect of the real system can or should be taken into account (e.g., ship maintenance, crew scheduling, shipboard accidents, real-time weather, equipment malfunction/misuse, …). Critical system aspects, as determined by subject matter experts (SMEs), are selected so that the model will properly represent the system and will react appropriately given changes to the input set. The key use of the CGTME is to compare output metrics between various scenarios. This enables an analyst to identify which performance or CONOPs changes are likely to have a significant impact on measures of effectiveness (MOEs) such as maritime domain awareness (MDA) and number of threat interdictions. The key consideration when evaluating CGTME results is the relative MOE values across test conditions as opposed to the absolute MOE value for each condition. The magnitude of the relative difference is the indicator of the impact of a condition and its associated actors.
5 UNCLAS | IMPRINT-CGTME Model: Notional Acquisition Problem | RDC | Brett et al. | Public | September 2011
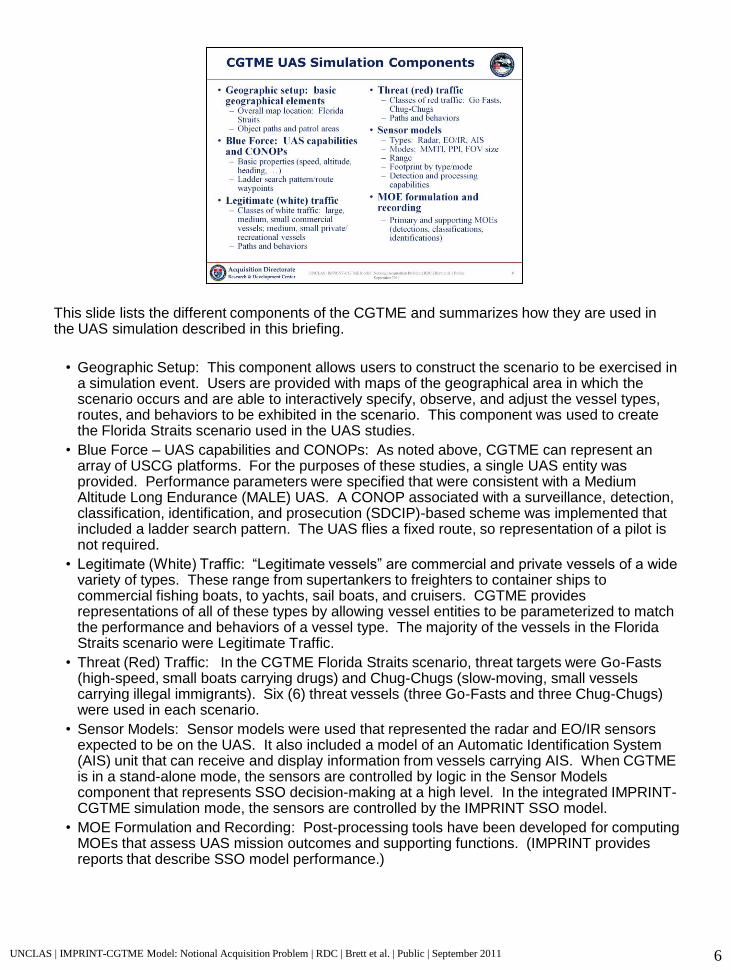
This slide lists the different components of the CGTME and summarizes how they are used in the UAS simulation described in this briefing.
• Geographic Setup: This component allows users to construct the scenario to be exercised in a simulation event. Users are provided with maps of the geographical area in which the scenario occurs and are able to interactively specify, observe, and adjust the vessel types, routes, and behaviors to be exhibited in the scenario. This component was used to create the Florida Straits scenario used in the UAS studies.
• Blue Force – UAS capabilities and CONOPs: As noted above, CGTME can represent an array of USCG platforms. For the purposes of these studies, a single UAS entity was provided. Performance parameters were specified that were consistent with a Medium Altitude Long Endurance (MALE) UAS. A CONOP associated with a surveillance, detection, classification, identification, and prosecution (SDCIP)-based scheme was implemented that included a ladder search pattern. The UAS flies a fixed route, so representation of a pilot is not required.
• Legitimate (White) Traffic: “Legitimate vessels” are commercial and private vessels of a wide variety of types. These range from supertankers to freighters to container ships to commercial fishing boats, to yachts, sail boats, and cruisers. CGTME provides representations of all of these types by allowing vessel entities to be parameterized to match the performance and behaviors of a vessel type. The majority of the vessels in the Florida Straits scenario were Legitimate Traffic.
• Threat (Red) Traffic: In the CGTME Florida Straits scenario, threat targets were Go-Fasts (high-speed, small boats carrying drugs) and Chug-Chugs (slow-moving, small vessels carrying illegal immigrants). Six (6) threat vessels (three Go-Fasts and three Chug-Chugs) were used in each scenario.
• Sensor Models: Sensor models were used that represented the radar and EO/IR sensors expected to be on the UAS. It also included a model of an Automatic Identification System (AIS) unit that can receive and display information from vessels carrying AIS. When CGTME is in a stand-alone mode, the sensors are controlled by logic in the Sensor Models component that represents SSO decision-making at a high level. In the integrated IMPRINT-CGTME simulation mode, the sensors are controlled by the IMPRINT SSO model.
• MOE Formulation and Recording: Post-processing tools have been developed for computing MOEs that assess UAS mission outcomes and supporting functions. (IMPRINT provides reports that describe SSO model performance.)
6 UNCLAS | IMPRINT-CGTME Model: Notional Acquisition Problem | RDC | Brett et al. | Public | September 2011
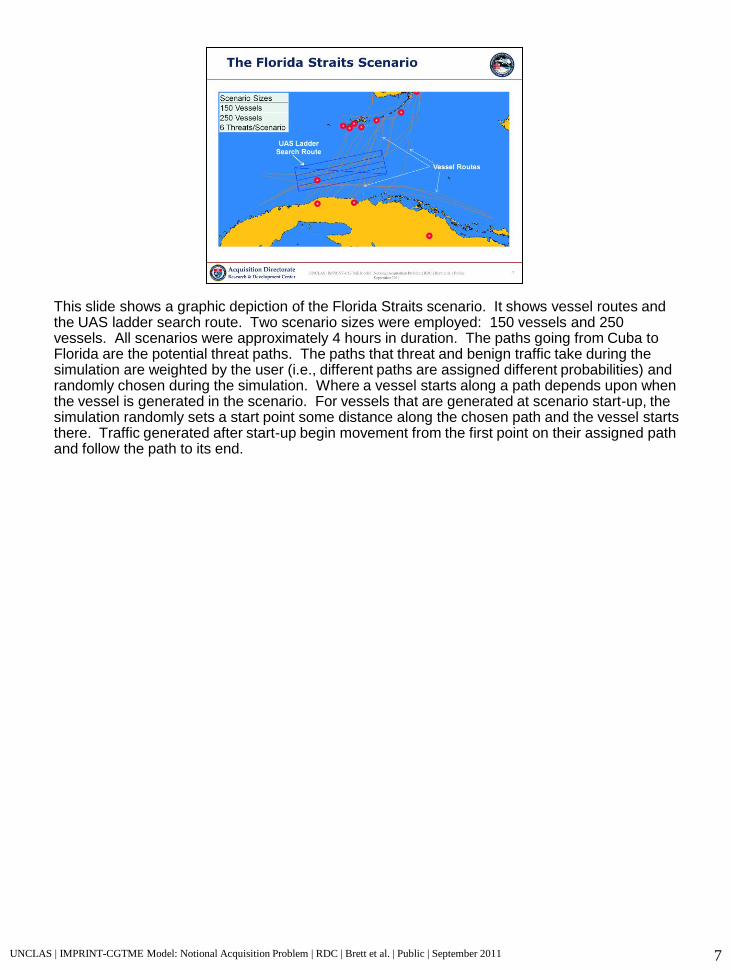
This slide shows a graphic depiction of the Florida Straits scenario. It shows vessel routes and the UAS ladder search route. Two scenario sizes were employed: 150 vessels and 250 vessels. All scenarios were approximately 4 hours in duration. The paths going from Cuba to Florida are the potential threat paths. The paths that threat and benign traffic take during the simulation are weighted by the user (i.e., different paths are assigned different probabilities) and randomly chosen during the simulation. Where a vessel starts along a path depends upon when the vessel is generated in the scenario. For vessels that are generated at scenario start-up, the simulation randomly sets a start point some distance along the chosen path and the vessel starts there. Traffic generated after start-up begin movement from the first point on their assigned path and follow the path to its end.
7 UNCLAS | IMPRINT-CGTME Model: Notional Acquisition Problem | RDC | Brett et al. | Public | September 2011
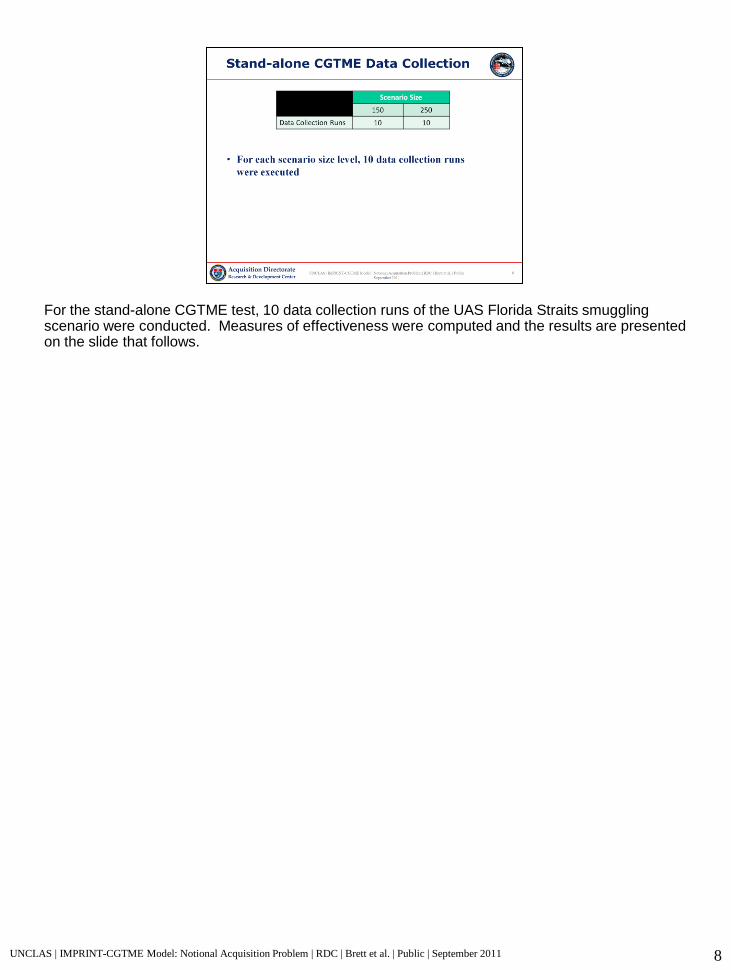
For the stand-alone CGTME test, 10 data collection runs of the UAS Florida Straits smuggling scenario were conducted. Measures of effectiveness were computed and the results are presented on the slide that follows.
UNCLAS | IMPRINT-CGTME Model: Notional Acquisition Problem | RDC | Brett et al. | Public | September 2011 8
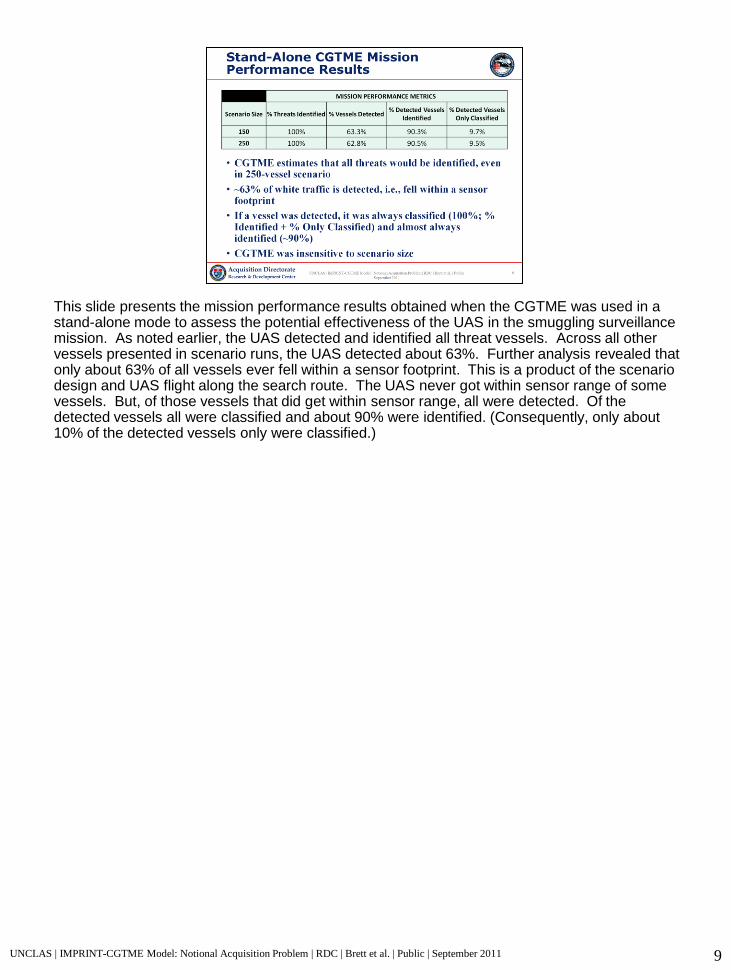
This slide presents the mission performance results obtained when the CGTME was used in a stand-alone mode to assess the potential effectiveness of the UAS in the smuggling surveillance mission. As noted earlier, the UAS detected and identified all threat vessels. Across all other vessels presented in scenario runs, the UAS detected about 63%. Further analysis revealed that only about 63% of all vessels ever fell within a sensor footprint. This is a product of the scenario design and UAS flight along the search route. The UAS never got within sensor range of some vessels. But, of those vessels that did get within sensor range, all were detected. Of the detected vessels all were classified and about 90% were identified. (Consequently, only about 10% of the detected vessels only were classified.)
UNCLAS | IMPRINT-CGTME Model: Notional Acquisition Problem | RDC | Brett et al. | Public | September 2011 9
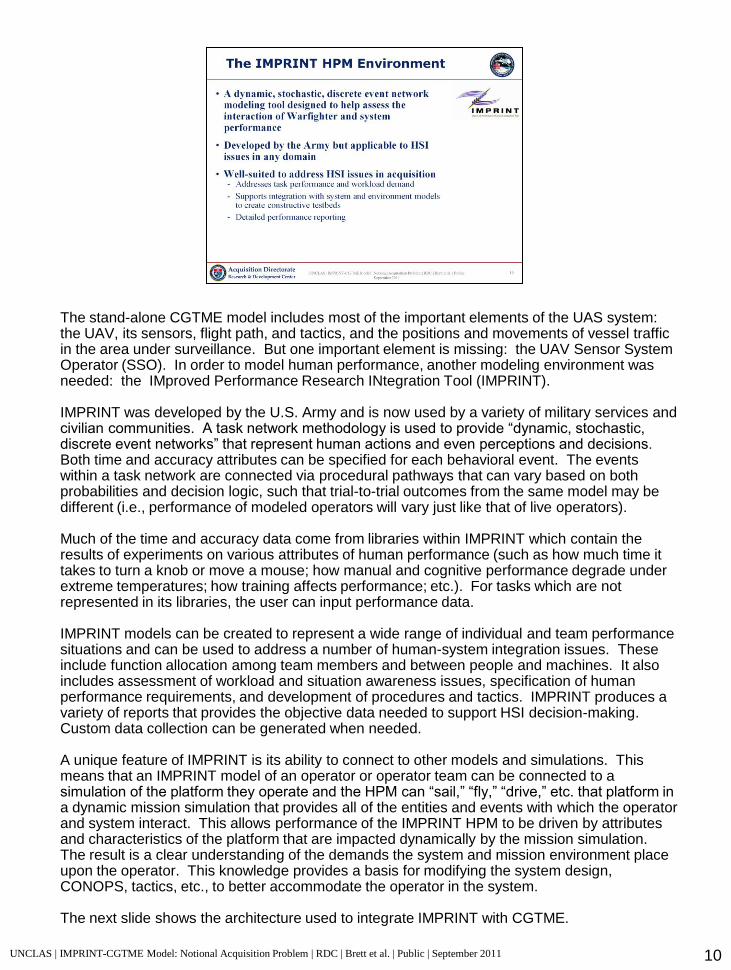
The stand-alone CGTME model includes most of the important elements of the UAS system: the UAV, its sensors, flight path, and tactics, and the positions and movements of vessel traffic in the area under surveillance. But one important element is missing: the UAV Sensor System Operator (SSO). In order to model human performance, another modeling environment was needed: the IMproved Performance Research INtegration Tool (IMPRINT). IMPRINT was developed by the U.S. Army and is now used by a variety of military services and civilian communities. A task network methodology is used to provide “dynamic, stochastic, discrete event networks” that represent human actions and even perceptions and decisions. Both time and accuracy attributes can be specified for each behavioral event. The events within a task network are connected via procedural pathways that can vary based on both probabilities and decision logic, such that trial-to-trial outcomes from the same model may be different (i.e., performance of modeled operators will vary just like that of live operators). Much of the time and accuracy data come from libraries within IMPRINT which contain the results of experiments on various attributes of human performance (such as how much time it takes to turn a knob or move a mouse; how manual and cognitive performance degrade under extreme temperatures; how training affects performance; etc.). For tasks which are not represented in its libraries, the user can input performance data. IMPRINT models can be created to represent a wide range of individual and team performance situations and can be used to address a number of human-system integration issues. These include function allocation among team members and between people and machines. It also includes assessment of workload and situation awareness issues, specification of human performance requirements, and development of procedures and tactics. IMPRINT produces a variety of reports that provides the objective data needed to support HSI decision-making. Custom data collection can be generated when needed. A unique feature of IMPRINT is its ability to connect to other models and simulations. This means that an IMPRINT model of an operator or operator team can be connected to a simulation of the platform they operate and the HPM can “sail,” “fly,” “drive,” etc. that platform in a dynamic mission simulation that provides all of the entities and events with which the operator and system interact. This allows performance of the IMPRINT HPM to be driven by attributes and characteristics of the platform that are impacted dynamically by the mission simulation. The result is a clear understanding of the demands the system and mission environment place upon the operator. This knowledge provides a basis for modifying the system design, CONOPS, tactics, etc., to better accommodate the operator in the system. The next slide shows the architecture used to integrate IMPRINT with CGTME.
10 UNCLAS | IMPRINT-CGTME Model: Notional Acquisition Problem | RDC | Brett et al. | Public | September 2011
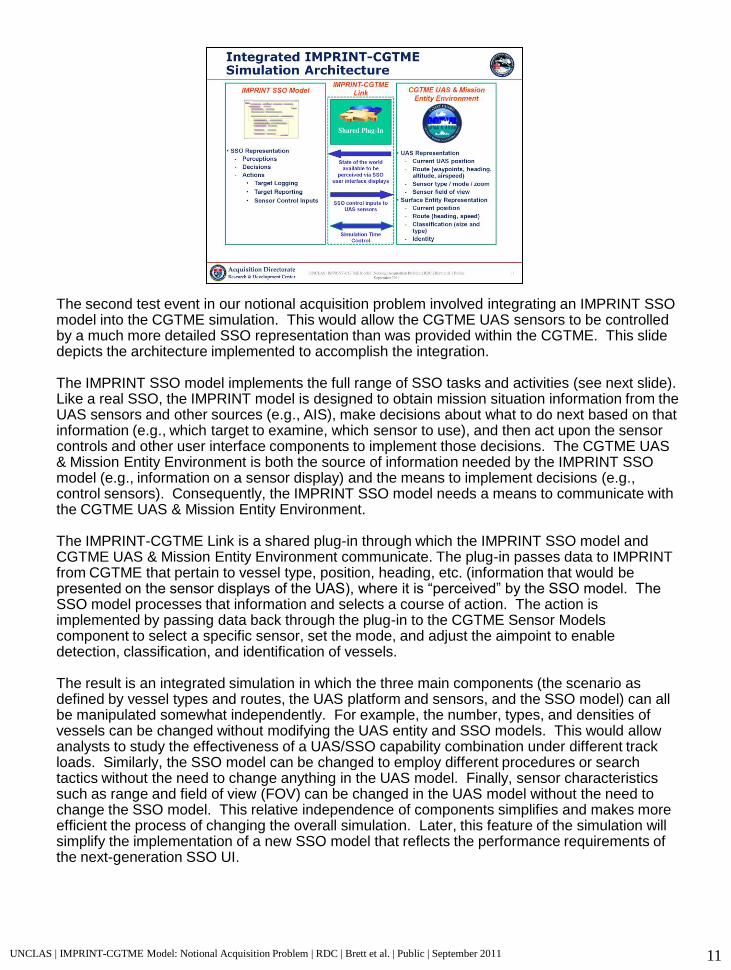
The second test event in our notional acquisition problem involved integrating an IMPRINT SSO model into the CGTME simulation. This would allow the CGTME UAS sensors to be controlled by a much more detailed SSO representation than was provided within the CGTME. This slide depicts the architecture implemented to accomplish the integration. The IMPRINT SSO model implements the full range of SSO tasks and activities (see next slide). Like a real SSO, the IMPRINT model is designed to obtain mission situation information from the UAS sensors and other sources (e.g., AIS), make decisions about what to do next based on that information (e.g., which target to examine, which sensor to use), and then act upon the sensor controls and other user interface components to implement those decisions. The CGTME UAS & Mission Entity Environment is both the source of information needed by the IMPRINT SSO model (e.g., information on a sensor display) and the means to implement decisions (e.g., control sensors). Consequently, the IMPRINT SSO model needs a means to communicate with the CGTME UAS & Mission Entity Environment. The IMPRINT-CGTME Link is a shared plug-in through which the IMPRINT SSO model and CGTME UAS & Mission Entity Environment communicate. The plug-in passes data to IMPRINT from CGTME that pertain to vessel type, position, heading, etc. (information that would be presented on the sensor displays of the UAS), where it is “perceived” by the SSO model. The SSO model processes that information and selects a course of action. The action is implemented by passing data back through the plug-in to the CGTME Sensor Models component to select a specific sensor, set the mode, and adjust the aimpoint to enable detection, classification, and identification of vessels. The result is an integrated simulation in which the three main components (the scenario as defined by vessel types and routes, the UAS platform and sensors, and the SSO model) can all be manipulated somewhat independently. For example, the number, types, and densities of vessels can be changed without modifying the UAS entity and SSO models. This would allow analysts to study the effectiveness of a UAS/SSO capability combination under different track loads. Similarly, the SSO model can be changed to employ different procedures or search tactics without the need to change anything in the UAS model. Finally, sensor characteristics such as range and field of view (FOV) can be changed in the UAS model without the need to change the SSO model. This relative independence of components simplifies and makes more efficient the process of changing the overall simulation. Later, this feature of the simulation will simplify the implementation of a new SSO model that reflects the performance requirements of the next-generation SSO UI.
11 UNCLAS | IMPRINT-CGTME Model: Notional Acquisition Problem | RDC | Brett et al. | Public | September 2011
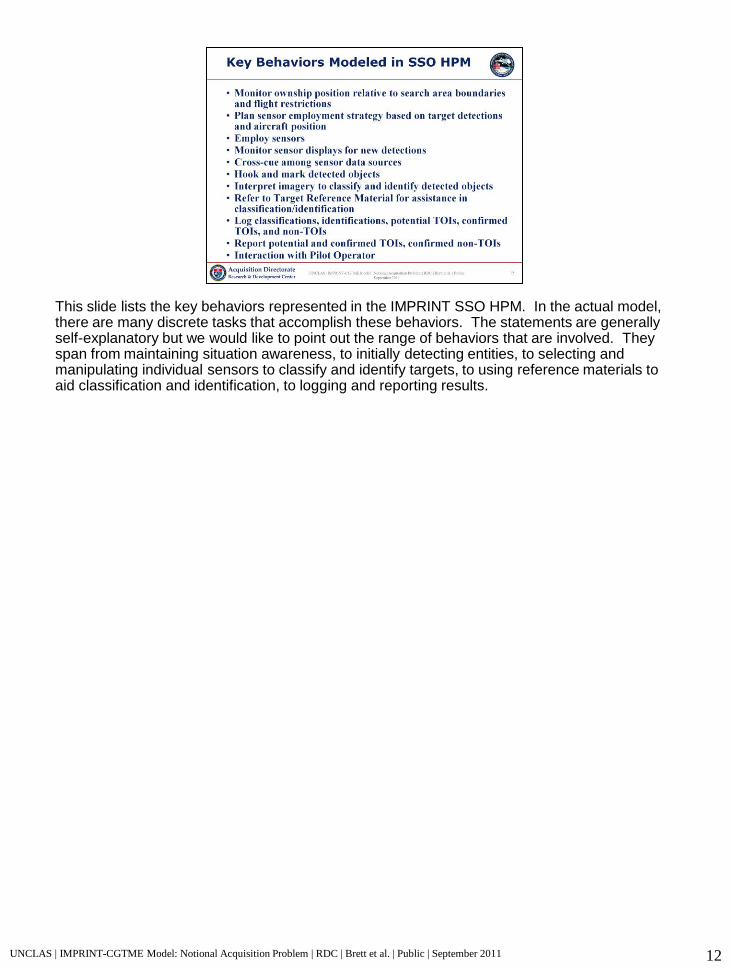
This slide lists the key behaviors represented in the IMPRINT SSO HPM. In the actual model, there are many discrete tasks that accomplish these behaviors. The statements are generally self-explanatory but we would like to point out the range of behaviors that are involved. They span from maintaining situation awareness, to initially detecting entities, to selecting and manipulating individual sensors to classify and identify targets, to using reference materials to aid classification and identification, to logging and reporting results.
12 UNCLAS | IMPRINT-CGTME Model: Notional Acquisition Problem | RDC | Brett et al. | Public | September 2011
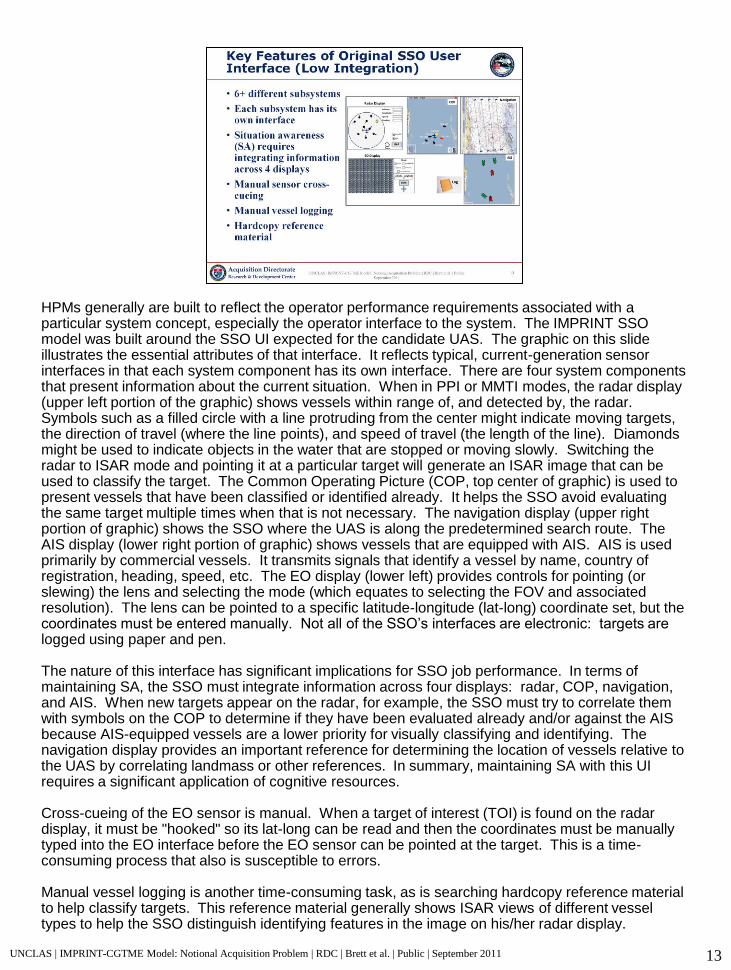
HPMs generally are built to reflect the operator performance requirements associated with a particular system concept, especially the operator interface to the system. The IMPRINT SSO model was built around the SSO UI expected for the candidate UAS. The graphic on this slide illustrates the essential attributes of that interface. It reflects typical, current-generation sensor interfaces in that each system component has its own interface. There are four system components that present information about the current situation. When in PPI or MMTI modes, the radar display (upper left portion of the graphic) shows vessels within range of, and detected by, the radar. Symbols such as a filled circle with a line protruding from the center might indicate moving targets, the direction of travel (where the line points), and speed of travel (the length of the line). Diamonds might be used to indicate objects in the water that are stopped or moving slowly. Switching the radar to ISAR mode and pointing it at a particular target will generate an ISAR image that can be used to classify the target. The Common Operating Picture (COP, top center of graphic) is used to present vessels that have been classified or identified already. It helps the SSO avoid evaluating the same target multiple times when that is not necessary. The navigation display (upper right portion of graphic) shows the SSO where the UAS is along the predetermined search route. The AIS display (lower right portion of graphic) shows vessels that are equipped with AIS. AIS is used primarily by commercial vessels. It transmits signals that identify a vessel by name, country of registration, heading, speed, etc. The EO display (lower left) provides controls for pointing (or slewing) the lens and selecting the mode (which equates to selecting the FOV and associated resolution). The lens can be pointed to a specific latitude-longitude (lat-long) coordinate set, but the coordinates must be entered manually. Not all of the SSO’s interfaces are electronic: targets are logged using paper and pen. The nature of this interface has significant implications for SSO job performance. In terms of maintaining SA, the SSO must integrate information across four displays: radar, COP, navigation, and AIS. When new targets appear on the radar, for example, the SSO must try to correlate them with symbols on the COP to determine if they have been evaluated already and/or against the AIS because AIS-equipped vessels are a lower priority for visually classifying and identifying. The navigation display provides an important reference for determining the location of vessels relative to the UAS by correlating landmass or other references. In summary, maintaining SA with this UI requires a significant application of cognitive resources. Cross-cueing of the EO sensor is manual. When a target of interest (TOI) is found on the radar display, it must be "hooked" so its lat-long can be read and then the coordinates must be manually typed into the EO interface before the EO sensor can be pointed at the target. This is a time-consuming process that also is susceptible to errors. Manual vessel logging is another time-consuming task, as is searching hardcopy reference material to help classify targets. This reference material generally shows ISAR views of different vessel types to help the SSO distinguish identifying features in the image on his/her radar display.
UNCLAS | IMPRINT-CGTME Model: Notional Acquisition Problem | RDC | Brett et al. | Public | September 2011 13
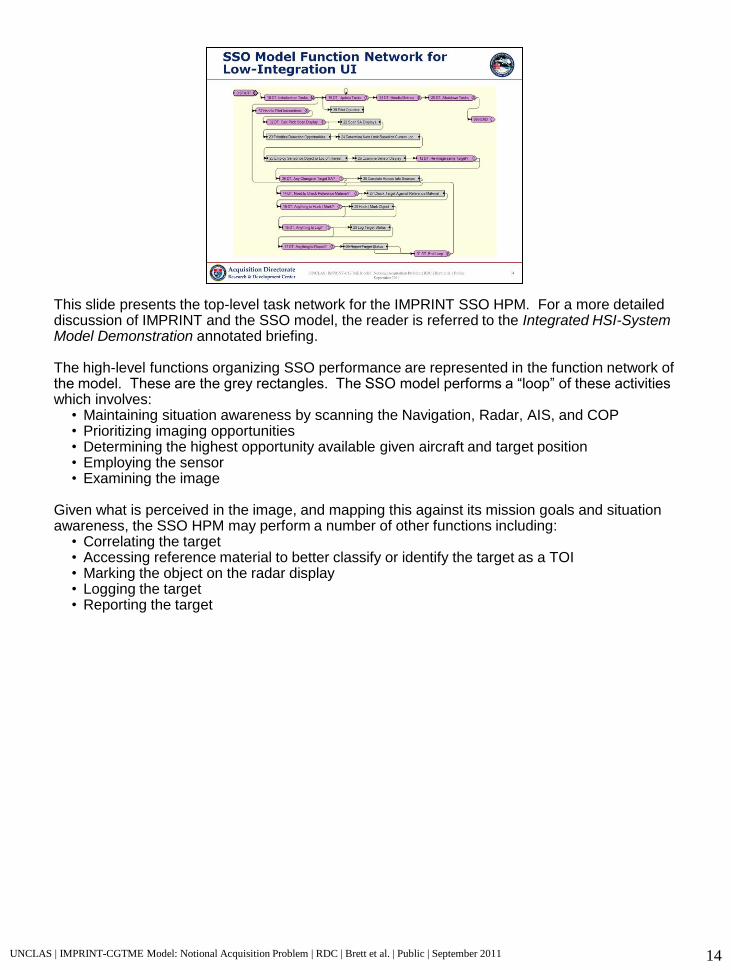
This slide presents the top-level task network for the IMPRINT SSO HPM. For a more detailed discussion of IMPRINT and the SSO model, the reader is referred to the Integrated HSI-System Model Demonstration annotated briefing. The high-level functions organizing SSO performance are represented in the function network of the model. These are the grey rectangles. The SSO model performs a “loop” of these activities which involves:
• Maintaining situation awareness by scanning the Navigation, Radar, AIS, and COP • Prioritizing imaging opportunities • Determining the highest opportunity available given aircraft and target position • Employing the sensor • Examining the image
Given what is perceived in the image, and mapping this against its mission goals and situation awareness, the SSO HPM may perform a number of other functions including:
• Correlating the target • Accessing reference material to better classify or identify the target as a TOI • Marking the object on the radar display • Logging the target • Reporting the target
14 UNCLAS | IMPRINT-CGTME Model: Notional Acquisition Problem | RDC | Brett et al. | Public | September 2011
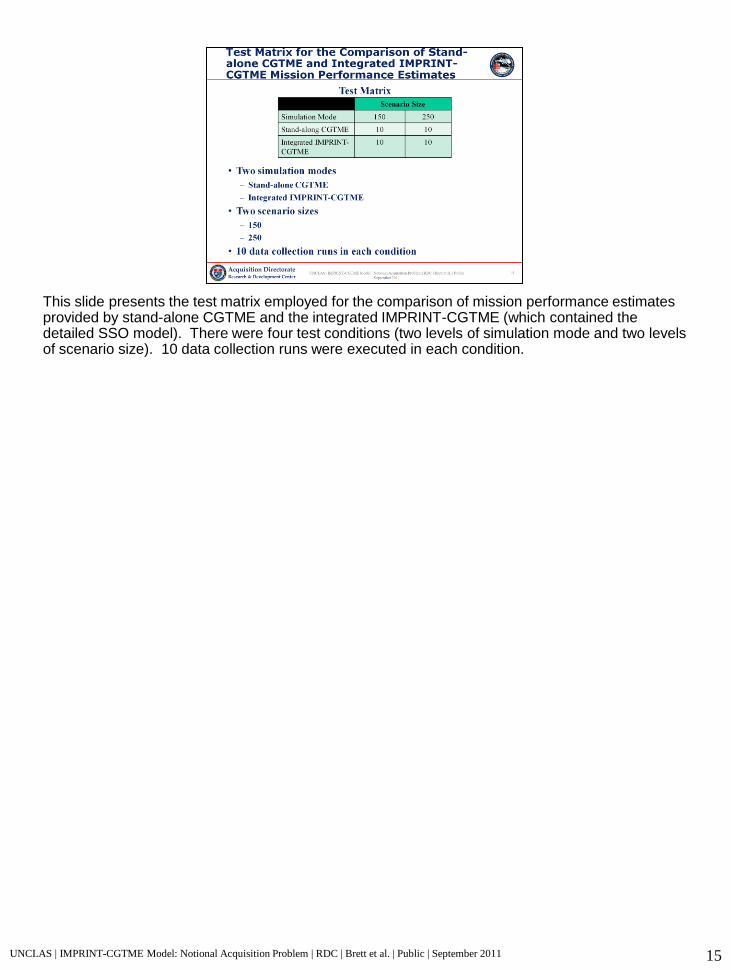
This slide presents the test matrix employed for the comparison of mission performance estimates provided by stand-alone CGTME and the integrated IMPRINT-CGTME (which contained the detailed SSO model). There were four test conditions (two levels of simulation mode and two levels of scenario size). 10 data collection runs were executed in each condition.
UNCLAS | IMPRINT-CGTME Model: Notional Acquisition Problem | RDC | Brett et al. | Public | September 2011 15
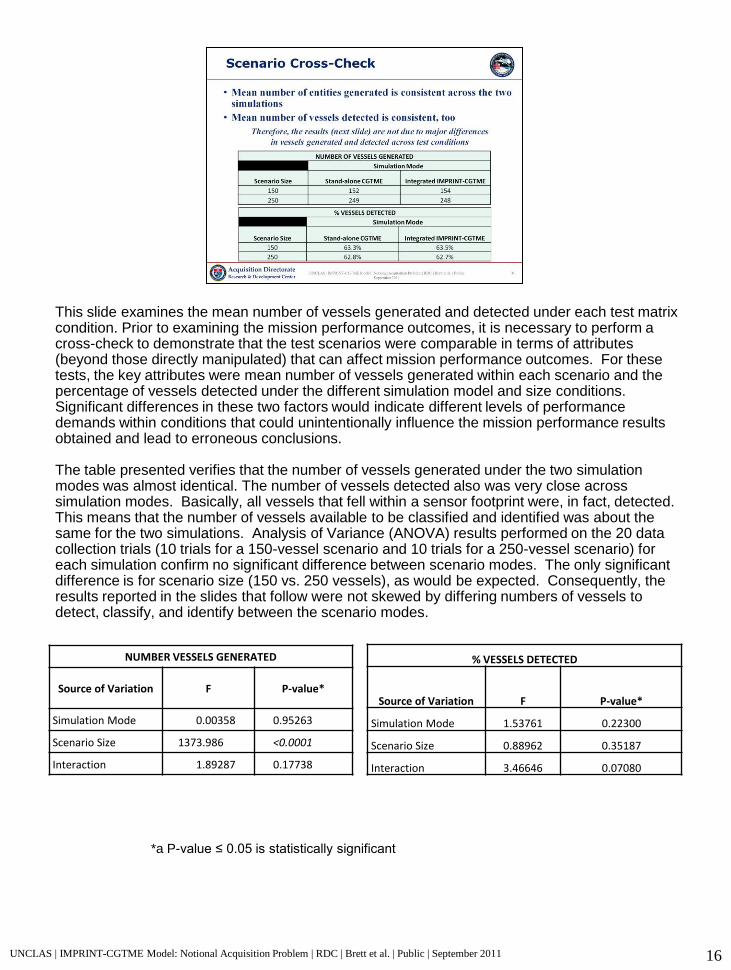
This slide examines the mean number of vessels generated and detected under each test matrix condition. Prior to examining the mission performance outcomes, it is necessary to perform a cross-check to demonstrate that the test scenarios were comparable in terms of attributes (beyond those directly manipulated) that can affect mission performance outcomes. For these tests, the key attributes were mean number of vessels generated within each scenario and the percentage of vessels detected under the different simulation model and size conditions. Significant differences in these two factors would indicate different levels of performance demands within conditions that could unintentionally influence the mission performance results obtained and lead to erroneous conclusions. The table presented verifies that the number of vessels generated under the two simulation modes was almost identical. The number of vessels detected also was very close across simulation modes. Basically, all vessels that fell within a sensor footprint were, in fact, detected. This means that the number of vessels available to be classified and identified was about the same for the two simulations. Analysis of Variance (ANOVA) results performed on the 20 data collection trials (10 trials for a 150-vessel scenario and 10 trials for a 250-vessel scenario) for each simulation confirm no significant difference between scenario modes. The only significant difference is for scenario size (150 vs. 250 vessels), as would be expected. Consequently, the results reported in the slides that follow were not skewed by differing numbers of vessels to detect, classify, and identify between the scenario modes. *a P-value ≤ 0.05 is statistically significant
16
% VESSELS DETECTED
Source of Variation F P-value*
Simulation Mode 1.53761 0.22300
Scenario Size 0.88962 0.35187
Interaction 3.46646 0.07080
NUMBER VESSELS GENERATED
Source of Variation F P-value*
Simulation Mode 0.00358 0.95263
Scenario Size 1373.986 <0.0001
Interaction 1.89287 0.17738
UNCLAS | IMPRINT-CGTME Model: Notional Acquisition Problem | RDC | Brett et al. | Public | September 2011
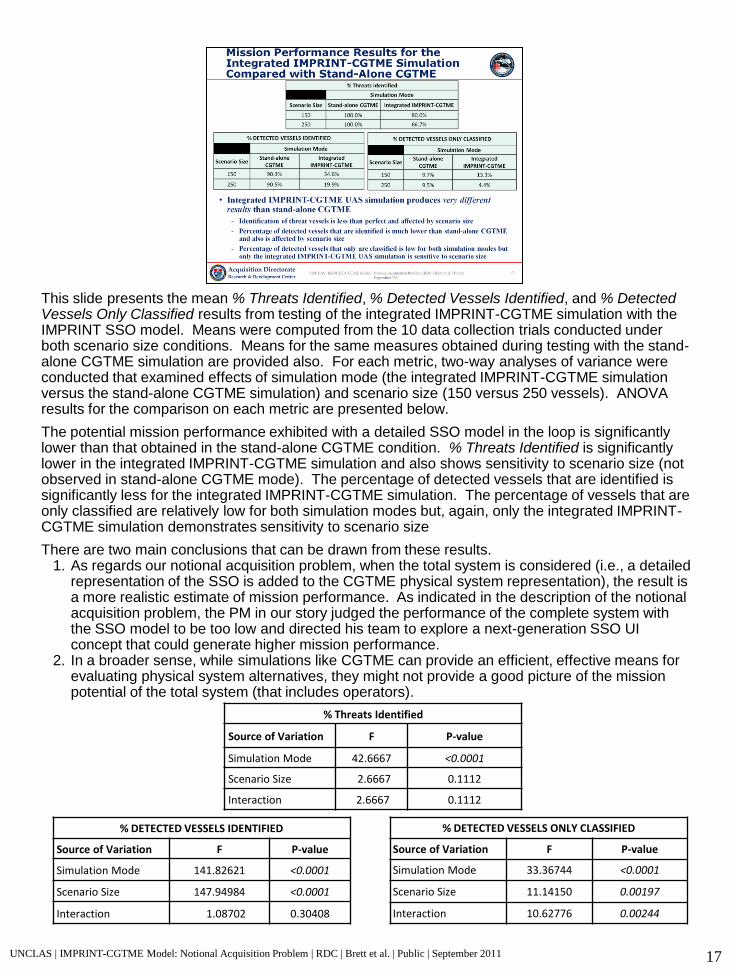
This slide presents the mean % Threats Identified, % Detected Vessels Identified, and % Detected Vessels Only Classified results from testing of the integrated IMPRINT-CGTME simulation with the IMPRINT SSO model. Means were computed from the 10 data collection trials conducted under both scenario size conditions. Means for the same measures obtained during testing with the stand-alone CGTME simulation are provided also. For each metric, two-way analyses of variance were conducted that examined effects of simulation mode (the integrated IMPRINT-CGTME simulation versus the stand-alone CGTME simulation) and scenario size (150 versus 250 vessels). ANOVA results for the comparison on each metric are presented below.
The potential mission performance exhibited with a detailed SSO model in the loop is significantly lower than that obtained in the stand-alone CGTME condition. % Threats Identified is significantly lower in the integrated IMPRINT-CGTME simulation and also shows sensitivity to scenario size (not observed in stand-alone CGTME mode). The percentage of detected vessels that are identified is significantly less for the integrated IMPRINT-CGTME simulation. The percentage of vessels that are only classified are relatively low for both simulation modes but, again, only the integrated IMPRINT-CGTME simulation demonstrates sensitivity to scenario size
There are two main conclusions that can be drawn from these results. 1. As regards our notional acquisition problem, when the total system is considered (i.e., a detailed
representation of the SSO is added to the CGTME physical system representation), the result is a more realistic estimate of mission performance. As indicated in the description of the notional acquisition problem, the PM in our story judged the performance of the complete system with the SSO model to be too low and directed his team to explore a next-generation SSO UI concept that could generate higher mission performance.
2. In a broader sense, while simulations like CGTME can provide an efficient, effective means for evaluating physical system alternatives, they might not provide a good picture of the mission potential of the total system (that includes operators).
17
% Threats Identified
Source of Variation F P-value
Simulation Mode 42.6667 <0.0001
Scenario Size 2.6667 0.1112
Interaction 2.6667 0.1112
% DETECTED VESSELS IDENTIFIED
Source of Variation F P-value
Simulation Mode 141.82621 <0.0001
Scenario Size 147.94984 <0.0001
Interaction 1.08702 0.30408
% DETECTED VESSELS ONLY CLASSIFIED
Source of Variation F P-value
Simulation Mode 33.36744 <0.0001
Scenario Size 11.14150 0.00197
Interaction 10.62776 0.00244
UNCLAS | IMPRINT-CGTME Model: Notional Acquisition Problem | RDC | Brett et al. | Public | September 2011
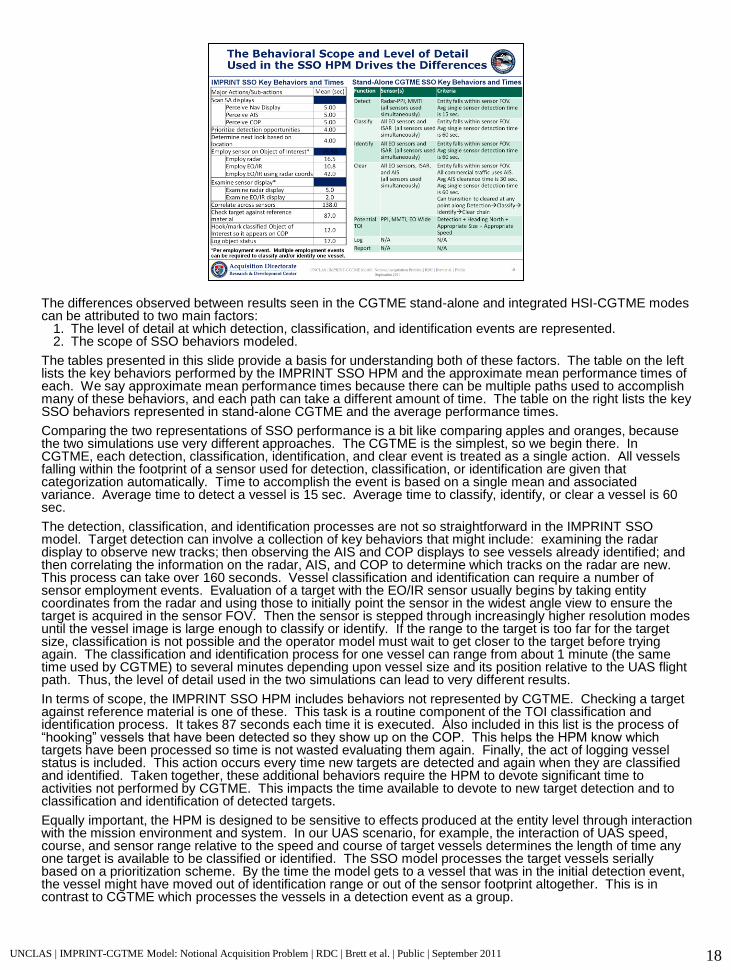
The differences observed between results seen in the CGTME stand-alone and integrated HSI-CGTME modes can be attributed to two main factors:
1. The level of detail at which detection, classification, and identification events are represented. 2. The scope of SSO behaviors modeled.
The tables presented in this slide provide a basis for understanding both of these factors. The table on the left lists the key behaviors performed by the IMPRINT SSO HPM and the approximate mean performance times of each. We say approximate mean performance times because there can be multiple paths used to accomplish many of these behaviors, and each path can take a different amount of time. The table on the right lists the key SSO behaviors represented in stand-alone CGTME and the average performance times.
Comparing the two representations of SSO performance is a bit like comparing apples and oranges, because the two simulations use very different approaches. The CGTME is the simplest, so we begin there. In CGTME, each detection, classification, identification, and clear event is treated as a single action. All vessels falling within the footprint of a sensor used for detection, classification, or identification are given that categorization automatically. Time to accomplish the event is based on a single mean and associated variance. Average time to detect a vessel is 15 sec. Average time to classify, identify, or clear a vessel is 60 sec.
The detection, classification, and identification processes are not so straightforward in the IMPRINT SSO model. Target detection can involve a collection of key behaviors that might include: examining the radar display to observe new tracks; then observing the AIS and COP displays to see vessels already identified; and then correlating the information on the radar, AIS, and COP to determine which tracks on the radar are new. This process can take over 160 seconds. Vessel classification and identification can require a number of sensor employment events. Evaluation of a target with the EO/IR sensor usually begins by taking entity coordinates from the radar and using those to initially point the sensor in the widest angle view to ensure the target is acquired in the sensor FOV. Then the sensor is stepped through increasingly higher resolution modes until the vessel image is large enough to classify or identify. If the range to the target is too far for the target size, classification is not possible and the operator model must wait to get closer to the target before trying again. The classification and identification process for one vessel can range from about 1 minute (the same time used by CGTME) to several minutes depending upon vessel size and its position relative to the UAS flight path. Thus, the level of detail used in the two simulations can lead to very different results.
In terms of scope, the IMPRINT SSO HPM includes behaviors not represented by CGTME. Checking a target against reference material is one of these. This task is a routine component of the TOI classification and identification process. It takes 87 seconds each time it is executed. Also included in this list is the process of “hooking” vessels that have been detected so they show up on the COP. This helps the HPM know which targets have been processed so time is not wasted evaluating them again. Finally, the act of logging vessel status is included. This action occurs every time new targets are detected and again when they are classified and identified. Taken together, these additional behaviors require the HPM to devote significant time to activities not performed by CGTME. This impacts the time available to devote to new target detection and to classification and identification of detected targets.
Equally important, the HPM is designed to be sensitive to effects produced at the entity level through interaction with the mission environment and system. In our UAS scenario, for example, the interaction of UAS speed, course, and sensor range relative to the speed and course of target vessels determines the length of time any one target is available to be classified or identified. The SSO model processes the target vessels serially based on a prioritization scheme. By the time the model gets to a vessel that was in the initial detection event, the vessel might have moved out of identification range or out of the sensor footprint altogether. This is in contrast to CGTME which processes the vessels in a detection event as a group.
18 UNCLAS | IMPRINT-CGTME Model: Notional Acquisition Problem | RDC | Brett et al. | Public | September 2011
In our acquisition story, the PM, disappointed with the IMPRINT-CGTME prediction of only 67% of threats identified, directed the team to consider alternative interface concepts that would improve SSO and mission performance. This section introduces the design concept for the next-generation SSO user interface and presents the performance results obtained. It also discusses why differences were observed between the new UI concept and the original one. Finally, it discusses what this demonstration shows us in terms of the utility of human performance modeling.
UNCLAS | IMPRINT-CGTME Model: Notional Acquisition Problem | RDC | Brett et al. | Public | September 2011 19
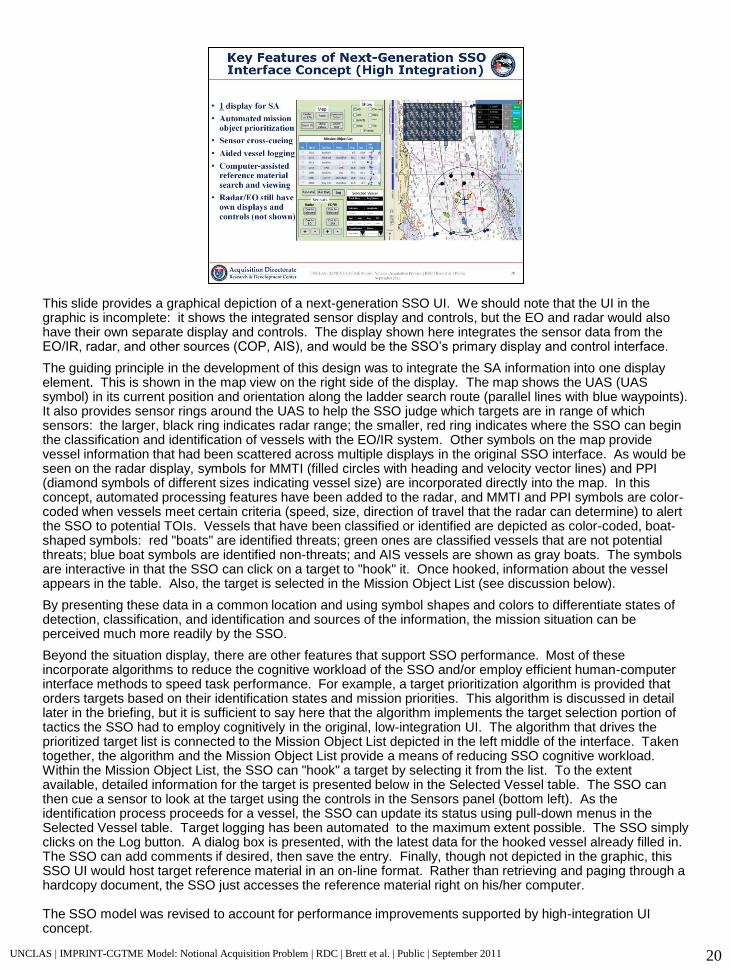
This slide provides a graphical depiction of a next-generation SSO UI. We should note that the UI in the graphic is incomplete: it shows the integrated sensor display and controls, but the EO and radar would also have their own separate display and controls. The display shown here integrates the sensor data from the EO/IR, radar, and other sources (COP, AIS), and would be the SSO’s primary display and control interface.
The guiding principle in the development of this design was to integrate the SA information into one display element. This is shown in the map view on the right side of the display. The map shows the UAS (UAS symbol) in its current position and orientation along the ladder search route (parallel lines with blue waypoints). It also provides sensor rings around the UAS to help the SSO judge which targets are in range of which sensors: the larger, black ring indicates radar range; the smaller, red ring indicates where the SSO can begin the classification and identification of vessels with the EO/IR system. Other symbols on the map provide vessel information that had been scattered across multiple displays in the original SSO interface. As would be seen on the radar display, symbols for MMTI (filled circles with heading and velocity vector lines) and PPI (diamond symbols of different sizes indicating vessel size) are incorporated directly into the map. In this concept, automated processing features have been added to the radar, and MMTI and PPI symbols are color-coded when vessels meet certain criteria (speed, size, direction of travel that the radar can determine) to alert the SSO to potential TOIs. Vessels that have been classified or identified are depicted as color-coded, boat-shaped symbols: red "boats" are identified threats; green ones are classified vessels that are not potential threats; blue boat symbols are identified non-threats; and AIS vessels are shown as gray boats. The symbols are interactive in that the SSO can click on a target to "hook" it. Once hooked, information about the vessel appears in the table. Also, the target is selected in the Mission Object List (see discussion below).
By presenting these data in a common location and using symbol shapes and colors to differentiate states of detection, classification, and identification and sources of the information, the mission situation can be perceived much more readily by the SSO.
Beyond the situation display, there are other features that support SSO performance. Most of these incorporate algorithms to reduce the cognitive workload of the SSO and/or employ efficient human-computer interface methods to speed task performance. For example, a target prioritization algorithm is provided that orders targets based on their identification states and mission priorities. This algorithm is discussed in detail later in the briefing, but it is sufficient to say here that the algorithm implements the target selection portion of tactics the SSO had to employ cognitively in the original, low-integration UI. The algorithm that drives the prioritized target list is connected to the Mission Object List depicted in the left middle of the interface. Taken together, the algorithm and the Mission Object List provide a means of reducing SSO cognitive workload. Within the Mission Object List, the SSO can "hook" a target by selecting it from the list. To the extent available, detailed information for the target is presented below in the Selected Vessel table. The SSO can then cue a sensor to look at the target using the controls in the Sensors panel (bottom left). As the identification process proceeds for a vessel, the SSO can update its status using pull-down menus in the Selected Vessel table. Target logging has been automated to the maximum extent possible. The SSO simply clicks on the Log button. A dialog box is presented, with the latest data for the hooked vessel already filled in. The SSO can add comments if desired, then save the entry. Finally, though not depicted in the graphic, this SSO UI would host target reference material in an on-line format. Rather than retrieving and paging through a hardcopy document, the SSO just accesses the reference material right on his/her computer. The SSO model was revised to account for performance improvements supported by high-integration UI concept.
UNCLAS | IMPRINT-CGTME Model: Notional Acquisition Problem | RDC | Brett et al. | Public | September 2011 20
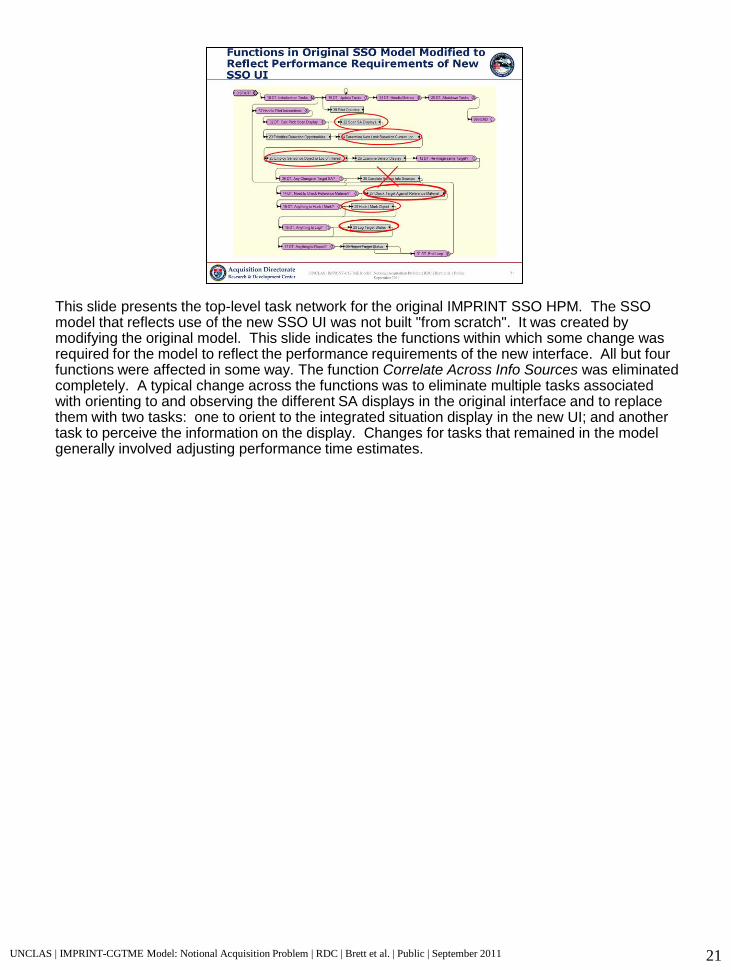
This slide presents the top-level task network for the original IMPRINT SSO HPM. The SSO model that reflects use of the new SSO UI was not built "from scratch". It was created by modifying the original model. This slide indicates the functions within which some change was required for the model to reflect the performance requirements of the new interface. All but four functions were affected in some way. The function Correlate Across Info Sources was eliminated completely. A typical change across the functions was to eliminate multiple tasks associated with orienting to and observing the different SA displays in the original interface and to replace them with two tasks: one to orient to the integrated situation display in the new UI; and another task to perceive the information on the display. Changes for tasks that remained in the model generally involved adjusting performance time estimates.
21 UNCLAS | IMPRINT-CGTME Model: Notional Acquisition Problem | RDC | Brett et al. | Public | September 2011
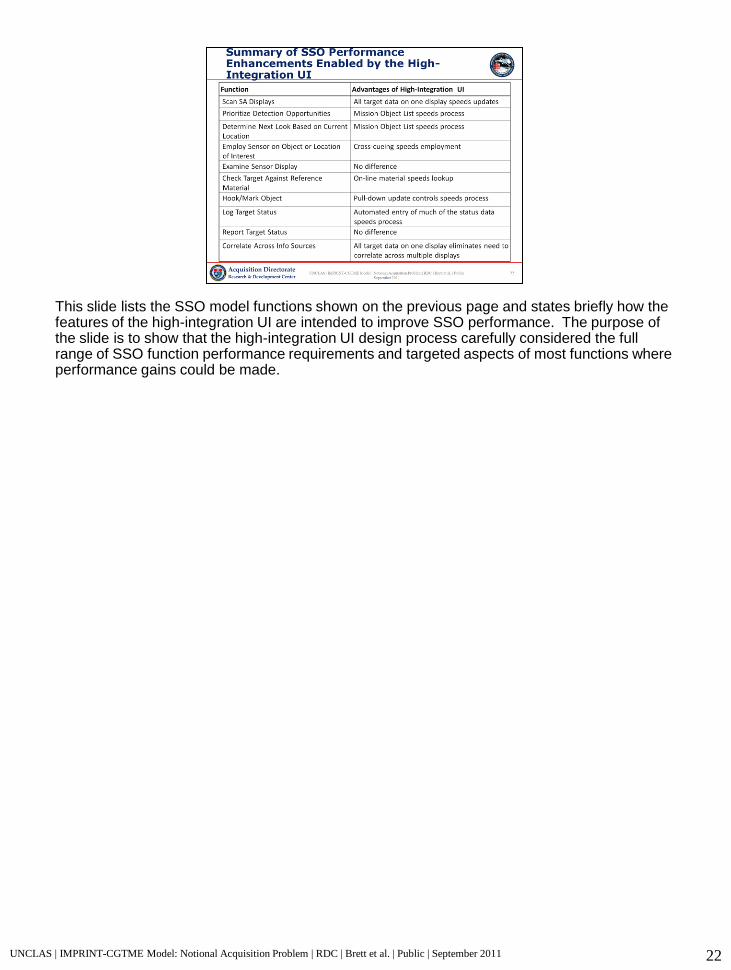
This slide lists the SSO model functions shown on the previous page and states briefly how the features of the high-integration UI are intended to improve SSO performance. The purpose of the slide is to show that the high-integration UI design process carefully considered the full range of SSO function performance requirements and targeted aspects of most functions where performance gains could be made.
UNCLAS | IMPRINT-CGTME Model: Notional Acquisition Problem | RDC | Brett et al. | Public | September 2011 22
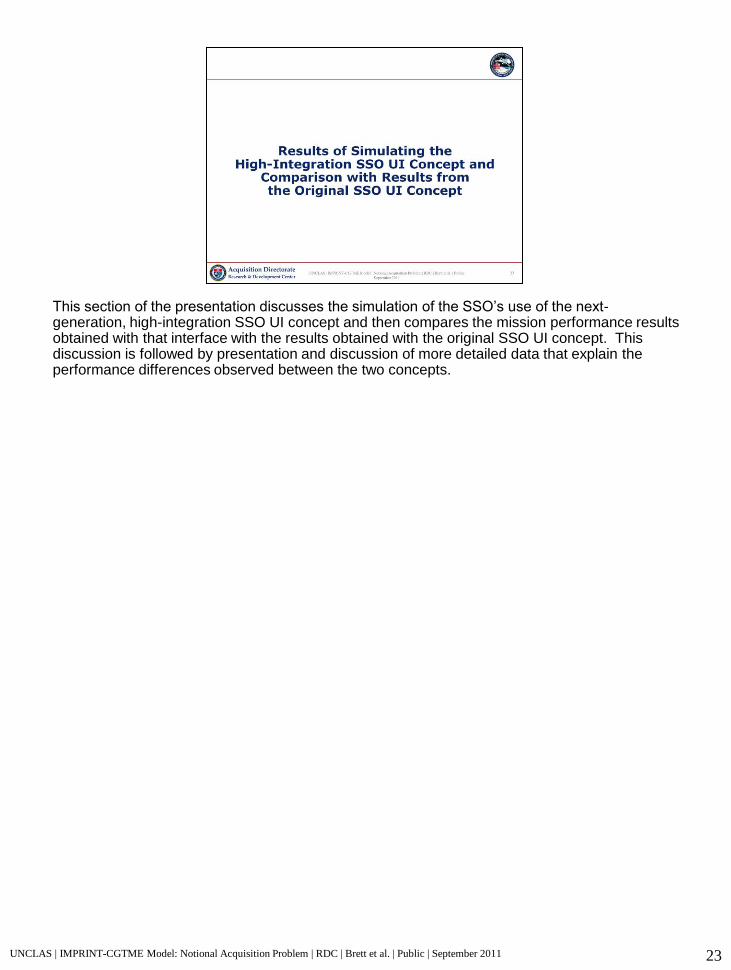
This section of the presentation discusses the simulation of the SSO’s use of the next-generation, high-integration SSO UI concept and then compares the mission performance results obtained with that interface with the results obtained with the original SSO UI concept. This discussion is followed by presentation and discussion of more detailed data that explain the performance differences observed between the two concepts.
UNCLAS | IMPRINT-CGTME Model: Notional Acquisition Problem | RDC | Brett et al. | Public | September 2011 23
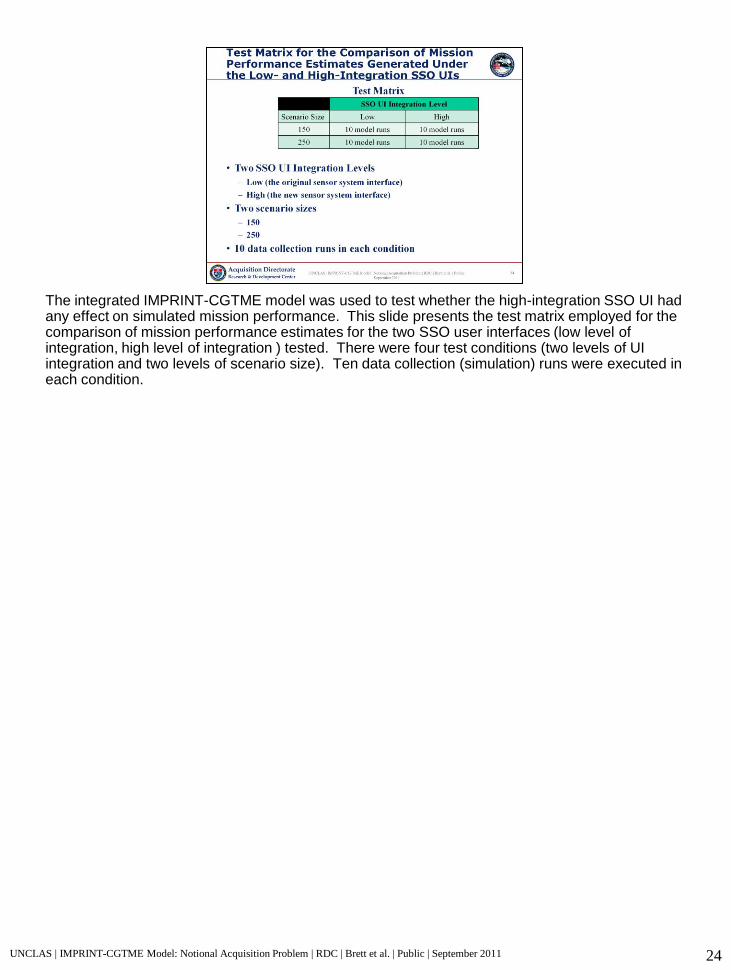
The integrated IMPRINT-CGTME model was used to test whether the high-integration SSO UI had any effect on simulated mission performance. This slide presents the test matrix employed for the comparison of mission performance estimates for the two SSO user interfaces (low level of integration, high level of integration ) tested. There were four test conditions (two levels of UI integration and two levels of scenario size). Ten data collection (simulation) runs were executed in each condition.
UNCLAS | IMPRINT-CGTME Model: Notional Acquisition Problem | RDC | Brett et al. | Public | September 2011 24
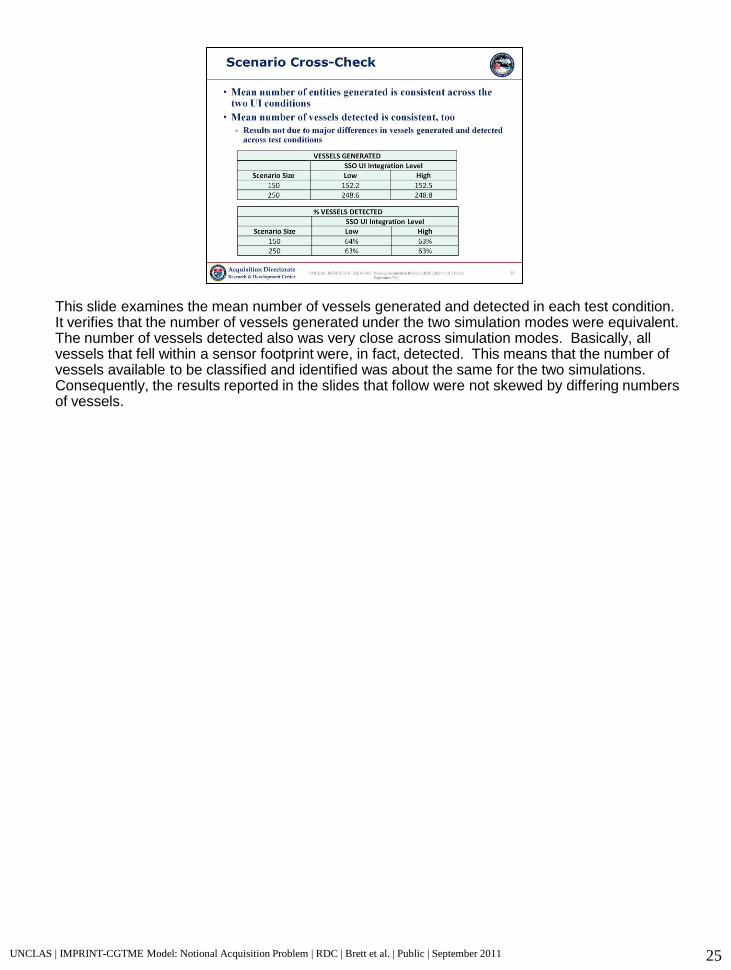
This slide examines the mean number of vessels generated and detected in each test condition. It verifies that the number of vessels generated under the two simulation modes were equivalent. The number of vessels detected also was very close across simulation modes. Basically, all vessels that fell within a sensor footprint were, in fact, detected. This means that the number of vessels available to be classified and identified was about the same for the two simulations. Consequently, the results reported in the slides that follow were not skewed by differing numbers of vessels.
25 UNCLAS | IMPRINT-CGTME Model: Notional Acquisition Problem | RDC | Brett et al. | Public | September 2011
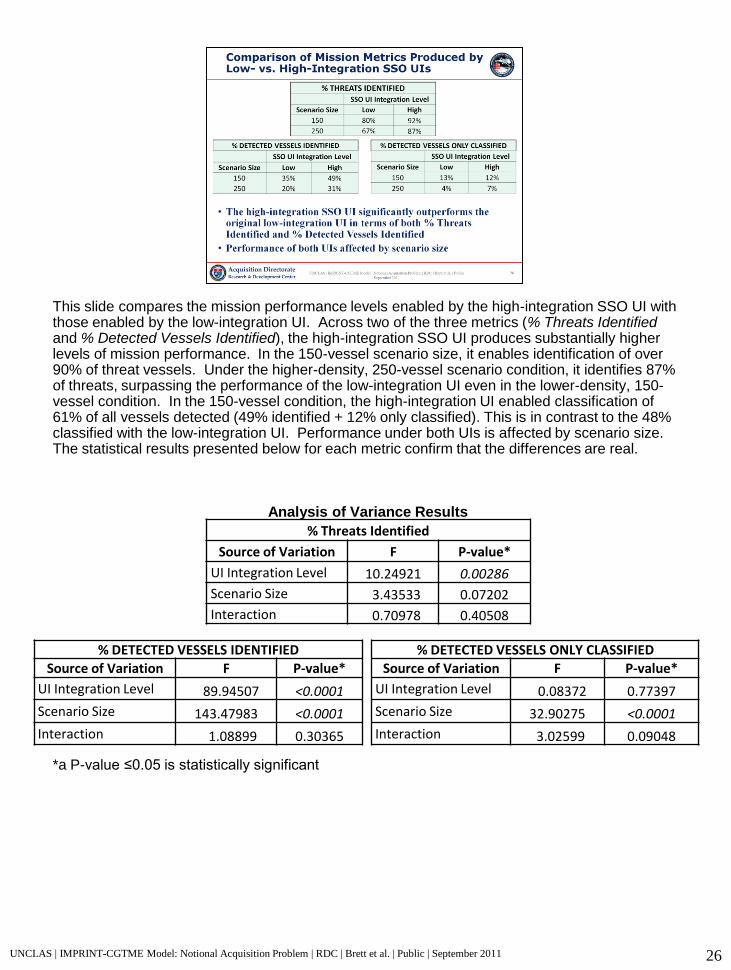
This slide compares the mission performance levels enabled by the high-integration SSO UI with those enabled by the low-integration UI. Across two of the three metrics (% Threats Identified and % Detected Vessels Identified), the high-integration SSO UI produces substantially higher levels of mission performance. In the 150-vessel scenario size, it enables identification of over 90% of threat vessels. Under the higher-density, 250-vessel scenario condition, it identifies 87% of threats, surpassing the performance of the low-integration UI even in the lower-density, 150-vessel condition. In the 150-vessel condition, the high-integration UI enabled classification of 61% of all vessels detected (49% identified + 12% only classified). This is in contrast to the 48% classified with the low-integration UI. Performance under both UIs is affected by scenario size. The statistical results presented below for each metric confirm that the differences are real.
Analysis of Variance Results *a P-value ≤0.05 is statistically significant
UNCLAS | IMPRINT-CGTME Model: Notional Acquisition Problem | RDC | Brett et al. | Public | September 2011 26
% Threats Identified
Source of Variation F P-value*
UI Integration Level 10.24921 0.00286
Scenario Size 3.43533 0.07202
Interaction 0.70978 0.40508
% DETECTED VESSELS IDENTIFIED
Source of Variation F P-value*
UI Integration Level 89.94507 <0.0001
Scenario Size 143.47983 <0.0001
Interaction 1.08899 0.30365
% DETECTED VESSELS ONLY CLASSIFIED
Source of Variation F P-value*
UI Integration Level 0.08372 0.77397
Scenario Size 32.90275 <0.0001
Interaction 3.02599 0.09048
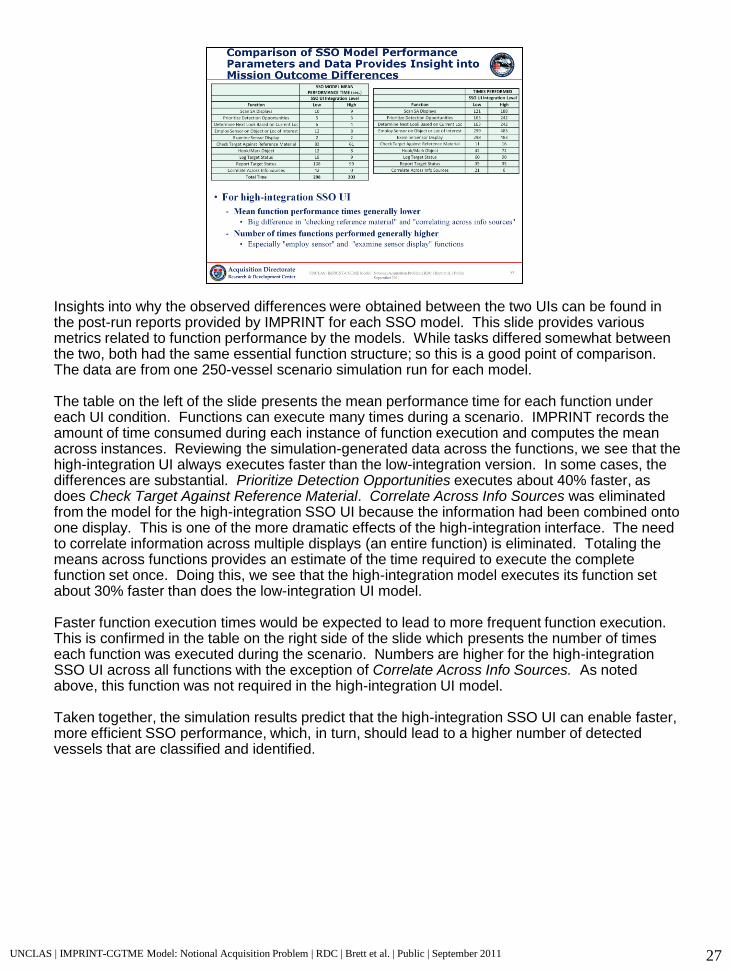
Insights into why the observed differences were obtained between the two UIs can be found in the post-run reports provided by IMPRINT for each SSO model. This slide provides various metrics related to function performance by the models. While tasks differed somewhat between the two, both had the same essential function structure; so this is a good point of comparison. The data are from one 250-vessel scenario simulation run for each model. The table on the left of the slide presents the mean performance time for each function under each UI condition. Functions can execute many times during a scenario. IMPRINT records the amount of time consumed during each instance of function execution and computes the mean across instances. Reviewing the simulation-generated data across the functions, we see that the high-integration UI always executes faster than the low-integration version. In some cases, the differences are substantial. Prioritize Detection Opportunities executes about 40% faster, as does Check Target Against Reference Material. Correlate Across Info Sources was eliminated from the model for the high-integration SSO UI because the information had been combined onto one display. This is one of the more dramatic effects of the high-integration interface. The need to correlate information across multiple displays (an entire function) is eliminated. Totaling the means across functions provides an estimate of the time required to execute the complete function set once. Doing this, we see that the high-integration model executes its function set about 30% faster than does the low-integration UI model. Faster function execution times would be expected to lead to more frequent function execution. This is confirmed in the table on the right side of the slide which presents the number of times each function was executed during the scenario. Numbers are higher for the high-integration SSO UI across all functions with the exception of Correlate Across Info Sources. As noted above, this function was not required in the high-integration UI model. Taken together, the simulation results predict that the high-integration SSO UI can enable faster, more efficient SSO performance, which, in turn, should lead to a higher number of detected vessels that are classified and identified.
27 UNCLAS | IMPRINT-CGTME Model: Notional Acquisition Problem | RDC | Brett et al. | Public | September 2011
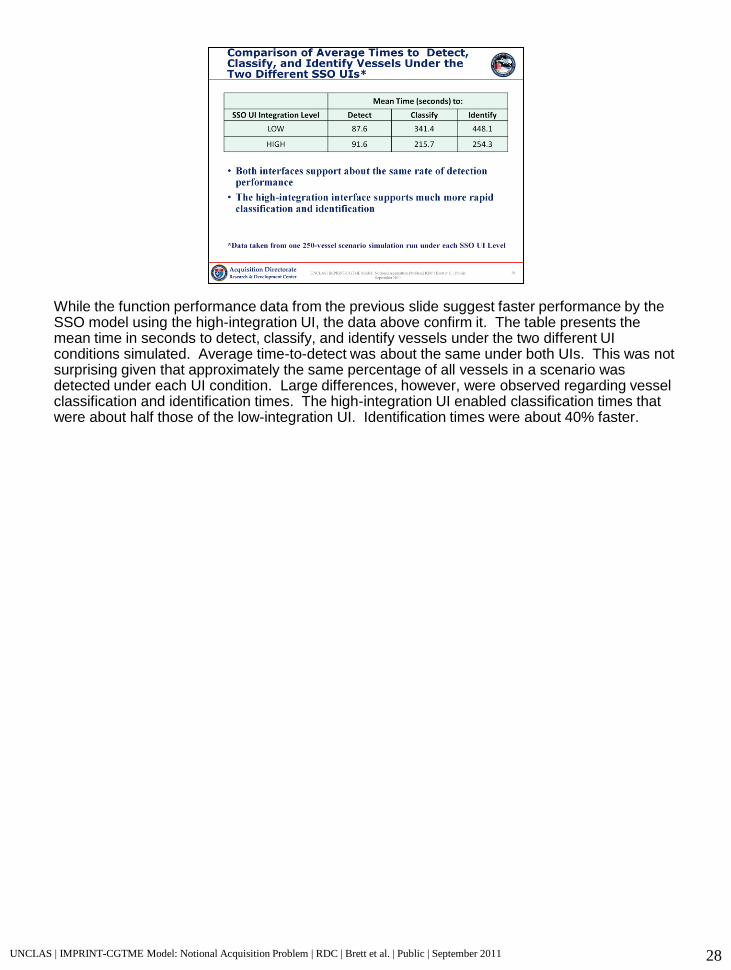
While the function performance data from the previous slide suggest faster performance by the SSO model using the high-integration UI, the data above confirm it. The table presents the mean time in seconds to detect, classify, and identify vessels under the two different UI conditions simulated. Average time-to-detect was about the same under both UIs. This was not surprising given that approximately the same percentage of all vessels in a scenario was detected under each UI condition. Large differences, however, were observed regarding vessel classification and identification times. The high-integration UI enabled classification times that were about half those of the low-integration UI. Identification times were about 40% faster.
UNCLAS | IMPRINT-CGTME Model: Notional Acquisition Problem | RDC | Brett et al. | Public | September 2011 28
UNCLAS | IMPRINT-CGTME Model: Notional Acquisition Problem | RDC | Brett et al. | Public | September 2011
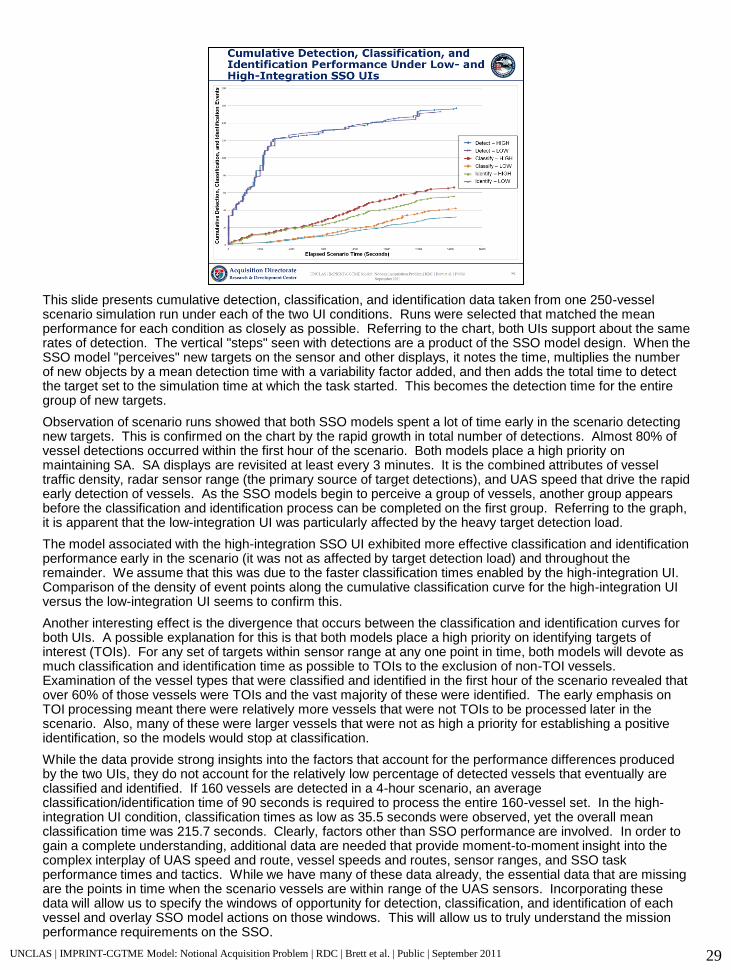
This slide presents cumulative detection, classification, and identification data taken from one 250-vessel scenario simulation run under each of the two UI conditions. Runs were selected that matched the mean performance for each condition as closely as possible. Referring to the chart, both UIs support about the same rates of detection. The vertical "steps" seen with detections are a product of the SSO model design. When the SSO model "perceives" new targets on the sensor and other displays, it notes the time, multiplies the number of new objects by a mean detection time with a variability factor added, and then adds the total time to detect the target set to the simulation time at which the task started. This becomes the detection time for the entire group of new targets.
Observation of scenario runs showed that both SSO models spent a lot of time early in the scenario detecting new targets. This is confirmed on the chart by the rapid growth in total number of detections. Almost 80% of vessel detections occurred within the first hour of the scenario. Both models place a high priority on maintaining SA. SA displays are revisited at least every 3 minutes. It is the combined attributes of vessel traffic density, radar sensor range (the primary source of target detections), and UAS speed that drive the rapid early detection of vessels. As the SSO models begin to perceive a group of vessels, another group appears before the classification and identification process can be completed on the first group. Referring to the graph, it is apparent that the low-integration UI was particularly affected by the heavy target detection load.
The model associated with the high-integration SSO UI exhibited more effective classification and identification performance early in the scenario (it was not as affected by target detection load) and throughout the remainder. We assume that this was due to the faster classification times enabled by the high-integration UI. Comparison of the density of event points along the cumulative classification curve for the high-integration UI versus the low-integration UI seems to confirm this.
Another interesting effect is the divergence that occurs between the classification and identification curves for both UIs. A possible explanation for this is that both models place a high priority on identifying targets of interest (TOIs). For any set of targets within sensor range at any one point in time, both models will devote as much classification and identification time as possible to TOIs to the exclusion of non-TOI vessels. Examination of the vessel types that were classified and identified in the first hour of the scenario revealed that over 60% of those vessels were TOIs and the vast majority of these were identified. The early emphasis on TOI processing meant there were relatively more vessels that were not TOIs to be processed later in the scenario. Also, many of these were larger vessels that were not as high a priority for establishing a positive identification, so the models would stop at classification.
While the data provide strong insights into the factors that account for the performance differences produced by the two UIs, they do not account for the relatively low percentage of detected vessels that eventually are classified and identified. If 160 vessels are detected in a 4-hour scenario, an average classification/identification time of 90 seconds is required to process the entire 160-vessel set. In the high-integration UI condition, classification times as low as 35.5 seconds were observed, yet the overall mean classification time was 215.7 seconds. Clearly, factors other than SSO performance are involved. In order to gain a complete understanding, additional data are needed that provide moment-to-moment insight into the complex interplay of UAS speed and route, vessel speeds and routes, sensor ranges, and SSO task performance times and tactics. While we have many of these data already, the essential data that are missing are the points in time when the scenario vessels are within range of the UAS sensors. Incorporating these data will allow us to specify the windows of opportunity for detection, classification, and identification of each vessel and overlay SSO model actions on those windows. This will allow us to truly understand the mission performance requirements on the SSO.
29
Based on the simulation results obtained, the high-integration SSO UI offers significant mission performance improvement over the original, low-integration design. Of course that conclusion is only as good as the implementation of the UI concept into the SSO model. In general, more detailed implementations of UI operations will lead to better representations of the performance impacts (and gains). Though not demonstrated in this study, model development often involves a round of tests and adjustments in which the modeler tweaks performance parameters based upon his/her understanding of human performance in the modeled context. The act of modeling is instructive in and of itself with regard to understanding the human capabilities, demands, and effects the model must embody. This understanding can lead to stronger UI designs as well as more rigorous models. Another reason for adjusting model parameters is to better understand performance bounds or limitations. If model performance changes dramatically around some parameter, the modeler needs to be especially sure there is a sound basis for selecting the parameter values. Because of the human performance is very context-dependent, it is desirable to obtain objective data on the performance of real humans in the context of interest. Virtual simulators are great sources of this data because they generally are controlled test environments with extensive data collection. Observation and measurement of operators employing similar real equipment/systems can be useful if a simulator is not available, but obtaining these data can be difficult. Prototyping is another means to gain insight into performance requirements associated with a UI. Though simple and somewhat crude, a PowerPoint–based prototype of the SSO high-integration interface was helpful in the development of that model. As we saw in the discussion of performance results obtained from the two SSO UI models, data from these models provided only one piece of the puzzle. While data from the models did support strong insight into factors driving the results, it did not definitively answer all questions. Additional data are required for that. The important lesson here is that human systems integration really is focused on understanding and enabling the human in the context of the broader system. To do this successfully, we need information and data on the mission environment and the physical system of interest, as well as the human, in order to obtain a clear picture of the demands the human must meet. Returning briefly to our notional acquisition problem, the PM was encouraged by the results obtained from the high-integration UI. He was not, however, satisfied. He wanted to obtain a threat identification rate greater than 90% in the 250-vessel scenario condition.
UNCLAS | IMPRINT-CGTME Model: Notional Acquisition Problem | RDC | Brett et al. | Public | September 2011 30
This section continues our notional acquisition problem. After reviewing the results of testing the high-integration SSO UI concept, the PM has directed his team to explore a way to further boost mission performance. One of his team members noted that the target prioritization scheme used in the high-integration UI was the same one used in the original low-integration UI. While incorporating the scheme into an algorithm and using it to rank targets on the Mission Object List reduced cognitive workload and SSO target prioritization time, she felt that another scheme might improve performance. She offered the alternative presented on the slide that follows. Beyond the notional acquisition problem, the assessment of alternative prioritization schemes provided here demonstrates another use for human performance modeling. It can be used to explore and refine tactics, CONOPs, and other employment doctrine and elements that are implemented by an operator to improve mission performance. In addition to testing the tactic, it also provides insight into potential impacts the tactic might have on operator performance (e.g., cognitive demands, workload issues, etc.). In a broader sense, the prioritization scheme test also shows how relatively small elements of the overall human-system can be isolated, manipulated, and evaluated to exploit high-payoff, performance-enhancement opportunities within the system.
UNCLAS | IMPRINT-CGTME Model: Notional Acquisition Problem | RDC | Brett et al. | Public | September 2011 31
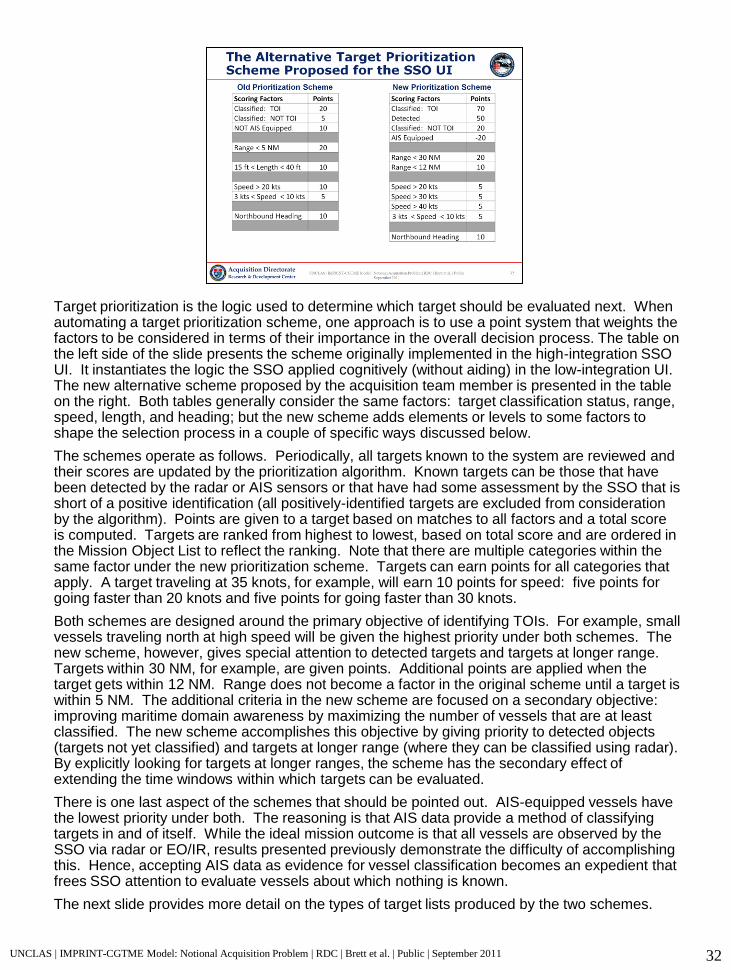
Target prioritization is the logic used to determine which target should be evaluated next. When automating a target prioritization scheme, one approach is to use a point system that weights the factors to be considered in terms of their importance in the overall decision process. The table on the left side of the slide presents the scheme originally implemented in the high-integration SSO UI. It instantiates the logic the SSO applied cognitively (without aiding) in the low-integration UI. The new alternative scheme proposed by the acquisition team member is presented in the table on the right. Both tables generally consider the same factors: target classification status, range, speed, length, and heading; but the new scheme adds elements or levels to some factors to shape the selection process in a couple of specific ways discussed below.
The schemes operate as follows. Periodically, all targets known to the system are reviewed and their scores are updated by the prioritization algorithm. Known targets can be those that have been detected by the radar or AIS sensors or that have had some assessment by the SSO that is short of a positive identification (all positively-identified targets are excluded from consideration by the algorithm). Points are given to a target based on matches to all factors and a total score is computed. Targets are ranked from highest to lowest, based on total score and are ordered in the Mission Object List to reflect the ranking. Note that there are multiple categories within the same factor under the new prioritization scheme. Targets can earn points for all categories that apply. A target traveling at 35 knots, for example, will earn 10 points for speed: five points for going faster than 20 knots and five points for going faster than 30 knots.
Both schemes are designed around the primary objective of identifying TOIs. For example, small vessels traveling north at high speed will be given the highest priority under both schemes. The new scheme, however, gives special attention to detected targets and targets at longer range. Targets within 30 NM, for example, are given points. Additional points are applied when the target gets within 12 NM. Range does not become a factor in the original scheme until a target is within 5 NM. The additional criteria in the new scheme are focused on a secondary objective: improving maritime domain awareness by maximizing the number of vessels that are at least classified. The new scheme accomplishes this objective by giving priority to detected objects (targets not yet classified) and targets at longer range (where they can be classified using radar). By explicitly looking for targets at longer ranges, the scheme has the secondary effect of extending the time windows within which targets can be evaluated.
There is one last aspect of the schemes that should be pointed out. AIS-equipped vessels have the lowest priority under both. The reasoning is that AIS data provide a method of classifying targets in and of itself. While the ideal mission outcome is that all vessels are observed by the SSO via radar or EO/IR, results presented previously demonstrate the difficulty of accomplishing this. Hence, accepting AIS data as evidence for vessel classification becomes an expedient that frees SSO attention to evaluate vessels about which nothing is known.
The next slide provides more detail on the types of target lists produced by the two schemes.
UNCLAS | IMPRINT-CGTME Model: Notional Acquisition Problem | RDC | Brett et al. | Public | September 2011 32
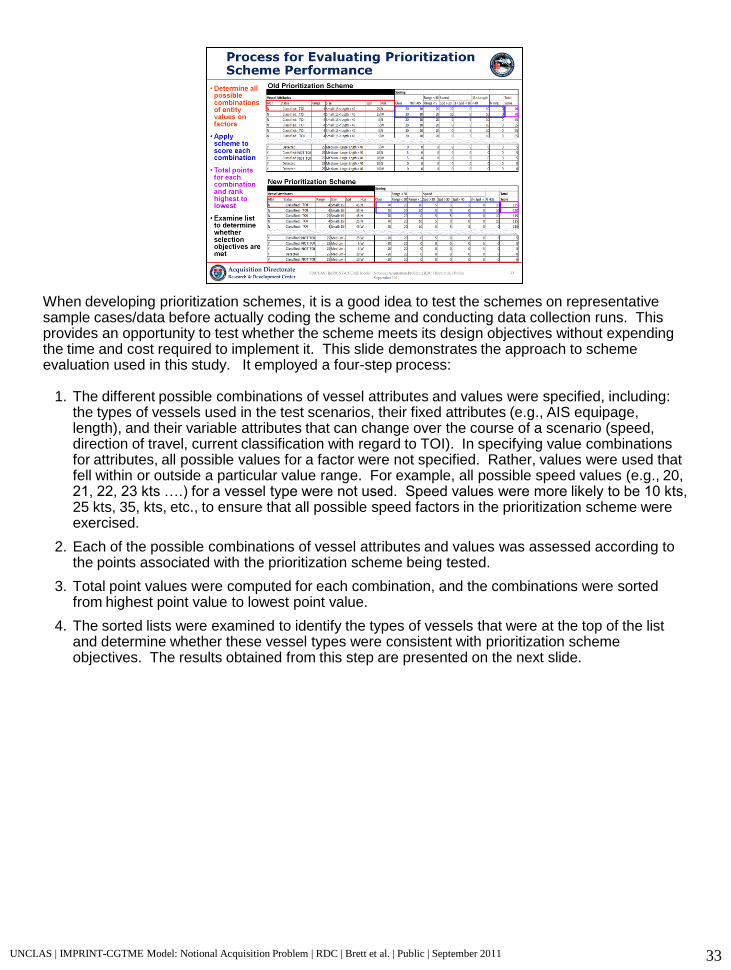
When developing prioritization schemes, it is a good idea to test the schemes on representative sample cases/data before actually coding the scheme and conducting data collection runs. This provides an opportunity to test whether the scheme meets its design objectives without expending the time and cost required to implement it. This slide demonstrates the approach to scheme evaluation used in this study. It employed a four-step process:
1. The different possible combinations of vessel attributes and values were specified, including: the types of vessels used in the test scenarios, their fixed attributes (e.g., AIS equipage, length), and their variable attributes that can change over the course of a scenario (speed, direction of travel, current classification with regard to TOI). In specifying value combinations for attributes, all possible values for a factor were not specified. Rather, values were used that fell within or outside a particular value range. For example, all possible speed values (e.g., 20, 21, 22, 23 kts ….) for a vessel type were not used. Speed values were more likely to be 10 kts, 25 kts, 35, kts, etc., to ensure that all possible speed factors in the prioritization scheme were exercised.
2. Each of the possible combinations of vessel attributes and values was assessed according to the points associated with the prioritization scheme being tested.
3. Total point values were computed for each combination, and the combinations were sorted from highest point value to lowest point value.
4. The sorted lists were examined to identify the types of vessels that were at the top of the list and determine whether these vessel types were consistent with prioritization scheme objectives. The results obtained from this step are presented on the next slide.
UNCLAS | IMPRINT-CGTME Model: Notional Acquisition Problem | RDC | Brett et al. | Public | September 2011 33
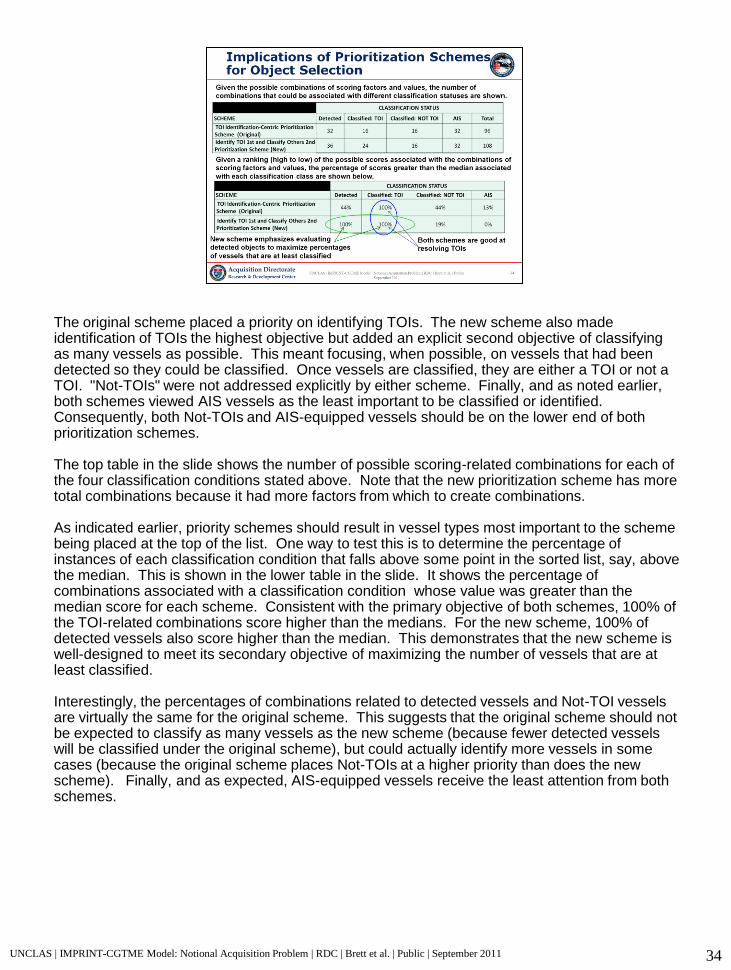
The original scheme placed a priority on identifying TOIs. The new scheme also made identification of TOIs the highest objective but added an explicit second objective of classifying as many vessels as possible. This meant focusing, when possible, on vessels that had been detected so they could be classified. Once vessels are classified, they are either a TOI or not a TOI. "Not-TOIs" were not addressed explicitly by either scheme. Finally, and as noted earlier, both schemes viewed AIS vessels as the least important to be classified or identified. Consequently, both Not-TOIs and AIS-equipped vessels should be on the lower end of both prioritization schemes. The top table in the slide shows the number of possible scoring-related combinations for each of the four classification conditions stated above. Note that the new prioritization scheme has more total combinations because it had more factors from which to create combinations. As indicated earlier, priority schemes should result in vessel types most important to the scheme being placed at the top of the list. One way to test this is to determine the percentage of instances of each classification condition that falls above some point in the sorted list, say, above the median. This is shown in the lower table in the slide. It shows the percentage of combinations associated with a classification condition whose value was greater than the median score for each scheme. Consistent with the primary objective of both schemes, 100% of the TOI-related combinations score higher than the medians. For the new scheme, 100% of detected vessels also score higher than the median. This demonstrates that the new scheme is well-designed to meet its secondary objective of maximizing the number of vessels that are at least classified. Interestingly, the percentages of combinations related to detected vessels and Not-TOI vessels are virtually the same for the original scheme. This suggests that the original scheme should not be expected to classify as many vessels as the new scheme (because fewer detected vessels will be classified under the original scheme), but could actually identify more vessels in some cases (because the original scheme places Not-TOIs at a higher priority than does the new scheme). Finally, and as expected, AIS-equipped vessels receive the least attention from both schemes.
UNCLAS | IMPRINT-CGTME Model: Notional Acquisition Problem | RDC | Brett et al. | Public | September 2011 34
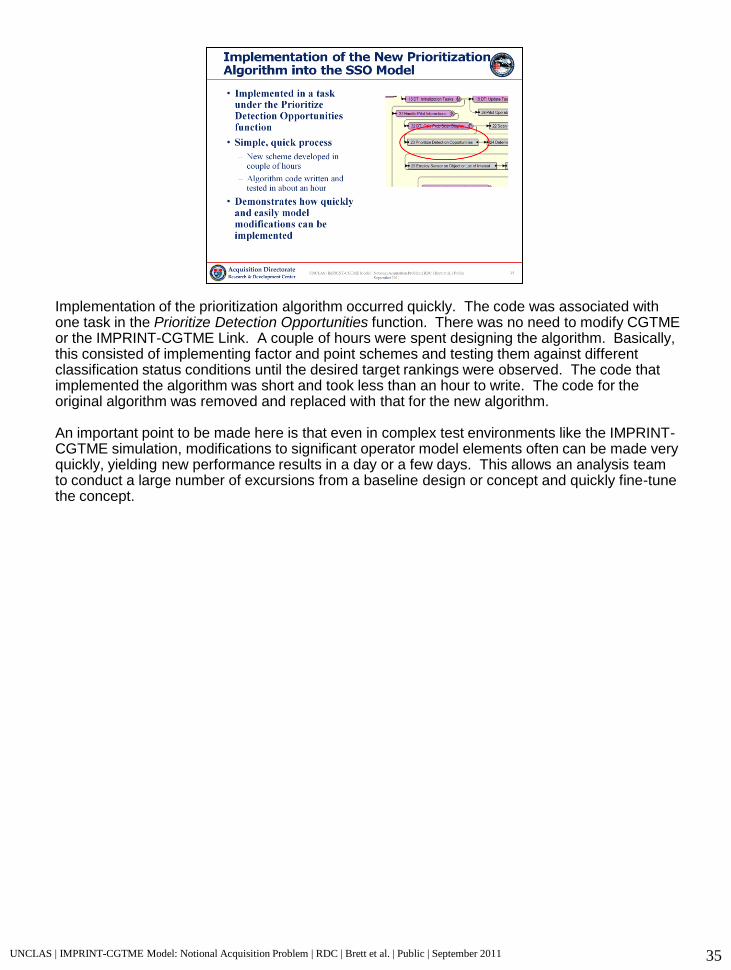
Implementation of the prioritization algorithm occurred quickly. The code was associated with one task in the Prioritize Detection Opportunities function. There was no need to modify CGTME or the IMPRINT-CGTME Link. A couple of hours were spent designing the algorithm. Basically, this consisted of implementing factor and point schemes and testing them against different classification status conditions until the desired target rankings were observed. The code that implemented the algorithm was short and took less than an hour to write. The code for the original algorithm was removed and replaced with that for the new algorithm. An important point to be made here is that even in complex test environments like the IMPRINT-CGTME simulation, modifications to significant operator model elements often can be made very quickly, yielding new performance results in a day or a few days. This allows an analysis team to conduct a large number of excursions from a baseline design or concept and quickly fine-tune the concept.
UNCLAS | IMPRINT-CGTME Model: Notional Acquisition Problem | RDC | Brett et al. | Public | September 2011 35
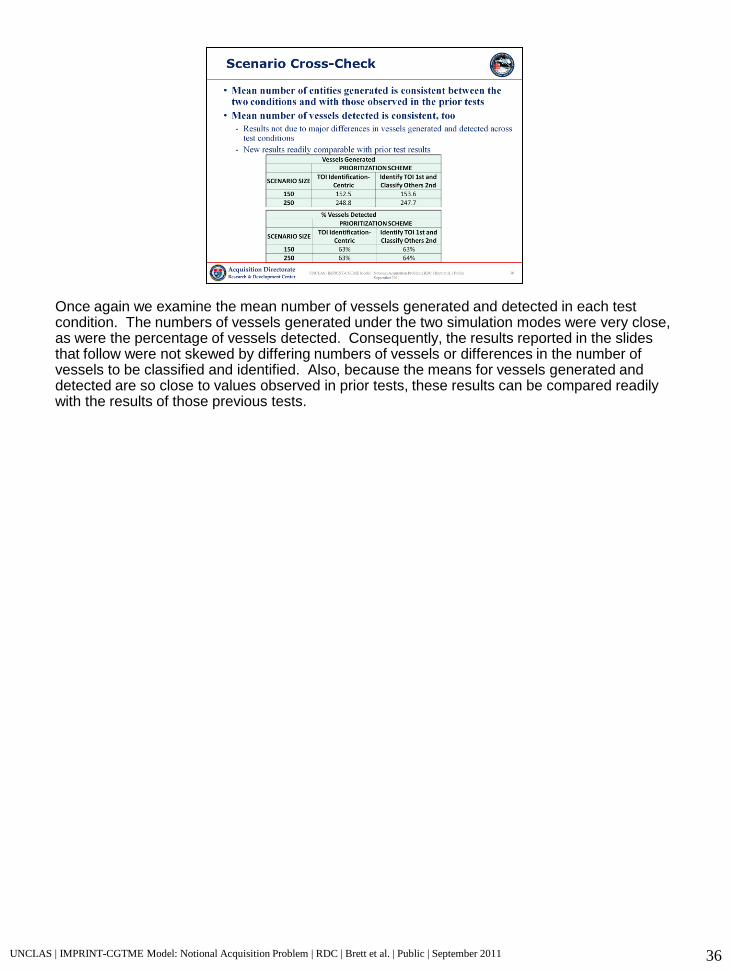
Once again we examine the mean number of vessels generated and detected in each test condition. The numbers of vessels generated under the two simulation modes were very close, as were the percentage of vessels detected. Consequently, the results reported in the slides that follow were not skewed by differing numbers of vessels or differences in the number of vessels to be classified and identified. Also, because the means for vessels generated and detected are so close to values observed in prior tests, these results can be compared readily with the results of those previous tests.
36 UNCLAS | IMPRINT-CGTME Model: Notional Acquisition Problem | RDC | Brett et al. | Public | September 2011
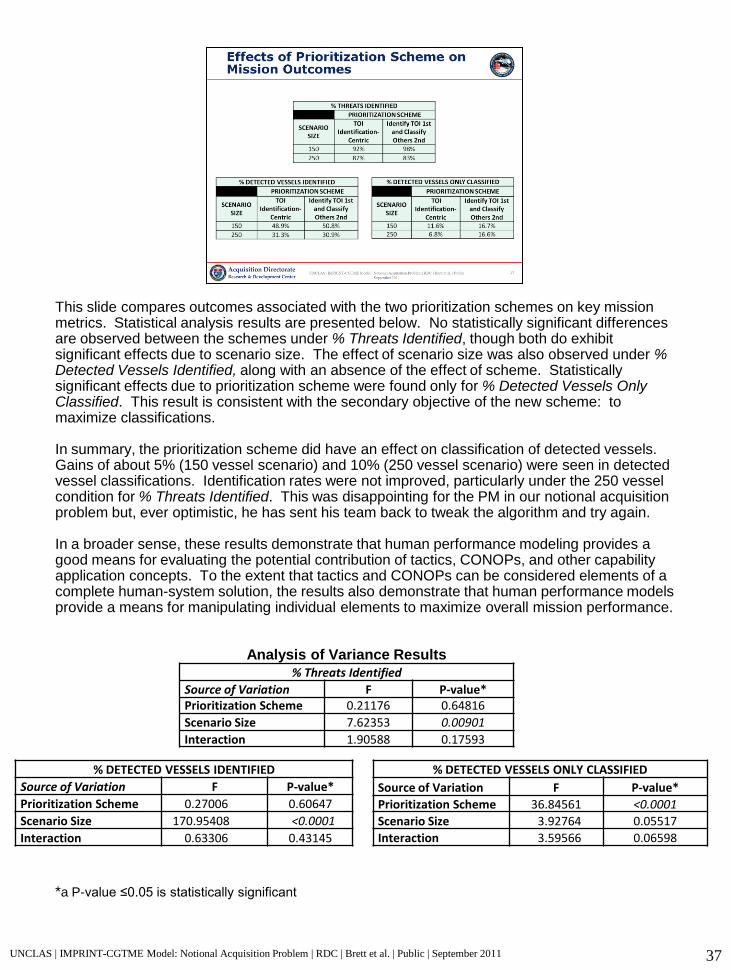
This slide compares outcomes associated with the two prioritization schemes on key mission metrics. Statistical analysis results are presented below. No statistically significant differences are observed between the schemes under % Threats Identified, though both do exhibit significant effects due to scenario size. The effect of scenario size was also observed under % Detected Vessels Identified, along with an absence of the effect of scheme. Statistically significant effects due to prioritization scheme were found only for % Detected Vessels Only Classified. This result is consistent with the secondary objective of the new scheme: to maximize classifications. In summary, the prioritization scheme did have an effect on classification of detected vessels. Gains of about 5% (150 vessel scenario) and 10% (250 vessel scenario) were seen in detected vessel classifications. Identification rates were not improved, particularly under the 250 vessel condition for % Threats Identified. This was disappointing for the PM in our notional acquisition problem but, ever optimistic, he has sent his team back to tweak the algorithm and try again. In a broader sense, these results demonstrate that human performance modeling provides a good means for evaluating the potential contribution of tactics, CONOPs, and other capability application concepts. To the extent that tactics and CONOPs can be considered elements of a complete human-system solution, the results also demonstrate that human performance models provide a means for manipulating individual elements to maximize overall mission performance. Analysis of Variance Results *a P-value ≤0.05 is statistically significant
UNCLAS | IMPRINT-CGTME Model: Notional Acquisition Problem | RDC | Brett et al. | Public | September 2011 37
% Threats Identified
Source of Variation F P-value* Prioritization Scheme 0.21176 0.64816
Scenario Size 7.62353 0.00901
Interaction 1.90588 0.17593
% DETECTED VESSELS IDENTIFIED
Source of Variation F P-value*
Prioritization Scheme 0.27006 0.60647
Scenario Size 170.95408 <0.0001
Interaction 0.63306 0.43145
% DETECTED VESSELS ONLY CLASSIFIED
Source of Variation F P-value*
Prioritization Scheme 36.84561 <0.0001
Scenario Size 3.92764 0.05517
Interaction 3.59566 0.06598
UNCLAS | IMPRINT-CGTME Model: Notional Acquisition Problem | RDC | Brett et al. | Public | September 2011 38
Conclusions
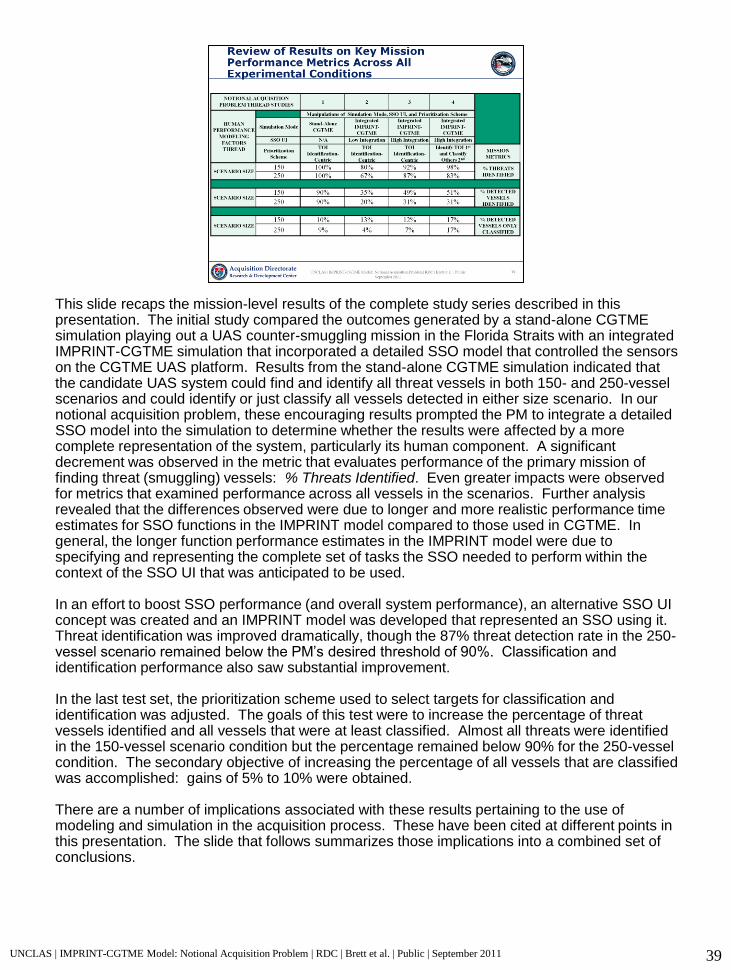
This slide recaps the mission-level results of the complete study series described in this presentation. The initial study compared the outcomes generated by a stand-alone CGTME simulation playing out a UAS counter-smuggling mission in the Florida Straits with an integrated IMPRINT-CGTME simulation that incorporated a detailed SSO model that controlled the sensors on the CGTME UAS platform. Results from the stand-alone CGTME simulation indicated that the candidate UAS system could find and identify all threat vessels in both 150- and 250-vessel scenarios and could identify or just classify all vessels detected in either size scenario. In our notional acquisition problem, these encouraging results prompted the PM to integrate a detailed SSO model into the simulation to determine whether the results were affected by a more complete representation of the system, particularly its human component. A significant decrement was observed in the metric that evaluates performance of the primary mission of finding threat (smuggling) vessels: % Threats Identified. Even greater impacts were observed for metrics that examined performance across all vessels in the scenarios. Further analysis revealed that the differences observed were due to longer and more realistic performance time estimates for SSO functions in the IMPRINT model compared to those used in CGTME. In general, the longer function performance estimates in the IMPRINT model were due to specifying and representing the complete set of tasks the SSO needed to perform within the context of the SSO UI that was anticipated to be used. In an effort to boost SSO performance (and overall system performance), an alternative SSO UI concept was created and an IMPRINT model was developed that represented an SSO using it. Threat identification was improved dramatically, though the 87% threat detection rate in the 250-vessel scenario remained below the PM’s desired threshold of 90%. Classification and identification performance also saw substantial improvement. In the last test set, the prioritization scheme used to select targets for classification and identification was adjusted. The goals of this test were to increase the percentage of threat vessels identified and all vessels that were at least classified. Almost all threats were identified in the 150-vessel scenario condition but the percentage remained below 90% for the 250-vessel condition. The secondary objective of increasing the percentage of all vessels that are classified was accomplished: gains of 5% to 10% were obtained. There are a number of implications associated with these results pertaining to the use of modeling and simulation in the acquisition process. These have been cited at different points in this presentation. The slide that follows summarizes those implications into a combined set of conclusions.
39 UNCLAS | IMPRINT-CGTME Model: Notional Acquisition Problem | RDC | Brett et al. | Public | September 2011
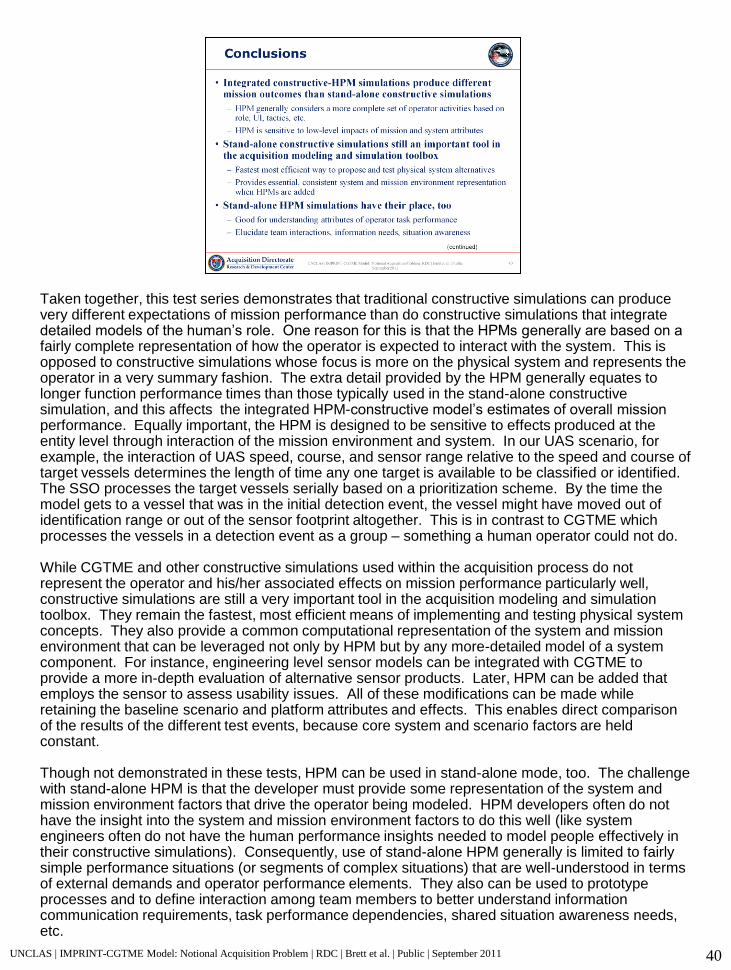
Taken together, this test series demonstrates that traditional constructive simulations can produce very different expectations of mission performance than do constructive simulations that integrate detailed models of the human’s role. One reason for this is that the HPMs generally are based on a fairly complete representation of how the operator is expected to interact with the system. This is opposed to constructive simulations whose focus is more on the physical system and represents the operator in a very summary fashion. The extra detail provided by the HPM generally equates to longer function performance times than those typically used in the stand-alone constructive simulation, and this affects the integrated HPM-constructive model’s estimates of overall mission performance. Equally important, the HPM is designed to be sensitive to effects produced at the entity level through interaction of the mission environment and system. In our UAS scenario, for example, the interaction of UAS speed, course, and sensor range relative to the speed and course of target vessels determines the length of time any one target is available to be classified or identified. The SSO processes the target vessels serially based on a prioritization scheme. By the time the model gets to a vessel that was in the initial detection event, the vessel might have moved out of identification range or out of the sensor footprint altogether. This is in contrast to CGTME which processes the vessels in a detection event as a group – something a human operator could not do. While CGTME and other constructive simulations used within the acquisition process do not represent the operator and his/her associated effects on mission performance particularly well, constructive simulations are still a very important tool in the acquisition modeling and simulation toolbox. They remain the fastest, most efficient means of implementing and testing physical system concepts. They also provide a common computational representation of the system and mission environment that can be leveraged not only by HPM but by any more-detailed model of a system component. For instance, engineering level sensor models can be integrated with CGTME to provide a more in-depth evaluation of alternative sensor products. Later, HPM can be added that employs the sensor to assess usability issues. All of these modifications can be made while retaining the baseline scenario and platform attributes and effects. This enables direct comparison of the results of the different test events, because core system and scenario factors are held constant. Though not demonstrated in these tests, HPM can be used in stand-alone mode, too. The challenge with stand-alone HPM is that the developer must provide some representation of the system and mission environment factors that drive the operator being modeled. HPM developers often do not have the insight into the system and mission environment factors to do this well (like system engineers often do not have the human performance insights needed to model people effectively in their constructive simulations). Consequently, use of stand-alone HPM generally is limited to fairly simple performance situations (or segments of complex situations) that are well-understood in terms of external demands and operator performance elements. They also can be used to prototype processes and to define interaction among team members to better understand information communication requirements, task performance dependencies, shared situation awareness needs, etc.
40 UNCLAS | IMPRINT-CGTME Model: Notional Acquisition Problem | RDC | Brett et al. | Public | September 2011
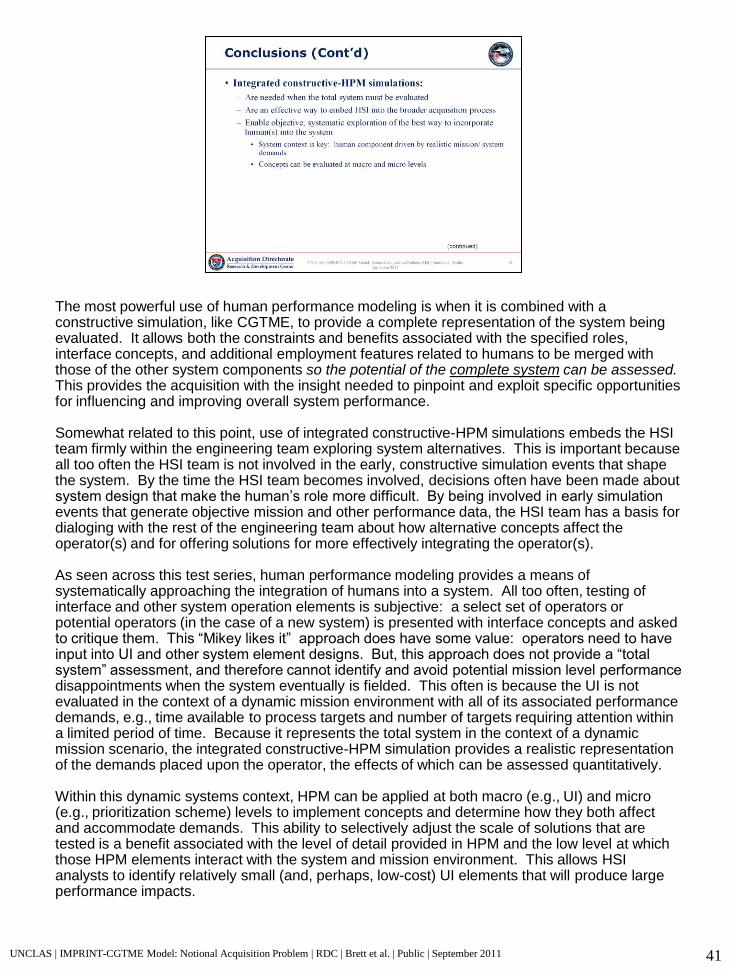
The most powerful use of human performance modeling is when it is combined with a constructive simulation, like CGTME, to provide a complete representation of the system being evaluated. It allows both the constraints and benefits associated with the specified roles, interface concepts, and additional employment features related to humans to be merged with those of the other system components so the potential of the complete system can be assessed. This provides the acquisition with the insight needed to pinpoint and exploit specific opportunities for influencing and improving overall system performance. Somewhat related to this point, use of integrated constructive-HPM simulations embeds the HSI team firmly within the engineering team exploring system alternatives. This is important because all too often the HSI team is not involved in the early, constructive simulation events that shape the system. By the time the HSI team becomes involved, decisions often have been made about system design that make the human’s role more difficult. By being involved in early simulation events that generate objective mission and other performance data, the HSI team has a basis for dialoging with the rest of the engineering team about how alternative concepts affect the operator(s) and for offering solutions for more effectively integrating the operator(s). As seen across this test series, human performance modeling provides a means of systematically approaching the integration of humans into a system. All too often, testing of interface and other system operation elements is subjective: a select set of operators or potential operators (in the case of a new system) is presented with interface concepts and asked to critique them. This “Mikey likes it” approach does have some value: operators need to have input into UI and other system element designs. But, this approach does not provide a “total system” assessment, and therefore cannot identify and avoid potential mission level performance disappointments when the system eventually is fielded. This often is because the UI is not evaluated in the context of a dynamic mission environment with all of its associated performance demands, e.g., time available to process targets and number of targets requiring attention within a limited period of time. Because it represents the total system in the context of a dynamic mission scenario, the integrated constructive-HPM simulation provides a realistic representation of the demands placed upon the operator, the effects of which can be assessed quantitatively. Within this dynamic systems context, HPM can be applied at both macro (e.g., UI) and micro (e.g., prioritization scheme) levels to implement concepts and determine how they both affect and accommodate demands. This ability to selectively adjust the scale of solutions that are tested is a benefit associated with the level of detail provided in HPM and the low level at which those HPM elements interact with the system and mission environment. This allows HSI analysts to identify relatively small (and, perhaps, low-cost) UI elements that will produce large performance impacts.
41 UNCLAS | IMPRINT-CGTME Model: Notional Acquisition Problem | RDC | Brett et al. | Public | September 2011
There is a cost associated with implementing an integrated HPM-constructive simulation environment. Generally, this involves creating an inter-simulation communications and timing management link and modifying the component simulations to interface with the link. This was done for the IMPRINT-CGTME simulation. Once that link has been created and the initial HPM and platform integration performed, future modifications to the HPM and other simulation components often can be done very rapidly and new test results obtained quickly. This enables rapid evolution of operator UI concepts towards an effective solution. Inevitably, there will be UI concepts, tactics, etc. that, when simulated, fail to meet performance requirements. Because of the nature of constructive simulation, these failures can be discarded, insights from the failure noted, and new alternatives proposed and tested rapidly and at relatively low cost. The idea is to fail early, when it does not cost much, and to use the knowledge and experience gained to keep improving the design of the human-system interface until we are sure we have an effective solution. This will help avoid the situation that occurs all too often in system acquisitions: we buy and field a system only to learn that it is difficult for our people to use, does not generate the performance we had hoped for, and is going to cost a lot of money to fix.
42 UNCLAS | IMPRINT-CGTME Model: Notional Acquisition Problem | RDC | Brett et al. | Public | September 2011
AIS automatic identification system ANOVA analysis of variance CGTME Coast Guard Tactical Modeling Environment CONOP concept of operations COP common operating picture COTS commercial-off-the-shelf CTS Core Tool Suite (as in GCAM-CTS) EO electro-optical (sensor) FOV field of view ft feet GCAM General Campaign Analysis Model HPM human performance model HSI human systems integration IMPRINT Improved Performance Research Integration Tool IR infrared (sensor) ISAR inverse synthetic aperture radar kts knots MALE medium altitude long endurance (type of UAS) MDA maritime domain awareness MMTI maritime moving target indicator (radar mode) MOE measure of effectiveness NM nautical mile PM Program Manager PPI plan position indicator (radar mode) RDC USCG Research & Development Center SA situation awareness SDCIP surveillance, detection, classification, identification, and prosecution sec seconds SME subject matter expert SPA Systems Planning and Analysis SSO sensor systems operator TOI target of interest UAS unmanned aerial system UDI unique deliverable identifier (RDC report number) UI user interface USCG United States Coast Guard
UNCLAS | IMPRINT-CGTME Model: Notional Acquisition Problem | RDC | Brett et al. | Public | September 2011 43