Embed Size (px)
Citation preview

RESEARCH ARTICLE
Integrating gastrocnemius force–length properties, in vivoactivation and operating lengths reveals how Anolis deal withecological challengesKathleen L. Foster*,‡ and Timothy E. Higham
ABSTRACTA central question in biology is how animals successfully behaveunder complex natural conditions. Although changes in locomotorbehaviour, motor control and force production in relation to incline arecommonly examined, a wide range of other factors, including a rangeof perch diameters, pervades arboreal habitats. Moving on differentsubstrate diameters requires considerable alteration of body and limbposture, probably causing significant shifts in the lengths of themuscle–tendon units powering locomotion. Thus, how substrateshape impacts in vivo muscle function remains an important butneglected question in ecophysiology. Here, we used high-speedvideography, electromyography, in situ contractile experiments andmorphology to examine gastrocnemius muscle function duringarboreal locomotion in the Cuban knight anole, Anolis equestris.The gastrocnemius contributes more to the propulsive effort on broadsurfaces than on narrow surfaces. Surprisingly, substrate inclinationaffected the relationship between the maximum potential force andfibre recruitment; the trade-off that was present between thesevariables on horizontal surfaces became a positive relationship oninclined surfaces. Finally, the biarticular nature of the gastrocnemiusallows it to generate force isometrically, regardless of substratediameter and incline, despite the fact that the tendons are incapableof stretching during cyclical locomotion. Our results emphasize theimportance of considering ecology andmuscle function together, andthe necessity of examining both mechanical and physiologicalproperties of muscles to understand how animals move in theirenvironment.
KEY WORDS: Muscle function, Anolis equestris, Arboreality,Electromyography, Tendon, In situ force–length curve
INTRODUCTIONHow animals function in their environment determines theirperformance at numerous tasks that are integral for survival(Foster et al., 2015; Irschick and Higham, 2016). The majority ofthese tasks, such as evading predators and capturing prey, requirelocomotion in highly heterogeneous environments. Theneuromuscular system, fundamental for powering locomotion,must, therefore, exhibit enough morphological, behavioural and/or
physiological flexibility to generate movement in the face of thesevarying conditions.
Muscle function can shift to allow animals to meet environmentaldemands over short time scales or through evolutionary changes inmorphology. For example, muscle moment arms are greater forthose species that commonly move on steep inclines (Zaaf et al.,1999; Herrel et al., 2008a,b), and muscles have longer fibres inspecies that rely on locomotor behaviours that require large limboscillations (Loeb and Gans, 1986; Biewener, 1998; Biewener andGillis, 1999; Daley and Biewener, 2003). Although the time scale ofsuch changes in morphology may be long, short-term alterations inmuscle activation and operating length can alter muscle forceproduction. Muscle recruitment may increase to meet an increaseddemand for muscle work (e.g. on an incline; Carlson-Kuhta et al.,1998; Gillis and Biewener, 2002; Daley and Biewener, 2003;Higham and Jayne, 2004; Foster and Higham, 2014) or the lengthsover which the muscle is generating force can change, impacting theamount of force and/or work it generates because of where it isactive on its force–length and/or force–velocity curves (e.g.Johnston, 1991; Roberts et al., 1997; Olson and Marsh, 1998;Gabaldón et al., 2004). Integrative studies examining the plasticityof neuromuscular function with changes in habitat structure oftenfocus on incline, but multiple things are likely to be changingsimultaneously, such as both perch diameter and incline. This isespecially the case for arboreal vertebrates.
Anolis are arboreal lizards that have repeatedly and rapidlyevolved ecomorphs that differ morphologically and behaviourallybased on the region of the arboreal environment in which theyspecialize (Losos, 1994, 2009). They are extremely adept at movingthrough the highly complex arboreal environment, and the shifts inlimb kinematics required for these animals to move on differentarboreal surfaces, particularly different diameter perches (Spezzanoand Jayne, 2004; Foster and Higham, 2012), suggest that shifts inmotor recruitment (Foster and Higham, 2014) and/or operatinglengths will be necessary for the maintenance of a given amount offorce. Although motor control has been examined recently (Fosterand Higham, 2014), other important aspects of muscle function (i.e.force production) have been neglected. This is probably due to therelatively small body size of Anolis, which precludes in vivomeasurements of muscle force.
Tendons can transfer force and store elastic energy via stretch andrecoil. However, small animals cannot take advantage of the latterbecause there is insufficient time to employ a catch mechanism andthe muscle forces and body mass are too small to deform the tendonwithout a catch mechanism (Biewener et al., 1981; Biewener andBlickhan, 1988; Pollock and Shadwick, 1994b; Astley and Roberts,2012). If tendons are incapable of deforming during cyclical, non-ballistic locomotion in Anolis lizards, then in vivomuscle length canbe inferred from 3D joint kinematics, as is done for fishes (Katz andReceived 17 October 2016; Accepted 8 December 2016
Department of Biology, University of California, 900 University Avenue, Riverside,CA 92521, USA.*Present address: Department of Biology, University of Ottawa, 30 Marie Curie,Ottawa, ON, Canada K1N 7N1.
‡Author for correspondence ([email protected])
K.L.F., 0000-0002-7365-7885
796
© 2017. Published by The Company of Biologists Ltd | Journal of Experimental Biology (2017) 220, 796-806 doi:10.1242/jeb.151795
Journal
ofEx
perim
entalB
iology
Shadwick, 1998; Shadwick et al., 1998; Donley and Shadwick,2003). In vivo muscle activation patterns and 3D joint kinematicscould then be linked to in situ force–length contractile properties.We first used the muscle and tendon of the gastrocnemius in
Anolis equestris to test whether tendons are capable of deformationduring cyclical locomotion using calculations based on dissectionsof hindlimb muscles and tendons as well as evidence derived fromin situ contractile experiments. Then, we combined 3D locomotorkinematics, in vivo muscle activation data and in situ force–lengthproperties to determine whether the gastrocnemius of small arborealanimals operates at or near the plateau of the force–length curve(FLC) and how its function shifts in the face of changes inenvironmental demand.The geometry of a broad surface means the position of the foot
(on top of the surface rather than on the side) should allow ankleextension to contribute more to propulsion than it would on anarrow surface (Foster and Higham, 2014). Therefore, we predictedthat, on broad surfaces, this greater propulsive contribution willoccur via increased gastrocnemius motor unit recruitment, activityoccurring at a length that results in greater force (i.e. optimalposition on the FLC), or a combination of the two. Further, weexpected to see a trade-off between potential force (force predictedby the in situ FLC) and muscle recruitment. We tested thesepredictions using a combination of high-speed videography,electromyography, in situ experiments and anatomical dissections.
MATERIALS AND METHODSSeven adult male Anolis equestris Merrem 1820 (mass 58.5±5.8 g;snout–vent length, SVL 14.3±0.5 cm) were purchased fromcommercial suppliers and housed in ∼38 l aquaria illuminatedwith 100 W incandescent and UVB lights for 12 h per day. Lizardswere provided with water ad libitum and fed crickets every day,except the day of experimentation. Experiments were conducted inaccordance with the University of California, Riverside AnimalCare and Use Protocol no. A-20140028.Individuals were used in a succession of four procedures that were
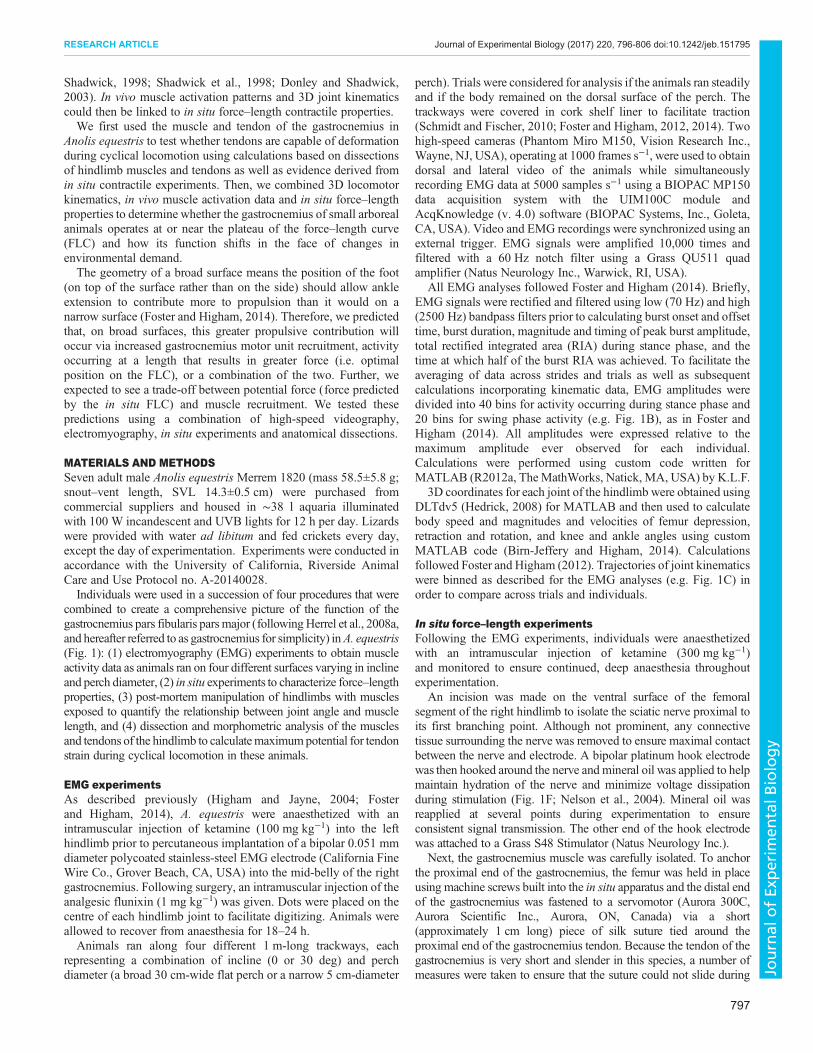
combined to create a comprehensive picture of the function of thegastrocnemius pars fibularis pars major (followingHerrel et al., 2008a,and hereafter referred to as gastrocnemius for simplicity) inA. equestris(Fig. 1): (1) electromyography (EMG) experiments to obtain muscleactivity data as animals ran on four different surfaces varying in inclineand perch diameter, (2) in situ experiments to characterize force–lengthproperties, (3) post-mortem manipulation of hindlimbs with musclesexposed to quantify the relationship between joint angle and musclelength, and (4) dissection and morphometric analysis of the musclesand tendons of the hindlimb to calculatemaximumpotential for tendonstrain during cyclical locomotion in these animals.
EMG experimentsAs described previously (Higham and Jayne, 2004; Fosterand Higham, 2014), A. equestris were anaesthetized with anintramuscular injection of ketamine (100 mg kg−1) into the lefthindlimb prior to percutaneous implantation of a bipolar 0.051 mmdiameter polycoated stainless-steel EMG electrode (California FineWire Co., Grover Beach, CA, USA) into the mid-belly of the rightgastrocnemius. Following surgery, an intramuscular injection of theanalgesic flunixin (1 mg kg−1) was given. Dots were placed on thecentre of each hindlimb joint to facilitate digitizing. Animals wereallowed to recover from anaesthesia for 18–24 h.Animals ran along four different 1 m-long trackways, each
representing a combination of incline (0 or 30 deg) and perchdiameter (a broad 30 cm-wide flat perch or a narrow 5 cm-diameter
perch). Trials were considered for analysis if the animals ran steadilyand if the body remained on the dorsal surface of the perch. Thetrackways were covered in cork shelf liner to facilitate traction(Schmidt and Fischer, 2010; Foster and Higham, 2012, 2014). Twohigh-speed cameras (Phantom Miro M150, Vision Research Inc.,Wayne, NJ, USA), operating at 1000 frames s−1, were used to obtaindorsal and lateral video of the animals while simultaneouslyrecording EMG data at 5000 samples s−1 using a BIOPAC MP150data acquisition system with the UIM100C module andAcqKnowledge (v. 4.0) software (BIOPAC Systems, Inc., Goleta,CA, USA). Video and EMG recordings were synchronized using anexternal trigger. EMG signals were amplified 10,000 times andfiltered with a 60 Hz notch filter using a Grass QU511 quadamplifier (Natus Neurology Inc., Warwick, RI, USA).
All EMG analyses followed Foster and Higham (2014). Briefly,EMG signals were rectified and filtered using low (70 Hz) and high(2500 Hz) bandpass filters prior to calculating burst onset and offsettime, burst duration, magnitude and timing of peak burst amplitude,total rectified integrated area (RIA) during stance phase, and thetime at which half of the burst RIA was achieved. To facilitate theaveraging of data across strides and trials as well as subsequentcalculations incorporating kinematic data, EMG amplitudes weredivided into 40 bins for activity occurring during stance phase and20 bins for swing phase activity (e.g. Fig. 1B), as in Foster andHigham (2014). All amplitudes were expressed relative to themaximum amplitude ever observed for each individual.Calculations were performed using custom code written forMATLAB (R2012a, TheMathWorks, Natick, MA, USA) by K.L.F.
3D coordinates for each joint of the hindlimb were obtained usingDLTdv5 (Hedrick, 2008) for MATLAB and then used to calculatebody speed and magnitudes and velocities of femur depression,retraction and rotation, and knee and ankle angles using customMATLAB code (Birn-Jeffery and Higham, 2014). Calculationsfollowed Foster and Higham (2012). Trajectories of joint kinematicswere binned as described for the EMG analyses (e.g. Fig. 1C) inorder to compare across trials and individuals.
In situ force–length experimentsFollowing the EMG experiments, individuals were anaesthetizedwith an intramuscular injection of ketamine (300 mg kg−1)and monitored to ensure continued, deep anaesthesia throughoutexperimentation.
An incision was made on the ventral surface of the femoralsegment of the right hindlimb to isolate the sciatic nerve proximal toits first branching point. Although not prominent, any connectivetissue surrounding the nerve was removed to ensure maximal contactbetween the nerve and electrode. A bipolar platinum hook electrodewas then hooked around the nerve and mineral oil was applied to helpmaintain hydration of the nerve and minimize voltage dissipationduring stimulation (Fig. 1F; Nelson et al., 2004). Mineral oil wasreapplied at several points during experimentation to ensureconsistent signal transmission. The other end of the hook electrodewas attached to a Grass S48 Stimulator (Natus Neurology Inc.).
Next, the gastrocnemius muscle was carefully isolated. To anchorthe proximal end of the gastrocnemius, the femur was held in placeusing machine screws built into the in situ apparatus and the distal endof the gastrocnemius was fastened to a servomotor (Aurora 300C,Aurora Scientific Inc., Aurora, ON, Canada) via a short(approximately 1 cm long) piece of silk suture tied around theproximal end of the gastrocnemius tendon. Because the tendon of thegastrocnemius is very short and slender in this species, a number ofmeasures were taken to ensure that the suture could not slide during
797
RESEARCH ARTICLE Journal of Experimental Biology (2017) 220, 796-806 doi:10.1242/jeb.151795
Journal
ofEx
perim
entalB
iology
100
80
40
2029
60
30 31 32 33 3428MTU length (mm)
Twitc
h is
omet
ric fo
rce
(% m
ax. f
orce
)
Servomotor Hook electrode
Join
t ang
le (d
eg) 120
90
30
60
Ankle
Knee
33
32
30
29
31
MTU
leng
th (m
m)
PF
(% m
ax.)
60
40
80
100
+
Muscle
TendonMax. tendon stress = max. force from muscle + body
tendon CSA
= max. tendon strainmax. tendon stress
Young’s modulus
PCSA� max. isometric stress = max. isometric force+
body weight
EM
G a
mpl
itude
(% m
ax.)
64
02
810
EMG electrode
A F
BG
C
D
E
H
Fig. 1. Schematic illustration of the methodology employed in this study, with example mean data from a representative Anolis equestris individualrunning on the horizontal, broad perch.EMG data were collected for the gastrocnemius (A,B) as the animal was filmed with high-speed video to obtain 3D jointangles (C). Calculations (D) based on dissections and confirmed with in situ experiments demonstrated that tendons were unlikely to stretch during running,enabling calculation of muscle–tendon unit (MTU) length from joint angles and muscle morphology data (E). In situ stimulation of the sciatic nerve enabledconstruction of a twitch force–length curve (FLC) for the gastrocnemius (F,G). Using this curve, MTU lengths during stance phase (red) and swing phase (blue)could be used to calculate the corresponding potential isometric force (H). Max., maximum; CSA, cross-sectional area; PCSA, physiological CSA; PF, potentialforce. Values are means±s.e.m.
798
RESEARCH ARTICLE Journal of Experimental Biology (2017) 220, 796-806 doi:10.1242/jeb.151795
Journal
ofEx
perim
entalB
iology
experimentation (verified with high-speed video). The majority of thecrus, along with all other distal limb muscles, was removed bysevering the limb just above the ankle and just below the knee after apiece of suturewas tied below the knee as a tourniquet to reduce bloodloss. Further, the weight at the distal end was minimized by removingall the toes of the foot. This arrangement meant that the ankle jointcould be used as an anchor, past which the suture fastened to the distalgastrocnemius could not slide. This also ensured that no other musclescould contract and interfere with the gastrocnemius during sciaticnerve stimulation. A small drop of contact cement was placed on theknot tied around the tendon to prevent the knot from loosening.Because the gastrocnemius of this species was too small for
sonomicrometry, the length of the muscle prior to each stimulationevent was measured using digital calipers (error±0.005 mm) and thelength during contraction was monitored using the Aurora dual-mode lever system. All force and length signals from the Auroralever system were sent to the same data acquisition system andsoftware used for EMG experiments.Before constructing an FLC for the gastrocnemius, the voltage at
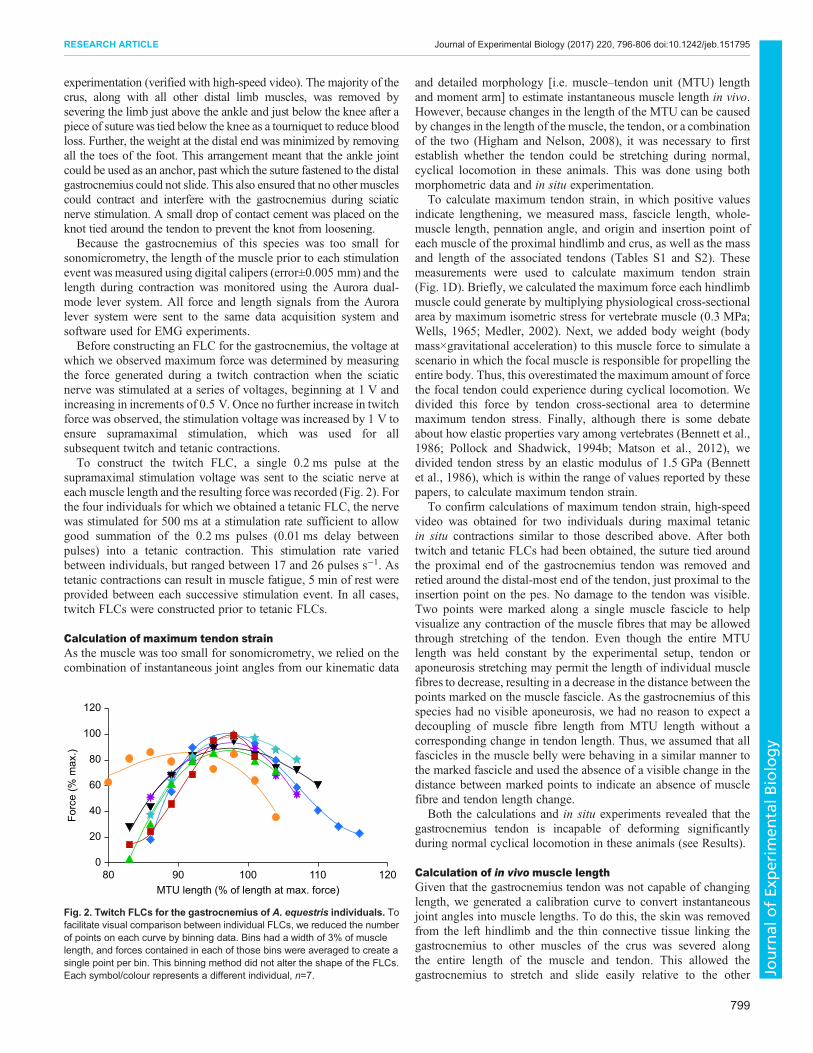
which we observed maximum force was determined by measuringthe force generated during a twitch contraction when the sciaticnerve was stimulated at a series of voltages, beginning at 1 V andincreasing in increments of 0.5 V. Once no further increase in twitchforce was observed, the stimulation voltage was increased by 1 V toensure supramaximal stimulation, which was used for allsubsequent twitch and tetanic contractions.To construct the twitch FLC, a single 0.2 ms pulse at the
supramaximal stimulation voltage was sent to the sciatic nerve ateach muscle length and the resulting forcewas recorded (Fig. 2). Forthe four individuals for which we obtained a tetanic FLC, the nervewas stimulated for 500 ms at a stimulation rate sufficient to allowgood summation of the 0.2 ms pulses (0.01 ms delay betweenpulses) into a tetanic contraction. This stimulation rate variedbetween individuals, but ranged between 17 and 26 pulses s−1. Astetanic contractions can result in muscle fatigue, 5 min of rest wereprovided between each successive stimulation event. In all cases,twitch FLCs were constructed prior to tetanic FLCs.
Calculation of maximum tendon strainAs the muscle was too small for sonomicrometry, we relied on thecombination of instantaneous joint angles from our kinematic data
and detailed morphology [i.e. muscle–tendon unit (MTU) lengthand moment arm] to estimate instantaneous muscle length in vivo.However, because changes in the length of the MTU can be causedby changes in the length of the muscle, the tendon, or a combinationof the two (Higham and Nelson, 2008), it was necessary to firstestablish whether the tendon could be stretching during normal,cyclical locomotion in these animals. This was done using bothmorphometric data and in situ experimentation.
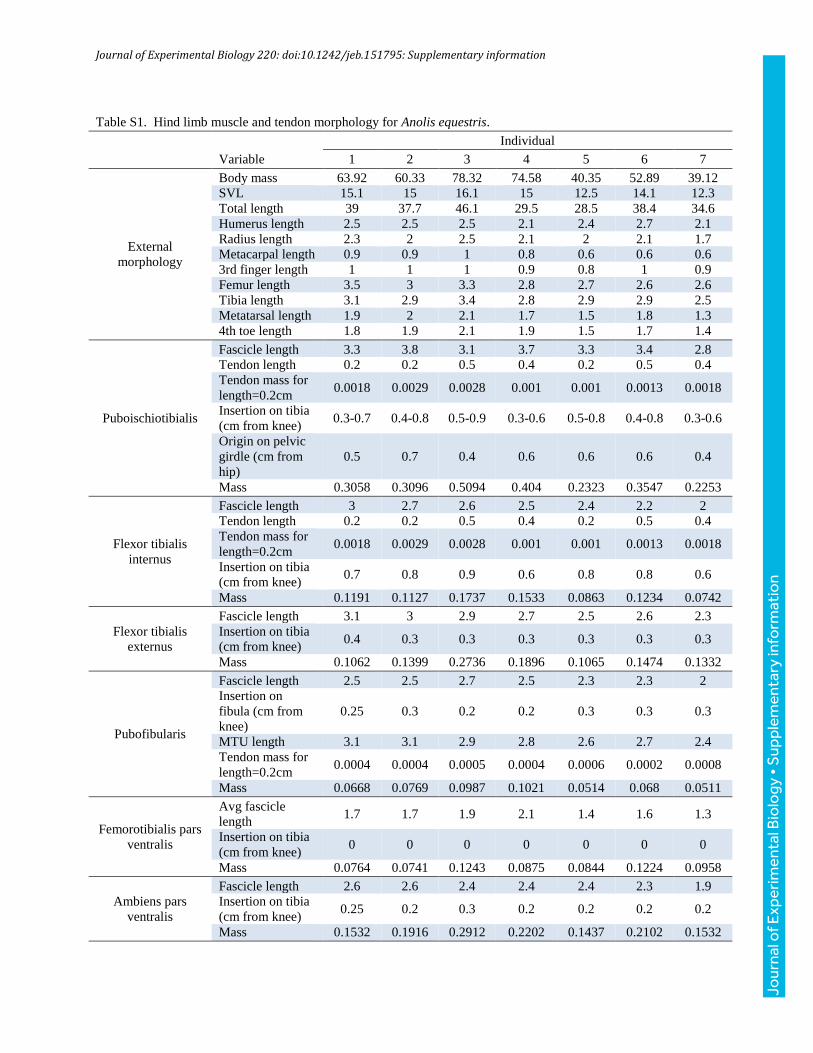
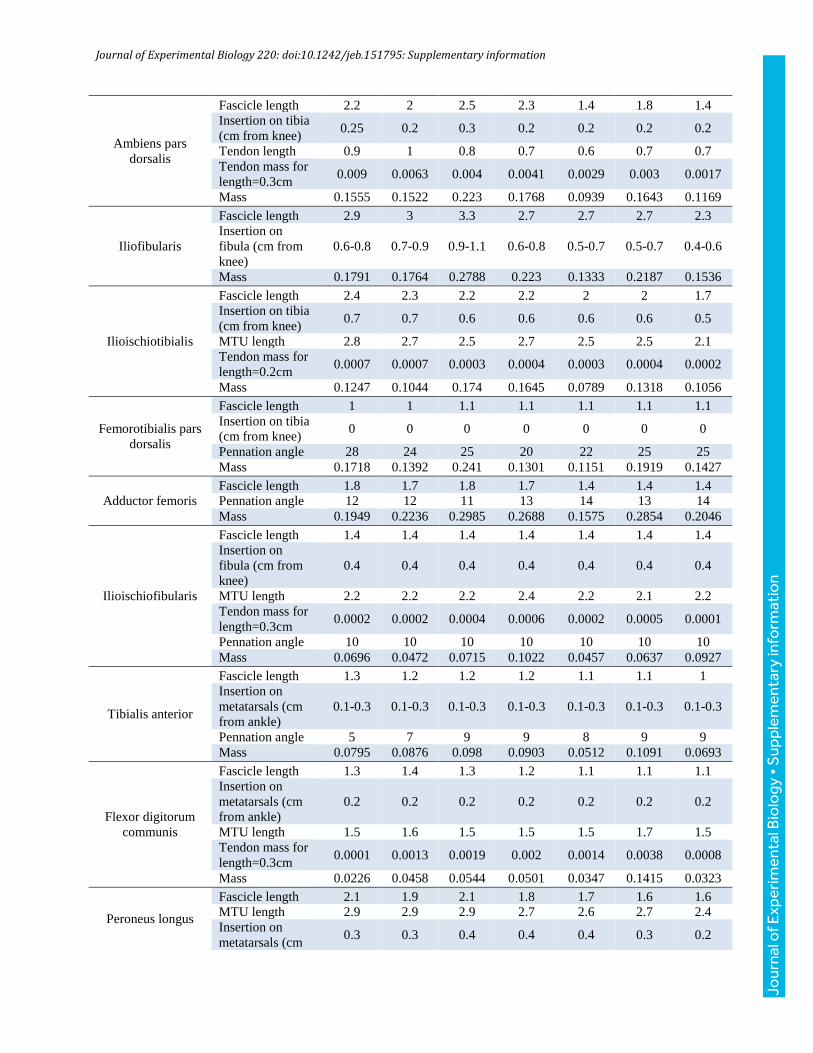
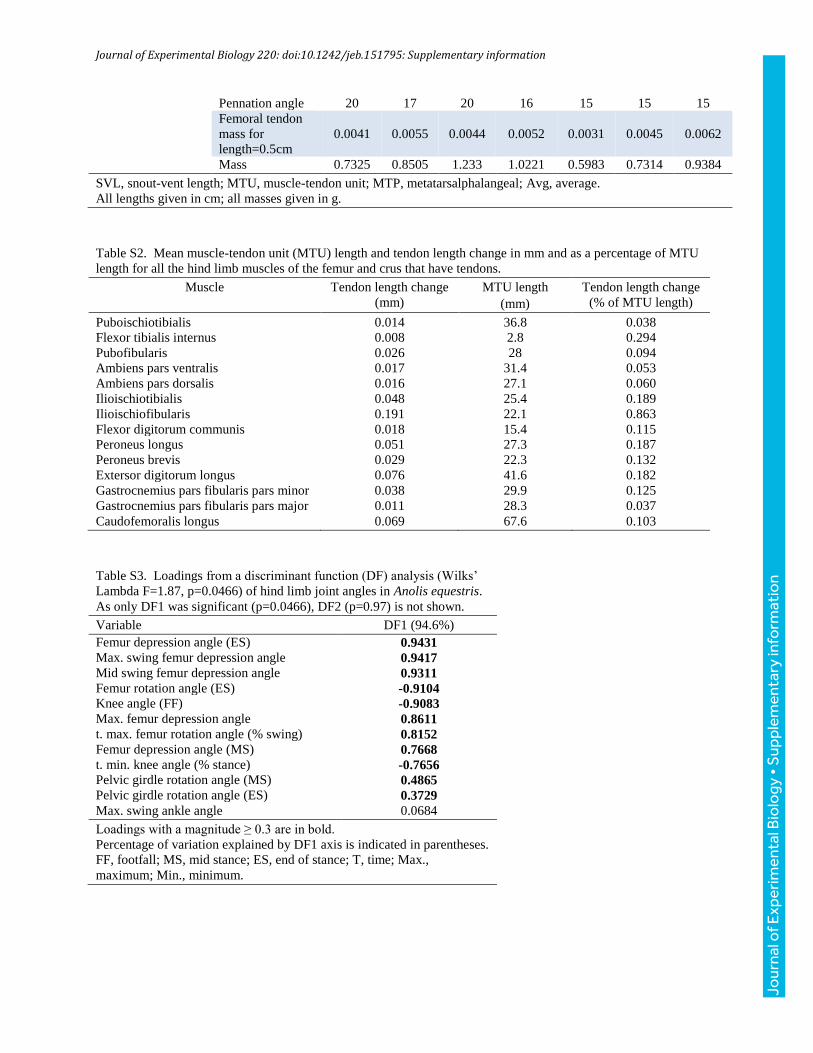
To calculate maximum tendon strain, in which positive valuesindicate lengthening, we measured mass, fascicle length, whole-muscle length, pennation angle, and origin and insertion point ofeach muscle of the proximal hindlimb and crus, as well as the massand length of the associated tendons (Tables S1 and S2). Thesemeasurements were used to calculate maximum tendon strain(Fig. 1D). Briefly, we calculated the maximum force each hindlimbmuscle could generate by multiplying physiological cross-sectionalarea by maximum isometric stress for vertebrate muscle (0.3 MPa;Wells, 1965; Medler, 2002). Next, we added body weight (bodymass×gravitational acceleration) to this muscle force to simulate ascenario in which the focal muscle is responsible for propelling theentire body. Thus, this overestimated the maximum amount of forcethe focal tendon could experience during cyclical locomotion. Wedivided this force by tendon cross-sectional area to determinemaximum tendon stress. Finally, although there is some debateabout how elastic properties vary among vertebrates (Bennett et al.,1986; Pollock and Shadwick, 1994b; Matson et al., 2012), wedivided tendon stress by an elastic modulus of 1.5 GPa (Bennettet al., 1986), which is within the range of values reported by thesepapers, to calculate maximum tendon strain.
To confirm calculations of maximum tendon strain, high-speedvideo was obtained for two individuals during maximal tetanicin situ contractions similar to those described above. After bothtwitch and tetanic FLCs had been obtained, the suture tied aroundthe proximal end of the gastrocnemius tendon was removed andretied around the distal-most end of the tendon, just proximal to theinsertion point on the pes. No damage to the tendon was visible.Two points were marked along a single muscle fascicle to helpvisualize any contraction of the muscle fibres that may be allowedthrough stretching of the tendon. Even though the entire MTUlength was held constant by the experimental setup, tendon oraponeurosis stretching may permit the length of individual musclefibres to decrease, resulting in a decrease in the distance between thepoints marked on the muscle fascicle. As the gastrocnemius of thisspecies had no visible aponeurosis, we had no reason to expect adecoupling of muscle fibre length from MTU length without acorresponding change in tendon length. Thus, we assumed that allfascicles in the muscle belly were behaving in a similar manner tothe marked fascicle and used the absence of a visible change in thedistance between marked points to indicate an absence of musclefibre and tendon length change.
Both the calculations and in situ experiments revealed that thegastrocnemius tendon is incapable of deforming significantlyduring normal cyclical locomotion in these animals (see Results).
Calculation of in vivo muscle lengthGiven that the gastrocnemius tendon was not capable of changinglength, we generated a calibration curve to convert instantaneousjoint angles into muscle lengths. To do this, the skin was removedfrom the left hindlimb and the thin connective tissue linking thegastrocnemius to other muscles of the crus was severed alongthe entire length of the muscle and tendon. This allowed thegastrocnemius to stretch and slide easily relative to the other
0
20
40
60
80
100
120
80 90 100 110 120
Forc
e (%
max
.)
MTU length (% of length at max. force)
Fig. 2. Twitch FLCs for the gastrocnemius of A. equestris individuals. Tofacilitate visual comparison between individual FLCs, we reduced the numberof points on each curve by binning data. Bins had a width of 3% of musclelength, and forces contained in each of those bins were averaged to create asingle point per bin. This binning method did not alter the shape of the FLCs.Each symbol/colour represents a different individual, n=7.
799
RESEARCH ARTICLE Journal of Experimental Biology (2017) 220, 796-806 doi:10.1242/jeb.151795
Journal
ofEx
perim
entalB
iology
muscles in the limb as the knee and ankle were manipulated. Theknee and ankle joints and origin and insertion points of thegastrocnemius muscle and tendon were painted with black nailpolish to facilitate visualization in videos. The limb wasmanipulated with forceps through the entire 3D range of hip, kneeand ankle angles normally observed during running in theseanimals. These manipulations were recorded with two high-speedvideo cameras and the resulting video was digitized as described forthe EMG analyses above. MTU length was calculated using acombination of the 3D coordinates of the joints and the muscle andtendon landmarks. Estimation of in vivo muscle length fromkinematics can be fraught with errors because of the ability of
skeletal structures to move relative to the skin (especially inmammals) and the potential for tendon strain to cause a decouplingbetween muscle length and MTU length. However, lizard skin issecurely anchored to the underlying skeletal structures at the joints(K.L.F., personal observation), reducing the potential for error inour calculations of muscle length to approximately the level that isseen in any kinematic study of lizard locomotion.
Because the gastrocnemius is biarticular, crossing both the kneeand ankle joints, a multiple regression was used to obtain thecalibration curve that converted the instantaneous knee and anklejoints from the video of the EMG trials into instantaneous musclelengths (Fig. 1E; custom MATLAB code written by K.L.F.). To
MTU
stra
in(%
rest
ing
leng
th)
64
02
810
–2
Horizontal
BroadNarrow
30 deg incline
30 deg incline, broad
EM
G a
mpl
itude
(% m
ax.)
Horizontal, broad
Horizontal, narrow
4
0
8
12
4
0
8
12
30 deg incline, narrow
60
50
40
30Broad Narrow
Sta
nce
RIA
(% m
ax.)
0 deg 30 deg
40
30
20
Max
. EM
G a
mpl
itude
of b
urst
1 (%
max
.)
0 deg 30 deg
10
5
0
–5
–10Tim
e of
max
. EM
G a
mpl
itude
of b
urst
1 (%
sta
nce
rel.
FF)
55
45
35
Tim
e of
max
. EM
G a
mpl
itude
of b
urst
2 (%
sta
nce
rel.
FF)
0 deg 30 deg
8
6
4
Max
. sta
nce
MTU
leng
thch
ange
(% re
stin
g le
ngth
)
Broad Narrow
100
80
60Max
. PF
of b
urst
1 (%
max
.)
Broad Narrow
A B
C D
E F
G H I
J K L
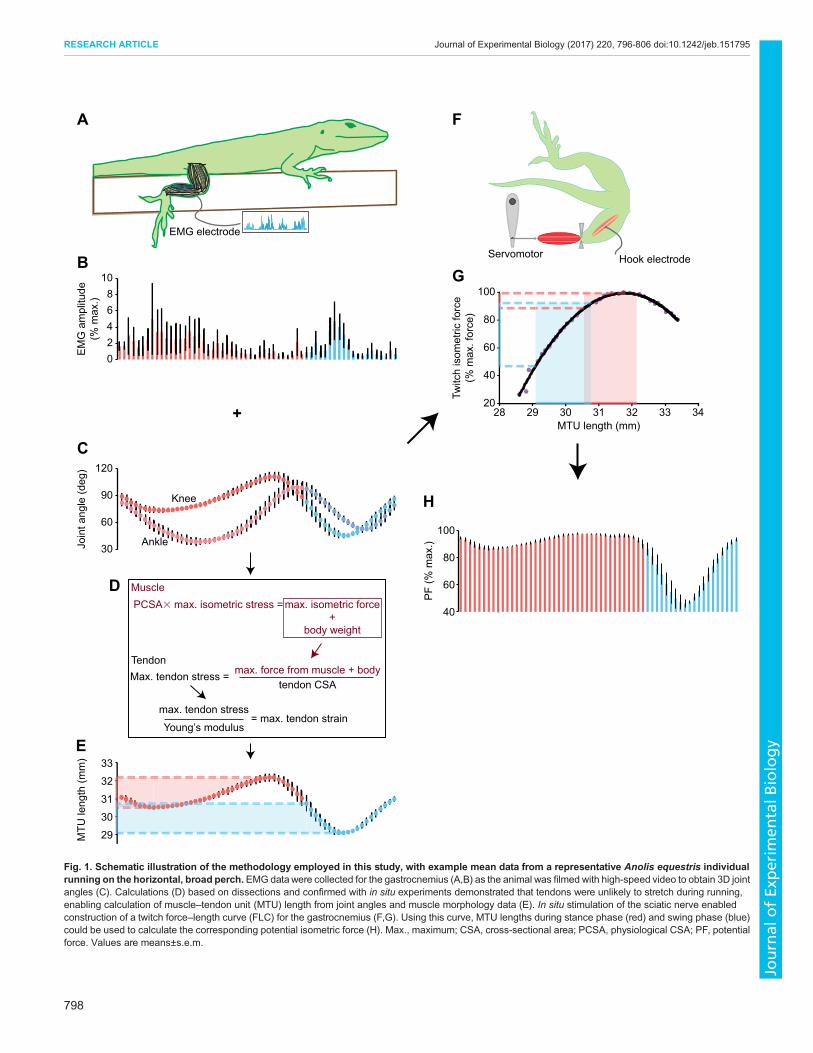
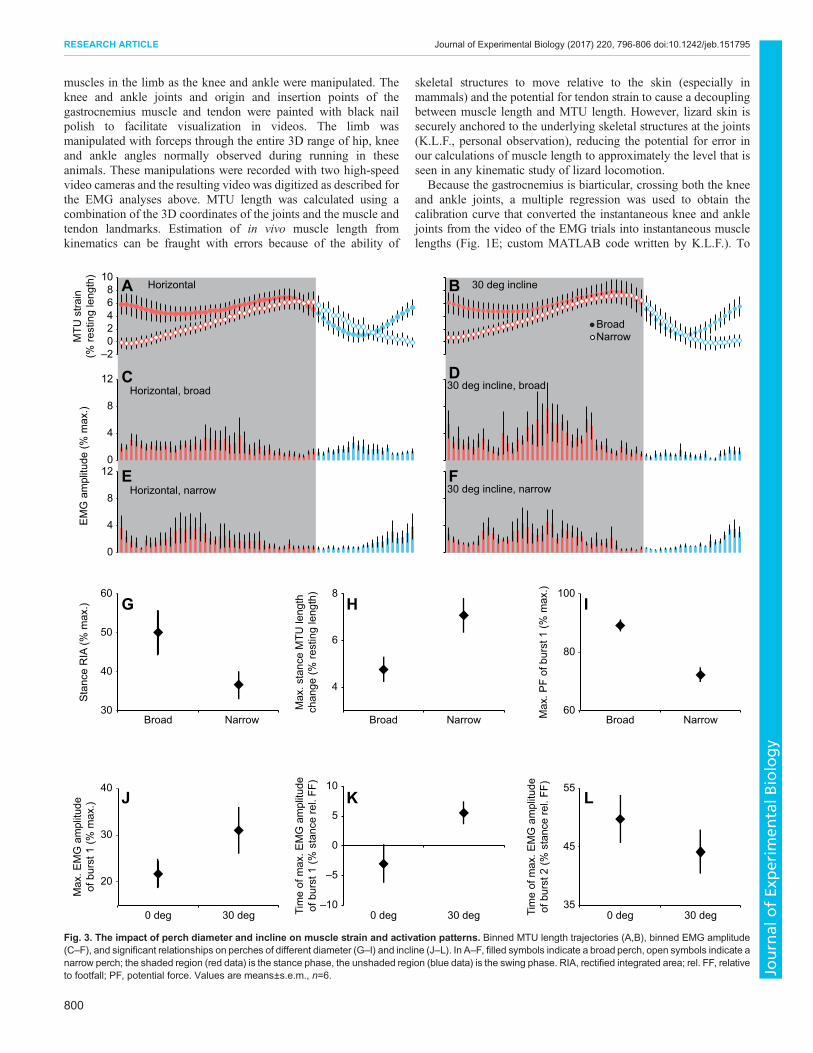
Fig. 3. The impact of perch diameter and incline on muscle strain and activation patterns. Binned MTU length trajectories (A,B), binned EMG amplitude(C–F), and significant relationships on perches of different diameter (G–I) and incline (J–L). In A–F, filled symbols indicate a broad perch, open symbols indicate anarrow perch; the shaded region (red data) is the stance phase, the unshaded region (blue data) is the swing phase. RIA, rectified integrated area; rel. FF, relativeto footfall; PF, potential force. Values are means±s.e.m., n=6.
800
RESEARCH ARTICLE Journal of Experimental Biology (2017) 220, 796-806 doi:10.1242/jeb.151795
Journal
ofEx
perim
entalB
iology
facilitate visual comparison of EMG amplitudes and instantaneousmuscle lengths, we generated binned trajectories of muscle strain asdescribed above (Fig. 3A,B). These muscle strain values wereexpressed as a percentage of resting muscle length, which wasdefined as the length of the muscle when the limb was positionedwith knee and ankle angles at 90 deg.
Calculation of potential forceWe defined potential force (PF) as the force that the gastrocnemiusmuscle could theoretically generate under isometric conditions asdefined by the twitch FLC. Although the muscle is most certainlyactive for more than the duration of a single twitch, and thus iscapable of generating greater total forces, the purpose of PF was notto calculate exact forces produced by the animals in vivo, but todetermine the relative potential to generate force in the differentconditions, with stimulation frequency and duration being equal.Further, although we generated tetanic FLCs as well, we viewed thetwitch curves as being more biologically relevant as tetaniccontractions are not observed in these animals during locomotion.We used the third-order polynomial that fitted the twitch FLC ofeach individual to calculate the PF that corresponded to any givenMTU length for that individual. This process is illustrated inFig. 1G, which shows the range of MTU lengths and correspondingPFs. These forces were then used to generate a trajectory of PFsthrough time (Fig. 1H). Finally, we used the onset and offset timesof EMG bursts to determine the portions of the twitch FLC thatcorresponded to periods of activity of the muscle (i.e. the activeportion of the FLC). From these regions, we identified the minimumand maximum PFs within each burst, as well as the minimum andmaximum PFs generated during both periods of activity.It is important to note that this PF calculation is highly dependent
on the position of the FLC. Both the magnitude of the forcesproduced and the length at which maximum force production occurson a given curve depend on the stimulation regime of the muscle.Not only do tetanic contractions achieve greater forces than twitchcontractions but also increases in stimulation frequency andintensity result in an increased optimum length in tetanic FLCs insome vertebrates (Rack and Westbury, 1969; Holt and Azizi, 2014,2016). Similarly, twitch curves can have considerably longer(∼40%) optimum lengths than tetanic curves (Holt and Azizi, 2014,2016), although this is not always the case (Rack and Westbury,
1969). As seen in several cats in the study by Rack and Westbury(1969), there was virtually no shift in the horizontal position of thetwitch and tetanic FLCs for the gastrocnemius muscles of ourlizards (∼5% of tetanic optimum length). This fact, coupled with thebiological relevance of twitch compared with tetanic contractions,led us to use the twitch FLCs for all PF calculations.
Statistical analysesPrior to all analyses, the role of speed (SVL s−1) was assessed byregressing it against all kinematic, EMG and force variables. We usedthe residuals of those variables thatwere significantly (r>0.15,P<0.01)impacted by speed. Principal component and discriminant functionanalyses used to analyse the kinematic data were performed in JMP(version11,SAS Institute Inc.,Cary,NC,USA).All otheranalyses (i.e.mixed-model analyses of variance, ANOVA) were performed withSYSTAT (version 13, Systat Software, Inc., San Jose, CA, USA).
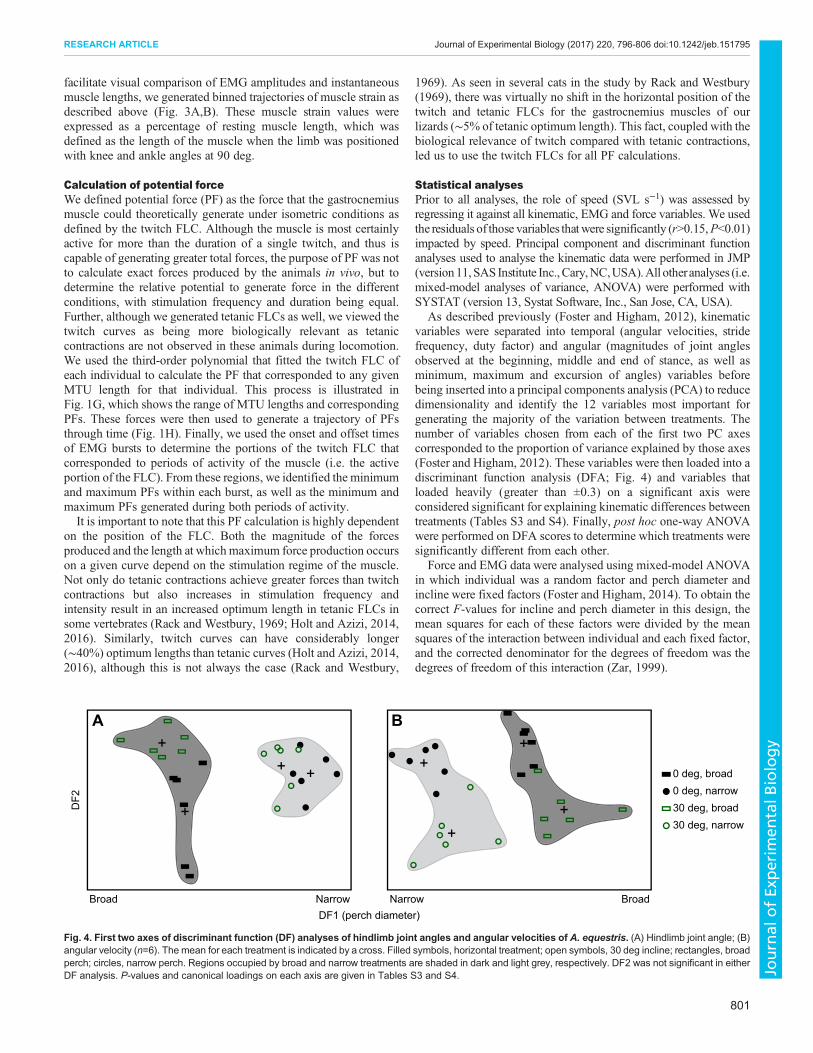
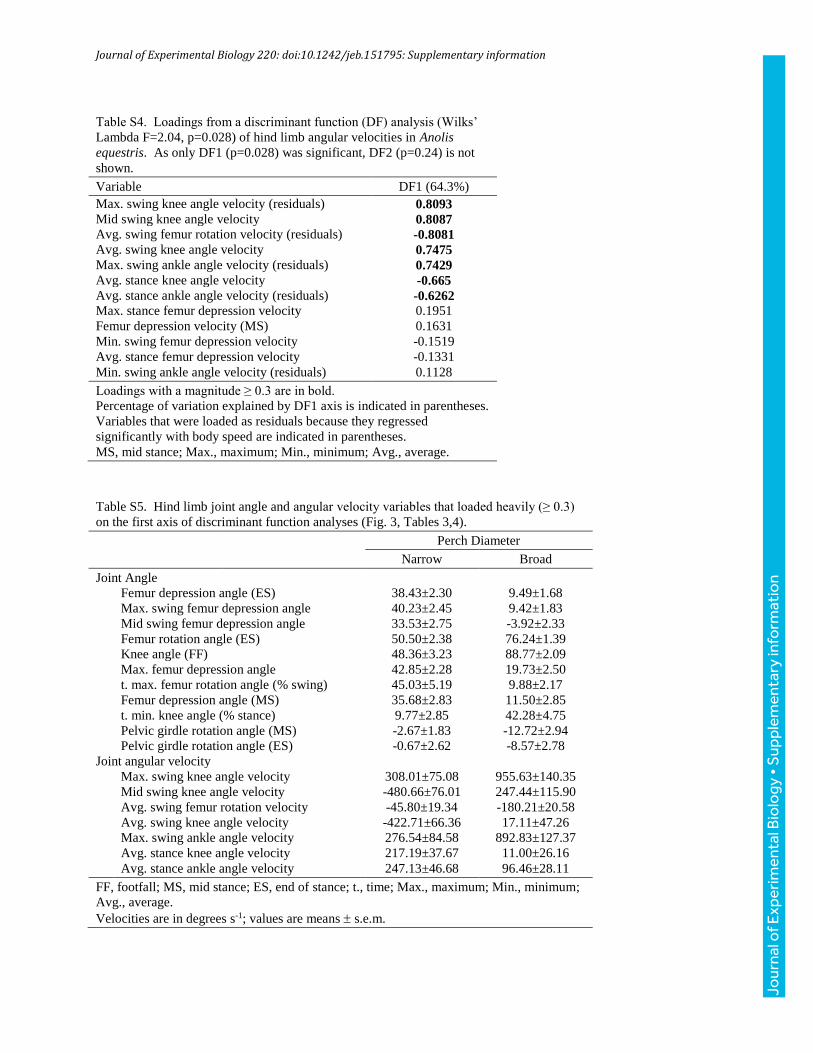
As described previously (Foster and Higham, 2012), kinematicvariables were separated into temporal (angular velocities, stridefrequency, duty factor) and angular (magnitudes of joint anglesobserved at the beginning, middle and end of stance, as well asminimum, maximum and excursion of angles) variables beforebeing inserted into a principal components analysis (PCA) to reducedimensionality and identify the 12 variables most important forgenerating the majority of the variation between treatments. Thenumber of variables chosen from each of the first two PC axescorresponded to the proportion of variance explained by those axes(Foster and Higham, 2012). These variables were then loaded into adiscriminant function analysis (DFA; Fig. 4) and variables thatloaded heavily (greater than ±0.3) on a significant axis wereconsidered significant for explaining kinematic differences betweentreatments (Tables S3 and S4). Finally, post hoc one-way ANOVAwere performed on DFA scores to determine which treatments weresignificantly different from each other.
Force and EMG data were analysed using mixed-model ANOVAin which individual was a random factor and perch diameter andincline were fixed factors (Foster and Higham, 2014). To obtain thecorrect F-values for incline and perch diameter in this design, themean squares for each of these factors were divided by the meansquares of the interaction between individual and each fixed factor,and the corrected denominator for the degrees of freedom was thedegrees of freedom of this interaction (Zar, 1999).
DF1 (perch diameter)
DF2
Broad Narrow Narrow Broad
0 deg, broad0 deg, narrow30 deg, broad30 deg, narrow
A B
Fig. 4. First two axes of discriminant function (DF) analyses of hindlimb joint angles and angular velocities of A. equestris. (A) Hindlimb joint angle; (B)angular velocity (n=6). The mean for each treatment is indicated by a cross. Filled symbols, horizontal treatment; open symbols, 30 deg incline; rectangles, broadperch; circles, narrow perch. Regions occupied by broad and narrow treatments are shaded in dark and light grey, respectively. DF2 was not significant in eitherDF analysis. P-values and canonical loadings on each axis are given in Tables S3 and S4.
801
RESEARCH ARTICLE Journal of Experimental Biology (2017) 220, 796-806 doi:10.1242/jeb.151795
Journal
ofEx
perim
entalB
iology
RESULTSChanges in kinematics with perch diameter and inclineFor both angular and velocity DFAs, only the first discriminant axis,which described perch diameter, was significant (Fig. 4; Tables S3and S4). Therefore, all significant changes in kinematics describedhere are associated with changes in perch diameter.The majority of the angular variables affected by changes in
perch diameter were associated with the proximal joints (Table S3).The pelvic girdle was less rotated and the femur was more depressedon the narrow perch than on the broad perch (Table S5). The femurrotated less and achieved its maximum long-axis rotation later inswing phase on the narrow perch than on the broad perch (Table S5).Further, maximum knee flexion occurred earlier in stance phase onthe narrow perch than on the broad perch (Table S5).Changes in joint angular velocities with perch diameter were
generally associated with the distal joints (Table S4). During stancephase, both the knee and the ankle extended faster on the narrowperch than on the broad perch (Table S5). The average angularvelocity of the knee during swing phase indicated that it wasgenerally extending (positive angular velocity) during recovery onthe broad perch but flexing (negative angular velocity) duringrecovery on the narrow perch (Table S5). Also, during swing phase,both ankle extension and femur long-axis rotation [in the counter-clockwise (i.e. negative) direction] occurred slower on the narrowperch than on the broad perch (Table S5).
Tendon function during cyclical locomotionThe most any hindlimb tendon could stretch during non-ballistic,cyclical locomotion in A. equestris is 0.191 mm, or 0.863% ofMTU length in the tendon of the ilioishiofibularis (Table S2). Incontrast, the tendon of the gastrocnemius, the focal muscle in thisstudy, could stretch only 0.037% of MTU length (Table S2),which reflects a maximum strain energy storage of0.000239 J kg−1 body mass. This is several orders of magnitudelower than the strain energy storage seen in the Tamar wallaby(0.1325 J kg−1 body mass; Biewener and Baudinette, 1995),which is known for using elastic energy storage for hopping.Further, for in situ experiments performed under conditions ofmaximal tetanic stimulation, high-speed video of a markedmuscle fascicle revealed no change in muscle fibre length ortendon length. Thus, neither the tendon of the gastrocnemius nor
any other hindlimb tendon is capable of deforming during cyclicallocomotion in A. equestris.
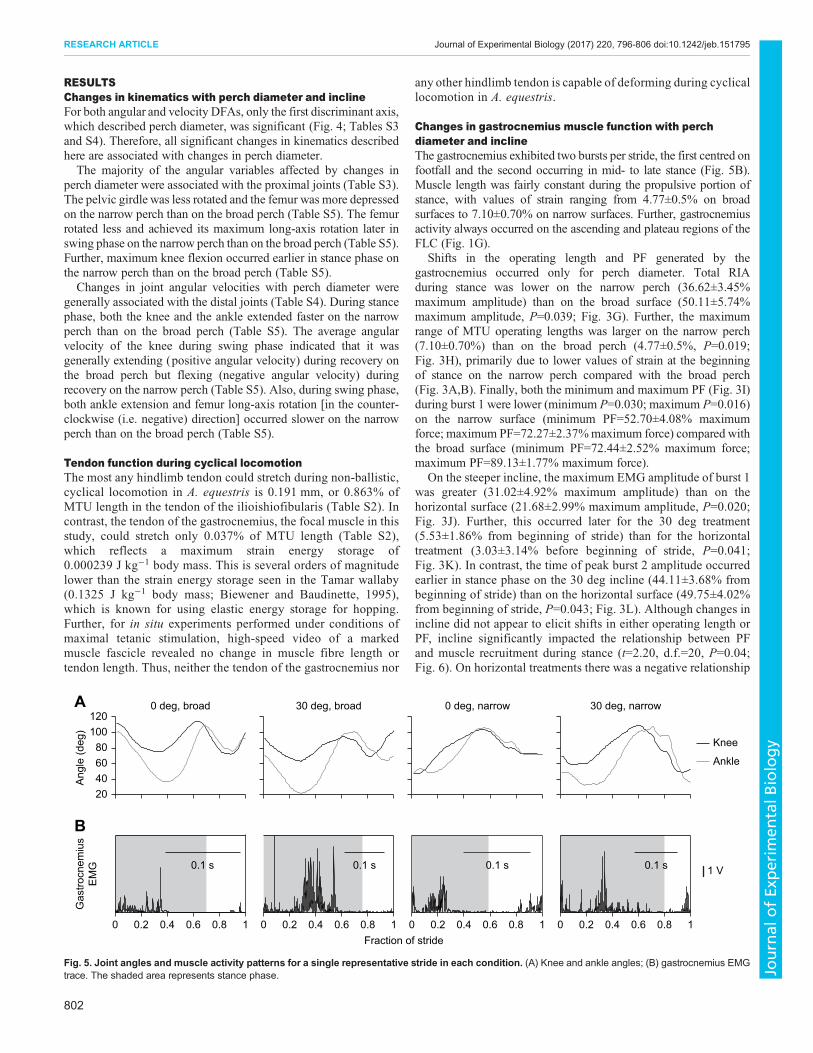
Changes in gastrocnemius muscle function with perchdiameter and inclineThe gastrocnemius exhibited two bursts per stride, the first centred onfootfall and the second occurring in mid- to late stance (Fig. 5B).Muscle length was fairly constant during the propulsive portion ofstance, with values of strain ranging from 4.77±0.5% on broadsurfaces to 7.10±0.70% on narrow surfaces. Further, gastrocnemiusactivity always occurred on the ascending and plateau regions of theFLC (Fig. 1G).
Shifts in the operating length and PF generated by thegastrocnemius occurred only for perch diameter. Total RIAduring stance was lower on the narrow perch (36.62±3.45%maximum amplitude) than on the broad surface (50.11±5.74%maximum amplitude, P=0.039; Fig. 3G). Further, the maximumrange of MTU operating lengths was larger on the narrow perch(7.10±0.70%) than on the broad perch (4.77±0.5%, P=0.019;Fig. 3H), primarily due to lower values of strain at the beginningof stance on the narrow perch compared with the broad perch(Fig. 3A,B). Finally, both the minimum and maximum PF (Fig. 3I)during burst 1 were lower (minimum P=0.030; maximum P=0.016)on the narrow surface (minimum PF=52.70±4.08% maximumforce; maximum PF=72.27±2.37%maximum force) compared withthe broad surface (minimum PF=72.44±2.52% maximum force;maximum PF=89.13±1.77% maximum force).
On the steeper incline, the maximum EMG amplitude of burst 1was greater (31.02±4.92% maximum amplitude) than on thehorizontal surface (21.68±2.99% maximum amplitude, P=0.020;Fig. 3J). Further, this occurred later for the 30 deg treatment(5.53±1.86% from beginning of stride) than for the horizontaltreatment (3.03±3.14% before beginning of stride, P=0.041;Fig. 3K). In contrast, the time of peak burst 2 amplitude occurredearlier in stance phase on the 30 deg incline (44.11±3.68% frombeginning of stride) than on the horizontal surface (49.75±4.02%from beginning of stride, P=0.043; Fig. 3L). Although changes inincline did not appear to elicit shifts in either operating length orPF, incline significantly impacted the relationship between PFand muscle recruitment during stance (t=2.20, d.f.=20, P=0.04;Fig. 6). On horizontal treatments there was a negative relationship
20406080
100120
0 deg, broad
Ang
le (d
eg)
0 0.2 0.4 0.6 0.8 1
Knee
Ankle
30 deg, broad 0 deg, narrow 30 deg, narrow
1 V0.1 s 0.1 s 0.1 s 0.1 s
Gas
trocn
emiu
sE
MG
0 0.2 0.4 0.6 0.8 1Fraction of stride
0 0.2 0.4 0.6 0.8 1 0 0.2 0.4 0.6 0.8 1
A
B
Fig. 5. Joint angles and muscle activity patterns for a single representative stride in each condition. (A) Knee and ankle angles; (B) gastrocnemius EMGtrace. The shaded area represents stance phase.
802
RESEARCH ARTICLE Journal of Experimental Biology (2017) 220, 796-806 doi:10.1242/jeb.151795
Journal
ofEx
perim
entalB
iology
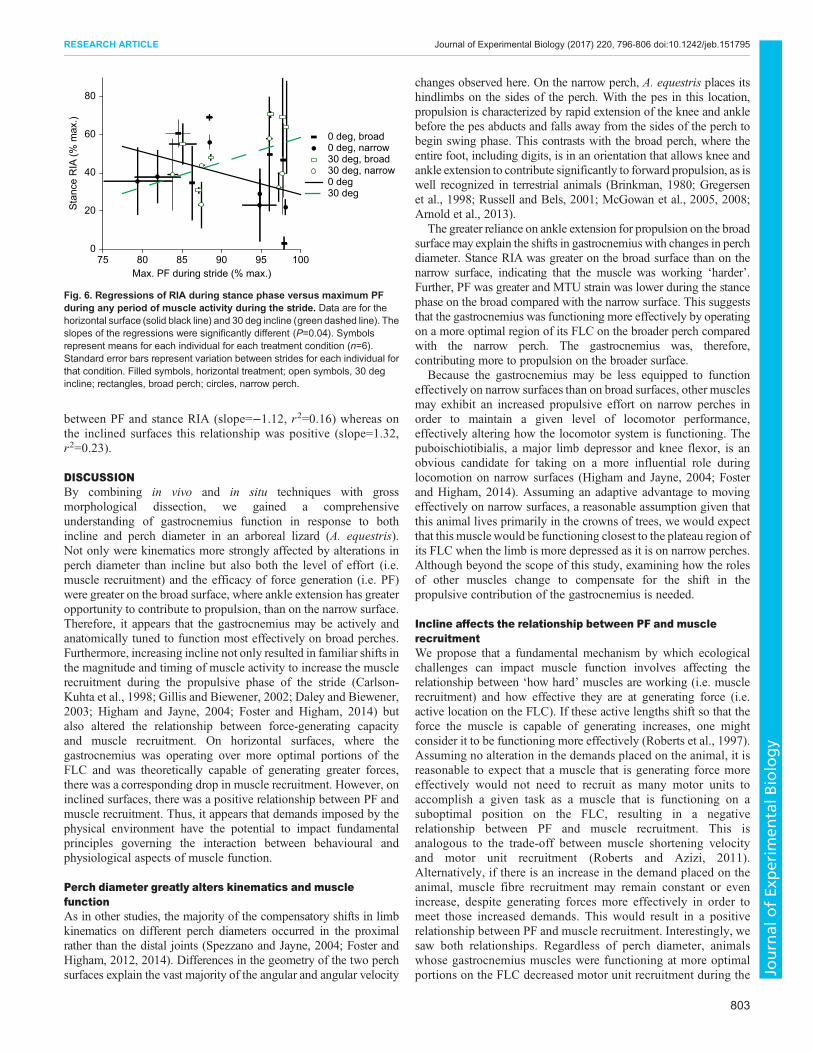
between PF and stance RIA (slope=−1.12, r2=0.16) whereas onthe inclined surfaces this relationship was positive (slope=1.32,r2=0.23).
DISCUSSIONBy combining in vivo and in situ techniques with grossmorphological dissection, we gained a comprehensiveunderstanding of gastrocnemius function in response to bothincline and perch diameter in an arboreal lizard (A. equestris).Not only were kinematics more strongly affected by alterations inperch diameter than incline but also both the level of effort (i.e.muscle recruitment) and the efficacy of force generation (i.e. PF)were greater on the broad surface, where ankle extension has greateropportunity to contribute to propulsion, than on the narrow surface.Therefore, it appears that the gastrocnemius may be actively andanatomically tuned to function most effectively on broad perches.Furthermore, increasing incline not only resulted in familiar shifts inthe magnitude and timing of muscle activity to increase the musclerecruitment during the propulsive phase of the stride (Carlson-Kuhta et al., 1998; Gillis and Biewener, 2002; Daley and Biewener,2003; Higham and Jayne, 2004; Foster and Higham, 2014) butalso altered the relationship between force-generating capacityand muscle recruitment. On horizontal surfaces, where thegastrocnemius was operating over more optimal portions of theFLC and was theoretically capable of generating greater forces,there was a corresponding drop in muscle recruitment. However, oninclined surfaces, there was a positive relationship between PF andmuscle recruitment. Thus, it appears that demands imposed by thephysical environment have the potential to impact fundamentalprinciples governing the interaction between behavioural andphysiological aspects of muscle function.
Perch diameter greatly alters kinematics and musclefunctionAs in other studies, the majority of the compensatory shifts in limbkinematics on different perch diameters occurred in the proximalrather than the distal joints (Spezzano and Jayne, 2004; Foster andHigham, 2012, 2014). Differences in the geometry of the two perchsurfaces explain the vast majority of the angular and angular velocity
changes observed here. On the narrow perch, A. equestris places itshindlimbs on the sides of the perch. With the pes in this location,propulsion is characterized by rapid extension of the knee and anklebefore the pes abducts and falls away from the sides of the perch tobegin swing phase. This contrasts with the broad perch, where theentire foot, including digits, is in an orientation that allows knee andankle extension to contribute significantly to forward propulsion, as iswell recognized in terrestrial animals (Brinkman, 1980; Gregersenet al., 1998; Russell and Bels, 2001; McGowan et al., 2005, 2008;Arnold et al., 2013).
The greater reliance on ankle extension for propulsion on the broadsurface may explain the shifts in gastrocnemius with changes in perchdiameter. Stance RIA was greater on the broad surface than on thenarrow surface, indicating that the muscle was working ‘harder’.Further, PF was greater and MTU strain was lower during the stancephase on the broad compared with the narrow surface. This suggeststhat the gastrocnemius was functioning more effectively by operatingon a more optimal region of its FLC on the broader perch comparedwith the narrow perch. The gastrocnemius was, therefore,contributing more to propulsion on the broader surface.
Because the gastrocnemius may be less equipped to functioneffectively on narrow surfaces than on broad surfaces, other musclesmay exhibit an increased propulsive effort on narrow perches inorder to maintain a given level of locomotor performance,effectively altering how the locomotor system is functioning. Thepuboischiotibialis, a major limb depressor and knee flexor, is anobvious candidate for taking on a more influential role duringlocomotion on narrow surfaces (Higham and Jayne, 2004; Fosterand Higham, 2014). Assuming an adaptive advantage to movingeffectively on narrow surfaces, a reasonable assumption given thatthis animal lives primarily in the crowns of trees, we would expectthat this musclewould be functioning closest to the plateau region ofits FLC when the limb is more depressed as it is on narrow perches.Although beyond the scope of this study, examining how the rolesof other muscles change to compensate for the shift in thepropulsive contribution of the gastrocnemius is needed.
Incline affects the relationship between PF and musclerecruitmentWe propose that a fundamental mechanism by which ecologicalchallenges can impact muscle function involves affecting therelationship between ‘how hard’ muscles are working (i.e. musclerecruitment) and how effective they are at generating force (i.e.active location on the FLC). If these active lengths shift so that theforce the muscle is capable of generating increases, one mightconsider it to be functioning more effectively (Roberts et al., 1997).Assuming no alteration in the demands placed on the animal, it isreasonable to expect that a muscle that is generating force moreeffectively would not need to recruit as many motor units toaccomplish a given task as a muscle that is functioning on asuboptimal position on the FLC, resulting in a negativerelationship between PF and muscle recruitment. This isanalogous to the trade-off between muscle shortening velocityand motor unit recruitment (Roberts and Azizi, 2011).Alternatively, if there is an increase in the demand placed on theanimal, muscle fibre recruitment may remain constant or evenincrease, despite generating forces more effectively in order tomeet those increased demands. This would result in a positiverelationship between PF and muscle recruitment. Interestingly, wesaw both relationships. Regardless of perch diameter, animalswhose gastrocnemius muscles were functioning at more optimalportions on the FLC decreased motor unit recruitment during the
Sta
nce
RIA
(% m
ax.)
0
20
40
60
80 85 90 95 100Max. PF during stride (% max.)
0 deg, broad
30 deg, broad30 deg, narrow
0 deg, narrow
30 deg0 deg
80
75
Fig. 6. Regressions of RIA during stance phase versus maximum PFduring any period of muscle activity during the stride. Data are for thehorizontal surface (solid black line) and 30 deg incline (green dashed line). Theslopes of the regressions were significantly different (P=0.04). Symbolsrepresent means for each individual for each treatment condition (n=6).Standard error bars represent variation between strides for each individual forthat condition. Filled symbols, horizontal treatment; open symbols, 30 degincline; rectangles, broad perch; circles, narrow perch.
803
RESEARCH ARTICLE Journal of Experimental Biology (2017) 220, 796-806 doi:10.1242/jeb.151795
Journal
ofEx
perim
entalB
iology

stance phase on horizontal surfaces (negative relationship) butincreased muscle fibre recruitment on 30 deg inclines (positiverelationship; Fig. 6). Thus, it appears that the increased musclework required on inclines (Cartmill, 1985; Preuschoft, 2002)disrupts the expected trade-off between PF and muscle recruitmentobserved on horizontal surfaces. Whether this pattern prevails inother vertebrate groups remains to be seen.
Tendons function to transfer force during locomotion ofsmall lizardsWe provide strong evidence that neither the tendon of thegastrocnemius nor any other hindlimb tendon is likely to stretchand store elastic energy during cyclical locomotor tasks inA. equestris. This is not surprising given that the combination ofrelatively constant tendon material properties (Bennett et al., 1986;Pollock and Shadwick, 1994b; but see Matson et al., 2012) andpositive allometry of muscle cross-sectional area means that smalleranimals are less likely to be able to generate the forces necessary tostretch their tendons (Biewener et al., 1981; Biewener and Blickhan,1988; Pollock and Shadwick, 1994a). Although even a smalldeformation of the tendon could be biologically meaningful in smallanimals, as elastic energy storage represents a larger proportion of
the mechanical work of locomotion as body size decreases(Bullimore and Burn, 2005), it is possible that other structures(e.g. titin) could be more important for locomotor efficiency in thisspecies (Nishikawa et al., 2012). Further investigation into the rolesof these structures is critical for a thorough understanding of theenergetics of Anolis locomotion.
The muscle forces we used in our calculations were estimatedassuming maximal motor unit recruitment under isometricconditions, and the entire weight of the animal was added to thoseforces such that each muscle was theoretically independentlyresponsible for supporting and propelling the body. Even though theelastic modulus of a tendon may not always be constant (Matsonet al., 2012), the value used in our calculations fell within the rangeof those reported in the literature (Bennett et al., 1986; Pollockand Shadwick, 1994b; Matson et al., 2012); halving this valuewould still result in tendon strains well below 0.1% of MTUlength. Further, our in situ experiments demonstrated that thegastrocnemius tendon would not deform even in the face of asupramaximal tetanic contraction, which is not likely to bebiologically relevant. Therefore, we conclude that, excludingballistic behaviours, hindlimb tendons are functioning to transmitforce, rather than store elastic energy, in this species.
Tendon-driven isometry Biarticular isometry Non-isometryA B C
iii iii iii
Uniarticular muscleLong, slender tendon
Biarticular muscleShort, thick tendon
Uniarticular muscleShort, thick tendon
ii ii ii
i i i
Fig. 7. Comparison of muscles contracting via tendon-driven isometry, biarticular isometry and non-isometry. Tendon-driven isometry (A) probablyoccurs primarily in larger animals (i) that have sufficient body mass to deform long, comparatively slender tendons (ii), allowing the muscle fibres to function over avery narrow range of lengths (i.e. isometrically) on the FLC (iii). Biarticular isometry (B) is likely to be the predominant mechanism of achieving isometry in smallanimals (i) that lack the body mass/muscle force to stretch shorter, comparatively thicker tendons (ii). However, as the muscle is biarticular, simultaneousextension and flexion in the two joints allows the muscle to function over a very narrow range of lengths on the FLC (iii). Non-isometric contractions (C) probablyoccur in uniarticular (ii) muscle of small animals (i) because changes in MTU length caused by joint flexion/extension translate directly into large changes inmuscle length on the FLC (iii) as the tendon cannot stretch.
804
RESEARCH ARTICLE Journal of Experimental Biology (2017) 220, 796-806 doi:10.1242/jeb.151795
Journal
ofEx
perim
entalB
iology
Most terrestrial vertebrates that have been the focus of in vivomuscle studies are necessarily amenable to invasive proceduresand, concomitantly, are relatively large. Examples include turkeys(Roberts et al., 2007; Higham and Nelson, 2008), guinea fowl(Daley and Biewener, 2003; Higham and Biewener, 2008, 2011;Higham et al., 2008), wallabies (Biewener, 1998), horses (Wickleret al., 2005) and goats (McGuigan et al., 2009). Because of the skewtowards larger animals, it is possible that our understanding ofmuscle function under in vivo conditions is also skewed. Some datado exist for smaller terrestrial vertebrates that have muscles largeenough to use sonomicrometry to determine in vivo muscle lengths(e.g. Olson and Marsh, 1998; Holt and Azizi, 2016). However, inmany small vertebrates, including A. equestris, the muscles are ofinsufficient size for sonomicrometry. Our approach to studying thedynamics of muscle function in small terrestrial animals,capitalizing on the fact that the kinematic and morphological datacan be used to infer in vivomuscle lengths, will provide new insightsand opportunities for comparisons across body sizes. Linkingkinematics (i.e. curvature of the midline) with muscle lengths hasproven useful for studying muscle function in swimming fishes(Katz and Shadwick, 1998; Shadwick et al., 1998; Donley andShadwick, 2003), although this relationship becomes decoupled inlamnid/thunniform swimmers that have a different muscle/tendonarrangement (Donley et al., 2005; Shadwick and Syme, 2008).
Biarticularity facilitates isometric function duringlocomotion in A. equestrisThe maximum gastrocnemius MTU strain observed during stancephase in A. equestris ranged from 4.77±0.5% on broad surfaces to7.10±0.70% on narrow surfaces. These values are comparable toother experiments reporting isometric gastrocnemius contractionsand fall well below length changes in other muscles and animals(Biewener, 1998; Gillis and Biewener, 2002; Wickler et al., 2005).Therefore, gastrocnemiusMTU strain in A. equestris falls within therange expected for muscles that achieve economical forceproduction (as opposed to high power) through isometriccontraction. Interestingly, however, A. equestris appears toachieve this isometry via a different mechanism from that in othervertebrates.There are at least two ways to achieve isometric force production
when joint angles are changing: (1) MTU length may change as aresult of changes in joint angles but the MTU length change may becaused solely by deformation of a series elastic element (e.g.tendon), allowing the muscle to maintain a constant length duringforce production (tendon-driven isometry), or (2) MTU length mayremain relatively constant if the muscle is biarticular becausecoincident changes in angle of the two joints may counteract eachother (biarticular isometry; Fig. 7A,B). A third less obviousscenario involves inter-muscular interactions across limb segments,such as the triarticular complex made up of the iliotibialis cranialis,iliotibialis lateralis pars preacetabularis and the medialgastrocnemius in guinea fowl (Higham and Biewener, 2011). Thefirst two mechanisms of achieving isometry relate to twobehavioural modes (cyclical versus ballistic locomotion) or twobody sizes (small versus large; Fig. 7A,B). Large animals havesufficient mass and are capable of generating sufficient muscleforces to stretch their tendons during both behavioural modes and socan utilize tendon-driven isometry (Alexander, 1974; Alexanderand Vernon, 1975; Biewener, 1998). In contrast, small animals thatlack the body mass and muscle force capacity to stretch tendons(Biewener et al., 1981; Biewener and Blickhan, 1988; Pollock andShadwick, 1994a) must rely on biarticular isometry when using a
cyclical locomotor mode because, unlike in ballistic movements,there is insufficient time to employ a catch mechanism (Astley andRoberts, 2012) to help load the tendon in advance (Fig. 7B).Therefore, as the gastrocnemius of A. equestris crosses both kneeand ankle joints and the tendon of the gastrocnemius is unlikely tobe deforming during running, it may be that biarticular isometry isthe only mechanism by which it is able to achieve effective forceproduction under conditions that require joints to move throughlarge angular excursions. This may partially explain the presence ofbiarticular muscles in animals that need to move effectively undermany different conditions. Biarticular muscles are common invertebrates and it is tempting to propose that isometric forceproduction may be one of the driving forces behind the evolution ofsuch a morphological arrangement, but more research is needed.
Our study focused on inclines and different perch diameters, butit should be noted that, in nature, these animals are likely to beperforming many additional behaviours (e.g. jumping, landing,turning) on substrates that also vary in many other aspects (e.g.texture, rugosity, compliance). Investigating how the gastrocnemiusand other muscles contribute to performance in these ecologicallyrelevant situations will be critical for discerning the relationshipsbetween physiology, biomechanics and ecology in Anolis.
AcknowledgementsWe would like to thank Dr Manny Azizi and Dr Natalie Holt for their guidance andassistance with experimental procedures.
Competing interestsThe authors declare no competing or financial interests.
Author contributionsK.L.F. and T.E.H. were involved in conceiving and designing the study, K.L.F.performed all experiments and data analyses and drafted themanuscript, and T.E.H.was involved in revising the manuscript. All authors gave final approval forpublication.
FundingThis work was supported by a Natural Sciences and Engineering Research Councilof Canada post-graduate scholarship 405019-2011 to K.L.F. and a National ScienceFoundation grant to T.E.H. (NSF IOS-1147043).
Data availabilityData are available from the Dryad digital repository: doi:10.5061/dryad.2vt32 (Fosterand Higham, 2017). Custom code can be obtained from the corresponding authorupon request.
Supplementary informationSupplementary information available online athttp://jeb.biologists.org/lookup/doi/10.1242/jeb.151795.supplemental
ReferencesAlexander, R. M. N. (1974). The mechanics of jumping by a dog (Canis familiaris).
J. Zool. 173, 549-573.Alexander, R. M. N. and Vernon, A. (1975). The mechanics of hopping by
kangaroos (Macropodidae). J. Zool. 177, 265-303.Arnold, A. S., Lee, D. V. and Biewener, A. A. (2013). Modulation of joint moments
and work in the goat hindlimb with locomotor speed and surface grade. J. Exp.Biol. 216, 2201-2212.
Astley, H. C. and Roberts, T. J. (2012). Evidence for a vertebrate catapult: elasticenergy storage in the plantaris tendon during frog jumping. Biol. Lett. 8, 386-389.
Bennett, M. B., Ker, R. F., Imery, N. J. and Alexander, R. M. N. (1986). Mechanicalproperties of various mammalian tendons. J. Zool. 209, 537-548.
Biewener, A. A. (1998). Muscle function in vivo: a comparison of muscles used forelastic energy savings versusmuscles used to generatemechanical power.Amer.Zool. 38, 703-717.
Biewener, A. and Baudinette, R. (1995). In vivo muscle force and elastic energystorage during steady-speed hopping of tammar wallabies (Macropus eugenii).J. Exp. Biol. 198, 1829-1841.
Biewener, A. A. and Blickhan, R. (1988). Kangaroo rat locomotion: design forelastic energy storage or acceleration? J. Exp. Biol. 140, 243-255.
805
RESEARCH ARTICLE Journal of Experimental Biology (2017) 220, 796-806 doi:10.1242/jeb.151795
Journal
ofEx
perim
entalB
iology

Biewener, A. A. and Gillis, G. B. (1999). Dynamics of muscle function duringlocomotion: accommodating variable conditions. J. Exp. Biol. 202, 3387-3396.
Biewener, A., Alexander, R. M. N. and Heglund, N. C. (1981). Elastic energystorage in the hopping of kangaroo rats (Dipodomys spectabilis). J. Zool. 195,369-383.
Birn-Jeffery, A. V. and Higham, T. E. (2014). Geckos significantly alter footorientation to facilitate adhesion during downhill locomotion. Biol. Lett. 10,20140456.
Brinkman, D. (1980). The hind limb step cycle of Caiman sclerops and themechanics of the crocodile tarsus and metatarsus. Can. J. Zool. 58, 2187-2200.
Bullimore, S. R. and Burn, J. F. (2005). Scaling of elastic energy storage inmammalian limb tendons: do small mammals really lose out? Biol. Lett. 1, 57-59.
Carlson-Kuhta, P., Trank, T. V. and Smith, J. L. (1998). Forms of forwardquadrupedal locomotion. II. A comparison of posture, hindlimb kinematics, andmotor patterns for upslope and level walking. J. Neurophysiol. 79, 1687-1701.
Cartmill, M. (1985). Climbing. In Functional Vertebrate Morphology (ed. M.Hildebrand, D. M. Bramble, K. F. Liem and D. B. Wake), pp. 73-88. Cambridge,MA: Harvard University Press.
Daley, M. A. andBiewener, A. A. (2003). Muscle force-length dynamics during levelversus incline locomotion: a comparison of in vivo performance of two guinea fowlankle extensors. J. Exp. Biol. 206, 2941-2958.
Donley, J. M. and Shadwick, R. E. (2003). Steady swimming muscle dynamics inthe leopard shark Triakis semifasciata. J. Exp. Biol. 206, 1117-1126.
Donley, J. M., Shadwick, R. E., Sepulveda, C. A., Konstantinidis, P. andGemballa, S. (2005). Patterns of redmuscle strain/activation and body kinematicsduring steady swimming in a lamnid shark, the shortfin mako (Isurus oxyrinchus).J. Exp. Biol. 208, 2377-2387.
Foster, K. L. and Higham, T. E. (2012). How forelimb and hindlimb functionchanges with incline and perch diameter in the green anole, Anolis carolinensis.J. Exp. Biol. 215, 2288-2300.
Foster, K. L. and Higham, T. E. (2014). Context-dependent changes in motorcontrol and kinematics during locomotion: modulation and decoupling.Proc. R. Soc. B Biol. Sci. 281, 20133331.
Foster, K. L. andHigham, T. E. (2017). Data from: Integrating gastrocnemius force–length properties, in vivo activation and operating lengths reveals how Anolis dealwith ecological challenges. Dryad Digital Repository doi:10.5061/dryad.2vt32.
Foster, K. L., Collins, C. E., Higham, T. E. Garland, T. J. (2015). Determinants oflizard escape performance: decision, motivation, ability, and opportunity. InEscaping from Predators: An Integrative View of Escape Decisions and RefugeUse (ed. W. E. Cooper, Jr and D. Blumstein), pp. 287-321. London: CambridgeUniversity Press.
Gabaldon, A. M., Nelson, F. E. and Roberts, T. J. (2004). Mechanical function oftwo ankle extensors in wild turkeys: shifts from energy production to energyabsorption during incline versus decline running. J. Exp. Biol. 207, 2277-2288.
Gillis, G. B. and Biewener, A. A. (2002). Effects of surface grade on proximalhindlimb muscle strain and activation during rat locomotion. J. Appl. Physiol. 93,1731-1743.
Gregersen, C. S., Silverton, N. A. and Carrier, D. R. (1998). External work andpotential for elastic storage at the limb joints of running dogs. J. Exp. Biol. 201,3197-3210.
Hedrick, T. L. (2008). Software techniques for two- and three-dimensional kinematicmeasurements of biological and biomimetic systems. Bioinspir. Biomim. 3,034001.
Herrel, A., Vanhooydonck, B., Porck, J. and Irschick, D. J. (2008a). Anatomicalbasis of differences in locomotor behavior inAnolis lizards: a comparison betweentwo ecomorphs. Bull. Mus. Comp. Zool. 159, 213-238.
Herrel, A., Schaerlaeken, V., Ross, C., Meyers, J., Nishikawa, K., Abdala, V.,Manzano, A. andAerts, P. (2008b). Electromyography and the evolution of motorcontrol: limitations and insights. Integr. Comp. Biol. 48, 261-271.
Higham, T. E. and Biewener, A. A. (2008). Integration within and between musclesduring terrestrial locomotion: effects of incline and speed. J. Exp. Biol. 211,2303-2316.
Higham, T. E. and Biewener, A. A. (2011). Functional and architectural complexitywithin and between muscles: regional variation and intermuscular forcetransmission. Philos. Trans. R. Soc. Lond. B. Biol. Sci. 366, 1477-1487.
Higham, T. E. and Jayne, B. C. (2004). In vivomuscle activity in the hindlimb of thearboreal lizard,Chamaeleo calyptratus: general patterns and the effects of incline.J. Exp. Biol. 207, 249-261.
Higham, T. E. and Nelson, F. E. (2008). The integration of lateral gastrocnemiusmuscle function and kinematics in running turkeys. Zoology 111, 483-493.
Higham, T. E., Biewener, A. A. and Wakeling, J. M. (2008). Functionaldiversification within and between muscle synergists during locomotion. Biol.Lett. 4, 41-44.
Holt, N. C. and Azizi, E. (2014). What drives activation-dependent shifts in theforce–length curve? Biol. Lett. 10, 201400651.
Holt, N. C. and Azizi, E. (2016). The effect of activation level on muscle functionduring locomotion: are optimal lengths and velocities always used? Proc. R. Soc.B Biol. Sci. 283, 20152832.
Irschick, D. J. and Higham, T. E. (2016). Animal Athletes: An Ecological andEvolutionary Approach. New York: Oxford University Press.
Johnston, I. A. (1991). Muscle action during locomotion: a comparative perspective.J. Exp. Biol. 160, 167-185.
Katz, S. L. and Shadwick, R. E. (1998). Curvature of swimming fish midlines as anindex of muscle strain suggests swimming muscle produces net positive work.J. Theor. Biol. 193, 243-256.
Loeb, G. E. and Gans, C. (1986). The organization of muscle. In Electromyographyfor Experimentalists, pp. 25-43. Chicago: University of Chicago Press.
Losos, J. B. (1994). Integrative approaches to evolutionary ecology: Anolis lizardsas model systems. Annu. Rev. Ecol. Syst. 25, 467-493.
Losos, J. B. (2009). Lizards in an Evolutionary Tree: Ecology and AdaptiveRadiation of Anoles. Berkeley, CA: University of California Press.
Matson, A., Konow, N., Miller, S., Konow, P. P. and Roberts, T. J. (2012). Tendonmaterial properties vary and are interdependent among turkey hindlimb muscles.J. Exp. Biol. 215, 3552-3558.
McGowan, C. P., Baudinette, R. V. and Biewener, A. A. (2005). Joint work andpower associated with acceleration and deceleration in tammar wallabies(Macropus eugenii). J. Exp. Biol. 208, 41-53.
McGowan, C. P., Neptune, R. R. and Kram, R. (2008). Independent effects ofweight and mass on plantar flexor activity during walking: implications for theircontributions to body support and forward propulsion. J. Appl. Physiol. 105,486-494.
McGuigan, M. P., Yoo, E., Lee, D. V. andBiewener, A. A. (2009). Dynamics of goatdistal hind limb muscle–tendon function in response to locomotor grade. J. Exp.Biol. 212, 2092-2104.
Medler, S. (2002). Comparative trends in shortening velocity and force production inskeletal muscles. Amer. J. Physiol. Reg. Integr. Comp. Physiol. 283, R368-R378.
Nelson, F. E., Gabaldon, A. M. and Roberts, T. J. (2004). Force-velocity propertiesof two avian hindlimb muscles. Comp. Biochem. Physiol. A Mol. Integr. Physiol.137, 711-721.
Nishikawa, K. C., Monroy, J. A., Uyeno, T. E., Yeo, S. H., Pai, D. K. and Lindstedt,S. L. (2012). Is titin a ‘winding filament’? A new twist on muscle contraction.Proc. R. Soc. B Biol. Sci. 279, 981-990.
Olson, J. M. and Marsh, R. L. (1998). Activation patterns and length changes inhindlimb muscles of the bullfrog Rana catesbeiana during jumping. J. Exp. Biol.201, 2763-2777.
Pollock, C. M. and Shadwick, R. E. (1994a). Allometry of muscle, tendon, andelastic energy storage capacity in mammals. Amer. J. Physiol. Reg. Integr. Comp.Physiol. 266, R1022-R1031.
Pollock, C. M. and Shadwick, R. E. (1994b). Relationship between body mass andbiomechanical properties of limb tendons in adult mammals. Amer. J. Physiol.Reg. Integr. Comp. Physiol. 266, R1016-R1021.
Preuschoft, H. (2002). What does “arboreal locomotion”mean exactly and what arethe relationships between “climbing”, environment and morphology? Z. Morphol.Anthropol. 83, 171-188.
Rack, P. M. H. and Westbury, D. R. (1969). The effects of length and stimulus rateon tension in the isometric cat soleus muscle. J. Physiol. 204, 443-460.
Roberts, T. J. and Azizi, E. (2011). Flexible mechanisms: the diverse roles ofbiological springs in vertebrate movement. J. Exp. Biol. 214, 353-361.
Roberts, T. J., Marsh, R. L., Weyand, P. G. and Taylor, C. R. (1997). Muscularforce in running turkeys: the economy of minimizing work. Science 275,1113-1115.
Roberts, T. J., Higginson, B. K., Nelson, F. E. and Gabaldon, A. M. (2007).Muscle strain is modulatedmorewith running slope than speed in wild turkey kneeand hip extensors. J. Exp. Biol. 210, 2510-2517.
Russell, A. P. and Bels, V. (2001). Digital Hyperextension in Anolis sagrei.Herpetologica 57, 58-65.
Schmidt, A. and Fischer, M. S. (2010). Arboreal locomotion in rats–the challenge ofmaintaining stability. J. Exp. Biol. 213, 3615-3624.
Shadwick, R. E. and Syme, D. A. (2008). Thunniform swimming: muscle dynamicsand mechanical power production of aerobic fibres in yellowfin tuna (Thunnusalbacares). J. Exp. Biol. 211, 1603-1611.
Shadwick, R. E., Steffensen, J. F., Katz, S. L. and Knower, T. (1998). Muscledynamics in fish during steady swimming. Amer. Zool. 38, 755-770.
Spezzano, L. C., Jr and Jayne, B. C. (2004). The effects of surface diameter andincline on the hindlimb kinematics of an arboreal lizard (Anolis sagrei). J. Exp. Biol.207, 2115-2131.
Wells, J. B. (1965). Comparison of mechanical properties between slow and fastmammalian muscles. J. Physiol. 178, 252-269.
Wickler, S. J., Hoyt, D. F., Biewener, A. A., Cogger, E. A. and De La Paz, K. L.(2005). In vivo muscle function vs speed II. Muscle function trotting up an incline.J. Exp. Biol. 208, 1191-1200.
Zaaf, A., Herrel, A., Aerts, P. and De Vree, F. (1999). Morphology andmorphometrics of the appendicular musculature in geckoes with differentlocomotor habits (Lepidosauria). Zoomorphology 119, 9-22.
Zar, J. H. (1999). Biostatistical Analysis. Upper Saddle River: Prentice Hall.
806
RESEARCH ARTICLE Journal of Experimental Biology (2017) 220, 796-806 doi:10.1242/jeb.151795
Journal
ofEx
perim
entalB
iology
Journal of Experimental Biology 220: doi:10.1242/jeb.151795: Supplementary information
Table S1. Hind limb muscle and tendon morphology for Anolis equestris.
Individual
Variable 1 2 3 4 5 6 7
External
morphology
Body mass 63.92 60.33 78.32 74.58 40.35 52.89 39.12
SVL 15.1 15 16.1 15 12.5 14.1 12.3
Total length 39 37.7 46.1 29.5 28.5 38.4 34.6
Humerus length 2.5 2.5 2.5 2.1 2.4 2.7 2.1
Radius length 2.3 2 2.5 2.1 2 2.1 1.7
Metacarpal length 0.9 0.9 1 0.8 0.6 0.6 0.6
3rd finger length 1 1 1 0.9 0.8 1 0.9
Femur length 3.5 3 3.3 2.8 2.7 2.6 2.6
Tibia length 3.1 2.9 3.4 2.8 2.9 2.9 2.5
Metatarsal length 1.9 2 2.1 1.7 1.5 1.8 1.3
4th toe length 1.8 1.9 2.1 1.9 1.5 1.7 1.4
Puboischiotibialis
Fascicle length 3.3 3.8 3.1 3.7 3.3 3.4 2.8
Tendon length 0.2 0.2 0.5 0.4 0.2 0.5 0.4
Tendon mass for
length=0.2cm 0.0018 0.0029 0.0028 0.001 0.001 0.0013 0.0018
Insertion on tibia
(cm from knee) 0.3-0.7 0.4-0.8 0.5-0.9 0.3-0.6 0.5-0.8 0.4-0.8 0.3-0.6
Origin on pelvic
girdle (cm from
hip)
0.5 0.7 0.4 0.6 0.6 0.6 0.4
Mass 0.3058 0.3096 0.5094 0.404 0.2323 0.3547 0.2253
Flexor tibialis
internus
Fascicle length 3 2.7 2.6 2.5 2.4 2.2 2
Tendon length 0.2 0.2 0.5 0.4 0.2 0.5 0.4
Tendon mass for
length=0.2cm 0.0018 0.0029 0.0028 0.001 0.001 0.0013 0.0018
Insertion on tibia
(cm from knee) 0.7 0.8 0.9 0.6 0.8 0.8 0.6
Mass 0.1191 0.1127 0.1737 0.1533 0.0863 0.1234 0.0742
Flexor tibialis
externus
Fascicle length 3.1 3 2.9 2.7 2.5 2.6 2.3
Insertion on tibia
(cm from knee) 0.4 0.3 0.3 0.3 0.3 0.3 0.3
Mass 0.1062 0.1399 0.2736 0.1896 0.1065 0.1474 0.1332
Pubofibularis
Fascicle length 2.5 2.5 2.7 2.5 2.3 2.3 2
Insertion on
fibula (cm from
knee)
0.25 0.3 0.2 0.2 0.3 0.3 0.3
MTU length 3.1 3.1 2.9 2.8 2.6 2.7 2.4
Tendon mass for
length=0.2cm 0.0004 0.0004 0.0005 0.0004 0.0006 0.0002 0.0008
Mass 0.0668 0.0769 0.0987 0.1021 0.0514 0.068 0.0511
Femorotibialis pars
ventralis
Avg fascicle
length 1.7 1.7 1.9 2.1 1.4 1.6 1.3
Insertion on tibia
(cm from knee) 0 0 0 0 0 0 0
Mass 0.0764 0.0741 0.1243 0.0875 0.0844 0.1224 0.0958
Ambiens pars
ventralis
Fascicle length 2.6 2.6 2.4 2.4 2.4 2.3 1.9
Insertion on tibia
(cm from knee) 0.25 0.2 0.3 0.2 0.2 0.2 0.2
Mass 0.1532 0.1916 0.2912 0.2202 0.1437 0.2102 0.1532
Jour
nal o
f Exp
erim
enta
l Bio
logy
• S
uppl
emen
tary
info
rmat
ion
Journal of Experimental Biology 220: doi:10.1242/jeb.151795: Supplementary information
Ambiens pars
dorsalis
Fascicle length 2.2 2 2.5 2.3 1.4 1.8 1.4
Insertion on tibia
(cm from knee) 0.25 0.2 0.3 0.2 0.2 0.2 0.2
Tendon length 0.9 1 0.8 0.7 0.6 0.7 0.7
Tendon mass for
length=0.3cm 0.009 0.0063 0.004 0.0041 0.0029 0.003 0.0017
Mass 0.1555 0.1522 0.223 0.1768 0.0939 0.1643 0.1169
Iliofibularis
Fascicle length 2.9 3 3.3 2.7 2.7 2.7 2.3
Insertion on
fibula (cm from
knee)
0.6-0.8 0.7-0.9 0.9-1.1 0.6-0.8 0.5-0.7 0.5-0.7 0.4-0.6
Mass 0.1791 0.1764 0.2788 0.223 0.1333 0.2187 0.1536
Ilioischiotibialis
Fascicle length 2.4 2.3 2.2 2.2 2 2 1.7
Insertion on tibia
(cm from knee) 0.7 0.7 0.6 0.6 0.6 0.6 0.5
MTU length 2.8 2.7 2.5 2.7 2.5 2.5 2.1
Tendon mass for
length=0.2cm 0.0007 0.0007 0.0003 0.0004 0.0003 0.0004 0.0002
Mass 0.1247 0.1044 0.174 0.1645 0.0789 0.1318 0.1056
Femorotibialis pars
dorsalis
Fascicle length 1 1 1.1 1.1 1.1 1.1 1.1
Insertion on tibia
(cm from knee) 0 0 0 0 0 0 0
Pennation angle 28 24 25 20 22 25 25
Mass 0.1718 0.1392 0.241 0.1301 0.1151 0.1919 0.1427
Adductor femoris
Fascicle length 1.8 1.7 1.8 1.7 1.4 1.4 1.4
Pennation angle 12 12 11 13 14 13 14
Mass 0.1949 0.2236 0.2985 0.2688 0.1575 0.2854 0.2046
Ilioischiofibularis
Fascicle length 1.4 1.4 1.4 1.4 1.4 1.4 1.4
Insertion on
fibula (cm from
knee)
0.4 0.4 0.4 0.4 0.4 0.4 0.4
MTU length 2.2 2.2 2.2 2.4 2.2 2.1 2.2
Tendon mass for
length=0.3cm 0.0002 0.0002 0.0004 0.0006 0.0002 0.0005 0.0001
Pennation angle 10 10 10 10 10 10 10
Mass 0.0696 0.0472 0.0715 0.1022 0.0457 0.0637 0.0927
Tibialis anterior
Fascicle length 1.3 1.2 1.2 1.2 1.1 1.1 1
Insertion on
metatarsals (cm
from ankle)
0.1-0.3 0.1-0.3 0.1-0.3 0.1-0.3 0.1-0.3 0.1-0.3 0.1-0.3
Pennation angle 5 7 9 9 8 9 9
Mass 0.0795 0.0876 0.098 0.0903 0.0512 0.1091 0.0693
Flexor digitorum
communis
Fascicle length 1.3 1.4 1.3 1.2 1.1 1.1 1.1
Insertion on
metatarsals (cm
from ankle)
0.2 0.2 0.2 0.2 0.2 0.2 0.2
MTU length 1.5 1.6 1.5 1.5 1.5 1.7 1.5
Tendon mass for
length=0.3cm 0.0001 0.0013 0.0019 0.002 0.0014 0.0038 0.0008
Mass 0.0226 0.0458 0.0544 0.0501 0.0347 0.1415 0.0323
Peroneus longus
Fascicle length 2.1 1.9 2.1 1.8 1.7 1.6 1.6
MTU length 2.9 2.9 2.9 2.7 2.6 2.7 2.4
Insertion on
metatarsals (cm 0.3 0.3 0.4 0.4 0.4 0.3 0.2
Jour
nal o
f Exp
erim
enta
l Bio
logy
• S
uppl
emen
tary
info
rmat
ion

Journal of Experimental Biology 220: doi:10.1242/jeb.151795: Supplementary information
from ankle)
Tendon mass for
length=0.45cm 0.0011 0.0015 0.0015 0.0013 0.0009 0.0005 0.0014
Mass (g) 0.0462 0.0532 0.0708 0.0435 0.0312 0.0587 0.0494
Peroneus brevis
Fascicle length 0.5 0.5 0.5 0.5 0.5 0.5 0.5
MTU length 2.8 2.4 2.4 2.2 1.9 2 1.9
Insertion on
metatarsals (cm
from ankle)
0.1 0.1 0.1 0.1 0.1 0.1 0.1
Tendon mass for
length=0.3cm 0.001 0.0016 0.002 0.0013 0.0009 0.0005 0.0008
Pennation angle 15 17 15 18 13 18 16
Mass 0.0491 0.0481 0.0746 0.0585 0.0359 0.059 0.0465
Extensor digitorum
longus
Fascicle length 2.6 2.3 2.2 2 1.9 2 1.9
Femoral tendon
length 1.2 1.4 1.2 1 1 1 0.9
Mass femoral
tendon for
length=0.25cm
0.0004 0.0003 0.0008 0.0004 0.0004 0.0007 0.0006
Origin on femur
(cm from knee) 0.1 0.1 0.1 0.1 0.1 0.1 0.1
MTP tendon
length 0.9 1.2 1 0.9 0.9 0.8 0.8
Mass MTP
tendon for
length=0.3
0.0004 0.0005 0.0008 0.0004 0.0003 0.0004 0.0007
Insertion on
metatarsals (cm
from ankle)
0.3 0.5 0.6 0.4 0.3 0.4 0.4
Mass 0.0497 0.0648 0.0781 0.0695 0.0366 0.0704 0.0753
Gastrocnemius pars
fibularis pars minor
Fascicle length 1.4 1.2 1.2 1.2 1 1 1
Insertion on
metatarsals (cm
from ankle)
0.4 0.4 0.4 0.4 0.4 0.4 0.4
Origin on femur
(cm from knee) 0.2 0.4 0.3 0.4 0.3 0.3 0.3
Pennation angle 14 12 14 14 13 15 13
MTU length 3.3 3.5 3.3 2.9 2.5 2.8 2.6
Tendon mass for
length=0.3cm 0.003 0.0027 0.0024 0.0034 0.0022 0.001 0.0019
Mass 0.1282 0.1331 0.1723 0.1729 0.0874 0.1228 0.1067
Gastrocnemius pars
fibularis pars major
Fascicle length 2.2 2.3 2.1 2.2 2 2.2 2.1
Insertion on
metatarsals (cm
from ankle)
0.4 0.4 0.4 0.4 0.4 0.4 0.4
Origin on femur
(cm from knee) 0.2 0.4 0.3 0.4 0.3 0.4 0.3
MTU length 3 3.2 3 2.9 2.5 2.7 2.5
Tendon mass for
length=0.3cm 0.0044 0.0043 0.0084 0.0057 0.0032 0.006 0.0026
Mass 0.1303 0.1496 0.2877 0.2237 0.0955 0.1784 0.1418
Caudofemoralis
longus
Muscle length 6.2 6.5 6.8 7.1 5.7 5.8 5.5
Avg fascicle
length 1.9 2.1 2 1.9 1.8 1.8 1.8
MTU length 6.8 7.1 7.3 7.6 6.2 6.3 6
Jour
nal o
f Exp
erim
enta
l Bio
logy
• S
uppl
emen
tary
info
rmat
ion
Journal of Experimental Biology 220: doi:10.1242/jeb.151795: Supplementary information
Pennation angle 20 17 20 16 15 15 15
Femoral tendon
mass for
length=0.5cm
0.0041 0.0055 0.0044 0.0052 0.0031 0.0045 0.0062
Mass 0.7325 0.8505 1.233 1.0221 0.5983 0.7314 0.9384
SVL, snout-vent length; MTU, muscle-tendon unit; MTP, metatarsalphalangeal; Avg, average.
All lengths given in cm; all masses given in g.
Table S2. Mean muscle-tendon unit (MTU) length and tendon length change in mm and as a percentage of MTU
length for all the hind limb muscles of the femur and crus that have tendons.
Muscle Tendon length change
(mm)
MTU length
(mm)
Tendon length change
(% of MTU length)
Puboischiotibialis 0.014 36.8 0.038
Flexor tibialis internus 0.008 2.8 0.294
Pubofibularis 0.026 28 0.094
Ambiens pars ventralis 0.017 31.4 0.053
Ambiens pars dorsalis 0.016 27.1 0.060
Ilioischiotibialis 0.048 25.4 0.189
Ilioischiofibularis 0.191 22.1 0.863
Flexor digitorum communis 0.018 15.4 0.115
Peroneus longus 0.051 27.3 0.187
Peroneus brevis 0.029 22.3 0.132
Extersor digitorum longus 0.076 41.6 0.182
Gastrocnemius pars fibularis pars minor 0.038 29.9 0.125
Gastrocnemius pars fibularis pars major 0.011 28.3 0.037
Caudofemoralis longus 0.069 67.6 0.103
Table S3. Loadings from a discriminant function (DF) analysis (Wilks’
Lambda F=1.87, p=0.0466) of hind limb joint angles in Anolis equestris.
As only DF1 was significant (p=0.0466), DF2 (p=0.97) is not shown.
Variable DF1 (94.6%)
Femur depression angle (ES) 0.9431
Max. swing femur depression angle 0.9417
Mid swing femur depression angle 0.9311
Femur rotation angle (ES) -0.9104
Knee angle (FF) -0.9083
Max. femur depression angle 0.8611
t. max. femur rotation angle (% swing) 0.8152
Femur depression angle (MS) 0.7668
t. min. knee angle (% stance) -0.7656
Pelvic girdle rotation angle (MS) 0.4865
Pelvic girdle rotation angle (ES) 0.3729
Max. swing ankle angle 0.0684
Loadings with a magnitude ≥ 0.3 are in bold.
Percentage of variation explained by DF1 axis is indicated in parentheses.
FF, footfall; MS, mid stance; ES, end of stance; T, time; Max.,
maximum; Min., minimum.
Jour
nal o
f Exp
erim
enta
l Bio
logy
• S
uppl
emen
tary
info
rmat
ion
Journal of Experimental Biology 220: doi:10.1242/jeb.151795: Supplementary information
Table S4. Loadings from a discriminant function (DF) analysis (Wilks’
Lambda F=2.04, p=0.028) of hind limb angular velocities in Anolis
equestris. As only DF1 (p=0.028) was significant, DF2 (p=0.24) is not
shown.
Variable DF1 (64.3%)
Max. swing knee angle velocity (residuals) 0.8093
Mid swing knee angle velocity 0.8087
Avg. swing femur rotation velocity (residuals) -0.8081
Avg. swing knee angle velocity 0.7475
Max. swing ankle angle velocity (residuals) 0.7429
Avg. stance knee angle velocity -0.665
Avg. stance ankle angle velocity (residuals) -0.6262
Max. stance femur depression velocity 0.1951
Femur depression velocity (MS) 0.1631
Min. swing femur depression velocity -0.1519
Avg. stance femur depression velocity -0.1331
Min. swing ankle angle velocity (residuals) 0.1128
Loadings with a magnitude ≥ 0.3 are in bold.
Percentage of variation explained by DF1 axis is indicated in parentheses.
Variables that were loaded as residuals because they regressed
significantly with body speed are indicated in parentheses.
MS, mid stance; Max., maximum; Min., minimum; Avg., average.
Table S5. Hind limb joint angle and angular velocity variables that loaded heavily (≥ 0.3)
on the first axis of discriminant function analyses (Fig. 3, Tables 3,4).
Perch Diameter
Narrow Broad
Joint Angle
Femur depression angle (ES) 38.43±2.30 9.49±1.68
Max. swing femur depression angle 40.23±2.45 9.42±1.83
Mid swing femur depression angle 33.53±2.75 -3.92±2.33
Femur rotation angle (ES) 50.50±2.38 76.24±1.39
Knee angle (FF) 48.36±3.23 88.77±2.09
Max. femur depression angle 42.85±2.28 19.73±2.50
t. max. femur rotation angle (% swing) 45.03±5.19 9.88±2.17
Femur depression angle (MS) 35.68±2.83 11.50±2.85
t. min. knee angle (% stance) 9.77±2.85 42.28±4.75
Pelvic girdle rotation angle (MS) -2.67±1.83 -12.72±2.94
Pelvic girdle rotation angle (ES) -0.67±2.62 -8.57±2.78
Joint angular velocity
Max. swing knee angle velocity 308.01±75.08 955.63±140.35
Mid swing knee angle velocity -480.66±76.01 247.44±115.90
Avg. swing femur rotation velocity -45.80±19.34 -180.21±20.58
Avg. swing knee angle velocity -422.71±66.36 17.11±47.26
Max. swing ankle angle velocity 276.54±84.58 892.83±127.37
Avg. stance knee angle velocity 217.19±37.67 11.00±26.16
Avg. stance ankle angle velocity 247.13±46.68 96.46±28.11
FF, footfall; MS, mid stance; ES, end of stance; t., time; Max., maximum; Min., minimum;
Avg., average.
Velocities are in degrees s-1; values are means s.e.m.
Jour
nal o
f Exp
erim
enta
l Bio
logy
• S
uppl
emen
tary
info
rmat
ion