Embed Size (px)
Citation preview

Integrating Operations and Finance: A Two-Way Street
Integrating Operations and Finance: A Two-Way Street
An Oracle White Paper
August 2008
Integrating Operations and Finance: A Two-Way Street Page 2
Integrating Operations and Finance:
A Two-Way Street
Introduction
One of the hot buttons in enterprise performance management (EPM) is
operational and financial integration. In many organizations, operational plans and
financial results are not aligned very well, and in most cases, both have their own
set of performance indicators. From a top-down perspective, the reasons for better
alignment of operational plans and financial results are clear.
• Alignment provides senior management with increased insight and control
• Alignment gives financial managers higher predictability of financial results
• Increased insight, control, and predictability allow the organization to be
transparent and to comply with regulations with confidence
However, the opposite business case—sharing financial information with operational
managers—is less often explored because too often financial data is held “close to
the vest.” This is unfortunate because financial information holds interesting
operational insights that can be crucial for operational managers.
Operational and finance integration should not be a one-way street for financial
and general managers that’s used only for external reporting and executive decision
making. Integration should be a two-way street allowing financial information to
go both ways.
Why Is Financial Information Crucial for Operational Managers?
Managers need the ability to see the financial consequences of their operational
plans and optimizations. Methodologies such as Economic Value Added (EVA)
and performance indicators such as Return on Capital Employed (ROCE) are
designed to help managers understand that financial resources are limited and that
capital should be deployed where the return is highest. Also, since financial results
are the bottom line for every single business function and domain, managers can
use them as benchmarks to compare results from various parts of the organization.
Financial information about business performance should not be limited to
consolidating the individual results of departments or regions. Success can also be
measured in the indirect contributions to other business functions. For example,
because procurement is highly connected to manufacturing, it may be more
Why Should Operational Managers Get
Financial Feedback?
• Capital should be deployed in
operations where the return is highest
• Financial results are the bottom line for
every business function
• Financial results make departments
and regions comparable and
“benchmark-able”
• Business functions have indirect
financial contributions including what
they achieve for other business
functions
• Bonus plans are directly connected to
financial results
Integrating Operations and Finance: A Two-Way Street Page 3
effective to work with suppliers to create an integrated value chain that leads to
much higher cost savings, than to spend large amounts of time trying to squeeze
the last penny out of the cost. Other examples include manufacturing planning
departments that have a huge impact on logistical optimization and marketing
budgets that should be aligned with sales opportunities. Ultimately, finance is the
language of business and these cross-domain optimizations can be expressed in
terms of lower cost and additional revenue.
Last, but not least, managers should have financial feedback because their bonuses
are often directly connected to the organization’s financial results.
Because financial reporting generally focuses on executive and financial
management, financial reporting is too often a one-way street. Financial data is
collected, aggregated, consumed by top management, and then externally reported
on the consolidated level. At this level, it’s almost impossible for operational
managers to recognize their contributions.
Even though most organizations do share financial data with their operational
managers, it often consists only of their slice of the cost or profit center. Also, the
account structure is usually optimized more for financial data processing (for
example, in journals) and technical financial reporting than for operational insight.
The bottom line is that financial reporting for operational managers needs urgent
attention.
What Financial Information Do Operational Managers Need?
Most operational managers have an intuitive understanding of a profit and loss
statement, but balance sheets and cashflow statements can be a different story.
Standard financial reports—usually limited to providing insight to the financial
experts—have only partial usefulness for operational managers. Organizations that
want to create operational and financial integration can use these guidelines to
construct useful reports that will provide helpful financial information to their
operational managers. Most organizations have already done the following:
• Standardize financial reports. Financial reports—particularly profit and
loss (P&L) statements—need to be standardized so that everyone is looking
at the data in the same format, with the same reference point. This can also
help operational managers feel more ownership for the results of the overall
company.
• Provide the variance. Providing the variance between the actual numbers
and the budgeted numbers (or the actuals and the forecast), helps managers
focus purely on what operational buttons to push. It also helps to split the
variance in a price variance and in an efficiency variance to take out the
effects of different currencies—particularly in a global business.
Fact: Oracle’s Hyperion Financial
Management is a single solution that
provides financial reporting for all
managers across the organization, as well
as for all relevant external stakeholders.
Integrating Operations and Finance: A Two-Way Street Page 4
• Provide the right level of detail. For example, provide revenue numbers
broken out by operationally relevant dimensions such as products, markets,
customers, sales channels, and so on.
These are some basic ways to provide useful information to operational managers.
However, with more creativity you can truly empower your operational managers
with insight into how their plans and actions can affect the organization’s financial
results. Take a look at these examples of specific operational uses of financial
information.
Contribution Margin
In many organizations there is a disconnect between the way the business is run
and how the sales force is compensated. For example, the sales force may be
measured in terms of revenue, but the CFO manages the company based on profit
and margin. This often leads to the end-of-quarter discussion on how margins are
under pressure because the sales people are giving much higher discounts. If the
company is being managed on margin, then sales operations should also be measured
on margin.
The easiest way to align sales operations with corporate objectives is to create a
straightforward model that calculates the contribution margin as “revenue less the
costs of goods sold (COGS).” If sales people are compensated based on
contribution margin, they will start to make different decisions on how to position
products to customers and how to conduct negotiations.
Contribution margin is also relevant for other parts of the business. For example,
this measurement can motivate workers in the manufacturing department to
monitor the contribution of each shift to the company bottom line—especially if
contribution margin is connected to an incentive program. Contribution margin
drives operational team managers to investigate how to reach the target production
for each shift using the minimal number of resources.
A note of caution: When you use cost allocations to calculate contribution margin,
use direct costs—rather than indirect costs—for your estimates as much as
possible. If the contribution margin includes too many indirect costs that the
operational manager cannot influence, the manager may be tempted to abandon
the indirect cost-pressured activities because they are perceived as loss-making
activities. This, then, leads to even more pressure from indirect costs on other
activities.
Operating Cash Cycle and Working Capital
Both the finance and operations side of an organization contribute to the
organization’s operating cash cycle (OCC)—the time an organization’s money is
tied up in inventory and other current assets before the company is paid for the
goods and services it produces. A reduced OCC improves an organization’s
working capital and financial results. Operational managers can reduce the OCC by
Fact: Oracle’s Hyperion Profitability and
Cost Management determines true
customer and product profitability to plan
for the most profitable segments and also
defines actions to improve or abandon
unprofitable ones. It helps operational
managers gain insight into cost structures
and drivers that can help them create plans
for increasing efficiencies and improving
profit margins.
Examples of financial information for
operational use include
• Contribution margin
• Working capital
• Indirect contributions
• Non-financial information
Integrating Operations and Finance: A Two-Way Street Page 5
optimizing business turnovers—making procurement strategies more efficient,
reducing inventory holding periods, and aggressively managing other supply chain
activities.
Traditional working capital information is not very intuitive for operational
managers, but it is extremely important. A low amount of working capital is bad
because it means the organization is not able to pay their suppliers. On the other
hand, if a low working capital is supported with an effective receivables collection
effort and favorable (long) payment terms with the organization’s suppliers, then
the low working capital can be a sign of efficiency.
By themselves, working capital amounts do not reveal much. It’s the movement of
working capital over time and the contributions of the individual components that
give you relevant information. However, operations throughout the organization
can also have a positive (or negative) effect on the overall result.
Working capital is driven by both accounts payable and the collection of
receivables. The average number of days sales outstanding (DSO) is used to
measure accounts receivable. Operation managers should review DSO reports
regularly. For example, back-office departments in charge of order entry, billing, or
other administrative tasks should be able to see DSO reports to understand the
positive impact of a speedy and error-free administrative process.
DSO reports containing a breakdown of DSO by customer segment and by
geography are fairly common. However, for procurement departments (for
example), it makes more sense to have a report that breaks down DSO by product.
In many cases, products sold never see the organization from the inside; they are
produced by contract manufacturers and shipped directly to the customers.
Increasing numbers in a DSO report are an early warning signal that the extended
supply chain is not working optimally or—even worse—can indicate product
quality issues.
Indirect Contributions
Insight into your own operations just to optimize financial results is no longer
enough. Business departments affect the results of other business departments in
an indirect way. If the impacts are not managed effectively, financial results will be
a consolidation of local (sub)optimizations instead of an optimized result for the
entire organization.
For example, the procurement department should take into account that
negotiating a mutual investment in value chain integration between the supplier
and the organization could lead to cost savings in the manufacturing department
far beyond squeezing the last bit of discount out of a contract. Manufacturing, in
turn, should take warehousing costs into consideration when putting together an
optimized production plan, because large batches of product could lead to higher
storage costs. If these increased warehousing costs are higher than achieved cost
efficiencies of the production plan, this local optimization should be avoided.
Integrating Operations and Finance: A Two-Way Street Page 6
After considering indirect cost savings, credits should also be shared. For example,
think about telecom company providers who sell “triple play” subscriptions
consisting of internet access, telephony, and television. Although senior
management usually frowns on double-counting revenue (because it can lead to an
increase in commissions), each division should get full credit because their
contribution is an inextricable part of the value proposition.
Indirect contributions can also come from the “softer” areas of finance, such as
brand value calculations. It would be interesting to see what a hiring campaign
implemented by the Human Resources (HR) department contributed in additional
brand value or what an award-winning systems implementation by the information
technology (IT) group has delivered in terms of brand value.
Nonfinancial Information
Increasingly, the financial consolidation system is also used for nonfinancial
reporting. Traditionally, this reporting is created to provide executive and financial
management with operational insight so they can better predict financial results.
Relevant, nonfinancial information would include units sold, pricing information,
workforce counts, and sales pipeline updates.
Another area of reporting that is gaining popularity is sustainability reporting. The
financial consolidation system easily holds information on an organization’s carbon
footprint and their use of natural resources, energy consumption, workforce
diversity, and health and safety reporting. The system facilitates the complex
calculations, the hierarchies of metrics, and the audit trail needed for external
reporting. However, sustainability reporting is only effective if it is backed up with
solid business practices. This means that operational managers must have the right
processes in place to meet sustainability demands and must—as with any other
business topic—require the appropriate feedback.
Fact: Oracle’s Hyperion Financial
Management is often used for nonfinancial
reporting, such as sustainability reporting,
combining economic, social, and
environmental performance.
should the credit .
Integrating Operations and Finance: A Two-Way Street Page 7
What Should Financial Information for Operational Managers
Look Like?
Financial specialists, the producers of management information, often choose to
analyze large financial overviews in a spreadsheet format and are familiar with the
standard layouts of P&L reports, balance sheets, and cash flow overviews. As
consumers of information, operational managers are certainly no strangers to
spreadsheets, but they often prefer a more graphical presentation.
Financial information, then, should be distributed in a predefined, intuitive manner
that makes use of informative graphical representations. It should provide guided
analysis and should enable users to share insights and discuss results.
These requirements are not unique and can very well be captured with an out-of-
the-box dashboard that has the appropriate templates along with a built-in
understanding of typical financial information.
Open to multiple sources and uses
In order to collaborate, managers – both financial and operational – need to work
off the same set of information from a variety of sources. ‘Being open’ is an
important characteristic of a reporting system sharing financial information with
operational managers. First, it needs to be open to include multiple sources. Not all
data may be in the financial consolidation system, it may for instance come from
transactional systems or from external data sources such as credit rating agencies
for benchmarking purposes. Also, to create a complete view, financial information
may come from partners upstream and downstream in the value chain, and they
may use different systems or different implementations from the same system. It
must be easy to read data from a wide variety of sources. The financial reporting
process also needs to be open for various end-user reporting tools. In some
organizations it is best to integrate the financial information with other types of
information, making use of a standard business intelligence system, such as Oracle
Business Intelligence. In other organizations it makes more sense to see the
financial information for operational managers as a specific extension to their
financial consolidation system.
Oracle supports both styles of being open, through its own offerings as well as via
partners.
A reporting system should include
• Interfaces to various sources, and
various end-user tools
• Predefined and intuitive formats
• Graphical interfaces
• Guided analysis
Integrating Operations and Finance: A Two-Way Street Page 8
Oracle BI Applications are complete, pre-built BI solutions that help people at all
levels of an organization better understand how their business is performing. The
Oracle BI Applications product portfolio, based on a Common Enterprise
Information Model, offers the following analytics products and many industry
specific solutions:
• Oracle Financial Analytics
• Oracle Supply Chain and Order Management Analytics
• Oracle Procurement and Spend Analytics
• Oracle Human Resources Analytics
• Oracle Sales Analytics
• Oracle Service Analytics
• Oracle Contact Center Analytics
• Oracle Marketing Analytics
Oracle Financial Analytics provides hundreds of financial metrics, alerts, reports,
and dashboards for financial professionals and line of business managers, and
includes prebuilt adapters for packaged applications such as E-Business Suite,
PeopleSoft Enterprise, Oracle's Siebel CRM Applications as well as a universal
adapter for third party systems like SAP.
Oracle is also open to partner-specific solutions. Take for instance CXO Cockpit.
The CXO-Cockpit Community is a network of CFO’s and finance professionals
from large organizations, sharing their best practices for presentation of financial
data. This network of professionals created a platform and developed a product
(the CXO-Cockpit) that brings these presentations into practice. The CXO-
Cockpit is an out-of-the-box executive dashboard that presents data from
consolidated Oracle|Hyperion systems.
Predefined and Intuitive
For reasons of compliance and control, everyone should be seeing exactly the
same financial information—multiple versions of the truth are not allowed. Supply
and consumption of financial management information is, by necessity, a highly
controlled process. Users cannot simply decide on how they would like specific
ratios or line items to be calculated for their personal use. For everyone to have the
same understanding of the information, you need pre-established formats.
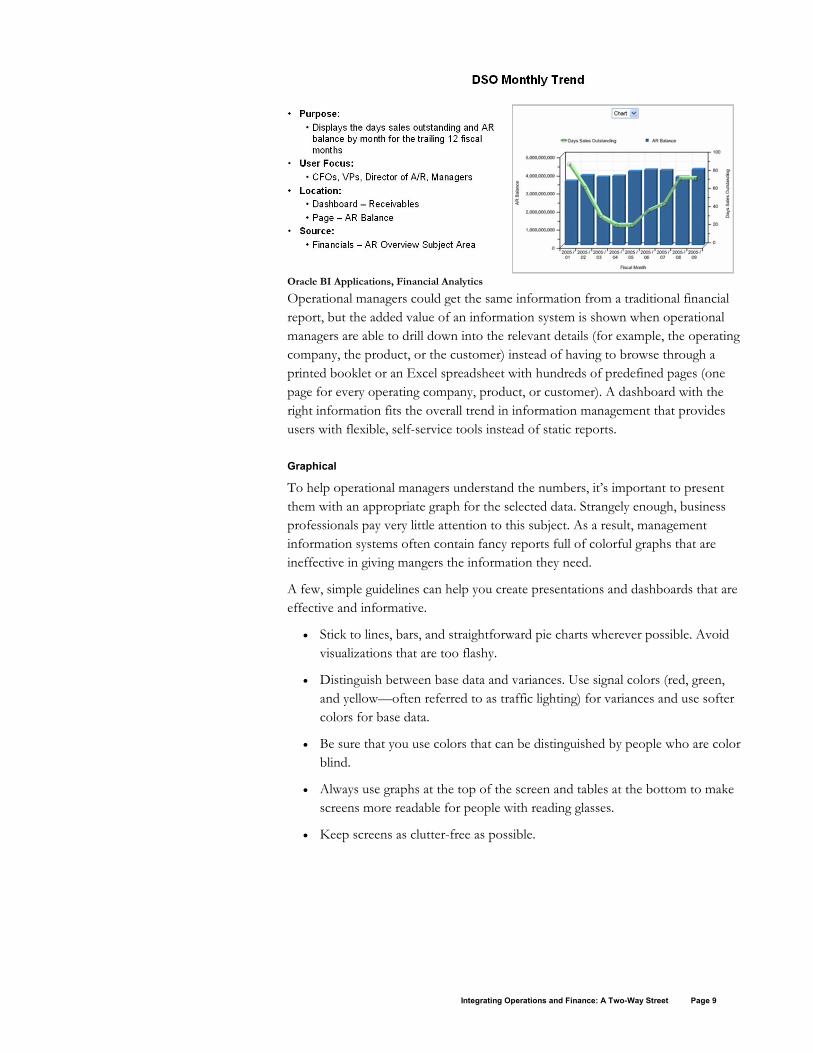
The following is an example of a pre-built DSO report that comes with out of the
box Financials Analytics functionality.
Oracle’s Common Enterprise Information
Model is a single repository, containing
all metadata for Oracle’s BI technologies,
BI applications and Performance
Management Applications.
Integrating Operations and Finance: A Two-Way Street Page 9
Oracle BI Applications, Financial Analytics
Operational managers could get the same information from a traditional financial
report, but the added value of an information system is shown when operational
managers are able to drill down into the relevant details (for example, the operating
company, the product, or the customer) instead of having to browse through a
printed booklet or an Excel spreadsheet with hundreds of predefined pages (one
page for every operating company, product, or customer). A dashboard with the
right information fits the overall trend in information management that provides
users with flexible, self-service tools instead of static reports.
Graphical
To help operational managers understand the numbers, it’s important to present
them with an appropriate graph for the selected data. Strangely enough, business
professionals pay very little attention to this subject. As a result, management
information systems often contain fancy reports full of colorful graphs that are
ineffective in giving mangers the information they need.
A few, simple guidelines can help you create presentations and dashboards that are
effective and informative.
• Stick to lines, bars, and straightforward pie charts wherever possible. Avoid
visualizations that are too flashy.
• Distinguish between base data and variances. Use signal colors (red, green,
and yellow—often referred to as traffic lighting) for variances and use softer
colors for base data.
• Be sure that you use colors that can be distinguished by people who are color
blind.
• Always use graphs at the top of the screen and tables at the bottom to make
screens more readable for people with reading glasses.
• Keep screens as clutter-free as possible.
Integrating Operations and Finance: A Two-Way Street Page 10
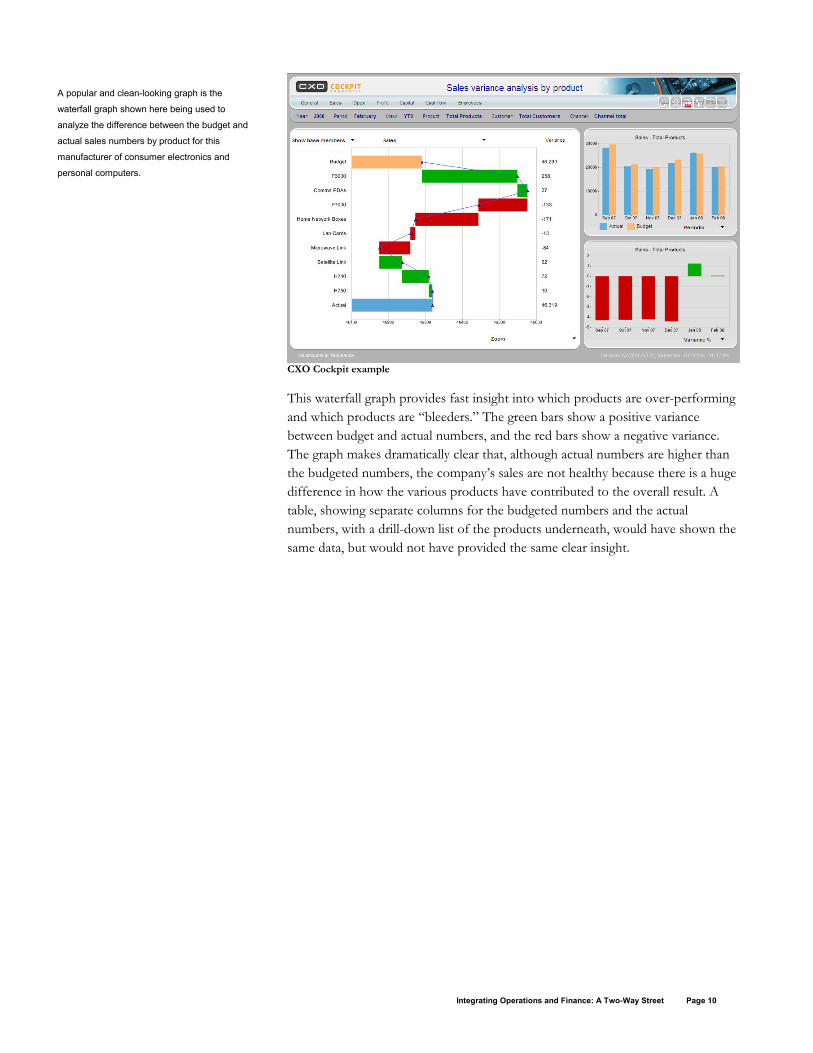
CXO Cockpit example
This waterfall graph provides fast insight into which products are over-performing
and which products are “bleeders.” The green bars show a positive variance
between budget and actual numbers, and the red bars show a negative variance.
The graph makes dramatically clear that, although actual numbers are higher than
the budgeted numbers, the company’s sales are not healthy because there is a huge
difference in how the various products have contributed to the overall result. A
table, showing separate columns for the budgeted numbers and the actual
numbers, with a drill-down list of the products underneath, would have shown the
same data, but would not have provided the same clear insight.
A popular and clean-looking graph is the
waterfall graph shown here being used to
analyze the difference between the budget and
actual sales numbers by product for this
manufacturer of consumer electronics and
personal computers.
Integrating Operations and Finance: A Two-Way Street Page 11
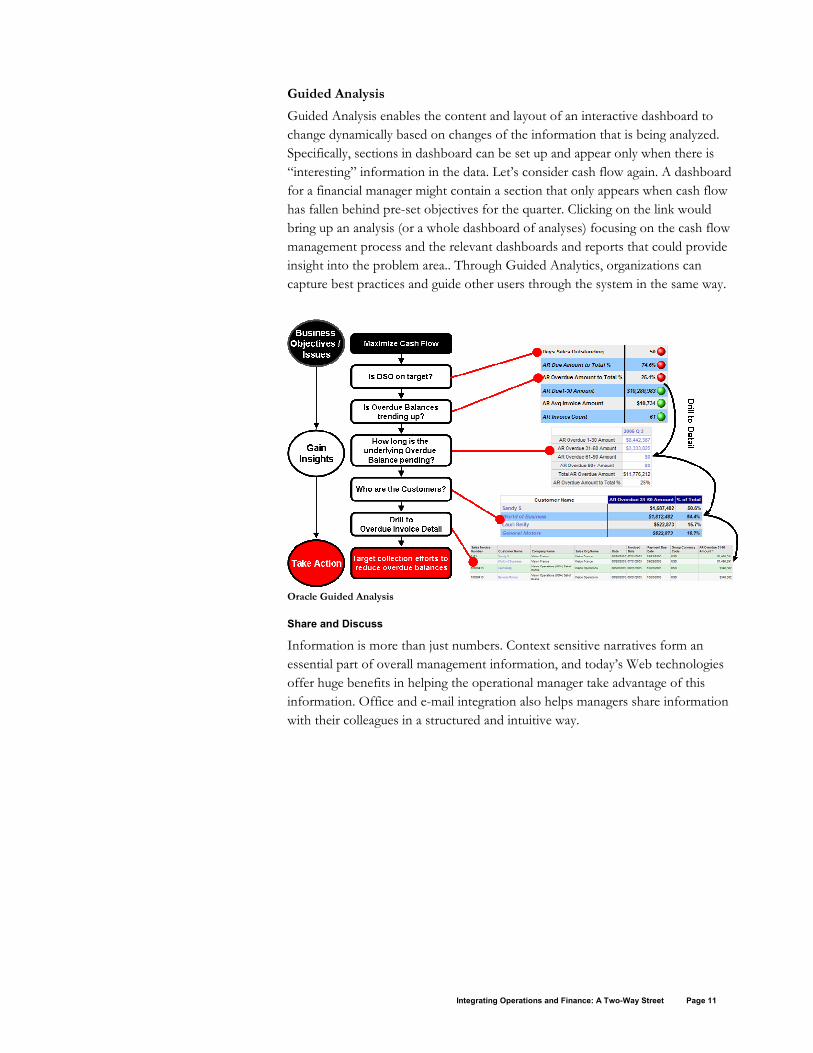
Guided Analysis
Guided Analysis enables the content and layout of an interactive dashboard to
change dynamically based on changes of the information that is being analyzed.
Specifically, sections in dashboard can be set up and appear only when there is
“interesting” information in the data. Let’s consider cash flow again. A dashboard
for a financial manager might contain a section that only appears when cash flow
has fallen behind pre-set objectives for the quarter. Clicking on the link would
bring up an analysis (or a whole dashboard of analyses) focusing on the cash flow
management process and the relevant dashboards and reports that could provide
insight into the problem area.. Through Guided Analytics, organizations can
capture best practices and guide other users through the system in the same way.
Oracle Guided Analysis
Share and Discuss
Information is more than just numbers. Context sensitive narratives form an
essential part of overall management information, and today’s Web technologies
offer huge benefits in helping the operational manager take advantage of this
information. Office and e-mail integration also helps managers share information
with their colleagues in a structured and intuitive way.
Integrating Operations and Finance: A Two-Way Street Page 12
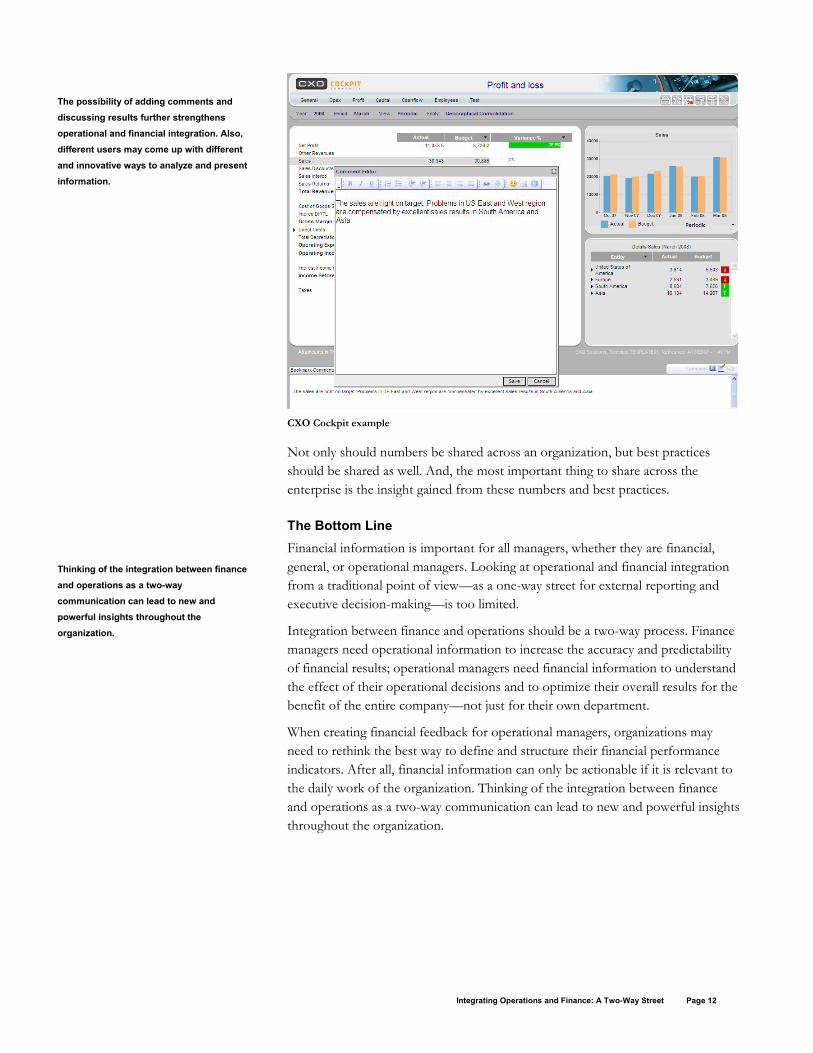
CXO Cockpit example
Not only should numbers be shared across an organization, but best practices
should be shared as well. And, the most important thing to share across the
enterprise is the insight gained from these numbers and best practices.
The Bottom Line
Financial information is important for all managers, whether they are financial,
general, or operational managers. Looking at operational and financial integration
from a traditional point of view—as a one-way street for external reporting and
executive decision-making—is too limited.
Integration between finance and operations should be a two-way process. Finance
managers need operational information to increase the accuracy and predictability
of financial results; operational managers need financial information to understand
the effect of their operational decisions and to optimize their overall results for the
benefit of the entire company—not just for their own department.
When creating financial feedback for operational managers, organizations may
need to rethink the best way to define and structure their financial performance
indicators. After all, financial information can only be actionable if it is relevant to
the daily work of the organization. Thinking of the integration between finance
and operations as a two-way communication can lead to new and powerful insights
throughout the organization.
The possibility of adding comments and
discussing results further strengthens
operational and financial integration. Also,
different users may come up with different
and innovative ways to analyze and present
information.
Thinking of the integration between finance
and operations as a two-way
communication can lead to new and
powerful insights throughout the
organization.
Integrating Operations and Finance: A Two-Way Street Page 13
About Oracle’s Enterprise Performance Management System
Oracle is the leader in Enterprise Performance Management (EPM), unifying
performance management and business intelligence (BI) and supporting a broad
range of strategic, financial, and operational management processes. Oracle
provides a complete and integrated system for managing and optimizing
enterprise-wide performance, letting organizations achieve a state of management
excellence that provides competitive advantage and leverages their operational
investments.
Oracle’s Hyperion Financial Management (Financial Management) is part of the
market-leading suite of Web-based, performance management software
applications that deliver global collection reporting and analysis in a single, highly
scalable solution. Financial Management uses today's most advanced technology,
yet is built to be owned and maintained by the organization’s finance team. You
can use Financial Management to
• Accelerate reporting cycles. Reduce closing cycles by days, and deliver
more timely results to internal and external stakeholders
• Improve confidence and compliance. Help reduce the cost of compliance
(as stipulated by the Sarbanes-Oxley Act, BASEL II, and other regulatory
requirements) and build a sustainable compliance framework
• Perform strategic analysis. Spend less time on processing and more time
on value-added analysis
• Deliver a single truth. Provide a single version of the truth to support
financial management and statutory reporting
• Easily integrate. Integrate not only with Oracle products, but also with
your existing infrastructure
Oracle Business Intelligence Applications
Oracle Business Intelligence (BI) Applications are complete, prebuilt BI solutions
that deliver intuitive, role-based intelligence for everyone in an organization—from
front line employees to senior management—that enable better decisions, actions,
and business processes. Based on best practices, these solutions enable
organizations to gain greater insight and value from a range of data sources and
applications including Oracle E-Business Suite, PeopleSoft, Siebel, and third party
systems such as SAP.
Oracle BI Applications are built on the Oracle BI Suite Enterprise Edition, a
comprehensive, innovative, and leading BI platform. This enables organizations to
realize the value of a packaged BI Application, such as rapid deployment, lower
TCO, and built-in best practices, while also being able to easily extend those
solutions to meet their specific needs, or build completely custom BI
applications—all on one common BI foundation.
Integrating Operations and Finance: A Two-Way Street Page 14
About CXO-Cockpit Community
The CXO-Cockpit Community is a network of CFO’s and finance professionals
from large organizations, sharing their best practices for presentation of financial
data. This network of professionals created a platform (www.cxo-cockpit.com) and
developed a product (the CXO-Cockpit) that brings these presentations into
practice. The CXO-Cockpit is an out-of-the-box executive dashboard that presents
data from consolidated Oracle/Hyperion systems. For information about CXO
Solutions, visit www.cxo-cockpit.com.
About Oracle Corporation
Oracle is the leader in Enterprise Performance Management (EPM), unifying
Performance Management and Business Intelligence (BI), supporting a broad
range of strategic, financial and operational management processes. Oracle
provides a complete and integrated system for managing and optimizing
enterprise-wide performance. This allows organizations to achieve a state of
management excellence – being smart, agile and aligned - which provides
competitive advantage and leverages their operational investments.
Smart – Leverage market-leading products and technologies that address
enterprise-wide requirements and drive new insights into your business
Agile – Enable advanced integration that improves agility and lowers costs of
ownership
Aligned – Drive pervasive intelligence across the enterprise by linking strategic,
financial and operational management processes
For more information go to http://www.oracle.com/epm.
Contact us with any comments or questions at [email protected].
Integrating Operations and Finance: A Two-Way Street
August 2008
Authors: Frank Buytendijk, Vice President, EPM Strategy, Oracle
Marcel Vlug, CEO, CXO Solutions
Oracle Corporation
World Headquarters
500 Oracle Parkway
Redwood Shores, CA 94065
U.S.A.
Worldwide Inquiries:
Phone: +1.650.506.7000
Fax: +1.650.506.7200
oracle.com
Copyright © 2008, Oracle. All rights reserved.
This document is provided for information purposes only and the
contents hereof are subject to change without notice.
This document is not warranted to be error-free, nor subject to any
other warranties or conditions, whether expressed orally or implied
in law, including implied warranties and conditions of merchantability
or fitness for a particular purpose. We specifically disclaim any
liability with respect to this document and no contractual obligations
are formed either directly or indirectly by this document. This document
may not be reproduced or transmitted in any form or by any means,
electronic or mechanical, for any purpose, without our prior written permission.
Oracle, JD Edwards, and PeopleSoft are registered trademarks of
Oracle Corporation and/or its affiliates. Other names may be trademarks
of their respective owners.