Embed Size (px)
Citation preview
INTEGRATING SCIENCE AND MATH THROUGH LAB ACTIVITIES
EDTL 611 Final Project
By
Susan Joseph and Heidi Koedam
June 2007
Table of Contents -Rationale & Summary pgs. 3-6
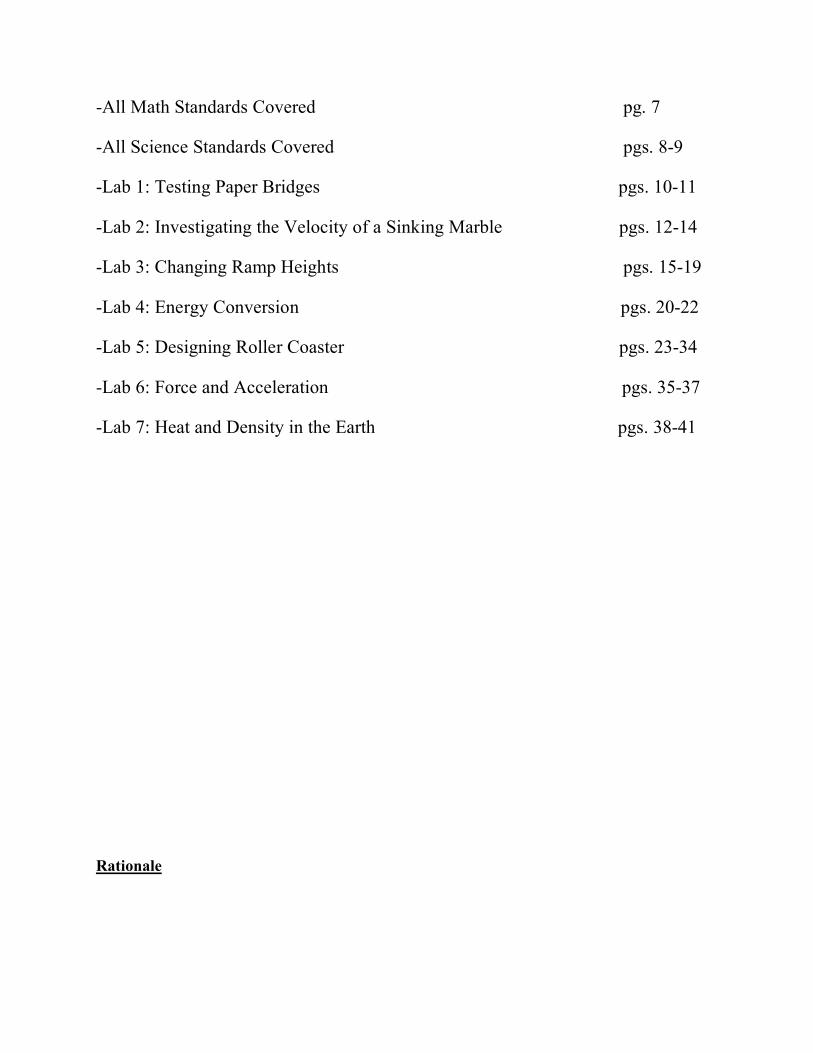
-All Math Standards Covered pg. 7
-All Science Standards Covered pgs. 8-9
-Lab 1: Testing Paper Bridges pgs. 10-11
-Lab 2: Investigating the Velocity of a Sinking Marble pgs. 12-14
-Lab 3: Changing Ramp Heights pgs. 15-19
-Lab 4: Energy Conversion pgs. 20-22
-Lab 5: Designing Roller Coaster pgs. 23-34
-Lab 6: Force and Acceleration pgs. 35-37
-Lab 7: Heat and Density in the Earth pgs. 38-41
Rationale
Our intent with this project was to use lab activities for the 9th grade physical science
classroom and connect them to mathematics concepts that are taught at the 9th grade level.
Teachers and others that create lesson plans often focus on connecting their lesson to a real world
experience. We feel that it is also important to connect these lesson plans and activities to
content knowledge that is taught in other classrooms, particularly the math classroom.
We feel that it is important for students to be exposed to a concept from more than one
angle in order to properly store this information into their long-term memory. Information is
transferred to long-term memory when networks in our brains are created and used often enough
that the information can be easily retrieved (Sprenger, 2005). The lesson plans that we have
complied and adapted are intended to allow students to create these networks. Many of the lab
activities focus on the same mathematical standards. Our intention is that this focus will
repeatedly require students to access the same information over and over again, thus creating a
stronger long-term memory.
Summary
Our lesson plans and lab activities focus on the following concepts that are addressed in a
9th grade physical science classroom: energy (physical, kinetic, and thermal), density, velocity,
and acceleration. This collection of topics will allow our students to use the same math skills
over and over again throughout all different lesson topics. According to Case, Wienholtz, &
Mcgivney (1994), traditionally, math and science have been kept completely separate at the high
school level, but reform efforts have recognized the similarities in thinking skills used in both
disciplines. We feel that repetition of basic math skills in the context of science lessons will
allow students to see the mathematical connection to science concepts.
Since our intention was to integrate mathematical skills into the physical science
curriculum, we chose to research physical science lessons from different textbooks and websites
and adapt them to include indicators from the Ohio Academic Mathematics Standards. Many of
the lesson plans we found merely brushed across a math concept. With some minor tweaking we
were able to create some higher-level mathematical questions that also enabled us to hit on
several of the 9th grade math standards.
Throughout her first year of teaching, Susie noticed that her students do not have a solid
understanding of how to translate data gathered from a lab activity and display this information
in graphical format. This math content is actually expected to be taught in the 8th grade.
However, seeing that many students still struggle with this concept, we have included a lesson
strictly intended to teach this concept. The “Testing Paper Bridges” lesson enables students to
learn for themselves how to translate data from a table to a graph. The discussion questions
allow for them to make predictions about data points not specifically tested. This discussion
extends itself to the introduction of the trendline or graph model. It is our hope that completing
this lesson at the beginning of the school year will adequately prepare students to analyze data
from future lab activities properly.
The remaining lessons and lab activities are related to physical science and have been
tweaked to hit on several of the math standards. The repetition of graphing data and analyzing
these graphs will allow for students to commit these standards into long-term memory. Bybee
(2002) mentions the analysis and interpretation of data as a key component in fostering scientific
inquiry in students. There are science standards that state that students should be able to come to
logical conclusions based on data and be able to write and present lab reports. These particular

standards are important because the concept of graphing shows up in numerous places on the
Ohio Graduation Test (OGT). Students will see graphing-related questions in both the math and
science portions of this test. There is also a good chance they will be seen in the social studies
portion of the test as well. Often students give up on a science OGT question before even
looking closely at it because it contains a graph or table that they are afraid to try to interpret. If
we can get this one idea of interpreting scientific data using math committed to the long-term
memory of our students, they will have a much better chance of passing the OGT.
Bibliography
Bybee, R. (2002). Learning science and the science of learning. Arlington, VA: National
Science Teachers Association.
Case, K., Weinholtz, D., & McGivney, R. (1994).
Presented to the Annual Meeting of the New England Educational Research
Organization: Sharing the vision: Curriculum articulation in math and science K-U in an
urban school district. Rockport, ME.
Sprenger, M. (2005). How to teach so students remember. Alexandria, VA:
Association for Supervision and Curriculum Development.
All Math Standards Covered:
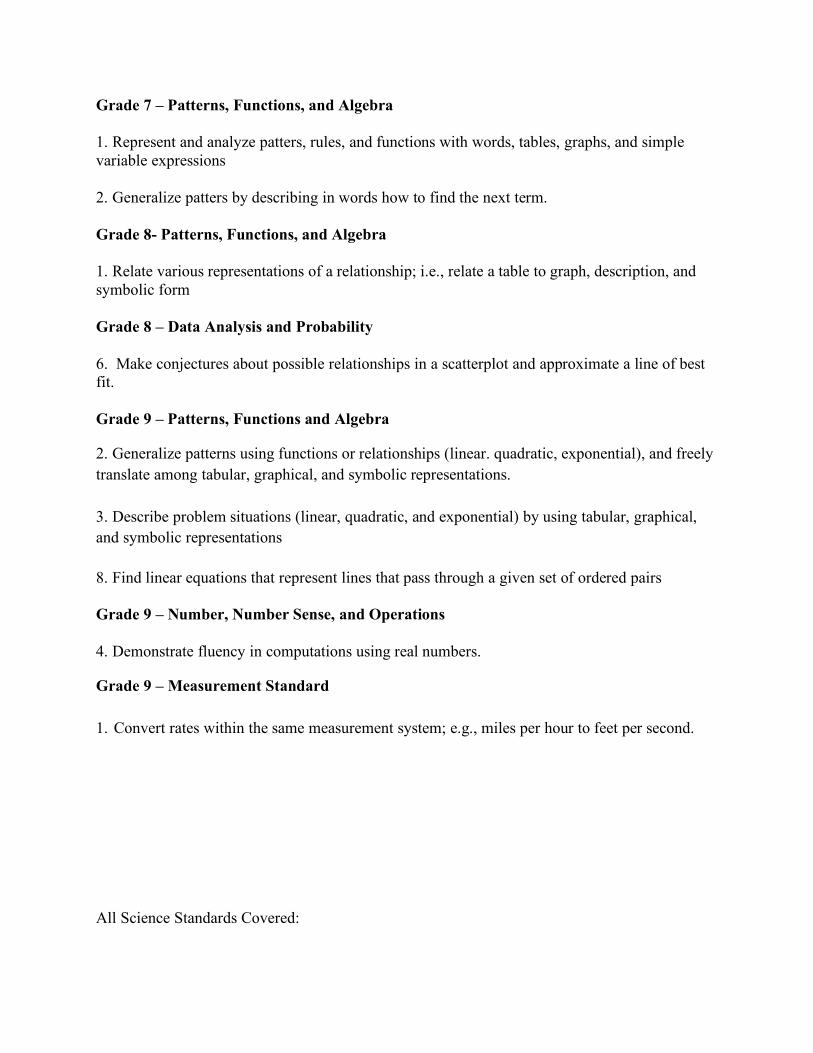
Grade 7 – Patterns, Functions, and Algebra
1. Represent and analyze patters, rules, and functions with words, tables, graphs, and simple variable expressions
2. Generalize patters by describing in words how to find the next term.
Grade 8- Patterns, Functions, and Algebra
1. Relate various representations of a relationship; i.e., relate a table to graph, description, and symbolic form
Grade 8 – Data Analysis and Probability
6. Make conjectures about possible relationships in a scatterplot and approximate a line of best fit.
Grade 9 – Patterns, Functions and Algebra
2. Generalize patterns using functions or relationships (linear. quadratic, exponential), and freely translate among tabular, graphical, and symbolic representations. 3. Describe problem situations (linear, quadratic, and exponential) by using tabular, graphical, and symbolic representations
8. Find linear equations that represent lines that pass through a given set of ordered pairs
Grade 9 – Number, Number Sense, and Operations
4. Demonstrate fluency in computations using real numbers.
Grade 9 – Measurement Standard 1. Convert rates within the same measurement system; e.g., miles per hour to feet per second.
All Science Standards Covered:
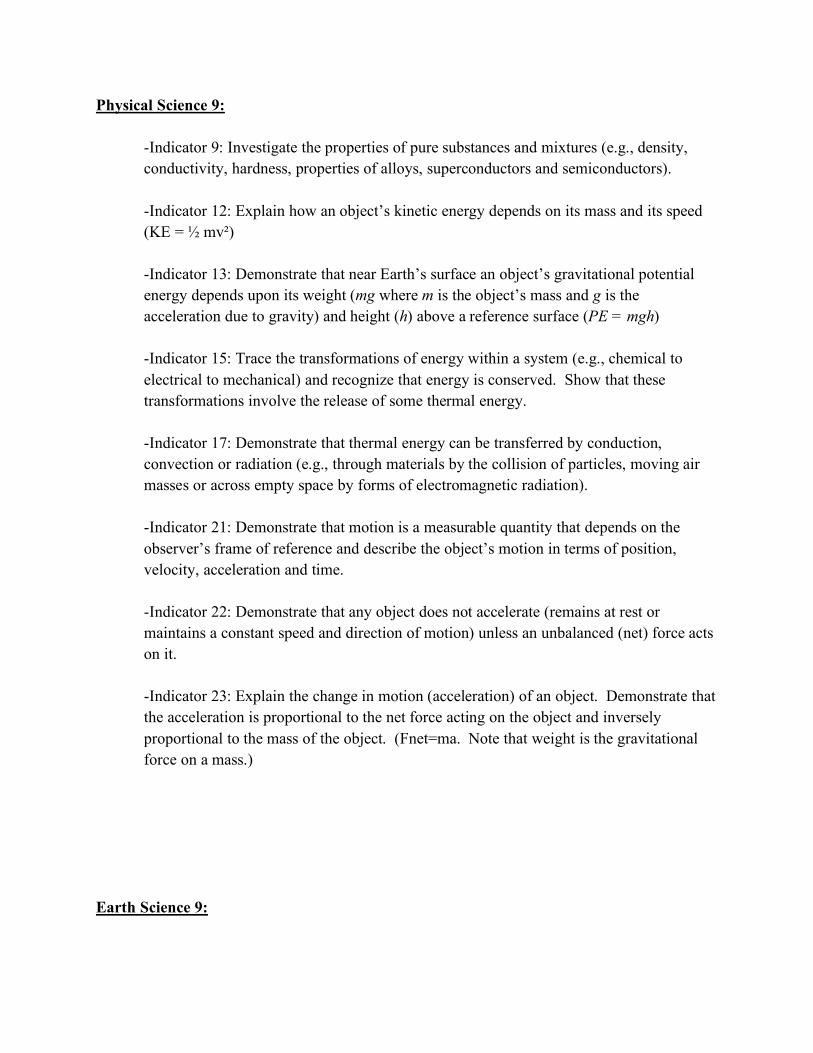
Physical Science 9:
-Indicator 9: Investigate the properties of pure substances and mixtures (e.g., density, conductivity, hardness, properties of alloys, superconductors and semiconductors). -Indicator 12: Explain how an object’s kinetic energy depends on its mass and its speed (KE = ½ mv²) -Indicator 13: Demonstrate that near Earth’s surface an object’s gravitational potential energy depends upon its weight (mg where m is the object’s mass and g is the acceleration due to gravity) and height (h) above a reference surface (PE = mgh) -Indicator 15: Trace the transformations of energy within a system (e.g., chemical to electrical to mechanical) and recognize that energy is conserved. Show that these transformations involve the release of some thermal energy. -Indicator 17: Demonstrate that thermal energy can be transferred by conduction, convection or radiation (e.g., through materials by the collision of particles, moving air masses or across empty space by forms of electromagnetic radiation). -Indicator 21: Demonstrate that motion is a measurable quantity that depends on the observer’s frame of reference and describe the object’s motion in terms of position, velocity, acceleration and time. -Indicator 22: Demonstrate that any object does not accelerate (remains at rest or maintains a constant speed and direction of motion) unless an unbalanced (net) force acts on it. -Indicator 23: Explain the change in motion (acceleration) of an object. Demonstrate that the acceleration is proportional to the net force acting on the object and inversely proportional to the mass of the object. (Fnet=ma. Note that weight is the gravitational force on a mass.)
Earth Science 9:
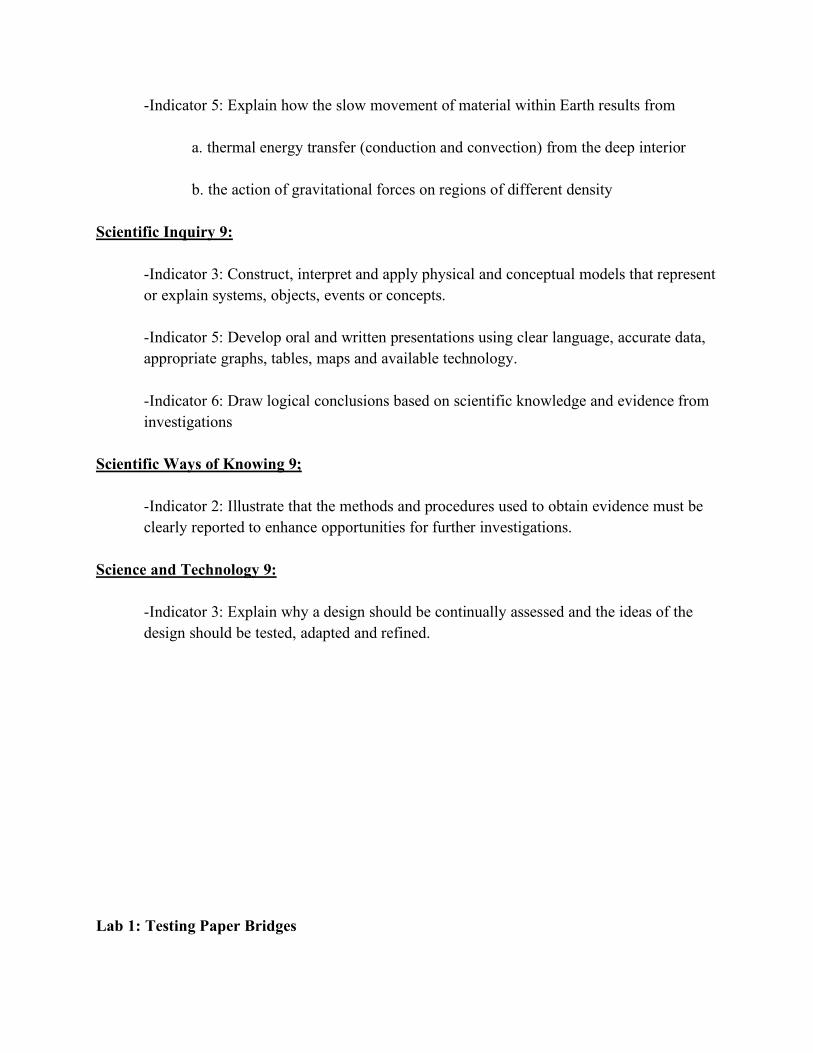
-Indicator 5: Explain how the slow movement of material within Earth results from
a. thermal energy transfer (conduction and convection) from the deep interior b. the action of gravitational forces on regions of different density
Scientific Inquiry 9:
-Indicator 3: Construct, interpret and apply physical and conceptual models that represent or explain systems, objects, events or concepts. -Indicator 5: Develop oral and written presentations using clear language, accurate data, appropriate graphs, tables, maps and available technology. -Indicator 6: Draw logical conclusions based on scientific knowledge and evidence from investigations
Scientific Ways of Knowing 9;
-Indicator 2: Illustrate that the methods and procedures used to obtain evidence must be clearly reported to enhance opportunities for further investigations.
Science and Technology 9:
-Indicator 3: Explain why a design should be continually assessed and the ideas of the design should be tested, adapted and refined.
Lab 1: Testing Paper Bridges
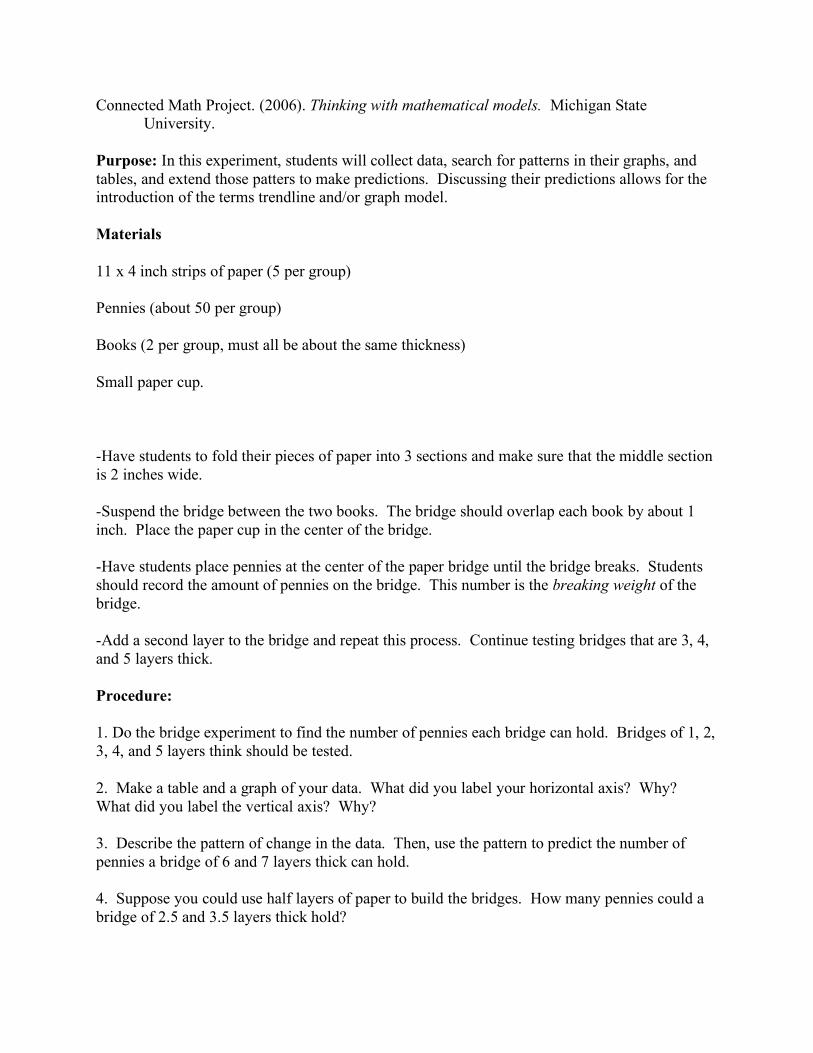
Connected Math Project. (2006). Thinking with mathematical models. Michigan State University.
Purpose: In this experiment, students will collect data, search for patterns in their graphs, and tables, and extend those patters to make predictions. Discussing their predictions allows for the introduction of the terms trendline and/or graph model.
Materials
11 x 4 inch strips of paper (5 per group)
Pennies (about 50 per group)
Books (2 per group, must all be about the same thickness)
Small paper cup.
-Have students to fold their pieces of paper into 3 sections and make sure that the middle section is 2 inches wide.
-Suspend the bridge between the two books. The bridge should overlap each book by about 1 inch. Place the paper cup in the center of the bridge.
-Have students place pennies at the center of the paper bridge until the bridge breaks. Students should record the amount of pennies on the bridge. This number is the breaking weight of the bridge.
-Add a second layer to the bridge and repeat this process. Continue testing bridges that are 3, 4, and 5 layers thick.
Procedure:
1. Do the bridge experiment to find the number of pennies each bridge can hold. Bridges of 1, 2, 3, 4, and 5 layers think should be tested.
2. Make a table and a graph of your data. What did you label your horizontal axis? Why? What did you label the vertical axis? Why?
3. Describe the pattern of change in the data. Then, use the pattern to predict the number of pennies a bridge of 6 and 7 layers thick can hold.
4. Suppose you could use half layers of paper to build the bridges. How many pennies could a bridge of 2.5 and 3.5 layers thick hold?
*As the class discusses their answers for problems 2, 3, and 4 the concept of trendline or graph model will come up. A graph model is a straight line or curve that shows a trend in a set of data. Once you fit a graph model to a set of data, you can use it to make predictions about values between and beyond the values in your data.
Ohio Academic Content Standards for Lab 1:
MATH:
Grade 7 – Patterns, Functions, and Algebra
1. Represent and analyze patters, rules, and functions with words, tables, graphs, and simple variable expressions
2. Generalize patters by describing in words how to find the next term.
Grade 8 – Patterns, Functions, and Algebra
1. Relate the various representations of a relationship; i.e., relate a table to a graph, description, and symbolic form.
Grade 8 – Data Analysis and Probability
6. Make conjectures about possible relationships in a scatterplot and approximate a line of best fit.
SCIENCE:
Scientific Inquiry grade 9, Indicator 3: Construct, interpret and apply physical and conceptual models that represent or explain systems, objects, events or concepts.
Scientific Inquiry grade 9, Indicator 5: Develop oral and written presentations using clear language, accurate data, appropriate graphs, tables, maps and available technology.
Scientific Inquiry grade 9, Indicator 6: Draw logical conclusions based on scientific knowledge and evidence from investigations
Lab 2: Investigating the Velocity of a Sinking Marble
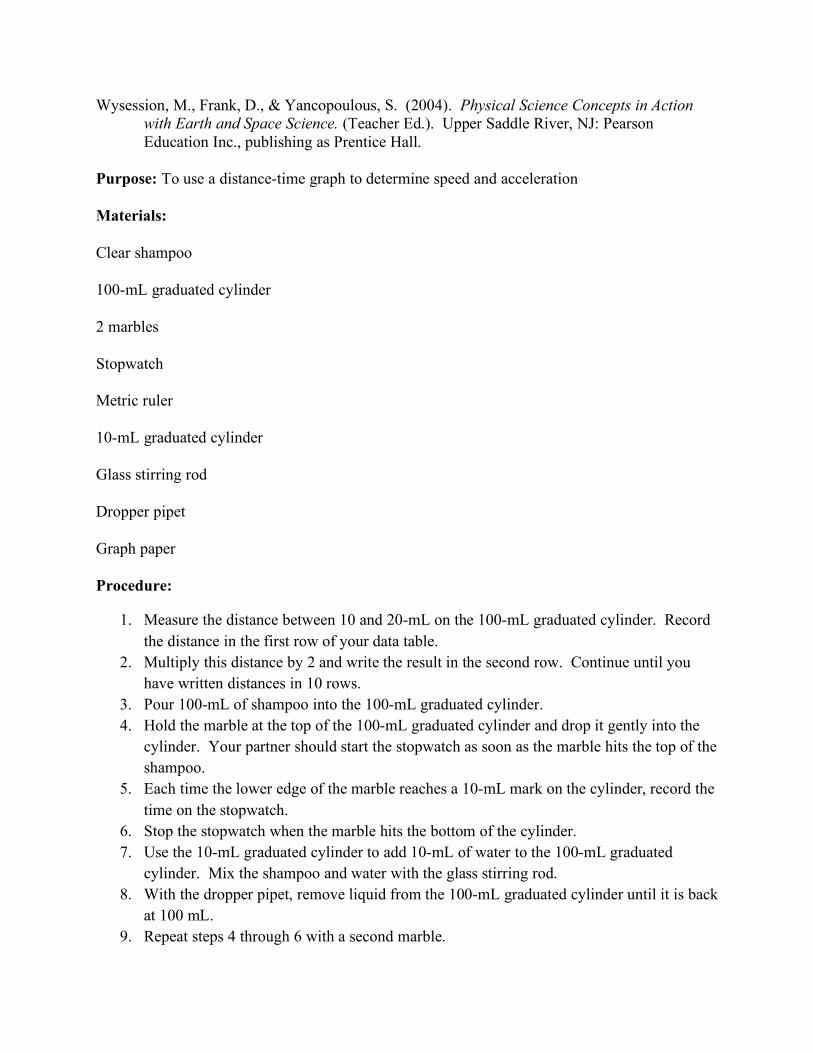
Wysession, M., Frank, D., & Yancopoulous, S. (2004). Physical Science Concepts in Action with Earth and Space Science. (Teacher Ed.). Upper Saddle River, NJ: Pearson Education Inc., publishing as Prentice Hall.
Purpose: To use a distance-time graph to determine speed and acceleration
Materials:
Clear shampoo
100-mL graduated cylinder
2 marbles
Stopwatch
Metric ruler
10-mL graduated cylinder
Glass stirring rod
Dropper pipet
Graph paper
Procedure:
1. Measure the distance between 10 and 20-mL on the 100-mL graduated cylinder. Record the distance in the first row of your data table.
2. Multiply this distance by 2 and write the result in the second row. Continue until you have written distances in 10 rows.
3. Pour 100-mL of shampoo into the 100-mL graduated cylinder. 4. Hold the marble at the top of the 100-mL graduated cylinder and drop it gently into the
cylinder. Your partner should start the stopwatch as soon as the marble hits the top of the shampoo.
5. Each time the lower edge of the marble reaches a 10-mL mark on the cylinder, record the time on the stopwatch.
6. Stop the stopwatch when the marble hits the bottom of the cylinder. 7. Use the 10-mL graduated cylinder to add 10-mL of water to the 100-mL graduated
cylinder. Mix the shampoo and water with the glass stirring rod. 8. With the dropper pipet, remove liquid from the 100-mL graduated cylinder until it is back
at 100 mL. 9. Repeat steps 4 through 6 with a second marble.
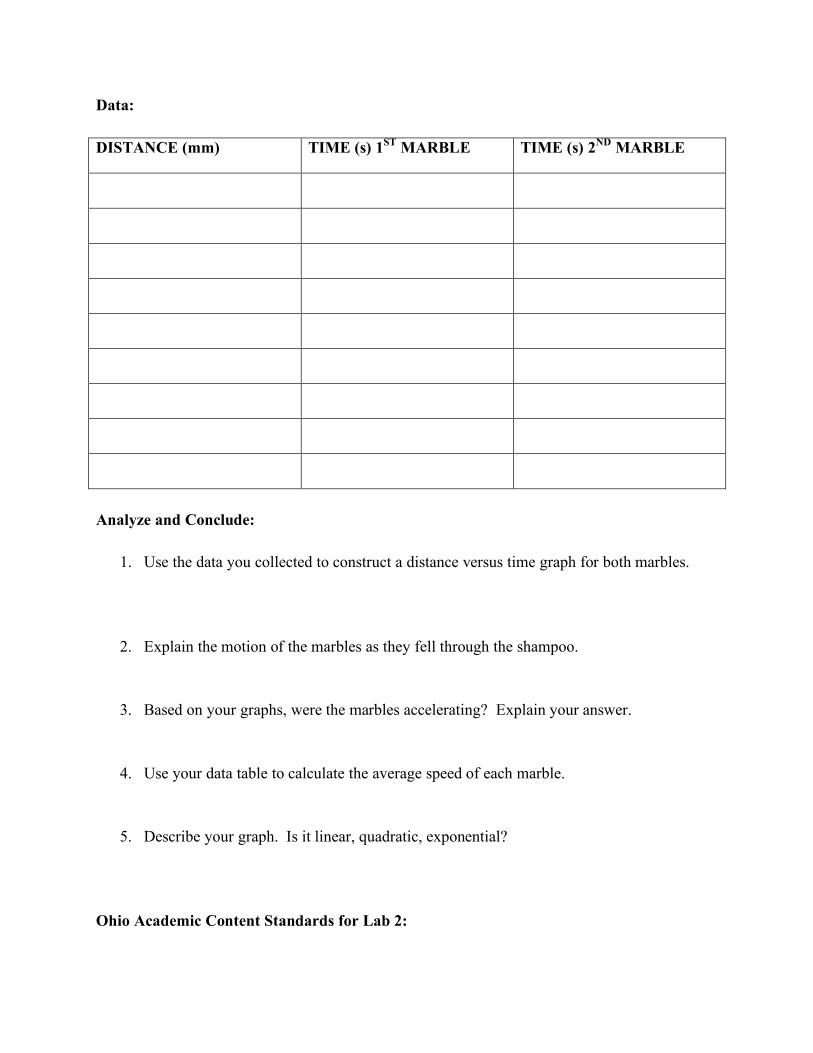
Data: DISTANCE (mm) TIME (s) 1ST MARBLE TIME (s) 2ND MARBLE
Analyze and Conclude:
1. Use the data you collected to construct a distance versus time graph for both marbles.
2. Explain the motion of the marbles as they fell through the shampoo.
3. Based on your graphs, were the marbles accelerating? Explain your answer.
4. Use your data table to calculate the average speed of each marble.
5. Describe your graph. Is it linear, quadratic, exponential?
Ohio Academic Content Standards for Lab 2:
MATH: Grade 9 – Patterns, Functions, and Algebra 2. Generalize patterns using functions or relationships (linear. quadratic, exponential), and freely translate among tabular, graphical, and symbolic representations. 3. Describe problem situations (linear, quadratic, exponential) by using tabular, graphical, and symbolic representations Grade 9 Number, Number Sense, and Operations 4. Demonstrate fluency in computations using real numbers. SCIENCE: Physical Science grade 9, Indicator 21: Demonstrate that motion is a measurable quantity that depends on the observer’s frame of reference and describe the object’s motion in terms of position, velocity, acceleration and time. Scientific Inquiry grade 9, Indicator 6: Draw logical conclusions based on scientific knowledge and evidence from investigations. Scientific Inquiry grade 9, Indicator 5: Develop oral and written presentations using clear language, accurate data, appropriate graphs, tables, maps and available technology. Scientific Ways of Knowing grade 9, Indicator 2: Illustrate that the methods and procedures used to obtain evidence must be clearly reported to enhance opportunities for further investigations
Lab 3: Changing Ramp Heights
http://pals.sri.com/tasks/5-8/changeramp/directs.html
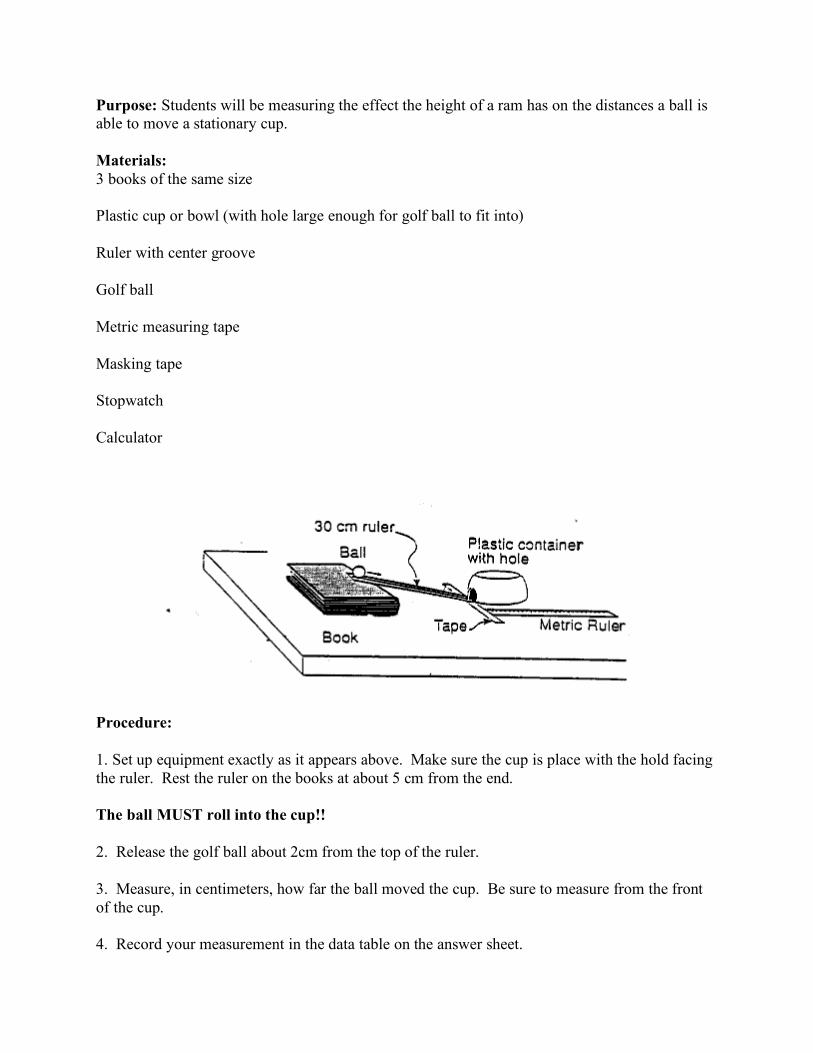
Purpose: Students will be measuring the effect the height of a ram has on the distances a ball is able to move a stationary cup.
Materials: 3 books of the same size
Plastic cup or bowl (with hole large enough for golf ball to fit into)
Ruler with center groove
Golf ball
Metric measuring tape
Masking tape
Stopwatch
Calculator
Procedure:
1. Set up equipment exactly as it appears above. Make sure the cup is place with the hold facing the ruler. Rest the ruler on the books at about 5 cm from the end.
The ball MUST roll into the cup!!
2. Release the golf ball about 2cm from the top of the ruler.
3. Measure, in centimeters, how far the ball moved the cup. Be sure to measure from the front of the cup.
4. Record your measurement in the data table on the answer sheet.

5. Record the amount of time the passes immediately after the ball rolls into the cup to when the cup moves 5 cm, 10 cm, and 20 cm.
6. Conduct two more trials for this height. Find the average of all three trials.
7. Add one book to the ramp and repeat steps 2-5
8. Add a third book to the ramp and repeat steps 2-5.
Answer Sheet
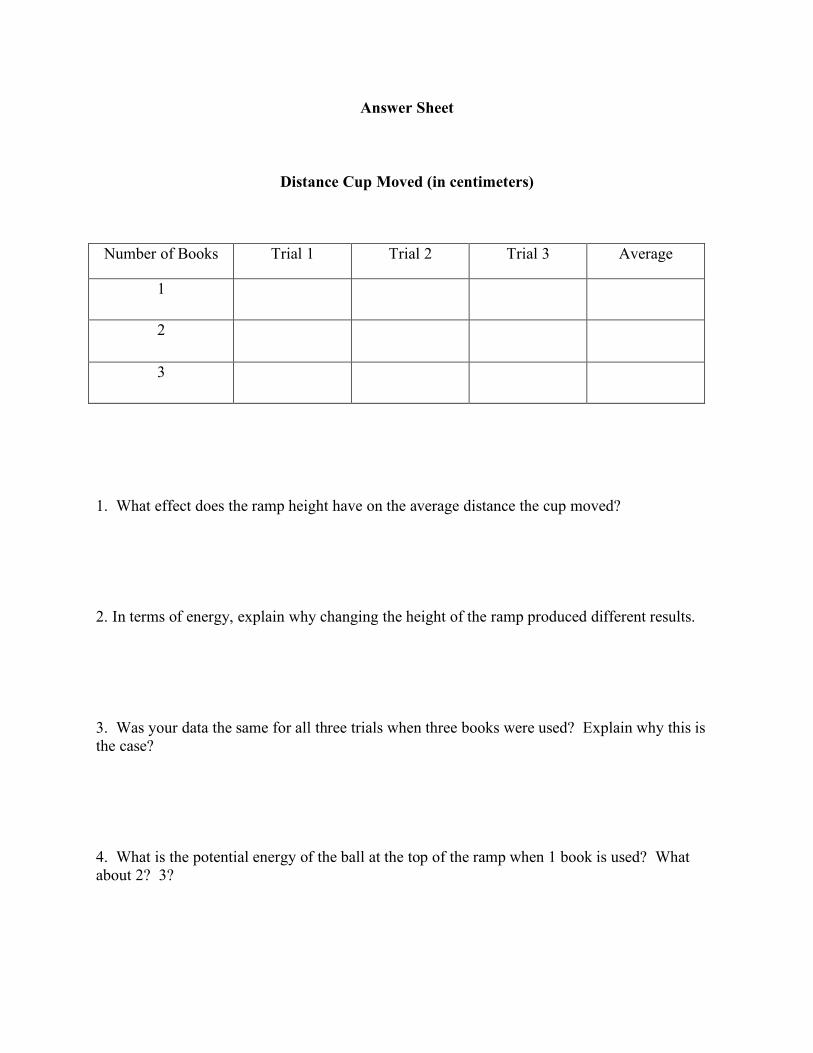
Distance Cup Moved (in centimeters)
Number of Books Trial 1 Trial 2 Trial 3 Average
1
2
3
1. What effect does the ramp height have on the average distance the cup moved?
2. In terms of energy, explain why changing the height of the ramp produced different results.
3. Was your data the same for all three trials when three books were used? Explain why this is the case?
4. What is the potential energy of the ball at the top of the ramp when 1 book is used? What about 2? 3?
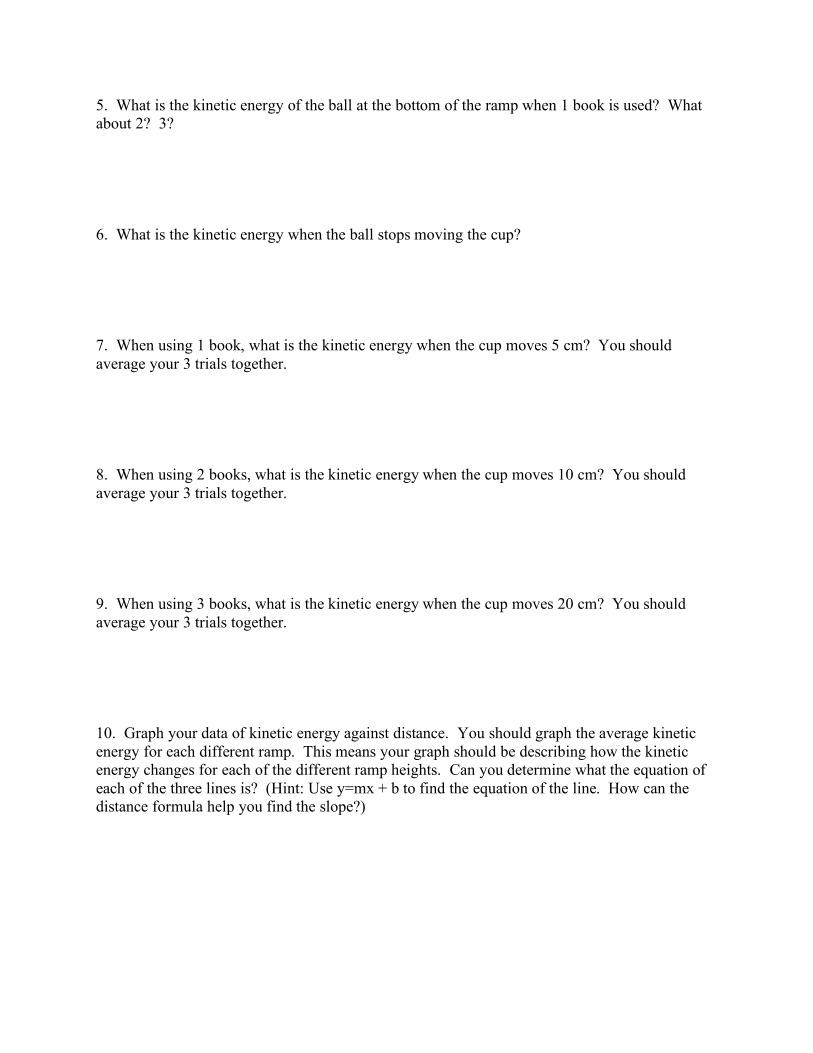
5. What is the kinetic energy of the ball at the bottom of the ramp when 1 book is used? What about 2? 3?
6. What is the kinetic energy when the ball stops moving the cup?
7. When using 1 book, what is the kinetic energy when the cup moves 5 cm? You should average your 3 trials together.
8. When using 2 books, what is the kinetic energy when the cup moves 10 cm? You should average your 3 trials together.
9. When using 3 books, what is the kinetic energy when the cup moves 20 cm? You should average your 3 trials together.
10. Graph your data of kinetic energy against distance. You should graph the average kinetic energy for each different ramp. This means your graph should be describing how the kinetic energy changes for each of the different ramp heights. Can you determine what the equation of each of the three lines is? (Hint: Use y=mx + b to find the equation of the line. How can the distance formula help you find the slope?)
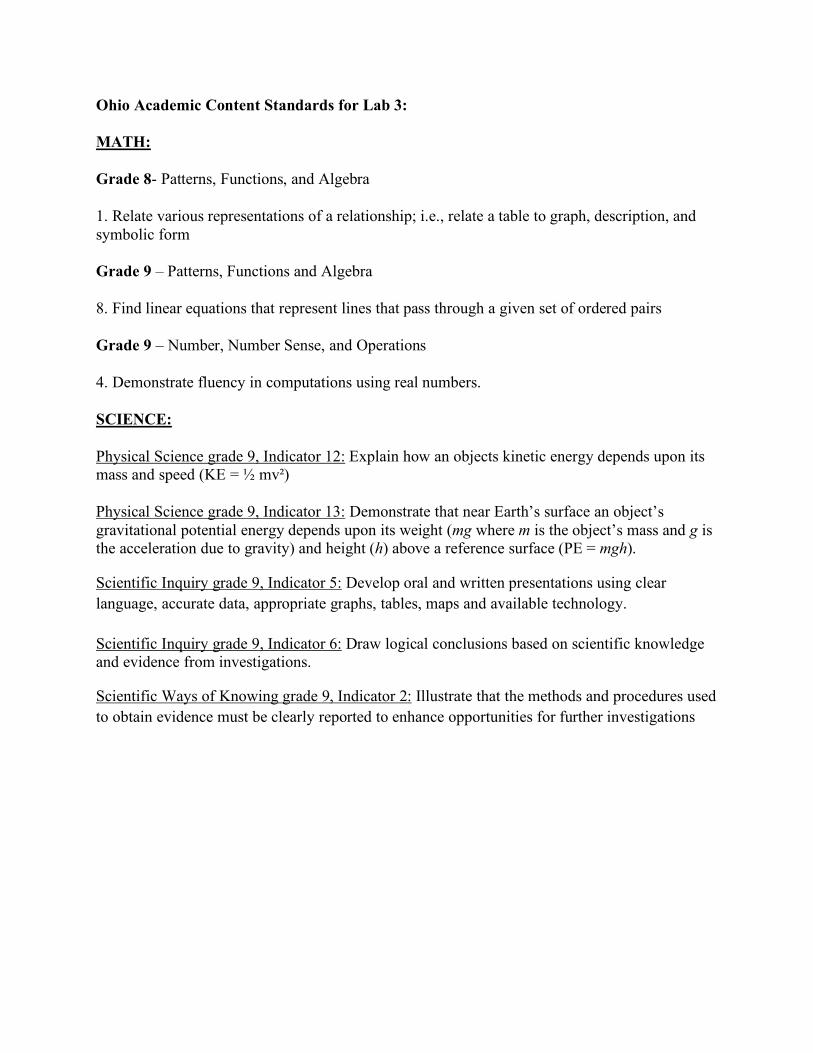
Ohio Academic Content Standards for Lab 3:
MATH:
Grade 8- Patterns, Functions, and Algebra
1. Relate various representations of a relationship; i.e., relate a table to graph, description, and symbolic form
Grade 9 – Patterns, Functions and Algebra
8. Find linear equations that represent lines that pass through a given set of ordered pairs
Grade 9 – Number, Number Sense, and Operations
4. Demonstrate fluency in computations using real numbers.
SCIENCE:
Physical Science grade 9, Indicator 12: Explain how an objects kinetic energy depends upon its mass and speed (KE = ½ mv²)
Physical Science grade 9, Indicator 13: Demonstrate that near Earth’s surface an object’s gravitational potential energy depends upon its weight (mg where m is the object’s mass and g is the acceleration due to gravity) and height (h) above a reference surface (PE = mgh).
Scientific Inquiry grade 9, Indicator 5: Develop oral and written presentations using clear language, accurate data, appropriate graphs, tables, maps and available technology.
Scientific Inquiry grade 9, Indicator 6: Draw logical conclusions based on scientific knowledge and evidence from investigations.
Scientific Ways of Knowing grade 9, Indicator 2: Illustrate that the methods and procedures used to obtain evidence must be clearly reported to enhance opportunities for further investigations
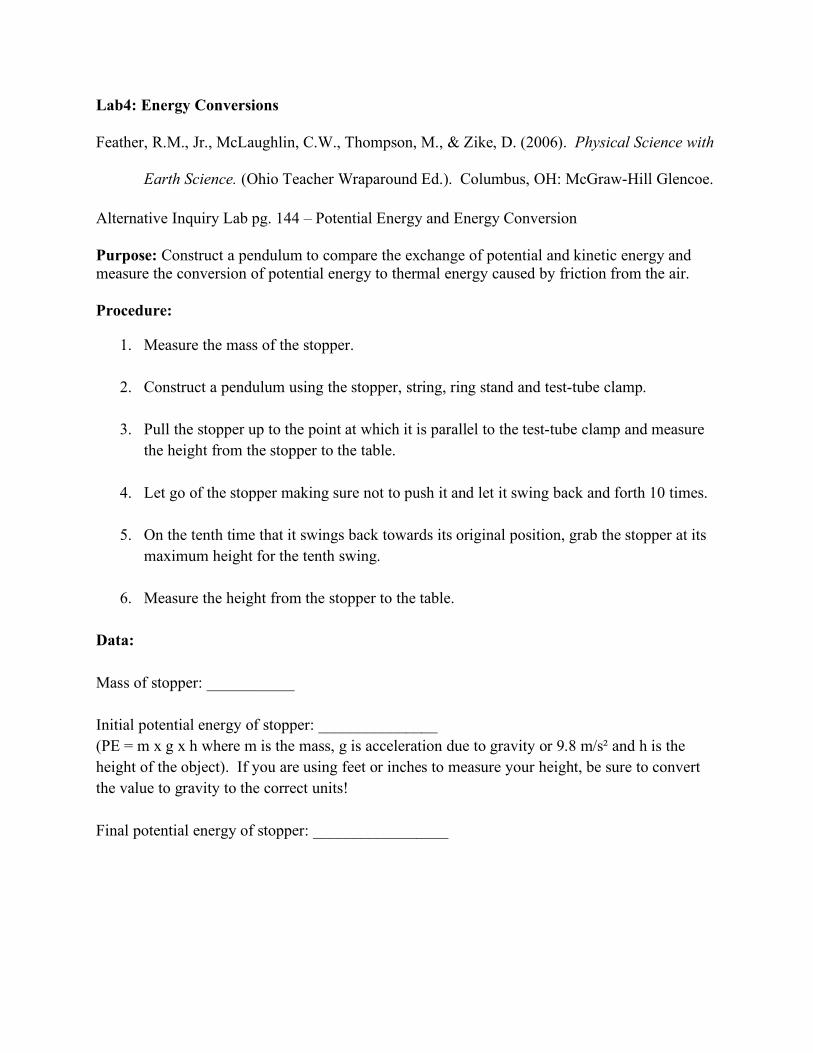
Lab4: Energy Conversions
Feather, R.M., Jr., McLaughlin, C.W., Thompson, M., & Zike, D. (2006). Physical Science with
Earth Science. (Ohio Teacher Wraparound Ed.). Columbus, OH: McGraw-Hill Glencoe.
Alternative Inquiry Lab pg. 144 – Potential Energy and Energy Conversion
Purpose: Construct a pendulum to compare the exchange of potential and kinetic energy and measure the conversion of potential energy to thermal energy caused by friction from the air.
Procedure:
1. Measure the mass of the stopper.
2. Construct a pendulum using the stopper, string, ring stand and test-tube clamp.
3. Pull the stopper up to the point at which it is parallel to the test-tube clamp and measure the height from the stopper to the table.
4. Let go of the stopper making sure not to push it and let it swing back and forth 10 times.
5. On the tenth time that it swings back towards its original position, grab the stopper at its maximum height for the tenth swing.
6. Measure the height from the stopper to the table.
Data: Mass of stopper: ___________ Initial potential energy of stopper: _______________ (PE = m x g x h where m is the mass, g is acceleration due to gravity or 9.8 m/s² and h is the height of the object). If you are using feet or inches to measure your height, be sure to convert the value to gravity to the correct units! Final potential energy of stopper: _________________
Conclusion Questions:
1. Describe how potential energy is converted to kinetic energy and back to potential energy again in the pendulum you created.
2. How does your stopper’s initial potential energy compare to its final potential energy?
3. Where has the energy from the start of the swing gone?
4. Do your results support the law of conservation of energy? Why or why not?
5. What happens if the mass of the stopper is increased?
Ohio Academic Content Standards for Lab 4: MATH: Grade 9 – Number, Number Sense, and Operations 4. Demonstrate fluency in computations using real numbers. Grade 9 – Measurement Standard 1. Convert rates within the same measurement system; e.g., miles per hour to feet per second.
SCIENCE: Physical Science grade 9, Indicator 15: Trace the transformations of energy within a system (e.g., chemical to electrical to mechanical) and recognize that energy is conserved. Show that these transformations involve the release of some thermal energy.
Physical Science grade 9, Indicator 12: Explain how an objects kinetic energy depends upon its mass and speed (KE = ½ mv²)
Physical Science grade 9, Indicator 13: Demonstrate that near Earth’s surface an object’s gravitational potential energy depends upon its weight (mg where m is the object’s mass and g is the acceleration due to gravity) and height (h) above a reference surface (PE = mgh).
Scientific Inquiry grade 9, Indicator 6: Draw logical conclusions based on scientific knowledge and evidence from investigations. Scientific Inquiry grade 9, Indicator 5: Develop oral and written presentations using clear language, accurate data, appropriate graphs, tables, maps and available technology. Scientific Ways of Knowing grade 9, Indicator 2: Illustrate that the methods and procedures used to obtain evidence must be clearly reported to enhance opportunities for further investigations
Scientific Inquiry grade 9, Indicator 3: Construct, interpret and apply physical and conceptual models that represent or explain systems, objects, events or concepts.
Lab 5: Designing Roller Coasters
*Lab and all attachments adapted from ODE lab “Up and Down Designs Roller Coaster Rides” from Ohio’s Instructional Management System:
http://ims.ode.state.oh.us/ode/ims/Search/LessonPlans/CSC_LP_S03_BE_L09_I13_01_SearchResults.asp
Purpose: To demonstrate the difference between potential and kinetic energy by designing foam tubing roller coasters.
Duration: This lab could take anywhere from 2 to 4 days depending on what type of scheduling you have. I wrote the procedure out in full since every class could be different in where they separate day 1 from day 2 and so on.
Materials:
Basketball
Book
Toy car
6 foot lengths of foam pipe insulation tubing cut in half lengthwise for each group
Masking tape
Toothpicks
Small marbles
Large marbles
Small container to catch marbles
Tape measure
Meter sticks
Scissors
Rulers
K and P labels for labeling kinetic and potential energy
Procedure:
1. Pre-assessment demonstration – various different demonstrations can be done such as bouncing a basketball, rolling a toy car or dropping a book. Hold a class discussion about the demonstrations addressing the following questions:
a. How do you define potential and kinetic energy?
b. When is potential energy the greatest in these demonstrations? When is it the least?
c. When is kinetic energy the greatest in these demonstrations? When is it the least?
d. If the basketball or book is dropped from a greater height, how are the potential and kinetic energy affected?
2. Show short video on roller coasters (these can be found online or taped off of the discovery channel or science channel).
3. Hold a class discussion about what students know about the energy conversions that occur during a roller coaster.
4. Have students read Attachment E Background Information for Student Lab Groups
5. Read Attachment Energy-Coaster Design Scenario together as a class to introduce the reason for designing a roller coaster.
6. Put students into groups of 3 to 4 students and hand out Attachment C Energy-Coaster Building Guidelines.
7. Review the guidelines so that all groups understand what the requirements are.
8. Give each lab group either a large or small marble, a container to catch the marble, foam tubing, toothpicks and masking tape.
9. Let the students explore with the materials for 15 to 20 minutes and then have them take 15 to 20 minutes or so to draw their chosen design. (The two pages in Attachment D could be used to have students draw their design and record the data for their coaster dimensions.)
10. Give students a scoring rubric and discuss how their roller coaster presentations will be scored.
11. Give students ample time to construct their designed roller coaster. Have the groups use the K and P labels to show where kinetic and potential energy are the highest in their coasters.
12. Test each roller coaster by having one student from the group release the marble at the starting point.
13. After testing all coasters, discuss what worked and did not work. What shape of loop worked best? How should heights of hills and loops be arranged for a coaster to be successful? How did potential and kinetic energy play a role in which designs were successful and which were not?
Conclusion:
1. Where on the coaster is potential energy of the marble the least?
2. Where on the coaster is kinetic energy of the marble the least?
3. Where on the coaster are both the potential and kinetic energies at maximum and how do these locations compare?
Answer: Gravitational potential energy is a maximum when the height above the reference surface is the greatest. This is not a point of greatest kinetic energy. When the kinetic energy is a maximum, the gravitation potential energy is a minimum and the object is at the lowest height above the reference surface.
4. How do the three highest points on the coaster compare? Explain the significance of the magnitude and location of three heights in terms of gravitational potential energy, kinetic energy and safety.
Answer: The heights successively decrease from the initial starting point to the bottom level of the coaster. Because of energy expended to overcome effects of frictional forces, heights of successive loops must decrease so that the coaster kinetic energy entering the low point of the loops is a large enough amount of kinetic energy to allow the car to safely make it to the top of the loops.
5. How do the heights at the tops of the loops in the typical design of a corkscrew type roller coaster compare to a loop-de-loop coaster? Why do most roller coasters have corkscrew turns instead of loop-de-loops?
Answer: The tops of the loops are lower in all successive loops in corkscrew roller coasters. It takes very high starting points to ensure enough initial gravitational potential energy is transformed into kinetic energy to safely complete loop-to-loop turns to the highest points in the loops of such coaster designs. In corkscrew coasters, the coaster can continue to build speed in completing a series of down hill corkscrew turns.
Ohio Academic Content Standards for Lab 5:
MATH:
Grade 9 – Number, Number Sense and Operations
4. Demonstrate fluency in computations using real numbers.
SCIENCE:
Physical Science 9, Indicator 12: Explain how an objects kinetic energy depends upon its mass and speed (KE = ½ mv²)
Physical Science 9, Indicator 13: Demonstrate that near Earth’s surface an object’s gravitational potential energy depends upon its weight (mg where m is the object’s mass and g is the acceleration due to gravity) and height (h) above a reference surface (PE = mgh).
Science and Technology 9, Indicator 3: Explain why a design should be continually assessed and the ideas of the design should be tested, adapted and refined.
Scientific Inquiry grade 9, Indicator 6: Draw logical conclusions based on scientific knowledge and evidence from investigations.
Attachment A: Pre-Assessment Scoring Guidelines
Collect enough information from the whole class discussion held during the demonstration(s) to generally gauge students’ prior knowledge and to decide what to emphasize in this lesson. Use the following information as a guide for this informal assessment, not for grading students’ responses to the questions, for each of the demonstrations.
1. An object’s gravitational potential energy (is directly proportional to) depends upon its weight (mg where m is the object’s mass and g is the acceleration due to gravity) and height (h) above a reference surface (PE = mgh).
2. An object’s kinetic energy (is directly proportional to) depends on its mass and the speed squared (KE = ½ mv2)
3. & 4.
a) For the rolling car stopped on the table top, the car has gravitational potential relative to the floor below. When the car is moving, it also has kinetic energy, and has the most kinetic energy when it is rolling fastest.
b) For the bouncing basketball at the highest point of its bounce above the ground, the energy of the ball is a maximum potential energy (no kinetic energy). When the ball is moving, both before and after bouncing, at least part of the ball’s energy is kinetic energy and part of its energy is gravitational potential energy. Just before and just after bouncing, the kinetic energy of the ball is greatest. Gravitational potential energy is least when the ball is closest to ground level.
c) Before dropping the book when holding the book above the grounds its energy is maximum gravitational potential energy. When the book is dropping, at least part of its energy is kinetic energy and part is gravitational potential energy. The book’s kinetic energy is a maximum just before it hits the floor. Gravitational potential energy is least when the book is closest to ground level.
d) For the rolling ball, its kinetic energy is at maximum when its rolling speed is greatest. Relative to the floor, the gravitational potential energy of the rolling ball is at minimum since it is in contact with the floor.
5. Since the original height is greater than in the original situation, the potential of the basketball will be greater. And the kinetic energy of the ball will be greater than in the original situation because it falls from a greater height. Its speed will be greater just before it hits the ground (ignoring the effects of air resistance).
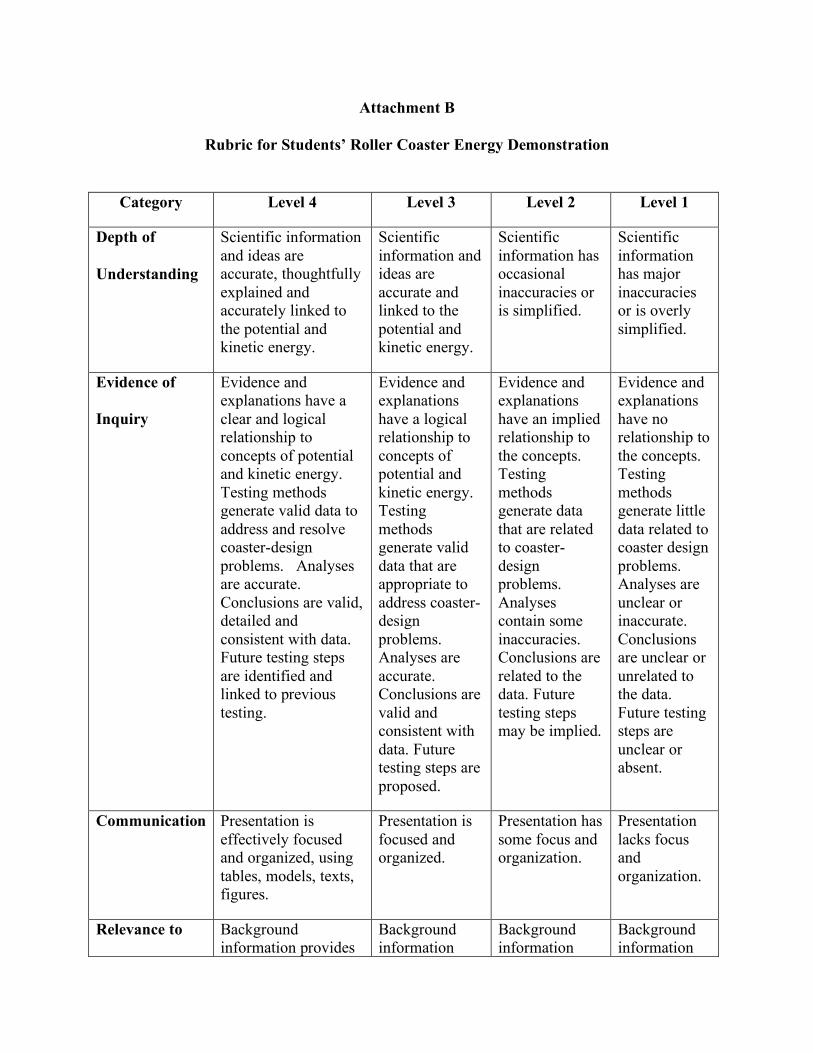
Attachment B
Rubric for Students’ Roller Coaster Energy Demonstration
Category Level 4 Level 3 Level 2 Level 1
Depth of
Understanding
Scientific information and ideas are accurate, thoughtfully explained and accurately linked to the potential and kinetic energy.
Scientific information and ideas are accurate and linked to the potential and kinetic energy.
Scientific information has occasional inaccuracies or is simplified.
Scientific information has major inaccuracies or is overly simplified.
Evidence of
Inquiry
Evidence and explanations have a clear and logical relationship to concepts of potential and kinetic energy. Testing methods generate valid data to address and resolve coaster-design problems. Analyses are accurate. Conclusions are valid, detailed and consistent with data. Future testing steps are identified and linked to previous testing.
Evidence and explanations have a logical relationship to concepts of potential and kinetic energy. Testing methods generate valid data that are appropriate to address coaster- design problems. Analyses are accurate. Conclusions are valid and consistent with data. Future testing steps are proposed.
Evidence and explanations have an implied relationship to the concepts. Testing methods generate data that are related to coaster-design problems. Analyses contain some inaccuracies. Conclusions are related to the data. Future testing steps may be implied.
Evidence and explanations have no relationship to the concepts. Testing methods generate little data related to coaster design problems. Analyses are unclear or inaccurate. Conclusions are unclear or unrelated to the data. Future testing steps are unclear or absent.
Communication Presentation is effectively focused and organized, using tables, models, texts, figures.
Presentation is focused and organized.
Presentation has some focus and organization.
Presentation lacks focus and organization.
Relevance to Background information provides
Background information
Background information
Background information
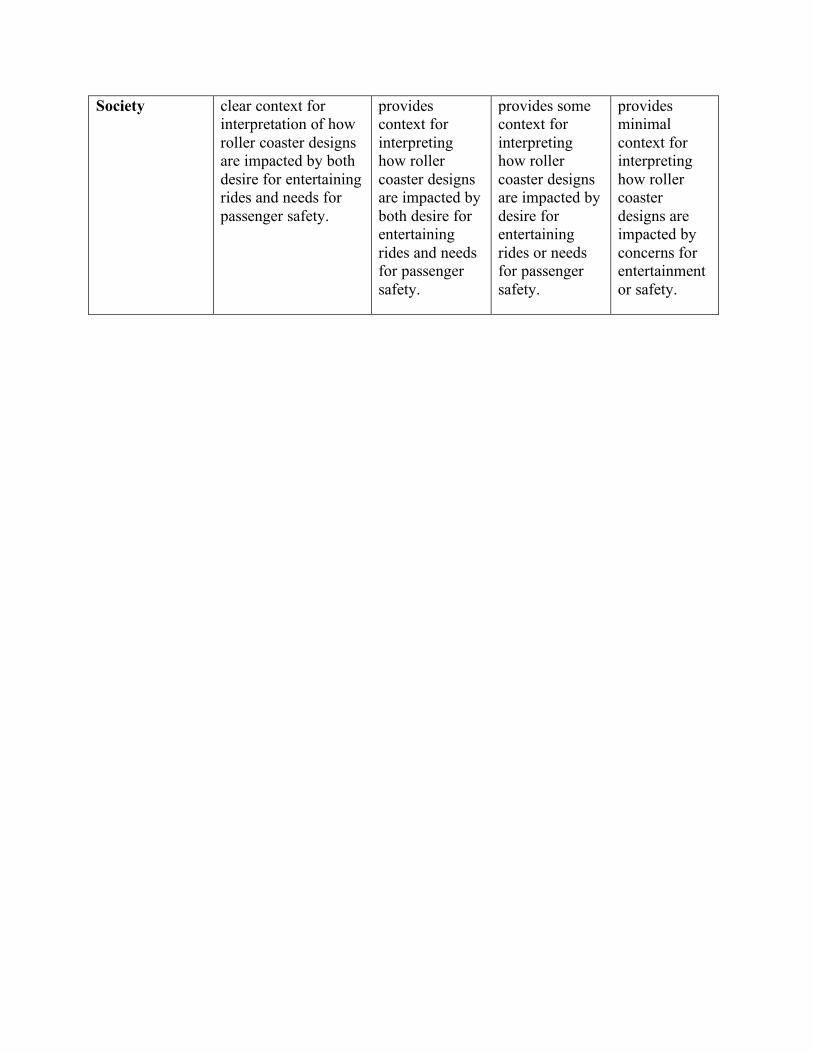
Society clear context for interpretation of how roller coaster designs are impacted by both desire for entertaining rides and needs for passenger safety.
provides context for interpreting how roller coaster designs are impacted by both desire for entertaining rides and needs for passenger safety.
provides some context for interpreting how roller coaster designs are impacted by desire for entertaining rides or needs for passenger safety.
provides minimal context for interpreting how roller coaster designs are impacted by concerns for entertainment or safety.
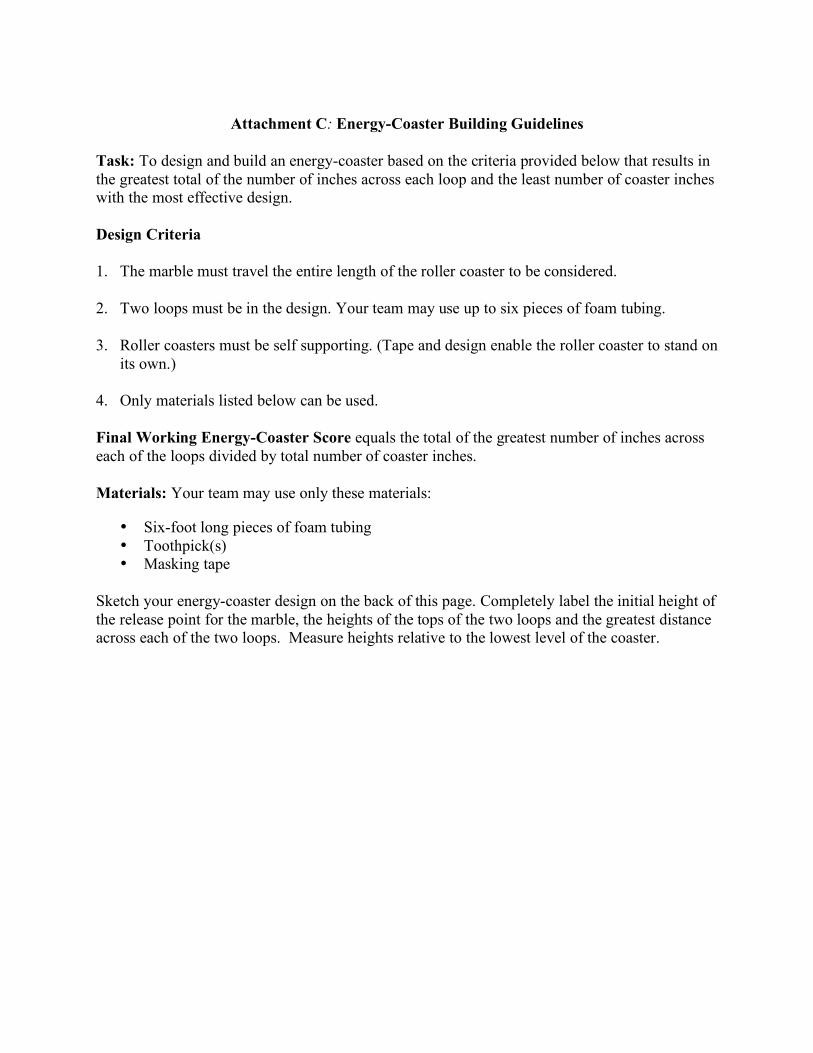
Attachment C: Energy-Coaster Building Guidelines
Task: To design and build an energy-coaster based on the criteria provided below that results in the greatest total of the number of inches across each loop and the least number of coaster inches with the most effective design.
Design Criteria
1. The marble must travel the entire length of the roller coaster to be considered.
2. Two loops must be in the design. Your team may use up to six pieces of foam tubing.
3. Roller coasters must be self supporting. (Tape and design enable the roller coaster to stand on its own.)
4. Only materials listed below can be used.
Final Working Energy-Coaster Score equals the total of the greatest number of inches across each of the loops divided by total number of coaster inches.
Materials: Your team may use only these materials:
• Six-foot long pieces of foam tubing • Toothpick(s) • Masking tape
Sketch your energy-coaster design on the back of this page. Completely label the initial height of the release point for the marble, the heights of the tops of the two loops and the greatest distance across each of the two loops. Measure heights relative to the lowest level of the coaster.
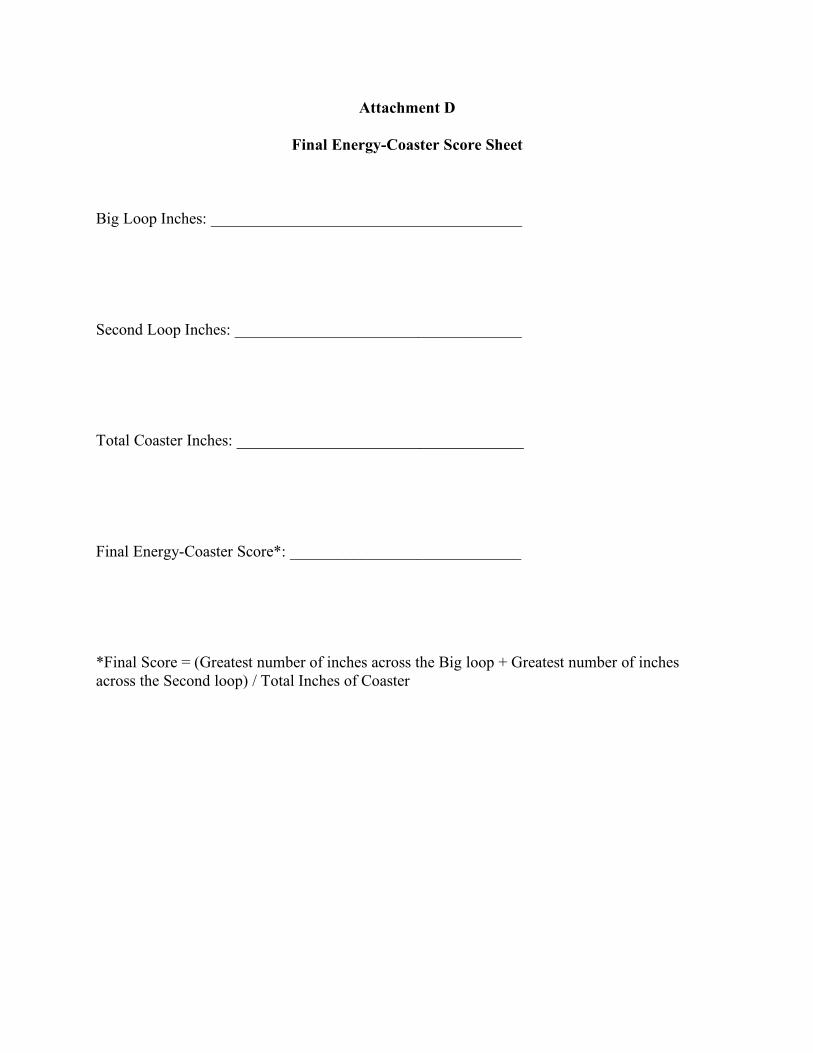
Attachment D
Final Energy-Coaster Score Sheet
Big Loop Inches: _______________________________________
Second Loop Inches: ____________________________________
Total Coaster Inches: ____________________________________
Final Energy-Coaster Score*: _____________________________
*Final Score = (Greatest number of inches across the Big loop + Greatest number of inches across the Second loop) / Total Inches of Coaster
Attachment D
Final Energy-Coaster Drawing and Data Sheet (Continued)
Mass of marble:
Labeled Drawing of Energy-Coaster: Make a neat, detailed drawing of the final working energy-coaster design on this page. Completely label the initial height of the release point for the marble, the heights of the tops of the two loops and the greatest distance across each of the two loops.
Attachment E, Energy-Coaster Resource Information
Background Information for Student Lab Groups
Roller coasters at amusement parks use gravitational potential energy and kinetic energy. Typically, the roller coaster car is pulled up a hill by a motor. The roller coaster car gains its initial gravitational potential energy.
Once at the peak point, there are no motors connected to the car in any way. The car begins its descent along a track that has been designed to safely transform the gravitational potential energy into kinetic energy of the car while making the ride entertaining for the occupants of the car.
If the car is going through a loop-to-loop and does not have enough kinetic energy, the car will not stay on the track as it reaches the peak of the loop.
Ideally, all the gravitational potential energy is converted to kinetic energy of the roller coaster car. However, effects of frictional forces result in some of the cars gravitational potential energy being transformed into other forms of energy (e.g., thermal energy). Because of this, the peak of the loops must be lower than the initial starting point of the car.
Gravitational potential energy (PE) is determined as PE = mgh, where m is the object’s mass and g is the acceleration due to gravity and h is the distance above the reference point where the mass starts.
Kinetic energy (KE) is determined as KE = (mv2)/2, where m is the object’s mass and v2 is the object’s speed squared.
Attachment E: Energy-Coaster Design Scenario
Why is a roller coaster wanted?
A local community wants to build a new roller coaster ride in preparation for its centennial celebration. An effective design must meet needs for passenger safety. The town leaders also want the roller coaster ride designed to be entertaining, producing a combination of relatively fast motion and more gentle motion with quick changes in speed and/or direction of travel. For this reason, they want the design to be as “loopy” as possible.
What’s the problem?
The town leaders need to keep the foot space taken up by the coaster to a minimum. They are looking for engineering designs that provide two complete loops, the greatest total of the number of inches across the big loop and the least number of coaster inches. Every section of a roller coaster has different characteristics. Some portions have very tight turns. Other sections have more gentle curves and turns. Given the design parameters, each coaster part has its limits for contributing to the most effective design, i.e., whether or not it will work in providing passengers an entertaining as well as a safe ride over the complete length of the coaster.
Lab 6: Force and Acceleration
Feather, R.M., Jr., McLaughlin, C.W., Thompson, M., & Zike, D. (2006). Physical Science with Earth Science. (Ohio Teacher Wraparound Ed.). Columbus, OH: McGraw-Hill Glencoe.
Goals: Observe how changing the net force on an object affects its acceleration. Interpret data collected for several trials.
Materials:
tape
paper clip
string
10 N spring scale
stop watch
large book (2)
triple beam balance
Procedure:
Tie the string around the book and attach the paper clip to the string
1. Use the balance to find the mass of the book.
2. Prepare a data table with the following headings: Force, Mass, Time
3. Tie the string around the book and attach the paper clip to the string.
4. Place the book on the floor or long table. Hook the paper clip to the spring scale.
5. Place 2 pieces of tape on the floor or table. One piece should mark the starting point of your book and the 2nd piece should be your finish line. The tape should be about 2 feet apart.
6. Pull the book across the floor or table at a slow but constant velocity. While you are pulling, read the force measured on the spring scale and record it in your data table. Record the amount of time it took to move from the starting line to finish line.
7. Repeat step 6 two more times, once accelerating slowly and once accelerating quickly. Make sure you don’t pull too hard, as your scale can only register a reading up to 10 N. The time it takes you to pull the book when accelerating slowly should be MORE than your first trial.
Similarly the time it takes you to pull your book when accelerating quickly should be LESS than your first trial.
8. Place a second book on top of the first book and repeat steps 4 through 7.
Conclusions
1. Organize the pulling forces for each set of trials. What is the relationship between the net force and the acceleration of the book?
2. How did adding the second book change your results?
3. Create a graph that describes your data using one book. Even though you do not have exact numbers for acceleration how can you represent these on a graph? How would you describe this graph (linear, quadratic, exponential)?
4. Create a graph that describes your data when you used two books. How does this graph compare to the first graph? In what ways are they similar? In what ways are they different?
Ohio Academic Content Standards for Lab 6:
MATH:
Grade 9 – Patterns, Functions, and Algebra
2. Generalize patterns using functions or relationships (linear, quadratic, exponential), and freely translate among tabular, graphical, and symbolic representations
3. Describe problem situations (linear, quadratic, exponential) by using tabular, graphical, and symbolic representations.
SCIENCE:
Physical Science grade 9, Indicator 21: Demonstrate that motion is a measurable quantity that depends on the observer’s frame of reference and describe the object’s motion in terms of position, velocity, acceleration and time. Physical Science grade 9, Indicator 22: Demonstrate that any object does not accelerate (remains at rest or maintains a constant speed and direction of motion) unless an unbalanced (net) force acts on it. Physical Science grade 9, Indicator 23: Explain the change in motion (acceleration) of an object. Demonstrate that the acceleration is proportional to the net force acting on the object and inversely proportional to the mass of the object. (Fnet=ma Note that weight is the gravitational force on a mass.) Scientific Inquiry grade 9, Indicator 6: Draw logical conclusions based on scientific knowledge and evidence from investigations. Scientific Inquiry grade 9, Indicator 5: Develop oral and written presentations using clear language, accurate data, appropriate graphs, tables, maps and available technology. Scientific Ways of Knowing grade 9, Indicator 2: Illustrate that the methods and procedures used to obtain evidence must be clearly reported to enhance opportunities for further investigations
Lab 7: Heat and Density in the Earth
*Lab adapted from ODE lab “Heat and Density” from Ohio’s Instructional Management System.
http://ims.ode.state.oh.us/ode/ims/Search/LessonPlans/CSC_LP_S01_BE_L09_I05_01_SearchResults.asp
Purpose: To use physical models to demonstrate the processes that shape the Earth’s surface and to calculate and graph the densities of five different objects.
Materials:
500-mL beaker
Clear pop
Raisins
Lava lamp
100-mL graduated cylinder
10-mL of salt water
10-mL of corn syrup
10-mL of vegetable oil
Small test tube cork
Lead sinker
3, 10-mL graduated cylinder
Digital scale
Procedure:
1. Teacher Demonstration:
a. Pour clear pop into a 500-mL beaker. Add about 10 raisins. Ask students to observe everything they see happening and write their observations in the space provided in the data table. Ask them to also explain why they think the clear pop and raisins behave in a certain way. (The bubbles of carbon dioxide in the pop are less dense than the rest of the liquid, so they rise to the top of the beaker carrying raisins up with them. When the bubbles are released at the surface of the pop, the raisins fall back down to the bottom because they are denser than the liquid.)
b. Display a lava lamp. Ask students to observe everything they see happening and write their observations in the space provided in the data table. Ask them to also
explain why they think the lava lamp behaves the way it does. (The lamp heats the liquid from below. The liquid is made of two different liquids that have different densities. When the denser material heats up, it expands, becomes less dense and rises to the top of the container. It cools at the top, becomes denser and sinks to be heated again which sets up a convection current inside the liquid)
c. Discuss a. and b. in terms of temperature, density and convection currents.
2. Discuss the density equation, D= m/v where m is the mass of an object and v is the volume of the object.
3. Show students the following items: 100-mL graduated cylinder, small test tube cork, lead sinker, 10-mL of salt water, 10-mL of corn syrup, and 10-mL of vegetable oil. Tell them you are going to put all of the items into the 100-mL graduated cylinder. Ask them to predict where the items will settle in the graduated cylinder and draw their predictions.
4. Split students into 5 groups and give each group one of the 5 items (cork, sinker, salt water, corn syrup, and vegetable oil). Have them calculate the mass, volume and density of the objects. When they are finished, have each group report to the class what values they found and how they found them.
5. Have students construct a graph of mass versus volume.
6. Have students adjust their predictions of where the items will settle when they are all added to the beaker based on the calculated densities.
7. Add the 5 items to the 100-mL graduated cylinder in any order. Have students draw a diagram of the actual positions of each of the items in the graduated cylinder.
Data:
Observations
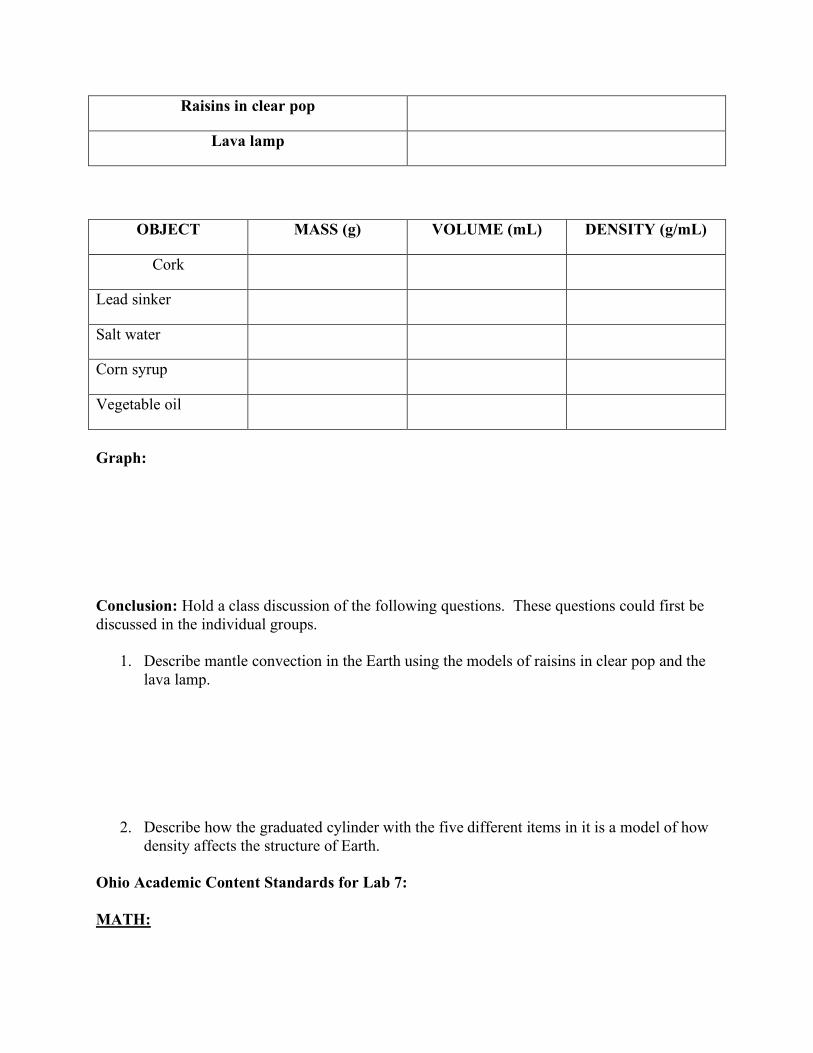
Raisins in clear pop
Lava lamp
OBJECT MASS (g) VOLUME (mL) DENSITY (g/mL)
Cork
Lead sinker
Salt water
Corn syrup
Vegetable oil
Graph:
Conclusion: Hold a class discussion of the following questions. These questions could first be discussed in the individual groups.
1. Describe mantle convection in the Earth using the models of raisins in clear pop and the lava lamp.
2. Describe how the graduated cylinder with the five different items in it is a model of how density affects the structure of Earth.
Ohio Academic Content Standards for Lab 7:
MATH:
Grade 9 – Number, Number Sense and Operations
4. Demonstrate fluency in computations using real numbers
SCIENCE:
Earth Science grade 9, Indicator 5: Explain how the slow movement of material within Earth results from: a. thermal energy transfer (conduction and convection) from the deep interior; b. the action of gravitational forces on regions of different density.
Physical Science grade 9, Indicator 9: Investigate the properties of pure substances and mixtures (e.g., density, conductivity, hardness, properties of alloys, superconductors and semiconductors).
Physical Science grade 9, Indicator 17: Demonstrate that thermal energy can be transferred by conduction, convection or radiation (e.g., through materials by collision of particles, moving air masses or across empty space by forms of electromagnetic radiation).
Scientific Inquiry grade 9, Indicator 3: Construct, interpret and apply physical and conceptual models that represent or explain systems, objects, events or concepts.
Scientific Inquiry grade 9, Indicator 6: Draw logical conclusions based on scientific knowledge and evidence from investigations. Scientific Inquiry grade 9, Indicator 5: Develop oral and written presentations using clear language, accurate data, appropriate graphs, tables, maps and available technology. Scientific Ways of Knowing grade 9, Indicator 2: Illustrate that the methods and procedures used to obtain evidence must be clearly reported to enhance opportunities for further investigations