Embed Size (px)
Citation preview

Integration of Energy Demand Reduction and
Sustainable Heating Installations in Individual
Danish Buildings
Master Program in Sustainable Energy Planning and Management Group SEPM4-2011-2, June 2011


Title:
“Integration of Energy Demand Reduction
and Sustainable Heating Installations in
Individual Danish Buildings”
Theme:
Master’s thesis
Project period:
February 1st – June 9th, 2011
Group members:
Ancuta-Gabriela Dragomir
Supervisor:
Karl Sperling
Total number of pages including
annexes: 53
Faculties of Engineering, Science and
Medicine
Department of Development and Planning
Fibigerstræde 11 - 13
9220 Aalborg East - Denmark
Telephone + 45 9940 9940
http://www.plan.aau.dk
Abstract:
Normally, a building last and pollute for 50 years or more and thus is quite mandatory to start implementing energy efficiency and/or conservation solutions. The project purpose is to analyse proper solutions applied for a modelled Danish house in order to increase its energy performance: reduce the energy demand, fuel and CO2 emissions. The report is divided into two main parts, dealing with techno-economic and institutional aspects. The analysis of three thermal insulation scenarios, as well as replacement of the existing oil boiler with three different energy efficient alternatives were modelled in COMPOSE. The current policies and regulations are assessed in relation with the chosen measures. The implementation of the optimal solution(s) is discussed looking at the economical and institutional perspectives.
Preface
The master thesis entitled “Integration of Energy Demand Reduction and Sustainable Heating Installations
in Individual Danish Buildings” was written by group SEPM4-2011-2, which is formed by a 10th semester
master student at Sustainable Energy Planning and Management, Department of Development and
Planning at Aalborg University, Denmark.
The project was conducted during the period of 1st of February to 9th of June 2011.
Literature references are marked with the author name and the date of publication in brackets according to
Chicago style. The annexes containing additional materials are assigned with capital letters and referenced
in the document. Tables and figures are numbered in format x.y, where x is the chapter number and y is the
number of the item.
The student express special thanks to its supervisor, Karl Sperling for his constant guidance, support and
ideas provided during the project work.
Special thanks are also given to Morten Boje Blarke for his permanent support while using COMPOSE.
The report is conducted by:
…………………………………………………
Ancuta-Gabriela Dragomir
Integration of Energy Demand Reduction and Sustainable Heating Installations in Individual Danish Buildings 1
Table of Contents
Table of Contents Abbreviations…………………………………………………………………………………………….………………………………………….…….2
1 Introduction ......................................................................................................................................... 3
1.1 Energy consumption in residential buildings ................................................................................. 3
1.2 The Danish Heating System .......................................................................................................... 4
1.3 Methodology ................................................................................................................................ 7
1.3.1 COMPOSE model .................................................................................................................. 8
1.3.2 Reference house data ..........................................................................................................11
1.3.3 Project limitations ................................................................................................................12
2 Measures to reduce energy consumption in residential houses ...........................................................13
2.1 Demand side – Insulation ............................................................................................................13
2.2 Supply side – Heating Installations ...............................................................................................16
3 Techno-economic aspects ...................................................................................................................20
3.1 Renovation Scenarios ..................................................................................................................20
3.1.1 Analysis ...............................................................................................................................20
3.1.2 Results .................................................................................................................................21
3.2 Energy-efficient installation scenarios..........................................................................................23
3.2.1 Reference scenario – Existing Gasoil Boiler ..........................................................................23
3.2.2 Alternative scenario 1 – Air to Water Heat Pump .................................................................24
3.2.3 Alternative scenario 2 – Ground Source Heat Pump .............................................................25
3.2.4 Alternative scenario 3 – Wood Chips Boiler ..........................................................................27
3.3 Results.........................................................................................................................................27
4 Challenges to change ..........................................................................................................................36
4.1 Assessment of existing policies and regulations ...........................................................................36
4.2 Barriers to more energy efficient buildings ..................................................................................38
4.2.1 Market barriers ....................................................................................................................38
4.2.2 Financial barriers .................................................................................................................38
4.3 Implementation of optimal solution(s).........................................................................................39
5 Conclusions and recommendations .....................................................................................................40
6 Bibliography ........................................................................................................................................41
Annexe A Hourly profile of domestic hot water consumption..............................................................44
Annexe B Results in tabular form..........................................................................................................48
Integration of Energy Demand Reduction and Sustainable Heating Installations in Individual Danish Buildings 2
Abbreviations
Abbreviations
1EUR = 7.46 DKK
PJ Petajoule
HDD Heating Degree Days
DH District Heating
NG Natural Gas
DUC Dansk Undergrunds Consortium
DONG DONG Energy Company
CO2 Carbon Dioxide
SBi Danish Building Research Institute
DEA Danish Energy Agency
COMPOSE Compare Options for Sustainable Energy
CHP Combined heat and power unit
HP Heat Pump
EB Electric boiler unit
DRY Design Reference Year
U-value Heat transfer coefficient
°C Degree Celsius
K Kelvin
low-E low-Emissivity glass
AAU Aalborg University
COP Coefficient of performance
GSHP Ground Source Heat Pump
kW Kilowatt
kWh Kilowatt hour
MC Marginal Costs
EUR Official Currency of the Eurozone
mm millimetres
kJ Kilojoule
O&M Operation and Maintenance
SPP Simple Payback Period
kg Kilogram
VAT Value Added Tax
EU European Union
ETS Emissions Trading Scheme
EC European Commission
BR Building Regulations

Integration of Energy Demand Reduction and Sustainable Heating Installations in Individual Danish Buildings 3
Introduction
1 Introduction
According to different sources, today in Europe around 40% of total energy consumption is expended by
the existing buildings of which two thirds by private houses (Utrick, 2009). Only in Denmark, for example,
more than 30% of total consumption is used for heating and cooling the existing constructions (Tommerup,
2005). But besides being a major consumer of energy, the building stock offers also vast opportunities for
energy savings. Due to the fact that majority of the Danish buildings were constructed before 1979 – before
introducing the first major application regarding energy performance of buildings, a great potential for
energy savings exist. According to IDA Climate Plan 2050, around 37 PJ or approximate 23% of the energy
needed for heating and domestic hot water was identified as potential savings. These savings can be
achievable by implementing energy conservation and energy efficiency improvements in heating supply
(The Danish Society of Engineers - IDA, 2009).
1.1 Energy consumption in residential buildings
The climatic conditions are directly linked to the household energy requirements. Major factors, such as
building form and construction material as well as the house orientation to the sun affects the amount of
energy needed to achieve the desired indoor temperature. Therefore, the energy efficiency measures are
undertaken differently according to the climatic zone. Denmark is situated in a moderate one, having the
annual average Heating Degree Days (HDD) of 3,500 (International Energy Agency, 2008).
The following figure provides an illustration of the average energy consumption by end-use of a household
located in a moderate climate.
Figure 1.1 Average household energy consumption by end-use (International Energy Agency, 2008)
Space heating 55%
Water heating19%
Cooking 4%
Lighting3%
Appliences19%
Integration of Energy Demand Reduction and Sustainable Heating Installations in Individual Danish Buildings 4
Introduction
As the pie chart shows, the space and water heating dominates the energy consumption profile for homes
in moderate climates and therefore the project attention goes to the existing heating system.
1.2 The Danish Heating System
In the last three decades, the Danish heating system has undergone significant changes in the power supply
to domestic consumers. According to Statistics Bank of Denmark, the main heating sources for private
houses may be summarised as following:
District Heating
Central heating with oil
Central heating with natural gas
Central heating without oil or natural gas
Stoves, electricity
Stoves, other
Unknown
As was expected, for a small number of households the heat installation is unknown.
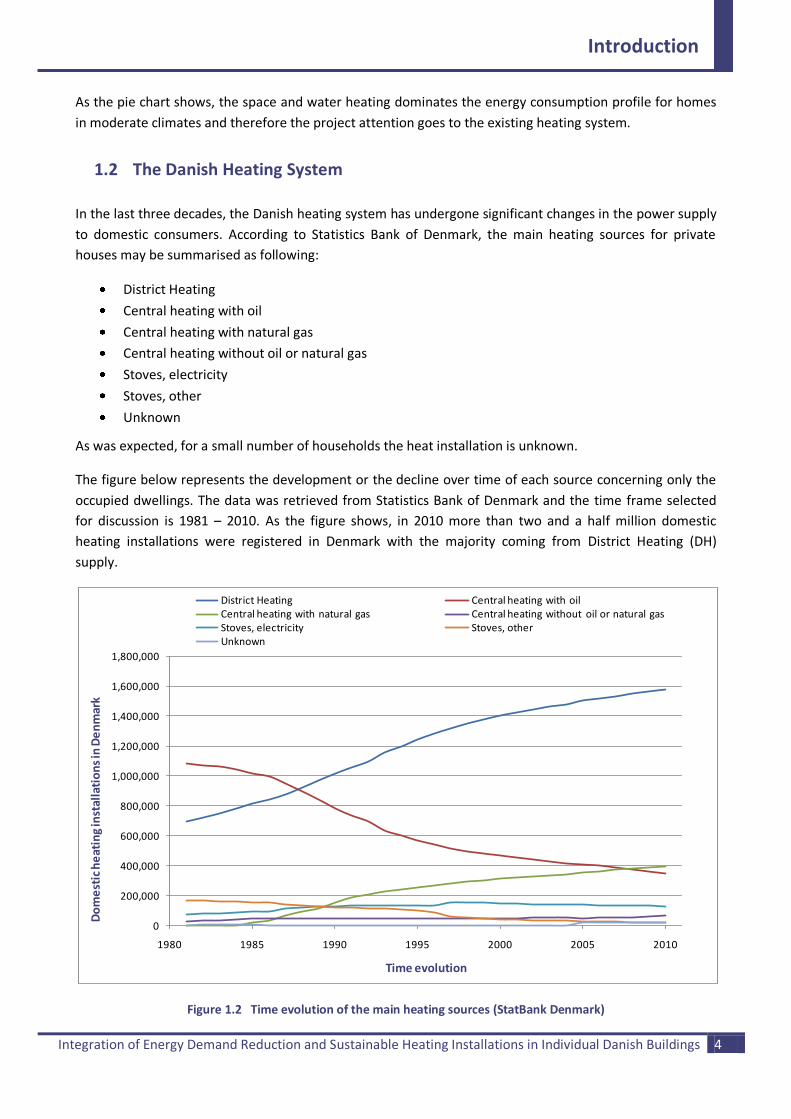
The figure below represents the development or the decline over time of each source concerning only the
occupied dwellings. The data was retrieved from Statistics Bank of Denmark and the time frame selected
for discussion is 1981 – 2010. As the figure shows, in 2010 more than two and a half million domestic
heating installations were registered in Denmark with the majority coming from District Heating (DH)
supply.
Figure 1.2 Time evolution of the main heating sources (StatBank Denmark)
0
200,000
400,000
600,000
800,000
1,000,000
1,200,000
1,400,000
1,600,000
1,800,000
1980 1985 1990 1995 2000 2005 2010
Do
me
stic
he
atin
g in
stal
lati
on
s in
De
nm
ark
Time evolution
District Heating Central heating with oilCentral heating with natural gas Central heating without oil or natural gasStoves, electricity Stoves, otherUnknown
Integration of Energy Demand Reduction and Sustainable Heating Installations in Individual Danish Buildings 5
Introduction
In relation to the 80s, DH has gained field among domestic consumers, in 2010 the share almost doubled.
As a consequence of oil crisis from the 70s, the central heating based on oil experienced a decline. While in
1981 more than half of the Danish homes were dependent on oil, in 2010 only 13.5% are still using it.
Looking into the Danish Natural Gas (NG) history, in 1979 Dansk Undergrunds Consortium (DUC) enters into
the first natural gas contract with DONG. In 1980, the construction of the first transmission system has
begun, following that after four years to start connecting and supplying (Energinet.dk). As the table shows,
natural gas won a strong position in terms of domestic heating; in 2010 exceeding the number of oil based
heating systems.
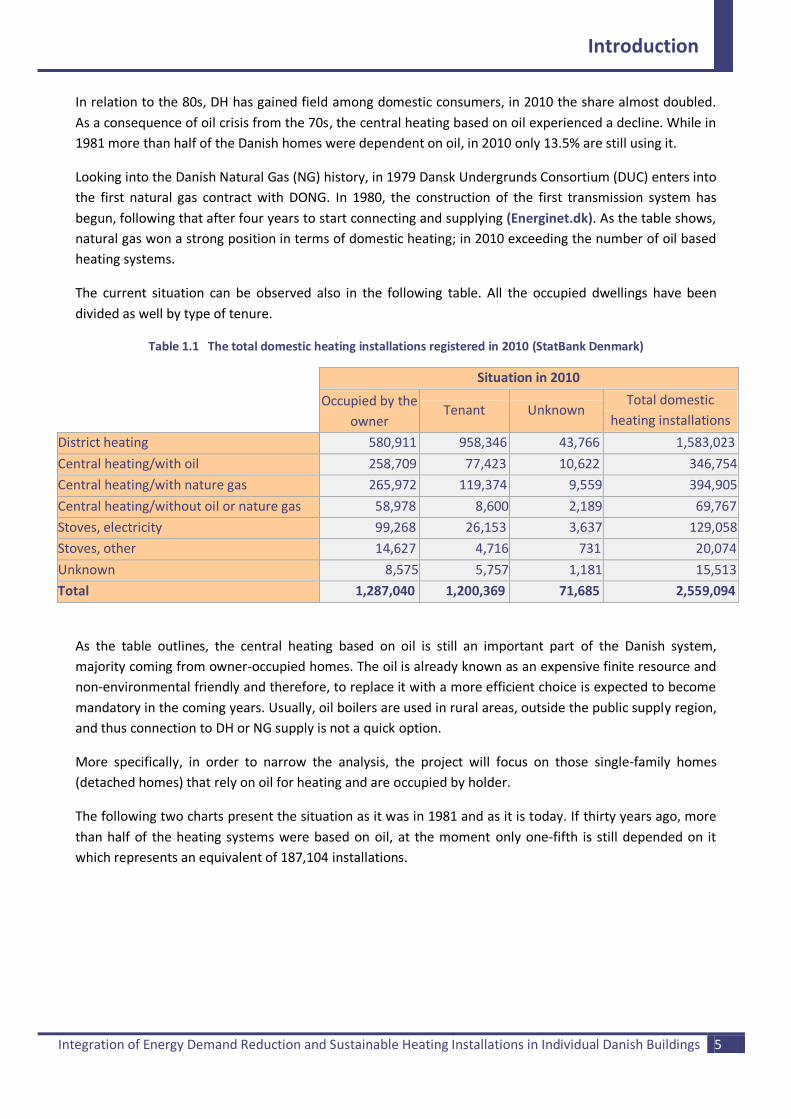
The current situation can be observed also in the following table. All the occupied dwellings have been
divided as well by type of tenure.
Table 1.1 The total domestic heating installations registered in 2010 (StatBank Denmark)
Situation in 2010
Occupied by the
owner Tenant Unknown
Total domestic
heating installations
District heating 580,911 958,346 43,766 1,583,023
Central heating/with oil 258,709 77,423 10,622 346,754
Central heating/with nature gas 265,972 119,374 9,559 394,905
Central heating/without oil or nature gas 58,978 8,600 2,189 69,767
Stoves, electricity 99,268 26,153 3,637 129,058
Stoves, other 14,627 4,716 731 20,074
Unknown 8,575 5,757 1,181 15,513
Total 1,287,040 1,200,369 71,685 2,559,094
As the table outlines, the central heating based on oil is still an important part of the Danish system,
majority coming from owner-occupied homes. The oil is already known as an expensive finite resource and
non-environmental friendly and therefore, to replace it with a more efficient choice is expected to become
mandatory in the coming years. Usually, oil boilers are used in rural areas, outside the public supply region,
and thus connection to DH or NG supply is not a quick option.
More specifically, in order to narrow the analysis, the project will focus on those single-family homes
(detached homes) that rely on oil for heating and are occupied by holder.
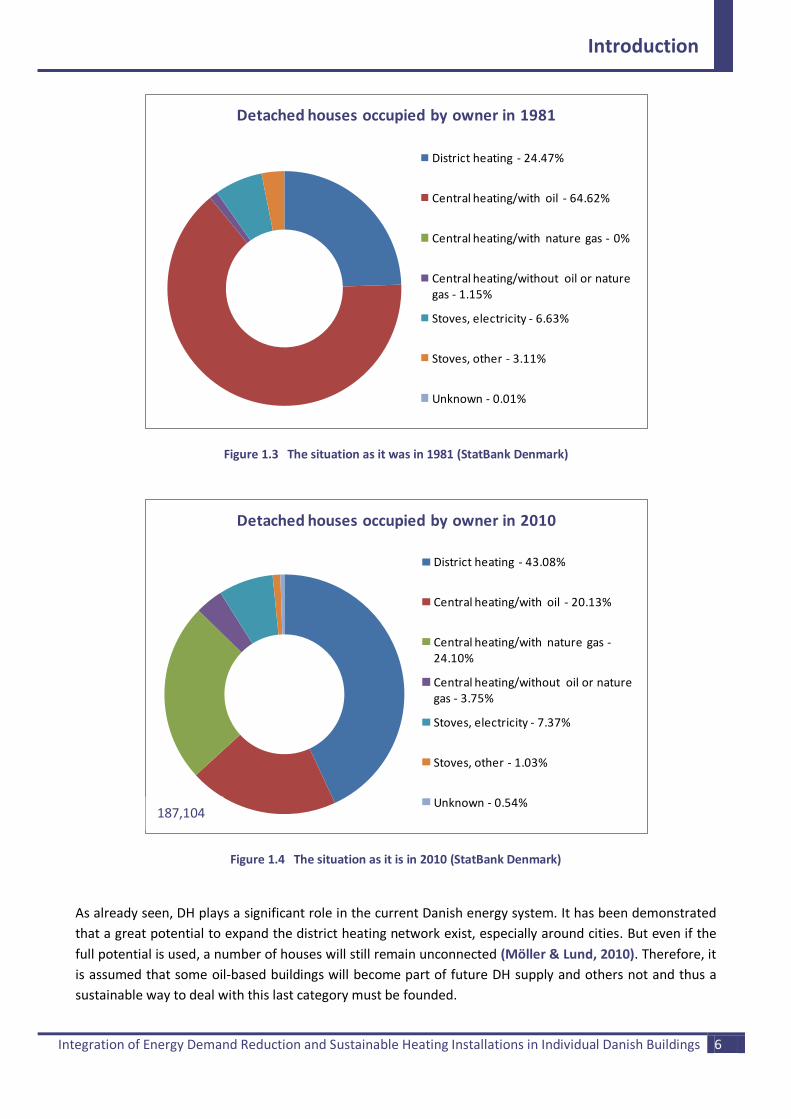
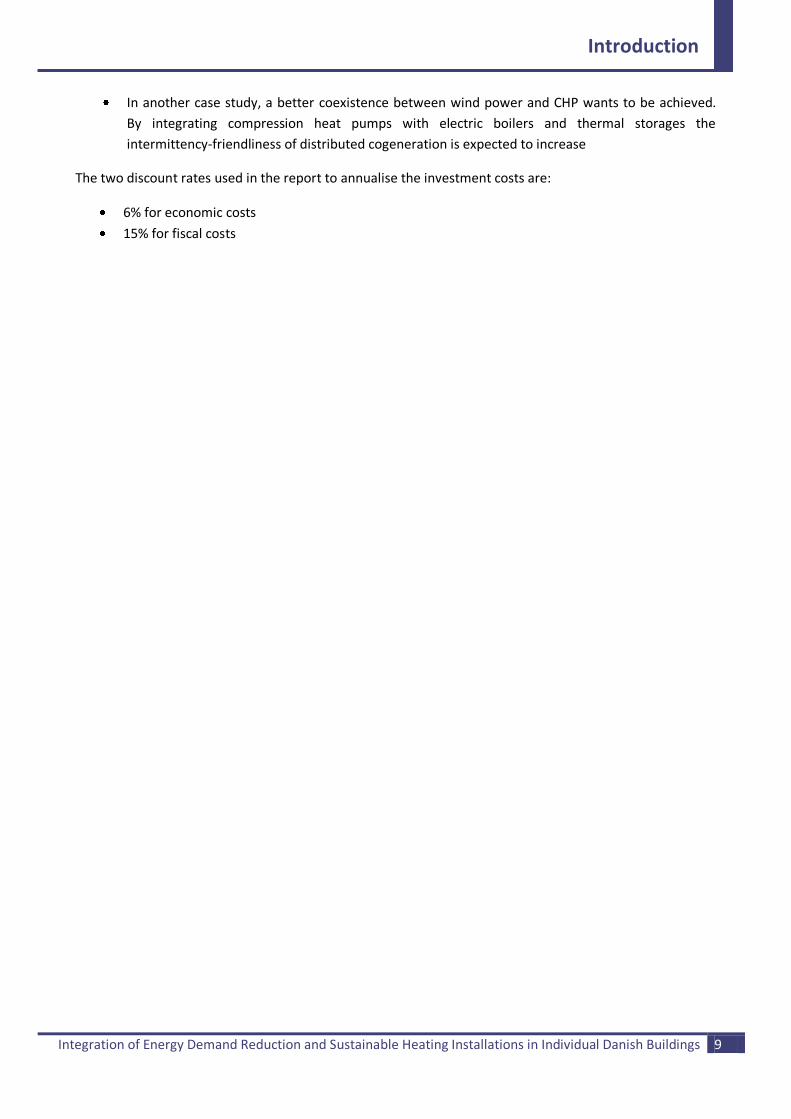
The following two charts present the situation as it was in 1981 and as it is today. If thirty years ago, more
than half of the heating systems were based on oil, at the moment only one-fifth is still depended on it
which represents an equivalent of 187,104 installations.
Integration of Energy Demand Reduction and Sustainable Heating Installations in Individual Danish Buildings 6
Introduction
Figure 1.3 The situation as it was in 1981 (StatBank Denmark)
Figure 1.4 The situation as it is in 2010 (StatBank Denmark)
As already seen, DH plays a significant role in the current Danish energy system. It has been demonstrated
that a great potential to expand the district heating network exist, especially around cities. But even if the
full potential is used, a number of houses will still remain unconnected (Möller & Lund, 2010). Therefore, it
is assumed that some oil-based buildings will become part of future DH supply and others not and thus a
sustainable way to deal with this last category must be founded.
Detached houses occupied by owner in 1981
District heating - 24.47%
Central heating/with oil - 64.62%
Central heating/with nature gas - 0%
Central heating/without oil or nature gas - 1.15%
Stoves, electricity - 6.63%
Stoves, other - 3.11%
Unknown - 0.01%
Detached houses occupied by owner in 2010
District heating - 43.08%
Central heating/with oil - 20.13%
Central heating/with nature gas -24.10%
Central heating/without oil or nature gas - 3.75%
Stoves, electricity - 7.37%
Stoves, other - 1.03%
Unknown - 0.54%187,104

Integration of Energy Demand Reduction and Sustainable Heating Installations in Individual Danish Buildings 7
Introduction
Considering also the existing energy policies and regulations that are intended to reduce fossil fuel
dependency, as well as greenhouse gas emissions, the project research question can be highlighted.
How can single-family homes, with a heating system based on oil reduce their energy demand, fuel
consumption and carbon dioxide (CO2) emissions?
The answer to this question will represent the main theme of the project.
1.3 Methodology
The report structure has been divided in two essential parts. The first part looks into the techno-economic
aspects of our research while the second, into the institutional ones.
Initially, proper solutions implemented to a model case have been identified and analyzed in order to
increase the energy performance. In terms of energy savings achieved by insulation, the analysis was
performed based on parameters and insulation scenarios retrieved from Danish Building Research Institute
(SBi, 2010) report. The investigation of the potential heating installations was carried out by reviewing the
specialized literature.
The techno-economic analysis, including both conservation and efficient technologies, will be accomplished
in COMPOSE, an energy planning programme. Under the basis of a series of assumptions, such as those
below, a broad range of possible alternatives will be provided.
Energy reduction and insulation costs → from SBi report
Fuel (gasoil, electricity and wood chips) price as well as electricity production and CO2 costs →
retrieved from Danish Energy Agency (DEA)
Technical aspects, including the efficiency of the chosen installations → taken from Data Sheets
Actual costs of acquisition and operation and maintenance of all technologies → taken directly
from manufacturers or suppliers
The institutional analysis has been performed through a brief assessment of the existing energy policies and
regulations in order to determine how the society helps to implement the optimal solution(s).
The report is structured as follows:
Chapter 2 – Measures to reduce energy consumption in residential houses: In this chapter the existing
cost-effective measures that are able to reduce the energy consumption, fuel and CO2 emissions of the
model house are presented.
Chapter 3 – Techno-economic aspects: Here, different insulation scenarios and efficient technologies are
analyzed in COMPOSE in order to identify the optimal solution in terms of cost and environment impact for
the chosen house. A sensitivity analysis based on new assumptions will be carried out also.
Chapter 4 – Challenges to change: This chapter includes a brief assess of the current policies and
regulations. The market and the financial barriers to more energy-efficient houses are presented, as well as
the implementation of the optimal solution(s).

Integration of Energy Demand Reduction and Sustainable Heating Installations in Individual Danish Buildings 8
Introduction
Chapter 5 – Conclusions and recommendations: The last chapter contains conclusions on the research
question and recommendations that can be useful for future energy planning and policies.
1.3.1 COMPOSE model
COMPOSE or Compare Options for Sustainable Energy is a techno-economic energy project evaluation
model. It was designed in 2008 by Morten Boje Blarke from Aalborg University and since then has been
continuously improved.
Its main objective is to compare options through the techno-economic results for providing energy services.
It offers cost-effectiveness and cost-benefit analyses based on a broad range of significant inputs, such as
the ones mentioned in Figure 1.5. The usefulness as well as the mission of the model is given by:
‘’COMPOSE simulates and evaluates an energy project in a system-wide perspective in terms of
operational dispatch, fuel consumption, emissions, economic costs, financial costs, fiscal costs,
intermittency-friendliness.
The mission is for COMPOSE to combine the strength of energy project operational simulation models
with the strength of energy system scenario models in order to arrive at a modelling framework that
supports an increasingly realistic and qualified comparative assessment of sustainable energy options
(ENERGYINTERACTIVE.NET)’’.
The software allows users to import projects from energyPRO or to exchange hourly profiles with
EnergyPLAN or even to import statistical data and projections from Energinet.dk and DEA.
The work flow is classified into three main steps:
1. Define – this part is actually the part where the projects and the systems are defined
2. Manage – this section includes all the assumptions that goes into the analysis of a defined project
in a defined system
3. Analyze – in this part it’s important to specify which project is included in the analysis in order to
calculate and evaluate the results
As mentioned, the model enables the user to determine the relocation coefficient – how good is a project
in terms of wind integration, the fuel consumption, electricity production, emissions, economic costs, fiscal
costs, financial costs, etc. Especially on these last three the consumers have a particular interest. By adding
to economic cost the cost with VAT and fuel taxes (fiscal cost) the financial cost, also known as the
consumer reality, is determined. This is actually the cost that is most likely wanted by users; it expresses
the cost that everyone must pay.
Figure 1.5 tries to present how COMOSE is structured. Besides the key inputs and outputs, what is beneath
the COMPOSE model is presented as methodology. Based on the outputs interpretation, COMPOSE can
help to create further policies.
In terms of applicability, COMPOSE has been used for researching the intermittency-friendliness of
different options in distributed cogeneration (CHP), such as:
In a typical case study, the model was applied in order to show how a heat pump integration can
affect the operational strategy of a CHP plant
Integration of Energy Demand Reduction and Sustainable Heating Installations in Individual Danish Buildings 9
Introduction
In another case study, a better coexistence between wind power and CHP wants to be achieved.
By integrating compression heat pumps with electric boilers and thermal storages the
intermittency-friendliness of distributed cogeneration is expected to increase
The two discount rates used in the report to annualise the investment costs are:
6% for economic costs
15% for fiscal costs

Integration of Energy Demand Reduction and Sustainable Heating Installations in Individual Danish Buildings 10
Introduction
DemandHeat ElectricityCooling
INPUTS
StorageThermal storageCold storageElectrical storage
ProcessEfficiency
Fuel ElectricityNatural gas
Oil etc.
Cost Benefit (Economic or Fiscal)Investment costOperation and
Maintenance cost
Annual ResultsFuel consumptionElectricity productionSystem-wide primary energy consumptionSystem-wide CO2Economic cost benefitsFiscal cost benefitsFinancial cost benefits Levelized economic cost benefit per reduced CO2 Relocation coefficient
METHODOLOGY OUTPUTS
Danish DRY Degree Hours Normalized
Mean = 0.44 Variance = 0.0000
0234 609 983 1432 1956 2480 3004 3528 4052 4577 5101 5625 6149 6673 7197 7721 8245
1
0.9
0.8
0.7
0.6
0.5
0.4
0.3
0.2
0.1
0
Hourly Profile
Diesel Gasoil ENS CIF
2010 2012 2014 2016 2018 2020 2022 2024 2026 2028 2030
122
120
118
116
114
112
110
108
106
104
102
100
98
96
94
92
90
88
86
Annual Profile
Project model
System model
Analyze
Energy
EconomicPlanning periodEconomic discount rateFinancial discount rateVAT
Environment
Economic dispatch model for candidate marginal power plants
Each variable is linked to an hourly and annual profile
Project ID
2301 2305 2309
Syste
m-W
ide P
rim
ary
Energ
y C
onsum
ption M
ean (
kW
h)
18,000
16,000
14,000
12,000
10,000
8,000
6,000
4,000
2,000
0
Linked to the System model
Hourly ResultsNet exchange with gridStorage levelStorage losses
Air-w ater HP w ith Ins. S-A NET 2010/0
Mean = -0.33 Variance = 0.3104
0145 377 609 840 1119 1443 1767 2092 2416 2741 3065 3389 3714 4038 4363 4687 5011 5336 5660 5985 6309 6633 6958 7282 7607 7931 8256 8580
0
-0.1
-0.2
-0.3
-0.4
-0.5
-0.6
-0.7
-0.8
-0.9
-1
-1.1
-1.2
-1.3
-1.4
-1.5
-1.6
-1.7
-1.8
-1.9
-2
-2.1
-2.2
Air-w ater HP w ith Ins. S-A NET 2010/0
Full Load Hours = 1288 Load Factor = 0.15
6309 801 1393 2083 2683 3189 3659 4082 4493 4910 5311 5739 6217 6729 7269 7834 8465 251 4013 644 093 492 84 19 131 143 5830 603 592 122 135
0
-0.1
-0.2
-0.3
-0.4
-0.5
-0.6
-0.7
-0.8
-0.9
-1
-1.1
-1.2
-1.3
-1.4
-1.5
-1.6
-1.7
-1.8
-1.9
-2
-2.1
-2.2
Load Curve
By hour
Linear programming model → makes a mathematical model for a define project and solves that model in order to minimize the economic and/or financial costs over a determined time period (a day, a week, a month or a year)
Realistic model → uses statistical data and projections from Energinet.dk and Danish Energy Agency
Economic unit dispatch optimization → based on the electricity prices can determine what are the marginal technologies
Project-system analysis hybrid → it’s a project and system model
Bottom-up approach → first identifies the parameters (efficiency, demand, prices etc.) and build up in order to determine the results
Figure 1.5 Input-output structure of the COMPOSE model
Integration of Energy Demand Reduction and Sustainable Heating Installations in Individual Danish Buildings 11
Introduction
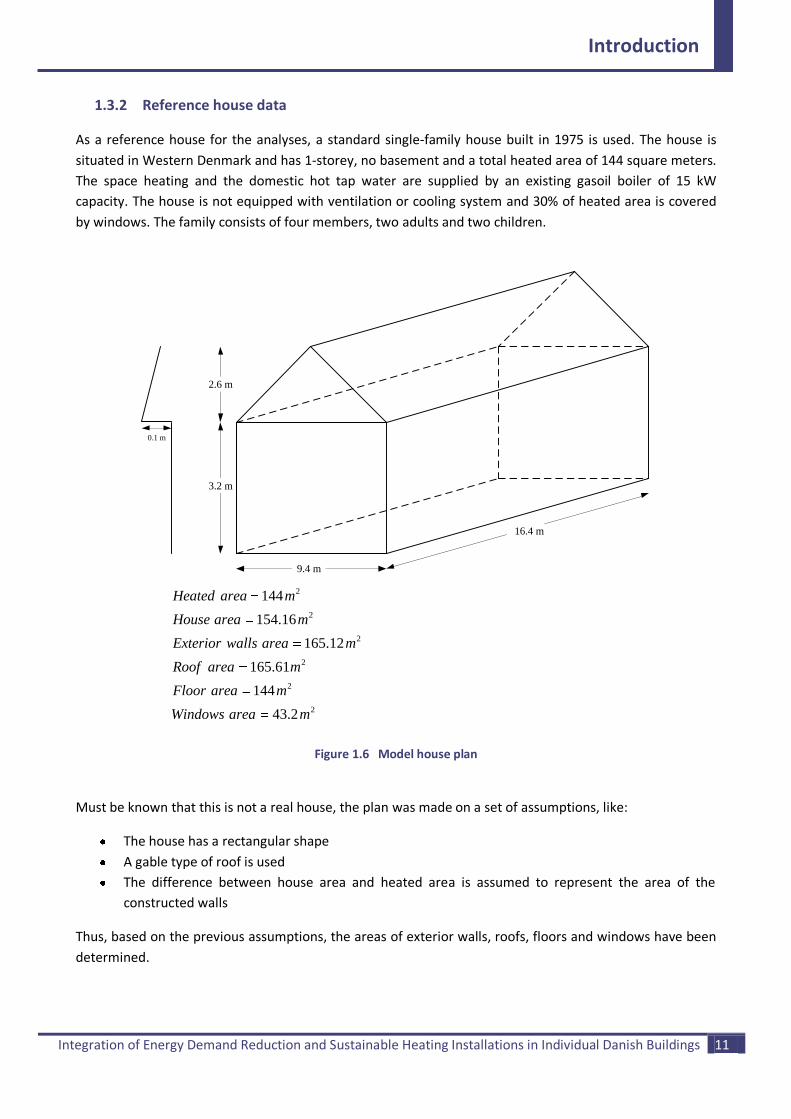
1.3.2 Reference house data
As a reference house for the analyses, a standard single-family house built in 1975 is used. The house is
situated in Western Denmark and has 1-storey, no basement and a total heated area of 144 square meters.
The space heating and the domestic hot tap water are supplied by an existing gasoil boiler of 15 kW
capacity. The house is not equipped with ventilation or cooling system and 30% of heated area is covered
by windows. The family consists of four members, two adults and two children.
16.4 m
9.4 m
3.2 m
2.6 m
0.1 m
2
2
2
2
2
2
144
154.16
165.12
165.61
144
43.2
Heated area m
House area m
Exterior walls area m
Roof area m
Floor area m
Windows area m
Figure 1.6 Model house plan
Must be known that this is not a real house, the plan was made on a set of assumptions, like:
The house has a rectangular shape
A gable type of roof is used
The difference between house area and heated area is assumed to represent the area of the
constructed walls
Thus, based on the previous assumptions, the areas of exterior walls, roofs, floors and windows have been
determined.
Integration of Energy Demand Reduction and Sustainable Heating Installations in Individual Danish Buildings 12
Introduction
1.3.3 Project limitations
The project analyse was limited to the existing houses with a heating system based on oil only, due to its
high impact on the environment. The solutions based on natural gas, electric heating or other fossil fuels
are not analyzed.
The considered case study was based on a single-family house with a heated area of 144 m2 only.
Regarding the insulation aspects, only the marginal cost is taken into analysis. The insulation scenarios
were designed to cover all the main house elements that have a significant heat transfer with the
environment, such as: outer walls, floors, roofs and windows.
As alternatives to the existing gasoil boiler, three solutions are considered in this study: air to water heat
pump, ground source heat pump and wood chips boiler.
Due to lack of exact knowledge concerning different probabilities, the following project assumptions are
set:
Constant fuel price. Independent of type (oil, electricity, wood chips), in the analysis it is assumed
to remain unchanged
The technological improvement will not be accelerated. Looking into the technological innovation
process it is a risk that a better and cheaper installation will emerge
Integration of Energy Demand Reduction and Sustainable Heating Installations in Individual Danish Buildings 13
Measures to reduce energy consumption in residential houses
2 Measures to reduce energy consumption in residential houses
The purpose of this section is to present what are the available cost-effective measures that can be taken in
order to reduce energy consumption and consequently fuel and greenhouse gas emissions.
There are two major approaches in terms of using the energy wisely: energy conservation and energy
efficiency. In the energy conservation approach the results are reduced due to changes in the consumer
behaviour or more generally in the demand part. The energy efficiency approach refers on achieving the
same results using less energy which usually involves changes in the supply area (guardian.co.uk). For a
broader discussion, both suggestions will be presented briefly further, each of them will include a general
part as well as a part related to the model home.
2.1 Demand side – Insulation
By applying viable energy-savings measures, such as insulation, the wasted energy and the heat demand of
the existing house will be significantly reduced.
By definition, ‘’insulation is a central aspect of managing a household’s overall energy consumption’’
(International Energy Agency, 2008). It is applicable in all climatic zones since it diminishes the heat or
cooling transfer through the house envelope from both parts, inside and outside. By using adequate
insulation materials and methods the heat or the cooling tends to be kept inside the dwelling as much as
possible and definitely this will make a difference in energy bills.
The building components: exterior walls, grounds or floors, roofs, windows are part of the building
envelope and are represented by a U-value which has the measurement unit in W/m2K. Should be noted
that Kelvin (K) is used only as a scale of temperature difference, numerically it is equal to degree Celsius
(°C). All houses must aim for the lowest U-value possible and this is because a lower U-value means less
heat wasted useless. The U-value is more correctly defined as being the overall heat transfer coefficient, it
measures the heat transfer rate through a certain material, can be outer walls, windows or others (Irish
Energy Center).
Integration of Energy Demand Reduction and Sustainable Heating Installations in Individual Danish Buildings 14
Measures to reduce energy consumption in residential houses
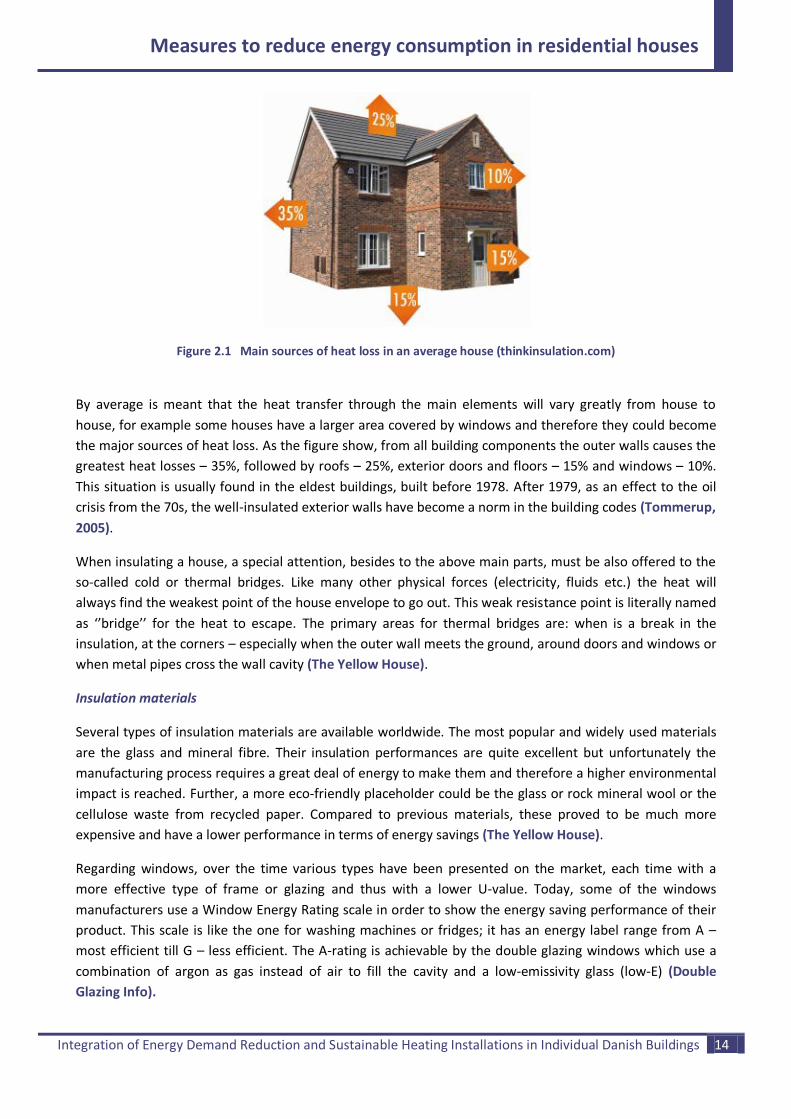
Figure 2.1 Main sources of heat loss in an average house (thinkinsulation.com)
By average is meant that the heat transfer through the main elements will vary greatly from house to
house, for example some houses have a larger area covered by windows and therefore they could become
the major sources of heat loss. As the figure show, from all building components the outer walls causes the
greatest heat losses – 35%, followed by roofs – 25%, exterior doors and floors – 15% and windows – 10%.
This situation is usually found in the eldest buildings, built before 1978. After 1979, as an effect to the oil
crisis from the 70s, the well-insulated exterior walls have become a norm in the building codes (Tommerup,
2005).
When insulating a house, a special attention, besides to the above main parts, must be also offered to the
so-called cold or thermal bridges. Like many other physical forces (electricity, fluids etc.) the heat will
always find the weakest point of the house envelope to go out. This weak resistance point is literally named
as ‘’bridge’’ for the heat to escape. The primary areas for thermal bridges are: when is a break in the
insulation, at the corners – especially when the outer wall meets the ground, around doors and windows or
when metal pipes cross the wall cavity (The Yellow House).
Insulation materials
Several types of insulation materials are available worldwide. The most popular and widely used materials
are the glass and mineral fibre. Their insulation performances are quite excellent but unfortunately the
manufacturing process requires a great deal of energy to make them and therefore a higher environmental
impact is reached. Further, a more eco-friendly placeholder could be the glass or rock mineral wool or the
cellulose waste from recycled paper. Compared to previous materials, these proved to be much more
expensive and have a lower performance in terms of energy savings (The Yellow House).
Regarding windows, over the time various types have been presented on the market, each time with a
more effective type of frame or glazing and thus with a lower U-value. Today, some of the windows
manufacturers use a Window Energy Rating scale in order to show the energy saving performance of their
product. This scale is like the one for washing machines or fridges; it has an energy label range from A –
most efficient till G – less efficient. The A-rating is achievable by the double glazing windows which use a
combination of argon as gas instead of air to fill the cavity and a low-emissivity glass (low-E) (Double
Glazing Info).

Integration of Energy Demand Reduction and Sustainable Heating Installations in Individual Danish Buildings 15
Measures to reduce energy consumption in residential houses
The role of insulation
Insulation is assumed to be beneficial for both parties involved, the house inhabitants and environment. In
terms of consumers, a better insulation leads to a higher reduction in heat demand which is equivalent to
lower energy bills. Furthermore, the environment gets out as a winner also; insulation can help to reduce
the so-called man-made CO2 emissions. By applying an appropriate insulation package other potential
benefits, beside the ones already mentioned, can be reached, such as (NAIMA):
Improve comfort if an additional ventilation system is included
Healthier environment
Sound control
Lifetime of energy savings
As regards the model house, the ’’Danske bygningers energibehov i 2050’’ (Danish buildings energy needs
in 2050) is taken as reference report to present the applied measures to the house envelope. The report
was initiated by the DEA in order to highlight the opportunities for energy improvement of the existing
Danish buildings up to 2050. The analysis is based on randomly information collected during the period
2005 - March 2010 in the sale and rental buildings.
The main assumptions related to the model house are presented below:
The calculation model used to establish the energy consumption for space heating and hot water
before and after implementing energy improvements was developed by Danish Building Research
Institute, Aalborg University (AAU)
The hot water consumption per day per family member is assumed to be 45 liters. Therefore, the
total daily consumption of the standard house is established at 180 liters. The heating installation
has to raise the water temperature from 8 (the cold water temperature) to 45 °C (the maximum
needed) which leads in a difference temperature of 37 °C. This is assumed to remain constant
independent of the applied level of insulation
The costs applied for energy improvements are used in the project as they are presented in the SBi
report
The SBi analysis includes only the houses with a U-value for the main elements (outer walls, roofs,
floors and windows) above a certain limit
In next chapter, these specifications are going to be implemented according to the house data. As already
mentioned only the marginal costs are going to be included in the economic analysis. Due to aging building
it is assumed that the owner has to refurbish the house anyway and therefore the project attention is
directed only to the extra energy savings after adding additional insulation. Besides the marginal cost, the
total cost includes also the cost for restoration (Danish Building Research Institute, 2010).
Once the building has been redesigned in order to minimise its energy losses makes sense to look into
other aspects, such as replacing the existing heating system. Is preferable to change it after the house was
insulated and not before.
Integration of Energy Demand Reduction and Sustainable Heating Installations in Individual Danish Buildings 16
Measures to reduce energy consumption in residential houses
2.2 Supply side – Heating Installations
Besides insulation, another tool to improve the home’s overall energy consumption is to replace the
existing heating facility with a more efficient one. When talking about a more efficient choice may be
referred to the efficiency of heat conversion – the same output with less input, or environmentally efficient
– lower level of CO2 emissions and other pollutants, or the efficiency in terms of financial cost – lower
installation and operation cost. Always the best solution for both parties involved, environment and
consumers is to find a balance between all these three categories (Green Energy Efficient Homes).
Referring to the chosen house, the following listing includes several possible alternatives to the current
situation:
Solar heating
Conventional Geothermal heating
Heat pumps (ground and air sources)
Wood heating
Electric heating
Further, each alternative will include a general description and the current applicability in Denmark.
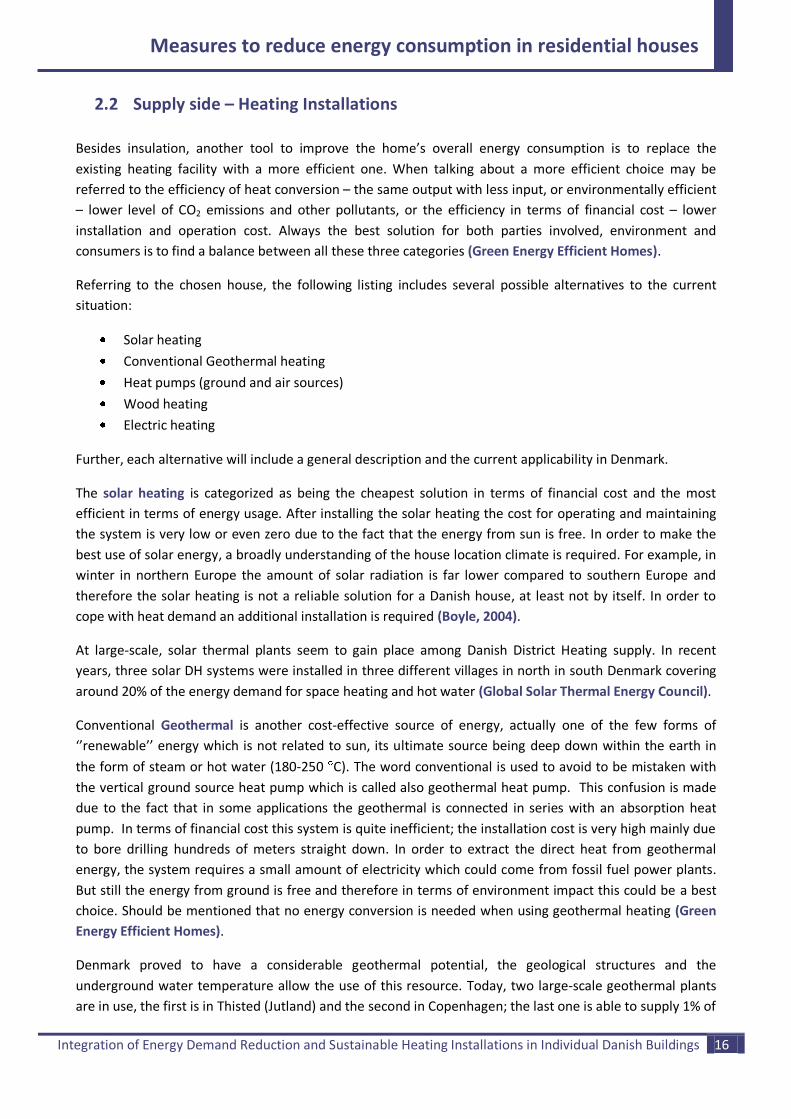
The solar heating is categorized as being the cheapest solution in terms of financial cost and the most
efficient in terms of energy usage. After installing the solar heating the cost for operating and maintaining
the system is very low or even zero due to the fact that the energy from sun is free. In order to make the
best use of solar energy, a broadly understanding of the house location climate is required. For example, in
winter in northern Europe the amount of solar radiation is far lower compared to southern Europe and
therefore the solar heating is not a reliable solution for a Danish house, at least not by itself. In order to
cope with heat demand an additional installation is required (Boyle, 2004).
At large-scale, solar thermal plants seem to gain place among Danish District Heating supply. In recent
years, three solar DH systems were installed in three different villages in north in south Denmark covering
around 20% of the energy demand for space heating and hot water (Global Solar Thermal Energy Council).
Conventional Geothermal is another cost-effective source of energy, actually one of the few forms of
‘’renewable’’ energy which is not related to sun, its ultimate source being deep down within the earth in
the form of steam or hot water (180-250 C). The word conventional is used to avoid to be mistaken with
the vertical ground source heat pump which is called also geothermal heat pump. This confusion is made
due to the fact that in some applications the geothermal is connected in series with an absorption heat
pump. In terms of financial cost this system is quite inefficient; the installation cost is very high mainly due
to bore drilling hundreds of meters straight down. In order to extract the direct heat from geothermal
energy, the system requires a small amount of electricity which could come from fossil fuel power plants.
But still the energy from ground is free and therefore in terms of environment impact this could be a best
choice. Should be mentioned that no energy conversion is needed when using geothermal heating (Green
Energy Efficient Homes).
Denmark proved to have a considerable geothermal potential, the geological structures and the
underground water temperature allow the use of this resource. Today, two large-scale geothermal plants
are in use, the first is in Thisted (Jutland) and the second in Copenhagen; the last one is able to supply 1% of

Integration of Energy Demand Reduction and Sustainable Heating Installations in Individual Danish Buildings 17
Measures to reduce energy consumption in residential houses
the District Heating need. A third plant is expected to be taken into operation in Sønderborg this year.
Therefore, the best use of geothermal energy is in the form of DH and not for individual houses, it’s an
expensive investment due to drilling up till 2,500 m (Danish Energy Agency and Ministry of Climate and
Energy).
Another suitable solution could be the electric Heat Pumps (HPs). By definition “a heat pump is a
mechanical device used for heating and cooling, which operates on the principle that the heat can be moved
from a cooler to a warmer temperature and vice versa” (Abdeen, 2006). Independent of the type, the
compression heat pumps represents another energy-efficient way to provide heat and cooling in different
applications, as they use renewable heat sources from our surroundings. The energy efficiency or the
performance of a heat pump is measured by its COP (Coefficient of Performance). The COP can be defined
as the ratio of the pump’s ability to produce heat to the electrical energy needed to extract it. Heat pumps
performance depends also on how electricity is produced; if it comes from fossil fuels the overall
performance of the installation decreases.
On the market there are five different types of heat pumps which use the following renewable sources
(Abdeen, 2006):
Bedrock
Surface soil
Lake water
Groundwater and
Air
Before going further, it should be mentioned that the first four are known as ground sources while the last
one as air source. The Ground Source Heat Pumps (GSHPs) are presented in two main configurations:
ground-coupled or closed loop and groundwater or open loop systems. The bedrock and the surface soil
sources are used in a closed loop system where the pipes are placed in one or more vertical boreholes
which are drilled deeper underground (50 to 200 m) or just beneath the ground surface, through a
horizontal collector which is located at a depth of about 1-2 m. The heat is moved from the ground to the
HP using a water-antifreeze solution. This mixed solution circulates through the pipes, absorbing the
ground energy and carrying it to the Heat Pump. As previous, an open loop system can be either horizontal,
using the energy stored in lake water or vertical, using the energy from the groundwater. In both cases the
water is directly pumped to the heat pump exchanger, where the energy is recovered and discharged back
into the ground with a lower temperature. As the conventional geothermal, both vertical ground sources
(bedrock and groundwater) could be forms of energy which are not related to the sun.
The above technologies rely on the fact that all over the year the Earth temperature is fairly constant under
a certain level, named also the frost line. This means that the ground is wormer in winter and cooler in
summer compared to the outside air. The average temperature of the Earth is about 10 °C at shallow depth
and above 30 °C deeper (Abdeen, 2006).
The air sources are devices that ‘’pumps’’ heat from an area with a relatively low temperature to an area
with a relatively high temperature. This type of heat pumps extract energy from outdoor and used it to
heat the indoor air - air to air heat pump or the water - air to water heat pump. The efficiency of this type is
slightly lower than the ground sources due to the fact that it varies depending on outside air temperature.
Integration of Energy Demand Reduction and Sustainable Heating Installations in Individual Danish Buildings 18
Measures to reduce energy consumption in residential houses
Between the two forms of heat pumps, the installation of an air source seems to be almost two times
cheaper than the ground source while the operation and maintenance costs are low for both. Therefore
based on previous affirmations, in terms of energy conversion, environment impact and cost efficiency the
air source Heat Pump could be a preferred candidate to replace the conventional installation of the house
(House-Energy).
Based on the Danish Energy Agency figures, the heat pumps received a warm welcome especially among
householders. In 2010 around 40,000 air and ground source heat pumps were installed in Denmark (The
Official Website of Denmark).
Wood heating is energy effective when combustion takes place inside a close system, such as woodstove
or wood boiler. The heating process of a biomass boiler is more or less similar to an oil boiler, but more
efficient and with a very big difference in terms of CO2 emissions during burning. It is assumed that burning
wood fuel is kind of carbon neutral, the CO2 released into the atmosphere is equivalent with the CO2
released when the plant dies and decomposes (green system uk). These days, a wood boiler can be as
automated as oil or gas boiler which makes it more expensive. The wood boilers are available at different
scales: from a small domestic house to a large system, such as schools, hospitals or factories. In terms of
supply, it’s ideal to use these boilers for meeting local heat demands. In terms of operation cost, the wood
heat can be very cheap if the owner have access to free firewood or possess a woodlot but if not it is quite
costly due to transportation (Usewoodfuel Scotland).
Denmark enjoys a substantial potential in terms of wood resource. According to DEA, around 60 District
Heating plants are wood-base, approximate 10 decentralised wood-fired cogeneration plants (heat co-
generated with electricity) and 6 centralised cogeneration plants which use biomass among other fuels. In
terms of individual consumers, around 600,000 wood installations are registered in Denmark with the
majority coming from wood-burning stoves (Danish Energy Agency).
From all mentioned sources, the electric heating seems to be the least efficient in terms of operation and
environment. As Heat Pumps, their performance is affected by how the electricity was produced. At the
power plant the maximum efficiency from converting primary fuel (coal, gas or oil in most cases) to
electricity is about 40% while at end-user a maximum theoretical of 100%. Based on these, the overall
efficiency of the electric heaters will drop (Green Energy Efficient Homes).
In Denmark, the electric heating is considered the most environmentally unfriendly form of heating. It is
both expensive and polluting; the carbon footprint of one electrically heated house is equal with the carbon
footprint of three or four houses heated by DH (The Danish Energy Saving Trust). As Figure 1.2 showed, in
2010 more than 5% of the total domestic installations are electric heaters.
Further, based on the above specifications all the main choices will be re-ordered and presented in tabular
form in order to select the most suitable installations which are able to replace the current one. The listing
starts with the most efficient and ends with the least efficient. Must be specified that this ordering is not
100% accurate, it was made only based on previous literature.

Integration of Energy Demand Reduction and Sustainable Heating Installations in Individual Danish Buildings 19
Measures to reduce energy consumption in residential houses
Table 2.1 Alternative heating solutions presented for each of the three efficiency categories
Financial cost
(installation and
operation)
Environmental
impact
Conversion
efficiency
Solar Solar Solar
Air Heat pump Geothermal Geothermal
Wood Wood Ground Heat pump
Ground Heat pump Ground Heat pump Air Heat pump
Geothermal Air Heat pump Wood
Electric Electric Electric
As the table shows, the solar heating looks to be the most viable technology. Unfortunately, due to the
small solar potential this alternative is not able to meet the model house heat demand all by itself. Despite
the low climate impact and the nonexistent conversion process, the geothermal heating is not economically
feasible when it used to supply one dwelling. Taking into consideration also the large potential and/or
utilization, the heating system based on wood or heat pumps seems to be the proper choice to replace the
conventional oil boiler. Therefore an air and a ground source HP as well as wood boiler are selected to be
analyzed further.

Integration of Energy Demand Reduction and Sustainable Heating Installations in Individual Danish Buildings 20
Techno-economic aspects
3 Techno-economic aspects
As mentioned in previous Section, the techno-economic study looks into two main aspects:
Reduce heat demand by applying energy conservation measures, such as insulation
Reduce fuel and CO2 emissions by replacing the heat supply technology with a more efficient one
3.1 Renovation Scenarios
The first part of the section consists of a brief analysis as regards to the house envelope changes while the
second part illustrates the consistency of the most relevant results. The house envelope changes refer only
to the parts that are meant to be insulated: outer walls, roofs, floors and windows. Along the study, very
often these four parts will be presented as house elements or components.
3.1.1 Analysis
In order to improve the heat transfer through all building elements an extra insulation is needed. The
following table outlines the reference U-value of the house elements as well as the additional insulation
layer applied to the model house in mm. The reference U-values were selected based on the construction
year of the model house (ISOVER), (Energy Saving Trust, 2005).
Table 3.1 Reference U-value and the extra insulation in mm or improved U-value
Exterior walls Roofs Floors Windows
Reference U-value 0.99 0.70 0.60 2.93
Extra insulation/
Improved U-value 200 mm 300 mm 100 mm 1.0
In the SBi report the improvement for windows was expressed as U-value, while for the rest of the
elements as equivalent thickness.
Further, three different renovation scenarios are developed after applying the new insulation layer. All
three actions are characterized by an improved share of each building element as the Table 3.2 shows. For
example, applying Scenario A means that only 50% of the outer walls and floors and 75% of the roofs and
windows are insulated. It is assumed that Scenario C corresponds to the maximum energy savings of the
model house; the remaining 15% of the exterior walls and floors as well as 5% of the roofs are inaccessible.

Integration of Energy Demand Reduction and Sustainable Heating Installations in Individual Danish Buildings 21
Techno-economic aspects
Table 3.2 Proportion of individual building elements, which are assume improved
Share of improvement [%]
Exterior walls Roofs Floors Windows
Scenario A 50 75 50 75
Scenario B 75 90 75 85
Scenario C 85 95 85 100
Using an artifice of calculation based on energy consumption before and after insulation, from now on all
three scenarios will be represented as insulation levels. Scenario C it’s assumed to be the maximum energy
savings (subtracting 38.4 from 111.18 kWh/m2) which corresponds to 100% insulation. This means that
each percentage saved corresponds to 0.72 kWh. The 0% insulation represents the existing situation,
before applying energy improvements.
The calculated unit consumption for all the heated square meters as well as the energy savings at each
level of insulation is specified in the following table.
Table 3.3 Calculated unit energy consumption for space heating and hot water per m2 before and after implementing energy savings measures [kWh/m2/year]
Calculated energy consumption 111.18 58.5 46.1 38.4
Energy savings 0 52.68 65.08 72.78
0.72
0 72.38 89.42 100
Insulation level 0% 72% 89% 100%
Energy performance frameworks
for buildings Exceeds Falls in
According to new Danish Building Regulations (BR10), the house must meet an energy frame for total
consumption, including space heating, ventilation, cooling and domestic hot water. As can be seen, in the
existing situation, the energy consumption exceeds the predetermined limit, but after applying different
levels of thermal insulation, the model house meets the energy requirements. With more details regarding
these energy frameworks it will come back in the next chapter.
In order to see only the changes in energy for space heating after insulation, the energy consumption of hot
water must be subtracted.
3.1.2 Results
Energy consumption for hot tap water
To convert from liters to energy, one important characteristic is taken from Mayer and DeOreo book, such
as:
‘’It takes 4.187 kJ of energy to heat a liter of water by one degree’’ (Mayer, 1999)

Integration of Energy Demand Reduction and Sustainable Heating Installations in Individual Danish Buildings 22
Techno-economic aspects
180 365 65,700Annual hot water consumption liters
4.187 65,700 37 10178178.3 2,820Annual energy consumption of hot tap water kJ kWh
Based on the above features, the model house has the annual energy consumption for hot water set at
2,820 kWh. An improvement to preceding project was to create an hourly profile for hot water based on
predefined hypotheses (see Annexe A); a profile that will be used also in our analysis. It is important to
know that all the assumptions and calculations provided in the Annexe were made only to create the
hourly profile which was subsequently used in COMPOSE analysis, and not to determine the actual value.
Table 3.4 Annual energy consumption before and after applying energy savings measures [kWh/year]
Insulation level
0% 72% 89% 100%
Space heating 13,190 5,604 3,818 2,710
Hot tap water 2,820
Total energy consumption [kWh/year] 16,010 8,424 6,638 5,530
As the table points out, is possible to achieve high energy savings after enforcing different insulation levels:
47, 58 and respectively 65% energy reduction compare to initial consumption of 16,010 kWh.
As already mentioned only the Marginal Costs (MC) are taken into account. To determine with better
accuracy the total investments, the marginal costs for each element improved per square meter plus an
additional cost for each mm of extra insulation were retrieved from SBi report and reproduced in the table
below.
Table 3.5 Marginal Costs of implementing energy saving measures
Starting price
Exterior walls 26.81 EUR/m2 outer wall + 0.94 EUR/mm of extra insulation
Roofs 6.70 EUR/m2 roof + 0.13 EUR/mm of extra insulation
Floors 46.91 EUR/m2 floor
Windows 53.62 EUR/m2 window
With reference to the standard house data, the total investment costs for each level are established and
presented as table and graph.
Table 3.6 Total Marginal Costs [EUR]
Insulation level
72% 89% 100%
MC_outer walls 2,401 3,508 3,950
MC_roofs 873 1,039 1,095
MC_floors 3,378 5,067 5,742
MC_windows 1,737 1,969 2,316
Total MC 8,389 11,582 13,103

Integration of Energy Demand Reduction and Sustainable Heating Installations in Individual Danish Buildings 23
Techno-economic aspects
The below chart is used to highlight to most expensive elements that need to be renovated. In all three
cases, the floors seem to have the highest costs, followed then by exterior walls, windows and roofs. These
high costs are especially due to the difficult accessibility of the insulation layer beneath the floors.
Figure 3.1 Total investment costs represented in graphic for each level of insulation
As the results show, the heat demand reduction is directly proportional with the investment costs in
insulation. A greater energy demand reduction is reached when a larger area of the house is insulated and
consequently when a higher investment is made.
3.2 Energy-efficient installation scenarios
Fuel and CO2 reduction is also achievable via upgrading the current heating supply – replace it with a new,
more economical and environmental friendly installation. In previous section various efficient equipments
were summarized, but only three of them seem appropriate for the model house: air and ground source
HPs and a Wood Chips Boiler. Further, a more detailed description of the selected models will be provided.
3.2.1 Reference scenario – Existing Gasoil Boiler
The current space heating and domestic hot water of the house is provided by an independent gasoil-fired
boiler via a water-based system. Next table presents the main inputs of the conventional boiler.
0
3,000
6,000
9,000
12,000
15,000
72% 89% 100%
Tota
l mar
gin
al c
ost
s [E
UR
]
Insulation level
MC_outer walls MC_roofs MC_floors MC_windows

Integration of Energy Demand Reduction and Sustainable Heating Installations in Individual Danish Buildings 24
Techno-economic aspects
Table 3.7 Main inputs to COMPOSE of the existing boiler
15 kW Gasoil Boiler
Efficiency Remaining
Lifetime [years]
Installation cost [EUR]
Incentive cost [EUR]
O&M cost [EUR/year]
0.8 20 – – 110
3.2.2 Alternative scenario 1 – Air to Water Heat Pump
A 4.5 kW CO2 ECO Heat Pump from SANYO is chosen as a first alternative. This is an air to water device
which extracts energy from air and uses it to heat the water through the use of electricity. Unlike other
heat pump systems, the SANYO solution is the natural choice, hence the name of ECO. As its refrigerant,
within the system it uses carbon dioxide, a natural and non-toxic gas which can operate up to temperatures
below -20 °C (SANYO).
How does the Air to Water Heat Pump work?
The working process can be explained briefly in four steps (MasterTherm):
The following table summarize the main inputs of the preferred HP model.
Table 3.8 Main inputs to COMPOSE for an Air to Water HP
4.5 kW air to water HP from SANYO
Highest
COP Lifetime [years]
Installation cost [EUR]
Incentive cost [EUR]
O&M cost
[EUR/year]
3.75 20 8,500 2,000 0
Step 1 Evaporation: through a heat exchanger the energy from air is transferred to the refrigerant with a low boiling point which evaporates and circulates into the closed system
Step 2 Compression: the refrigerant pressure and temperature are raised by a compressor
Step 3 Condensation: in a second heat exchanger the refrigerant is condensed in order to release the heat to a water delivery system
Step 4 Expansion: the refrigerant pressure is reduced by an expansion valve. As a consequence, the temperature falls too and is ready to start the cycle again
A simple diagram of an air to water HP
Integration of Energy Demand Reduction and Sustainable Heating Installations in Individual Danish Buildings 25
Techno-economic aspects
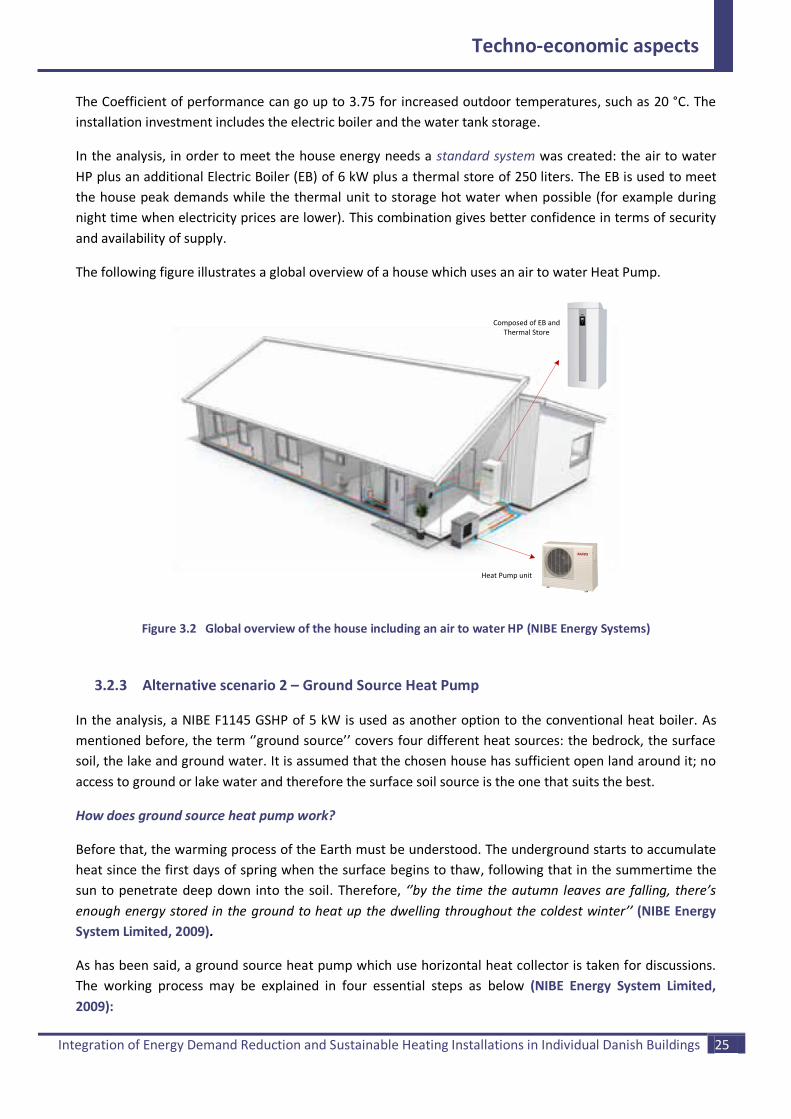
The Coefficient of performance can go up to 3.75 for increased outdoor temperatures, such as 20 °C. The
installation investment includes the electric boiler and the water tank storage.
In the analysis, in order to meet the house energy needs a standard system was created: the air to water
HP plus an additional Electric Boiler (EB) of 6 kW plus a thermal store of 250 liters. The EB is used to meet
the house peak demands while the thermal unit to storage hot water when possible (for example during
night time when electricity prices are lower). This combination gives better confidence in terms of security
and availability of supply.
The following figure illustrates a global overview of a house which uses an air to water Heat Pump.
Composed of EB and Thermal Store
Heat Pump unit
Figure 3.2 Global overview of the house including an air to water HP (NIBE Energy Systems)
3.2.3 Alternative scenario 2 – Ground Source Heat Pump
In the analysis, a NIBE F1145 GSHP of 5 kW is used as another option to the conventional heat boiler. As
mentioned before, the term ‘’ground source’’ covers four different heat sources: the bedrock, the surface
soil, the lake and ground water. It is assumed that the chosen house has sufficient open land around it; no
access to ground or lake water and therefore the surface soil source is the one that suits the best.
How does ground source heat pump work?
Before that, the warming process of the Earth must be understood. The underground starts to accumulate
heat since the first days of spring when the surface begins to thaw, following that in the summertime the
sun to penetrate deep down into the soil. Therefore, ‘’by the time the autumn leaves are falling, there’s
enough energy stored in the ground to heat up the dwelling throughout the coldest winter’’ (NIBE Energy
System Limited, 2009).
As has been said, a ground source heat pump which use horizontal heat collector is taken for discussions.
The working process may be explained in four essential steps as below (NIBE Energy System Limited,
2009):

Integration of Energy Demand Reduction and Sustainable Heating Installations in Individual Danish Buildings 26
Techno-economic aspects
In order for the pipes to be laid down, the top earth layer needs to me removed completely and then
distributed back. After that the family can use the total space of its garden as if nothing had happened. The
loop length is chosen according to the house size and the amount of heat that needs.
The table below outlines the main inputs of the chosen GSHP.
Table 3.9 Main inputs to COMPOSE for a GSHP
5 kW GSHP from NIBE
Highest COP
Lifetime [years]
Installation cost [EUR]
Incentive cost [EUR]
O&M cost
[EUR/year]
4.44 30 12,200 2,600 0
The pump is optimized to run at a low temperature of the output water, such as 35 °C. It has a zero visual
impact on the garden; all outdoor elements are hidden into the ground.
In order to cover the house needs, a standard system similar to the air to water heat pump is defined. It is
almost the same structure, the only difference being in the pump type.
The next figure shows a global overview of a house which includes a horizontal-loop system.
Step 1 Through the pipes buried at a depth of about 1-2 m beneath the lawn a mixture of water and antifreeze circulates. The stored heat from the earth surface is absorbed into this liquid, known also as a collector, and pumped into the heat pump using a heat exchanger
Step 2 After the collector with a low grade heat passes through the heat pump, it meets another closed system. This new system contains a refrigerant which is capable of being turned into gas at a very low temperature
Step 3 Through a high pressure compressor, the refrigerant temperature rise significantly, up till 100 °C. Afterwards, the heat is transferred to the water-based system of the house via a condenser. Usually, the output temperature of the water after leaving the condenser reaches more than 50 °C
Step 4 The refrigerant returns to liquid form and is ready to repeat the cycle as long as heating is required
A simple diagram of a GSHP

Integration of Energy Demand Reduction and Sustainable Heating Installations in Individual Danish Buildings 27
Techno-economic aspects
Contains the EB and the Thermal Storage unit
Horizontal heat exchanger – connection in series
Figure 3.3 Global overview of the house including a horizontal ground source Heat Pump (NIBE Energy Systems)
3.2.4 Alternative scenario 3 – Wood Chips Boiler
A wood chip boiler can be as well incorporated into the house, for discussions a 20 kW HACK ETA boiler was
chosen (ETA Heiztechnik GmbH). The heating process itself is similar to the oil: the wood-fired boiler heats
the water, which provides central heating through radiators and hot water to the taps.
Next table presents the main inputs of the selected Wood Chips Boiler:
Table 3.10 Main inputs to COMPOSE for a Wood Chips Boiler
20 kW Wood Chips Boiler from ETA
Efficiency Lifetime [years]
Installation cost [EUR]
Incentive cost [EUR]
O&M cost [EUR/year]
0.95 30 15,000 3,000 230
In order to work at its high performance, the boiler must to be cleaned every two weeks. In general, the
wood chip is stored in an open area where it can be easily accessed.
As was seen in the above tables, around 20% of the equipment cost is supported by the Danish
Government through so called incentives or subsidies and that because air, ground and wood are
considered renewable sources (european heat pump association), (Centre for Biomass Technology).
3.3 Results
For achieving a significant reduction of energy, fuel and CO2 emissions, the heating installations mentioned
above are been integrated with all restoration actions. The modelling was performed in COMPOSE while
the output data was processed in Excel in order to reach the desired charts. All results are expressed as
annual values in graphical form. In annexe B they can be seen are tabular form.

Integration of Energy Demand Reduction and Sustainable Heating Installations in Individual Danish Buildings 28
Techno-economic aspects
Most feasible alternatives based on economic or financial topic will be highlighted through the use of a
discussion space. Each of the four heat installations are analysed with all four insulation levels making thus
a total of sixteen different investment points.
The total space of discussion is represented in form of four possible options as below:
Option 1: Do nothing
Option 2: Keep the Gasoil Boiler and insulate
Option 3: Replace the Gasoil Boiler with HPs/Wood Chips Boiler
Option 4: Replace the Gasoil Boiler with HPs/Wood Chips Boiler and insulate
First let’s see how the situation looks in terms of investment recovery based on economic and financial fuel
savings. As already mentioned in Introduction part, COMPOSE is able to determine the cost before applying
VAT and taxes – economic cost and after applying VAT and taxes – financial cost. The only difference
between the two is that financial costs represent the consumer reality and this is due the fiscal cost
inclusion.
In the following tables, the Simple Payback Period (SPP) was determined by dividing the economic and
financial fuel savings by total costs after subtracting the subsidies.
Table 3.11 SPP based on annual economic fuel savings
Economic Fuel Savings [EUR/year] Simple Payback Period [years]
Insulation level 0% 72% 89% 100% 0% 72% 89% 100%
Type of installation
Gasoil Boiler – 532.77 658.20 736.01 – 15.75 17.60 17.80
Air to Water HP 868.24 999.66 1028.86 1046.71 7.49 14.89 17.57 18.73
GSHP 909.26 1018.49 1043.08 1058.08 10.56 17.66 20.31 21.46
Wood Chips Boiler 740.67 922.49 965.29 991.85 16.20 22.10 24.43 25.31
Table 3.12 SPP based on annual financial fuel savings
Financial Fuel Savings [EUR/year] Simple Payback Period [years]
Insulation level 0% 72% 89% 100% 0% 72% 89% 100%
Type of installation
Gasoil Boiler – 1048.35 1295.16 1448.28 – 8.00 8.94 9.05
Air to Water HP 1197.77 1696.01 1810.02 1880.19 5.43 8.78 9.99 10.43
GSHP 1346.45 1762.83 1859.28 1918.81 7.13 10.20 11.39 11.83
Wood Chips Boiler 1732.85 1960.12 2013.63 2046.82 6.92 10.40 11.71 12.26
Both tables can be interpreted alike: Results interpretation
0% 72% 89% 100%
Option 1
Option 2 X X X
Option 3 X
Option 4
Insulation level
The first convenient/cheapest solution for the consumer is to replace the gasoil boiler and don’t insulate while the second one is to keep the existing boiler and insulate.
Integration of Energy Demand Reduction and Sustainable Heating Installations in Individual Danish Buildings 29
Techno-economic aspects
Due to the fiscal cost inclusion the payback time based on financial fuel savings looks more attractive. The
replacement of gasoil boiler with HPs or Wood Chips Boiler and no insulation could be also labelled as the
optimal solution in terms of costs. Therefore, a first impression after analysing the return of investment is
that insulation is not feasible after replacing the existing gasoil boiler.
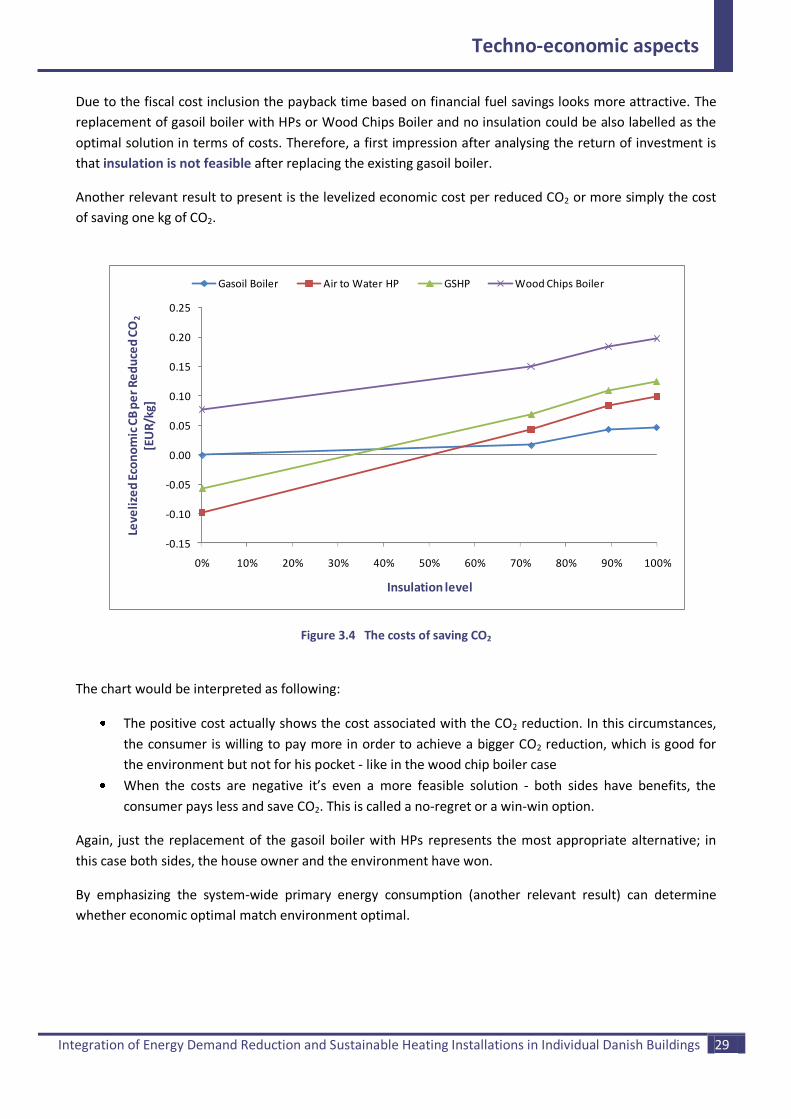
Another relevant result to present is the levelized economic cost per reduced CO2 or more simply the cost
of saving one kg of CO2.
Figure 3.4 The costs of saving CO2
The chart would be interpreted as following:
The positive cost actually shows the cost associated with the CO2 reduction. In this circumstances,
the consumer is willing to pay more in order to achieve a bigger CO2 reduction, which is good for
the environment but not for his pocket - like in the wood chip boiler case
When the costs are negative it’s even a more feasible solution - both sides have benefits, the
consumer pays less and save CO2. This is called a no-regret or a win-win option.
Again, just the replacement of the gasoil boiler with HPs represents the most appropriate alternative; in
this case both sides, the house owner and the environment have won.
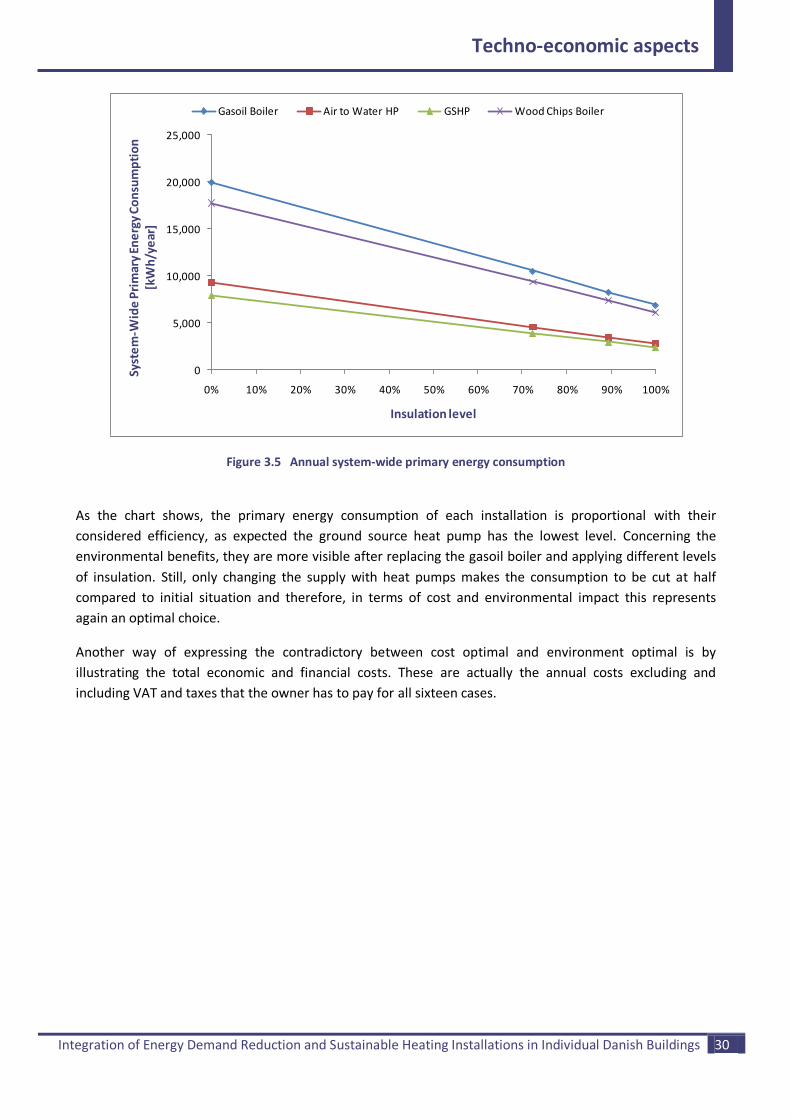
By emphasizing the system-wide primary energy consumption (another relevant result) can determine
whether economic optimal match environment optimal.
-0.15
-0.10
-0.05
0.00
0.05
0.10
0.15
0.20
0.25
0% 10% 20% 30% 40% 50% 60% 70% 80% 90% 100%
Leve
lize
d E
con
om
ic C
B p
er
Re
du
ced
CO
2
[EU
R/k
g]
Insulation level
Gasoil Boiler Air to Water HP GSHP Wood Chips Boiler
Integration of Energy Demand Reduction and Sustainable Heating Installations in Individual Danish Buildings 30
Techno-economic aspects
Figure 3.5 Annual system-wide primary energy consumption
As the chart shows, the primary energy consumption of each installation is proportional with their
considered efficiency, as expected the ground source heat pump has the lowest level. Concerning the
environmental benefits, they are more visible after replacing the gasoil boiler and applying different levels
of insulation. Still, only changing the supply with heat pumps makes the consumption to be cut at half
compared to initial situation and therefore, in terms of cost and environmental impact this represents
again an optimal choice.
Another way of expressing the contradictory between cost optimal and environment optimal is by
illustrating the total economic and financial costs. These are actually the annual costs excluding and
including VAT and taxes that the owner has to pay for all sixteen cases.
0
5,000
10,000
15,000
20,000
25,000
0% 10% 20% 30% 40% 50% 60% 70% 80% 90% 100%
Syst
em
-Wid
e P
rim
ary
Ene
rgy
Co
nsu
mp
tio
n
[kW
h/y
ear
]
Insulation level
Gasoil Boiler Air to Water HP GSHP Wood Chips Boiler

Integration of Energy Demand Reduction and Sustainable Heating Installations in Individual Danish Buildings 31
Techno-economic aspects
Figure 3.6 Annual Economic Costs
Figure 3.7 Annual Financial Costs
Interpretation based on economic and financial costs
500
1,000
1,500
2,000
2,500
0% 10% 20% 30% 40% 50% 60% 70% 80% 90% 100%
Tota
l Eco
no
mic
Co
sts
[EU
R/y
ear
]
Insulation level
Gasoil Boiler Air to Water HP GSHP Wood Chips Boiler
1,500
2,000
2,500
3,000
0% 10% 20% 30% 40% 50% 60% 70% 80% 90% 100%
Tota
l Fin
anci
al C
ost
s [E
UR
/ye
ar]
Insulation level
Gasoil Boiler Air to Water HP GSHP Wood Chips Boiler
As in the Simple Payback Period case, is cheaper for the house owner to replace their existing boiler and not insulate or to keep it and insulate.
0% 72% 89% 100%
Option 1
Option 2 X X X
Option 3 X
Option 4
Insulation level
Integration of Energy Demand Reduction and Sustainable Heating Installations in Individual Danish Buildings 32
Techno-economic aspects
The financial costs display also another possible alternative, such as to replace the existing boiler with HPs
and apply the first level of insulation but due to the small difference between them and the gasoil situation
it is considered ineffective. It can become effective if for example the heat demand of the house increases.
In the gasoil case, a visible difference between the two profiles (economic and financial) can be observed
and this is because financial costs are dominated by fiscal.
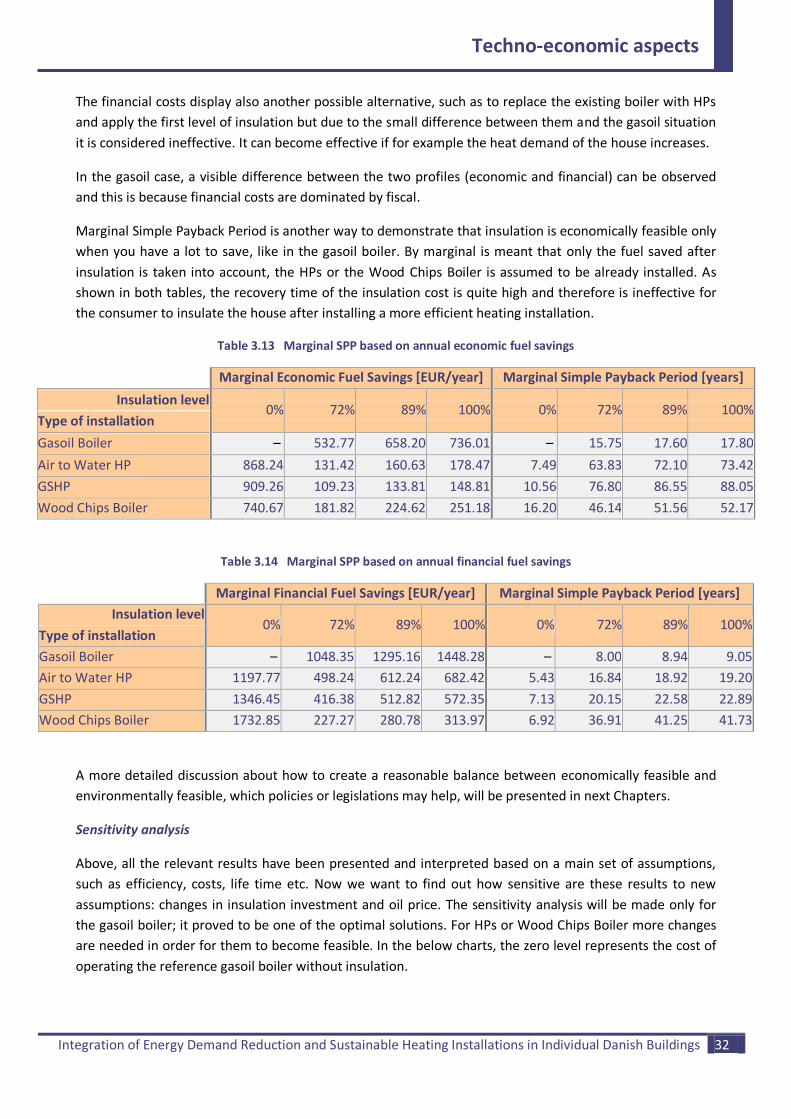
Marginal Simple Payback Period is another way to demonstrate that insulation is economically feasible only
when you have a lot to save, like in the gasoil boiler. By marginal is meant that only the fuel saved after
insulation is taken into account, the HPs or the Wood Chips Boiler is assumed to be already installed. As
shown in both tables, the recovery time of the insulation cost is quite high and therefore is ineffective for
the consumer to insulate the house after installing a more efficient heating installation.
Table 3.13 Marginal SPP based on annual economic fuel savings
Marginal Economic Fuel Savings [EUR/year] Marginal Simple Payback Period [years]
Insulation level 0% 72% 89% 100% 0% 72% 89% 100%
Type of installation
Gasoil Boiler – 532.77 658.20 736.01 – 15.75 17.60 17.80
Air to Water HP 868.24 131.42 160.63 178.47 7.49 63.83 72.10 73.42
GSHP 909.26 109.23 133.81 148.81 10.56 76.80 86.55 88.05
Wood Chips Boiler 740.67 181.82 224.62 251.18 16.20 46.14 51.56 52.17
Table 3.14 Marginal SPP based on annual financial fuel savings
Marginal Financial Fuel Savings [EUR/year] Marginal Simple Payback Period [years]
Insulation level 0% 72% 89% 100% 0% 72% 89% 100%
Type of installation
Gasoil Boiler – 1048.35 1295.16 1448.28 – 8.00 8.94 9.05
Air to Water HP 1197.77 498.24 612.24 682.42 5.43 16.84 18.92 19.20
GSHP 1346.45 416.38 512.82 572.35 7.13 20.15 22.58 22.89
Wood Chips Boiler 1732.85 227.27 280.78 313.97 6.92 36.91 41.25 41.73
A more detailed discussion about how to create a reasonable balance between economically feasible and
environmentally feasible, which policies or legislations may help, will be presented in next Chapters.
Sensitivity analysis
Above, all the relevant results have been presented and interpreted based on a main set of assumptions,
such as efficiency, costs, life time etc. Now we want to find out how sensitive are these results to new
assumptions: changes in insulation investment and oil price. The sensitivity analysis will be made only for
the gasoil boiler; it proved to be one of the optimal solutions. For HPs or Wood Chips Boiler more changes
are needed in order for them to become feasible. In the below charts, the zero level represents the cost of
operating the reference gasoil boiler without insulation.
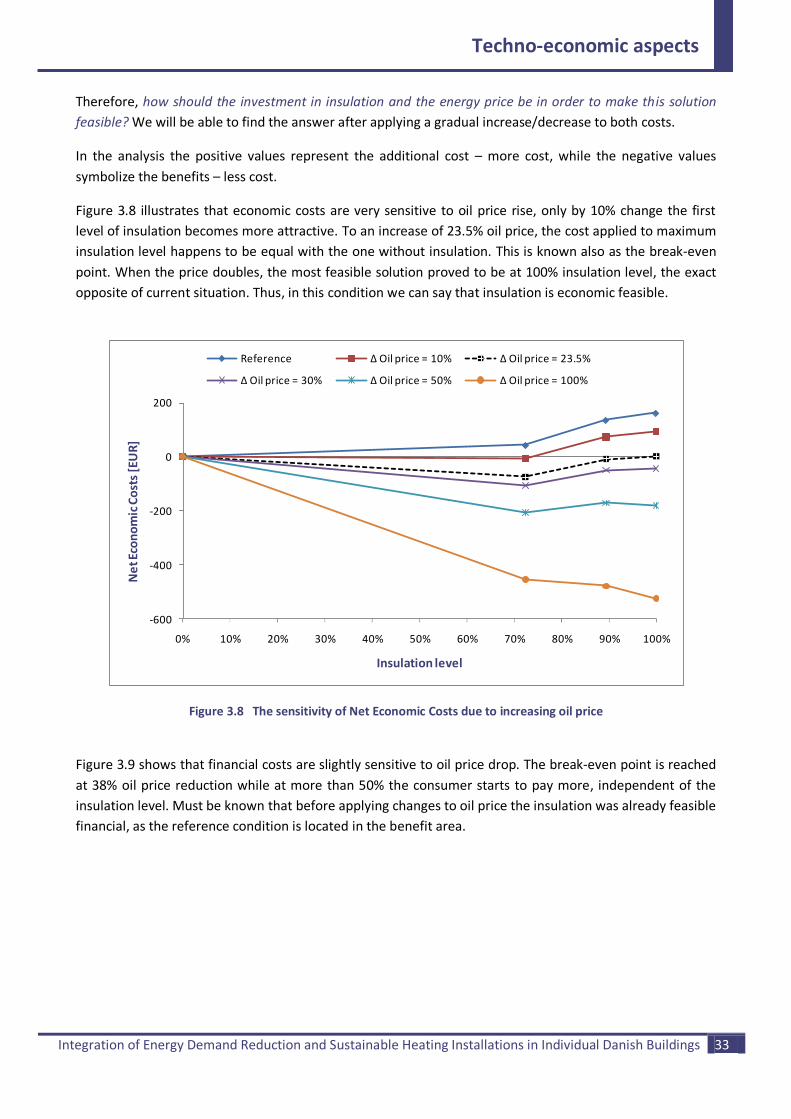
Integration of Energy Demand Reduction and Sustainable Heating Installations in Individual Danish Buildings 33
Techno-economic aspects
Therefore, how should the investment in insulation and the energy price be in order to make this solution
feasible? We will be able to find the answer after applying a gradual increase/decrease to both costs.
In the analysis the positive values represent the additional cost – more cost, while the negative values
symbolize the benefits – less cost.
Figure 3.8 illustrates that economic costs are very sensitive to oil price rise, only by 10% change the first
level of insulation becomes more attractive. To an increase of 23.5% oil price, the cost applied to maximum
insulation level happens to be equal with the one without insulation. This is known also as the break-even
point. When the price doubles, the most feasible solution proved to be at 100% insulation level, the exact
opposite of current situation. Thus, in this condition we can say that insulation is economic feasible.
Figure 3.8 The sensitivity of Net Economic Costs due to increasing oil price
Figure 3.9 shows that financial costs are slightly sensitive to oil price drop. The break-even point is reached
at 38% oil price reduction while at more than 50% the consumer starts to pay more, independent of the
insulation level. Must be known that before applying changes to oil price the insulation was already feasible
financial, as the reference condition is located in the benefit area.
-600
-400
-200
0
200
0% 10% 20% 30% 40% 50% 60% 70% 80% 90% 100%
Ne
t Eco
no
mic
Co
sts
[EU
R]
Insulation level
Reference Δ Oil price = 10% Δ Oil price = 23.5%
Δ Oil price = 30% Δ Oil price = 50% Δ Oil price = 100%
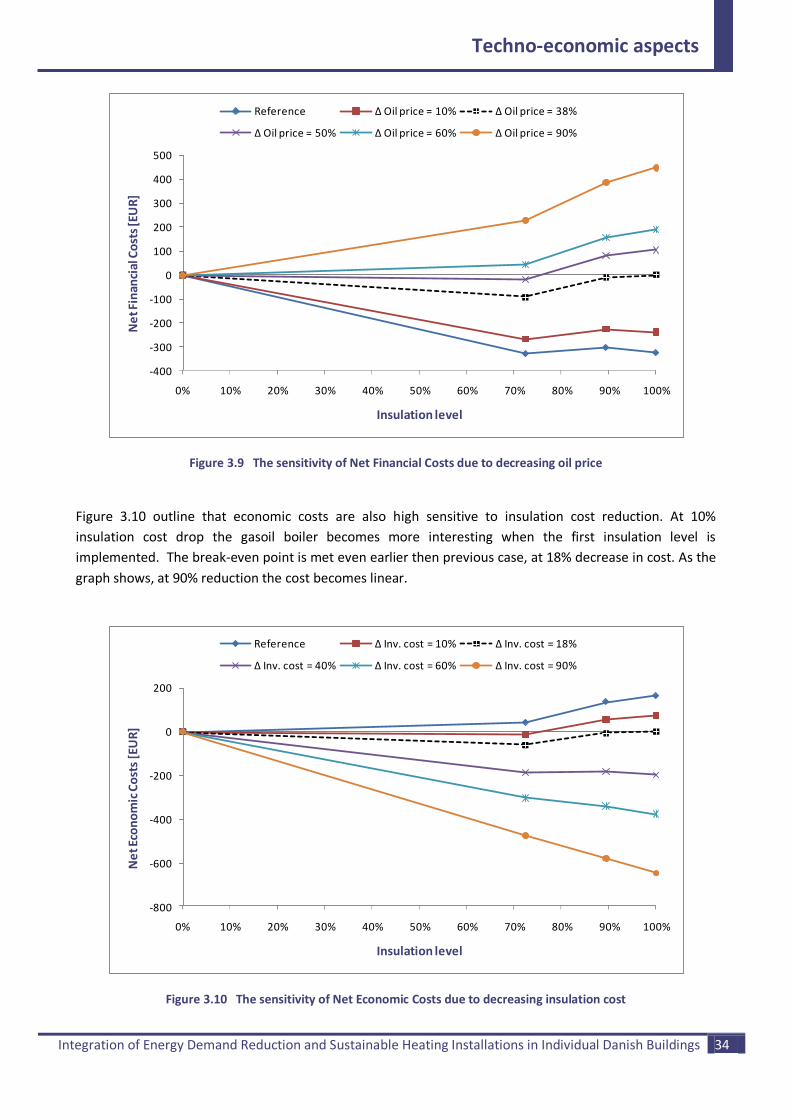
Integration of Energy Demand Reduction and Sustainable Heating Installations in Individual Danish Buildings 34
Techno-economic aspects
Figure 3.9 The sensitivity of Net Financial Costs due to decreasing oil price
Figure 3.10 outline that economic costs are also high sensitive to insulation cost reduction. At 10%
insulation cost drop the gasoil boiler becomes more interesting when the first insulation level is
implemented. The break-even point is met even earlier then previous case, at 18% decrease in cost. As the
graph shows, at 90% reduction the cost becomes linear.
Figure 3.10 The sensitivity of Net Economic Costs due to decreasing insulation cost
-400
-300
-200
-100
0
100
200
300
400
500
0% 10% 20% 30% 40% 50% 60% 70% 80% 90% 100%
Ne
t Fin
anci
al C
ost
s [E
UR
]
Insulation level
Reference Δ Oil price = 10% Δ Oil price = 38%
Δ Oil price = 50% Δ Oil price = 60% Δ Oil price = 90%
-800
-600
-400
-200
0
200
0% 10% 20% 30% 40% 50% 60% 70% 80% 90% 100%
Ne
t Eco
no
mic
Co
sts
[EU
R]
Insulation level
Reference Δ Inv. cost = 10% Δ Inv. cost = 18%
Δ Inv. cost = 40% Δ Inv. cost = 60% Δ Inv. cost = 90%
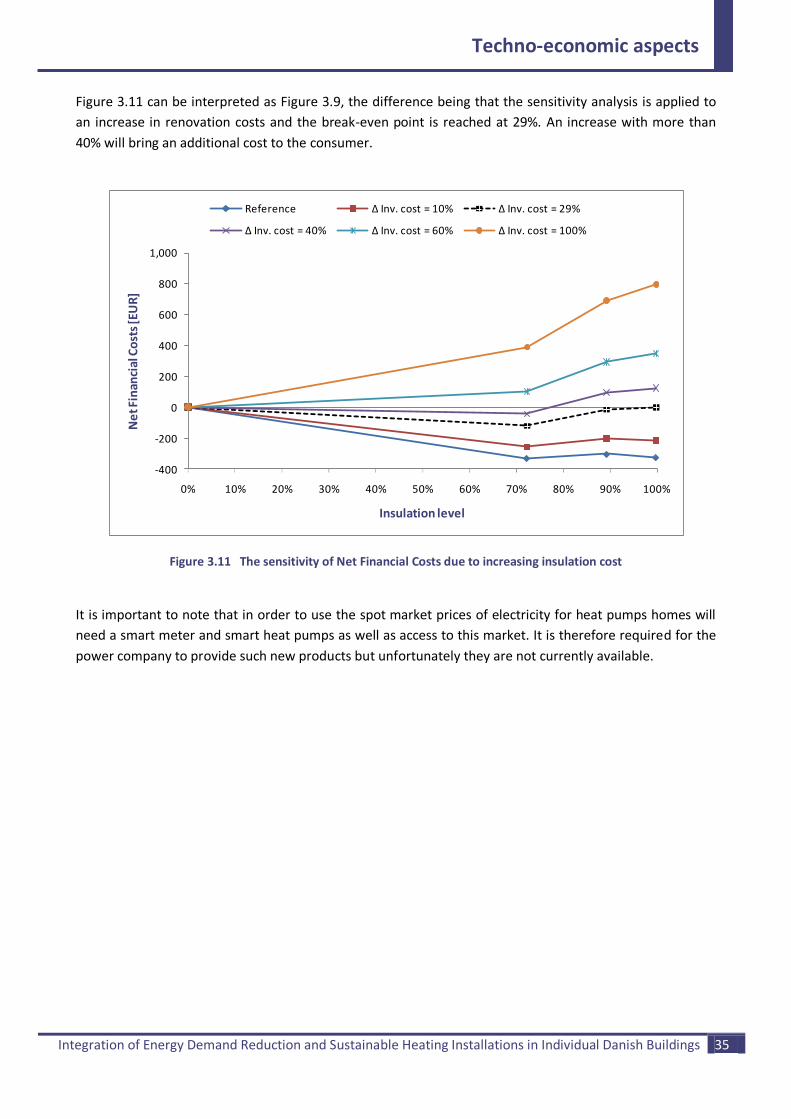
Integration of Energy Demand Reduction and Sustainable Heating Installations in Individual Danish Buildings 35
Techno-economic aspects
Figure 3.11 can be interpreted as Figure 3.9, the difference being that the sensitivity analysis is applied to
an increase in renovation costs and the break-even point is reached at 29%. An increase with more than
40% will bring an additional cost to the consumer.
Figure 3.11 The sensitivity of Net Financial Costs due to increasing insulation cost
It is important to note that in order to use the spot market prices of electricity for heat pumps homes will
need a smart meter and smart heat pumps as well as access to this market. It is therefore required for the
power company to provide such new products but unfortunately they are not currently available.
-400
-200
0
200
400
600
800
1,000
0% 10% 20% 30% 40% 50% 60% 70% 80% 90% 100%
Ne
t Fin
anci
al C
ost
s [E
UR
]
Insulation level
Reference Δ Inv. cost = 10% Δ Inv. cost = 29%
Δ Inv. cost = 40% Δ Inv. cost = 60% Δ Inv. cost = 100%

Integration of Energy Demand Reduction and Sustainable Heating Installations in Individual Danish Buildings 36
Challenges to change
4 Challenges to change
The first part of the section includes a brief review of the current policies and regulations. The main
obstacles to more energy-efficient homes as well as the implementation of the optimal alternatives are
presented further.
4.1 Assessment of existing policies and regulations
Today, Denmark is one of the leaders in terms of energy efficiency and renewable energy. Since 1980,
Danish economy grew by 78%, while energy consumption remained almost the same. In terms of energy,
since 1997 Denmark had become self-sufficient, meaning that it is no longer dependent on fuel imports to
cover its energy consumption. Moreover, the share of renewable energy accounts for about 19% in final
energy consumption and approximate 28% if we look into the electricity supply separately. Denmark has
also a wide and varied heat sector, around 681 plants generate both electricity and heat, on small and large
scale, and around 230 only heat. Overall, all these were possible due to decisions made by politicians and
planners over the last decades (Danish Energy Agency).
The Ministry of Climate and Energy and the Danish Energy Agency are accountable for establishing new
renewable energy and energy efficiency policies. Their task is to influence the society behaviour in order to
act in a more energy-efficient and environmentally friendly way. The influence is mainly exerted through
the implementation of energy agreements and policies in all sectors (Nordic Energy Solutions).
Until 30 June this year, a commitment for grants is still valid for scraping the existing oil burners. For those
owners who need to replace oil-fired, grants for the purchase and installation of district heating, heat
pumps or solar heating are available (Skrot dit oliefyr).
Further, two of the national policies most related to the project are outlined below:
1. An Energy Policy Agreement established in 2008 sets out targets for energy-saving initiatives. Some
of these initiatives are summarized briefly beneath (Danish Climate and Energy Policy):
A reduction of at least 75% of the energy used in buildings should be reached by 2020
More than 2,5 millions EUR are allocated annually, during 2008-2011, to different campaigns for
promoting energy savings in buildings
Heat pumps are favoured when it comes to changing the individual oil burners. A pool of
approximate 4 million EUR has been attributed for information campaigns, labelling of efficient
pumps, limited subsidies schemes, etc. In order to understand the value of this fund has been
estimated that around 470 air to water heat pumps from SANYO or 320 ground source heat
pumps from NIBE can be purchased with this amount of money. This initiative seeks only heat
consumers outside the collective heat supply
Tax increase for CO2 and other pollutants

Integration of Energy Demand Reduction and Sustainable Heating Installations in Individual Danish Buildings 37
Challenges to change
2. In February 2011, the Danish Government has initiated a long-term vision called the Energy Strategy
2050. This strategy is actually the first of its kind ever created in Denmark and probably in the rest of
the world having as primary goal to become independent of fossil fuels (coal, oil and gas) by 2050. In
addition, as a consequence of reducing fossil fuel dependency, the share of renewable energy is
expected to increase by 33% until 2020 (The Danish Government, 2011).
Since 1973, Denmark has been an active member of the European Union (EU). As the results show, the EU
regulations have been implemented into the national legislation. From the EU climate and energy package
the most relevant Danish targets can be summarized as further (The Danish Government, 2011):
A share of 30% renewable energy on final energy consumption (electricity, heating and cooling)
should be achieved by 2020 in relation to 1990 level. This is actually a Danish goal to overcome the
common EU framework and foster a new climate and energy policy. The overall target was
originally established through Directive: 2009/28/EC – 20% share of energy from renewable
sources by 2020
A gradual reduction until reaches 20% by 2020 regarding the non-ETS (emissions trading scheme)
greenhouse gas emissions
Starting with 1st June a new tax deduction from salaries was introduced for energy efficient renovations in
Danish homes. With this tax deduction of approximate 2,000 EUR per year per person over 18 years, the
Government wants to stimulate private owners to improve their homes in order to reduce the energy
expenditure and increase the sale value (Videncenter for energibesparelser i bygninger).
As already mentioned, the European buildings are responsible for about 40% of the total energy
consumption. To reduce this share, a new Directive of the European Parliament and of the Council on
Energy Performance of Buildings (2010/31/EU) came into force in May 2010. The Directive was set to
promote the improvement of energy performance in new and existing buildings having as main purpose a
20% reduction in greenhouse gas emissions and 20% energy savings by 2020. This new Directive is actually
a recast of the main legislative instrument established in December 16th, 2002 (2002/91/EC) (Official
Journal of the European Union, 2010).
In order to achieve the Directive aim, in 2010 the Danish Ministry of Economic and Business Affairs has
implemented a new set of rules for constructions in Denmark called Building Regulations (BR10). In relation
to BR08, important changes are made concerning the energy consumption level. The new energy
frameworks for heating, ventilation, cooling and domestic hot tap water are presented next (The Danish
Ministry of Economic and Business Affairs, 2010):
The energy consumption should not exceed 52.5 kWh/m2/year +1650 kWh/year divided the heated
floor area
To be part of class 2015 low-energy building, the energy consumption must not exceed 30
kWh/m2/year +1000 kWh/year divided the heated floor area. This new class is actually introduced
instead of class 1 and 2 low-energy from BR08.
Is necessary to know that the rules are designed for new constructions but in the analyses, the energy
frameworks were used as a comparison to the existing model dwelling.
Integration of Energy Demand Reduction and Sustainable Heating Installations in Individual Danish Buildings 38
Challenges to change
4.2 Barriers to more energy efficient buildings
It turns out that the real advantage of energy efficiency in existing residential buildings has been hidden by
the so-called barriers. Two of them with a high impact in the consumer decision-making are presented
below.
4.2.1 Market barriers
Has been proved that today, energy efficiency is not a major preoccupation especially for individual
consumers. This lack of care stems from the fact that energy costs are low compared to labour cost, for
example, and therefore people are not motivated to improve. Even so, if at individual level the cost is low
at society level it is quite significant. Due to this, through different policies and regulations, the Danish
Government wishes to promote energy-savings and energy efficiency measure in order to reduce the
overall energy consumption and consequently the environmental impact (International Energy Agency,
2008).
Through information people have access to a wide range of perception in terms of efficiency, technical
aspects, level of comfort, climate impact or security matters. Therefore, one important market obstacle in
applying energy efficiency measures in residential buildings is the information failure. There are many
forms of information barriers, but the ones with the higher importance are summarized in the following list
(International Energy Agency, 2008):
Lack of transparency regarding the available data, such as financial support to invest in more
efficient technologies
The ability to explain the technical aspects. The non-experts consumers have difficulties in making
use of the existing information and therefore the sellers, promoters or financiers should have a
proper training and knowledge in energy efficiency
The energy price distortion could be another important barrier. Due to the lack of inclusion of externalities,
the price is not reflecting the true cost of the energy used (International Energy Agency, 2008).
Therefore, by dealing with such barriers, the consumer perception for financial and environment advantage
becomes even more difficult to change.
4.2.2 Financial barriers
The main financial obstacles are going to the outlined below (International Energy Agency, 2008):
Usually, the acquisition cost of an energy efficient product tends to be higher than the less efficient
one and thus the access to initial cost turns into a prime barrier for consumers
Another obstacle is the uncertainty linked to energy savings. The methods used to calculate the
energy savings depends on different forecasts (weather, energy prices) and thus is difficult to
evaluate with accuracy the ‘’after-benefits’’
The applied discount rate with respect to energy efficient investments may also represent an
obstacle. Among consumers the opinions are divided, some say that the current discount rate is as
it should be and some that it is too high and for this reason the investment happens to be
considered a risk

Integration of Energy Demand Reduction and Sustainable Heating Installations in Individual Danish Buildings 39
Challenges to change
Bank loans could be another possible financial obstacle. Due to the high initial cost, consumers
usually borrow money from banks. Based on the lending volume, an interest rate will be applied; in
some cases it could be fixed or variable depending on the economic conditions. The loan is
calculated according to the borrower’s income capacity and therefore an unsecure workplace
involves greater risks.
Must be know that the financial aspect represents only one part of the owner’s decision process. Was show
in different studies that the need for something can push someone to overcome the feeling of risk or great
effort, such as financial (Joelsson, 2007).
4.3 Implementation of optimal solution(s)
Two solutions have been identified as optimal, primarily considering the cost and secondly the
environmental impact:
1. The replacement of the conventional gasoil boiler with energy-efficient installations, such as HPs or
Wood Chips Boiler proved to be the best choice. In this case, both parties involved win: on the one
hand the consumer chooses the cheapest alternative and on the other hand, more environmentally-
friendly.
As mentioned above, through the existing energy policies, the Danish Government supports the
replacement of oil furnaces with Heat Pumps and Biomass Boilers. Approximately 20% of the
purchase cost of these installations is borne by the so-called governmental subsidies. But still, after
subtracting these subsidies, the initial investment cost is high and therefore in some cases the
consumer must turn to bank loans.
Overall, the implementation of this solution is favorable for all: low energy bills for the consumers,
reduced oil dependency and consequently, low environmental impact.
2. Keeping the gasoil boiler and insulating the house is another optimal choice for the owner and also
for the environment. Through insulation is possible to achieve a reduction of heat consumption by
47, 58 and respectively 65% as well as a substantial reduction in CO2 emissions. As mentioned earlier,
the Danish government began to encourage energy efficient renovations, but unfortunately, the
investment cost is still high for most consumers.
As a result, preserving the existing gasoil boiler is in contradiction with the Government's wish to
become fossil fuel independent but implementing energy-savings measures in order to reduce the
overall energy consumption is a key requirement, both nationally and internationally.
In both cases, the investment cost is a primary barrier, but through the introduction of incentives, it gets a
more optimistic shape.
Therefore, implementing any of the two optimal solutions requires compromises from either the consumer
or the environment but is important to know that in both situations everyone stands to gain.
Integration of Energy Demand Reduction and Sustainable Heating Installations in Individual Danish Buildings 40
Conclusions and recommendations
5 Conclusions and recommendations
An initial aim of the report was to ‘’transform’’ a modelled Danish house. After applying the right measures,
the house should become energy-efficient and environmental friendly. The techno-economic analysis has
shown that the total energy demand can be reduced by 47, 58, and respectively 65% after applying
different levels of thermal insulation. A significant fuel and CO2 reduction can be also achieved by replacing
the conventional heating installation with an air to water HP or a ground source HP or a Wood Chips boiler.
By applying both measures, insulation and efficient heat equipments, the results are even more favorable
especially for the environment but also for the consumers if we look into fuel savings only. However, from
the consumer perspective, application of both measures is not economically feasible. It is proved to be
efficient only in cases where the consumer has a lot to save.
Due to high investment costs, the pay-back time based on fuel savings is also high. By looking into the
results, only two solutions are economically viable. The first is just the replacement of the existing gasoil
boiler with one of the three efficient installations. The second one is just the addition of insulation while
the existing oil boiler is not replaced.
From the institutional perspective, the Danish government offers financial support to replace the oil boiler
and to renovate the house. Still, the amount of money allocated is limited and consequently the level of
incentives is small.
Recommendations:
Due to high initial cost, a even more supportive financial framework is needed from the
government for both, insulation and efficient instalations
The municipalities or the state should provide a lower or even free interest loans for energy
efficient measures
As a government, first priority is to replace the oil boiler. As seen, the Danish government offers grants to
get rid of oil boilers. Then, the conditions must be changed in order to make the insulation much cheaper
and insulate in the end.

Integration of Energy Demand Reduction and Sustainable Heating Installations in Individual Danish Buildings 41
Bibliography
6 Bibliography
Abdeen, M. O. (2006). Ground-source heat pumps systems and applications. Renewable and Sustainable
Energy Reviews , 27.
Boyle, G. (2004). Renewable Energy. London: Oxford University Press.
Centre for Biomass Technology. (u.d.). Subsidies, taxes and duties on energy in Denmark. Hentede 22. May
2011 fra Centre for Biomass Technology:
http://www.videncenter.dk/uk/Articles/samlet2.htm#subsidiesPrivate
Danish Building Research Institute. (2010). Danske bygningers energibehov i 2050. Aalborg: SBi.
Danish Energy Agency. (u.d.). Hentede 24. May 2011 fra Danish Energy Agency: http://www.ens.dk/en-
US/Sider/forside.aspx
Danish Energy Agency and Ministry of Climate and Energy. (u.d.). Geothermal energy. Hentede 23. May
2011 fra Climate & Energy Guide: http://www.klimaogenergiguiden.dk/topic17_geothermal-energy.html
Danish Energy Agency. (u.d.). Danish Climate and Energy Policy. Hentede 28. May 2011 fra Danish Energy
Agency: http://www.ens.dk/en-US/policy/danish-climate-and-energy-policy/Sider/danish-climate-and-
energy-policy.aspx
Danish Energy Agency. (u.d.). Large and small scale district heating plants. Hentede 22. May 2011 fra
Danish Energy Agency: http://www.ens.dk/en-US/supply/Heat/district_heating_plants/Sider/Forside.aspx
Danish Energy Agency. (u.d.). Skrot dit oliefyr. Hentede 7. June 2011 fra SKROTDITOLIEFYR.DK:
http://www.skrotditoliefyr.dk/da-DK/om_ordningen/Sider/forside.aspx
DeOreo, W. B. The End Use of Hot Water in Single Family Homes. Aquacraft, Inc.
Double Glazing Info. (u.d.). Noise and thermal insulation. Hentede 15. May 2011 fra http://www.double-
glazing-info.com/Noise-and-thermal-insulation/How-does-it-work/Thermal-insulation-glass-and-double-
glazing-window
Energinet.dk. (u.d.). The History of natural gas. Hentede 20. October 2010 fra Energinet.dk:
http://energinet.dk/EN/GAS/Danish-gas-market/Sider/The-history-of-natural-gas.aspx
Energy Saving Trust. (2005). Northern Ireland: assessing U-values of existing housing. Energy Saving Trust.
ENERGYINTERACTIVE.NET. (u.d.). COMPOSE. Hentede 5. June 2011 fra ENERGYINTERACTIVE.NET:
http://energyinteractive.net/COMPOSE.ashx
ETA Heiztechnik GmbH. (u.d.). Wood chip boiler ETA HACK 20 to 200 kW. Hentede 20. April 2011 fra ETA
Heiztechnik GmbH,: http://www.eta.co.at/15.0.html?&L=1

Integration of Energy Demand Reduction and Sustainable Heating Installations in Individual Danish Buildings 42
Bibliography
european heat pump association. (u.d.). Denmark sets strong incentive for heat pump take-up. Hentede 23.
May 2011 fra european heat pump association: http://www.ehpa.org/news/article/denmark-incentivises-
heat-pump-take-up/
Global Solar Thermal Energy Council. (u.d.). Large-Scale Solar District Heating in Denmark. Hentede 22. May
2011 fra Global Solar Thermal Energy Council: http://www.solarthermalworld.org/node/766
Green Energy Efficient Homes. (u.d.). The most efficient home heating choices. Hentede 16. May 2011 fra
Green Energy Efficient Homes: http://www.green-energy-efficient-homes.com/most-efficient-home-
heating.html
green system uk. (u.d.). Questions & Answers on Biomass Heating. Hentede 9. May 2011 fra green system
uk,: http://www.greensystemsuk.com/solar_questions_w.php
guardian.co.uk. (u.d.). Energy efficiency. Hentede 15. May 2011 fra guardian.co.uk:
http://www.guardian.co.uk/environment/2009/jul/16/energy-efficiency
House-Energy. (u.d.). Heat pumps prices. Hentede 15. May 2011 fra House-Energy: http://www.house-
energy.com/Heat-Pumps/Heat-Pumps-Prices.htm
International Energy Agency. (2008). Promoting energy efficiency investments. Case studies in the
residential sector. Paris: OECG/IEA and AFD.
Irish Energy Center. (u.d.). Hentede 5. April 2011 fra Irish Energy Center:
http://casestudies.pepesec.eu/archives/169
ISOVER. Higher quality of life – lower heating costs. France: ISOVER.
Joelsson, A. G. (2007). Perspectives on implementing energy efficiency in existing Swedish detached
houses. Elsevier , 12.
MasterTherm. (u.d.). How does a heat pump work? Hentede 10. May 2011 fra MasterTherm:
http://www.mastertherm.co.uk/heat-pumps-residential-use/how-does-heat-pump-work
Mayer, P. W. (1999). Residential end uses of water,. USA: WWWA Research Foundation.
Möller, B., & Lund, H. (2010). Conversion of individual natural gas to district heating : Geographical studies
of supply costs and consequences for the Danish energy system. Applied Energy , 12.
NAIMA, N. A. (u.d.). Residential Home Insulation. Hentede 4. April 2011 fra NAIMA North American
Insulation Manufacturers Association: http://www.naima.org/insulation-knowledge-base/residential-
home-insulation.html
NIBE Energy System Limited. (2009). A new generation of heat pumps: NIBE Ground source. Chesterfield.
NIBE Energy Systems. (u.d.). NIBE Heat Pump Homeowner Section. Hentede 18. April 2011 fra NIBE :
http://www.nibe.co.uk/
Nordic Energy Solutions. (u.d.). Danish climate and energy policy,. Hentede 28. May 2011 fra Nordic Energy
Solutions: http://www.nordicenergysolutions.org/performance-policy/denmark/danish-climate-energy-
policy
Integration of Energy Demand Reduction and Sustainable Heating Installations in Individual Danish Buildings 43
Bibliography
Official Journal of the European Union. (2010). DIRECTIVE 2010/31/EU OF THE EUROPEAN PARLIAMENT
AND OF THE COUNCIL. Official Journal of the European Union , 23.
SANYO. (u.d.). SANYO CO2 ECO Heating System. Hentede 18. April 2011 fra SANYO:
http://uk.sanyo.com/aircon/products/CO2-ECO-Heating-System/45kW-Single-and-Three-Phase/
StatBank Denmark. (u.d.). Statistics Denmark. Hentede 27. April 2011 fra
http://statistikbanken.dk/statbank5a/default.asp?w=1280
The Danish Energy Saving Trust. (u.d.). Electric heating. Hentede 23. May 2011 fra The Danish Energy Saving
Trust: http://www.savingtrust.dk/consumer/products/indoor-climate/electrical-heating
The Danish Government. (2011). Energy Strategy 2050 - from coal, oil and gas to green energy.
Copenhagen K: The Danish Ministry of Climate and Energy.
The Danish Ministry of Economic and Business Affairs. (2010). Building Regulations. Copenhagen: The
Danish Ministry of Economic and Business Affairs,.
The Danish Society of Engineers - IDA. (2009). IDA Climate Plan 2050. Copenhagen: IDA.
The Official Website of Denmark. (u.d.). Environment, Energy & Climate News. Hentede 22. May 2011 fra
The Official Website of Denmark: http://www.denmark.dk/en/servicemenu/news/environment-energy-
climate-news/heatpumpsgetawarmwelcomeindenmark.htm
The Yellow House. (u.d.). Insulation. Hentede 15. May 2011 fra The Yellow House:
http://theyellowhouse.org.uk/themes/insula.html
thinkinsulation.com. (u.d.). Insulation. Hentede 15. May 2011 fra thinkinsulation.com - it's time to save
energy: http://www.thinkinsulation.co.uk/where-can-it-be-used.htm
Tommerup, H. S. (2005). Energy savings in Danish residential building stock. Energy and Buildings , 9.
Usewoodfuel Scotland. (u.d.). Wood Chips. Hentede 30. April 2011 fra Usewoodfuel Scotland,:
http://www.usewoodfuel.co.uk/using-woodfuel/types-of-woodfuel/wood-chips.aspx
Utrick, J. B. (2009). Energy and Buildings: Efficiency, Air Quality and Conservatio. New York: Nova Science
Publishers.
Videncenter for energibesparelser i bygninger. (u.d.). Nu kommer der skattefradrag på energirigtig
renovering. Hentede 7. June 2011 fra Videncenter for energibesparelser i bygninger,:
http://www.byggeriogenergi.dk/30653
Integration of Energy Demand Reduction and Sustainable Heating Installations in Individual Danish Buildings 44
Annexe A
Annexe A Hourly profile of domestic hot water consumption
This hourly profile was developed and used as case study in previous report.
Assumptions
Both parents have a stable job and both children are part of an obligatory schooling. Parents’ working
hours begins at 8:30 AM and ends at 4:30 PM all weekdays. The youngest child has 10 years old and the
older 12 and both attends the secondary school lectures which programs normally starts at 8:00 AM and
ends at around 2:00 or 3:00 PM. The distance between home and work or school is less than 10 km and
therefore an early departure is not needed.
The house is equipped with a clothes washer and a dishwasher which use cold tap water at the start stage.
Beside them, the most common cold and hot water-consuming activities for a family are the bath, the
faucet, the shower, toilet and sometimes the uncontrolled leak.
In the analysis the clothes washer, the dishwasher and the toilet are only cold water-consuming and hence
they are not discussed further.
In terms of bath and shower, the parents tend to take a shower every morning between 6:00 and 8:00 AM
while the kids are used to bathe in the evening, before bedtime between 8:00 and 10:00 PM. During
weekdays, until 7:30 AM the breakfast must be prepared and after 6:00 PM the dinner while during the
weekend days, beside breakfast and dinner the lunch it’s included too. The hour shower, the dinner
preparation and the bath starts with an hour later, while the lunch is prepared between 1:00 and 3:00 PM.
Based on the previous assumptions, around 7 hours per day, from Monday till Friday, all family members
are out and therefore the faucet is used only half of it per day per capita compared to weekend days, when
the family spends most of its time home. The distribution of faucet consumption in terms of preparing
breakfast, lunch and dinner for one week is presented later on. An additional consumption, such as
washing hands between meals is assumed to be around 1 liter of hot water every remaining hour when the
members are home.
During a week time some unpredictable activities may occur, such as sport (running or playing football or
tennis) which requires a shower after or some friends coming over dinner and therefore a margin of 5% is
added to the total daily hot water consumption. The unpredictable consumption is not taken into account
in the daily profile.
According to DeOreo article, the daily hot water consumption per capita for the main activities are as
presented in the below pie chart. These data are quite useful in terms of drawing the family daily profile.
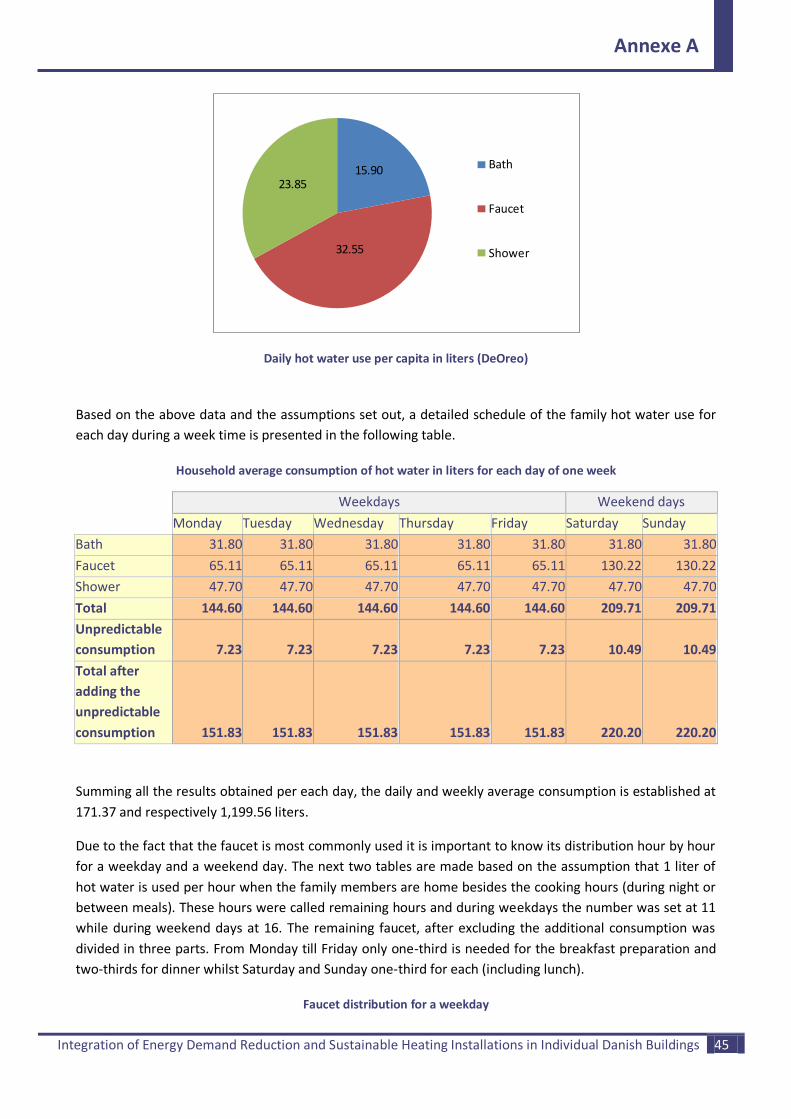
Integration of Energy Demand Reduction and Sustainable Heating Installations in Individual Danish Buildings 45
Annexe A
Daily hot water use per capita in liters (DeOreo)
Based on the above data and the assumptions set out, a detailed schedule of the family hot water use for
each day during a week time is presented in the following table.
Household average consumption of hot water in liters for each day of one week
Weekdays Weekend days
Monday Tuesday Wednesday Thursday Friday Saturday Sunday
Bath 31.80 31.80 31.80 31.80 31.80 31.80 31.80
Faucet 65.11 65.11 65.11 65.11 65.11 130.22 130.22
Shower 47.70 47.70 47.70 47.70 47.70 47.70 47.70
Total 144.60 144.60 144.60 144.60 144.60 209.71 209.71
Unpredictable
consumption 7.23 7.23 7.23 7.23 7.23 10.49 10.49
Total after
adding the
unpredictable
consumption 151.83 151.83 151.83 151.83 151.83 220.20 220.20
Summing all the results obtained per each day, the daily and weekly average consumption is established at
171.37 and respectively 1,199.56 liters.
Due to the fact that the faucet is most commonly used it is important to know its distribution hour by hour
for a weekday and a weekend day. The next two tables are made based on the assumption that 1 liter of
hot water is used per hour when the family members are home besides the cooking hours (during night or
between meals). These hours were called remaining hours and during weekdays the number was set at 11
while during weekend days at 16. The remaining faucet, after excluding the additional consumption was
divided in three parts. From Monday till Friday only one-third is needed for the breakfast preparation and
two-thirds for dinner whilst Saturday and Sunday one-third for each (including lunch).
Faucet distribution for a weekday
Bath
Faucet
Shower
15.9023.85
32.55
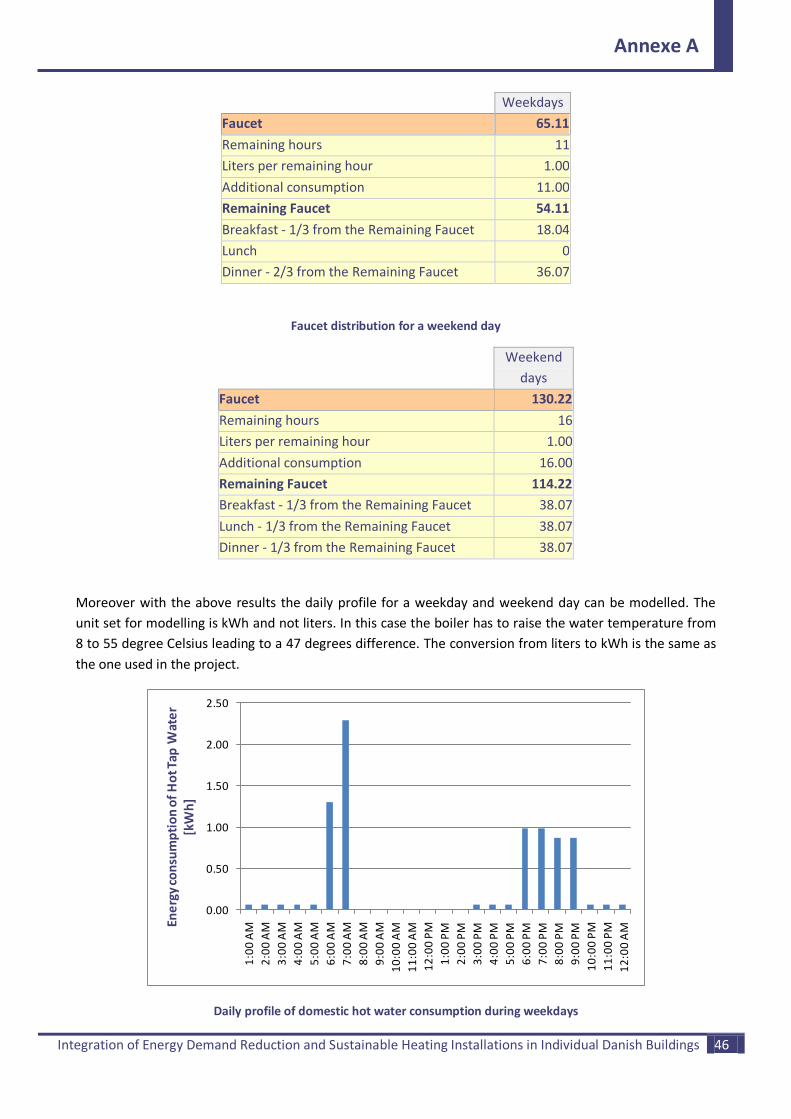
Integration of Energy Demand Reduction and Sustainable Heating Installations in Individual Danish Buildings 46
Annexe A
Weekdays
Faucet 65.11
Remaining hours 11
Liters per remaining hour 1.00
Additional consumption 11.00
Remaining Faucet 54.11
Breakfast - 1/3 from the Remaining Faucet 18.04
Lunch 0
Dinner - 2/3 from the Remaining Faucet 36.07
Faucet distribution for a weekend day
Weekend
days
Faucet 130.22
Remaining hours 16
Liters per remaining hour 1.00
Additional consumption 16.00
Remaining Faucet 114.22
Breakfast - 1/3 from the Remaining Faucet 38.07
Lunch - 1/3 from the Remaining Faucet 38.07
Dinner - 1/3 from the Remaining Faucet 38.07
Moreover with the above results the daily profile for a weekday and weekend day can be modelled. The
unit set for modelling is kWh and not liters. In this case the boiler has to raise the water temperature from
8 to 55 degree Celsius leading to a 47 degrees difference. The conversion from liters to kWh is the same as
the one used in the project.
Daily profile of domestic hot water consumption during weekdays
0.00
0.50
1.00
1.50
2.00
2.50
1:0
0 A
M
2:0
0 A
M
3:0
0 A
M
4:0
0 A
M
5:0
0 A
M
6:0
0 A
M
7:0
0 A
M
8:0
0 A
M
9:0
0 A
M
10
:00
AM
11
:00
AM
12
:00
PM
1:0
0 P
M
2:0
0 P
M
3:0
0 P
M
4:0
0 P
M
5:0
0 P
M
6:0
0 P
M
7:0
0 P
M
8:0
0 P
M
9:0
0 P
M
10
:00
PM
11
:00
PM
12
:00
AMEn
erg
y co
nsu
mp
tio
n o
f H
ot T
ap W
ate
r [k
Wh
]
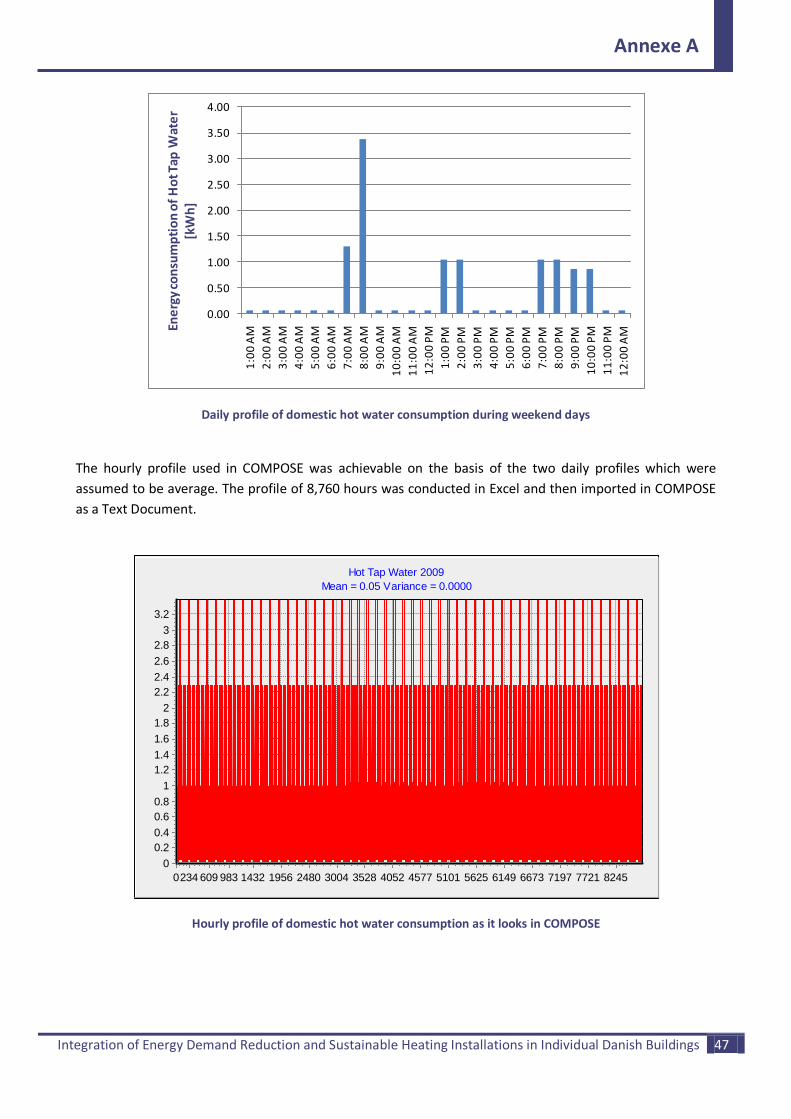
Integration of Energy Demand Reduction and Sustainable Heating Installations in Individual Danish Buildings 47
Annexe A
Daily profile of domestic hot water consumption during weekend days
The hourly profile used in COMPOSE was achievable on the basis of the two daily profiles which were
assumed to be average. The profile of 8,760 hours was conducted in Excel and then imported in COMPOSE
as a Text Document.
Hourly profile of domestic hot water consumption as it looks in COMPOSE
0.00
0.50
1.00
1.50
2.00
2.50
3.00
3.50
4.00
1:0
0 A
M
2:0
0 A
M
3:0
0 A
M
4:0
0 A
M
5:0
0 A
M
6:0
0 A
M
7:0
0 A
M
8:0
0 A
M
9:0
0 A
M
10
:00
AM
11
:00
AM
12
:00
PM
1:0
0 P
M
2:0
0 P
M
3:0
0 P
M
4:0
0 P
M
5:0
0 P
M
6:0
0 P
M
7:0
0 P
M
8:0
0 P
M
9:0
0 P
M
10
:00
PM
11
:00
PM
12
:00
AMEn
erg
y co
nsu
mp
tio
n o
f H
ot T
ap W
ate
r [k
Wh
]
Hot Tap Water 2009
Mean = 0.05 Variance = 0.0000
0234 609 983 1432 1956 2480 3004 3528 4052 4577 5101 5625 6149 6673 7197 7721 8245
3.2
3
2.8
2.6
2.4
2.2
2
1.8
1.6
1.4
1.2
1
0.8
0.6
0.4
0.2
0
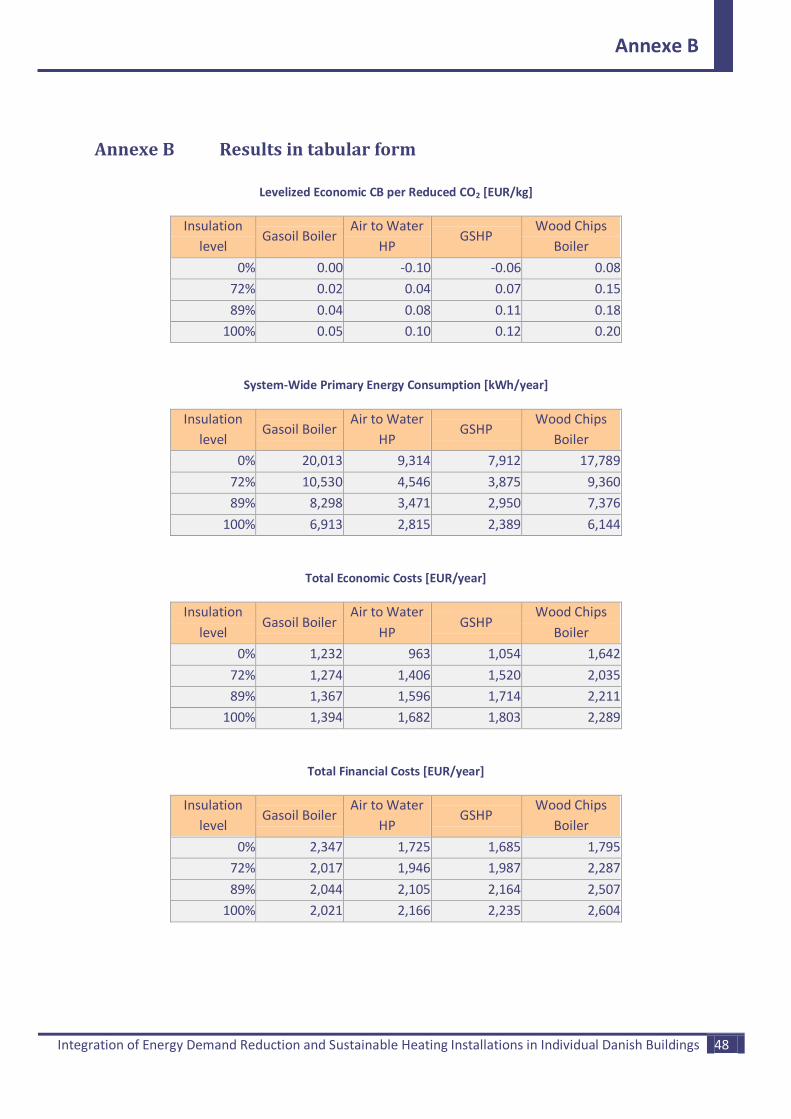
Integration of Energy Demand Reduction and Sustainable Heating Installations in Individual Danish Buildings 48
Annexe B
Annexe B Results in tabular form
Levelized Economic CB per Reduced CO2 [EUR/kg]
Insulation
level Gasoil Boiler
Air to Water
HP GSHP
Wood Chips
Boiler
0% 0.00 -0.10 -0.06 0.08
72% 0.02 0.04 0.07 0.15
89% 0.04 0.08 0.11 0.18
100% 0.05 0.10 0.12 0.20
System-Wide Primary Energy Consumption [kWh/year]
Insulation
level Gasoil Boiler
Air to Water
HP GSHP
Wood Chips
Boiler
0% 20,013 9,314 7,912 17,789
72% 10,530 4,546 3,875 9,360
89% 8,298 3,471 2,950 7,376
100% 6,913 2,815 2,389 6,144
Total Economic Costs [EUR/year]
Insulation
level Gasoil Boiler
Air to Water
HP GSHP
Wood Chips
Boiler
0% 1,232 963 1,054 1,642
72% 1,274 1,406 1,520 2,035
89% 1,367 1,596 1,714 2,211
100% 1,394 1,682 1,803 2,289
Total Financial Costs [EUR/year]
Insulation
level Gasoil Boiler
Air to Water
HP GSHP
Wood Chips
Boiler
0% 2,347 1,725 1,685 1,795
72% 2,017 1,946 1,987 2,287
89% 2,044 2,105 2,164 2,507
100% 2,021 2,166 2,235 2,604

Integration of Energy Demand Reduction and Sustainable Heating Installations in Individual Danish Buildings 49
Annexe B
The sensitivity of Net Economic Costs due to increasing oil price
Gasoil
Boiler
Insulation
level Reference
Δ Oil price
= 10%
Δ Oil price
= 23.5%
Δ Oil price
= 30%
Δ Oil price
= 50%
Δ Oil price
= 100%
1,231.77 0% 0 0 0 0 0 0
1,273.96 72% 42.19 -7.58 -74.66 -106.99 -206.39 -454.98
1,367.36 89% 135.59 74.11 -8.76 -48.70 -171.51 -478.62
1,393.79 100% 162.02 93.27 0.60 -44.06 -181.39 -524.80
The sensitivity of Net Financial Costs due to decreasing oil price
Gasoil
Boiler
Insulation
level Reference
Δ Oil price
= 10%
Δ Oil price
= 38%
Δ Oil price
= 50%
Δ Oil price
= 60%
Δ Oil price
= 90%
2,346.73 0% 0 0 0 0 0 0
2,017.07 72% -329.65 -267.44 -93.54 -18.93 43.28 229.59
2,043.81 89% -302.92 -226.07 -11.22 80.96 157.82 387.99
2,020.99 100% -325.73 -239.79 0.45 103.53 189.47 446.86
The sensitivity of Net Economic Costs due to decreasing insulation cost
Gasoil
Boiler
Insulation
level Reference
Δ Inv. cost
= 10%
Δ Inv. cost
= 18%
Δ Inv. cost
= 40%
Δ Inv. cost
= 60%
Δ Inv. cost
= 90%
1,231.77 0% 0 0 0 0 0 0
1,273.96 72% 42.19 -15.31 -61.30 -187.82 -302.76 -475.26
1,367.36 89% 135.59 56.23 -7.30 -181.94 -340.67 -578.83
1,393.79 100% 162.02 72.24 0.35 -197.18 -376.81 -646.23
The sensitivity of Net Financial Costs due to increasing insulation cost
Gasoil
Boiler
Insulation
level Reference
Δ Inv. cost
= 10%
Δ Inv. cost
= 29%
Δ Inv. cost
= 40%
Δ Inv. cost
= 60%
Δ Inv. cost
= 100%
2,346.73 0% 0 0 0 0 0 0
2,017.07 72% -329.65 -257.77 -121.22 -42.14 101.53 389.04
2,043.81 89% -302.92 -203.71 -15.15 93.99 292.41 689.32
2,020.99 100% -325.73 -213.51 -0.19 123.27 347.81 796.81