Embed Size (px)
Citation preview
Interconnector between Iceland and GB, cost benefit analysis and impact assessmentCost-benefit Analysis Presentation
London, February 8th 2016
Contents
1. Introduction and background 2. Methodology3. Interconnector business models4. Market scenarios5. Key market projection results6. Cost-benefit analysis7. Iceland impact analysis
DisclaimerThis presentation and the information contained therein is furnished and has been prepared by Kvika banki hf and Pöyry. for information purposes only and is strictly confidential. It is furnished for the viewer´s private information with the express understanding, which the viewer acknowledges, that it is not an offer, a recommendation or solicitation to buy, hold or sell, or a means by which any security may be offered or sold. The presentation is furnished and intended for European market participants and shall be viewed in that manner.
The opinions and projections presented herein are based on general information gathered at the time of writing. Opinions and projections are subject to change without notice. Kvika and Pöyryrely on information obtained from sources believed to be reliable but does not guarantee its accuracy or completeness. Kvika and Pöyryare not obliged to make amendments or changes to this publication should errors be discovered or opinions or information change.
Neither Kvika, Pöyry nor any officer or employee thereof accepts any liability whatsoever for any direct or consequential loss arising from any use of this publication or its contents. Copyright of this presentation is owned by Kvika and Pöyry. No part of this presentation may be reproduced in any manner without the prior written permission of Kvika.and Pöyry
1. Introduction and backgroundPresentation for UK-ICE Task Energy Task Force
London, February 8th 2016
Kvika and Pöyry
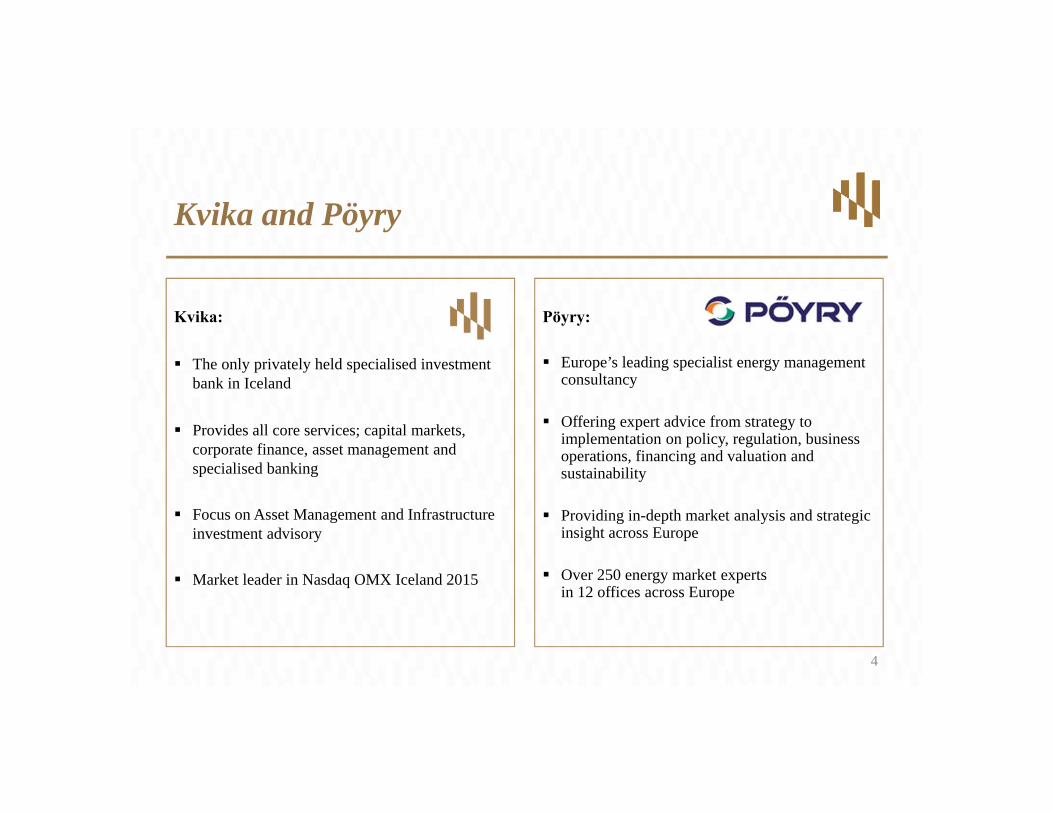
Kvika:
The only privately held specialised investment bank in Iceland
Provides all core services; capital markets, corporate finance, asset management and specialised banking
Focus on Asset Management and Infrastructure investment advisory
Market leader in Nasdaq OMX Iceland 2015
Pöyry:
Europe’s leading specialist energy management consultancy
Offering expert advice from strategy to implementation on policy, regulation, business operations, financing and valuation and sustainability
Providing in-depth market analysis and strategic insight across Europe
Over 250 energy market experts in 12 offices across Europe
4
The project team
Kvika:
Steering committee: Dr. Sigurður Hannesson, Managing Director
Kvika Asset Management. D. Phil in mathematics from University of Oxford
Sigurður Atli Jónsson, CEO of Kvika Magnús Bjarnason, MD International Banking
Kvika. Background in renewable energy, investment banking and governmental services
Project Manager: Rósant Torfason, Corporate finance Kvika.
Pöyry:
Steering committe: Dr. Gareth Davies, director at Pöyry. Over 17
years of experience in energy policy anlaysisand energy market economics. PhD in Economics.
Michael Martin, principal consultant at Pöyry. Has a vast experience in the modelling of both hydro and thermal markets.
Project Manager: Micheal Martin. [email protected]
5

Scope of the workCost benefit analysis and impact assessment for Iceland
Cost Benefit Analysis for Iceland:‐ Projection on wholesale prices in Iceland with and without an Interconnector‐ Producer and consumer surplus in Iceland‐ Cost of the Interconnector, losses and cable failures‐ Business Models / Evaluate optimal Business Model for Iceland‐ Support mechanism; CfD‘s, Capacity Mechanism, other guarantees.‐ Demand and supply projection
Impact assessment on Iceland:‐ Households‐ Power Intensive industries, other industries and services‐ Energy sector and transmission system‐ Security of supply
Other items:‐ Analyze potential options to mitigate higher electricity prices in Iceland‐ Experience from other countries i.e. Norway‐ Environmental issues
6
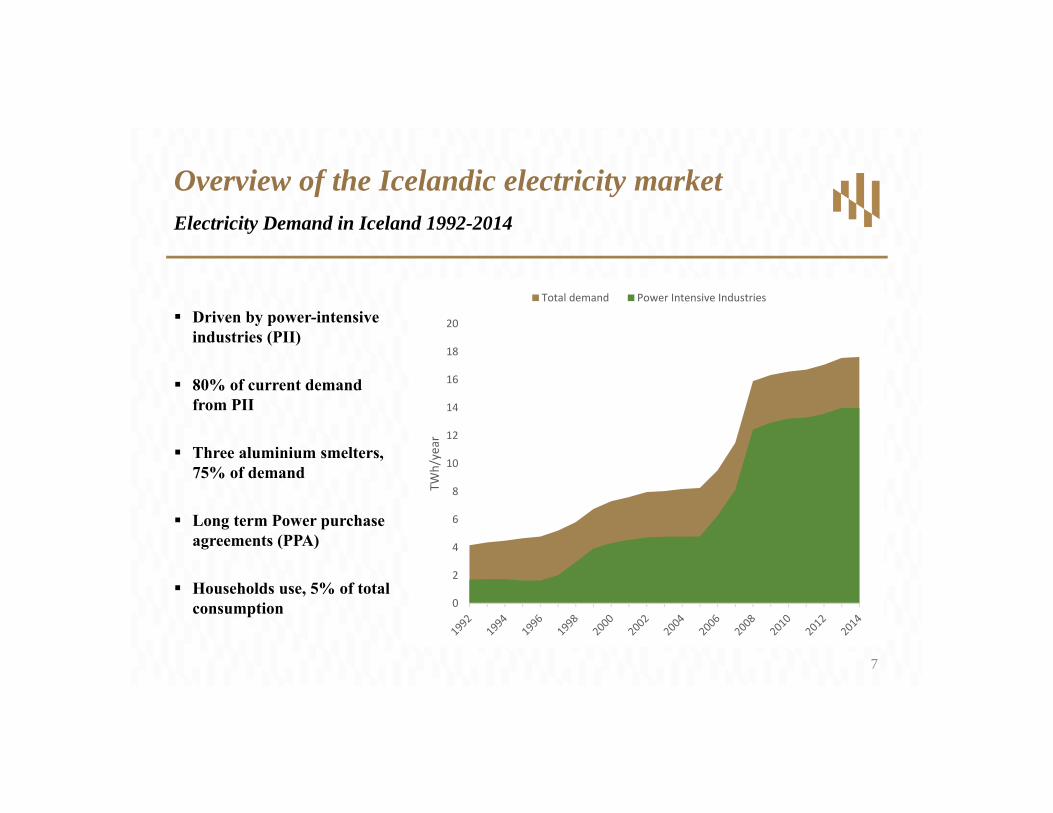
Driven by power-intensive industries (PII)
80% of current demand from PII
Three aluminium smelters, 75% of demand
Long term Power purchase agreements (PPA)
Households use, 5% of total consumption 0
2
4
6
8
10
12
14
16
18
20
TWh/year
Total demand Power Intensive Industries
Overview of the Icelandic electricity marketElectricity Demand in Iceland 1992-2014
7
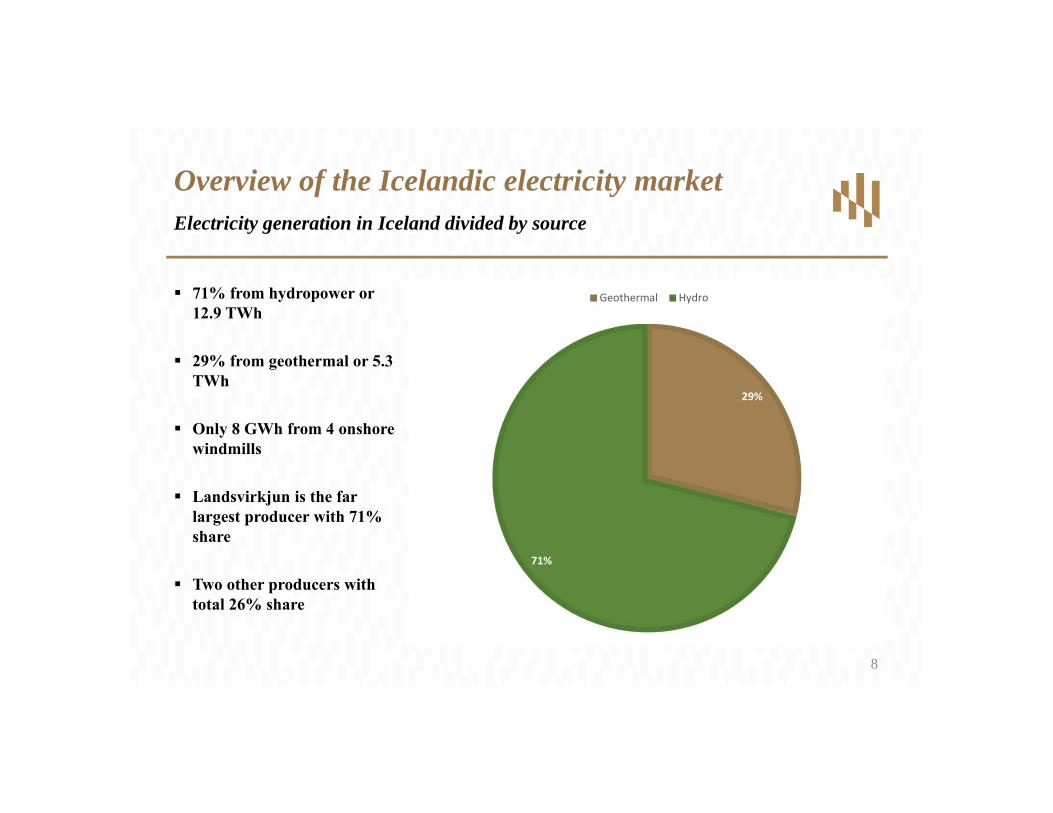
71% from hydropower or 12.9 TWh
29% from geothermal or 5.3 TWh
Only 8 GWh from 4 onshore windmills
Landsvirkjun is the far largest producer with 71% share
Two other producers with total 26% share
Overview of the Icelandic electricity marketElectricity generation in Iceland divided by source
29%
71%
Geothermal Hydro
8
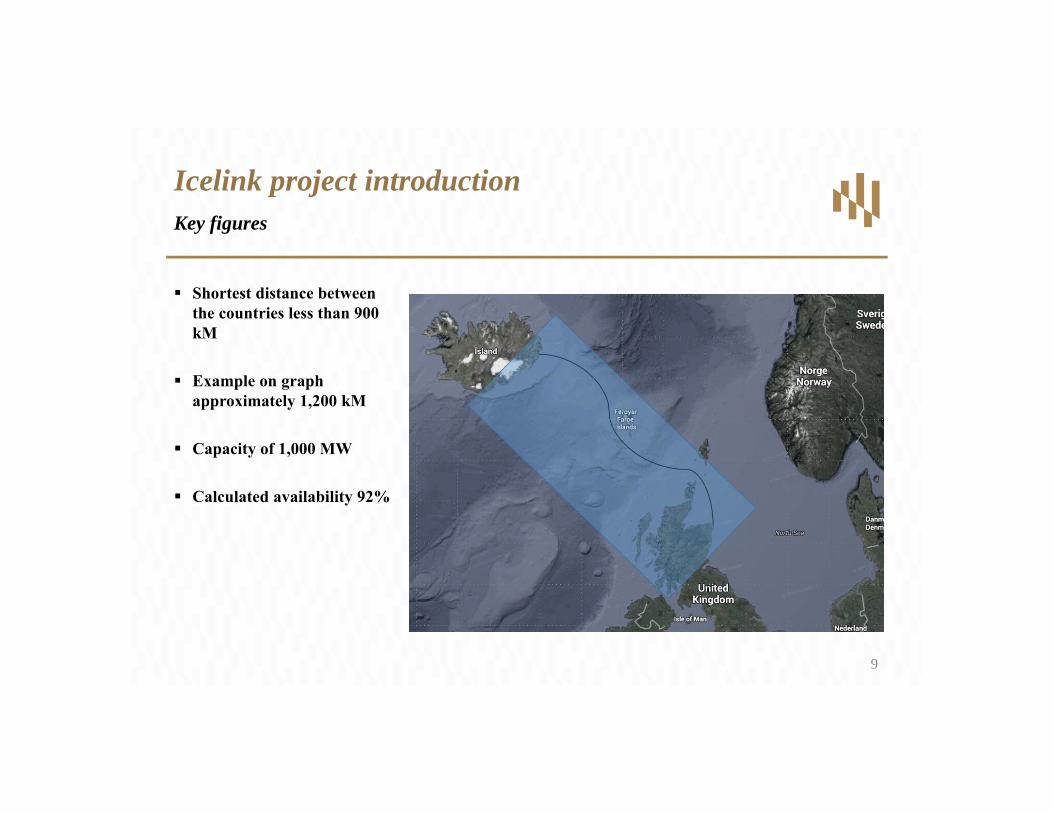
Shortest distance between the countries less than 900 kM
Example on graph approximately 1,200 kM
Capacity of 1,000 MW
Calculated availability 92%
Icelink project introductionKey figures
9
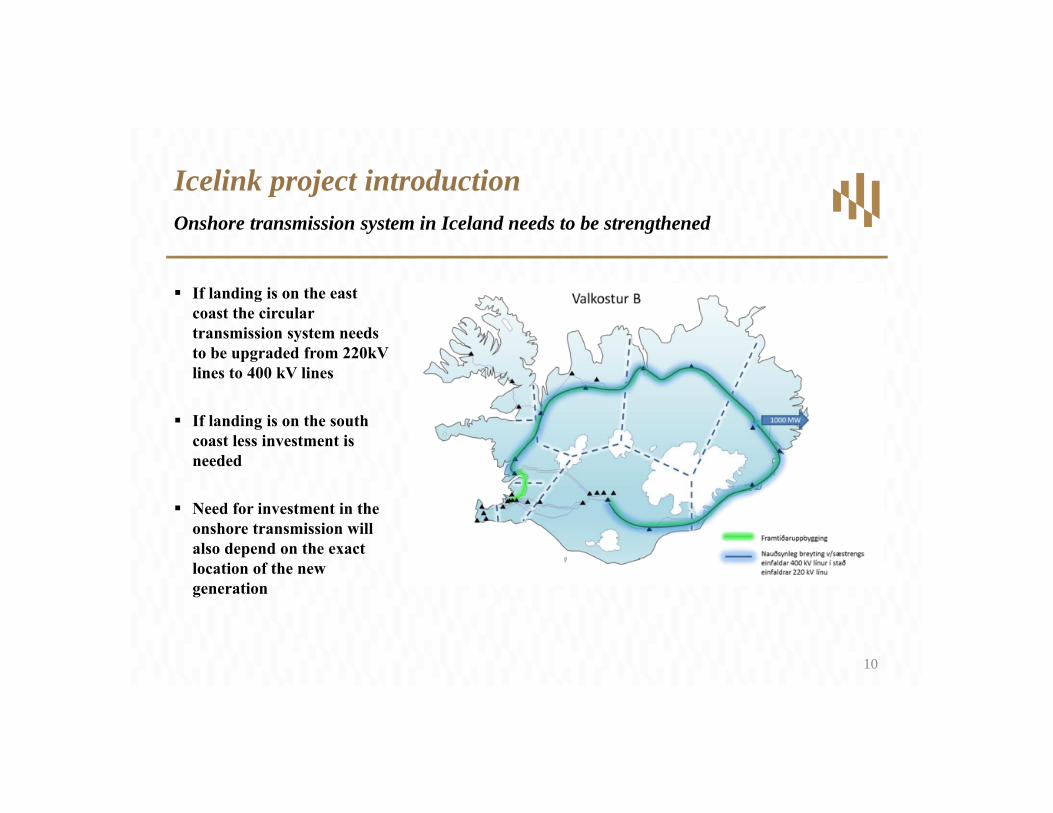
If landing is on the east coast the circular transmission system needs to be upgraded from 220kV lines to 400 kV lines
If landing is on the south coast less investment is needed
Need for investment in the onshore transmission will also depend on the exact location of the new generation
Icelink project introductionOnshore transmission system in Iceland needs to be strengthened
10
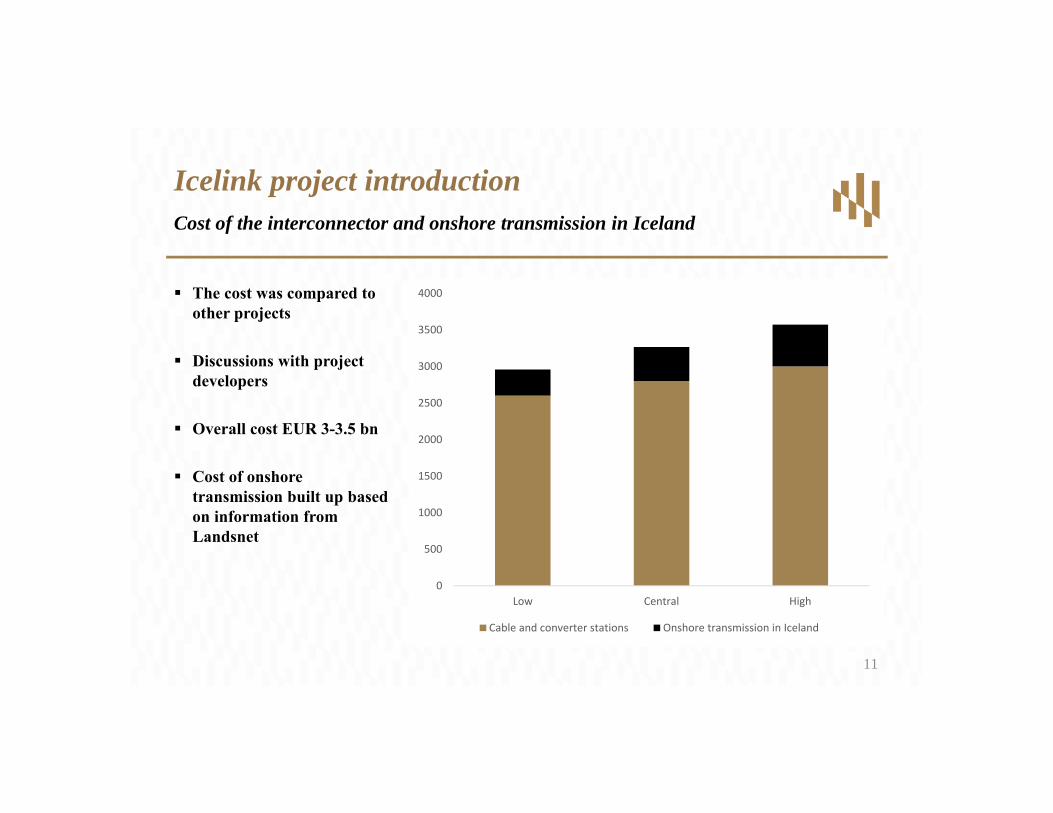
The cost was compared to other projects
Discussions with project developers
Overall cost EUR 3-3.5 bn
Cost of onshore transmission built up based on information from Landsnet
Icelink project introductionCost of the interconnector and onshore transmission in Iceland
0
500
1000
1500
2000
2500
3000
3500
4000
Low Central High
Cable and converter stations Onshore transmission in Iceland
11
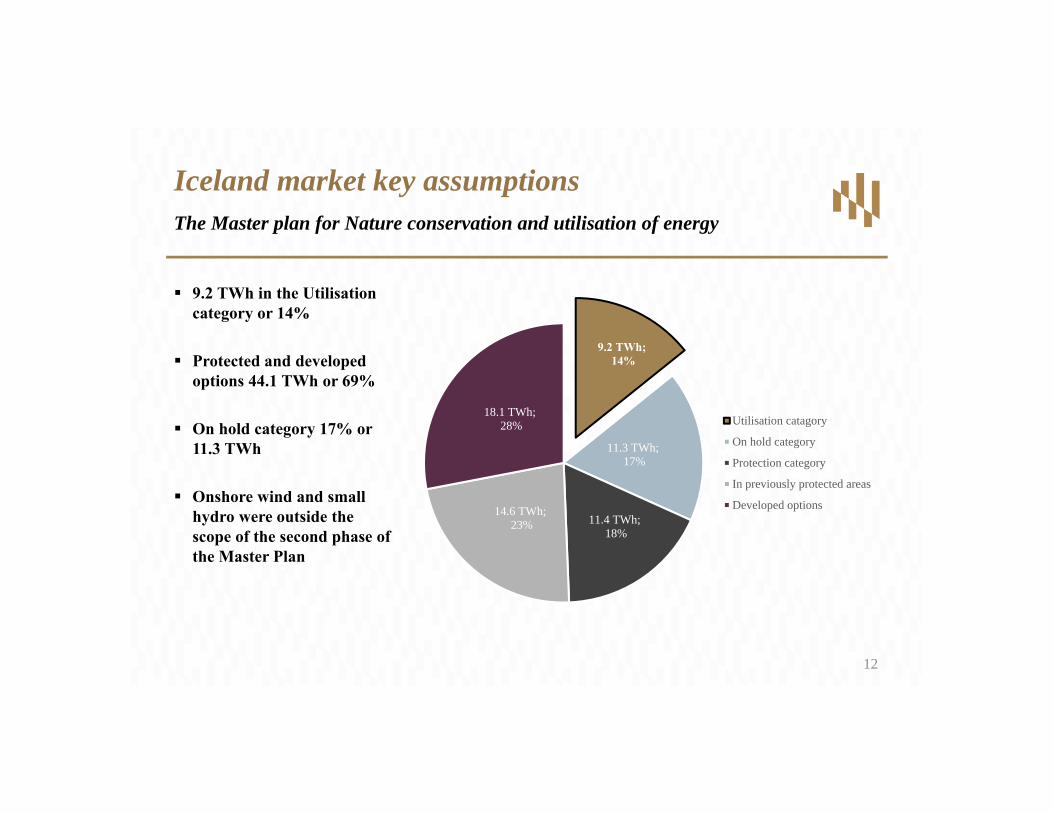
9.2 TWh in the Utilisation category or 14%
Protected and developed options 44.1 TWh or 69%
On hold category 17% or 11.3 TWh
Onshore wind and small hydro were outside the scope of the second phase of the Master Plan
Iceland market key assumptionsThe Master plan for Nature conservation and utilisation of energy
9.2 TWh;14%
11.3 TWh;17%
11.4 TWh;18%
14.6 TWh;23%
18.1 TWh;28% Utilisation catagory
On hold category
Protection category
In previously protected areas
Developed options
12
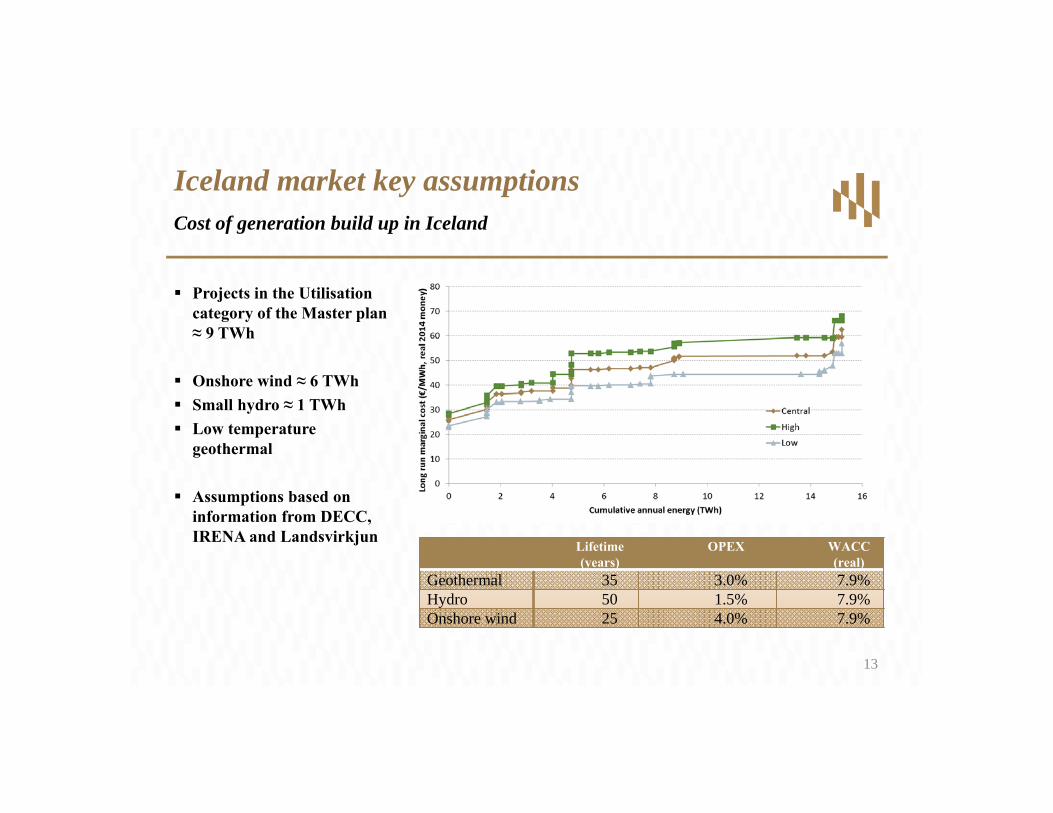
Projects in the Utilisation category of the Master plan ≈ 9 TWh
Onshore wind ≈ 6 TWh Small hydro ≈ 1 TWh Low temperature
geothermal
Assumptions based on information from DECC, IRENA and Landsvirkjun
Iceland market key assumptionsCost of generation build up in Iceland
Lifetime (years)
OPEX WACC (real)
Geothermal 35 3.0% 7.9%Hydro 50 1.5% 7.9%Onshore wind 25 4.0% 7.9%
13
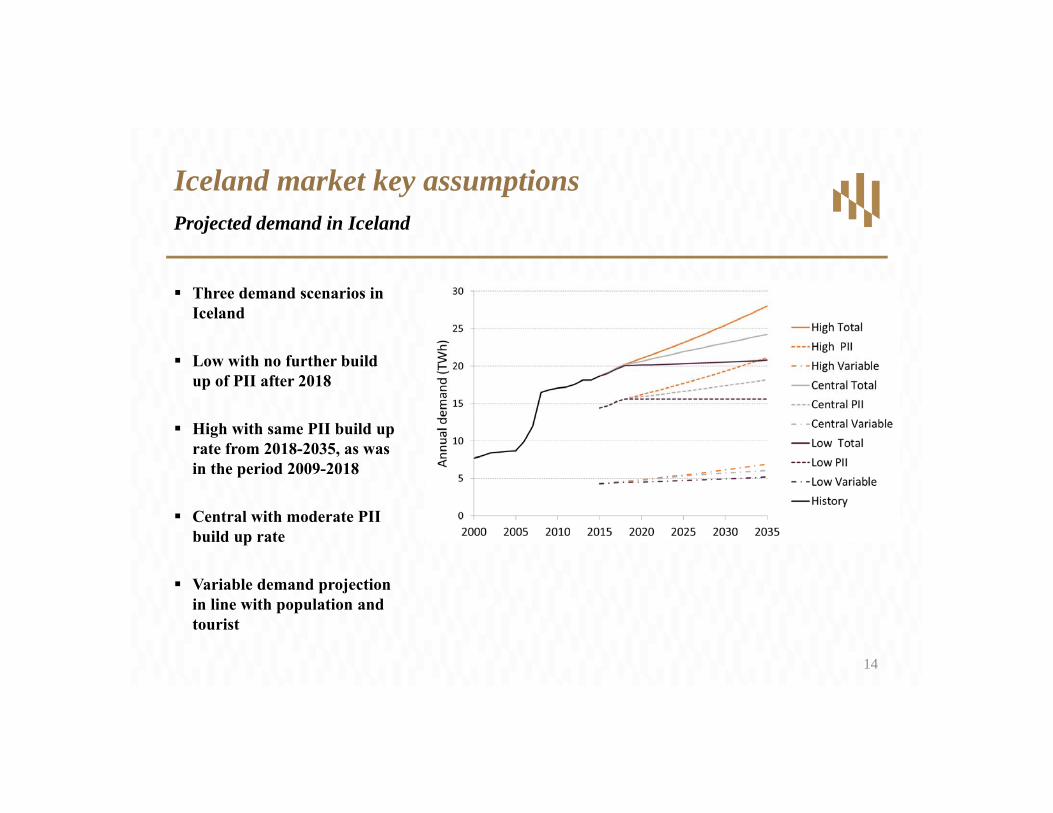
Three demand scenarios in Iceland
Low with no further build up of PII after 2018
High with same PII build up rate from 2018-2035, as was in the period 2009-2018
Central with moderate PII build up rate
Variable demand projection in line with population and tourist
Iceland market key assumptionsProjected demand in Iceland
14
2. MethodologyPresentation for UK-ICE Task Energy Task Force
London, February 8th 2016
COPYRIGHT©PÖYRY
PRINCIPLES OF THE ANALYSIS
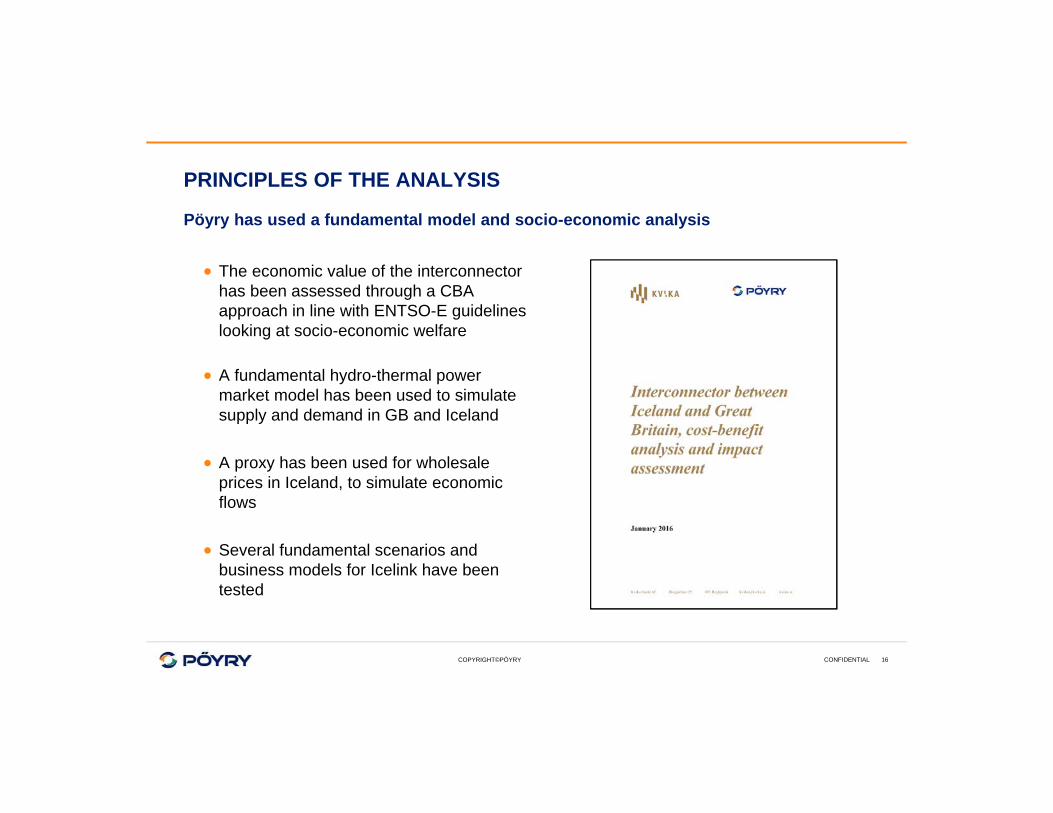
Pöyry has used a fundamental model and socio-economic analysis
The economic value of the interconnector has been assessed through a CBA approach in line with ENTSO-E guidelines looking at socio-economic welfare
A fundamental hydro-thermal power market model has been used to simulate supply and demand in GB and Iceland
A proxy has been used for wholesale prices in Iceland, to simulate economic flows
Several fundamental scenarios and business models for Icelink have been tested
CONFIDENTIAL 16
COPYRIGHT©PÖYRY
THE COST BENEFIT ANALYSIS
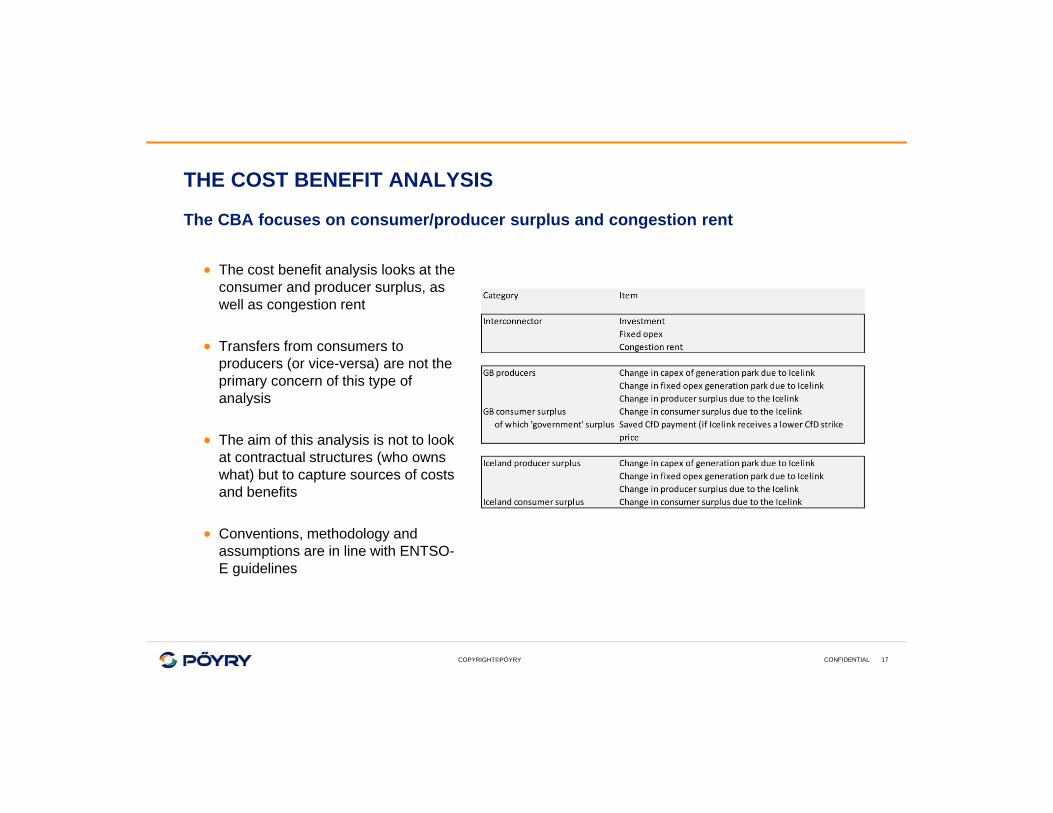
The CBA focuses on consumer/producer surplus and congestion rent
The cost benefit analysis looks at the consumer and producer surplus, as well as congestion rent
Transfers from consumers to producers (or vice-versa) are not the primary concern of this type of analysis
The aim of this analysis is not to look at contractual structures (who owns what) but to capture sources of costs and benefits
Conventions, methodology and assumptions are in line with ENTSO-E guidelines
CONFIDENTIAL 17
COPYRIGHT©PÖYRY
BID3 – PÖYRY’S ELECTRICITY MARKET MODEL
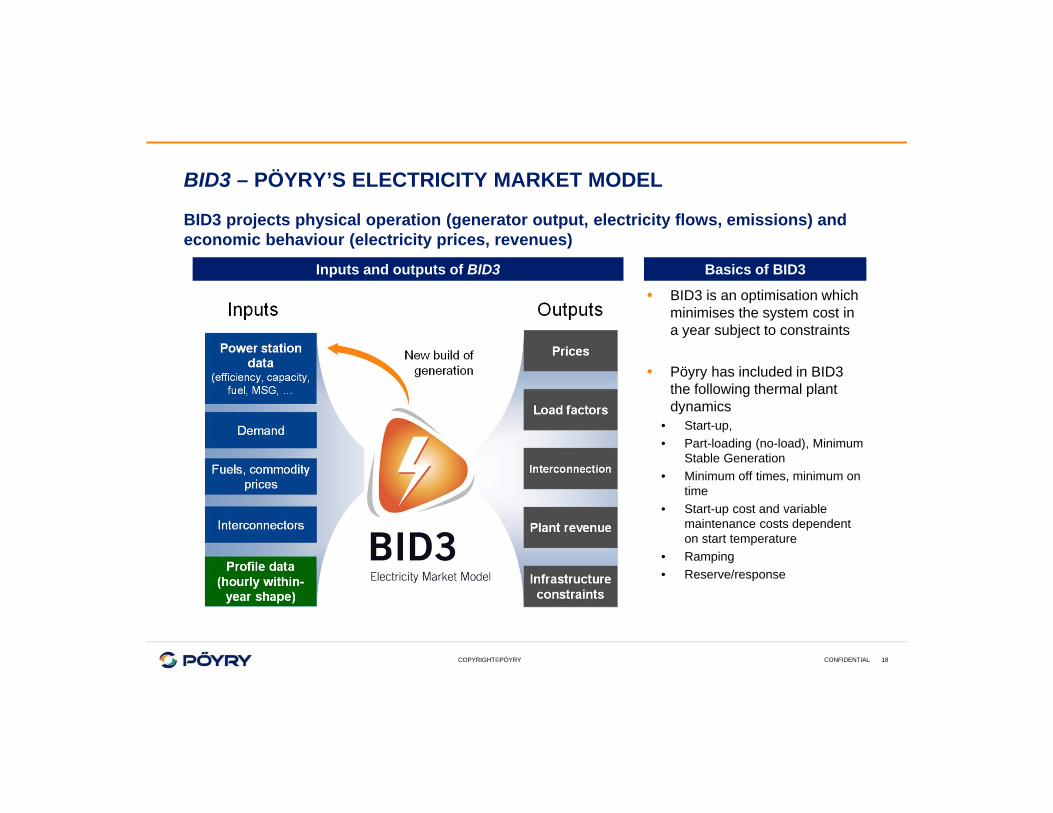
BID3 projects physical operation (generator output, electricity flows, emissions) and economic behaviour (electricity prices, revenues)
• BID3 is an optimisation which minimises the system cost in a year subject to constraints
• Pöyry has included in BID3 the following thermal plant dynamics
• Start-up,• Part-loading (no-load), Minimum
Stable Generation• Minimum off times, minimum on
time• Start-up cost and variable
maintenance costs dependent on start temperature
• Ramping• Reserve/response
Basics of BID3Inputs and outputs of BID3
CONFIDENTIAL 18
COPYRIGHT©PÖYRY
THE PRICE OF POWER IN ICELAND
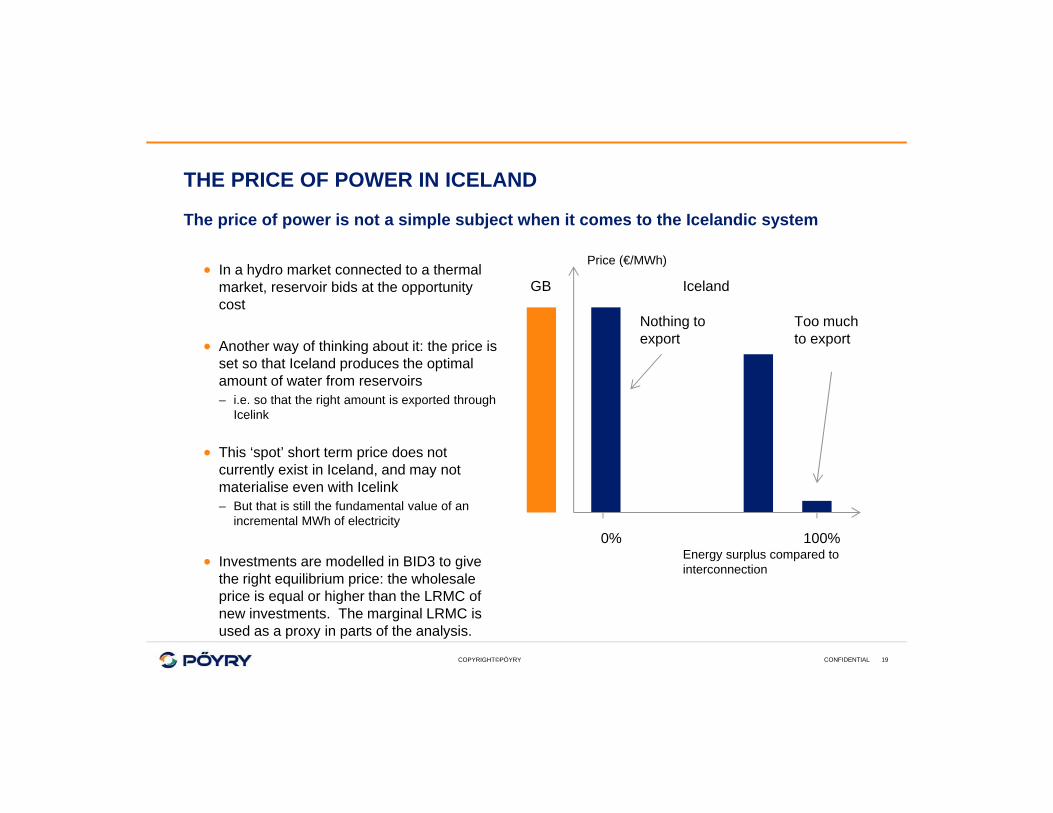
The price of power is not a simple subject when it comes to the Icelandic system
In a hydro market connected to a thermal market, reservoir bids at the opportunity cost
Another way of thinking about it: the price is set so that Iceland produces the optimal amount of water from reservoirs– i.e. so that the right amount is exported through
Icelink
This ‘spot’ short term price does not currently exist in Iceland, and may not materialise even with Icelink– But that is still the fundamental value of an
incremental MWh of electricity
Investments are modelled in BID3 to give the right equilibrium price: the wholesale price is equal or higher than the LRMC of new investments. The marginal LRMC is used as a proxy in parts of the analysis.
Energy surplus compared to interconnection
Price (€/MWh)
GB Iceland
0% 100%
Nothing to export
Too much to export
CONFIDENTIAL 19

3. Interconnector Business ModelsPresentation for UK-ICE Task Energy Task Force
London, February 8th 2016

COPYRIGHT©PÖYRY
CASH FLOW ROUTES FOR ICELINK
The benefits and viability of Icelink are heavily dependent on the project set-up
Icelink is not a ‘standard’ interconnector in the European context– No ‘spot price’ in Iceland, no Short Run Marginal
Cost– Icelink is in principle based on building renewable
generation to export to GB
Two revenue streams on the GB side have been analysed– The wholesale price (in the case of merchant
interconnector, with or without cap & floor) and capacity payment
– Wholesale price + Contract for Difference (CfD) remunerating carbon-free generation in GB
On the Icelandic side, two ways for an interconnector to pay for electricity have been analysed– Through a PPA with a generator– A ‘spot price’ – which at the moment doesn’t exist
‘Spot price’ PPA
Wholesaleprice + cap. payment
Contractfor Differences
Cash flow routes
CONFIDENTIAL 21
COPYRIGHT©PÖYRY
BUSINESS MODELS FOR ICELINK
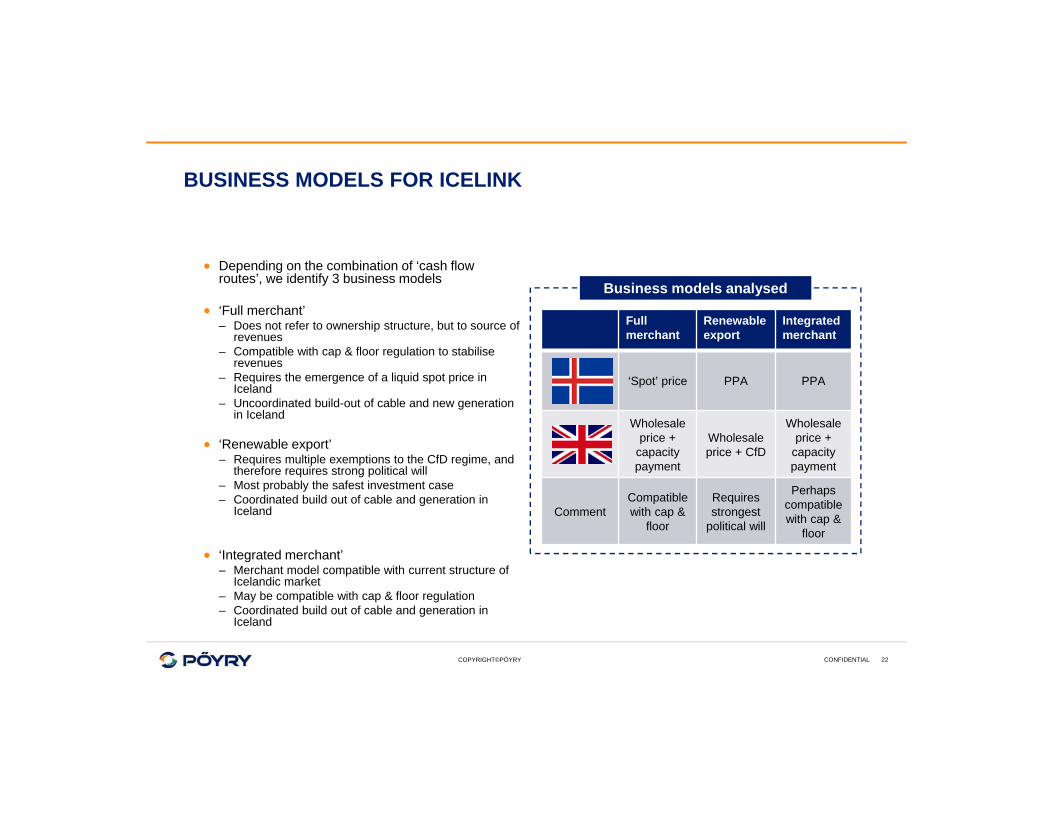
Depending on the combination of ‘cash flow routes’, we identify 3 business models
‘Full merchant’– Does not refer to ownership structure, but to source of
revenues– Compatible with cap & floor regulation to stabilise
revenues– Requires the emergence of a liquid spot price in
Iceland– Uncoordinated build-out of cable and new generation
in Iceland
‘Renewable export’– Requires multiple exemptions to the CfD regime, and
therefore requires strong political will– Most probably the safest investment case– Coordinated build out of cable and generation in
Iceland
‘Integrated merchant’– Merchant model compatible with current structure of
Icelandic market– May be compatible with cap & floor regulation– Coordinated build out of cable and generation in
Iceland
Full merchant
Renewableexport
Integrated merchant
‘Spot’ price PPA PPA
Wholesaleprice +
capacity payment
Wholesaleprice + CfD
Wholesaleprice +
capacity payment
CommentCompatible with cap &
floor
Requiresstrongest
political will
Perhaps compatible with cap &
floor
Business models analysed
CONFIDENTIAL 22
COPYRIGHT©PÖYRY
THE ICELINK CONCEPT DOCUMENT
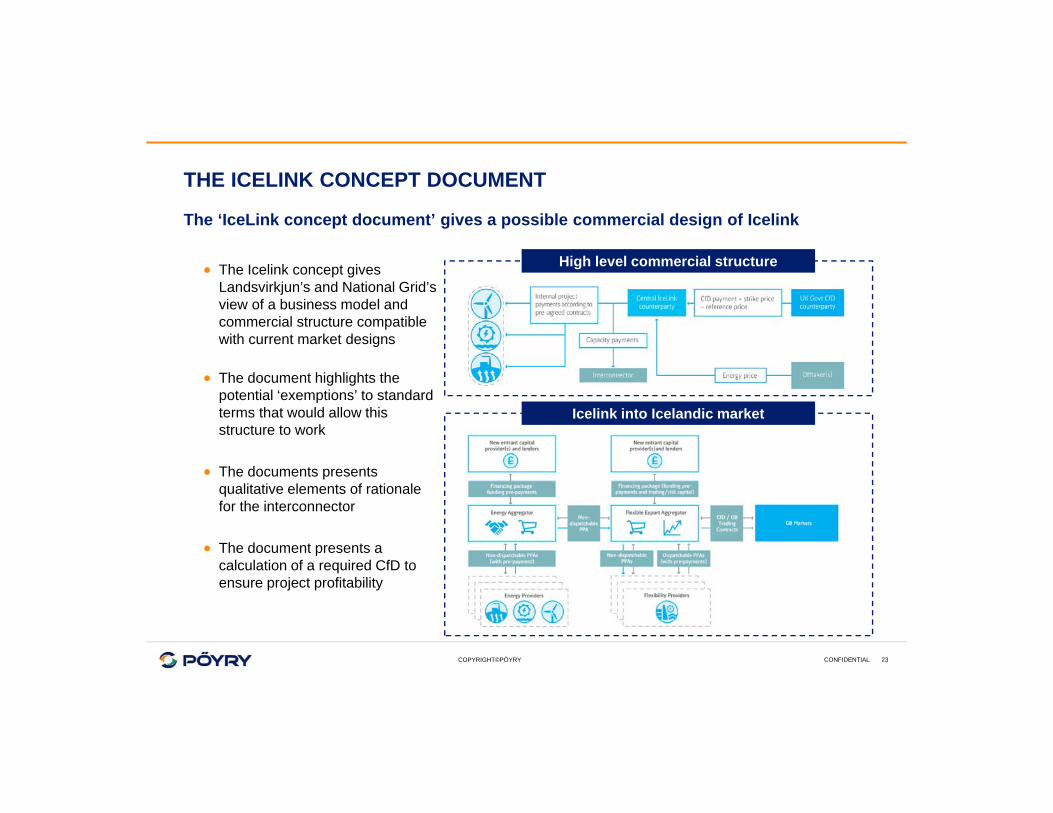
The ‘IceLink concept document’ gives a possible commercial design of Icelink
The Icelink concept gives Landsvirkjun’s and National Grid’s view of a business model and commercial structure compatible with current market designs
The document highlights the potential ‘exemptions’ to standard terms that would allow this structure to work
The documents presents qualitative elements of rationale for the interconnector
The document presents a calculation of a required CfD to ensure project profitability
High level commercial structure
Icelink into Icelandic market
CONFIDENTIAL 23
COPYRIGHT©PÖYRY
THE ICELINK CONCEPT DOCUMENT VS. PÖYRY ANALYSIS
The business case presented in the Concept Document is closest to the ‘RES export’ business case: the source of revenues for interconnector + generation is a Contract for Differences (+ wholesale price)
The Concept Document assumes a circa 65% export factor, which is one of the sensitivities we have explored
The basis for this 65% export is to reduce the need for grid reinforcements in GB, and for Icelink to be a source of flexibility as well as a source of imports
Pöyry’s modelling suggests that there would be little use of this flexibility– In the ‘day-ahead’ market– In a ‘best guess’ scenario rather than a ‘objectives met’ scenario– Results in only 5% higher revenues per MWh than in the Central case
Pöyry’s analysis does not consider North-South grid reinforcement costs in GB– How would a 65% export feed into the reinforcement cost? How would it be operated?
The required CfD strike price in the concept document is very close to the level found in Pöyry’s analysis– Some assumptions are different (duration of CfD, discount rates, etc.)
CONFIDENTIAL 24
4. Market scenariosPresentation for UK-ICE Task Energy Task Force
London, February 8th 2016
COPYRIGHT©PÖYRY
FUNDAMENTAL SCENARIOS
Pöyry’s standard scenarios capture the fundamental drivers of Icelink
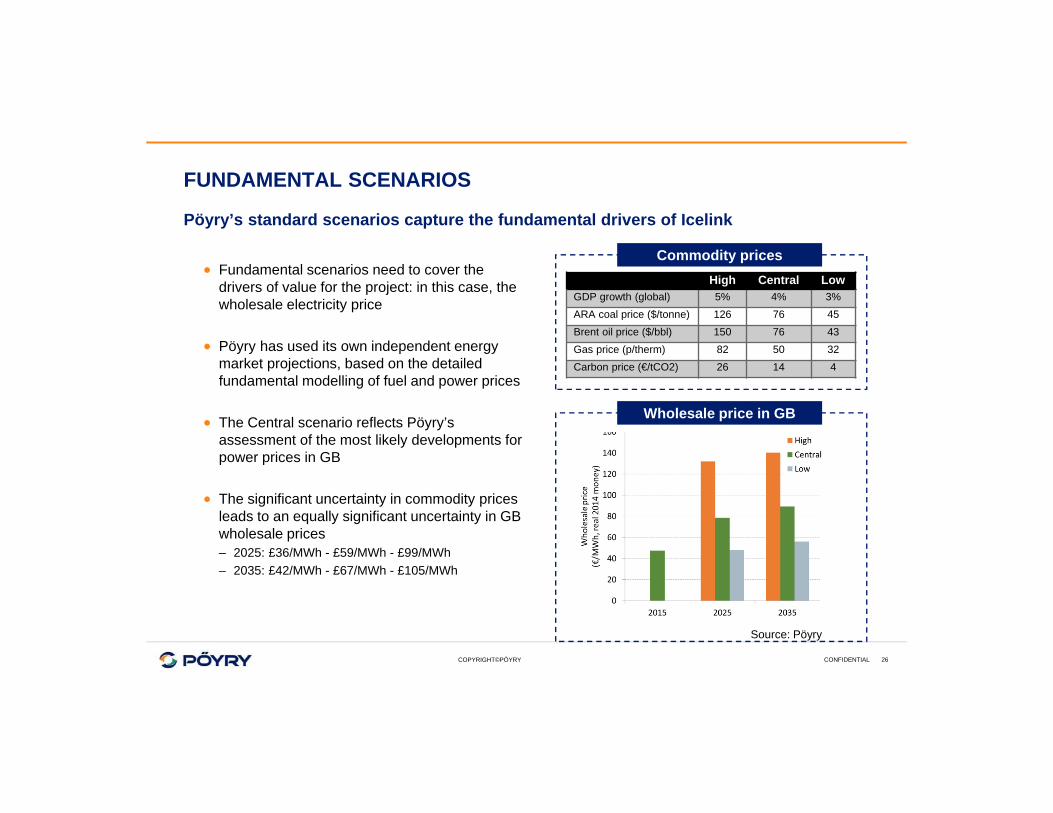
Fundamental scenarios need to cover the drivers of value for the project: in this case, the wholesale electricity price
Pöyry has used its own independent energy market projections, based on the detailed fundamental modelling of fuel and power prices
The Central scenario reflects Pöyry’s assessment of the most likely developments for power prices in GB
The significant uncertainty in commodity prices leads to an equally significant uncertainty in GB wholesale prices– 2025: £36/MWh - £59/MWh - £99/MWh– 2035: £42/MWh - £67/MWh - £105/MWh
High Central LowGDP growth (global) 5% 4% 3%ARA coal price ($/tonne) 126 76 45Brent oil price ($/bbl) 150 76 43Gas price (p/therm) 82 50 32Carbon price (€/tCO2) 26 14 4
Wholesale price in GB
Commodity prices
Source: Pöyry
CONFIDENTIAL 26
COPYRIGHT©PÖYRY
SIMULATIONS PERFORMED FOR THE ANALYSIS
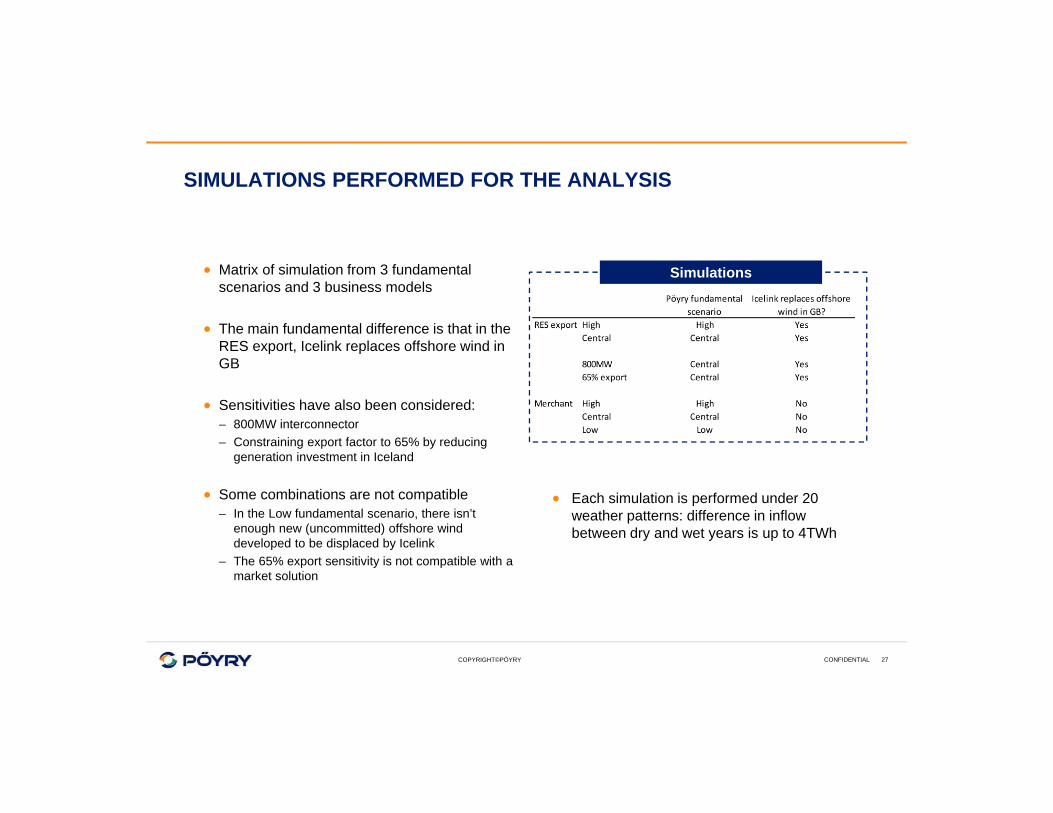
Matrix of simulation from 3 fundamental scenarios and 3 business models
The main fundamental difference is that in the RES export, Icelink replaces offshore wind in GB
Sensitivities have also been considered:– 800MW interconnector– Constraining export factor to 65% by reducing
generation investment in Iceland
Some combinations are not compatible– In the Low fundamental scenario, there isn’t
enough new (uncommitted) offshore wind developed to be displaced by Icelink
– The 65% export sensitivity is not compatible with a market solution
Simulations
Each simulation is performed under 20 weather patterns: difference in inflow between dry and wet years is up to 4TWh
CONFIDENTIAL 27

5. Key market projection resultsPresentation for UK-ICE Task Energy Task Force
London, February 8th 2016
COPYRIGHT©PÖYRY
NEW GENERATION INVESTMENTS
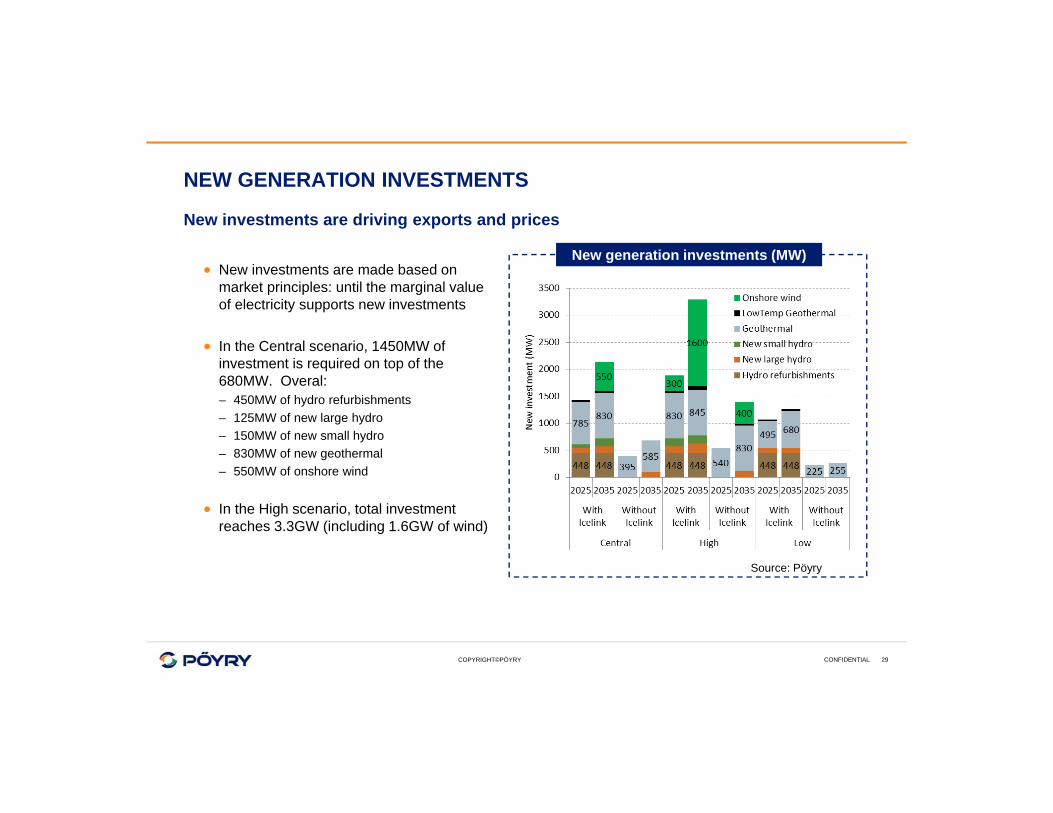
New investments are driving exports and prices
New investments are made based on market principles: until the marginal value of electricity supports new investments
In the Central scenario, 1450MW of investment is required on top of the 680MW. Overal:– 450MW of hydro refurbishments– 125MW of new large hydro– 150MW of new small hydro– 830MW of new geothermal– 550MW of onshore wind
In the High scenario, total investment reaches 3.3GW (including 1.6GW of wind)
New generation investments (MW)
Source: Pöyry
CONFIDENTIAL 29
COPYRIGHT©PÖYRY
SUPPLY AND DEMAND IN ICELAND
A mix still dominated by conventional hydro and geothermal
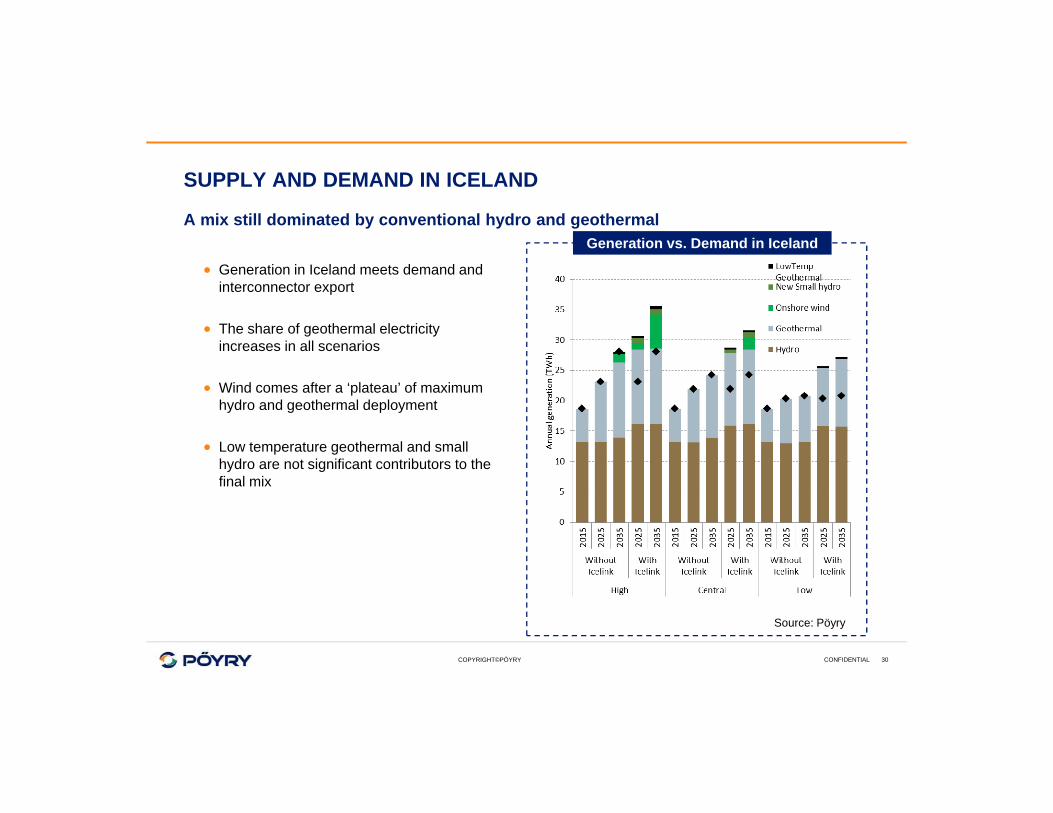
Generation in Iceland meets demand and interconnector export
The share of geothermal electricity increases in all scenarios
Wind comes after a ‘plateau’ of maximum hydro and geothermal deployment
Low temperature geothermal and small hydro are not significant contributors to the final mix
Generation vs. Demand in Iceland
Source: Pöyry
CONFIDENTIAL 30
COPYRIGHT©PÖYRY
ICELINK IMPROVES THE USE OF RESOURCE
Icelink saves around 1.5TWh of spilled inflow per year on average
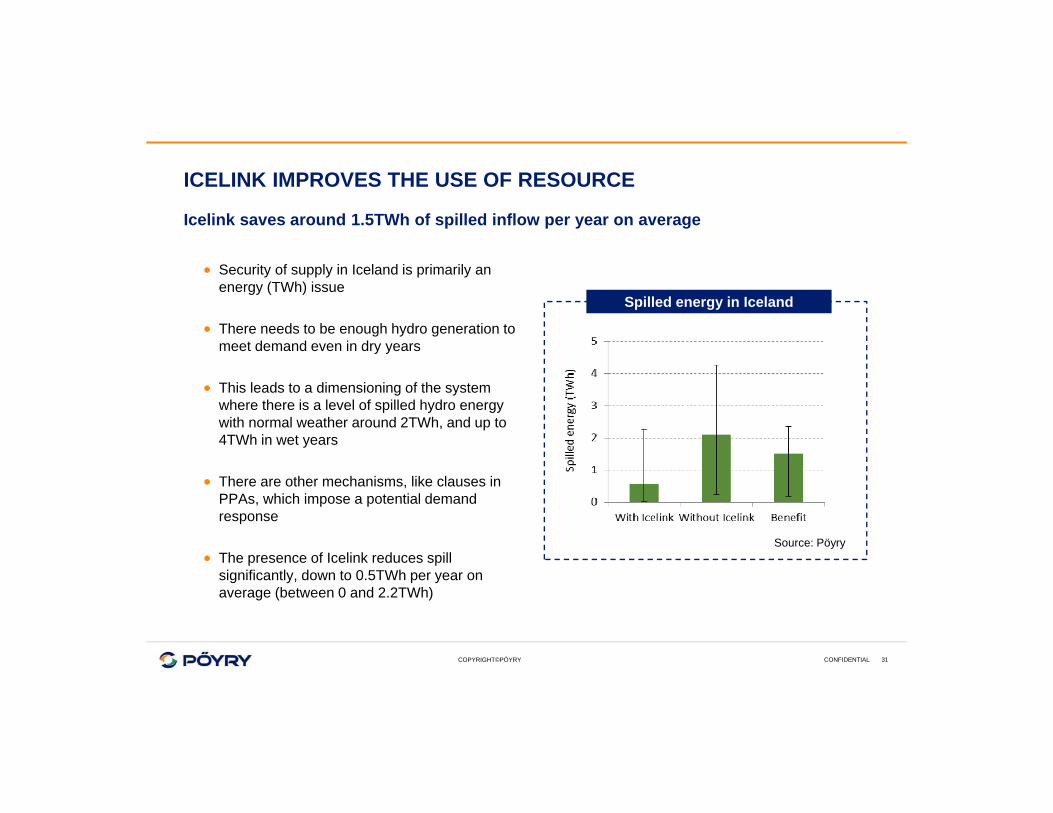
Security of supply in Iceland is primarily an energy (TWh) issue
There needs to be enough hydro generation to meet demand even in dry years
This leads to a dimensioning of the system where there is a level of spilled hydro energy with normal weather around 2TWh, and up to 4TWh in wet years
There are other mechanisms, like clauses in PPAs, which impose a potential demand response
The presence of Icelink reduces spill significantly, down to 0.5TWh per year on average (between 0 and 2.2TWh)
Spilled energy in Iceland
Source: Pöyry
CONFIDENTIAL 31
COPYRIGHT©PÖYRY
ICELINK IS AN EXPORT CABLE
There is little reverse flow from GB to Iceland through Icelink
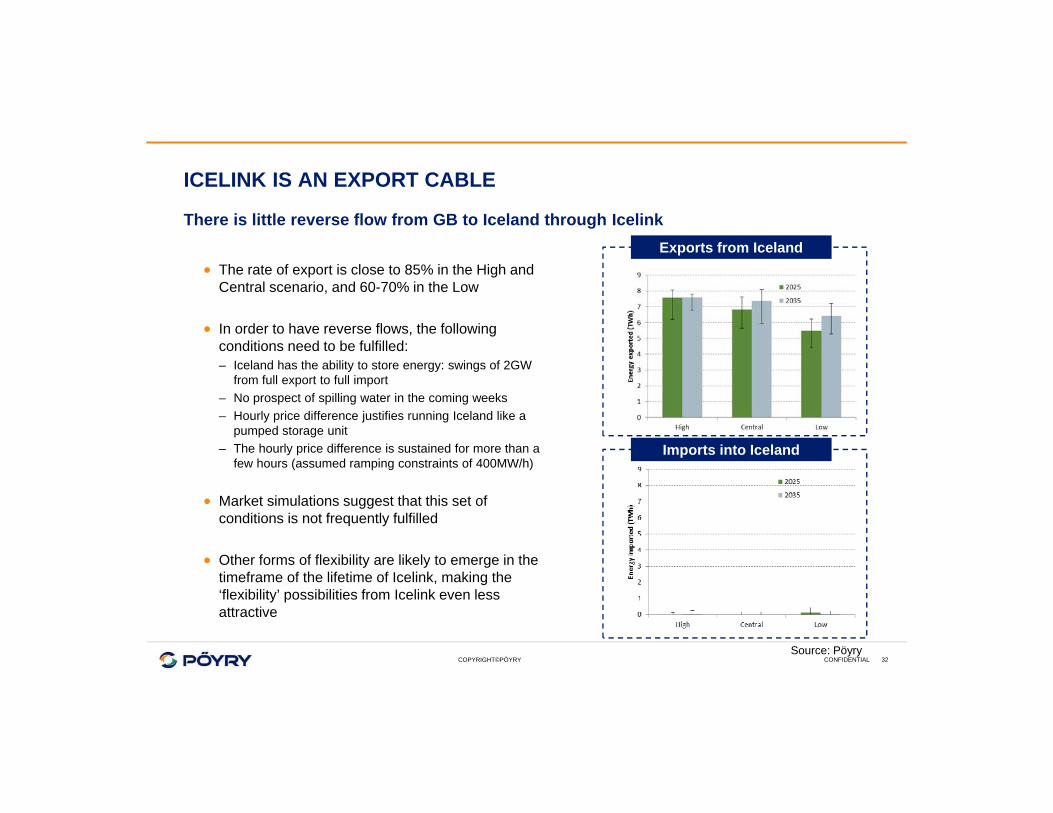
The rate of export is close to 85% in the High and Central scenario, and 60-70% in the Low
In order to have reverse flows, the following conditions need to be fulfilled:– Iceland has the ability to store energy: swings of 2GW
from full export to full import– No prospect of spilling water in the coming weeks– Hourly price difference justifies running Iceland like a
pumped storage unit– The hourly price difference is sustained for more than a
few hours (assumed ramping constraints of 400MW/h)
Market simulations suggest that this set of conditions is not frequently fulfilled
Other forms of flexibility are likely to emerge in the timeframe of the lifetime of Icelink, making the ‘flexibility’ possibilities from Icelink even less attractive
Exports from Iceland
Imports into Iceland
Source: PöyryCONFIDENTIAL 32
COPYRIGHT©PÖYRY
ELECTRICITY PRICE IN ICELAND
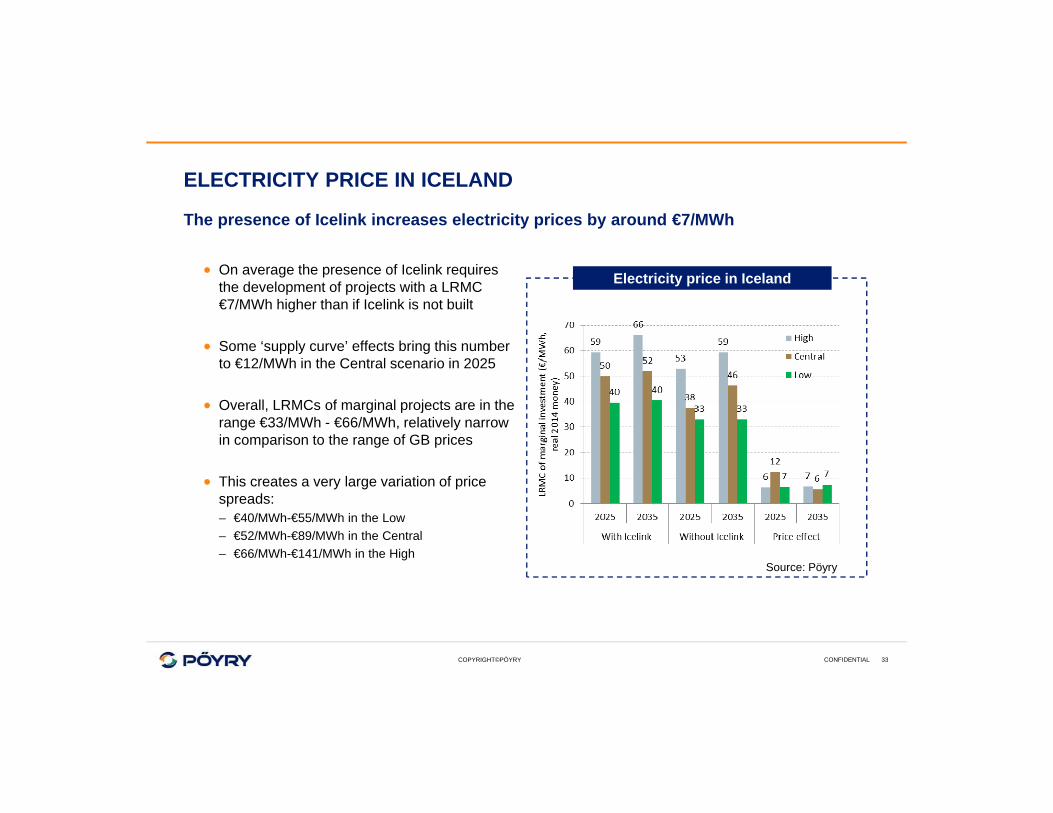
The presence of Icelink increases electricity prices by around €7/MWh
On average the presence of Icelink requires the development of projects with a LRMC €7/MWh higher than if Icelink is not built
Some ‘supply curve’ effects bring this number to €12/MWh in the Central scenario in 2025
Overall, LRMCs of marginal projects are in the range €33/MWh - €66/MWh, relatively narrow in comparison to the range of GB prices
This creates a very large variation of price spreads:– €40/MWh-€55/MWh in the Low– €52/MWh-€89/MWh in the Central– €66/MWh-€141/MWh in the High
Electricity price in Iceland
Source: Pöyry
CONFIDENTIAL 33
COPYRIGHT©PÖYRY
800MW, 65% EXPORT SENSITIVITIES
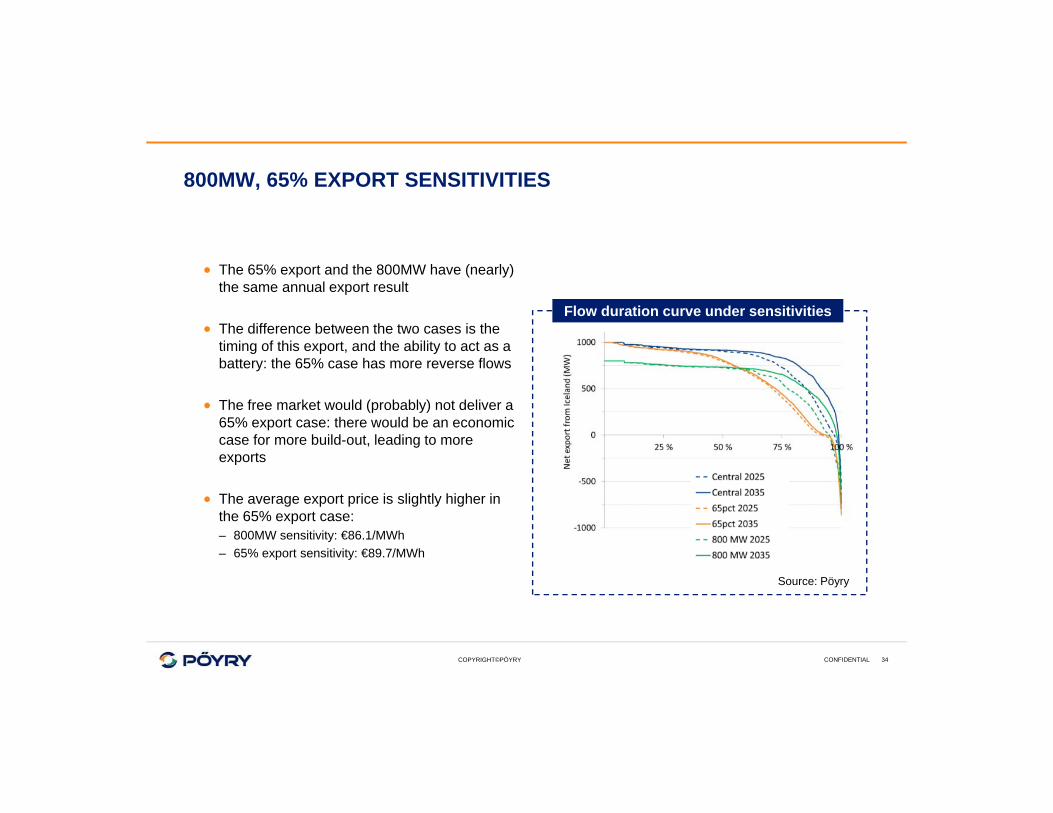
The 65% export and the 800MW have (nearly) the same annual export result
The difference between the two cases is the timing of this export, and the ability to act as a battery: the 65% case has more reverse flows
The free market would (probably) not deliver a 65% export case: there would be an economic case for more build-out, leading to more exports
The average export price is slightly higher in the 65% export case:– 800MW sensitivity: €86.1/MWh– 65% export sensitivity: €89.7/MWh
Flow duration curve under sensitivities
Source: Pöyry
CONFIDENTIAL 34
6. Cost benefit analysisPresentation for UK-ICE Task Energy Task Force
London, February 8th 2016
COPYRIGHT©PÖYRY
THE COST BENEFIT ANALYSIS
The CBA focuses on consumer/producer surplus and congestion rent
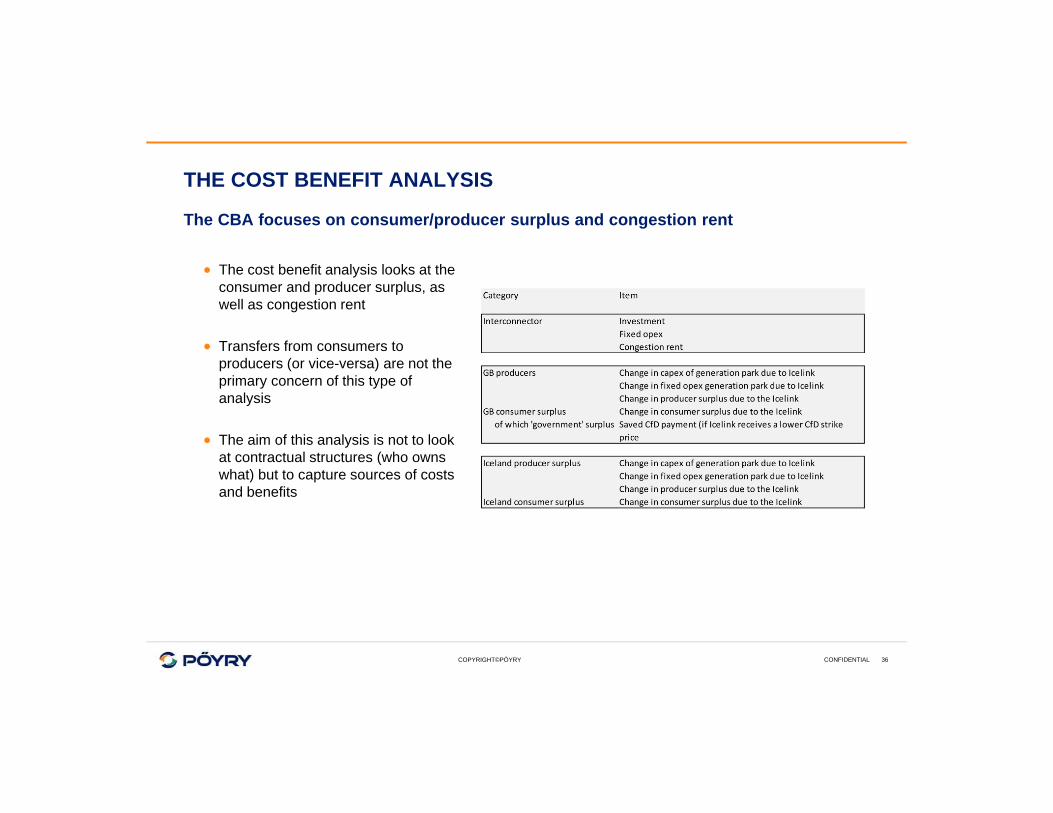
The cost benefit analysis looks at the consumer and producer surplus, as well as congestion rent
Transfers from consumers to producers (or vice-versa) are not the primary concern of this type of analysis
The aim of this analysis is not to look at contractual structures (who owns what) but to capture sources of costs and benefits
CONFIDENTIAL 36
COPYRIGHT©PÖYRY
SOCIO-ECONOMIC VALUE OF THE ICELINK PROJECT
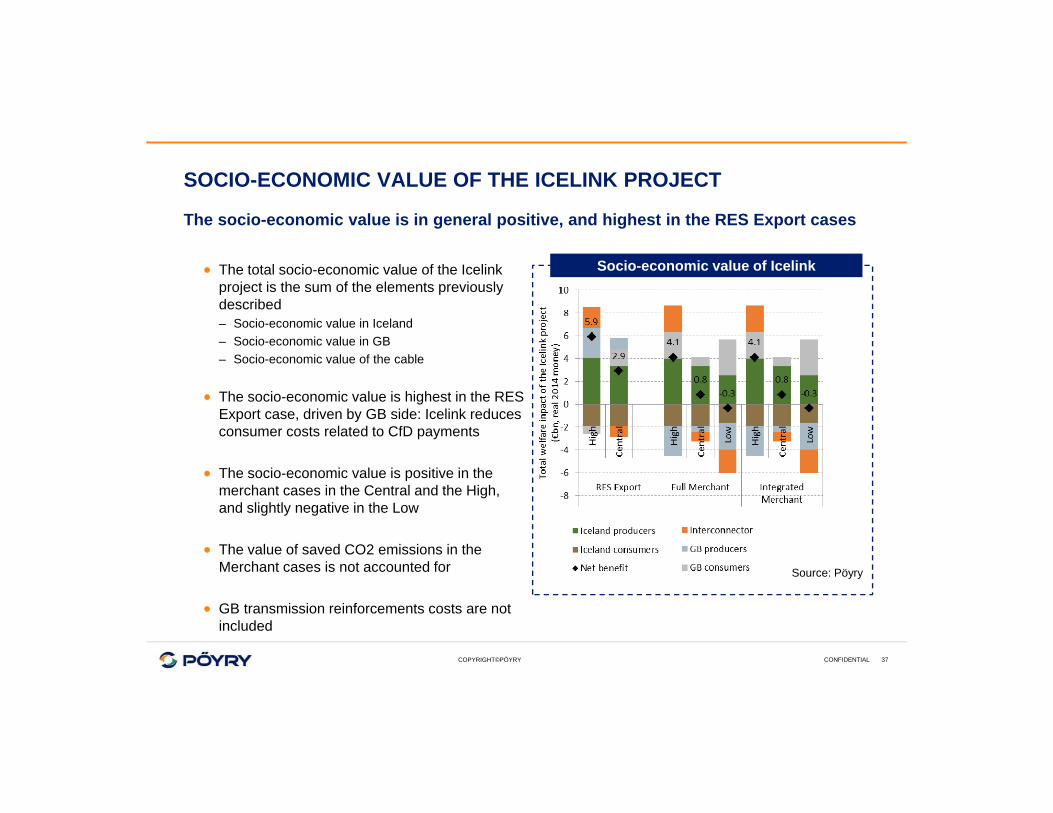
The socio-economic value is in general positive, and highest in the RES Export cases
The total socio-economic value of the Icelink project is the sum of the elements previously described– Socio-economic value in Iceland– Socio-economic value in GB– Socio-economic value of the cable
The socio-economic value is highest in the RES Export case, driven by GB side: Icelink reduces consumer costs related to CfD payments
The socio-economic value is positive in the merchant cases in the Central and the High, and slightly negative in the Low
The value of saved CO2 emissions in the Merchant cases is not accounted for
GB transmission reinforcements costs are not included
Socio-economic value of Icelink
Source: Pöyry
CONFIDENTIAL 37
COPYRIGHT©PÖYRY
PRODUCER/CONSUMER SURPLUS IN ICELAND
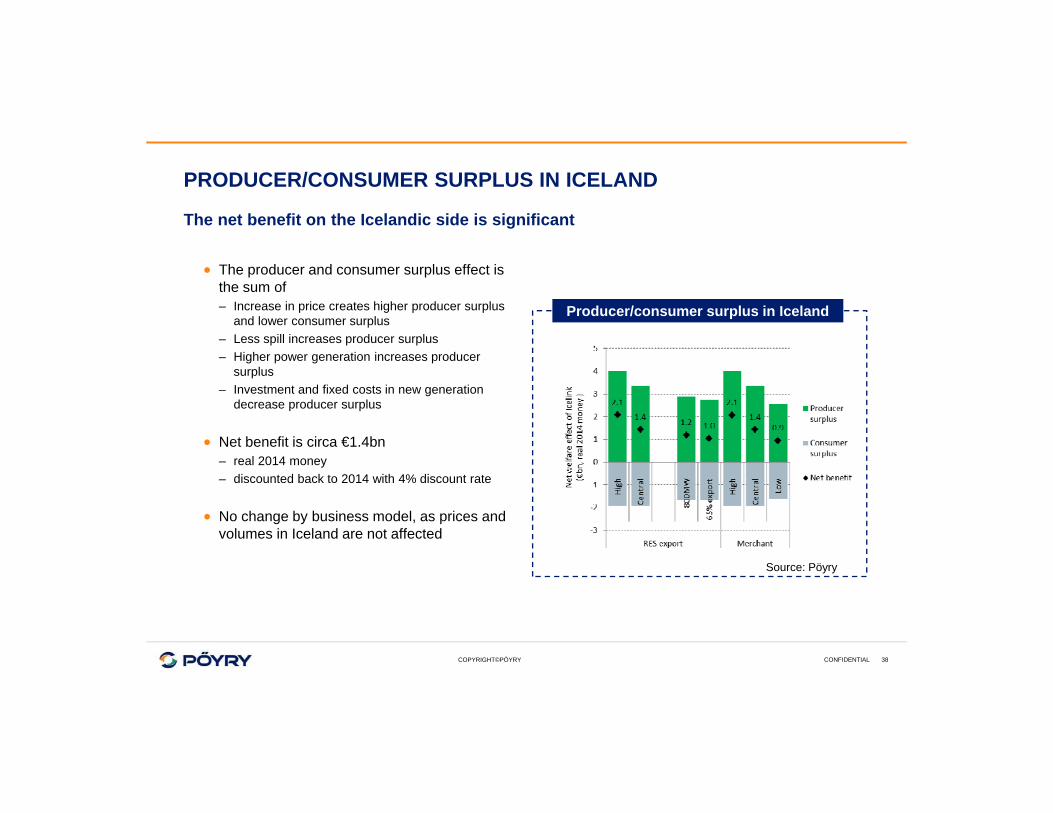
The net benefit on the Icelandic side is significant
The producer and consumer surplus effect is the sum of– Increase in price creates higher producer surplus
and lower consumer surplus– Less spill increases producer surplus– Higher power generation increases producer
surplus– Investment and fixed costs in new generation
decrease producer surplus
Net benefit is circa €1.4bn – real 2014 money– discounted back to 2014 with 4% discount rate
No change by business model, as prices and volumes in Iceland are not affected
Producer/consumer surplus in Iceland
Source: Pöyry
CONFIDENTIAL 38
COPYRIGHT©PÖYRY
SIGNIFICANT WEALTH TRANSFERS IN ICELAND
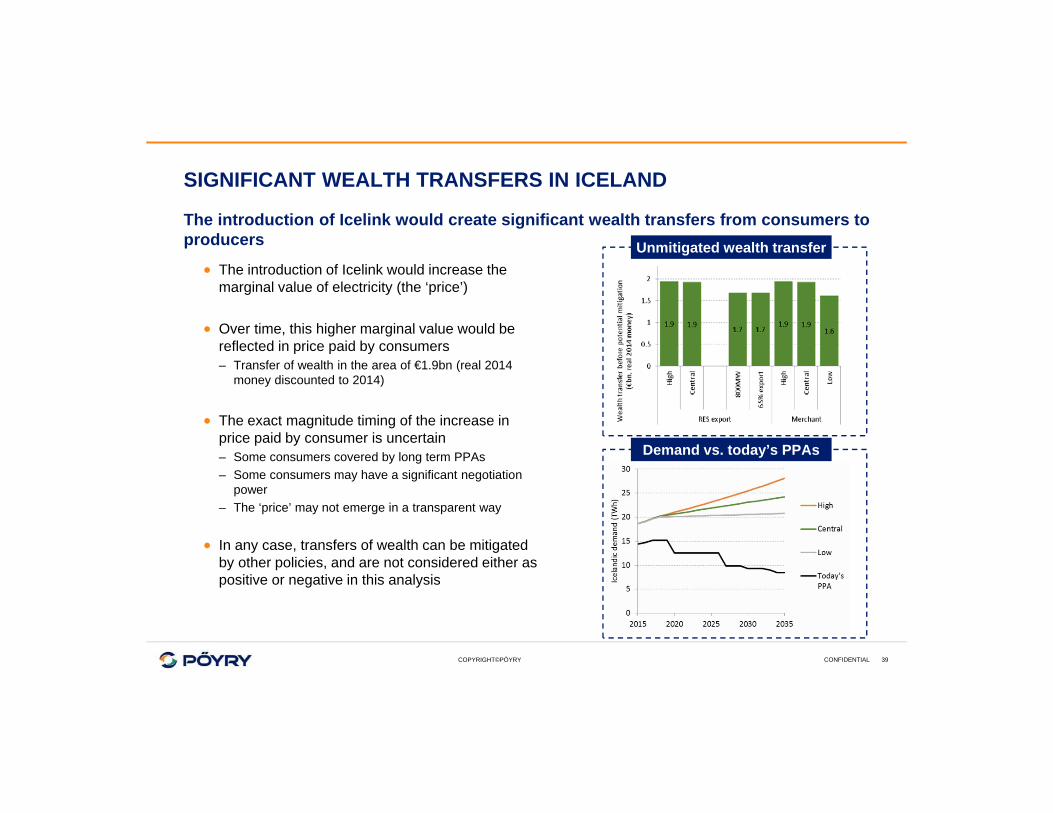
The introduction of Icelink would create significant wealth transfers from consumers to producers
The introduction of Icelink would increase the marginal value of electricity (the ‘price’)
Over time, this higher marginal value would be reflected in price paid by consumers– Transfer of wealth in the area of €1.9bn (real 2014
money discounted to 2014)
The exact magnitude timing of the increase in price paid by consumer is uncertain– Some consumers covered by long term PPAs– Some consumers may have a significant negotiation
power– The ‘price’ may not emerge in a transparent way
In any case, transfers of wealth can be mitigated by other policies, and are not considered either as positive or negative in this analysis
Unmitigated wealth transfer
Demand vs. today’s PPAs
CONFIDENTIAL 39
COPYRIGHT©PÖYRY
REQUIRED STRIKE PRICE IN GB
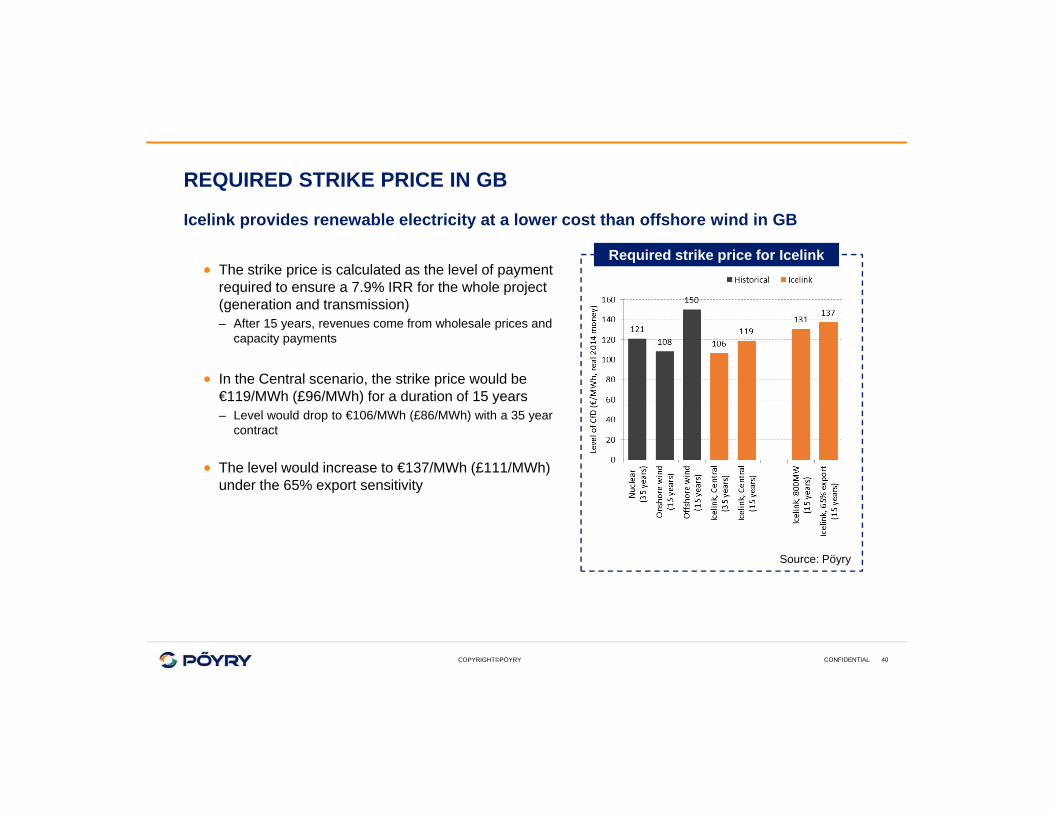
Icelink provides renewable electricity at a lower cost than offshore wind in GB
The strike price is calculated as the level of payment required to ensure a 7.9% IRR for the whole project (generation and transmission)– After 15 years, revenues come from wholesale prices and
capacity payments
In the Central scenario, the strike price would be €119/MWh (£96/MWh) for a duration of 15 years– Level would drop to €106/MWh (£86/MWh) with a 35 year
contract
The level would increase to €137/MWh (£111/MWh) under the 65% export sensitivity
Required strike price for Icelink
Source: Pöyry
CONFIDENTIAL 40
COPYRIGHT©PÖYRY
PRODUCER/CONSUMER SURPLUS IN GB
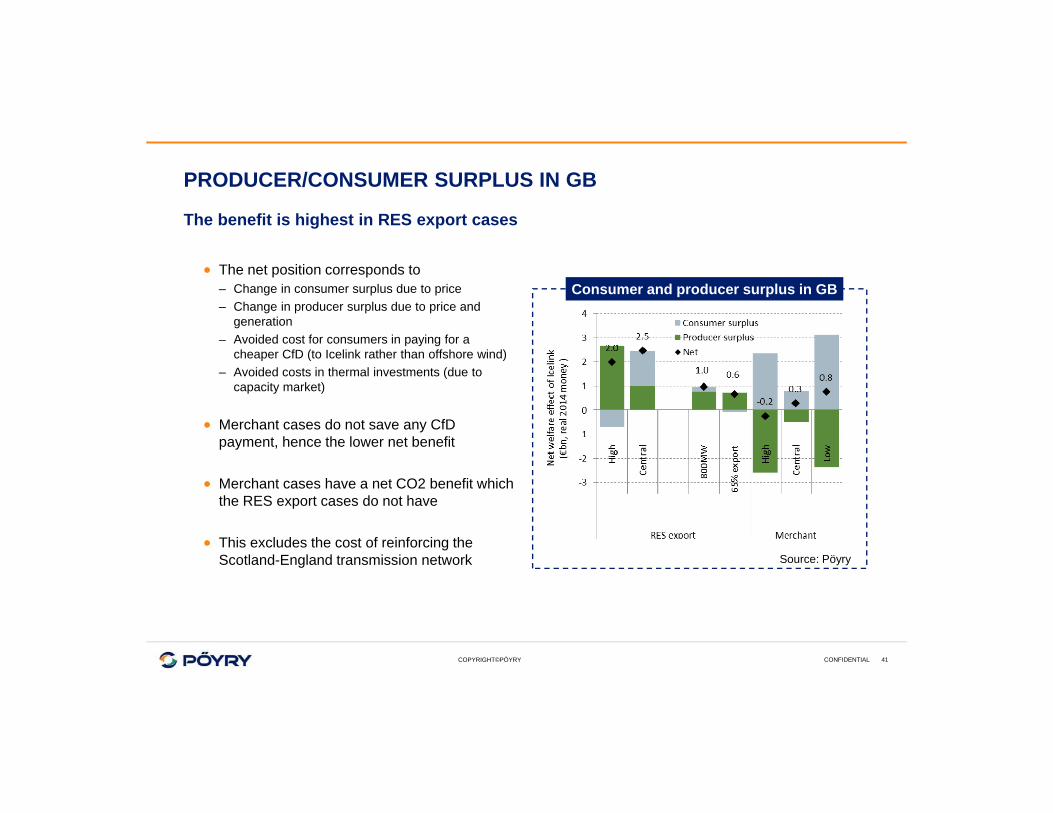
The benefit is highest in RES export cases
The net position corresponds to– Change in consumer surplus due to price– Change in producer surplus due to price and
generation– Avoided cost for consumers in paying for a
cheaper CfD (to Icelink rather than offshore wind)– Avoided costs in thermal investments (due to
capacity market)
Merchant cases do not save any CfD payment, hence the lower net benefit
Merchant cases have a net CO2 benefit which the RES export cases do not have
This excludes the cost of reinforcing the Scotland-England transmission network
Consumer and producer surplus in GB
Source: Pöyry
CONFIDENTIAL 41
COPYRIGHT©PÖYRY
SOCIO-ECONOMIC VALUE OF THE CABLE (ISOLATED)
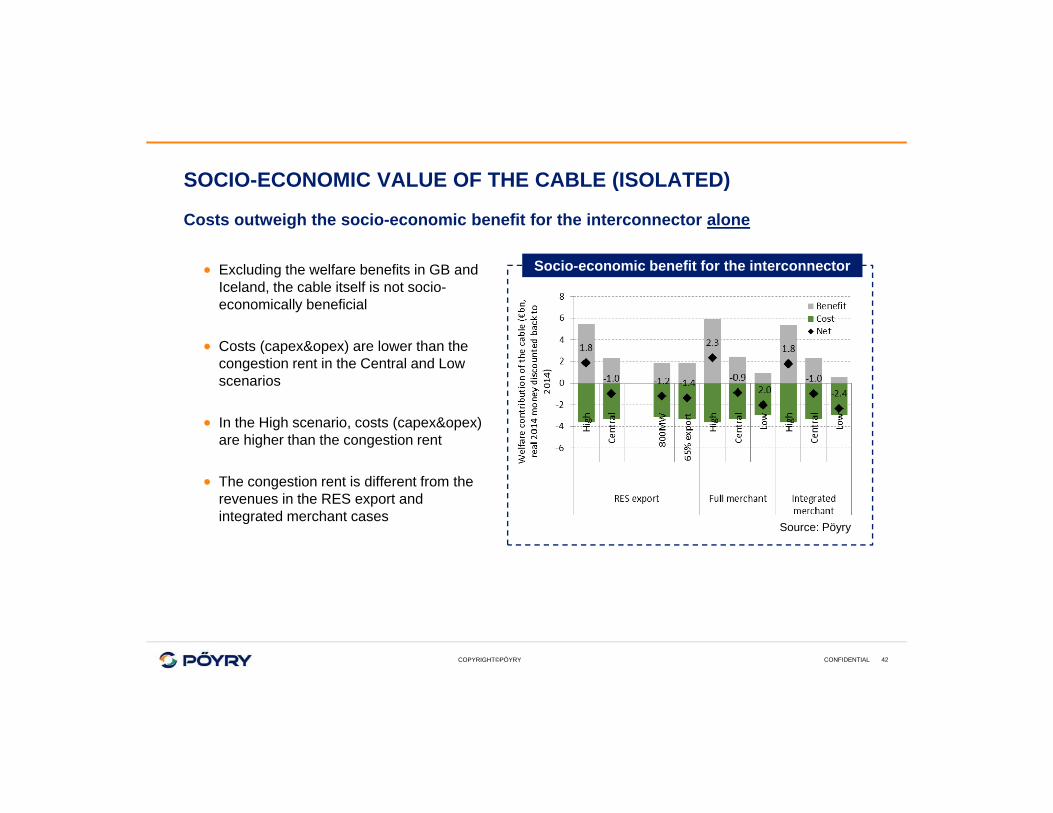
Costs outweigh the socio-economic benefit for the interconnector alone
Excluding the welfare benefits in GB and Iceland, the cable itself is not socio-economically beneficial
Costs (capex&opex) are lower than the congestion rent in the Central and Low scenarios
In the High scenario, costs (capex&opex) are higher than the congestion rent
The congestion rent is different from the revenues in the RES export and integrated merchant cases
Socio-economic benefit for the interconnector
Source: Pöyry
CONFIDENTIAL 42
COPYRIGHT©PÖYRY
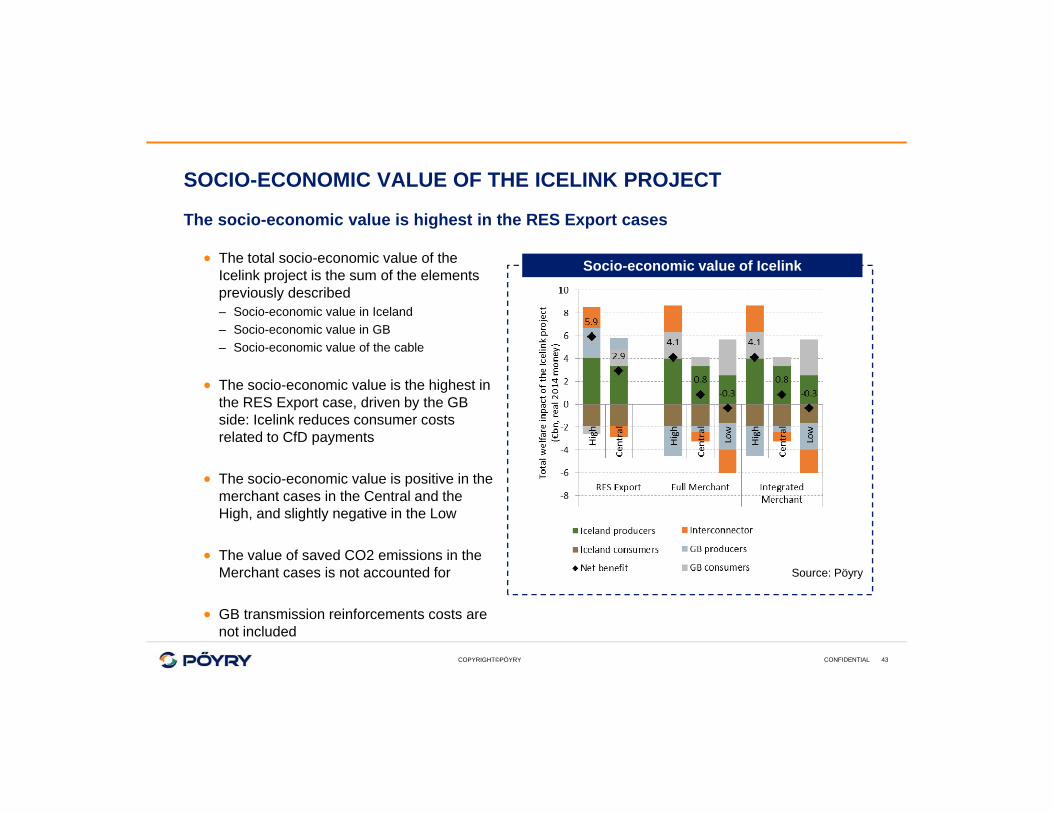
SOCIO-ECONOMIC VALUE OF THE ICELINK PROJECT
The socio-economic value is highest in the RES Export cases
The total socio-economic value of the Icelink project is the sum of the elements previously described– Socio-economic value in Iceland– Socio-economic value in GB– Socio-economic value of the cable
The socio-economic value is the highest in the RES Export case, driven by the GB side: Icelink reduces consumer costs related to CfD payments
The socio-economic value is positive in the merchant cases in the Central and the High, and slightly negative in the Low
The value of saved CO2 emissions in the Merchant cases is not accounted for
GB transmission reinforcements costs are not included
Socio-economic value of Icelink
Source: Pöyry
CONFIDENTIAL 43

COPYRIGHT©PÖYRY
SOCIO-ECONOMIC VALUE IN SENSITIVITIES
The socio-economic value of the Icelink project in the sensitivities is significantly lower than in the Central case
The overall welfare decreases significantly in the 800MW and 65% export sensitivities
The welfare decrease in GB, Iceland and for the interconnector itself
This does not take into account that grid reinforcement in GB may be cheaper under some of these sensitivities
This aspect may need to be analysed in more detail
Socio-economic benefit of sensitivities
Source: Pöyry
CONFIDENTIAL 44
COPYRIGHT©PÖYRY
COMMERCIAL RETURN OF ICELINK
The basis for the calculation of the IRR is different from the socio-economic analysis
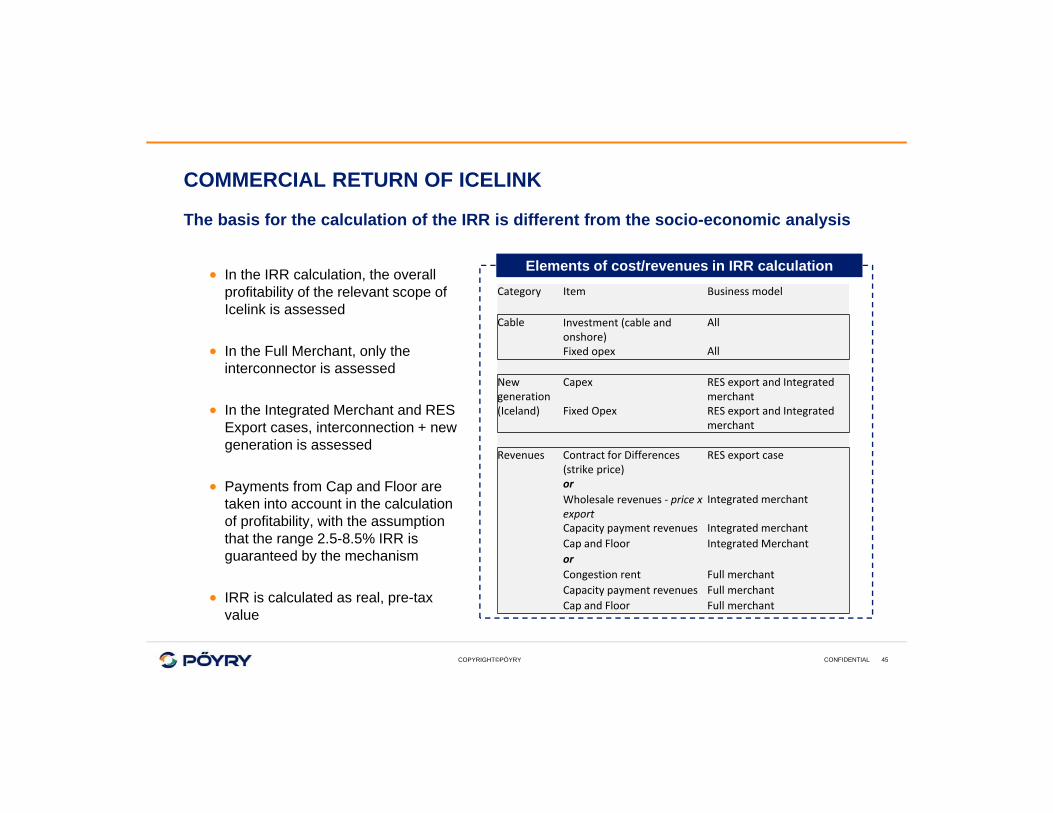
In the IRR calculation, the overall profitability of the relevant scope of Icelink is assessed
In the Full Merchant, only the interconnector is assessed
In the Integrated Merchant and RES Export cases, interconnection + new generation is assessed
Payments from Cap and Floor are taken into account in the calculation of profitability, with the assumption that the range 2.5-8.5% IRR is guaranteed by the mechanism
IRR is calculated as real, pre-tax value
Category Item Business model
Cable Investment (cable and onshore)
All
Fixed opex All
New generation
Capex RES export and Integrated merchant
(Iceland) Fixed Opex RES export and Integrated merchant
Revenues Contract for Differences (strike price)
RES export case
orWholesale revenues ‐ price x export
Integrated merchant
Capacity payment revenues Integrated merchantCap and Floor Integrated MerchantorCongestion rent Full merchantCapacity payment revenues Full merchantCap and Floor Full merchant
Elements of cost/revenues in IRR calculation
CONFIDENTIAL 45
COPYRIGHT©PÖYRY
INTERNAL RATE OF RETURN OF ICELINK
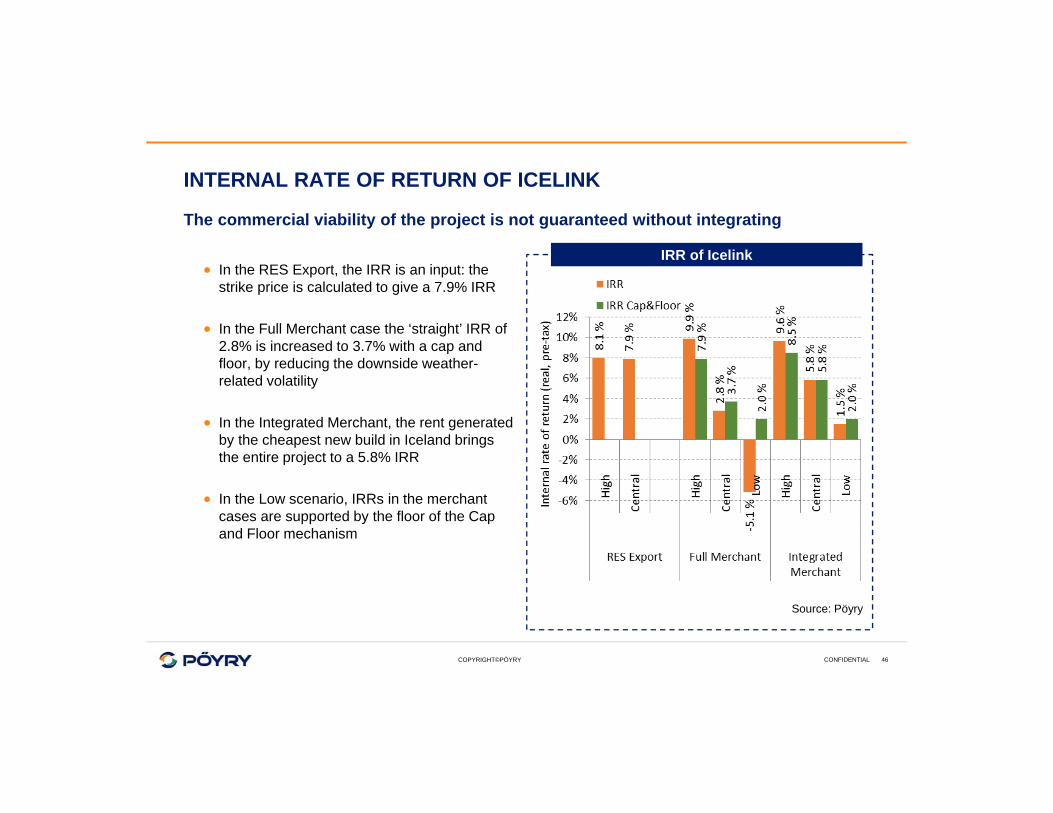
The commercial viability of the project is not guaranteed without integrating
In the RES Export, the IRR is an input: the strike price is calculated to give a 7.9% IRR
In the Full Merchant case the ‘straight’ IRR of 2.8% is increased to 3.7% with a cap and floor, by reducing the downside weather-related volatility
In the Integrated Merchant, the rent generated by the cheapest new build in Iceland brings the entire project to a 5.8% IRR
In the Low scenario, IRRs in the merchant cases are supported by the floor of the Cap and Floor mechanism
IRR of Icelink
Source: Pöyry
CONFIDENTIAL 46
COPYRIGHT©PÖYRY
CONCLUSION
The RES export case is a valid business case which can deliver a safe return for the Icelink project as a whole– A detailed commercial and regulatory analysis could be performed to find ideal setup for the project,
starting from the Icelink Concept Document– A clear political support is required for this option, to support Icelink over a local offshore wind project
The Full Merchant case has a positive socio-economically value, but a poor commercial return: it could get a cap and floor arrangement but would not find investors
The Integrated Merchant case internalises the rents made by the cheapest of the new generation in Iceland, and reaches a rate of return closer to a commercial hurdle rate but still on the low side– A cap and floor would made the revenues less risky than standard generation investments– This option requires less political support, but is less attractive financially
CONFIDENTIAL 47
7. Iceland Impact AnalysisPresentation for UK-ICE Task Energy Task Force
London, February 8th 2016
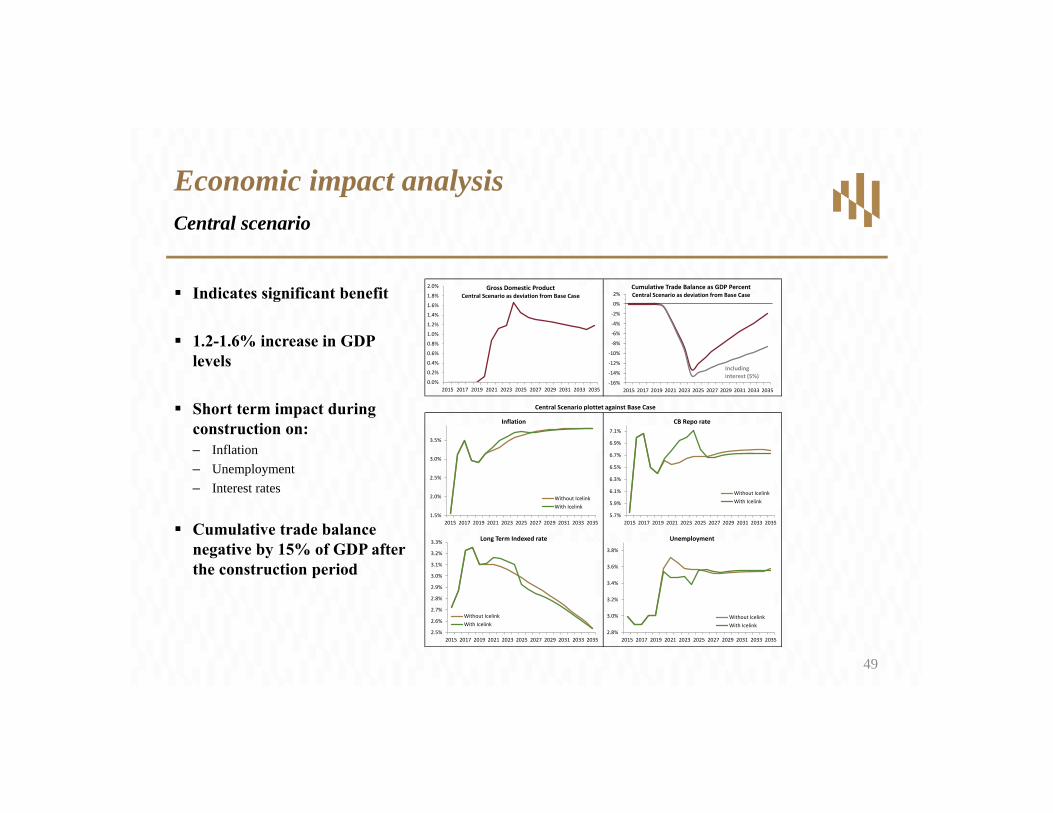
Indicates significant benefit
1.2-1.6% increase in GDP levels
Short term impact during construction on:– Inflation– Unemployment– Interest rates
Cumulative trade balance negative by 15% of GDP after the construction period
Economic impact analysisCentral scenario
1.5%
2.0%
2.5%
3.0%
3.5%
2015 2017 2019 2021 2023 2025 2027 2029 2031 2033 2035
Inflation
Without IcelinkWith Icelink
5.7%
5.9%
6.1%
6.3%
6.5%
6.7%
6.9%
7.1%
2015 2017 2019 2021 2023 2025 2027 2029 2031 2033 2035
CB Repo rate
Without IcelinkWith Icelink
2.5%
2.6%
2.7%
2.8%
2.9%
3.0%
3.1%
3.2%
3.3%
2015 2017 2019 2021 2023 2025 2027 2029 2031 2033 2035
Long Term Indexed rate
Without IcelinkWith Icelink
2.8%
3.0%
3.2%
3.4%
3.6%
3.8%
2015 2017 2019 2021 2023 2025 2027 2029 2031 2033 2035
Unemployment
Without IcelinkWith Icelink
0.0%
0.2%
0.4%
0.6%
0.8%
1.0%
1.2%
1.4%
1.6%
1.8%
2.0%
2015 2017 2019 2021 2023 2025 2027 2029 2031 2033 2035
Gross Domestic ProductCentral Scenario as deviation from Base Case
‐16%
‐14%
‐12%
‐10%
‐8%
‐6%
‐4%
‐2%
0%
2%
2015 2017 2019 2021 2023 2025 2027 2029 2031 2033 2035
Cumulative Trade Balance as GDP Percent Central Scenario as deviation from Base Case
Including interest (5%)
Central Scenario plottet against Base Case
49
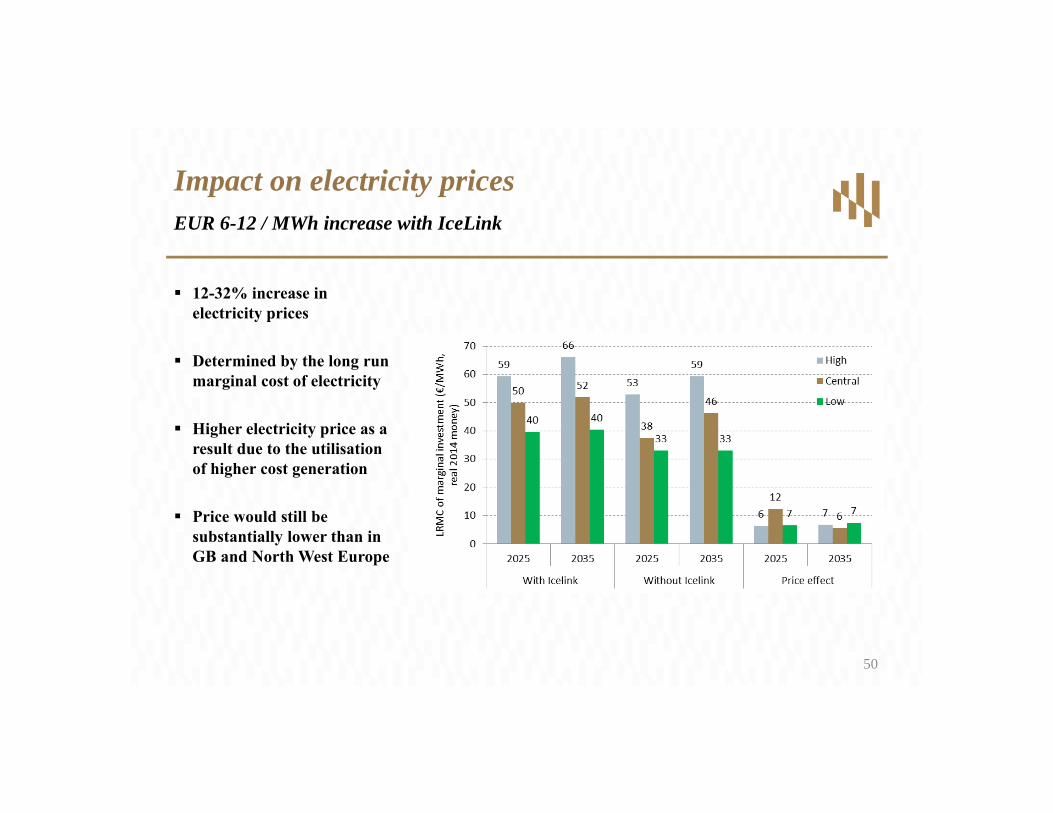
12-32% increase in electricity prices
Determined by the long run marginal cost of electricity
Higher electricity price as a result due to the utilisation of higher cost generation
Price would still be substantially lower than in GB and North West Europe
Impact on electricity pricesEUR 6-12 / MWh increase with IceLink
50
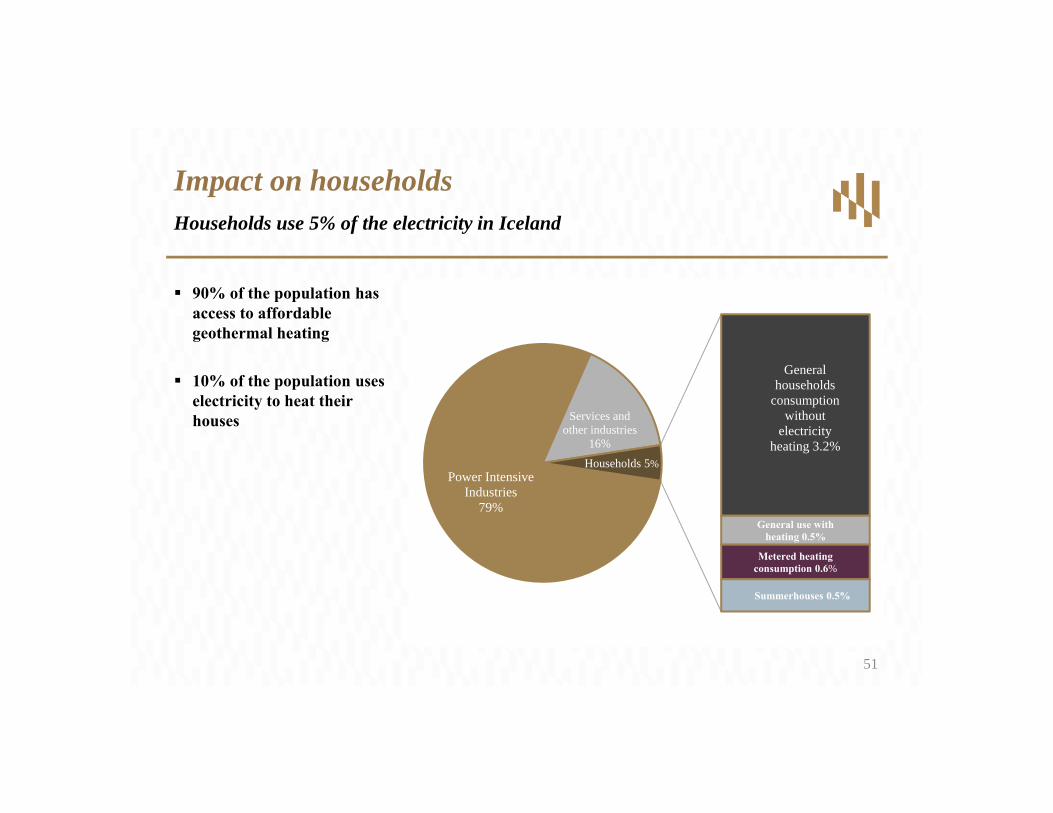
90% of the population has access to affordable geothermal heating
10% of the population uses electricity to heat their houses
Impact on householdsHouseholds use 5% of the electricity in Iceland
Power Intensive Industries
79%
Services and other industries
16%
General households
consumption without
electricity heating 3.2%
General use with heating 0.5%
Metered heating consumption 0.6%
Summerhouses 0.5%
Households 5%
51
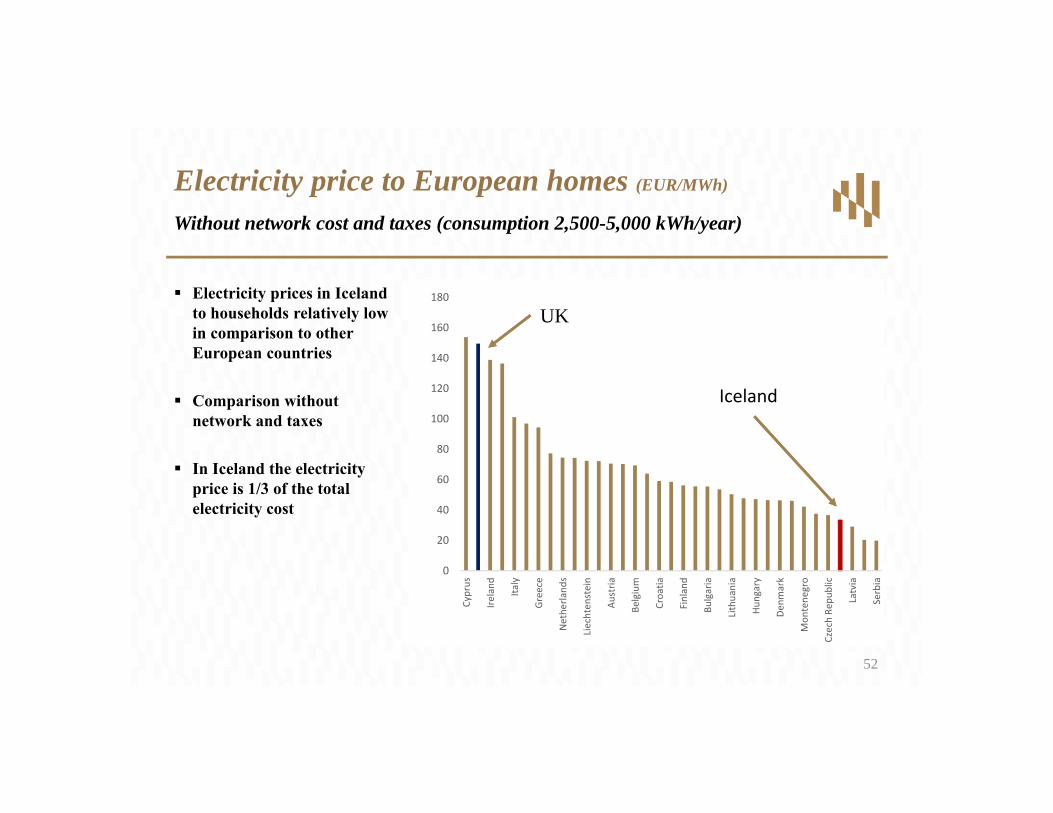
Electricity prices in Iceland to households relatively low in comparison to other European countries
Comparison without network and taxes
In Iceland the electricity price is 1/3 of the total electricity cost
Electricity price to European homes (EUR/MWh)
Without network cost and taxes (consumption 2,500-5,000 kWh/year)
52
0
20
40
60
80
100
120
140
160
180
Cyprus
Ireland
Italy
Greece
Nethe
rland
s
Liechten
stein
Austria
Belgium
Croatia
Finland
Bulgaria
Lithuania
Hungary
Denm
ark
Mon
tene
gro
Czech Re
public
Latvia
Serbia
Iceland
UK
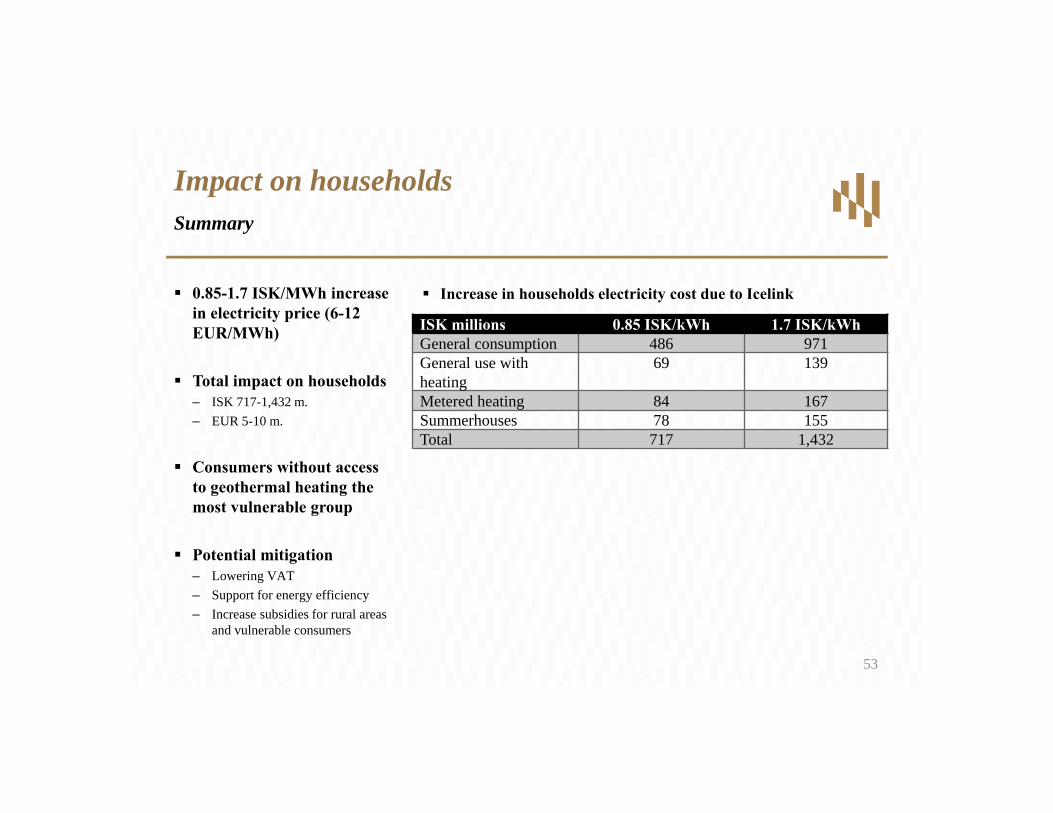
0.85-1.7 ISK/MWh increase in electricity price (6-12 EUR/MWh)
Total impact on households – ISK 717-1,432 m.– EUR 5-10 m.
Consumers without access to geothermal heating the most vulnerable group
Potential mitigation– Lowering VAT– Support for energy efficiency– Increase subsidies for rural areas
and vulnerable consumers
Impact on householdsSummary
ISK millions 0.85 ISK/kWh 1.7 ISK/kWhGeneral consumption 486 971General use with heating
69 139
Metered heating 84 167Summerhouses 78 155Total 717 1,432
Increase in households electricity cost due to Icelink
53
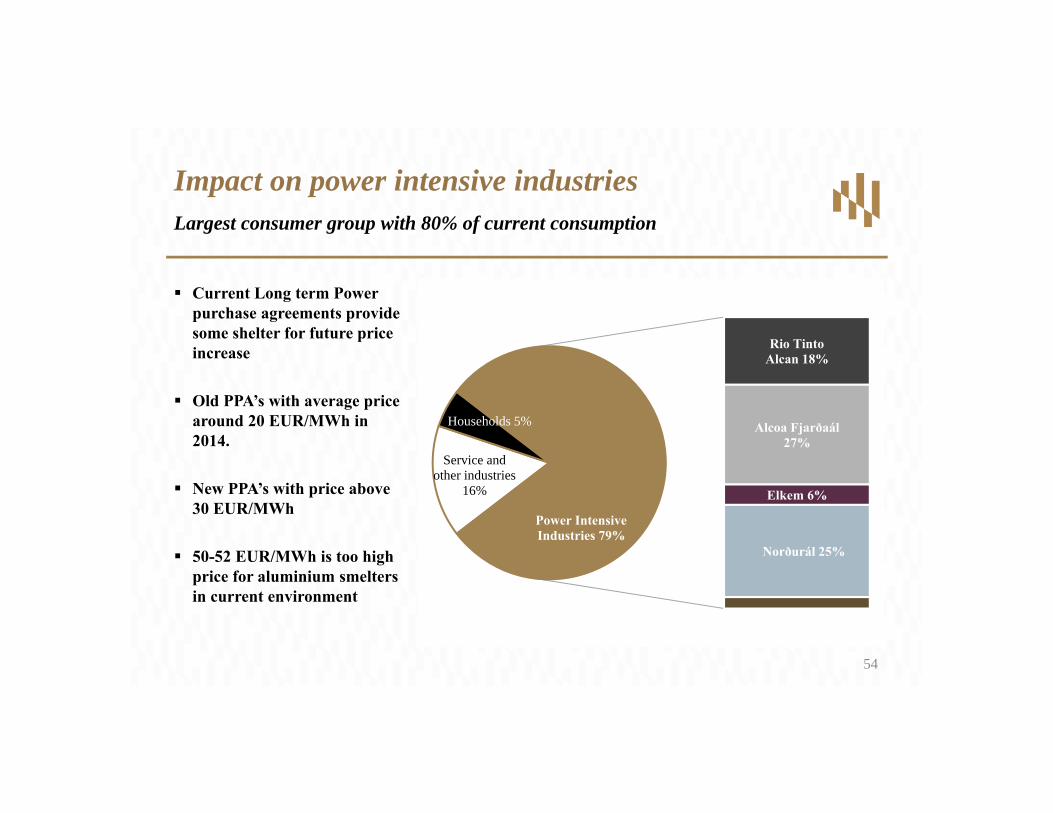
Current Long term Power purchase agreements provide some shelter for future price increase
Old PPA’s with average price around 20 EUR/MWh in 2014.
New PPA’s with price above 30 EUR/MWh
50-52 EUR/MWh is too high price for aluminium smelters in current environment
Impact on power intensive industriesLargest consumer group with 80% of current consumption
Service and other industries
16%
Households 5%
Rio Tinto Alcan 18%
Alcoa Fjarðaál 27%
Elkem 6%
Norðurál 25%
Power Intensive Industries 79%
54
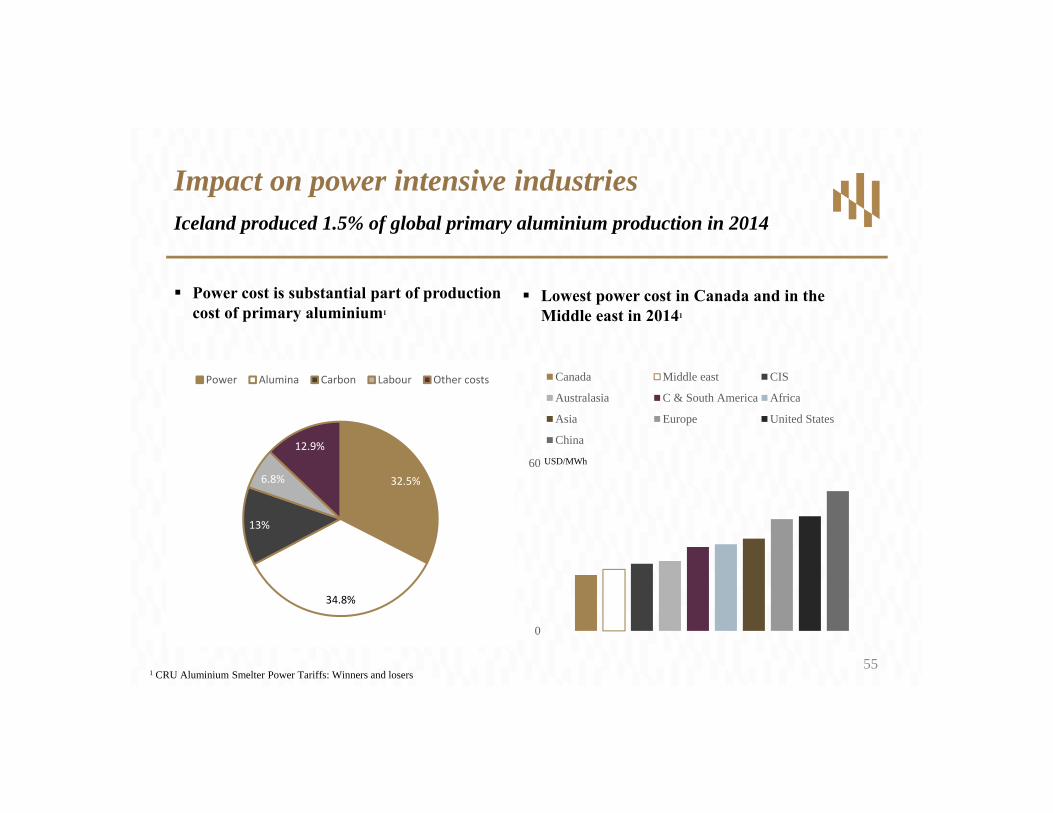
Power cost is substantial part of production cost of primary aluminium1
Impact on power intensive industriesIceland produced 1.5% of global primary aluminium production in 2014
55
32.5%
34.8%
13%
6.8%
12.9%
Power Alumina Carbon Labour Other costs
0
60
Canada Middle east CIS
Australasia C & South America Africa
Asia Europe United States
China
USD/MWh
Lowest power cost in Canada and in the Middle east in 20141
1 CRU Aluminium Smelter Power Tariffs: Winners and losers
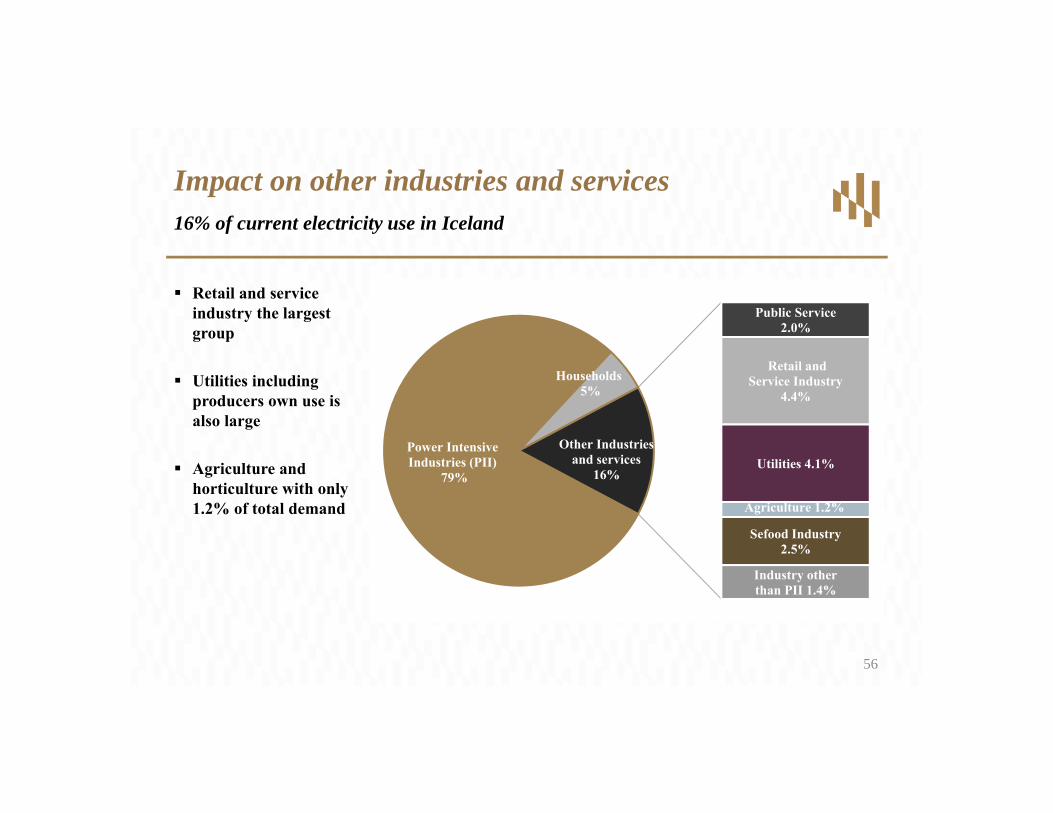
Retail and service industry the largest group
Utilities including producers own use is also large
Agriculture and horticulture with only 1.2% of total demand
Impact on other industries and services16% of current electricity use in Iceland
56
Power Intensive Industries (PII)
79%
Households5%
Public Service 2.0%
Retail and Service Industry
4.4%
Utilities 4.1%
Agriculture 1.2%
Sefood Industry 2.5%
Industry other than PII 1.4%
Other Industries and services
16%

Comparison includes unrecoverable taxes, distribution and transmission charges
Most other industries and services in Iceland are small and medium sized enterprises
Electricity price to SME’s relatively low in Iceland compared to Europe
Impact on other industries and servicesElectricity price to industry to industry in Europe (500-2,000 MWh/year)
0
20
40
60
80
100
120
140
160
180
200
Cyp
rus
Italy
Liec
hten
stei
n
Uni
ted
Kin
gdom
Portu
gal
Slov
akia
Spai
n
Aus
tria
Den
mar
k
Cro
atia
Hun
gary
Slov
enia
Cze
ch R
epub
lic
Rom
ania
Kos
ovo
Bul
garia
Icel
and
high
Swed
en
Icel
and
low
57
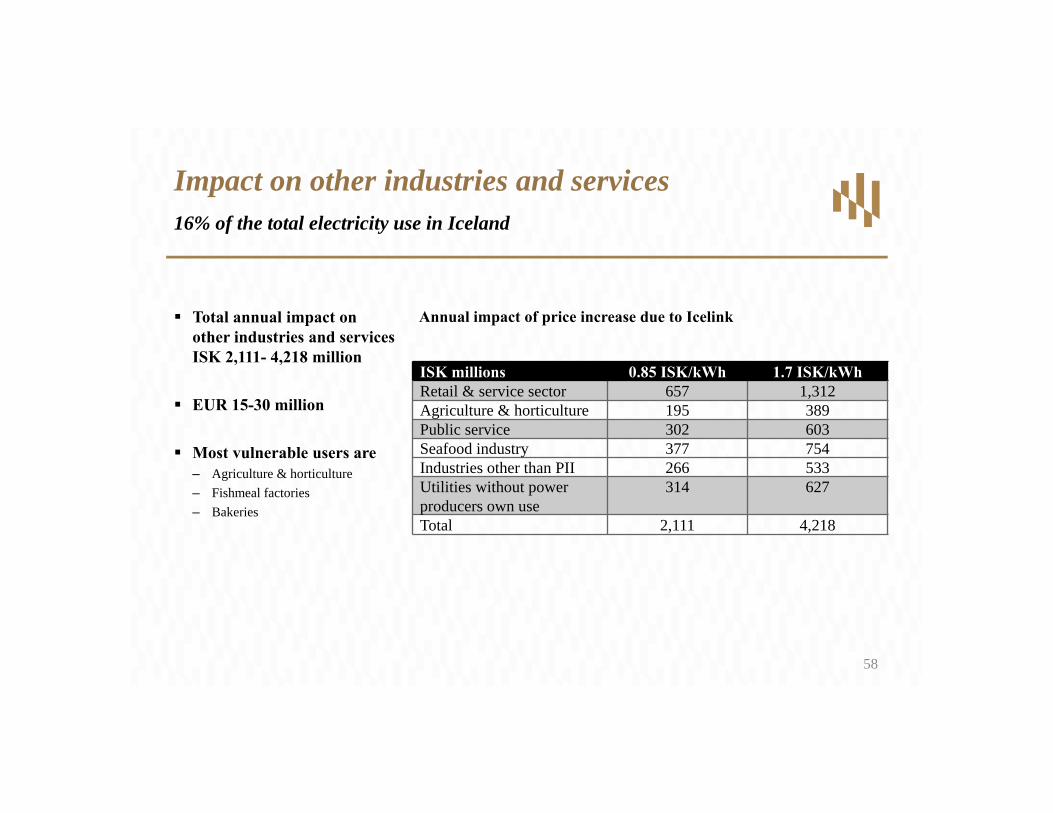
Total annual impact on other industries and services ISK 2,111- 4,218 million
EUR 15-30 million
Most vulnerable users are– Agriculture & horticulture– Fishmeal factories– Bakeries
Impact on other industries and services16% of the total electricity use in Iceland
ISK millions 0.85 ISK/kWh 1.7 ISK/kWhRetail & service sector 657 1,312Agriculture & horticulture 195 389Public service 302 603Seafood industry 377 754Industries other than PII 266 533Utilities without power producers own use
314 627
Total 2,111 4,218
Annual impact of price increase due to Icelink
58

APPENDIX
COPYRIGHT©PÖYRY 60
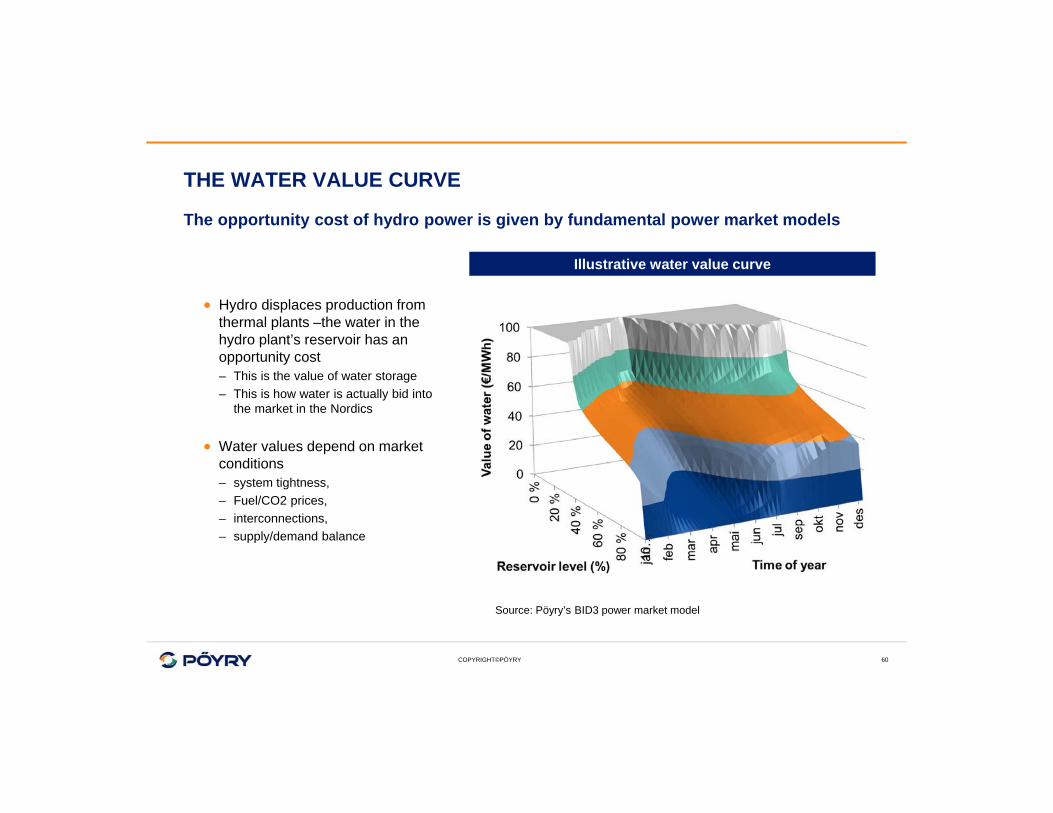
THE WATER VALUE CURVE
The opportunity cost of hydro power is given by fundamental power market models
Hydro displaces production from thermal plants –the water in the hydro plant’s reservoir has an opportunity cost– This is the value of water storage– This is how water is actually bid into
the market in the Nordics
Water values depend on market conditions – system tightness, – Fuel/CO2 prices, – interconnections, – supply/demand balance
Illustrative water value curve
Source: Pöyry’s BID3 power market model
COPYRIGHT©PÖYRY
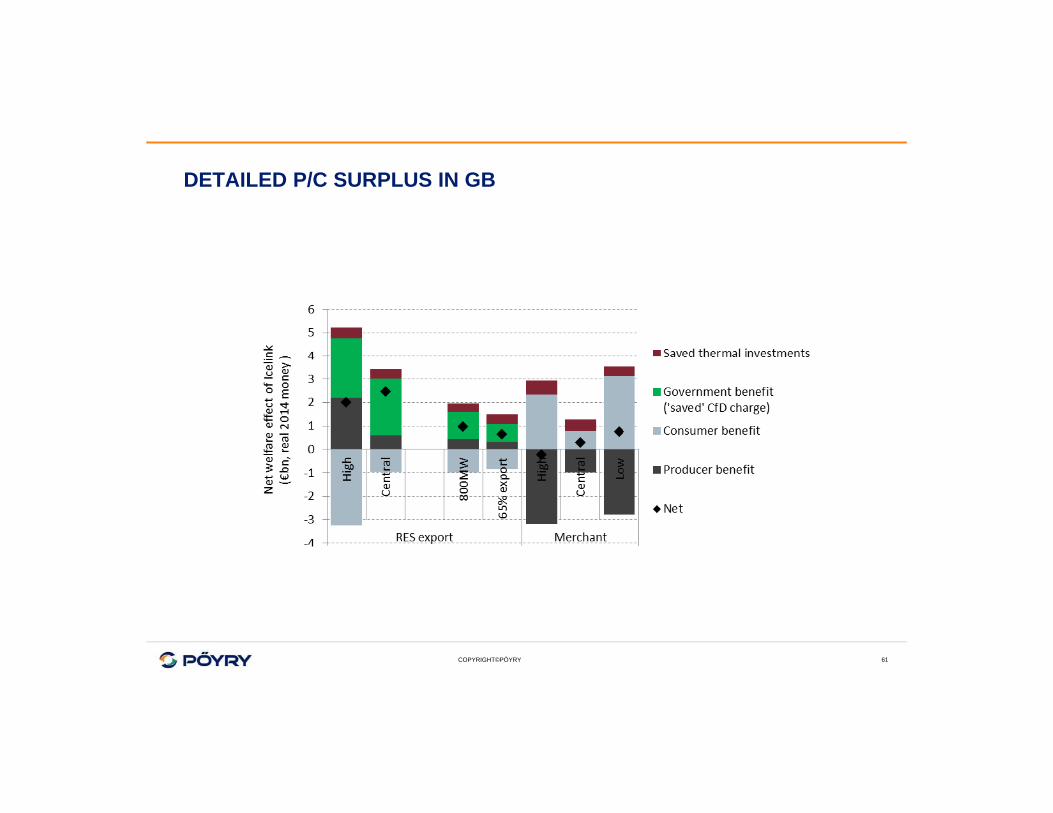
DETAILED P/C SURPLUS IN GB
61
COPYRIGHT©PÖYRY
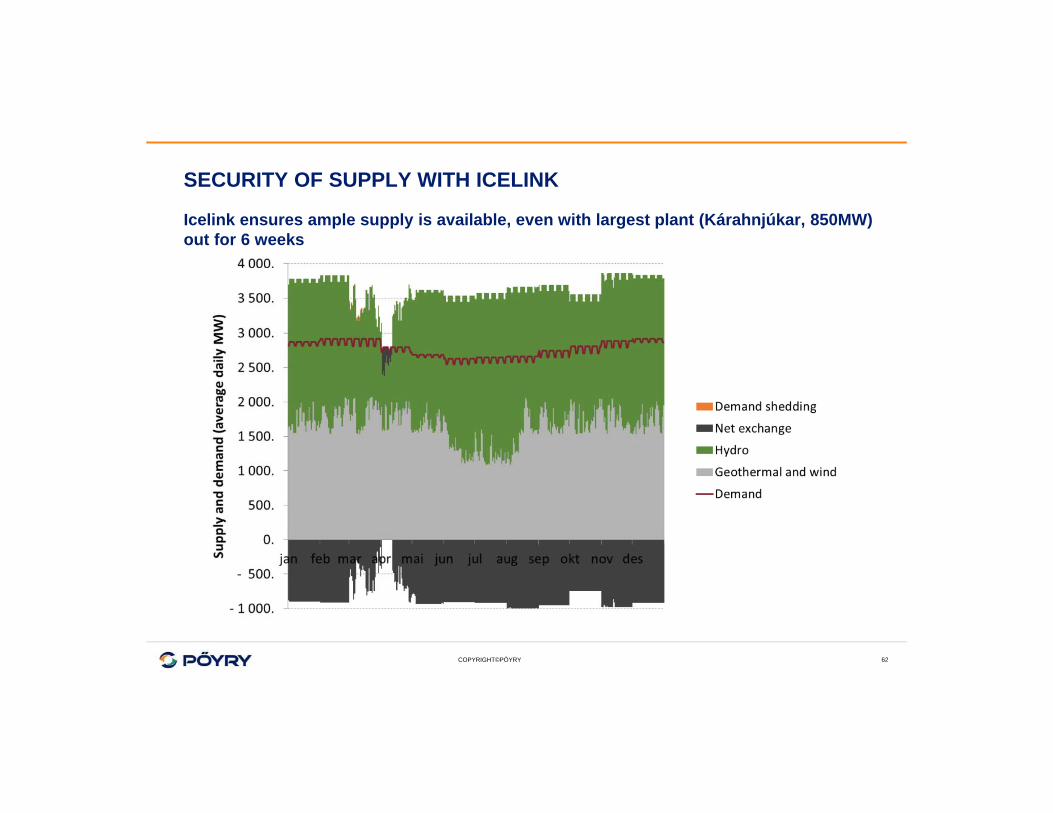
SECURITY OF SUPPLY WITH ICELINK
Icelink ensures ample supply is available, even with largest plant (Kárahnjúkar, 850MW) out for 6 weeks
62
COPYRIGHT©PÖYRY
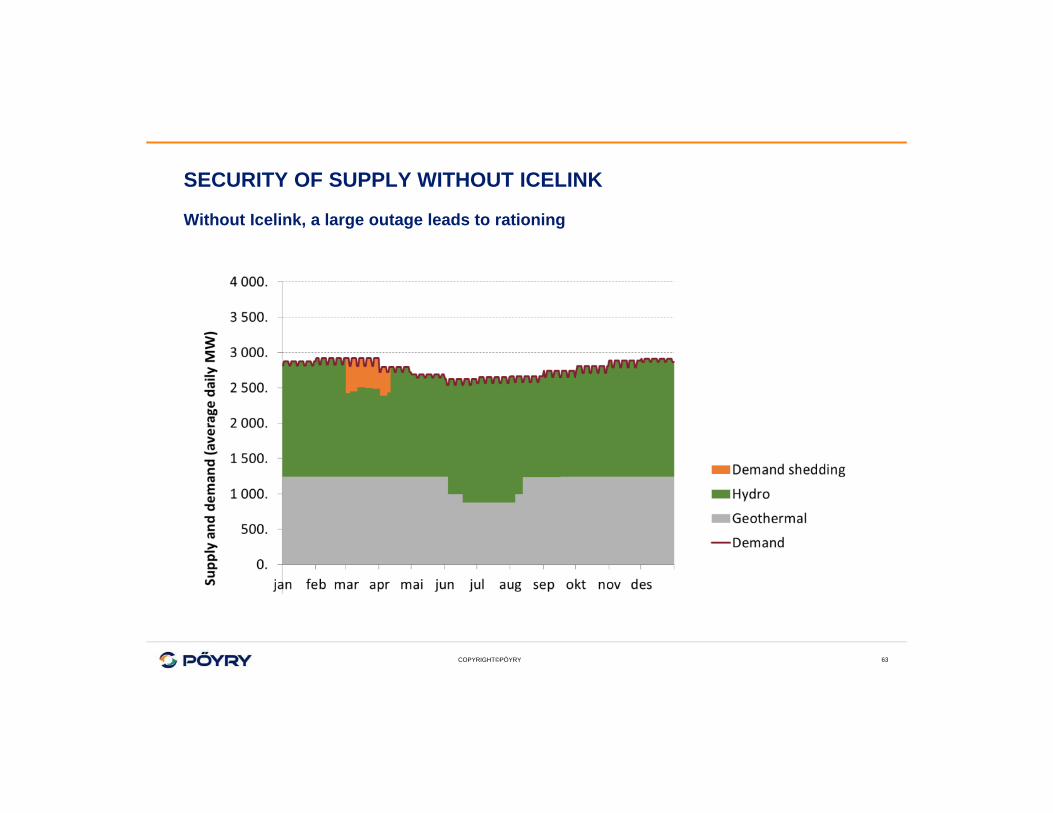
SECURITY OF SUPPLY WITHOUT ICELINK
Without Icelink, a large outage leads to rationing
63
COPYRIGHT©PÖYRY 64
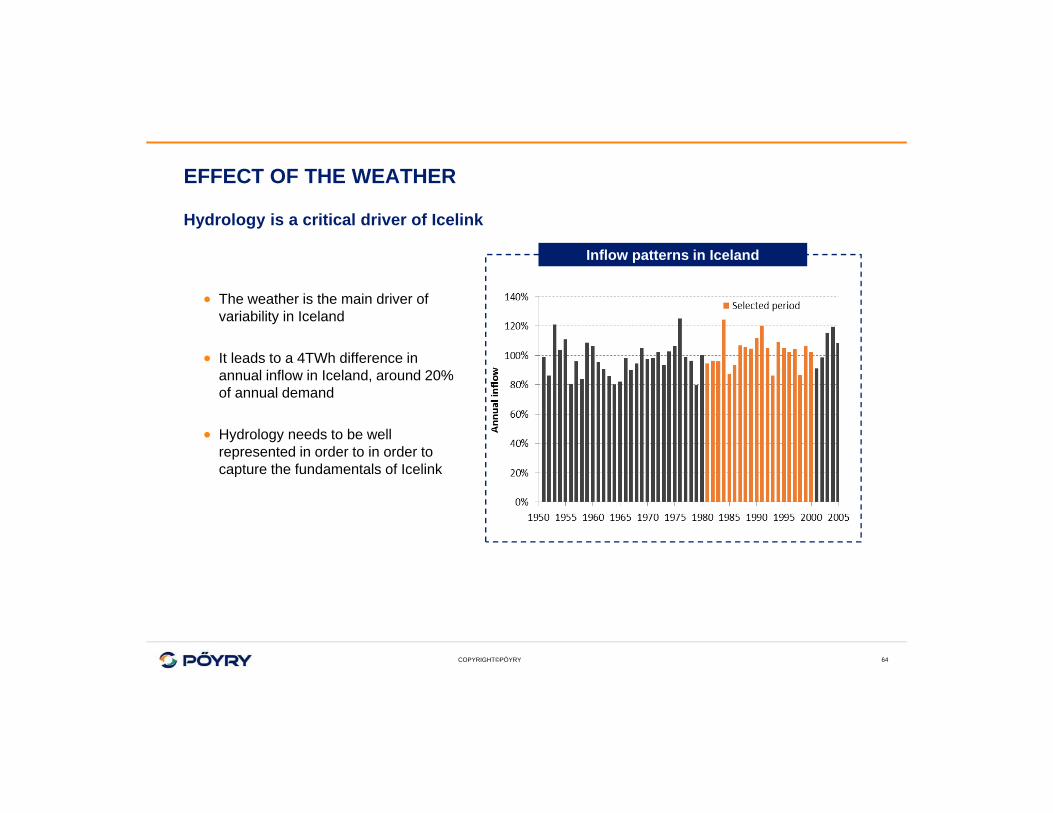
EFFECT OF THE WEATHER
Hydrology is a critical driver of Icelink
The weather is the main driver of variability in Iceland
It leads to a 4TWh difference in annual inflow in Iceland, around 20% of annual demand
Hydrology needs to be well represented in order to in order to capture the fundamentals of Icelink
Inflow patterns in Iceland
COPYRIGHT©PÖYRY
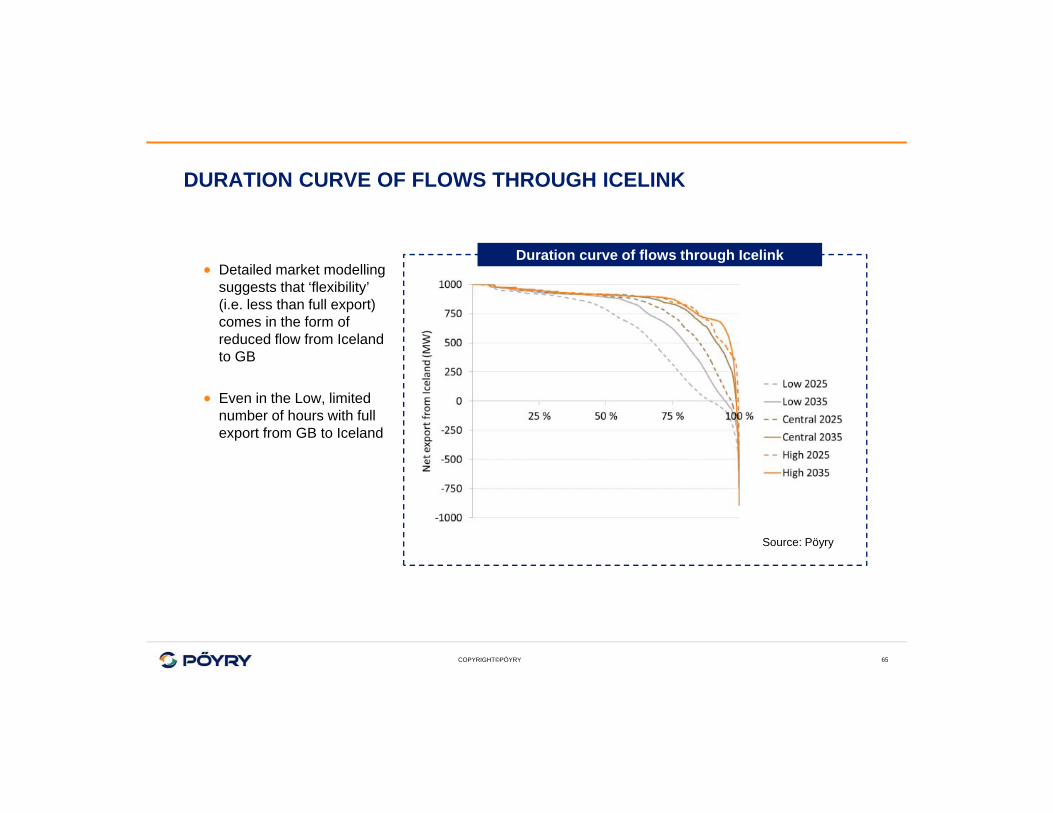
DURATION CURVE OF FLOWS THROUGH ICELINK
Detailed market modelling suggests that ‘flexibility’ (i.e. less than full export) comes in the form of reduced flow from Iceland to GB
Even in the Low, limited number of hours with full export from GB to Iceland
Duration curve of flows through Icelink
Source: Pöyry
65
COPYRIGHT©PÖYRY 66
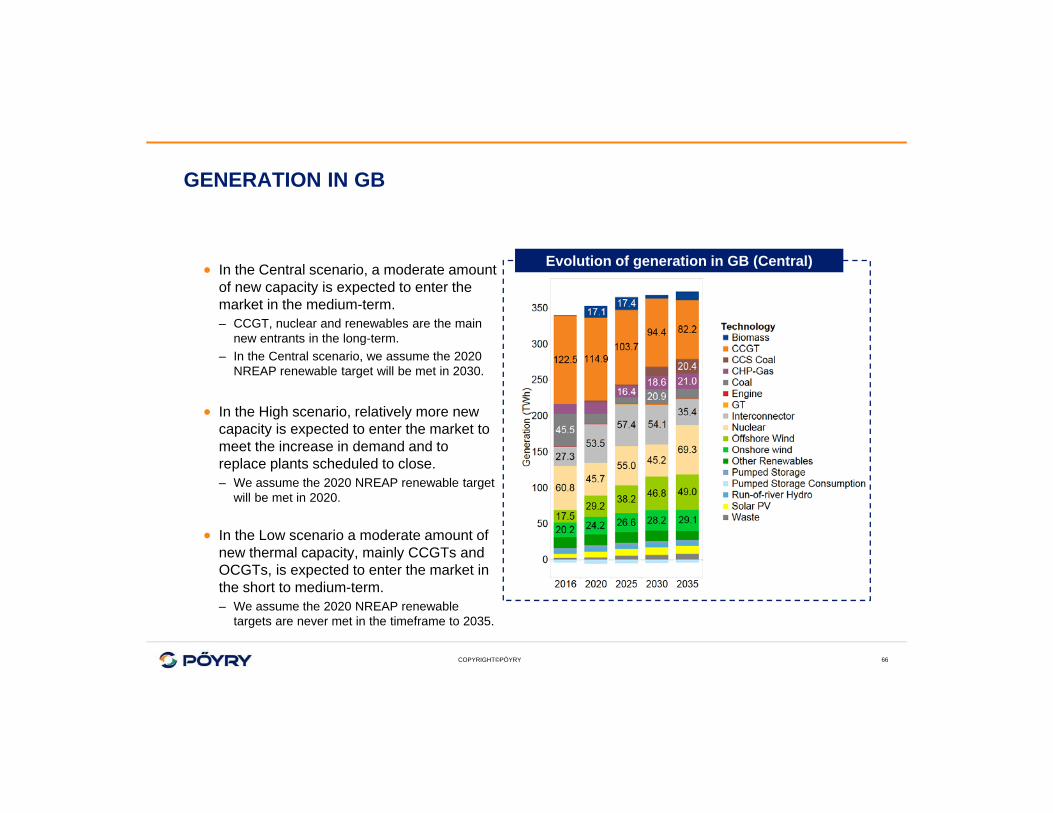
GENERATION IN GB
In the Central scenario, a moderate amount of new capacity is expected to enter the market in the medium-term.– CCGT, nuclear and renewables are the main
new entrants in the long-term.– In the Central scenario, we assume the 2020
NREAP renewable target will be met in 2030.
In the High scenario, relatively more new capacity is expected to enter the market to meet the increase in demand and to replace plants scheduled to close. – We assume the 2020 NREAP renewable target
will be met in 2020.
In the Low scenario a moderate amount of new thermal capacity, mainly CCGTs and OCGTs, is expected to enter the market in the short to medium-term.– We assume the 2020 NREAP renewable
targets are never met in the timeframe to 2035.
Evolution of generation in GB (Central)