Embed Size (px)
Citation preview
(all figures in EUR millions unless stated otherwise)
AMREST GROUP INTERIM REPORT for 9 months ended 30 September 2021 1
Interim Report for Q3 2021 AmRest Holdings SE capital group
10 NOVEMBER 2021

(all figures in EUR millions unless stated otherwise)
AMREST GROUP INTERIM REPORT for 9 months ended 30 September 2021 2
(all figures in EUR millions unless stated otherwise)
AMREST GROUP INTERIM REPORT for 9 months ended 30 September 2021 3
Contents
3 AMREST GROUP INTERIM REPORT for 9 months ended 30 September 2021
Financial highlights (consolidated data) 5
Part A. Directors’ Report for Q3 2021 6
Part B. Condensed Consolidated Interim Financial Statements for Q3 2021 16

(all figures in EUR millions unless stated otherwise)
AMREST GROUP INTERIM REPORT for 9 months ended 30 September 2021 4
Hig
hlig
hts
(all figures in EUR millions unless stated otherwise)
AMREST GROUP INTERIM REPORT for 9 months ended 30 September 2021 5
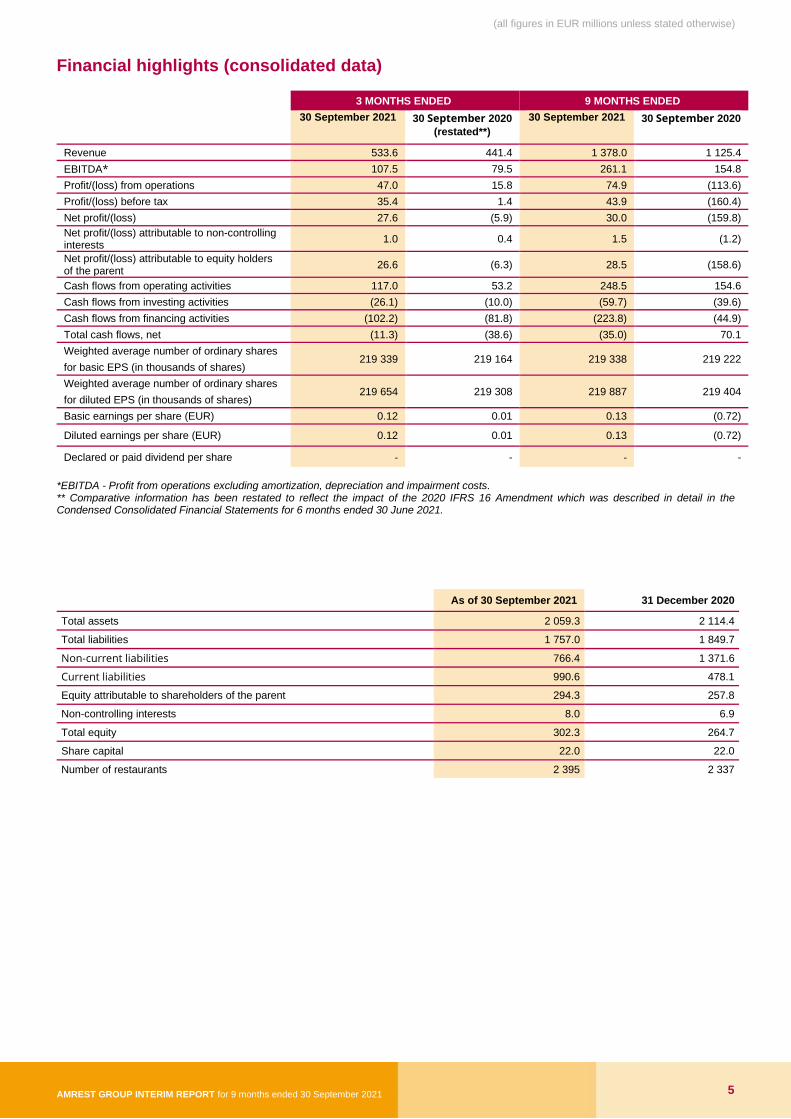
Financial highlights (consolidated data)
3 MONTHS ENDED 9 MONTHS ENDED
30 September 2021 30 September 2020
(restated**)
30 September 2021 30 September 2020
Revenue 533.6 441.4 1 378.0 1 125.4
EBITDA* 107.5 79.5 261.1 154.8
Profit/(loss) from operations 47.0 15.8 74.9 (113.6)
Profit/(loss) before tax 35.4 1.4 43.9 (160.4)
Net profit/(loss) 27.6 (5.9) 30.0 (159.8)
Net profit/(loss) attributable to non-controlling interests
1.0 0.4 1.5 (1.2)
Net profit/(loss) attributable to equity holders of the parent
26.6 (6.3) 28.5 (158.6)
Cash flows from operating activities 117.0 53.2 248.5 154.6
Cash flows from investing activities (26.1) (10.0) (59.7) (39.6)
Cash flows from financing activities (102.2) (81.8) (223.8) (44.9)
Total cash flows, net (11.3) (38.6) (35.0) 70.1
Weighted average number of ordinary shares 219 339 219 164 219 338 219 222
for basic EPS (in thousands of shares)
Weighted average number of ordinary shares 219 654 219 308 219 887 219 404
for diluted EPS (in thousands of shares)
Basic earnings per share (EUR) 0.12 0.01 0.13 (0.72)
Diluted earnings per share (EUR) 0.12 0.01 0.13 (0.72)
Declared or paid dividend per share - - - -
*EBITDA - Profit from operations excluding amortization, depreciation and impairment costs. ** Comparative information has been restated to reflect the impact of the 2020 IFRS 16 Amendment which was described in detail in the Condensed Consolidated Financial Statements for 6 months ended 30 June 2021.
As of 30 September 2021 31 December 2020
Total assets 2 059.3 2 114.4
Total liabilities 1 757.0 1 849.7
Non-current liabilities 766.4 1 371.6
Current liabilities 990.6 478.1
Equity attributable to shareholders of the parent 294.3 257.8
Non-controlling interests 8.0 6.9
Total equity 302.3 264.7
Share capital 22.0 22.0
Number of restaurants 2 395 2 337
(all figures in EUR millions unless stated otherwise)
AMREST GROUP INTERIM REPORT for 9 months ended 30 September 2021 6
Part A. Directors’ Report for Q3 2021
AMREST GROUP INTERIM REPORT for 9 months ended 30 September 2021 6
Part A. Directors’ Report for Q3 2021
The Group’s performance in Q3 2021 7
Significant events and transactions in Q3 2021 (till the date of publication of this Report) 14
Changes in the Company’s Governing Bodies 14
Dividends paid during the period covered by this Report 14
Shareholders of AmRest Holdings SE 14
Changes in the number of shares held by members of the Board of Directors 14
Transactions on AmRest shares concluded for the purpose of executing the management option plan 15
Forecasts of financial results 15
(all figures in EUR millions unless stated otherwise)
AMREST GROUP INTERIM REPORT for 9 months ended 30 September 2021 7
The Group’s performance in Q3 2021
Group Revenues and Profitability
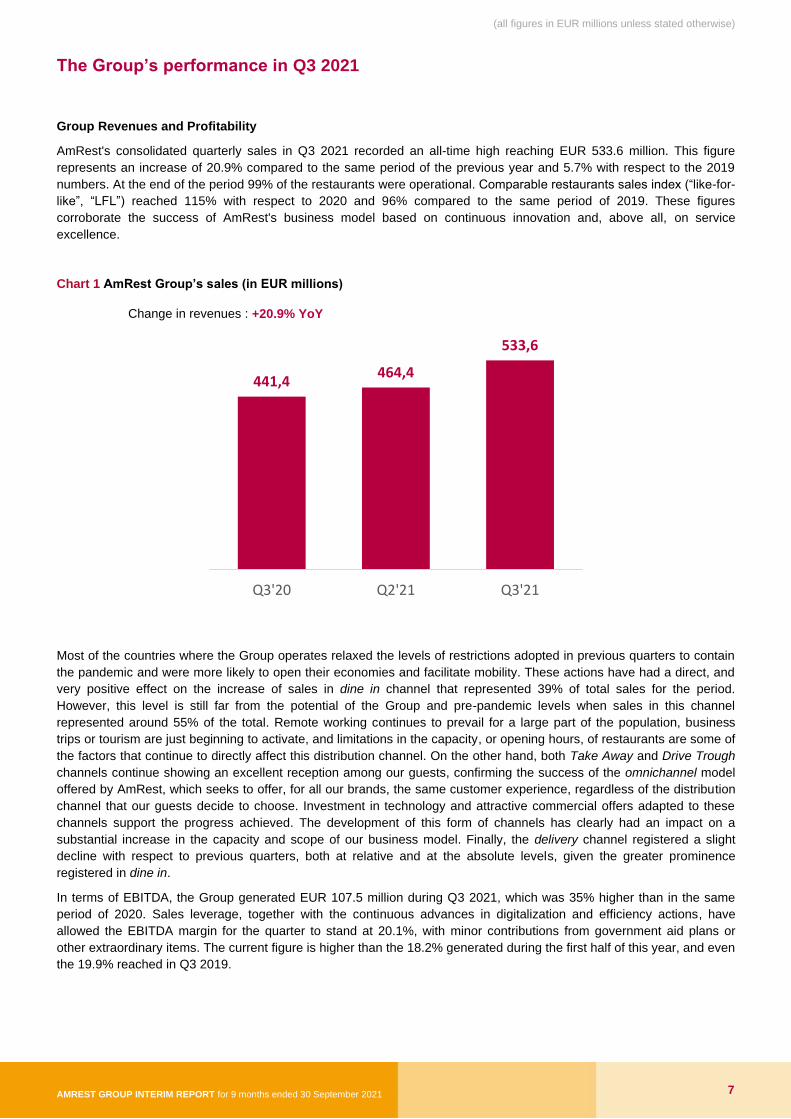
AmRest's consolidated quarterly sales in Q3 2021 recorded an all-time high reaching EUR 533.6 million. This figure
represents an increase of 20.9% compared to the same period of the previous year and 5.7% with respect to the 2019
numbers. At the end of the period 99% of the restaurants were operational. Comparable restaurants sales index (“like-for-
like”, “LFL”) reached 115% with respect to 2020 and 96% compared to the same period of 2019. These figures
corroborate the success of AmRest's business model based on continuous innovation and, above all, on service
excellence.
Chart 1 AmRest Group’s sales (in EUR millions)
Most of the countries where the Group operates relaxed the levels of restrictions adopted in previous quarters to contain
the pandemic and were more likely to open their economies and facilitate mobility. These actions have had a direct, and
very positive effect on the increase of sales in dine in channel that represented 39% of total sales for the period.
However, this level is still far from the potential of the Group and pre-pandemic levels when sales in this channel
represented around 55% of the total. Remote working continues to prevail for a large part of the population, business
trips or tourism are just beginning to activate, and limitations in the capacity, or opening hours, of restaurants are some of
the factors that continue to directly affect this distribution channel. On the other hand, both Take Away and Drive Trough
channels continue showing an excellent reception among our guests, confirming the success of the omnichannel model
offered by AmRest, which seeks to offer, for all our brands, the same customer experience, regardless of the distribution
channel that our guests decide to choose. Investment in technology and attractive commercial offers adapted to these
channels support the progress achieved. The development of this form of channels has clearly had an impact on a
substantial increase in the capacity and scope of our business model. Finally, the delivery channel registered a slight
decline with respect to previous quarters, both at relative and at the absolute levels, given the greater prominence
registered in dine in.
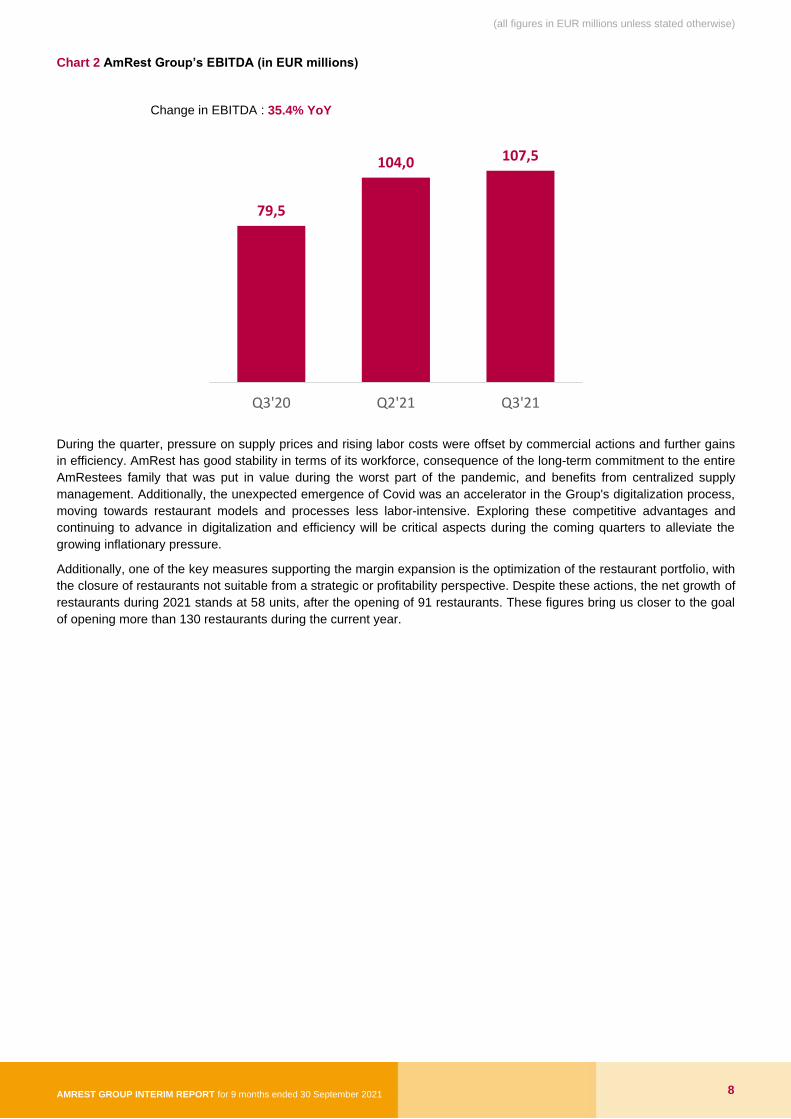
In terms of EBITDA, the Group generated EUR 107.5 million during Q3 2021, which was 35% higher than in the same
period of 2020. Sales leverage, together with the continuous advances in digitalization and efficiency actions, have
allowed the EBITDA margin for the quarter to stand at 20.1%, with minor contributions from government aid plans or
other extraordinary items. The current figure is higher than the 18.2% generated during the first half of this year, and even
the 19.9% reached in Q3 2019.
441,4464,4
533,6
Q3'20 Q2'21 Q3'21
Change in revenues : +20.9% YoY
(all figures in EUR millions unless stated otherwise)
AMREST GROUP INTERIM REPORT for 9 months ended 30 September 2021 8
Chart 2 AmRest Group’s EBITDA (in EUR millions)
During the quarter, pressure on supply prices and rising labor costs were offset by commercial actions and further gains
in efficiency. AmRest has good stability in terms of its workforce, consequence of the long-term commitment to the entire
AmRestees family that was put in value during the worst part of the pandemic, and benefits from centralized supply
management. Additionally, the unexpected emergence of Covid was an accelerator in the Group's digitalization process,
moving towards restaurant models and processes less labor-intensive. Exploring these competitive advantages and
continuing to advance in digitalization and efficiency will be critical aspects during the coming quarters to alleviate the
growing inflationary pressure.
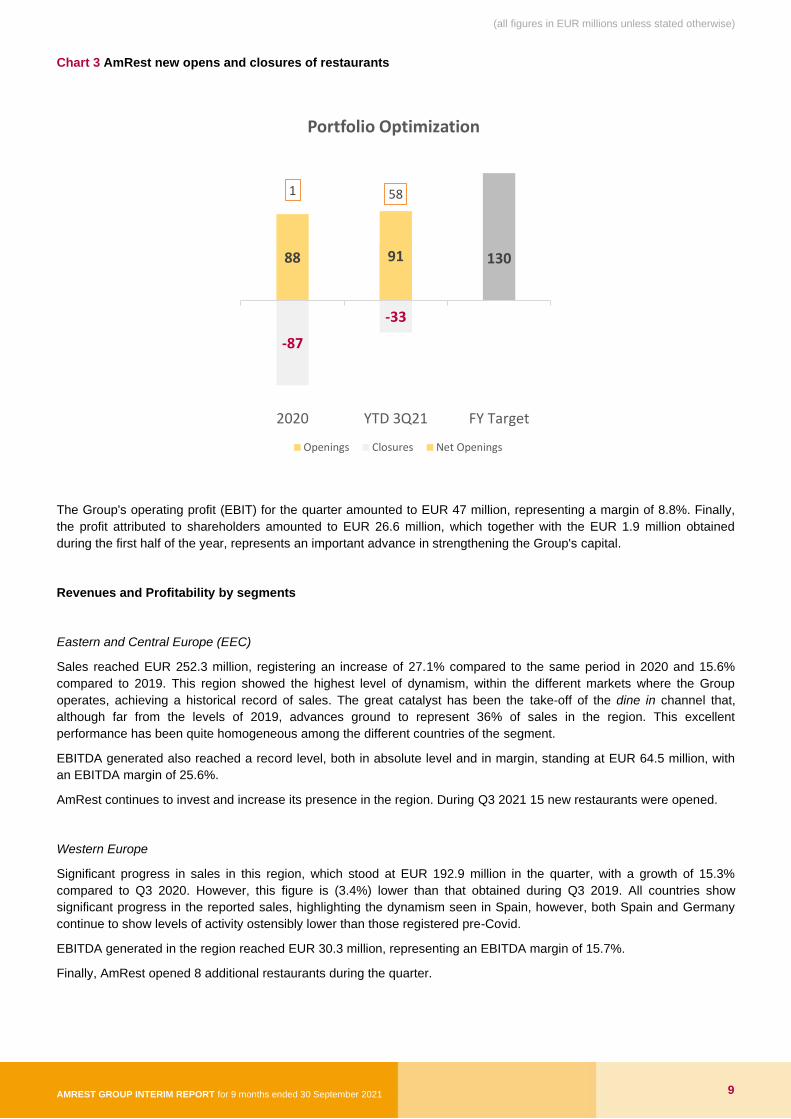
Additionally, one of the key measures supporting the margin expansion is the optimization of the restaurant portfolio, with
the closure of restaurants not suitable from a strategic or profitability perspective. Despite these actions, the net growth of
restaurants during 2021 stands at 58 units, after the opening of 91 restaurants. These figures bring us closer to the goal
of opening more than 130 restaurants during the current year.
79,5
104,0 107,5
Q3'20 Q2'21 Q3'21
Change in EBITDA : 35.4% YoY
(all figures in EUR millions unless stated otherwise)
AMREST GROUP INTERIM REPORT for 9 months ended 30 September 2021 9
Chart 3 AmRest new opens and closures of restaurants
The Group's operating profit (EBIT) for the quarter amounted to EUR 47 million, representing a margin of 8.8%. Finally,
the profit attributed to shareholders amounted to EUR 26.6 million, which together with the EUR 1.9 million obtained
during the first half of the year, represents an important advance in strengthening the Group's capital.
Revenues and Profitability by segments
Eastern and Central Europe (EEC)
Sales reached EUR 252.3 million, registering an increase of 27.1% compared to the same period in 2020 and 15.6%
compared to 2019. This region showed the highest level of dynamism, within the different markets where the Group
operates, achieving a historical record of sales. The great catalyst has been the take-off of the dine in channel that,
although far from the levels of 2019, advances ground to represent 36% of sales in the region. This excellent
performance has been quite homogeneous among the different countries of the segment.
EBITDA generated also reached a record level, both in absolute level and in margin, standing at EUR 64.5 million, with
an EBITDA margin of 25.6%.
AmRest continues to invest and increase its presence in the region. During Q3 2021 15 new restaurants were opened.
Western Europe
Significant progress in sales in this region, which stood at EUR 192.9 million in the quarter, with a growth of 15.3%
compared to Q3 2020. However, this figure is (3.4%) lower than that obtained during Q3 2019. All countries show
significant progress in the reported sales, highlighting the dynamism seen in Spain, however, both Spain and Germany
continue to show levels of activity ostensibly lower than those registered pre-Covid.
EBITDA generated in the region reached EUR 30.3 million, representing an EBITDA margin of 15.7%.
Finally, AmRest opened 8 additional restaurants during the quarter.
88 91 130
-87
-33
1 58
2020 YTD 3Q21 FY Target
Portfolio Optimization
Openings Closures Net Openings
(all figures in EUR millions unless stated otherwise)
AMREST GROUP INTERIM REPORT for 9 months ended 30 September 2021 10
Russia
Good commercial results in Russia with a sales balance of EUR 50.9 million during the third quarter of the year. This
figure is 19.1% higher than the registered in 2020 but still (7.4%) lower than 2019 figure. The continuous increase
registered in the Take Away channel stands out. EBITDA generated in the region stood at EUR 10.8 million, with a
margin of 21.2%.
During the quarter, 7 new restaurants were opened in the region.
China
New historical record of quarterly sales in Q3 2021, after increasing sales by 2.5% compared to the previous quarter that
constituted the previous record. The sales amounted to EUR 27.3 million and is 10.3% higher than that obtained in the
same period of 2020. The level of EBITDA generated stood at EUR 8.4 million, representing an EBITDA margin of
30.8%.
The total number of restaurants in the region increased to 78 following the opening of two new franchises during the
quarter.
Cash Flow generation and CAPEX
AmRest continued with a strong cash flow generation from its operating activities during the quarter that reached EUR
117.0 million and enabled to fund EUR 23.3 million of CAPEX, meet its financial commitments and accelerate the
Group's deleveraging.
Debt and liquidity
As of the end of the third quarter, net financial debt (ex IFRS16) stands at EUR 490.8 million, after the repayment of EUR
57 million covering the scheduled maturities of the syndicated bank loans. On the other hand, cash amounts to EUR
172.6 million. The decrease in debt and increase in revenues allow the leverage ratio¹ to stand at 3.2 from 4.4 in 2Q2021.
These figures allow AmRest to comply with its valid liquidity covenant at the end of the 3Q2021, that demands liquidity in
excess of EUR 50 million, and in advance with the two additional financial covenants that it will have to face at the end of
the fourth quarter: leverage ratio 1< 3.5 and interest coverage >3.5.
1 Leverage ratio defined as Net Debt/EBITDA. EBITDA calculated according to the financing agreements with the banks.
(all figures in EUR millions unless stated otherwise)
AMREST GROUP INTERIM REPORT for 9 months ended 30 September 2021 11
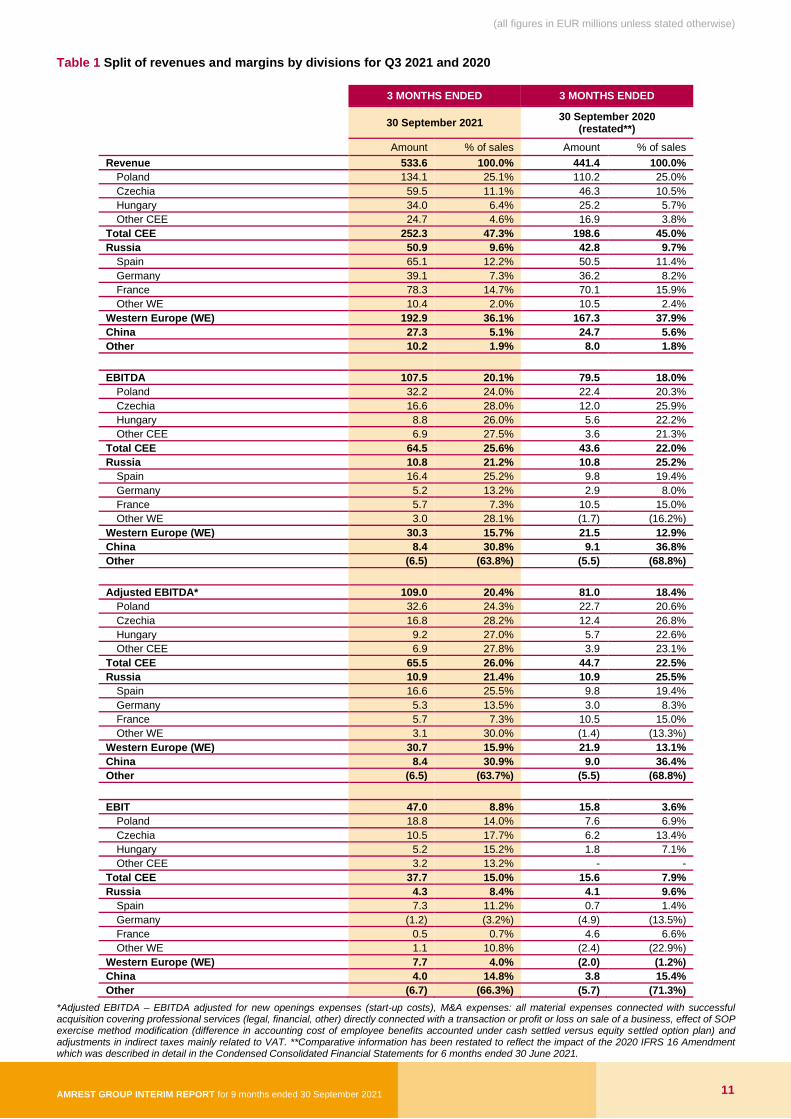
Table 1 Split of revenues and margins by divisions for Q3 2021 and 2020
3 MONTHS ENDED 3 MONTHS ENDED
30 September 2021 30 September 2020
(restated**)
Amount % of sales Amount % of sales
Revenue 533.6 100.0% 441.4 100.0%
Poland 134.1 25.1% 110.2 25.0%
Czechia 59.5 11.1% 46.3 10.5%
Hungary 34.0 6.4% 25.2 5.7%
Other CEE 24.7 4.6% 16.9 3.8%
Total CEE 252.3 47.3% 198.6 45.0%
Russia 50.9 9.6% 42.8 9.7%
Spain 65.1 12.2% 50.5 11.4%
Germany 39.1 7.3% 36.2 8.2%
France 78.3 14.7% 70.1 15.9%
Other WE 10.4 2.0% 10.5 2.4%
Western Europe (WE) 192.9 36.1% 167.3 37.9%
China 27.3 5.1% 24.7 5.6%
Other 10.2 1.9% 8.0 1.8%
EBITDA 107.5 20.1% 79.5 18.0%
Poland 32.2 24.0% 22.4 20.3%
Czechia 16.6 28.0% 12.0 25.9%
Hungary 8.8 26.0% 5.6 22.2%
Other CEE 6.9 27.5% 3.6 21.3%
Total CEE 64.5 25.6% 43.6 22.0%
Russia 10.8 21.2% 10.8 25.2%
Spain 16.4 25.2% 9.8 19.4%
Germany 5.2 13.2% 2.9 8.0%
France 5.7 7.3% 10.5 15.0%
Other WE 3.0 28.1% (1.7) (16.2%)
Western Europe (WE) 30.3 15.7% 21.5 12.9%
China 8.4 30.8% 9.1 36.8%
Other (6.5) (63.8%) (5.5) (68.8%)
Adjusted EBITDA* 109.0 20.4% 81.0 18.4%
Poland 32.6 24.3% 22.7 20.6%
Czechia 16.8 28.2% 12.4 26.8%
Hungary 9.2 27.0% 5.7 22.6%
Other CEE 6.9 27.8% 3.9 23.1%
Total CEE 65.5 26.0% 44.7 22.5%
Russia 10.9 21.4% 10.9 25.5%
Spain 16.6 25.5% 9.8 19.4%
Germany 5.3 13.5% 3.0 8.3%
France 5.7 7.3% 10.5 15.0%
Other WE 3.1 30.0% (1.4) (13.3%)
Western Europe (WE) 30.7 15.9% 21.9 13.1%
China 8.4 30.9% 9.0 36.4%
Other (6.5) (63.7%) (5.5) (68.8%)
EBIT 47.0 8.8% 15.8 3.6%
Poland 18.8 14.0% 7.6 6.9%
Czechia 10.5 17.7% 6.2 13.4%
Hungary 5.2 15.2% 1.8 7.1%
Other CEE 3.2 13.2% - -
Total CEE 37.7 15.0% 15.6 7.9%
Russia 4.3 8.4% 4.1 9.6%
Spain 7.3 11.2% 0.7 1.4%
Germany (1.2) (3.2%) (4.9) (13.5%)
France 0.5 0.7% 4.6 6.6%
Other WE 1.1 10.8% (2.4) (22.9%)
Western Europe (WE) 7.7 4.0% (2.0) (1.2%)
China 4.0 14.8% 3.8 15.4%
Other (6.7) (66.3%) (5.7) (71.3%)
*Adjusted EBITDA – EBITDA adjusted for new openings expenses (start-up costs), M&A expenses: all material expenses connected with successful acquisition covering professional services (legal, financial, other) directly connected with a transaction or profit or loss on sale of a business, effect of SOP exercise method modification (difference in accounting cost of employee benefits accounted under cash settled versus equity settled option plan) and adjustments in indirect taxes mainly related to VAT. **Comparative information has been restated to reflect the impact of the 2020 IFRS 16 Amendment which was described in detail in the Condensed Consolidated Financial Statements for 6 months ended 30 June 2021.
(all figures in EUR millions unless stated otherwise)
AMREST GROUP INTERIM REPORT for 9 months ended 30 September 2021 12
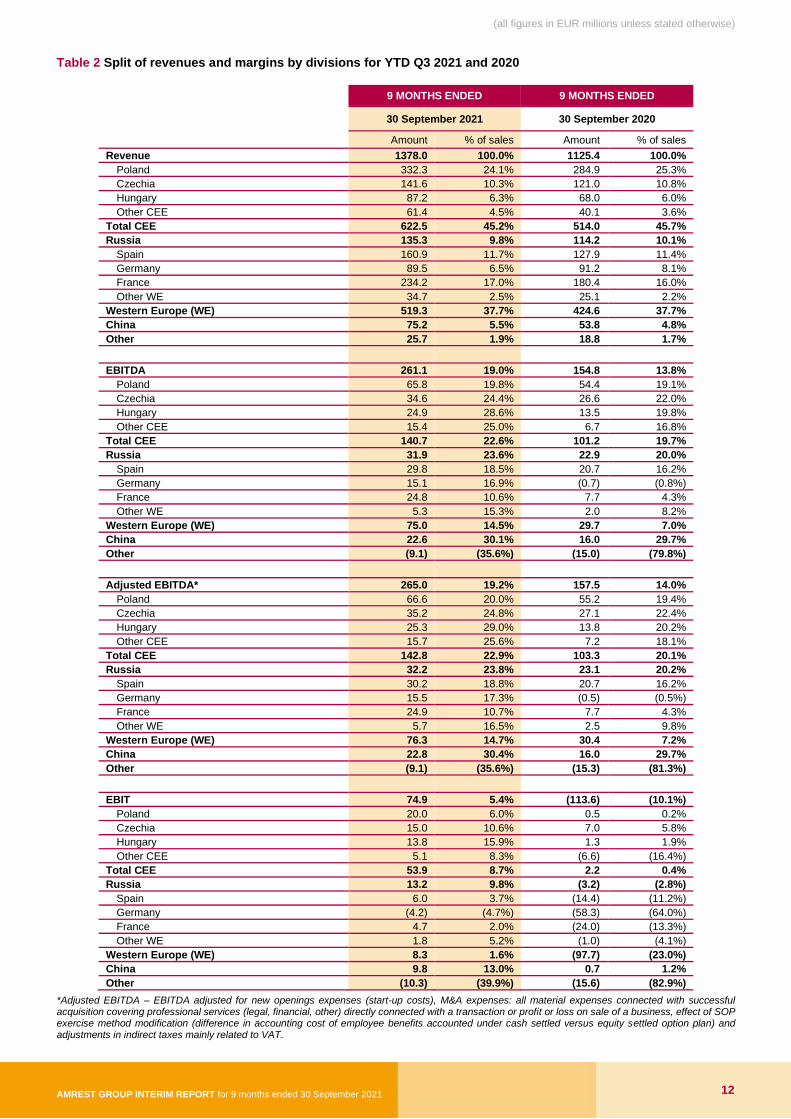
Table 2 Split of revenues and margins by divisions for YTD Q3 2021 and 2020
9 MONTHS ENDED 9 MONTHS ENDED
30 September 2021 30 September 2020
Amount % of sales Amount % of sales
Revenue 1378.0 100.0% 1125.4 100.0%
Poland 332.3 24.1% 284.9 25.3%
Czechia 141.6 10.3% 121.0 10.8%
Hungary 87.2 6.3% 68.0 6.0%
Other CEE 61.4 4.5% 40.1 3.6%
Total CEE 622.5 45.2% 514.0 45.7%
Russia 135.3 9.8% 114.2 10.1%
Spain 160.9 11.7% 127.9 11.4%
Germany 89.5 6.5% 91.2 8.1%
France 234.2 17.0% 180.4 16.0%
Other WE 34.7 2.5% 25.1 2.2%
Western Europe (WE) 519.3 37.7% 424.6 37.7%
China 75.2 5.5% 53.8 4.8%
Other 25.7 1.9% 18.8 1.7%
EBITDA 261.1 19.0% 154.8 13.8%
Poland 65.8 19.8% 54.4 19.1%
Czechia 34.6 24.4% 26.6 22.0%
Hungary 24.9 28.6% 13.5 19.8%
Other CEE 15.4 25.0% 6.7 16.8%
Total CEE 140.7 22.6% 101.2 19.7%
Russia 31.9 23.6% 22.9 20.0%
Spain 29.8 18.5% 20.7 16.2%
Germany 15.1 16.9% (0.7) (0.8%)
France 24.8 10.6% 7.7 4.3%
Other WE 5.3 15.3% 2.0 8.2%
Western Europe (WE) 75.0 14.5% 29.7 7.0%
China 22.6 30.1% 16.0 29.7%
Other (9.1) (35.6%) (15.0) (79.8%)
Adjusted EBITDA* 265.0 19.2% 157.5 14.0%
Poland 66.6 20.0% 55.2 19.4%
Czechia 35.2 24.8% 27.1 22.4%
Hungary 25.3 29.0% 13.8 20.2%
Other CEE 15.7 25.6% 7.2 18.1%
Total CEE 142.8 22.9% 103.3 20.1%
Russia 32.2 23.8% 23.1 20.2%
Spain 30.2 18.8% 20.7 16.2%
Germany 15.5 17.3% (0.5) (0.5%)
France 24.9 10.7% 7.7 4.3%
Other WE 5.7 16.5% 2.5 9.8%
Western Europe (WE) 76.3 14.7% 30.4 7.2%
China 22.8 30.4% 16.0 29.7%
Other (9.1) (35.6%) (15.3) (81.3%)
EBIT 74.9 5.4% (113.6) (10.1%)
Poland 20.0 6.0% 0.5 0.2%
Czechia 15.0 10.6% 7.0 5.8%
Hungary 13.8 15.9% 1.3 1.9%
Other CEE 5.1 8.3% (6.6) (16.4%)
Total CEE 53.9 8.7% 2.2 0.4%
Russia 13.2 9.8% (3.2) (2.8%)
Spain 6.0 3.7% (14.4) (11.2%)
Germany (4.2) (4.7%) (58.3) (64.0%)
France 4.7 2.0% (24.0) (13.3%)
Other WE 1.8 5.2% (1.0) (4.1%)
Western Europe (WE) 8.3 1.6% (97.7) (23.0%)
China 9.8 13.0% 0.7 1.2%
Other (10.3) (39.9%) (15.6) (82.9%)
*Adjusted EBITDA – EBITDA adjusted for new openings expenses (start-up costs), M&A expenses: all material expenses connected with successful acquisition covering professional services (legal, financial, other) directly connected with a transaction or profit or loss on sale of a business, effect of SOP exercise method modification (difference in accounting cost of employee benefits accounted under cash settled versus equity settled option plan) and adjustments in indirect taxes mainly related to VAT.
(all figures in EUR millions unless stated otherwise)
AMREST GROUP INTERIM REPORT for 9 months ended 30 September 2021 13
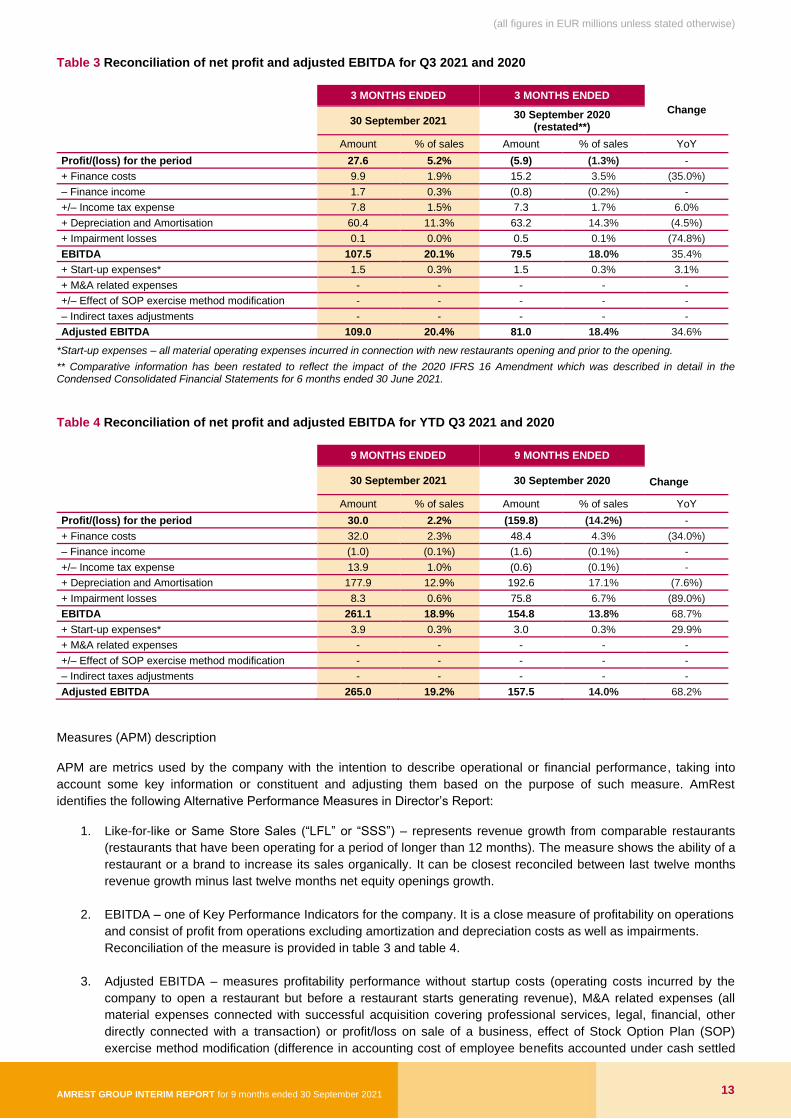
Table 3 Reconciliation of net profit and adjusted EBITDA for Q3 2021 and 2020
3 MONTHS ENDED 3 MONTHS ENDED
Change 30 September 2021
30 September 2020 (restated**)
Amount % of sales Amount % of sales YoY
Profit/(loss) for the period 27.6 5.2% (5.9) (1.3%) -
+ Finance costs 9.9 1.9% 15.2 3.5% (35.0%)
– Finance income 1.7 0.3% (0.8) (0.2%) -
+/– Income tax expense 7.8 1.5% 7.3 1.7% 6.0%
+ Depreciation and Amortisation 60.4 11.3% 63.2 14.3% (4.5%)
+ Impairment losses 0.1 0.0% 0.5 0.1% (74.8%)
EBITDA 107.5 20.1% 79.5 18.0% 35.4%
+ Start-up expenses* 1.5 0.3% 1.5 0.3% 3.1%
+ M&A related expenses - - - - -
+/– Effect of SOP exercise method modification - - - - -
– Indirect taxes adjustments - - - - -
Adjusted EBITDA 109.0 20.4% 81.0 18.4% 34.6%
*Start-up expenses – all material operating expenses incurred in connection with new restaurants opening and prior to the opening.
** Comparative information has been restated to reflect the impact of the 2020 IFRS 16 Amendment which was described in detail in the Condensed Consolidated Financial Statements for 6 months ended 30 June 2021.
Table 4 Reconciliation of net profit and adjusted EBITDA for YTD Q3 2021 and 2020
9 MONTHS ENDED 9 MONTHS ENDED
Change 30 September 2021 30 September 2020
Amount % of sales Amount % of sales YoY
Profit/(loss) for the period 30.0 2.2% (159.8) (14.2%) -
+ Finance costs 32.0 2.3% 48.4 4.3% (34.0%)
– Finance income (1.0) (0.1%) (1.6) (0.1%) -
+/– Income tax expense 13.9 1.0% (0.6) (0.1%) -
+ Depreciation and Amortisation 177.9 12.9% 192.6 17.1% (7.6%)
+ Impairment losses 8.3 0.6% 75.8 6.7% (89.0%)
EBITDA 261.1 18.9% 154.8 13.8% 68.7%
+ Start-up expenses* 3.9 0.3% 3.0 0.3% 29.9%
+ M&A related expenses - - - - -
+/– Effect of SOP exercise method modification - - - - -
– Indirect taxes adjustments - - - - -
Adjusted EBITDA 265.0 19.2% 157.5 14.0% 68.2%
Measures (APM) description
APM are metrics used by the company with the intention to describe operational or financial performance, taking into
account some key information or constituent and adjusting them based on the purpose of such measure. AmRest
identifies the following Alternative Performance Measures in Director’s Report:
1. Like-for-like or Same Store Sales (“LFL” or “SSS”) – represents revenue growth from comparable restaurants
(restaurants that have been operating for a period of longer than 12 months). The measure shows the ability of a
restaurant or a brand to increase its sales organically. It can be closest reconciled between last twelve months
revenue growth minus last twelve months net equity openings growth.
2. EBITDA – one of Key Performance Indicators for the company. It is a close measure of profitability on operations
and consist of profit from operations excluding amortization and depreciation costs as well as impairments.
Reconciliation of the measure is provided in table 3 and table 4.
3. Adjusted EBITDA – measures profitability performance without startup costs (operating costs incurred by the
company to open a restaurant but before a restaurant starts generating revenue), M&A related expenses (all
material expenses connected with successful acquisition covering professional services, legal, financial, other
directly connected with a transaction) or profit/loss on sale of a business, effect of Stock Option Plan (SOP)
exercise method modification (difference in accounting cost of employee benefits accounted under cash settled
(all figures in EUR millions unless stated otherwise)
AMREST GROUP INTERIM REPORT for 9 months ended 30 September 2021 14
versus equity settled option plan) and adjustments in indirect taxes, mainly related to VAT. It allows to present
profitability for restaurants that already generate revenue and without some unusual costs related to M&A, tax
adjustments or accounting adjustments related to SOP. Reconciliation of this APM is provided in table 2.
Significant events and transactions in Q3 2021 (till the date of publication of this Report)
There were no significant events or transactions that occurred in the period covered by this Report.
Changes in the Company’s Governing Bodies
There were no changes in the Company’s Board of Directors that occurred in the period covered by this Report.
As of 30 September 2021 (and simultaneously at the date of publication of this report) the composition of the Board of
Directors was as follows:
■ Mr. José Parés Gutiérrez
■ Mr. Carlos Fernández González
■ Mr. Luis Miguel Álvarez Pérez
■ Ms. Romana Sadurska
■ Mr. Pablo Castilla Reparaz
■ Mr. Emilio Fullaondo Botella
■ Ms. Mónica Cueva Díaz
■ Eduardo Rodríguez-Rovira Rodríguez (Secretary, non-Board member)
Dividends paid during the period covered by this Report
In the period covered by this Report the Group has paid dividend to non-controlling interest of SCM Sp. z o.o. in the
amount of EUR 0.9 million.
Shareholders of AmRest Holdings SE
Pursuant to the best AmRest’s knowledge as at 30 September 2021 AmRest Holdings had the following shareholder
structure:
Shareholder Number of shares and votes at the
Shareholders’ meeting
% of shares and votes at the
Shareholders’ meeting
FCapital Dutch B. V.* 147 203 760 67.05%
Artal International S.C.A. 11 366 102 5.18%
Nationale-Nederlanden OFE 9 358 214 4.26%
Aviva OFE 6 843 700 3.12%
Other Shareholders 44 782 407 20.40%
* FCapital Dutch B. V. is the sole shareholder of FCapital Lux (holding directly 56 509 547 AmRest shares) and the subsidiary of Finaccess Capital, S.A. de C.V. Grupo Finaccess SAPI de CV is the direct majority shareholder of Finaccess Capital, S.A. de C.V. and a subsidiary of Grupo Far-Luca, S.A. de C.V. The direct majority shareholder of Grupo Far-Luca, S.A. de C.V., Mr. Carlos Fernández González, is a member of AmRest’s Board of Directors.
Changes in the number of shares held by members of the Board of Directors
During the period since 1 July 2021 the following changes occurred with respect to AmRest shares and stock options
held by the members of the Board of Directors of AmRest.
As at 30 June 2021 Mr. Carlos Fernández González (member of the Company’s Board of Directors) held through its
closely associated person, FCapital Dutch B.V., 147 203 760 shares of the Company with a total nominal value of EUR
14 720 376. On 30 September 2021, Mr. Carlos Fernández González still held 147 203 760 AmRest’s shares with a total
nominal value of EUR 14 720 376 through FCapital Dutch B.V.
(all figures in EUR millions unless stated otherwise)
AMREST GROUP INTERIM REPORT for 9 months ended 30 September 2021 15
As at 30 June 2021 Mr. Carlos Fernández González held through his another closely associated person - Finaccess
México, S.A. de C.V., Sociedad Operadora de Fondos de Inversión, 1 172 145 AmRest shares with a total nominal value
of EUR 117 214.5. As at 30 September 2021 he still held through Finaccess México, S.A. de C.V. 1 172 145 AmRest
shares with a total nominal value of EUR 117 214.5. The direct holder of the shares is Latin 10, SA de CV, a fund
independently managed by Finaccess Mexico, S.A. de C.V. (a subsidiary of Grupo Finaccess).
Transactions on AmRest shares concluded for the purpose of executing the management option plan
The commencement of the purchase of treasury shares occurred on the basis of Resolution No. 7 of the General Meeting
of the Company of 19 May 2015 concerning the authorization for the Management Board to acquire treasury shares in
the Company and the establishment of reserve capital and (replacing it) Resolution No. 9 of the General Meeting of the
Company of 6 June 2018 concerning the authorization to the Board of Directors for the derivative acquisition of the
Company’s own shares made directly by the Company or indirectly through its subsidiaries as well as for the sale of the
own shares.
The Company was acquiring the own shares for the purposes of execution of stock option programs: Employee Stock
Option Plan and Management Incentive Plan.
In the period between 1 July 2021 and 30 September 2021, AmRest didn’t purchase any own shares. During the same
period, the Company disposed a total of 60 560 own shares with a total nominal value of EUR 6 056.0 and representing
0.0276% of the share capital to entitled participants of the stock options plans. Disposal transactions under these plans
were executed in three settlement methods, which impacted the sale price. Major part of the shares was transferred to
the participants free of charge. As at 30 September 2021 AmRest held 444 450 own shares with a total nominal value of
EUR 44 445.0 and representing 0.2024% of the share capital.
The subsidiaries of AmRest Holdings SE do not hold any Company’s shares.
Forecasts of financial results The Company has not published any forecasts of financial results. COVID-19 pandemic continues. Significant efforts are
put by governments to mass vaccination programs to succeed and allow to reduce any future infection cycles. Still the
uncertainties exist, and the effects of the pandemic cannot be reliably estimated.
In addition, the management is carefully monitoring the possible impacts derived from the increasing supply cost and the
tightening labor market in many countries.
(all figures in EUR millions unless stated otherwise)
AMREST GROUP INTERIM REPORT for 9 months ended 30 September 2021 16
Part B. Condensed Consolidated Interim Financial Statements for Q3 2021
AMREST GROUP INTERIM REPORT for 9 months ended 30 September 2021 16
16
Condensed consolidated income statement for 9 months ended 30 September 2021 17
Condensed consolidated statement of comprehensive income for 9 months ended 30 September 2021 18
Condensed consolidated statement of financial position as of 30 September 2021 19
Condensed consolidated statement of cash flows for 9 months ended 30 September 2021 20
Condensed consolidated statement of changes in equity for 9 months ended 30 September 2021 21
Notes to condensed consolidated interim report 22
(all figures in EUR millions unless stated otherwise)
AMREST GROUP INTERIM REPORT for 9 months ended 30 September 2021 17
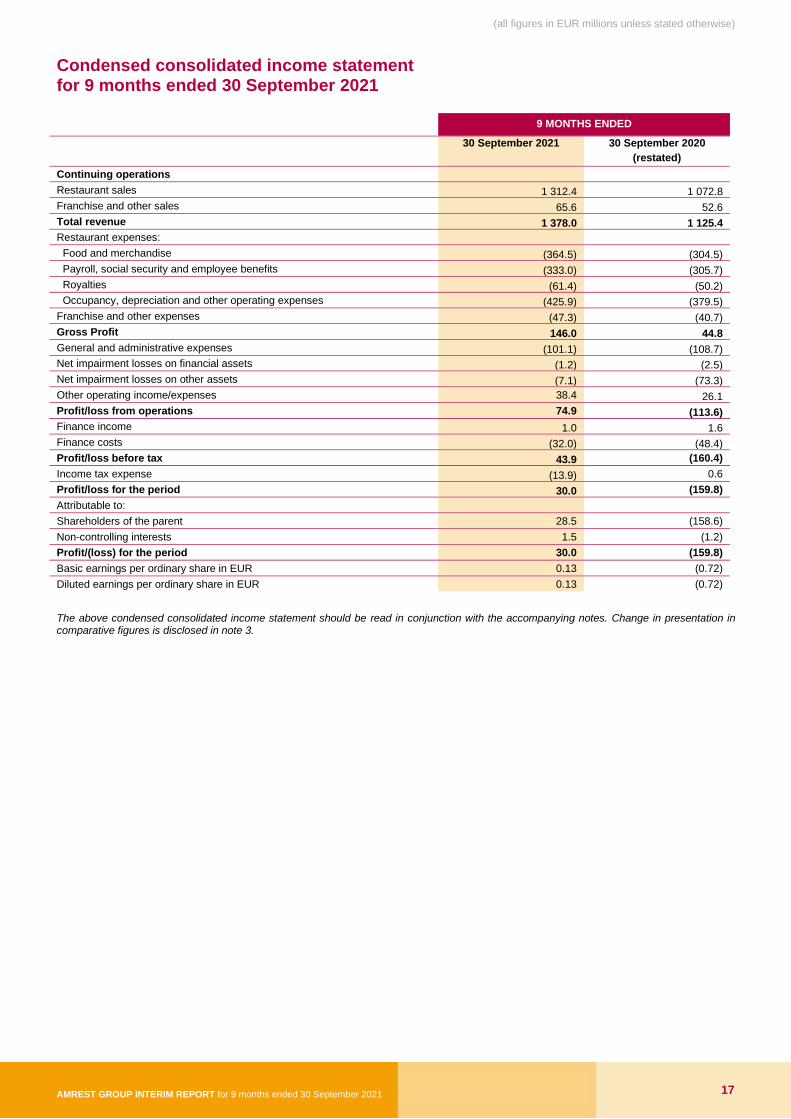
Condensed consolidated income statement for 9 months ended 30 September 2021
9 MONTHS ENDED
30 September 2021
30 September 2020
(restated)
Continuing operations
Restaurant sales 1 312.4 1 072.8
Franchise and other sales 65.6 52.6
Total revenue 1 378.0 1 125.4
Restaurant expenses:
Food and merchandise (364.5) (304.5)
Payroll, social security and employee benefits (333.0) (305.7)
Royalties (61.4) (50.2)
Occupancy, depreciation and other operating expenses (425.9) (379.5)
Franchise and other expenses (47.3) (40.7)
Gross Profit 146.0 44.8
General and administrative expenses (101.1) (108.7)
Net impairment losses on financial assets (1.2) (2.5)
Net impairment losses on other assets (7.1) (73.3)
Other operating income/expenses 38.4 26.1
Profit/loss from operations 74.9 (113.6)
Finance income 1.0 1.6
Finance costs (32.0) (48.4)
Profit/loss before tax 43.9 (160.4)
Income tax expense (13.9) 0.6
Profit/loss for the period 30.0 (159.8)
Attributable to:
Shareholders of the parent 28.5 (158.6)
Non-controlling interests 1.5 (1.2)
Profit/(loss) for the period 30.0 (159.8)
Basic earnings per ordinary share in EUR 0.13 (0.72)
Diluted earnings per ordinary share in EUR 0.13 (0.72)
The above condensed consolidated income statement should be read in conjunction with the accompanying notes. Change in presentation in comparative figures is disclosed in note 3.
(all figures in EUR millions unless stated otherwise)
AMREST GROUP INTERIM REPORT for 9 months ended 30 September 2021 18
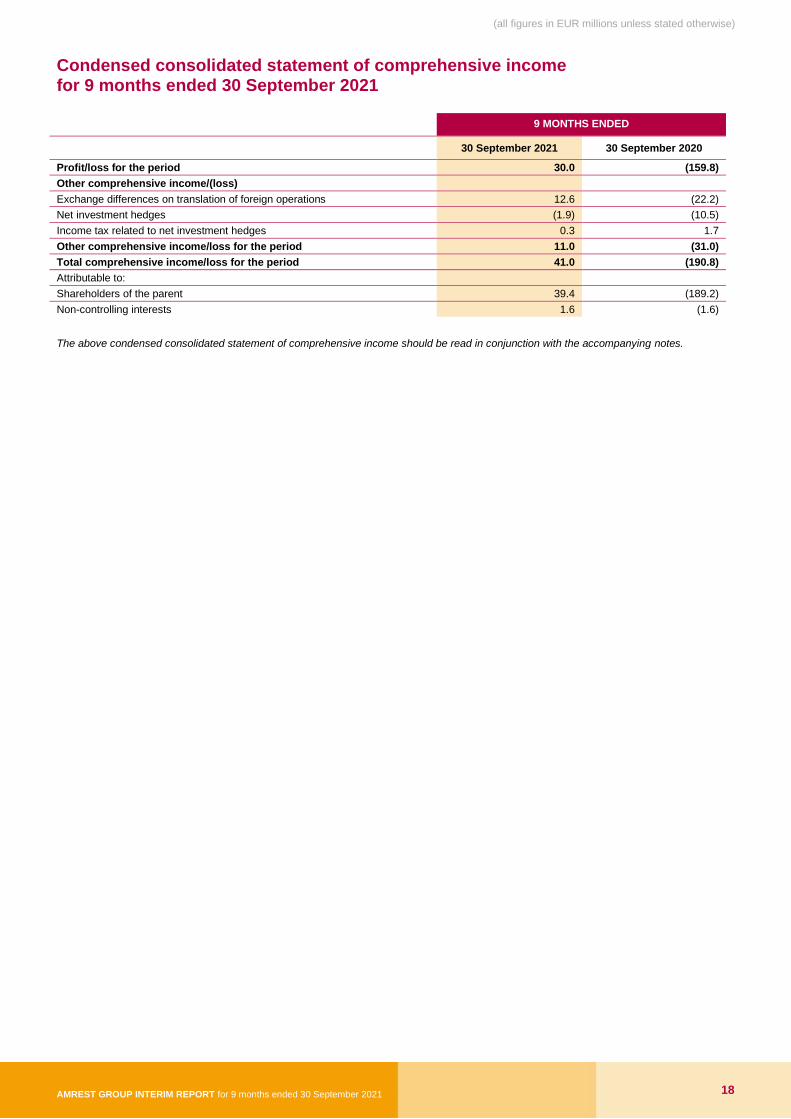
Condensed consolidated statement of comprehensive income for 9 months ended 30 September 2021
9 MONTHS ENDED
30 September 2021 30 September 2020
Profit/loss for the period 30.0 (159.8)
Other comprehensive income/(loss)
Exchange differences on translation of foreign operations 12.6 (22.2)
Net investment hedges (1.9) (10.5)
Income tax related to net investment hedges 0.3 1.7
Other comprehensive income/loss for the period 11.0 (31.0)
Total comprehensive income/loss for the period 41.0 (190.8)
Attributable to:
Shareholders of the parent 39.4 (189.2)
Non-controlling interests 1.6 (1.6)
The above condensed consolidated statement of comprehensive income should be read in conjunction with the accompanying notes.
(all figures in EUR millions unless stated otherwise)
AMREST GROUP INTERIM REPORT for 9 months ended 30 September 2021 19
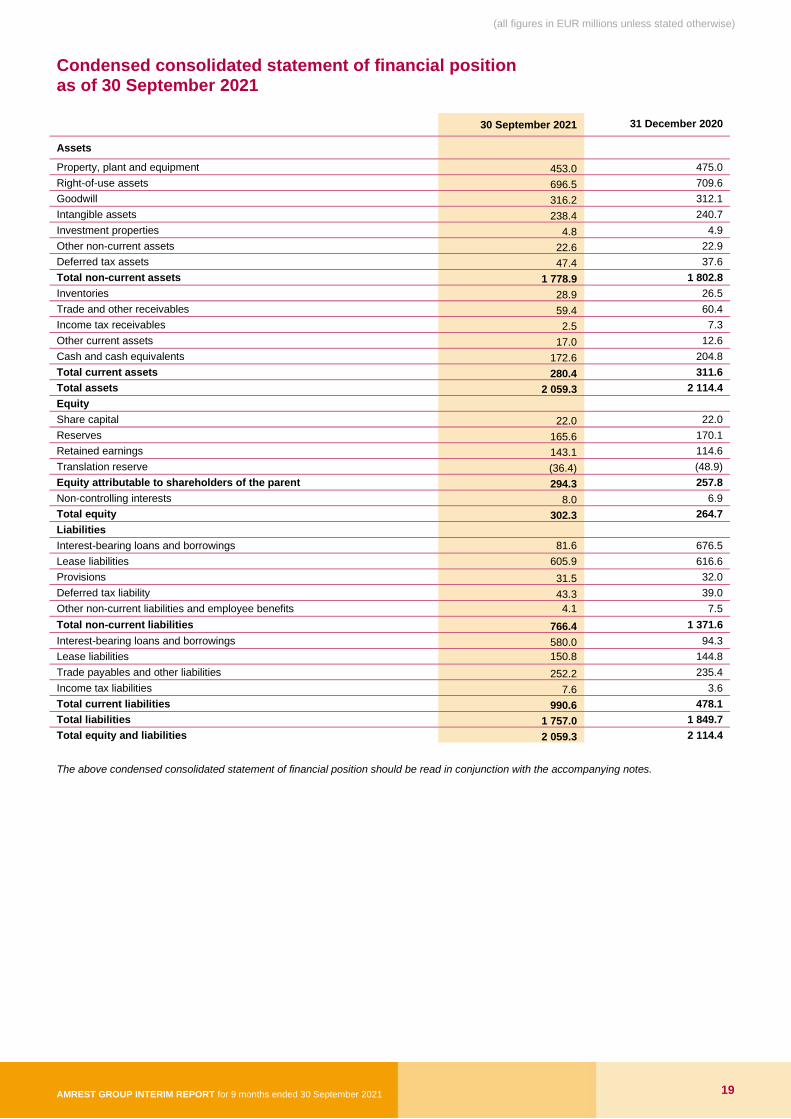
Condensed consolidated statement of financial position as of 30 September 2021
30 September 2021 31 December 2020
Assets
Property, plant and equipment 453.0 475.0
Right-of-use assets 696.5 709.6
Goodwill 316.2 312.1
Intangible assets 238.4 240.7
Investment properties 4.8 4.9
Other non-current assets 22.6 22.9
Deferred tax assets 47.4 37.6
Total non-current assets 1 778.9 1 802.8
Inventories 28.9 26.5
Trade and other receivables 59.4 60.4
Income tax receivables 2.5 7.3
Other current assets 17.0 12.6
Cash and cash equivalents 172.6 204.8
Total current assets 280.4 311.6
Total assets 2 059.3 2 114.4
Equity
Share capital 22.0 22.0
Reserves 165.6 170.1
Retained earnings 143.1 114.6
Translation reserve (36.4) (48.9)
Equity attributable to shareholders of the parent 294.3 257.8
Non-controlling interests 8.0 6.9
Total equity 302.3 264.7
Liabilities
Interest-bearing loans and borrowings 81.6 676.5
Lease liabilities 605.9 616.6
Provisions 31.5 32.0
Deferred tax liability 43.3 39.0
Other non-current liabilities and employee benefits 4.1 7.5
Total non-current liabilities 766.4 1 371.6
Interest-bearing loans and borrowings 580.0 94.3
Lease liabilities 150.8 144.8
Trade payables and other liabilities 252.2 235.4
Income tax liabilities 7.6 3.6
Total current liabilities 990.6 478.1
Total liabilities 1 757.0 1 849.7
Total equity and liabilities 2 059.3 2 114.4
The above condensed consolidated statement of financial position should be read in conjunction with the accompanying notes.
(all figures in EUR millions unless stated otherwise)
AMREST GROUP INTERIM REPORT for 9 months ended 30 September 2021 20
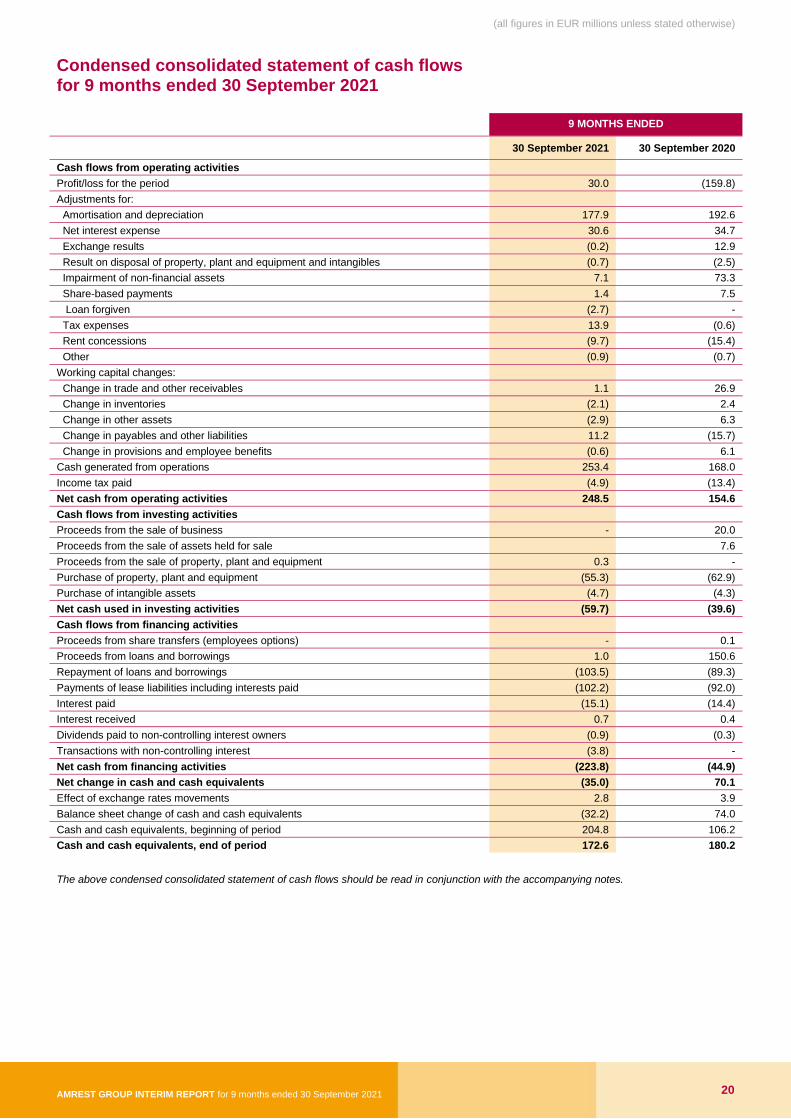
Condensed consolidated statement of cash flows for 9 months ended 30 September 2021
9 MONTHS ENDED
30 September 2021 30 September 2020
Cash flows from operating activities
Profit/loss for the period 30.0 (159.8)
Adjustments for:
Amortisation and depreciation 177.9 192.6
Net interest expense 30.6 34.7
Exchange results (0.2) 12.9
Result on disposal of property, plant and equipment and intangibles (0.7) (2.5)
Impairment of non-financial assets 7.1 73.3
Share-based payments 1.4 7.5
Loan forgiven (2.7) -
Tax expenses 13.9 (0.6)
Rent concessions (9.7) (15.4)
Other (0.9) (0.7)
Working capital changes:
Change in trade and other receivables 1.1 26.9
Change in inventories (2.1) 2.4
Change in other assets (2.9) 6.3
Change in payables and other liabilities 11.2 (15.7)
Change in provisions and employee benefits (0.6) 6.1
Cash generated from operations 253.4 168.0
Income tax paid (4.9) (13.4)
Net cash from operating activities 248.5 154.6
Cash flows from investing activities
Proceeds from the sale of business - 20.0
Proceeds from the sale of assets held for sale 7.6
Proceeds from the sale of property, plant and equipment 0.3 -
Purchase of property, plant and equipment (55.3) (62.9)
Purchase of intangible assets (4.7) (4.3)
Net cash used in investing activities (59.7) (39.6)
Cash flows from financing activities
Proceeds from share transfers (employees options) - 0.1
Proceeds from loans and borrowings 1.0 150.6
Repayment of loans and borrowings (103.5) (89.3)
Payments of lease liabilities including interests paid (102.2) (92.0)
Interest paid (15.1) (14.4)
Interest received 0.7 0.4
Dividends paid to non-controlling interest owners (0.9) (0.3)
Transactions with non-controlling interest (3.8) -
Net cash from financing activities (223.8) (44.9)
Net change in cash and cash equivalents (35.0) 70.1
Effect of exchange rates movements 2.8 3.9
Balance sheet change of cash and cash equivalents (32.2) 74.0
Cash and cash equivalents, beginning of period 204.8 106.2
Cash and cash equivalents, end of period 172.6 180.2
The above condensed consolidated statement of cash flows should be read in conjunction with the accompanying notes.
(all figures in EUR millions unless stated otherwise)
AMREST GROUP INTERIM REPORT for 9 months ended 30 September 2021 21
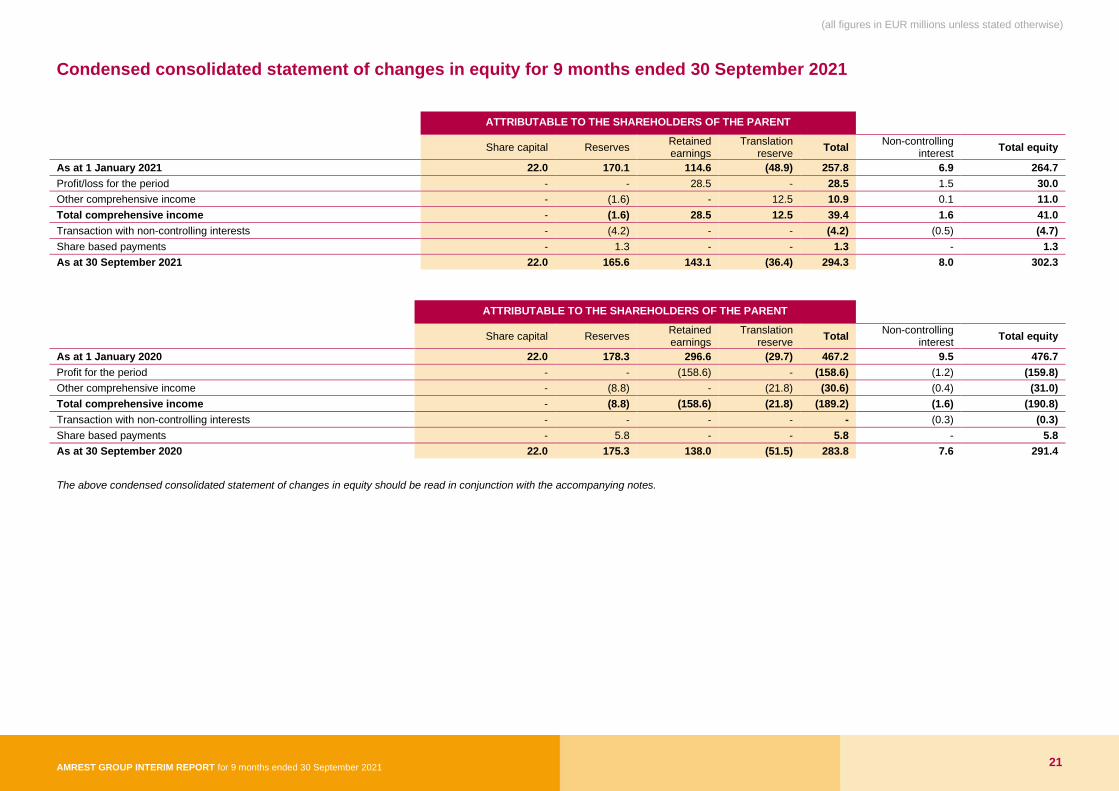
Condensed consolidated statement of changes in equity for 9 months ended 30 September 2021 ATTRIBUTABLE TO THE SHAREHOLDERS OF THE PARENT
Share capital Reserves Retained earnings
Translation reserve
Total Non-controlling
interest Total equity
As at 1 January 2021 22.0 170.1 114.6 (48.9) 257.8 6.9 264.7
Profit/loss for the period - - 28.5 - 28.5 1.5 30.0
Other comprehensive income - (1.6) - 12.5 10.9 0.1 11.0
Total comprehensive income - (1.6) 28.5 12.5 39.4 1.6 41.0
Transaction with non-controlling interests - (4.2) - - (4.2) (0.5) (4.7)
Share based payments - 1.3 - - 1.3 - 1.3
As at 30 September 2021 22.0 165.6 143.1 (36.4) 294.3 8.0 302.3
ATTRIBUTABLE TO THE SHAREHOLDERS OF THE PARENT
Share capital Reserves Retained earnings
Translation reserve
Total Non-controlling
interest Total equity
As at 1 January 2020 22.0 178.3 296.6 (29.7) 467.2 9.5 476.7
Profit for the period - - (158.6) - (158.6) (1.2) (159.8)
Other comprehensive income - (8.8) - (21.8) (30.6) (0.4) (31.0)
Total comprehensive income - (8.8) (158.6) (21.8) (189.2) (1.6) (190.8)
Transaction with non-controlling interests - - - - - (0.3) (0.3)
Share based payments - 5.8 - - 5.8 - 5.8
As at 30 September 2020 22.0 175.3 138.0 (51.5) 283.8 7.6 291.4
The above condensed consolidated statement of changes in equity should be read in conjunction with the accompanying notes.
(all figures in EUR millions unless stated otherwise)
AMREST GROUP INTERIM REPORT for 9 months ended 30 September 2021 22
Notes to condensed consolidated interim report
1. General information on the Group
AmRest Holdings SE (“The Company”, “AmRest”) was incorporated in the Netherlands in October 2000. Since 2008 the
Company operates a European Company (Societas Europaea, SE). The company is domiciled in Spain.
There was no change in name of reporting entity during the reporting period.
Paseo de la Castellana 163, 28046 (Madrid), Spain is the Company’s registered office as of 30 September 2021
and has not changed during the reporting period.
Hereinafter the Company and its subsidiaries shall be referred to as the “Group” and “AmRest Group”.
In 2005 the shares of AmRest Holdings SE were quoted for the first time on the Warsaw Stock Exchange (“WSE”) and in
2018 were quoted on the Madrid, Barcelona, Bilbao and Valencia Stock Exchanges, through the Spanish Automated
Quotation System (Sistema de Interconexión Bursátil - SIBE). Since 21 November 2018 AmRest’s shares have been
quoted simultaneously on both the above stock exchanges (dual listing).
Grupo Finaccess S.A.P.I. de C.V. is the ultimate parent of the Group.
The Group is the largest independent chain restaurant operator in Central and Eastern Europe. The Group is also
conducting its operations in Western Europe, Russia and China. The Group’s principal place of business is Europe.
The Group operates Kentucky Fried Chicken (“KFC”), Pizza Hut (“PH”), Burger King (“BK”) and Starbucks (“SBX”)
restaurants through its subsidiaries in Poland, the Czech Republic (hereinafter Czechia), Hungary, Slovakia, Russia,
Serbia, Croatia, Bulgaria, Romania, Germany, France, Austria, Slovenia and Spain, on the basis of franchise rights
granted. Starting from October 2016 the Group as a master-franchisee has the right to grant a license to third parties to
operate Pizza Hut Express and Pizza Hut Delivery restaurants (sub-franchise) in countries of Central and Eastern
Europe, while ensuring a certain share of restaurants operated directly by AmRest. Pizza Hut restaurants acquired in
France in May 2017, in Germany in July 2017 and in Russia in June 2018 are operated both by AmRest and its sub-
franchisees based on master-franchise agreements.
In Spain, Germany and Portugal the Group operates its own brands La Tagliatella. This business is based on own
restaurants and the franchise agreements signed with non-related companies. It is supported by the central kitchen
located in Spain which produces and delivers products to the whole network of the mentioned own brands. In China the
Group operates its own brand Blue Frog.
In 2018 the Group acquired the Bacoa and Sushi Shop brands, as a result of which it operates own and franchise
restaurants in Spain (Bacoa) and own and franchise Sushi Shop restaurants in France, Belgium, Spain, several Middle
East countries, Switzerland, United Kingdom, Luxembourg, Italy, Portugal. Bacoa is a Spanish premium burger chain,
and Sushi Shop is the operator of the leading European chain of Japanese cuisine restaurants.
Additionally, among own brands the Group operates virtual brands. The offer of virtual brands in Poland is available
under Food About concept - an umbrella brand that enables ordering different virtual brand dishes within one order.
As of 30 September 2021, the Group operates 2 395 restaurants (own and franchise) in comparison to 2 337 restaurants
as of 31 December 2020.
(all figures in EUR millions unless stated otherwise)
AMREST GROUP INTERIM REPORT for 3 months ended 30 September 2021 23
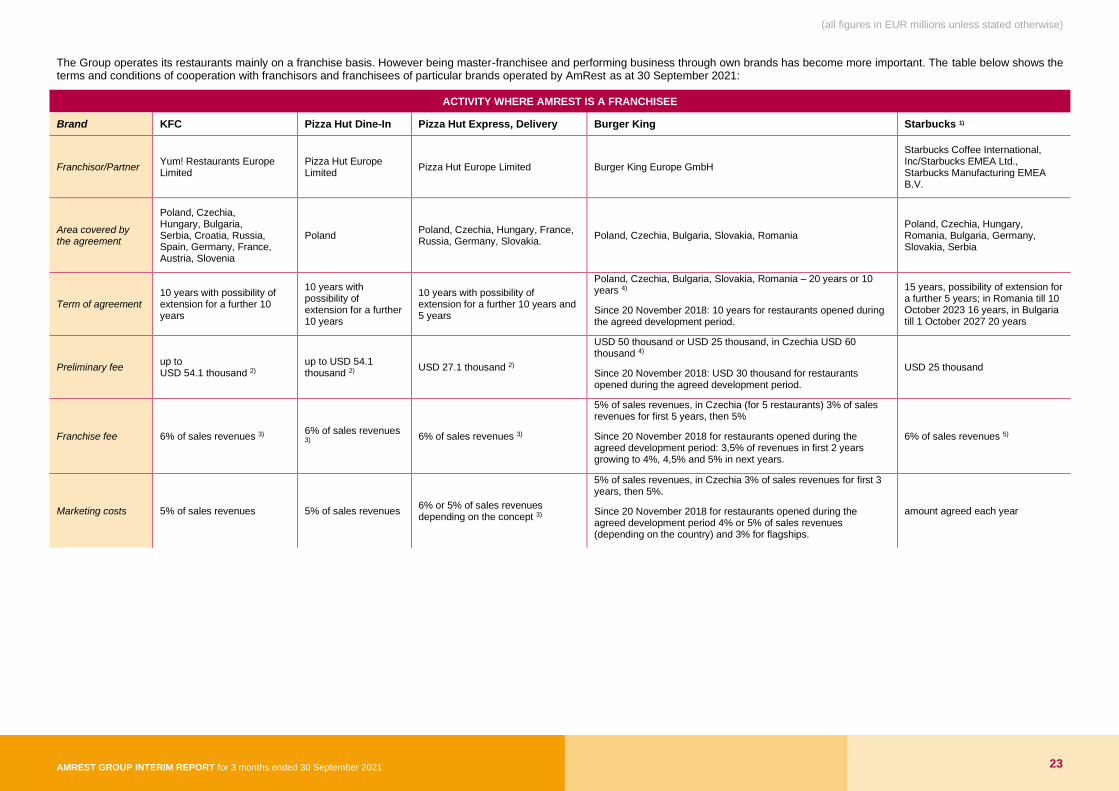
The Group operates its restaurants mainly on a franchise basis. However being master-franchisee and performing business through own brands has become more important. The table below shows the terms and conditions of cooperation with franchisors and franchisees of particular brands operated by AmRest as at 30 September 2021:
ACTIVITY WHERE AMREST IS A FRANCHISEE
Brand KFC Pizza Hut Dine-In Pizza Hut Express, Delivery Burger King Starbucks 1)
Franchisor/Partner Yum! Restaurants Europe Limited
Pizza Hut Europe Limited
Pizza Hut Europe Limited Burger King Europe GmbH
Starbucks Coffee International, Inc/Starbucks EMEA Ltd., Starbucks Manufacturing EMEA B.V.
Area covered by the agreement
Poland, Czechia, Hungary, Bulgaria, Serbia, Croatia, Russia, Spain, Germany, France, Austria, Slovenia
Poland Poland, Czechia, Hungary, France, Russia, Germany, Slovakia.
Poland, Czechia, Bulgaria, Slovakia, Romania Poland, Czechia, Hungary, Romania, Bulgaria, Germany, Slovakia, Serbia
Term of agreement 10 years with possibility of extension for a further 10 years
10 years with possibility of extension for a further 10 years
10 years with possibility of extension for a further 10 years and 5 years
Poland, Czechia, Bulgaria, Slovakia, Romania – 20 years or 10 years 4)
Since 20 November 2018: 10 years for restaurants opened during the agreed development period.
15 years, possibility of extension for a further 5 years; in Romania till 10 October 2023 16 years, in Bulgaria till 1 October 2027 20 years
Preliminary fee up to USD 54.1 thousand 2)
up to USD 54.1 thousand 2)
USD 27.1 thousand 2)
USD 50 thousand or USD 25 thousand, in Czechia USD 60 thousand 4)
Since 20 November 2018: USD 30 thousand for restaurants opened during the agreed development period.
USD 25 thousand
Franchise fee 6% of sales revenues 3) 6% of sales revenues 3)
6% of sales revenues 3)
5% of sales revenues, in Czechia (for 5 restaurants) 3% of sales revenues for first 5 years, then 5%
Since 20 November 2018 for restaurants opened during the agreed development period: 3,5% of revenues in first 2 years growing to 4%, 4,5% and 5% in next years.
6% of sales revenues 5)
Marketing costs 5% of sales revenues 5% of sales revenues 6% or 5% of sales revenues depending on the concept 3)
5% of sales revenues, in Czechia 3% of sales revenues for first 3 years, then 5%.
Since 20 November 2018 for restaurants opened during the agreed development period 4% or 5% of sales revenues (depending on the country) and 3% for flagships.
amount agreed each year
(all figures in EUR millions unless stated otherwise)
AMREST GROUP INTERIM REPORT for 9 months ended 30 September 2021 24
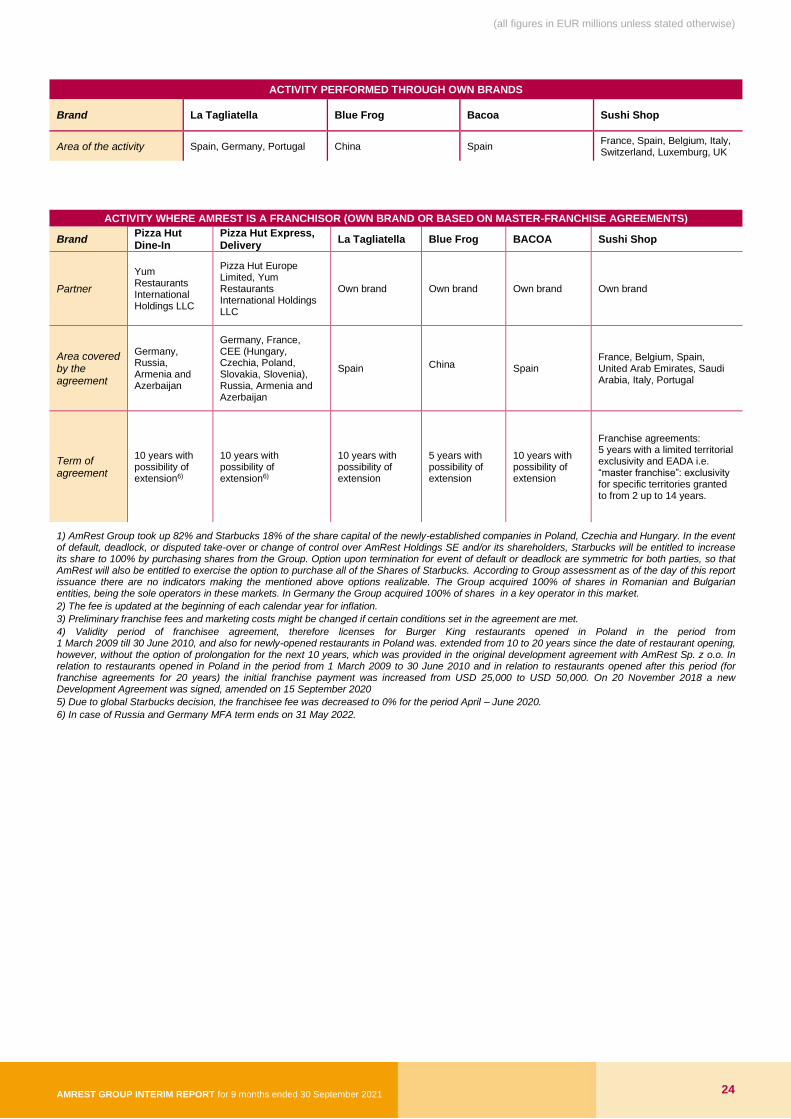
ACTIVITY PERFORMED THROUGH OWN BRANDS
Brand La Tagliatella Blue Frog Bacoa Sushi Shop
Area of the activity Spain, Germany, Portugal China Spain France, Spain, Belgium, Italy, Switzerland, Luxemburg, UK
ACTIVITY WHERE AMREST IS A FRANCHISOR (OWN BRAND OR BASED ON MASTER-FRANCHISE AGREEMENTS)
Brand Pizza Hut Dine-In
Pizza Hut Express, Delivery
La Tagliatella Blue Frog BACOA Sushi Shop
Partner
Yum Restaurants International Holdings LLC
Pizza Hut Europe Limited, Yum Restaurants International Holdings LLC
Own brand Own brand Own brand Own brand
Area covered by the agreement
Germany, Russia, Armenia and Azerbaijan
Germany, France, CEE (Hungary, Czechia, Poland, Slovakia, Slovenia), Russia, Armenia and Azerbaijan
Spain
China
Spain France, Belgium, Spain, United Arab Emirates, Saudi Arabia, Italy, Portugal
Term of agreement
10 years with possibility of extension6)
10 years with possibility of extension6)
10 years with possibility of extension
5 years with possibility of extension
10 years with possibility of extension
Franchise agreements: 5 years with a limited territorial exclusivity and EADA i.e. “master franchise”: exclusivity for specific territories granted to from 2 up to 14 years.
1) AmRest Group took up 82% and Starbucks 18% of the share capital of the newly-established companies in Poland, Czechia and Hungary. In the event of default, deadlock, or disputed take-over or change of control over AmRest Holdings SE and/or its shareholders, Starbucks will be entitled to increase its share to 100% by purchasing shares from the Group. Option upon termination for event of default or deadlock are symmetric for both parties, so that AmRest will also be entitled to exercise the option to purchase all of the Shares of Starbucks. According to Group assessment as of the day of this report issuance there are no indicators making the mentioned above options realizable. The Group acquired 100% of shares in Romanian and Bulgarian entities, being the sole operators in these markets. In Germany the Group acquired 100% of shares in a key operator in this market.
2) The fee is updated at the beginning of each calendar year for inflation.
3) Preliminary franchise fees and marketing costs might be changed if certain conditions set in the agreement are met.
4) Validity period of franchisee agreement, therefore licenses for Burger King restaurants opened in Poland in the period from 1 March 2009 till 30 June 2010, and also for newly-opened restaurants in Poland was. extended from 10 to 20 years since the date of restaurant opening, however, without the option of prolongation for the next 10 years, which was provided in the original development agreement with AmRest Sp. z o.o. In relation to restaurants opened in Poland in the period from 1 March 2009 to 30 June 2010 and in relation to restaurants opened after this period (for franchise agreements for 20 years) the initial franchise payment was increased from USD 25,000 to USD 50,000. On 20 November 2018 a new Development Agreement was signed, amended on 15 September 2020
5) Due to global Starbucks decision, the franchisee fee was decreased to 0% for the period April – June 2020.
6) In case of Russia and Germany MFA term ends on 31 May 2022.
(all figures in EUR millions unless stated otherwise)
AMREST GROUP INTERIM REPORT for 9 months ended 30 September 2021 25
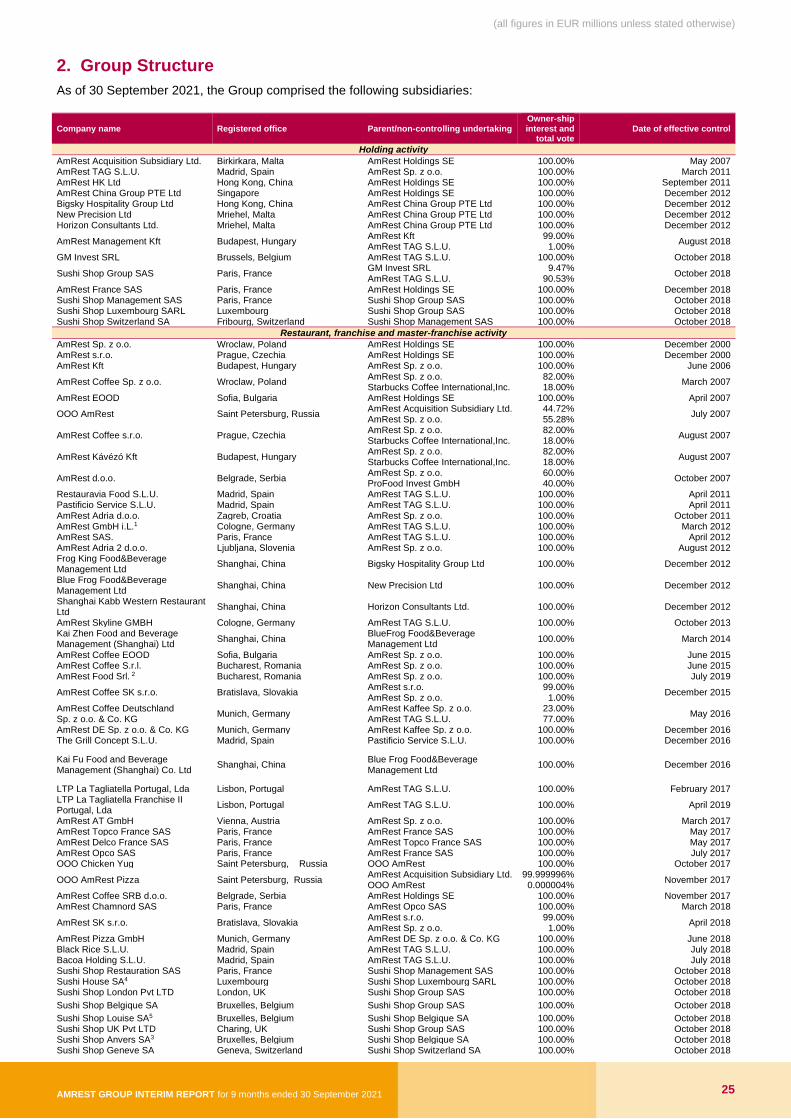
2. Group Structure
As of 30 September 2021, the Group comprised the following subsidiaries:
Company name Registered office Parent/non-controlling undertaking Owner-ship interest and
total vote Date of effective control
Holding activity
AmRest Acquisition Subsidiary Ltd. Birkirkara, Malta AmRest Holdings SE 100.00% May 2007 AmRest TAG S.L.U. Madrid, Spain AmRest Sp. z o.o. 100.00% March 2011 AmRest HK Ltd Hong Kong, China AmRest Holdings SE 100.00% September 2011 AmRest China Group PTE Ltd Singapore AmRest Holdings SE 100.00% December 2012 Bigsky Hospitality Group Ltd Hong Kong, China AmRest China Group PTE Ltd 100.00% December 2012 New Precision Ltd Mriehel, Malta AmRest China Group PTE Ltd 100.00% December 2012 Horizon Consultants Ltd. Mriehel, Malta AmRest China Group PTE Ltd 100.00% December 2012
AmRest Management Kft Budapest, Hungary AmRest Kft 99.00%
August 2018 AmRest TAG S.L.U. 1.00%
GM Invest SRL Brussels, Belgium AmRest TAG S.L.U. 100.00% October 2018
Sushi Shop Group SAS Paris, France GM Invest SRL 9.47%
October 2018 AmRest TAG S.L.U. 90.53%
AmRest France SAS Paris, France AmRest Holdings SE 100.00% December 2018 Sushi Shop Management SAS Paris, France Sushi Shop Group SAS 100.00% October 2018 Sushi Shop Luxembourg SARL Luxembourg Sushi Shop Group SAS 100.00% October 2018 Sushi Shop Switzerland SA Fribourg, Switzerland Sushi Shop Management SAS 100.00% October 2018
Restaurant, franchise and master-franchise activity
AmRest Sp. z o.o. Wroclaw, Poland AmRest Holdings SE 100.00% December 2000 AmRest s.r.o. Prague, Czechia AmRest Holdings SE 100.00% December 2000 AmRest Kft Budapest, Hungary AmRest Sp. z o.o. 100.00% June 2006
AmRest Coffee Sp. z o.o. Wroclaw, Poland AmRest Sp. z o.o. 82.00%
March 2007 Starbucks Coffee International,Inc. 18.00%
AmRest EOOD Sofia, Bulgaria AmRest Holdings SE 100.00% April 2007
OOO AmRest Saint Petersburg, Russia AmRest Acquisition Subsidiary Ltd. 44.72%
July 2007 AmRest Sp. z o.o. 55.28%
AmRest Coffee s.r.o. Prague, Czechia AmRest Sp. z o.o. 82.00%
August 2007 Starbucks Coffee International,Inc. 18.00%
AmRest Kávézó Kft Budapest, Hungary AmRest Sp. z o.o. 82.00%
August 2007 Starbucks Coffee International,Inc. 18.00%
AmRest d.o.o. Belgrade, Serbia AmRest Sp. z o.o. 60.00%
October 2007 ProFood Invest GmbH 40.00%
Restauravia Food S.L.U. Madrid, Spain AmRest TAG S.L.U. 100.00% April 2011 Pastificio Service S.L.U. Madrid, Spain AmRest TAG S.L.U. 100.00% April 2011 AmRest Adria d.o.o. Zagreb, Croatia AmRest Sp. z o.o. 100.00% October 2011 AmRest GmbH i.L.1 Cologne, Germany AmRest TAG S.L.U. 100.00% March 2012 AmRest SAS. Paris, France AmRest TAG S.L.U. 100.00% April 2012 AmRest Adria 2 d.o.o. Ljubljana, Slovenia AmRest Sp. z o.o. 100.00% August 2012 Frog King Food&Beverage Management Ltd
Shanghai, China Bigsky Hospitality Group Ltd 100.00% December 2012
Blue Frog Food&Beverage Management Ltd
Shanghai, China New Precision Ltd 100.00% December 2012
Shanghai Kabb Western Restaurant Ltd
Shanghai, China Horizon Consultants Ltd. 100.00% December 2012
AmRest Skyline GMBH Cologne, Germany AmRest TAG S.L.U. 100.00% October 2013 Kai Zhen Food and Beverage Management (Shanghai) Ltd
Shanghai, China BlueFrog Food&Beverage Management Ltd
100.00% March 2014
AmRest Coffee EOOD Sofia, Bulgaria AmRest Sp. z o.o. 100.00% June 2015 AmRest Coffee S.r.l. Bucharest, Romania AmRest Sp. z o.o. 100.00% June 2015 AmRest Food Srl. 2 Bucharest, Romania AmRest Sp. z o.o. 100.00% July 2019
AmRest Coffee SK s.r.o. Bratislava, Slovakia AmRest s.r.o. 99.00%
December 2015 AmRest Sp. z o.o. 1.00%
AmRest Coffee Deutschland Munich, Germany
AmRest Kaffee Sp. z o.o. 23.00% May 2016
Sp. z o.o. & Co. KG AmRest TAG S.L.U. 77.00% AmRest DE Sp. z o.o. & Co. KG Munich, Germany AmRest Kaffee Sp. z o.o. 100.00% December 2016 The Grill Concept S.L.U. Madrid, Spain Pastificio Service S.L.U. 100.00% December 2016
Kai Fu Food and Beverage Management (Shanghai) Co. Ltd
Shanghai, China Blue Frog Food&Beverage Management Ltd
100.00% December 2016
LTP La Tagliatella Portugal, Lda Lisbon, Portugal AmRest TAG S.L.U. 100.00% February 2017 LTP La Tagliatella Franchise II Portugal, Lda
Lisbon, Portugal AmRest TAG S.L.U. 100.00% April 2019
AmRest AT GmbH Vienna, Austria AmRest Sp. z o.o. 100.00% March 2017 AmRest Topco France SAS Paris, France AmRest France SAS 100.00% May 2017 AmRest Delco France SAS Paris, France AmRest Topco France SAS 100.00% May 2017 AmRest Opco SAS Paris, France AmRest France SAS 100.00% July 2017 OOO Chicken Yug Saint Petersburg, Russia OOO AmRest 100.00% October 2017
OOO AmRest Pizza Saint Petersburg, Russia AmRest Acquisition Subsidiary Ltd. 99.999996%
November 2017
OOO AmRest 0.000004% AmRest Coffee SRB d.o.o. Belgrade, Serbia AmRest Holdings SE 100.00% November 2017 AmRest Chamnord SAS Paris, France AmRest Opco SAS 100.00% March 2018
AmRest SK s.r.o. Bratislava, Slovakia AmRest s.r.o. 99.00%
April 2018
AmRest Sp. z o.o. 1.00% AmRest Pizza GmbH Munich, Germany AmRest DE Sp. z o.o. & Co. KG 100.00% June 2018 Black Rice S.L.U. Madrid, Spain AmRest TAG S.L.U. 100.00% July 2018 Bacoa Holding S.L.U. Madrid, Spain AmRest TAG S.L.U. 100.00% July 2018 Sushi Shop Restauration SAS Paris, France Sushi Shop Management SAS 100.00% October 2018 Sushi House SA4 Luxembourg Sushi Shop Luxembourg SARL 100.00% October 2018 Sushi Shop London Pvt LTD London, UK Sushi Shop Group SAS 100.00% October 2018
Sushi Shop Belgique SA Bruxelles, Belgium Sushi Shop Group SAS 100.00% October 2018 Sushi Shop Louise SA5 Bruxelles, Belgium Sushi Shop Belgique SA 100.00% October 2018 Sushi Shop UK Pvt LTD Charing, UK Sushi Shop Group SAS 100.00% October 2018 Sushi Shop Anvers SA3 Bruxelles, Belgium Sushi Shop Belgique SA 100.00% October 2018 Sushi Shop Geneve SA Geneva, Switzerland Sushi Shop Switzerland SA 100.00% October 2018
(all figures in EUR millions unless stated otherwise)
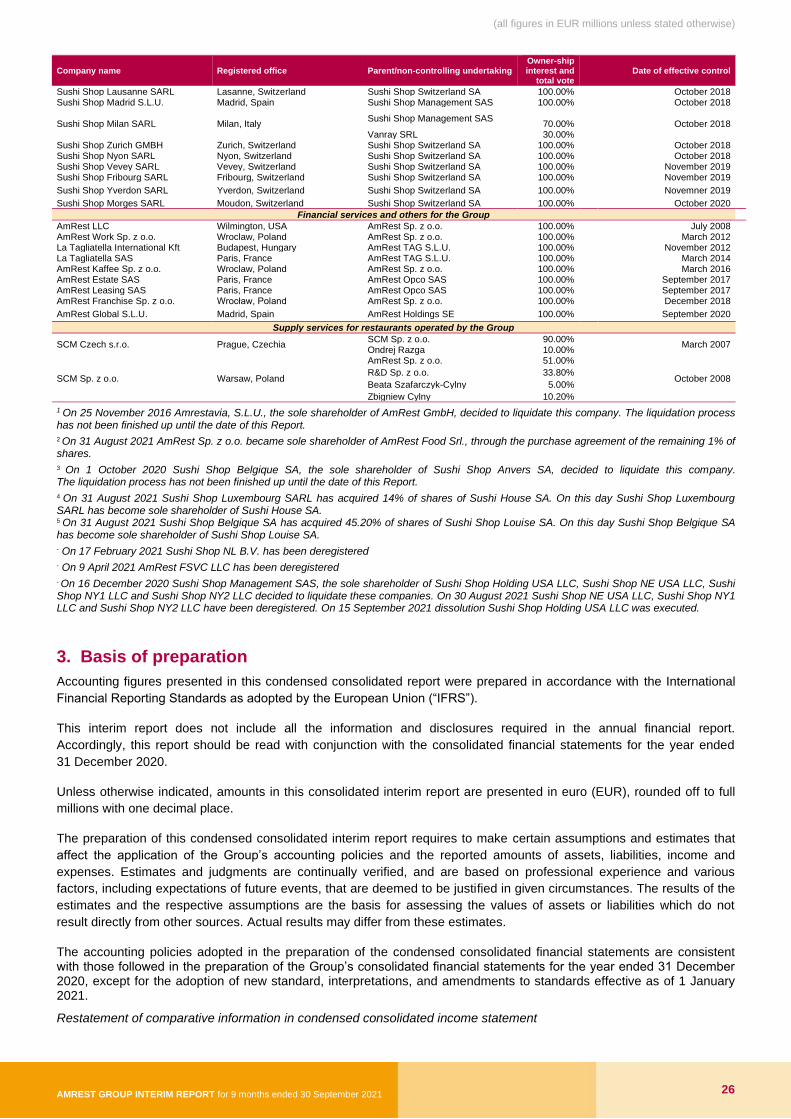
AMREST GROUP INTERIM REPORT for 9 months ended 30 September 2021 26
Company name Registered office Parent/non-controlling undertaking Owner-ship interest and
total vote Date of effective control
Sushi Shop Lausanne SARL Lasanne, Switzerland Sushi Shop Switzerland SA 100.00% October 2018 Sushi Shop Madrid S.L.U. Madrid, Spain Sushi Shop Management SAS 100.00% October 2018
Sushi Shop Milan SARL Milan, Italy Sushi Shop Management SAS
70.00% October 2018
Vanray SRL 30.00% Sushi Shop Zurich GMBH Zurich, Switzerland Sushi Shop Switzerland SA 100.00% October 2018 Sushi Shop Nyon SARL Nyon, Switzerland Sushi Shop Switzerland SA 100.00% October 2018 Sushi Shop Vevey SARL Vevey, Switzerland Sushi Shop Switzerland SA 100.00% November 2019 Sushi Shop Fribourg SARL Fribourg, Switzerland Sushi Shop Switzerland SA 100.00% November 2019
Sushi Shop Yverdon SARL Yverdon, Switzerland Sushi Shop Switzerland SA 100.00% Novemner 2019 Sushi Shop Morges SARL Moudon, Switzerland Sushi Shop Switzerland SA 100.00% October 2020
Financial services and others for the Group AmRest LLC Wilmington, USA AmRest Sp. z o.o. 100.00% July 2008 AmRest Work Sp. z o.o. Wroclaw, Poland AmRest Sp. z o.o. 100.00% March 2012 La Tagliatella International Kft Budapest, Hungary AmRest TAG S.L.U. 100.00% November 2012 La Tagliatella SAS Paris, France AmRest TAG S.L.U. 100.00% March 2014 AmRest Kaffee Sp. z o.o. Wroclaw, Poland AmRest Sp. z o.o. 100.00% March 2016 AmRest Estate SAS Paris, France AmRest Opco SAS 100.00% September 2017 AmRest Leasing SAS Paris, France AmRest Opco SAS 100.00% September 2017 AmRest Franchise Sp. z o.o. Wrocław, Poland AmRest Sp. z o.o. 100.00% December 2018
AmRest Global S.L.U. Madrid, Spain AmRest Holdings SE 100.00% September 2020 Supply services for restaurants operated by the Group
SCM Czech s.r.o. Prague, Czechia SCM Sp. z o.o. 90.00%
March 2007
Ondrej Razga 10.00%
SCM Sp. z o.o. Warsaw, Poland
AmRest Sp. z o.o. 51.00%
October 2008
R&D Sp. z o.o. 33.80% Beata Szafarczyk-Cylny 5.00% Zbigniew Cylny 10.20%
1 On 25 November 2016 Amrestavia, S.L.U., the sole shareholder of AmRest GmbH, decided to liquidate this company. The liquidation process has not been finished up until the date of this Report.
2 On 31 August 2021 AmRest Sp. z o.o. became sole shareholder of AmRest Food Srl., through the purchase agreement of the remaining 1% of shares.
3 On 1 October 2020 Sushi Shop Belgique SA, the sole shareholder of Sushi Shop Anvers SA, decided to liquidate this company. The liquidation process has not been finished up until the date of this Report.
4 On 31 August 2021 Sushi Shop Luxembourg SARL has acquired 14% of shares of Sushi House SA. On this day Sushi Shop Luxembourg SARL has become sole shareholder of Sushi House SA. 5 On 31 August 2021 Sushi Shop Belgique SA has acquired 45.20% of shares of Sushi Shop Louise SA. On this day Sushi Shop Belgique SA has become sole shareholder of Sushi Shop Louise SA.
- On 17 February 2021 Sushi Shop NL B.V. has been deregistered
- On 9 April 2021 AmRest FSVC LLC has been deregistered
- On 16 December 2020 Sushi Shop Management SAS, the sole shareholder of Sushi Shop Holding USA LLC, Sushi Shop NE USA LLC, Sushi Shop NY1 LLC and Sushi Shop NY2 LLC decided to liquidate these companies. On 30 August 2021 Sushi Shop NE USA LLC, Sushi Shop NY1 LLC and Sushi Shop NY2 LLC have been deregistered. On 15 September 2021 dissolution Sushi Shop Holding USA LLC was executed.
3. Basis of preparation
Accounting figures presented in this condensed consolidated report were prepared in accordance with the International
Financial Reporting Standards as adopted by the European Union (“IFRS”).
This interim report does not include all the information and disclosures required in the annual financial report.
Accordingly, this report should be read with conjunction with the consolidated financial statements for the year ended
31 December 2020.
Unless otherwise indicated, amounts in this consolidated interim report are presented in euro (EUR), rounded off to full
millions with one decimal place.
The preparation of this condensed consolidated interim report requires to make certain assumptions and estimates that
affect the application of the Group’s accounting policies and the reported amounts of assets, liabilities, income and
expenses. Estimates and judgments are continually verified, and are based on professional experience and various
factors, including expectations of future events, that are deemed to be justified in given circumstances. The results of the
estimates and the respective assumptions are the basis for assessing the values of assets or liabilities which do not
result directly from other sources. Actual results may differ from these estimates.
The accounting policies adopted in the preparation of the condensed consolidated financial statements are consistent with those followed in the preparation of the Group’s consolidated financial statements for the year ended 31 December 2020, except for the adoption of new standard, interpretations, and amendments to standards effective as of 1 January 2021.
Restatement of comparative information in condensed consolidated income statement
(all figures in EUR millions unless stated otherwise)
AMREST GROUP INTERIM REPORT for 9 months ended 30 September 2021 27
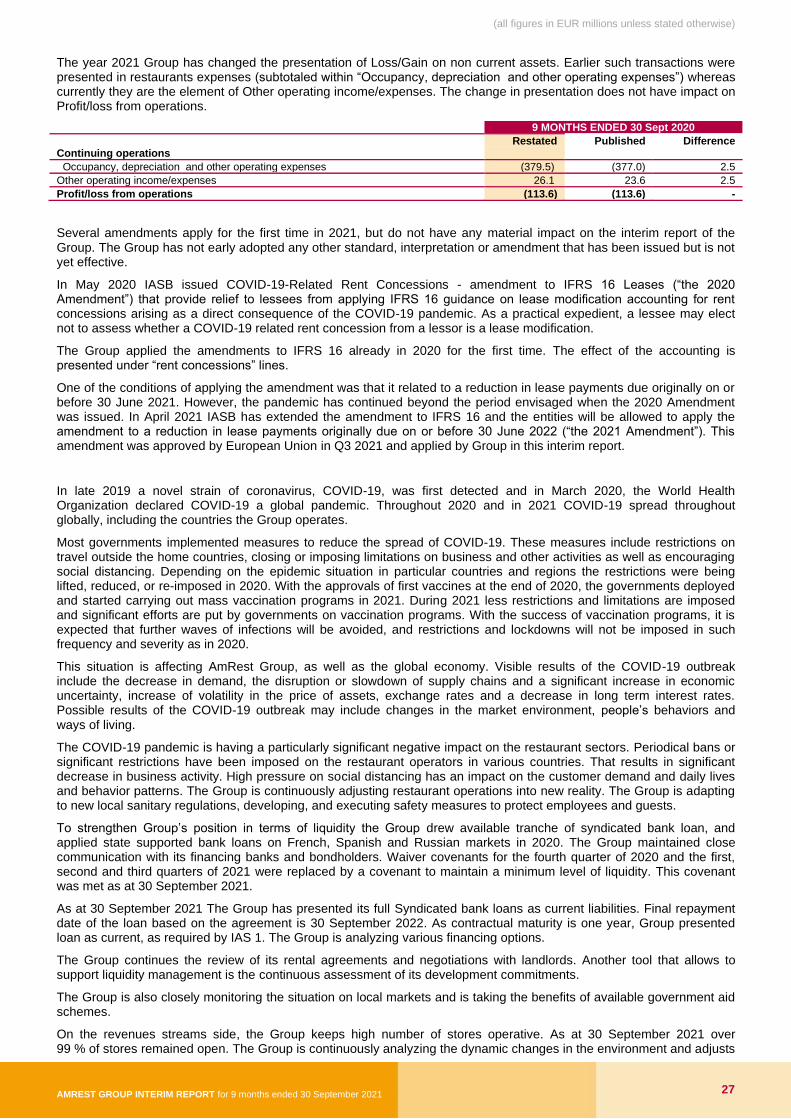
The year 2021 Group has changed the presentation of Loss/Gain on non current assets. Earlier such transactions were presented in restaurants expenses (subtotaled within “Occupancy, depreciation and other operating expenses”) whereas currently they are the element of Other operating income/expenses. The change in presentation does not have impact on Profit/loss from operations.
9 MONTHS ENDED 30 Sept 2020
Restated Published Difference Continuing operations
Occupancy, depreciation and other operating expenses (379.5) (377.0) 2.5
Other operating income/expenses 26.1 23.6 2.5
Profit/loss from operations (113.6) (113.6) -
Several amendments apply for the first time in 2021, but do not have any material impact on the interim report of the Group. The Group has not early adopted any other standard, interpretation or amendment that has been issued but is not yet effective.
In May 2020 IASB issued COVID-19-Related Rent Concessions - amendment to IFRS 16 Leases (“the 2020 Amendment”) that provide relief to lessees from applying IFRS 16 guidance on lease modification accounting for rent concessions arising as a direct consequence of the COVID-19 pandemic. As a practical expedient, a lessee may elect not to assess whether a COVID-19 related rent concession from a lessor is a lease modification.
The Group applied the amendments to IFRS 16 already in 2020 for the first time. The effect of the accounting is presented under “rent concessions” lines.
One of the conditions of applying the amendment was that it related to a reduction in lease payments due originally on or before 30 June 2021. However, the pandemic has continued beyond the period envisaged when the 2020 Amendment was issued. In April 2021 IASB has extended the amendment to IFRS 16 and the entities will be allowed to apply the amendment to a reduction in lease payments originally due on or before 30 June 2022 (“the 2021 Amendment”). This amendment was approved by European Union in Q3 2021 and applied by Group in this interim report.
In late 2019 a novel strain of coronavirus, COVID-19, was first detected and in March 2020, the World Health Organization declared COVID-19 a global pandemic. Throughout 2020 and in 2021 COVID-19 spread throughout globally, including the countries the Group operates.
Most governments implemented measures to reduce the spread of COVID-19. These measures include restrictions on travel outside the home countries, closing or imposing limitations on business and other activities as well as encouraging social distancing. Depending on the epidemic situation in particular countries and regions the restrictions were being lifted, reduced, or re-imposed in 2020. With the approvals of first vaccines at the end of 2020, the governments deployed and started carrying out mass vaccination programs in 2021. During 2021 less restrictions and limitations are imposed and significant efforts are put by governments on vaccination programs. With the success of vaccination programs, it is expected that further waves of infections will be avoided, and restrictions and lockdowns will not be imposed in such frequency and severity as in 2020.
This situation is affecting AmRest Group, as well as the global economy. Visible results of the COVID-19 outbreak include the decrease in demand, the disruption or slowdown of supply chains and a significant increase in economic uncertainty, increase of volatility in the price of assets, exchange rates and a decrease in long term interest rates. Possible results of the COVID-19 outbreak may include changes in the market environment, people’s behaviors and ways of living.
The COVID-19 pandemic is having a particularly significant negative impact on the restaurant sectors. Periodical bans or significant restrictions have been imposed on the restaurant operators in various countries. That results in significant decrease in business activity. High pressure on social distancing has an impact on the customer demand and daily lives and behavior patterns. The Group is continuously adjusting restaurant operations into new reality. The Group is adapting to new local sanitary regulations, developing, and executing safety measures to protect employees and guests.
To strengthen Group’s position in terms of liquidity the Group drew available tranche of syndicated bank loan, and applied state supported bank loans on French, Spanish and Russian markets in 2020. The Group maintained close communication with its financing banks and bondholders. Waiver covenants for the fourth quarter of 2020 and the first, second and third quarters of 2021 were replaced by a covenant to maintain a minimum level of liquidity. This covenant was met as at 30 September 2021.
As at 30 September 2021 The Group has presented its full Syndicated bank loans as current liabilities. Final repayment date of the loan based on the agreement is 30 September 2022. As contractual maturity is one year, Group presented loan as current, as required by IAS 1. The Group is analyzing various financing options.
The Group continues the review of its rental agreements and negotiations with landlords. Another tool that allows to support liquidity management is the continuous assessment of its development commitments.
The Group is also closely monitoring the situation on local markets and is taking the benefits of available government aid schemes.
On the revenues streams side, the Group keeps high number of stores operative. As at 30 September 2021 over 99 % of stores remained open. The Group is continuously analyzing the dynamic changes in the environment and adjusts
(all figures in EUR millions unless stated otherwise)
AMREST GROUP INTERIM REPORT for 9 months ended 30 September 2021 28
its ongoing operations to minimize the risk of disruption of business continuity and to increase possible ways of providing products and services to Group’s customers, ensuring staff and guests safety, as well complying with all government directives.
Based on the available information, facts, circumstances and uncertainties about the future, which is at least, but is not limited to, twelve months from the end of the reporting period, the Board of Directors concluded that going concern assumption applies in the foreseeable future. Consequently, this interim report has been prepared under going concern principle.
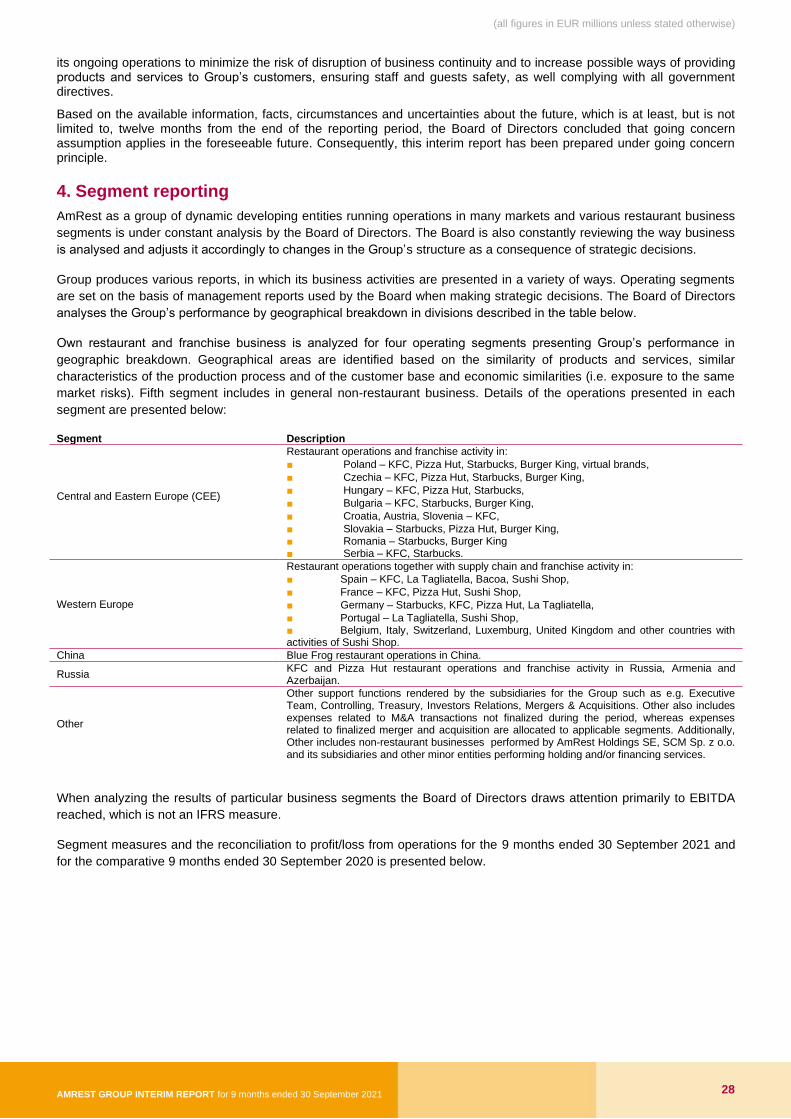
4. Segment reporting
AmRest as a group of dynamic developing entities running operations in many markets and various restaurant business
segments is under constant analysis by the Board of Directors. The Board is also constantly reviewing the way business
is analysed and adjusts it accordingly to changes in the Group’s structure as a consequence of strategic decisions.
Group produces various reports, in which its business activities are presented in a variety of ways. Operating segments
are set on the basis of management reports used by the Board when making strategic decisions. The Board of Directors
analyses the Group’s performance by geographical breakdown in divisions described in the table below.
Own restaurant and franchise business is analyzed for four operating segments presenting Group’s performance in
geographic breakdown. Geographical areas are identified based on the similarity of products and services, similar
characteristics of the production process and of the customer base and economic similarities (i.e. exposure to the same
market risks). Fifth segment includes in general non-restaurant business. Details of the operations presented in each
segment are presented below:
Segment Description
Central and Eastern Europe (CEE)
Restaurant operations and franchise activity in:
■ Poland – KFC, Pizza Hut, Starbucks, Burger King, virtual brands,
■ Czechia – KFC, Pizza Hut, Starbucks, Burger King,
■ Hungary – KFC, Pizza Hut, Starbucks,
■ Bulgaria – KFC, Starbucks, Burger King,
■ Croatia, Austria, Slovenia – KFC,
■ Slovakia – Starbucks, Pizza Hut, Burger King, ■ Romania – Starbucks, Burger King ■ Serbia – KFC, Starbucks.
Western Europe
Restaurant operations together with supply chain and franchise activity in:
■ Spain – KFC, La Tagliatella, Bacoa, Sushi Shop,
■ France – KFC, Pizza Hut, Sushi Shop,
■ Germany – Starbucks, KFC, Pizza Hut, La Tagliatella,
■ Portugal – La Tagliatella, Sushi Shop, ■ Belgium, Italy, Switzerland, Luxemburg, United Kingdom and other countries with activities of Sushi Shop.
China Blue Frog restaurant operations in China.
Russia KFC and Pizza Hut restaurant operations and franchise activity in Russia, Armenia and Azerbaijan.
Other
Other support functions rendered by the subsidiaries for the Group such as e.g. Executive Team, Controlling, Treasury, Investors Relations, Mergers & Acquisitions. Other also includes expenses related to M&A transactions not finalized during the period, whereas expenses related to finalized merger and acquisition are allocated to applicable segments. Additionally, Other includes non-restaurant businesses performed by AmRest Holdings SE, SCM Sp. z o.o. and its subsidiaries and other minor entities performing holding and/or financing services.
When analyzing the results of particular business segments the Board of Directors draws attention primarily to EBITDA
reached, which is not an IFRS measure.
Segment measures and the reconciliation to profit/loss from operations for the 9 months ended 30 September 2021 and
for the comparative 9 months ended 30 September 2020 is presented below.
(all figures in EUR millions unless stated otherwise)
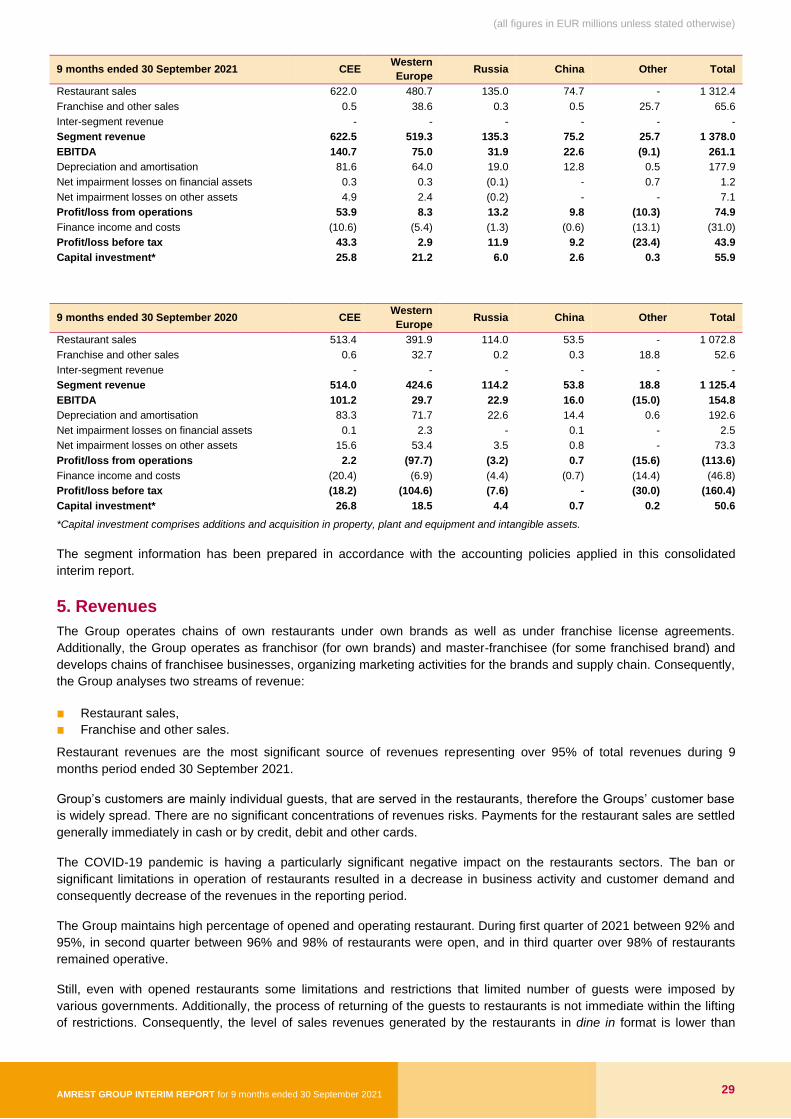
AMREST GROUP INTERIM REPORT for 9 months ended 30 September 2021 29
9 months ended 30 September 2021 CEE Western
Europe Russia China Other Total
Restaurant sales 622.0 480.7 135.0 74.7 - 1 312.4
Franchise and other sales 0.5 38.6 0.3 0.5 25.7 65.6
Inter-segment revenue - - - - - -
Segment revenue 622.5 519.3 135.3 75.2 25.7 1 378.0
EBITDA 140.7 75.0 31.9 22.6 (9.1) 261.1
Depreciation and amortisation 81.6 64.0 19.0 12.8 0.5 177.9
Net impairment losses on financial assets 0.3 0.3 (0.1) - 0.7 1.2
Net impairment losses on other assets 4.9 2.4 (0.2) - - 7.1
Profit/loss from operations 53.9 8.3 13.2 9.8 (10.3) 74.9
Finance income and costs (10.6) (5.4) (1.3) (0.6) (13.1) (31.0)
Profit/loss before tax 43.3 2.9 11.9 9.2 (23.4) 43.9
Capital investment* 25.8 21.2 6.0 2.6 0.3 55.9
9 months ended 30 September 2020 CEE Western
Europe Russia China Other Total
Restaurant sales 513.4 391.9 114.0 53.5 - 1 072.8
Franchise and other sales 0.6 32.7 0.2 0.3 18.8 52.6
Inter-segment revenue - - - - - -
Segment revenue 514.0 424.6 114.2 53.8 18.8 1 125.4
EBITDA 101.2 29.7 22.9 16.0 (15.0) 154.8
Depreciation and amortisation 83.3 71.7 22.6 14.4 0.6 192.6
Net impairment losses on financial assets 0.1 2.3 - 0.1 - 2.5
Net impairment losses on other assets 15.6 53.4 3.5 0.8 - 73.3
Profit/loss from operations 2.2 (97.7) (3.2) 0.7 (15.6) (113.6)
Finance income and costs (20.4) (6.9) (4.4) (0.7) (14.4) (46.8)
Profit/loss before tax (18.2) (104.6) (7.6) - (30.0) (160.4)
Capital investment* 26.8 18.5 4.4 0.7 0.2 50.6
*Capital investment comprises additions and acquisition in property, plant and equipment and intangible assets.
The segment information has been prepared in accordance with the accounting policies applied in this consolidated
interim report.
5. Revenues
The Group operates chains of own restaurants under own brands as well as under franchise license agreements.
Additionally, the Group operates as franchisor (for own brands) and master-franchisee (for some franchised brand) and
develops chains of franchisee businesses, organizing marketing activities for the brands and supply chain. Consequently,
the Group analyses two streams of revenue:
■ Restaurant sales,
■ Franchise and other sales.
Restaurant revenues are the most significant source of revenues representing over 95% of total revenues during 9
months period ended 30 September 2021.
Group’s customers are mainly individual guests, that are served in the restaurants, therefore the Groups’ customer base
is widely spread. There are no significant concentrations of revenues risks. Payments for the restaurant sales are settled
generally immediately in cash or by credit, debit and other cards.
The COVID-19 pandemic is having a particularly significant negative impact on the restaurants sectors. The ban or
significant limitations in operation of restaurants resulted in a decrease in business activity and customer demand and
consequently decrease of the revenues in the reporting period.
The Group maintains high percentage of opened and operating restaurant. During first quarter of 2021 between 92% and
95%, in second quarter between 96% and 98% of restaurants were open, and in third quarter over 98% of restaurants
remained operative.
Still, even with opened restaurants some limitations and restrictions that limited number of guests were imposed by
various governments. Additionally, the process of returning of the guests to restaurants is not immediate within the lifting
of restrictions. Consequently, the level of sales revenues generated by the restaurants in dine in format is lower than
(all figures in EUR millions unless stated otherwise)
AMREST GROUP INTERIM REPORT for 9 months ended 30 September 2021 30
before the COVID-19 outbreak. It is not possible to reliably and objectively quantify the economic impact of pandemic
situation on the Group's revenues.
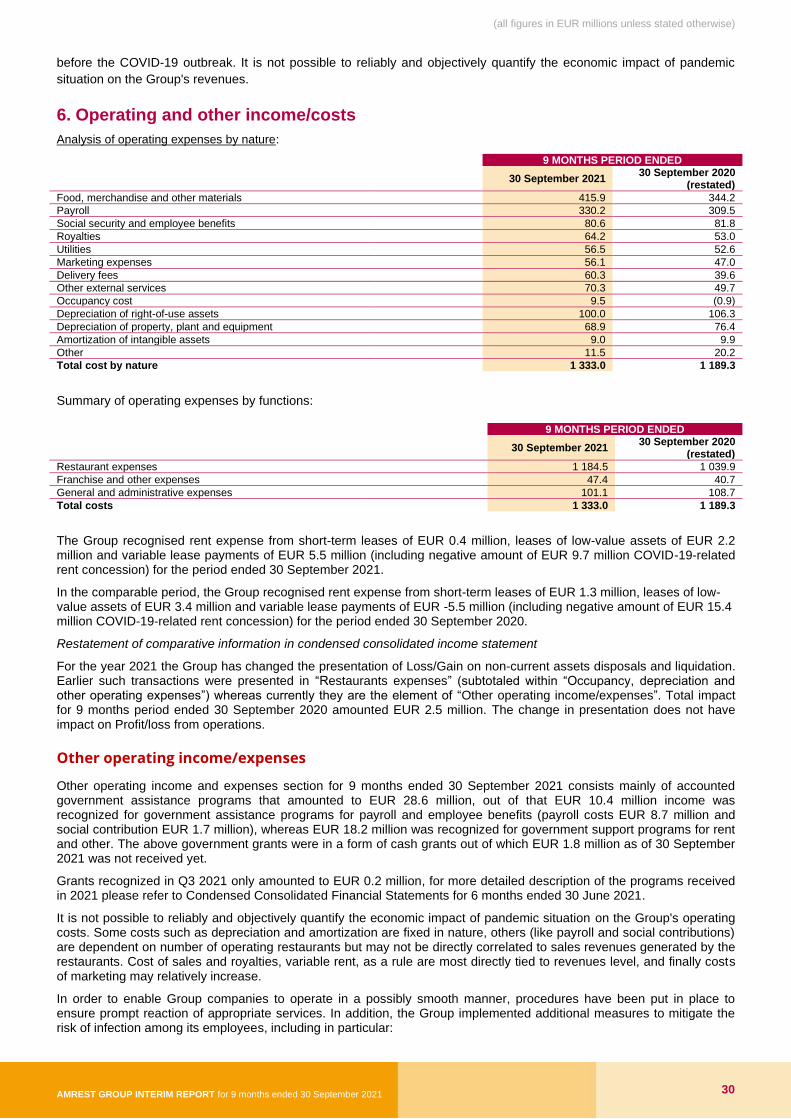
6. Operating and other income/costs
Analysis of operating expenses by nature:
9 MONTHS PERIOD ENDED
30 September 2021 30 September 2020
(restated)
Food, merchandise and other materials 415.9 344.2
Payroll 330.2 309.5
Social security and employee benefits 80.6 81.8
Royalties 64.2 53.0
Utilities 56.5 52.6
Marketing expenses 56.1 47.0
Delivery fees 60.3 39.6
Other external services 70.3 49.7
Occupancy cost 9.5 (0.9)
Depreciation of right-of-use assets 100.0 106.3
Depreciation of property, plant and equipment 68.9 76.4
Amortization of intangible assets 9.0 9.9
Other 11.5 20.2
Total cost by nature 1 333.0 1 189.3
Summary of operating expenses by functions:
9 MONTHS PERIOD ENDED
30 September 2021 30 September 2020
(restated)
Restaurant expenses 1 184.5 1 039.9
Franchise and other expenses 47.4 40.7
General and administrative expenses 101.1 108.7
Total costs 1 333.0 1 189.3
The Group recognised rent expense from short-term leases of EUR 0.4 million, leases of low-value assets of EUR 2.2 million and variable lease payments of EUR 5.5 million (including negative amount of EUR 9.7 million COVID-19-related rent concession) for the period ended 30 September 2021.
In the comparable period, the Group recognised rent expense from short-term leases of EUR 1.3 million, leases of low-value assets of EUR 3.4 million and variable lease payments of EUR -5.5 million (including negative amount of EUR 15.4 million COVID-19-related rent concession) for the period ended 30 September 2020.
Restatement of comparative information in condensed consolidated income statement
For the year 2021 the Group has changed the presentation of Loss/Gain on non-current assets disposals and liquidation. Earlier such transactions were presented in “Restaurants expenses” (subtotaled within “Occupancy, depreciation and other operating expenses”) whereas currently they are the element of “Other operating income/expenses”. Total impact for 9 months period ended 30 September 2020 amounted EUR 2.5 million. The change in presentation does not have impact on Profit/loss from operations.
Other operating income/expenses
Other operating income and expenses section for 9 months ended 30 September 2021 consists mainly of accounted government assistance programs that amounted to EUR 28.6 million, out of that EUR 10.4 million income was recognized for government assistance programs for payroll and employee benefits (payroll costs EUR 8.7 million and social contribution EUR 1.7 million), whereas EUR 18.2 million was recognized for government support programs for rent and other. The above government grants were in a form of cash grants out of which EUR 1.8 million as of 30 September 2021 was not received yet.
Grants recognized in Q3 2021 only amounted to EUR 0.2 million, for more detailed description of the programs received in 2021 please refer to Condensed Consolidated Financial Statements for 6 months ended 30 June 2021.
It is not possible to reliably and objectively quantify the economic impact of pandemic situation on the Group's operating costs. Some costs such as depreciation and amortization are fixed in nature, others (like payroll and social contributions) are dependent on number of operating restaurants but may not be directly correlated to sales revenues generated by the restaurants. Cost of sales and royalties, variable rent, as a rule are most directly tied to revenues level, and finally costs of marketing may relatively increase.
In order to enable Group companies to operate in a possibly smooth manner, procedures have been put in place to ensure prompt reaction of appropriate services. In addition, the Group implemented additional measures to mitigate the risk of infection among its employees, including in particular:
(all figures in EUR millions unless stated otherwise)
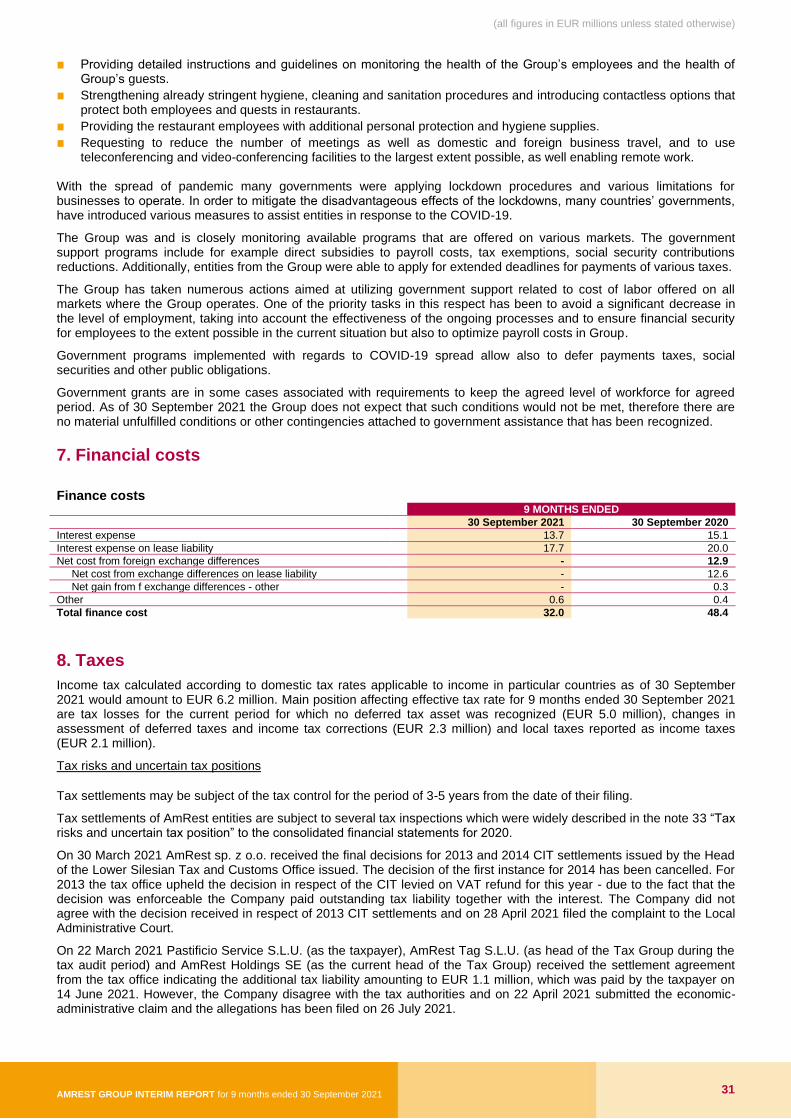
AMREST GROUP INTERIM REPORT for 9 months ended 30 September 2021 31
■ Providing detailed instructions and guidelines on monitoring the health of the Group’s employees and the health of Group’s guests.
■ Strengthening already stringent hygiene, cleaning and sanitation procedures and introducing contactless options that protect both employees and quests in restaurants.
■ Providing the restaurant employees with additional personal protection and hygiene supplies.
■ Requesting to reduce the number of meetings as well as domestic and foreign business travel, and to use teleconferencing and video-conferencing facilities to the largest extent possible, as well enabling remote work.
With the spread of pandemic many governments were applying lockdown procedures and various limitations for businesses to operate. In order to mitigate the disadvantageous effects of the lockdowns, many countries’ governments, have introduced various measures to assist entities in response to the COVID-19.
The Group was and is closely monitoring available programs that are offered on various markets. The government support programs include for example direct subsidies to payroll costs, tax exemptions, social security contributions reductions. Additionally, entities from the Group were able to apply for extended deadlines for payments of various taxes.
The Group has taken numerous actions aimed at utilizing government support related to cost of labor offered on all markets where the Group operates. One of the priority tasks in this respect has been to avoid a significant decrease in the level of employment, taking into account the effectiveness of the ongoing processes and to ensure financial security for employees to the extent possible in the current situation but also to optimize payroll costs in Group.
Government programs implemented with regards to COVID-19 spread allow also to defer payments taxes, social securities and other public obligations.
Government grants are in some cases associated with requirements to keep the agreed level of workforce for agreed period. As of 30 September 2021 the Group does not expect that such conditions would not be met, therefore there are no material unfulfilled conditions or other contingencies attached to government assistance that has been recognized.
7. Financial costs
Finance costs 9 MONTHS ENDED
30 September 2021 30 September 2020
Interest expense 13.7 15.1
Interest expense on lease liability 17.7 20.0
Net cost from foreign exchange differences - 12.9
Net cost from exchange differences on lease liability - 12.6
Net gain from f exchange differences - other - 0.3
Other 0.6 0.4
Total finance cost 32.0 48.4
8. Taxes
Income tax calculated according to domestic tax rates applicable to income in particular countries as of 30 September 2021 would amount to EUR 6.2 million. Main position affecting effective tax rate for 9 months ended 30 September 2021 are tax losses for the current period for which no deferred tax asset was recognized (EUR 5.0 million), changes in assessment of deferred taxes and income tax corrections (EUR 2.3 million) and local taxes reported as income taxes (EUR 2.1 million).
Tax risks and uncertain tax positions
Tax settlements may be subject of the tax control for the period of 3-5 years from the date of their filing.
Tax settlements of AmRest entities are subject to several tax inspections which were widely described in the note 33 “Tax risks and uncertain tax position” to the consolidated financial statements for 2020.
On 30 March 2021 AmRest sp. z o.o. received the final decisions for 2013 and 2014 CIT settlements issued by the Head of the Lower Silesian Tax and Customs Office issued. The decision of the first instance for 2014 has been cancelled. For 2013 the tax office upheld the decision in respect of the CIT levied on VAT refund for this year - due to the fact that the decision was enforceable the Company paid outstanding tax liability together with the interest. The Company did not agree with the decision received in respect of 2013 CIT settlements and on 28 April 2021 filed the complaint to the Local Administrative Court.
On 22 March 2021 Pastificio Service S.L.U. (as the taxpayer), AmRest Tag S.L.U. (as head of the Tax Group during the tax audit period) and AmRest Holdings SE (as the current head of the Tax Group) received the settlement agreement from the tax office indicating the additional tax liability amounting to EUR 1.1 million, which was paid by the taxpayer on 14 June 2021. However, the Company disagree with the tax authorities and on 22 April 2021 submitted the economic-administrative claim and the allegations has been filed on 26 July 2021.
(all figures in EUR millions unless stated otherwise)
AMREST GROUP INTERIM REPORT for 9 months ended 30 September 2021 32
On 23 June 2021 Pastificio Service S.L.U. received notification of the start of an inspection relating to a municipal tax (business activity tax) for the fiscal years 2018-2021. The tax inspection is related to the Pastificio's activity in the Central Kitchen (Lleida).
Tax proceedings in Sushi Shop Group SAS entity relating to years 2018 and 2019, which started in December 2020, have been finished. On 10 July 2021 the Company accepted the rectification of tax result proposed by French Tax Authority and agreed to pay additional tax liability of EUR 0.3 million together with interest.
On 9 June 2021 AmRest Kft and on 14 June 2021 AmRest Kávézó Kft received the notification letters in respect to planned initiation of tax proceedings. Tax proceeding in AmRest Kft relates to all tax settlements for the period 2018-2019 and in AmRest Kávézó Kft for the year 2019. As of 30 September 2021 and as of the date of publication of this Report tax proceedings have not concluded.
On 20 July 2021 AmRest sp. z o.o. received the notification from the Polish tax authorities in respect to opening the suspended proceedings related to the annulment of the final decision covering VAT for 2014 (detailed background of these proceedings was described in point (a) of the note 33 “Tax risks and uncertain tax position” to the consolidated financial statements for 2020 related to the tax inspections in AmRest sp. z o.o.). On 14 September 2021 the Company received the decision based on which the proceedings related to the annulment of the final decision covering VAT for 2014 were cancelled.
On 19 July 2021 AmRest sp. z o.o. received the notification from the Polish tax authorities in respect to opening the suspended tax inspection covering VAT returns for the period December 2017 – March 2018 (detailed background of these proceedings was described in point (d) of the note 33 “Tax risks and uncertain tax position” to the consolidated financial statements for 2020 related to the tax inspections in AmRest sp. z o.o.).
On 28 July 2021 AmRest sp. z o.o. received the notification from the Polish tax authorities in respect to opening the suspended tax inspection covering VAT returns for the period April – September 2018 (detailed background of these proceedings was described in point (e) of the note 33 “Tax risks and uncertain tax position” to the consolidated financial statements for 2020 related to the tax inspections in AmRest sp. z o.o.).
In 23 August 2021 AmRest sp. z o.o. received the notification stating that tax inspections regarding the VAT settlements for the period from October 2018 to March 2019 (as described in point (f) of the note 33 “Tax risks and uncertain tax position” to the consolidated financial statements for 2020 related to the tax inspections in AmRest sp. z o.o.) had evolved into tax proceedings. The decision of the Tax Office is expected to be issued before the end of 2021.
Since 31 December 2020 till the date of approval of these condensed consolidated financial statements the status of other reported tax related risks has not changed. The Group did not receive any other new decisions except the ones described above and no new tax inspections took place.
The Group’s risk assessment regarding tax risks and uncertainties has not changed since the publication of the consolidated financial statements for 2020, except for the revised approach regarding the tax proceedings in Spain. Therefore, as of 30 September 2021 and as at the date of publication of this Report, no provisions other than the one stated above were created.
In Group’s opinion, there are no other material contingent liabilities concerning pending audits and tax proceedings.
9. Equity
Share capital
Share capital consists of ordinary shares. All shares issued are subscribed and fully paid. The par value of each share is 0.1 EUR.
As of 30 September 2021, and 31 December 2020 the Company has 219 554 183 shares issued.
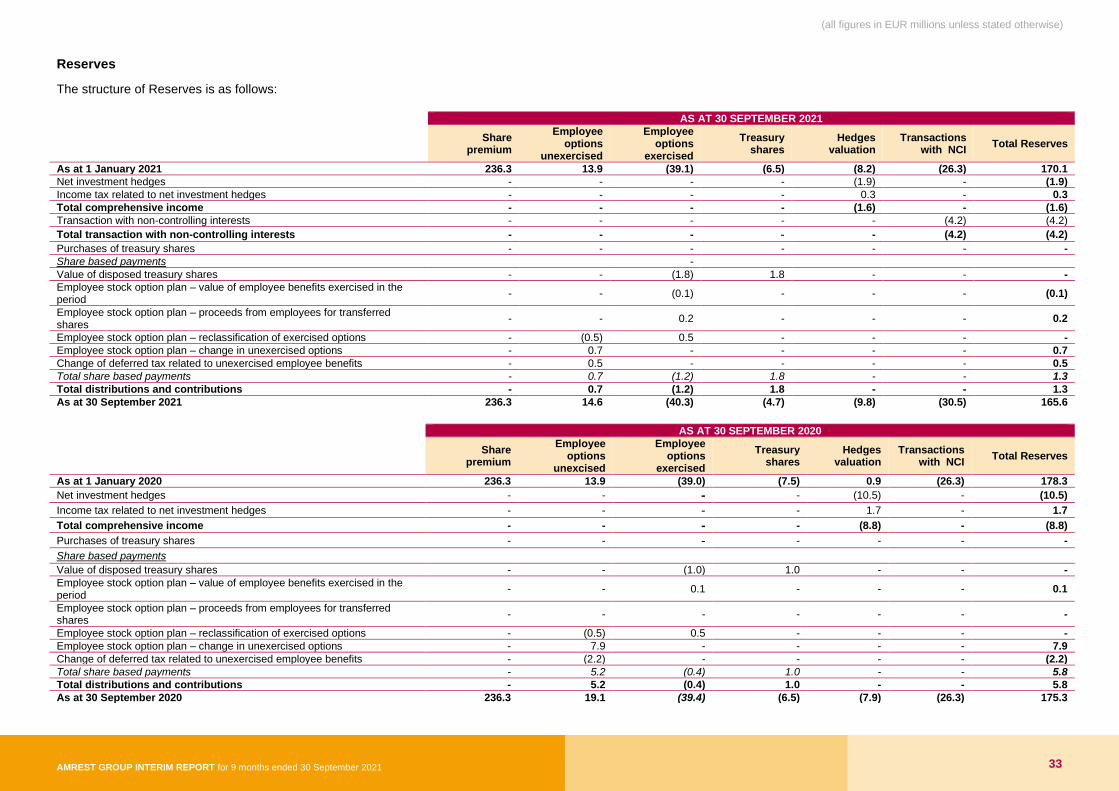
(all figures in EUR millions unless stated otherwise)
AMREST GROUP INTERIM REPORT for 9 months ended 30 September 2021 33
Reserves
The structure of Reserves is as follows:
AS AT 30 SEPTEMBER 2021
Share
premium
Employee options
unexercised
Employee options
exercised
Treasury shares
Hedges valuation
Transactions with NCI
Total Reserves
As at 1 January 2021 236.3 13.9 (39.1) (6.5) (8.2) (26.3) 170.1
Net investment hedges - - - - (1.9) - (1.9)
Income tax related to net investment hedges - - - - 0.3 - 0.3
Total comprehensive income - - - - (1.6) - (1.6)
Transaction with non-controlling interests - - - - - (4.2) (4.2)
Total transaction with non-controlling interests - - - - - (4.2) (4.2)
Purchases of treasury shares - - - - - - -
Share based payments -
Value of disposed treasury shares - - (1.8) 1.8 - - -
Employee stock option plan – value of employee benefits exercised in the period
- - (0.1) - - - (0.1)
Employee stock option plan – proceeds from employees for transferred shares
- - 0.2 - - - 0.2
Employee stock option plan – reclassification of exercised options - (0.5) 0.5 - - - -
Employee stock option plan – change in unexercised options - 0.7 - - - - 0.7
Change of deferred tax related to unexercised employee benefits - 0.5 - - - - 0.5
Total share based payments - 0.7 (1.2) 1.8 - - 1.3
Total distributions and contributions - 0.7 (1.2) 1.8 - - 1.3
As at 30 September 2021 236.3 14.6 (40.3) (4.7) (9.8) (30.5) 165.6
AS AT 30 SEPTEMBER 2020
Share
premium
Employee options
unexcised
Employee options
exercised
Treasury shares
Hedges valuation
Transactions with NCI
Total Reserves
As at 1 January 2020 236.3 13.9 (39.0) (7.5) 0.9 (26.3) 178.3
Net investment hedges - - - - (10.5) - (10.5)
Income tax related to net investment hedges - - - - 1.7 - 1.7
Total comprehensive income - - - - (8.8) - (8.8)
Purchases of treasury shares - - - - - - -
Share based payments
Value of disposed treasury shares - - (1.0) 1.0 - - -
Employee stock option plan – value of employee benefits exercised in the period
- - 0.1 - - - 0.1
Employee stock option plan – proceeds from employees for transferred shares
- - - - - - -
Employee stock option plan – reclassification of exercised options - (0.5) 0.5 - - - -
Employee stock option plan – change in unexercised options - 7.9 - - - - 7.9
Change of deferred tax related to unexercised employee benefits - (2.2) - - - - (2.2)
Total share based payments - 5.2 (0.4) 1.0 - - 5.8
Total distributions and contributions - 5.2 (0.4) 1.0 - - 5.8
As at 30 September 2020 236.3 19.1 (39.4) (6.5) (7.9) (26.3) 175.3
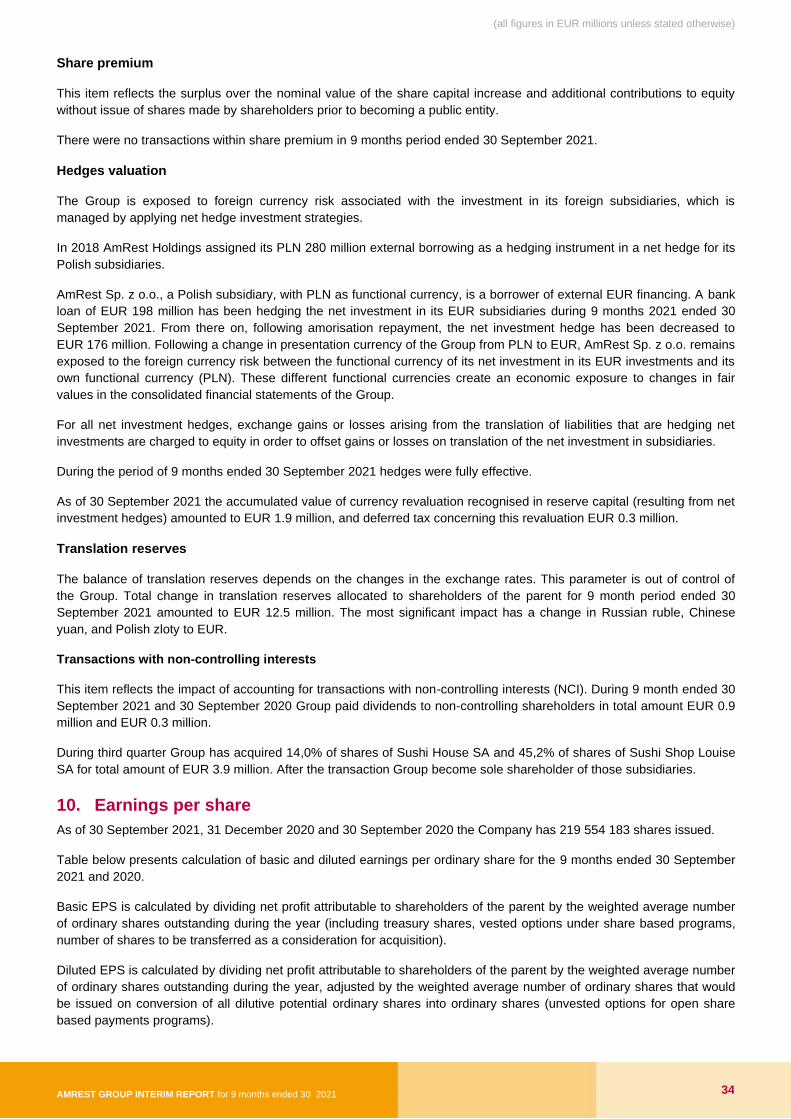
(all figures in EUR millions unless stated otherwise)
AMREST GROUP INTERIM REPORT for 9 months ended 30 2021 34
Share premium
This item reflects the surplus over the nominal value of the share capital increase and additional contributions to equity
without issue of shares made by shareholders prior to becoming a public entity.
There were no transactions within share premium in 9 months period ended 30 September 2021.
Hedges valuation
The Group is exposed to foreign currency risk associated with the investment in its foreign subsidiaries, which is
managed by applying net hedge investment strategies.
In 2018 AmRest Holdings assigned its PLN 280 million external borrowing as a hedging instrument in a net hedge for its
Polish subsidiaries.
AmRest Sp. z o.o., a Polish subsidiary, with PLN as functional currency, is a borrower of external EUR financing. A bank
loan of EUR 198 million has been hedging the net investment in its EUR subsidiaries during 9 months 2021 ended 30
September 2021. From there on, following amorisation repayment, the net investment hedge has been decreased to
EUR 176 million. Following a change in presentation currency of the Group from PLN to EUR, AmRest Sp. z o.o. remains
exposed to the foreign currency risk between the functional currency of its net investment in its EUR investments and its
own functional currency (PLN). These different functional currencies create an economic exposure to changes in fair
values in the consolidated financial statements of the Group.
For all net investment hedges, exchange gains or losses arising from the translation of liabilities that are hedging net
investments are charged to equity in order to offset gains or losses on translation of the net investment in subsidiaries.
During the period of 9 months ended 30 September 2021 hedges were fully effective.
As of 30 September 2021 the accumulated value of currency revaluation recognised in reserve capital (resulting from net
investment hedges) amounted to EUR 1.9 million, and deferred tax concerning this revaluation EUR 0.3 million.
Translation reserves
The balance of translation reserves depends on the changes in the exchange rates. This parameter is out of control of
the Group. Total change in translation reserves allocated to shareholders of the parent for 9 month period ended 30
September 2021 amounted to EUR 12.5 million. The most significant impact has a change in Russian ruble, Chinese
yuan, and Polish zloty to EUR.
Transactions with non-controlling interests
This item reflects the impact of accounting for transactions with non-controlling interests (NCI). During 9 month ended 30
September 2021 and 30 September 2020 Group paid dividends to non-controlling shareholders in total amount EUR 0.9
million and EUR 0.3 million.
During third quarter Group has acquired 14,0% of shares of Sushi House SA and 45,2% of shares of Sushi Shop Louise
SA for total amount of EUR 3.9 million. After the transaction Group become sole shareholder of those subsidiaries.
10. Earnings per share
As of 30 September 2021, 31 December 2020 and 30 September 2020 the Company has 219 554 183 shares issued.
Table below presents calculation of basic and diluted earnings per ordinary share for the 9 months ended 30 September
2021 and 2020.
Basic EPS is calculated by dividing net profit attributable to shareholders of the parent by the weighted average number
of ordinary shares outstanding during the year (including treasury shares, vested options under share based programs,
number of shares to be transferred as a consideration for acquisition).
Diluted EPS is calculated by dividing net profit attributable to shareholders of the parent by the weighted average number
of ordinary shares outstanding during the year, adjusted by the weighted average number of ordinary shares that would
be issued on conversion of all dilutive potential ordinary shares into ordinary shares (unvested options for open share
based payments programs).
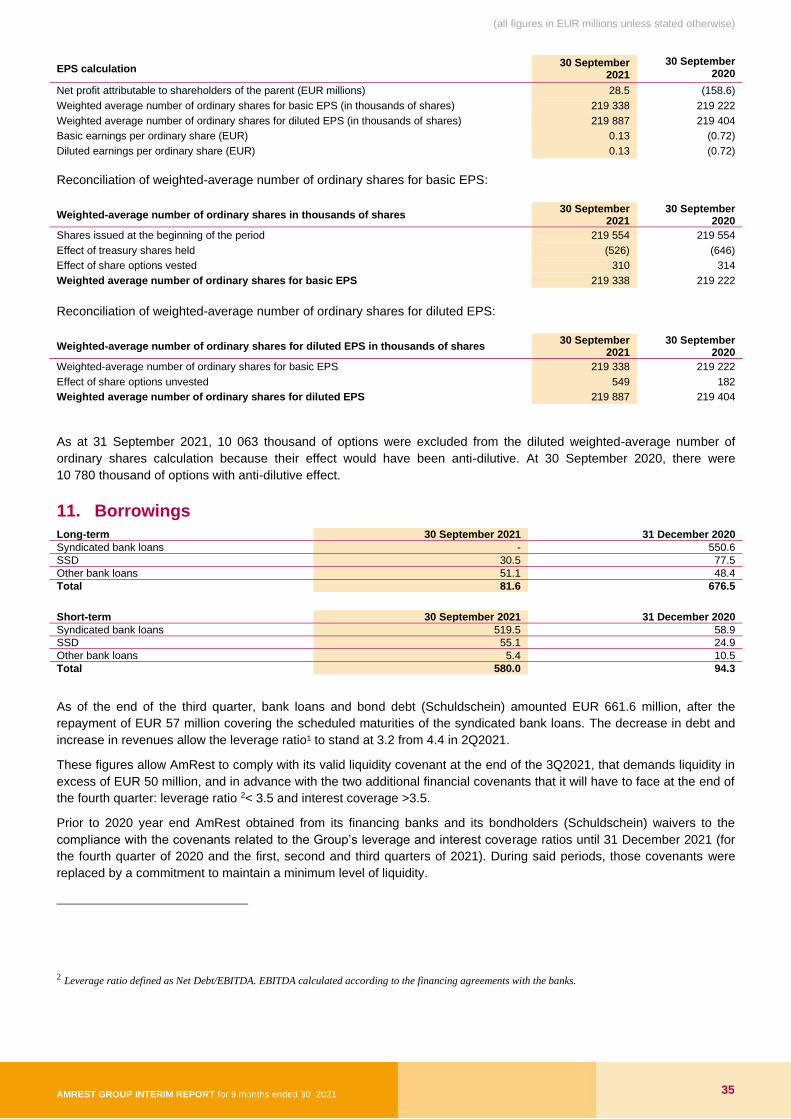
(all figures in EUR millions unless stated otherwise)
AMREST GROUP INTERIM REPORT for 9 months ended 30 2021 35
EPS calculation 30 September
2021
30 September 2020
Net profit attributable to shareholders of the parent (EUR millions) 28.5 (158.6)
Weighted average number of ordinary shares for basic EPS (in thousands of shares) 219 338 219 222
Weighted average number of ordinary shares for diluted EPS (in thousands of shares) 219 887 219 404
Basic earnings per ordinary share (EUR) 0.13 (0.72)
Diluted earnings per ordinary share (EUR) 0.13 (0.72)
Reconciliation of weighted-average number of ordinary shares for basic EPS:
Weighted-average number of ordinary shares in thousands of shares 30 September
2021 30 September
2020
Shares issued at the beginning of the period 219 554 219 554
Effect of treasury shares held (526) (646)
Effect of share options vested 310 314
Weighted average number of ordinary shares for basic EPS 219 338 219 222
Reconciliation of weighted-average number of ordinary shares for diluted EPS:
Weighted-average number of ordinary shares for diluted EPS in thousands of shares 30 September
2021 30 September
2020
Weighted-average number of ordinary shares for basic EPS 219 338 219 222
Effect of share options unvested 549 182
Weighted average number of ordinary shares for diluted EPS 219 887 219 404
As at 31 September 2021, 10 063 thousand of options were excluded from the diluted weighted-average number of
ordinary shares calculation because their effect would have been anti-dilutive. At 30 September 2020, there were
10 780 thousand of options with anti-dilutive effect.
11. Borrowings
Long-term 30 September 2021 31 December 2020
Syndicated bank loans - 550.6
SSD 30.5 77.5
Other bank loans 51.1 48.4
Total 81.6 676.5
Short-term 30 September 2021 31 December 2020
Syndicated bank loans 519.5 58.9
SSD 55.1 24.9
Other bank loans 5.4 10.5
Total 580.0 94.3
As of the end of the third quarter, bank loans and bond debt (Schuldschein) amounted EUR 661.6 million, after the
repayment of EUR 57 million covering the scheduled maturities of the syndicated bank loans. The decrease in debt and
increase in revenues allow the leverage ratio¹ to stand at 3.2 from 4.4 in 2Q2021.
These figures allow AmRest to comply with its valid liquidity covenant at the end of the 3Q2021, that demands liquidity in
excess of EUR 50 million, and in advance with the two additional financial covenants that it will have to face at the end of
the fourth quarter: leverage ratio 2< 3.5 and interest coverage >3.5.
Prior to 2020 year end AmRest obtained from its financing banks and its bondholders (Schuldschein) waivers to the
compliance with the covenants related to the Group’s leverage and interest coverage ratios until 31 December 2021 (for
the fourth quarter of 2020 and the first, second and third quarters of 2021). During said periods, those covenants were
replaced by a commitment to maintain a minimum level of liquidity.
2 Leverage ratio defined as Net Debt/EBITDA. EBITDA calculated according to the financing agreements with the banks.
(all figures in EUR millions unless stated otherwise)
AMREST GROUP INTERIM REPORT for 9 months ended 30 2021 36
As at 30 September 2021 the Group has presented its full Syndicated bank loans as current liabilities. Final repayment date of the loan based on the agreement signed is 30 September 2022. As contractual maturity is one year, Group presented loan as current, as required by IAS 1. The Group is analysing various financing options.
12. Changes in the future commitments and contingent liabilities
As in the previous reporting period, the Group’s future liabilities are derived mainly from the franchise agreements and
development agreements. Group restaurants are operated in accordance with franchise and development agreements
with YUM! and subsidiaries of YUM!, Burger King Europe GmbH, Starbucks Coffee International, Inc. In accordance with
these agreements, the Group is obliged to meet certain development commitments as well as maintain the identity,
reputation and high operating standards of each brand. Details of the agreements together with other future commitments
have been described in note 1 and 40d of the Group’s consolidated financial statements for the year ended 31 December
2020. As the COVID-19 pandemic restrictions impacted restaurants operation, the Group is assessing its development
plans.
Commitments regarding credit agreement are described in note 29 and note 30 of the Group’s consolidated financial
statements for the year ended 31 December 2020.
13. Events after the reporting period
After 30 September 2021, until the date of publication of this interim report, COVID-19 pandemic continues. Significant
efforts are put by governments to mass vaccination programs to succeed and allow to reduce any future infection cycles.
Group’s revenues and operations after 30 September 2021 were not affected by unexpected factors. Still the
uncertainties exist, and the effects of the pandemic cannot be reliably estimated.

AMREST GROUP INTERIM REPORT for 3 months ended 31 March 2021 37
AMREST GROUP INTERIM REPORT for 3 months ended 31 March 2021 38
This Interim Report has been approved by resolution
of the Board of Directors following the recommendation of the Audit Committee.
Wroclaw, 10 November 2021

AMREST GROUP INTERIM REPORT for 3 months ended 31 March 2021 39
AmRest Holdings SE
28046 Madrid, Spain
NIP A88063979 | +34 91 799 16 50 | amrest.eu