Embed Size (px)
Citation preview

INTERIM RESULTS FOR THE PERIOD ENDED SEPTEMBER 30, 2015
Highlights
• EBITDA* in the quarter reported a loss of $5.9 million compared to 2Q loss of $25.3 million.
• Board maintains dividend at $0.45 per share for the quarter.
• Golar, Perenco and SNH sign and execute all contracts for the GoFLNG Hilli Project – vessel to commence
operations in Q2 2017 with a minimum annual expected EBITDA**
of $170m for 50% capacity utilisation for
its initial 8-year contract.
• Placed order for an additional FSRU newbuild with Samsung.
• Golar Partners reported a record 3Q EBITDA of $94.9 million. Golar owns 30.4% (plus IDRs) of Golar LNG
Partners. We only recognise $6.8 million contribution from Golar Partners in 3Q results.
Subsequent events
• Gazprom, Perenco and SNH sign a firm 8-year Sale and Purchase contract for LNG from GoFLNG Hilli.
• Golar Hilli Corporation received a $500 million guarantee from Perenco and SNH for their performance under
the GoFLNG Hilli contract and has in return issued a $400 million guarantee to Perenco and SNH.
• The LNG carrier pool “The Cool Pool” successfully commenced operations.
• Executed a firm 5-year contract with West Africa Gas Limited and received financing for FSRU Golar Tundra.
Financial Review
Business Performance
2015 2015
(in thousands of $) Jul-Sep Apr-Jun
Time and voyage charter revenues 24,252
16,922
Vessel and other management fees 3,126
3,222
Vessel operating expenses (13,519) (14,801)
Voyage and commission expenses (12,384) (21,424)
Administrative expenses (7,339) (9,214)
Depreciation and amortization (18,376) (18,118)
Total Adjusted Operating Losses*** (24,240) (43,413)
Add back
Depreciation and amortization 18,376 18,118
EBITDA* (5,864) (25,295)
Golar LNG Limited (“Golar” or “the Company”) reported today a 3Q operating loss of $24.2 million as compared
to $43.4 million in 2Q. In line with expectations, 3Q reported an improvement in vessel utilisation, albeit from a
very low level in 2Q. Although headline charter rates remained relatively constant across the quarters, the increase

in utilisation from 33% in 2Q to 43% in 3Q together with improved round trip economics resulted in an increase in
time charter revenues from $16.9 million in 2Q to $24.3 million in 3Q. With the exception of the Golar Penguin, all
of the carriers recorded utilisation at or above prior quarter levels.
3Q voyage costs decreased $9.0 million from $21.4 million in 2Q to $12.4 million. The obligation to charter back
the Golar Eskimo from Golar Partners in the period prior to delivery in Jordan finished at the end of 2Q. Savings in
payments to Golar Partners net of revenues received for the Eskimo account for $6.5 million of this $9.0 million
reduction. Reduced bunkers as a result of improved vessel utilisation accounted for most of the remaining $2.5
million decrease. Of the $12.4 million 3Q voyage and commission expenses, $6.7 million represents the cost of
chartering in the Golar Grand from Golar Partners. The remaining $5.7 million is predominantly bunker and
positioning costs.
Vessel operating expenses decreased $1.3 million to $13.5 million in 3Q. Administration costs decreased $1.9
million over 2Q to $7.3 million in 3Q with reductions in legal and non-cash share option related expenses
accounting for most of the decrease.
Collectively the above resulted in a $19.4 million increase in EBITDA from a loss of $25.3 million in 2Q to a loss
of $5.9 million in 3Q.
Net Income Summary
(in thousands of $) 2015 2015
Jul-Sep Apr-Jun
Total Adjusted Operating Loss*** (24,240) (43,413)
Net gain on disposals (includes amortization of deferred gains) 127 126
Impairment on asset held for sale - (1,032)
Dividend income 3,914 3,914
Net interest expense (16,077) (15,722)
Other financial items (110,412) 50,802
Taxes 760 742
Equity in net earnings of affiliates 2,908 4,406
Net (loss) / income (143,020) (177)
In 3Q the Company generated a substantial net loss of $143.0 million. A material portion of this loss is the result of
non-cash items including:
Total return equity swap loss of $67.2 million on 3.5 million underlying Golar shares.
Interest rate swap loss of $22.3 million.
In addition, a loan impairment has been recognised in 3Q for a transaction expected to take place during 4Q:
Impairment of $15.0 million on a loan receivable from PT Equinox in connection with the repossession of
the vessel Salju (formerly Golar Viking).
The Company has received $13.1 million in cash in respect of its common units, subordinated units, GP and IDRs
in Golar Partners. The Partnership contributed a positive $6.8 million to the Company’s 3Q result (represented by

$3.9 million in dividend income and $2.9 million in equity in net earnings of affiliates). The difference has been
booked against the balance sheet under Investment in Affiliates.
Net interest expense increased from $15.7 million in 2Q to $16.1 million in 3Q. Included in the other financial
items of $110.4 million is a non-cash loss of $89.5 million, mainly related to derivative movements as noted above.
The equity TRS loss as at September 30 was marked-to-market using a share price of $27.88.
Anticipated short-haul cabotage trade opportunities in Indonesia, ideally suited to the Salju, have failed to
materialise as expected. Golar, acting as the main lender to this vessel, has therefore agreed to the repossession of
Salju from P.T. Equinox based on a vessel valuation of $125 million which is in line with current market valuations.
This will be satisfied by extinguishing a loan to the vessel owning company and therefore no cash will actually be
paid. As the vessel valuation is lower than the $138.6 million loan and working capital advances receivable by
Golar from P.T. Equinox and the equity injected by P.T. Equinox has been exhausted, a non-cash impairment of
$15.0 million (net of associated repossession costs) has been recognised. The vessel has no mortgage debt other
than what is due to Golar LNG.
Commercial Review
LNG Shipping and FSRU Performance
Overall 3Q LNG Carrier activity levels were a little higher than 2Q with utilisation of our spot fleet increasing from
33% in 2Q to 43% 3Q. Average 3Q charter rates for the spot fleet were in the range of $35,000 per day. Spot
charters have typically been for much shorter voyages than seen in recent years as intra-basin trade has become the
norm. This has increased both activity levels and vessel availability.
To date, Middle East demand has been the main driver of LNG carrier spot fixtures. Fixing activity in the Middle
East and Atlantic regions has been higher than in the Pacific. Both Egypt and Jordan have recently concluded
tenders to buy 56 and 19 cargoes respectively through to the end of 2016. Activity levels in 4Q have continued to
improve, particularly for European reloads heading into the new terminals in the Middle East, and in the Atlantic in
general.
The “Cool Pool” formation comprising Golar (8 carriers contributed), Gaslog (3 carriers) and Dynagas (3 carriers)
was completed and commenced operations on October 1. The Pool has been very well received by the market. Of
the 17 spot voyage charters concluded globally during October, 10 were with the Cool Pool. Improved scheduling
ability including the ability to fix forward and reduced positioning costs and cost efficiencies as a result of the
common marketing of vessels are expected to result in continuing improvements in vessel utilisation and further
reductions to voyage costs in 4Q.
Gladstone LNG initiated operations during October and Australia Pacific LNG is expected to commence operations
before year-end. Indonesia’s Senora-Donggi project and the second train of BG’s Queensland Curtis project also
continue to ramp up LNG production rates. Cheniere have indicated that Sabine Pass will load its first cargo in
early 2016. Demand for shipping, particularly in the over-provided for Pacific basin is therefore expected to
gradually improve over the coming quarters.
Golar’s existing fleet of 6 operating FSRUs, all of which reside within Golar Partners, continue to operate reliably
with 100% availability (excluding 3 days scheduled drydocking).

Investment Review
Conversion Contracts
GoFLNG Hilli conversion progress remains on schedule with the project’s contingency budget remaining
substantially untapped. During the quarter the vessel re-entered Keppel drydock and prefabricated sponsons are
now in the process of being attached to the hull. This work will continue for the remainder of this year. Pre
fabrication of the process top side modules and pipe racks has now commenced with most major equipment items
for the conversion now delivered to the shipyard.
Golar continues to work constructively with Keppel Corp with respect to the scheduling of the conversion of
Gandria and Gimi. The total commitment to these two ships remains at $50 million. Both contracts allow for their
termination after deduction of a set cancellation fee. In view of the prevailing uncertainty in the energy markets,
Golar does not intend to accelerate these conversions before satisfactory financing and firm client contracts are in
place. The ordering of long-lead items for these two vessels does however preserve Golar’s ability to meet clients
2018 and 2019 production schedules.
FSRU Newbuild
On July 17 Golar placed an order with Samsung Heavy Industries for an additional FSRU newbuild. Delivering in
November 2017, this FSRU is timed to meet the requirements of a number of specific FSRU opportunities that
Golar is currently pursuing. Buoyed by attractively priced and available LNG supply, current demand for FSRUs is
strong. On November 25 the Company took delivery of its 7th FSRU, the newbuild Golar Tundra. Golar Tundra
will shortly proceed to Keppel where the vessel will undergo some minor modifications required to make the FSRU
compatible with receiving facilities currently being constructed in the port of Tema, Ghana.
Business Development Review
FSRU activities
On November 4, Golar and West African Gas Limited (“WAGL”) executed a firm contract for the provision of the
FSRU Golar Tundra to support their LNG import operations in Ghana. A strong counterparty, WAGL is jointly
owned by subsidiaries of the Nigerian National Petroleum Corporation (60%) and Sahara Energy Resource Limited
(40%). The FSRU Tundra will be moored inside the port of Tema at a jetty currently being modified by WAGL
who have also now sourced the required LNG supply. The FSRU contract will be for an initial period of five years
with the option to extend for a further five years on the same terms. Annual EBITDA** from this project is
expected to be $44 million. As this is a five year charter, the FSRU will be offered for purchase to Golar Partners.
Before 2018 approximately 115 million tonnes of new LNG production capacity is expected to come on stream,
equivalent to a 45% increase on the world’s current LNG production capacity. This will not only result in an
increase in the utilisation of existing regasification capacity, but also create a need for additional capacity with the
opening of new markets for LNG. Based upon current customer inquiries the Company is very confident that the
available uncontracted FSRU capacity will be absorbed shortly.
GoFLNG - Business Development Progress
All contracts for the GoFLNG Hilli project have now been signed and the project has taken FID. A Sale and
Purchase Agreement for the LNG off-take has also been executed by Perenco, SNH and Gazprom.

The GoFLNG Hilli is expected to deliver an EBITDA for Golar in the first full year of operation, based on the
utilisation of 2 of the available 4 liquefaction trains, in the range of a minimum of $170 million to maximum of
$300 million. The vessel tariff is floored and capped indexed to Brent in the range of $60/bbl to $102/bbl.
GoFLNG Hilli will commence operations in Cameroon in Q2 2017 and the contract has a duration of 8 years. The
field has reserves to support more than the current two train commitment and Golar will work to increase utilisation
of the vessel. Increasing production to 3 trains is expected to increase EBITDA to between $240 million and $430
million without increasing capital costs.
Ophir’s Fortuna project in Equatorial Guinea where GoFLNG Gandria will be deployed from 1H-2019 has taken
credible steps forward including substantial progress on LNG HoA’s with buyer interest oversubscribed.
Additionally, material progress has been made by Ophir on full field development. Golar expects to make the
conversion agreement effective and issue the notice to proceed to Keppel for the Gandria conversion by mid-2016,
coincident with the project taking FID. Project economics recently presented by Ophir demonstrate very healthy
project economics and robust options for financing.
New GoFLNG business development activity remains focused on maturing projects that have the potential to
commence operations in 2018 with good progress recorded against a number of potential projects. It is however
acknowledged that the window for securing a 2018 start-up GoFLNG project is now narrowing.
Golar is pleased to report that good progress has been made with the Brazilian “Sergipe” greenfield power project,
with solid steps made by the joint venture on EPC contracts for the power station and associated infrastructure and
progression of SPA discussions with potential suppliers of LNG to the project. The project remains on track to sign
binding PPA agreements within the first half 2016. Total committed capital as of today is $5 million in cash and $24
million in guarantees. It remains Golar’s intention to spin off the on shore investment in Sergipe.
Financing and Liquidity Review
FSRU financing
On October 23 Golar received an underwritten financing commitment for the FSRU newbuild, Golar Tundra. On
delivery of the Tundra on November 25, $205 million was drawn down. On November 25, Golar Partners repaid
the $100 million Golar Eskimo vendor financing facility provided by Golar.
FLNG financing
As at September 30, including the value of the original vessel, Golar has invested $436 million in the Hilli
conversion project. Today this investment sits at $452 million. Having executed the Tolling Agreement and the
Midstream Gas Convention with Perenco, the GoFLNG Hilli financing facility is now available. All remaining
conversion and site specific costs for the GoFLNG Hilli are expected to be satisfied by this facility.
The Company is progressing with the financing for FLNG number 2. Several banks have given indications and the
Company expects to have a committed facility in place before the end of Q1.
Liquidity
The cash balance at the end of 3Q was $222.8 million. Financing of the Golar Tundra and repayment by Golar
Partners of the $100 million Eskimo vendor loan have added $150 million to liquidity since September 30. The
Board has focused on efforts to further improve the Company’s liquidity position and reduce risk levels. On the
back of this, the Company has decided and agreed to delay the effective dates for the Gandria and Gimi conversion

projects until employment contracts for these assets are further advanced. The ordering of long lead items has
already secured Golar’s ability to deliver according to the clients’ production schedules for 2018 and 2019. This
strategic adjustment substantially reduces the company’s risk while retaining full upside.
In connection with the final signatures on the GoFLNG Hilli project approval, the contracting parties agreed to
exchange mutual Letters of Credit. Golar Hilli Corporation received a $500 million guarantee from Perenco and
SNH and has, as of November 27, posted a $400 million guarantee to the upstream partners. Golar Hilli
Corporation had, as of execution date, initially posted $305 million to support this guarantee, but expects part of
this to be returned to the Company as the guarantee bank progresses with its syndication process.
The Company has received agreeable terms for financing facilities in relation to existing vessels which could
increase the liquidity position and provide growth capital for the FLNG business of approximately $190 million
over and above the aforementioned $150 million from Tundra and Eskimo and drawdown against the GoFLNG
Hilli financing facility that is expected to amount to approximately $50 million by year end.
Corporate and other matters
Changes to the Board
On August 27, Dan Rabun assumed the role of Chairman of the Board. Formerly Chairman of Ensco plc until May
2015, Mr Rabun has a strong energy background from Ensco and as managing partner in Baker McKenzie’s Dallas
office. He is also currently a Board member of Apache Corporation.
Niels Stolt-Nielsen was appointed to the Board at the Annual General Meeting on September 23. Mr Stolt-Nielsen
is a major owner and Chairman of the world’s leading chemical carrier company, Stolt Nielsen. He is also the
Chairman and founding investor of the LPG Company, Avance Gas.
Share and Convertible Bond Buybacks
As at September 30, 2015, Golar had forward contracts to repurchase 3.5 million of its own shares at an average
price of $27.88 per share. On August 4, Golar also announced that it had approved a unit purchase program under
which the Company may purchase up to $25 million worth of publicly held Golar Partners common units. To date
240,000 shares have been purchased outright at a cost of $5.0 million.
Shares and options
As at September 30, 2015, the total number of shares outstanding in Golar including the 3.5 million shares
repurchased by the Company is 93.5 million. Additionally, there are currently 1.8 million outstanding stock options
in issue with an average strike price of approximately $56.70 per share.
Dividend
The Board has maintained the dividend at $0.45 per share for 3Q. The record date for the dividend will be
December 10, the ex-dividend date is December 8 and the dividend will be paid on or about January 6, 2016.
In order to support the company’s growth prospects the Board has evaluated the Company’s dividend policy. The
dividend was maintained in 3Q however the Board may consider reducing the dividend level in the coming six
quarters until the GoFLNG Hilli project commences. The target will be to free up additional capital to fund growth
within the FLNG segment. The Board continues to see a regular dividend as a key part of the investment return for

shareholders and expects that the long term cashflow generated by the FLNG contracts can provide a good basis for
stable dividends when these contracts commence.
Outlook
The company has passed a very significant milestone in the roll out of its FLNG strategy. The recent FID of the
Cameroon GoFLNG Hilli project fully validates both the technical and commercial aspects of the Company’s
approach to FLNG projects. That the project has reached FID and signing of the final LNG SPA in accordance with
the original schedule proves the strong economics for all parties and confirms the robustness of the GoFLNG
business model. The materialisation of the GoFLNG Hilli project is expected to secure the Company a solid base
cash flow with significant upside potential related to higher utilisation and commodity prices. Good progress by
Ophir and Golar on the GoFLNG Gandria project and a maturing and growing portfolio of FLNG opportunities,
with counterparties ranging from junior explorers to the larger IOC’s, is also encouraging.
The LNG carrier spot market is now showing the first real signs of recovery on the back of new production capacity
starting up and the very welcome acceptance by the market of the Cool Pool. The speed of this recovery will in part
be a function of how trade patterns evolve over the coming months.
The market for FSRU’s has clearly entered into a new phase. Whereas, previously, potential new FSRU projects
were frustrated by the inability to secure LNG supply, we now find holders of uncontracted LNG supply motivated
to accelerate FSRU projects in an effort to reduce their exposure. Based upon current customer inquiries the
Company is very confident that the available uncontracted FSRU capacity will be absorbed shortly.
The Board’s main target is to strengthen Golar’s ability to execute further FLNG projects within the framework of
the Company’s current balance sheet. In order to do so the Board is considering the release of some of the equity
currently tied up in shipping activities and using this to grow the Company’s FLNG activities. This can include
leveraging unencumbered assets, re-leveraging existing debt facilities as well as being open to strategic transactions
within the shipping segment.
The Board is disappointed in the Golar Partners unit price performance in 2015, which has mainly been driven by
the negative sentiment in the MLP market. However, the Board is pleased to see that the underlying business in
Golar Partners is performing well and continues to be supported by long term contracts. Annual Golar Partners
EBITDA* now exceeds $350 million. Golar’s 30.4% ownership of Golar Partners, was, as of September 30, valued
at $280 million and currently generates an expected annual dividend income of $43.7 million. Additionally, Golar is
the owner of 100 % of the general partner interest which owns all of the Incentive Distribution Rights. These
currently produce dividends of $8.7 million per annum at a distribution of $2.31 per unit. This distribution level is
at the beginning of the 50% threshold and further growth in dividends will augment disproportionately, Golar’s
share of dividends from Golar Partners.
The company expects operating earnings to improve in the coming quarters, driven by an improved shipping market
and Golar Tundra commencing operations in 2Q 2016. The Board also expects positive outcomes from the ongoing
contract discussions in the FLNG business within the next six months and see significant opportunities to build a
solid long term contract backlog and cashflow from this business.

The Board is further encouraged to see that the GoFLNG concept, confirmed by the Perenco transaction and
progress with Ophir, provides strong economics to our customers even at oil prices around $40 per barrel, and gas
prices around $5-6 mmbtu. If energy prices stay at these levels there may be material Coal to Gas switching and
strong growth in LNG demand over the years to come. At the same time these price levels do not support
Greenfield LNG developments. Such a high growth scenario driven by low energy prices may lead to improved
market balances in the LNG shipping and FSRU markets and create good opportunities for low cost FLNG
production.
Non-Gaap Measures:
* EBITDA is defined as earnings before interest, depreciation and amortization, impairments and non-recurring items.
** Expected annual EBITDA is based on certain assumptions that management believes are accurate but because of factors described under the heading
“Forward Looking Statements” actual results may differ materially.
*** Adjusted Operating Losses exclude gains and losses on disposals and impairments of assets.

Forward Looking Statements
This press release contains forward-looking statements (as defined in Section 21E of the Securities Exchange Act of
1934, as amended) which reflects management’s current expectations, estimates and projections about its
operations. All statements, other than statements of historical facts, that address activities and events that will,
should, could or may occur in the future are forward-looking statements. Words such as “may,” “could,” “should,”
“would,” “expect,” “plan,” “anticipate,” “intend,” “forecast,” “believe,” “estimate,” “predict,” “propose,”
“potential,” “continue,” or the negative of these terms and similar expressions are intended to identify such forward-
looking statements. These statements are not guarantees of future performance and are subject to certain risks,
uncertainties and other factors, some of which are beyond our control and are difficult to predict. Therefore, actual
outcomes and results may differ materially from what is expressed or forecasted in such forward-looking
statements. You should not place undue reliance on these forward-looking statements, which speak only as of the
date of this press release. Unless legally required, Golar undertakes no obligation to update publicly any forward-
looking statements whether as a result of new information, future events or otherwise.
Among the important factors that could cause actual results to differ materially from those in the forward-looking
statements are: changes in LNG carriers, FSRU and floating LNG vessel market trends, including charter rates,
ship values and technological advancements; changes in the supply and demand for LNG; changes in trading
patterns that affect the opportunities for the profitable operation of LNG carriers, FSRUs; and floating LNG vessels;
changes in Golar’s ability to retrofit vessels as FSRUs and floating LNG vessels, Golar’s ability to obtain financing
for such retrofitting on acceptable terms or at all and the timing of the delivery and acceptance of such retrofitted
vessels; increases in costs; changes in the availability of vessels to purchase, the time it takes to construct new
vessels, or the vessels’ useful lives; changes in the ability of Golar to obtain additional financing; changes in Golar’s
relationships with major chartering parties; changes in Golar’s ability to sell vessels to Golar LNG Partners LP;
Golar’s ability to integrate and realize the benefits of acquisitions; changes in rules and regulations applicable to
LNG carriers, FSRUs and floating LNG vessels; changes in domestic and international political conditions,
particularly where Golar operates; as well as other factors discussed in Golar’s most recent Form 20-F filed with the
Securities and Exchange Commission. Unpredictable or unknown factors also could have material adverse effects
on forward-looking statements.
November 30, 2015
The Board of Directors
Golar LNG Limited
Hamilton, Bermuda
Questions should be directed to:
Golar Management Limited - +44 207 063 7900
Gary Smith - Chief Executive Officer
Brian Tienzo - Chief Financial Officer
Stuart Buchanan - Investor Relations

Golar LNG Limited
UNAUDITED CONDENSED CONSOLIDATED STATEMENTS OF INCOME
2015 2015 2015 2014 2014
(in thousands of $) Jul-Sep Apr-Jun Jan-Sep Jul-Sep Jan-Sep
Time charter revenues 24,252 16,922 70,009 26,009 62,881
Vessel and other management fees 3,126 3,222 9,671 2,825 8,003
Total operating revenues 27,378 20,144 79,680 28,834 70,884
Vessel operating expenses 13,519 14,801 42,857 11,206 36,758
Voyage, charter-hire and commission expenses (1) 12,384 21,424 57,515 6,135 15,490
Administrative expenses 7,339 9,214 23,505 5,630 15,001
Depreciation and amortization 18,376 18,118 54,191 11,220 35,687
Total operating expenses 51,618 63,557 178,068 34,191 102,936
Net gain on disposals to Golar Partners (includes amortization of
deferred gains) 127
126
103,917
184
35,220
Impairment of vessel 'Held for Sale' (2) — (1,032 ) (1,032 ) — —
Other operating gains and losses (LNG Trade) — — — — 1,317
Loss on disposal of vessel — — (5,824 ) — —
Operating (loss) income (24,113 ) (44,319 ) (1,327 ) (5,173 ) 4,485
Other non-operating income (expense)
Dividend income 3,914 3,914 11,409 7,174 20,029
Loss on sale of available-for-sale-securities — — (3,011 ) — —
Other — — — 313 281
Total other non-operating income 3,914 3,914 8,398 7,487 20,310
Financial income (expenses)
Interest income 876 2,318 4,786 322 609
Interest expense (16,953 ) (18,040 ) (51,622 ) (2,070 ) (5,605 )
Other financial items (3) (110,412 ) 50,802 (91,561 ) (410 ) (39,146 )
Net financial (expense) income (126,489 ) 35,080 (138,397 ) (2,158 ) (44,142 )
(Loss) income before taxes and equity in net earnings of
affiliates (146,688 ) (5,325 ) (131,326 ) 156
(19,347 )
Taxes 760 742 2,563 (415 ) 765
Equity in net earnings of affiliates 2,908 4,406 10,133 8,028 15,112
Net (loss) income (143,020 ) (177 ) (118,630 ) 7,769 (3,470 )
Net income attributable to non-controlling interests (3,103 ) (2,386 ) (8,138 ) — —
Net (loss) income attributable to Golar LNG Ltd (146,123 ) (2,563 ) (126,768 ) 7,769 (3,470 )
(1) This includes related party charter-hire expenses of $6.7 million and $13.2 million for the quarters ended September 30, 2015 and June 30,
2015, respectively.
(2) The impairment loss was in relation to the LNG vessel, the LNG Abuja classified as held for sale as of June 30, 2015 but subsequently sold
in July 2015.

(3) Other financial items includes $15.0 million relating to the impairment of the loan receivable due from Equinox in connection with the
disposal of the Golar Viking to PT Equinox in February 2015.

Golar LNG Limited
UNAUDITED CONDENSED CONSOLIDATED STATEMENTS OF COMPREHENSIVE INCOME
2015 2015 2015 2014 2014
(in thousands of $)
Jul-Sep Apr-Jun Jan-Sep Jul-Sep Jan-Sep
Net (loss) income (143,020 ) (177 ) (118,630 ) 7,769 (3,470 )
Other comprehensive income (loss):
Net gain on qualifying cash flow hedging instruments (670 ) 493 (706 ) 4,599 6,350
Net (loss) gain on investments in available-for-sale securities (17,516 ) (3,703 ) (41,898 ) (18,825 ) 39,508
Other comprehensive (loss) income (18,186 ) (3,210 ) (42,604 ) (14,226 ) 45,858
Comprehensive (loss) income (161,206 ) (3,387 ) (161,234 ) (6,457 ) 42,388
Comprehensive (loss) income attributable to:
Stockholders of Golar LNG Limited (164,309 ) (5,773 ) (169,372 ) (6,457 ) 42,388
Non-controlling interests 3,103 2,386 8,138 — —
(161,206 ) (3,387 ) (161,234 ) (6,457 ) 42,388

Golar LNG Limited
CONDENSED CONSOLIDATED BALANCE SHEETS
2015 2014
(in thousands of $) Sep-30 Dec-31
Unaudited Audited
ASSETS
Current
Cash and cash equivalents 222,842 191,410
Restricted cash 108,017 74,162
Other current assets 38,751 30,234
Amounts due from related parties 18,782 9,967
Short-term debt due from related parties — 20,000
Vessel held-for-sale (1) — 132,110
Assets held-for-sale (2) — 284,955
Total current assets 388,392 742,838
Non-current
Restricted cash 425 425
Investment in available-for-sale securities 27,992 275,307
Investment in affiliates 315,698 335,372
Cost method investments 204,172 204,172
Newbuildings 122,921 344,543
Asset under development 435,788 345,205
Vessels and equipment, net 2,228,487 1,648,888
Other non-current assets 215,095 95,243
Long-term debt due from related party 100,000 —
Total assets 4,038,970 3,991,993
LIABILITIES AND STOCKHOLDERS' EQUITY
Current
Current portion of long-term debt 114,800 76,181
Short-term debt 110,065 40,250
Other current liabilities 145,433 88,858
Liabilities held-for-sale (2) — 164,401
Total current liabilities 370,298 369,690
Long-term
Long-term debt 1,590,899 1,264,356
Other long-term liabilities 72,314 75,440
Total Liabilities 2,033,511 1,709,486
Equity
Stockholders' equity 1,995,666 2,280,852
Non-controlling interest 9,793 1,655
Total liabilities and stockholders' equity 4,038,970 3,991,993
(1) In December 2014, we entered into an agreement to sell our LNG carrier the Golar Viking to Equinox. Accordingly, as of December 31,
2014, this vessel was classified as held for sale. The sale of the Golar Viking was completed in February 2015 at a sale price of $135 million.

(2) In December 2014, we entered into an agreement to sell our interests in the companies that own and operate the FSRU, the Golar Eskimo
to Golar Partners. Accordingly, as of December 31, 2014, the net assets associated with the Golar Eskimo sale were classified as 'held for
sale'.

Golar LNG Limited
UNAUDITED CONDENSED CONSOLIDATED STATEMENTS OF CASHFLOWS
2015 2015 2015 2014 2014
(in thousands of $) Jul-Sep Apr-Jun Jan-Sep Jul-Sep Jan-Sep
OPERATING ACTIVITIES
Net (loss) income (143,020 ) (177 ) (118,630 ) 7,769 (3,470 )
Adjustments to reconcile net (loss) income to net cash (used in)
provided by operating activities:
Depreciation and amortization 18,376 18,118 54,191 11,220 35,687
Amortization of deferred tax benefits on intra-group transfers (872 ) (872 ) (2,616 ) (872 ) (2,616 )
Amortization of deferred charges and debt guarantee (27 ) (783 ) (2,454 ) 590 1,683
Gain on disposal to Golar Partners (including amortization of
deferred gain) (127 ) (126 ) (103,917 ) (184 ) (35,220 )
Equity in net earnings of affiliates (2,908 ) (4,406 ) (10,133 ) (8,028 ) (15,112 )
Impairment of vessel held-for-sale — 1,032 1,032 — —
Loss on sale of vessel — — 5,824 — —
Dividend income from available-for-sale and cost investments
recognized in operating income (3,914 ) (3,914 ) (11,409 ) (7,174 ) (20,029 )
Dividends received 13,796 13,125 39,474 15,907 46,060
Drydocking expenditure — (36 ) (10,405 ) (93 ) (3,296 )
Stock-based compensation 111 1,874 3,611 73 314
Loss on disposal of available-for-sale securities — — 3,011 — —
Change in market value of derivatives 89,958 (55,856 ) 59,664 (7,289 ) 15,724
Impairment of Equinox loan receivable 15,010 — 15,010 — —
Other current and long-term assets (25,086 ) 25,286 (18,032 ) (3,066 ) (10,177 )
Other current and long-term liabilities 23,037 (14,372 ) 2,332 9,717 2,269
Net foreign exchange gain 282 458 1,883 406 (433 )
Net cash (used in) provided by operating activities (15,384 ) (20,649 ) (91,564 ) 18,976 11,384
Golar LNG Limited
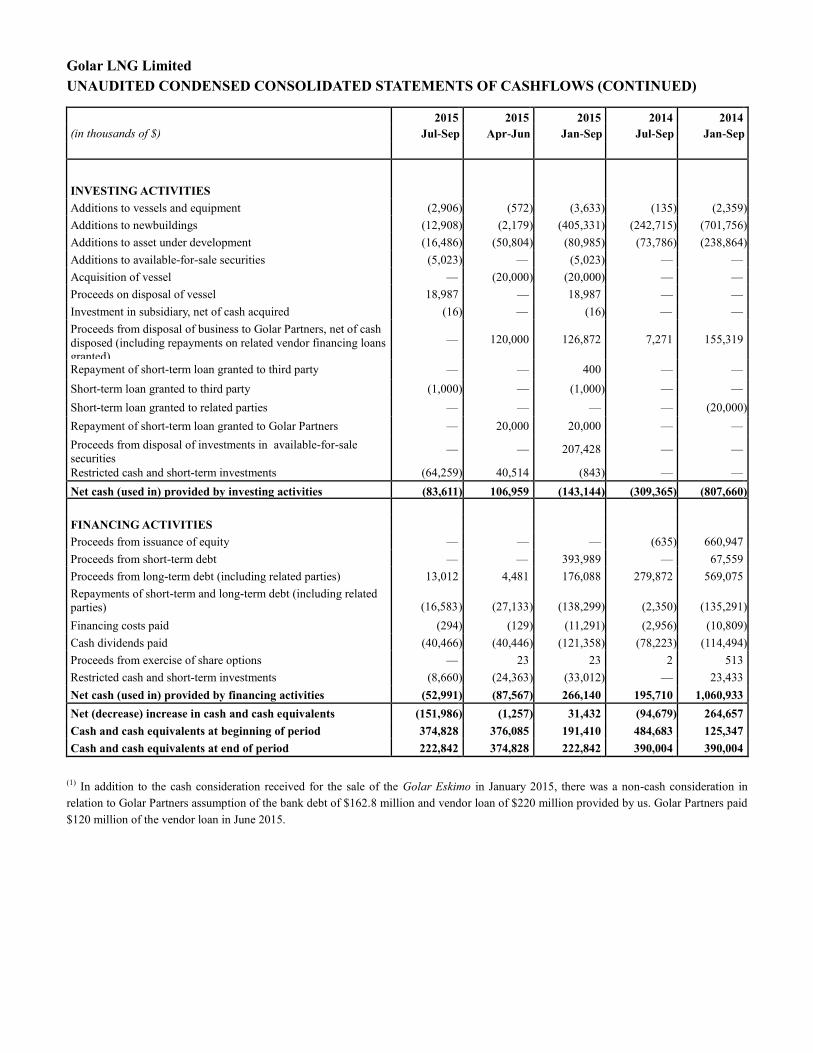
UNAUDITED CONDENSED CONSOLIDATED STATEMENTS OF CASHFLOWS (CONTINUED)
2015 2015 2015 2014 2014
(in thousands of $) Jul-Sep Apr-Jun Jan-Sep Jul-Sep Jan-Sep
INVESTING ACTIVITIES
Additions to vessels and equipment (2,906 ) (572 ) (3,633 ) (135 ) (2,359 )
Additions to newbuildings (12,908 ) (2,179 ) (405,331 ) (242,715 ) (701,756 )
Additions to asset under development (16,486 ) (50,804 ) (80,985 ) (73,786 ) (238,864 )
Additions to available-for-sale securities (5,023 ) — (5,023 ) — —
Acquisition of vessel — (20,000 ) (20,000 ) — —
Proceeds on disposal of vessel 18,987 — 18,987 — —
Investment in subsidiary, net of cash acquired (16 ) — (16 ) — —
Proceeds from disposal of business to Golar Partners, net of cash
disposed (including repayments on related vendor financing loans granted)
—
120,000
126,872
7,271
155,319
Repayment of short-term loan granted to third party — — 400 — —
Short-term loan granted to third party (1,000 ) — (1,000 ) — —
Short-term loan granted to related parties — — — — (20,000 )
Repayment of short-term loan granted to Golar Partners — 20,000 20,000 — —
Proceeds from disposal of investments in available-for-sale
securities —
—
207,428
—
—
Restricted cash and short-term investments (64,259 ) 40,514 (843 ) — —
Net cash (used in) provided by investing activities (83,611 ) 106,959 (143,144 ) (309,365 ) (807,660 )
FINANCING ACTIVITIES
Proceeds from issuance of equity — — — (635 ) 660,947
Proceeds from short-term debt — — 393,989 — 67,559
Proceeds from long-term debt (including related parties) 13,012 4,481 176,088 279,872 569,075
Repayments of short-term and long-term debt (including related
parties) (16,583 ) (27,133 ) (138,299 ) (2,350 ) (135,291 )
Financing costs paid (294 ) (129 ) (11,291 ) (2,956 ) (10,809 )
Cash dividends paid (40,466 ) (40,446 ) (121,358 ) (78,223 ) (114,494 )
Proceeds from exercise of share options — 23 23 2 513
Restricted cash and short-term investments (8,660 ) (24,363 ) (33,012 ) — 23,433
Net cash (used in) provided by financing activities (52,991 ) (87,567 ) 266,140 195,710 1,060,933
Net (decrease) increase in cash and cash equivalents (151,986 ) (1,257 ) 31,432 (94,679 ) 264,657
Cash and cash equivalents at beginning of period 374,828 376,085 191,410 484,683 125,347
Cash and cash equivalents at end of period 222,842 374,828 222,842 390,004 390,004
(1) In addition to the cash consideration received for the sale of the Golar Eskimo in January 2015, there was a non-cash consideration in
relation to Golar Partners assumption of the bank debt of $162.8 million and vendor loan of $220 million provided by us. Golar Partners paid
$120 million of the vendor loan in June 2015.

Golar LNG Limited
UNAUDITED CONDENSED CONSOLIDATED STATEMENT OF CHANGES IN EQUITY
(in thousands of $) Share
Capital
Additional
Paid in
Capital
Contributed
Surplus (1)
Accumulated
Other
Comprehensive
(loss) income
Accumulated
Retained
Earnings
Total before
Non-
Controlling
Interest
Non-
Controlling
Interest
Total
Equity
Balance at December 31,
2013 80,580
656,018
200,000
(6,757 ) 874,296
1,804,137
—
1,804,137
Net loss — — — — (3,470 ) (3,470 ) — (3,470 )
Dividends — — — — (114,494 ) (114,494 ) — (114,494 )
Exercise of share options 51 787 — — (325 ) 513 — 513
Grant of share options — 314 — — — 314 — 314
Net proceeds from issuance
of shares 12,650 648,297 — — — 660,947
— 660,947
Other comprehensive loss — — — 45,858 — 45,858 — 45,858
Balance at September 30,
2014 93,281
1,305,416
200,000
39,101
756,007
2,393,805
—
2,393,805
(in thousands of $) Share
Capital
Additional
Paid in
Capital
Contributed
Surplus (1)
Accumulated
Other
Comprehensive
(loss) income
Accumulated
Retained
Earnings
Total before
Non-
Controlling
Interest
Non-
Controlling
Interest
Total
Equity
Balance at December 31,
2014 93,415
1,307,087
200,000
5,171
675,179
2,280,852
1,655
2,282,507
Net loss — — — — (126,768 ) (126,768 ) 8,138 (118,630 )
Dividends — — — — (121,359 ) (121,359 ) — (121,359 )
Exercise of share options 8 15 — — — 23 — 23
Grant of share options — 4,891 — — — 4,891 — 4,891
Forfeiture of share options — (1,734 ) — — — (1,734 ) — (1,734 )
Cancellation of share options — 786 — — — 786 — 786
Transfer of additional paid in
capital (2) — 6,003 — (4,424 ) — 1,579 — 1,579
Other comprehensive income — — — (42,604 ) — (42,604 ) — (42,604 )
Balance at September 30,
2015 93,423
1,317,048
200,000
(41,857 ) 427,052
1,995,666
9,793
2,005,459
(1) Contributed Surplus is 'capital' that can be returned to shareholders without the need to reduce share capital thereby giving Golar greater
flexibility when it comes to declaring dividends.
(2) The three and nine months period ended September 30, 2015 include an out of period correction of $1.6 million additional expense
captured in other financial items in the income statement, a decrease to the accumulated other comprehensive income by $4.4 million, and
increase to additional paid in capital of $6 million. Management believes this out of period correction is not material to the current period
condensed consolidated financial statements or any previously issued financial statements and is not expected to be material to the annual
consolidated financial statements for the year ending December 31, 2015.