Embed Size (px)
Citation preview
THE19TH
INTERNATIONAL CONFERENCE ON COMPOSITE MATERIALS
1 Introduction
Characterizing interlaminar fatigue delamination in
carbon fiber-reinforced polymer-matrix (CFRP)
composites is important due to rising use of these
materials in primary structures [1]. In many
applications CFRP composite elements are subject
to cyclic or intermittent loads which can initiate and
promote delaminations even if initial defects cannot
be detected with nondestructive testing [2]. For
designing CFRP structures understanding fatigue
delamination initiation and growth is hence crucial
[2–4]. Published standards, test results and research
in cyclic fatigue delamination are summarized in,
e.g., [5, 6].
Recent round robin test analysis [6, 7] for
developing test procedures for cyclic delamination
growth combined with improved understanding of
relevant effects [2, 8] have highlighted a number of
issues. The question of “threshold behavior” of
fatigue delamination growth in composites which is
essential for fracture mechanics based design
approaches [4] does seem to play a central role in
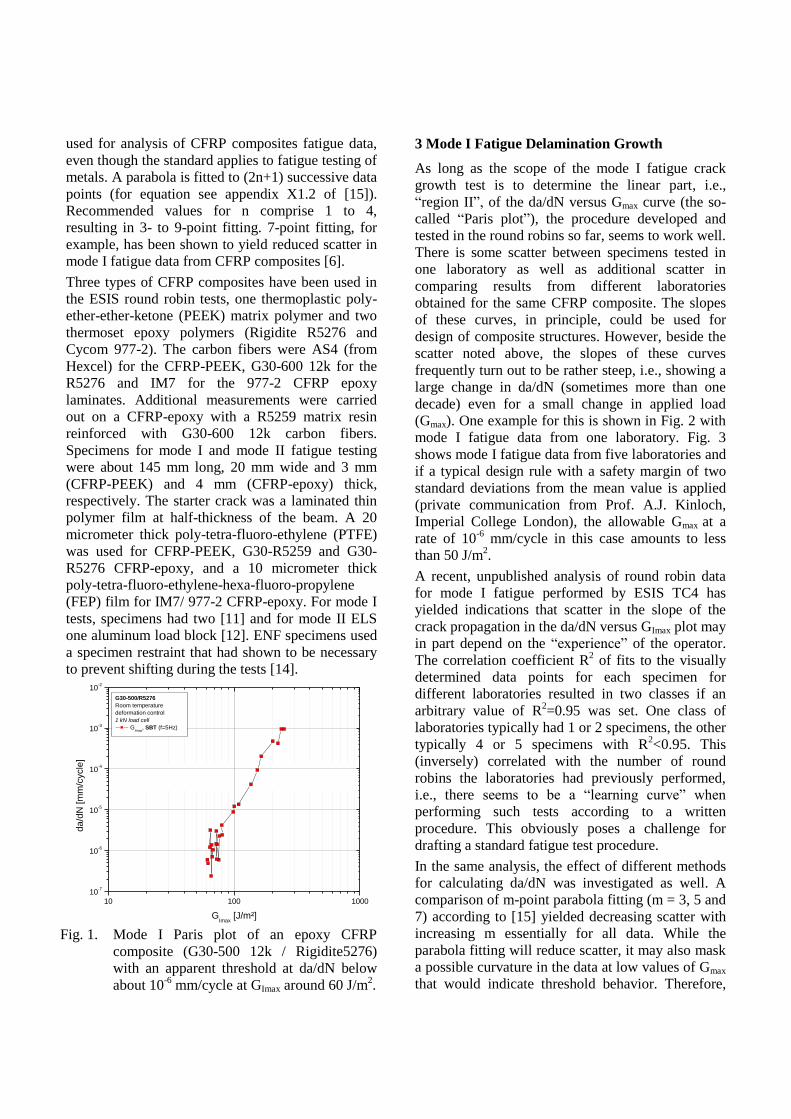
several aspects. A threshold is the observation of
decreasing average delamination growth rate da/dN
(from delamination length a per fatigue cycle
number N) at constant applied load Gmax (e.g.,
shown in Fig. 1). Selected examples of the analysis
and interpretation of fatigue crack growth will be
illustrated by experimental data and discussed. The
aim of the paper is to point out open questions and
alternative interpretation of data in order to stimulate
further discussion and research. The focus is on
fatigue delamination growth in CFRP composites
under mode I and mode II loading.
2 Experimental
With the exception of a standard test method for
fatigue delamination growth onset under mode I
(tensile opening) load issued by the American
Society for Testing and Materials (ASTM) [9], there
are no standardized test methods for fatigue
delamination growth in CFRP composites available
yet. Both, Technical Committee 4 on Polymers,
Composites and Adhesives of the European
Structural Integrity Society (ESIS) and Sub-
committee D30.06 on interlaminar properties of
composites of ASTM have started round robin
testing towards development of a mode I fatigue
delamination growth standard. These are essentially
based on the existing quasi-static test procedures
[10–12] which are then adapted for fatigue loading.
Preliminary results for mode I fatigue [6, 13] and for
mode II fatigue [14] have been published.
The fatigue delamination growth test procedures for
the round robin tests specify so-called Double
Cantilever Beam (DCB) specimen for mode I and
End-Loaded Split (ELS) or End-Notch Flexure
(ENF) specimen for mode II [6, 13, 14]. Fatigue
loading shall typically start from a precrack obtained
from quasi-static mode I and mode II loading,
respectively, followed by cyclic fatigue loading
under the respective mode using displacement
control and a R-ratio (ratio between minimum and
maximum displacement) of 0.1. Test frequency shall
be as high as possible, but not exceed 10 Hz, unless
specimens are monitored for temperature rise.
Delamination growth shall be monitored visually
with the aid of a travelling microscope, and loading
can be stopped for that. Corresponding maximum
load and displacement values and one cycle of
machine load and displacement values every 500 to
1’000 cycles shall also be recorded. The test shall be
run until a delamination length increment da/dN of
10-6
mm per cycle is reached. For determining the
so-called threshold (see Fig. 1), the test duration
may be increased.
The incremental polynomial method for computing
da/dN as described in appendix X1.2 of [15] can be
INTERLAMINAR FATIGUE CRACK GROWTH IN CARBON
FIBER REINFORCED COMPOSITES
S. Stelzer1*, R. Jones
2, A.J. Brunner
3
1Institute of Material Science and Testing of Plastics, Montanuniversitaet Leoben, Leoben,
Austria, 2 Centre of Expertise in Structural Mechanics, Department of Mechanical and
Aerospace Engineering, Monash University, Australia, 3
Empa, Swiss Federal Laboratories for
Materials Science and Technology, Dübendorf, Switzerland * Corresponding author ([email protected])
Keywords: delamination fatigue, mode I, mode II
used for analysis of CFRP composites fatigue data,
even though the standard applies to fatigue testing of
metals. A parabola is fitted to (2n+1) successive data
points (for equation see appendix X1.2 of [15]).
Recommended values for n comprise 1 to 4,
resulting in 3- to 9-point fitting. 7-point fitting, for
example, has been shown to yield reduced scatter in
mode I fatigue data from CFRP composites [6].
Three types of CFRP composites have been used in
the ESIS round robin tests, one thermoplastic poly-
ether-ether-ketone (PEEK) matrix polymer and two
thermoset epoxy polymers (Rigidite R5276 and
Cycom 977-2). The carbon fibers were AS4 (from
Hexcel) for the CFRP-PEEK, G30-600 12k for the
R5276 and IM7 for the 977-2 CFRP epoxy
laminates. Additional measurements were carried
out on a CFRP-epoxy with a R5259 matrix resin
reinforced with G30-600 12k carbon fibers.
Specimens for mode I and mode II fatigue testing
were about 145 mm long, 20 mm wide and 3 mm
(CFRP-PEEK) and 4 mm (CFRP-epoxy) thick,
respectively. The starter crack was a laminated thin
polymer film at half-thickness of the beam. A 20
micrometer thick poly-tetra-fluoro-ethylene (PTFE)
was used for CFRP-PEEK, G30-R5259 and G30-
R5276 CFRP-epoxy, and a 10 micrometer thick
poly-tetra-fluoro-ethylene-hexa-fluoro-propylene
(FEP) film for IM7/ 977-2 CFRP-epoxy. For mode I
tests, specimens had two [11] and for mode II ELS
one aluminum load block [12]. ENF specimens used
a specimen restraint that had shown to be necessary
to prevent shifting during the tests [14].
Fig. 1. Mode I Paris plot of an epoxy CFRP
composite (G30-500 12k / Rigidite5276)
with an apparent threshold at da/dN below
about 10-6
mm/cycle at GImax around 60 J/m2.
3 Mode I Fatigue Delamination Growth
As long as the scope of the mode I fatigue crack
growth test is to determine the linear part, i.e.,
“region II”, of the da/dN versus Gmax curve (the so-
called “Paris plot”), the procedure developed and
tested in the round robins so far, seems to work well.
There is some scatter between specimens tested in
one laboratory as well as additional scatter in
comparing results from different laboratories
obtained for the same CFRP composite. The slopes
of these curves, in principle, could be used for
design of composite structures. However, beside the
scatter noted above, the slopes of these curves
frequently turn out to be rather steep, i.e., showing a
large change in da/dN (sometimes more than one
decade) even for a small change in applied load
(Gmax). One example for this is shown in Fig. 2 with
mode I fatigue data from one laboratory. Fig. 3
shows mode I fatigue data from five laboratories and
if a typical design rule with a safety margin of two
standard deviations from the mean value is applied
(private communication from Prof. A.J. Kinloch,
Imperial College London), the allowable Gmax at a
rate of 10-6
mm/cycle in this case amounts to less
than 50 J/m2.
A recent, unpublished analysis of round robin data
for mode I fatigue performed by ESIS TC4 has
yielded indications that scatter in the slope of the
crack propagation in the da/dN versus GImax plot may
in part depend on the “experience” of the operator.
The correlation coefficient R2 of fits to the visually
determined data points for each specimen for
different laboratories resulted in two classes if an
arbitrary value of R2=0.95 was set. One class of
laboratories typically had 1 or 2 specimens, the other
typically 4 or 5 specimens with R2<0.95. This
(inversely) correlated with the number of round
robins the laboratories had previously performed,
i.e., there seems to be a “learning curve” when
performing such tests according to a written
procedure. This obviously poses a challenge for
drafting a standard fatigue test procedure.
In the same analysis, the effect of different methods
for calculating da/dN was investigated as well. A
comparison of m-point parabola fitting (m = 3, 5 and
7) according to [15] yielded decreasing scatter with
increasing m essentially for all data. While the
parabola fitting will reduce scatter, it may also mask
a possible curvature in the data at low values of Gmax
that would indicate threshold behavior. Therefore,
10 100 1000
10-7
10-6
10-5
10-4
10-3
10-2
G30-500/R5276
Room temperature
deformation control
1 kN load cell
GImax
, SBT (f=5Hz)
da
/dN
[m
m/c
ycle
]
GImax
[J/m²]
3
INTERLAMINAR FATIGUE CRACK GROWTH IN CARBON FIBER
REINFORCED COMPOSITES
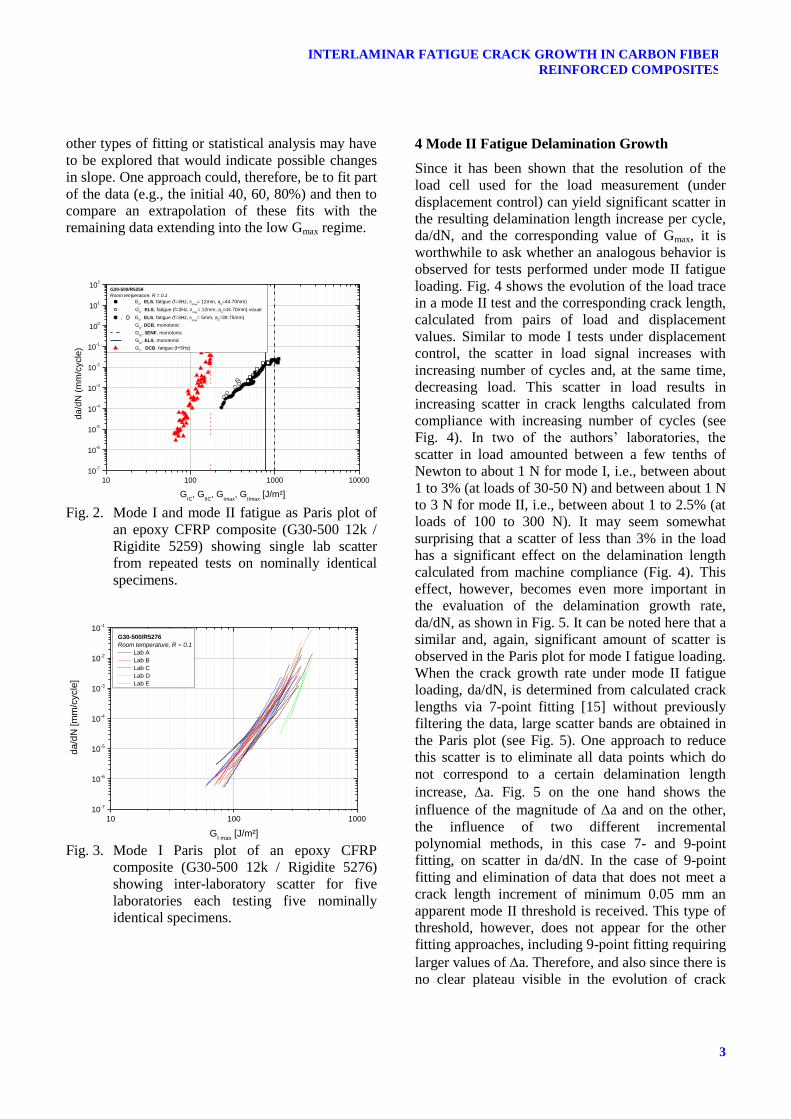
other types of fitting or statistical analysis may have
to be explored that would indicate possible changes
in slope. One approach could, therefore, be to fit part
of the data (e.g., the initial 40, 60, 80%) and then to
compare an extrapolation of these fits with the
remaining data extending into the low Gmax regime.
Fig. 2. Mode I and mode II fatigue as Paris plot of
an epoxy CFRP composite (G30-500 12k /
Rigidite 5259) showing single lab scatter
from repeated tests on nominally identical
specimens.
Fig. 3. Mode I Paris plot of an epoxy CFRP
composite (G30-500 12k / Rigidite 5276)
showing inter-laboratory scatter for five
laboratories each testing five nominally
identical specimens.
4 Mode II Fatigue Delamination Growth
Since it has been shown that the resolution of the
load cell used for the load measurement (under
displacement control) can yield significant scatter in
the resulting delamination length increase per cycle,
da/dN, and the corresponding value of Gmax, it is
worthwhile to ask whether an analogous behavior is
observed for tests performed under mode II fatigue
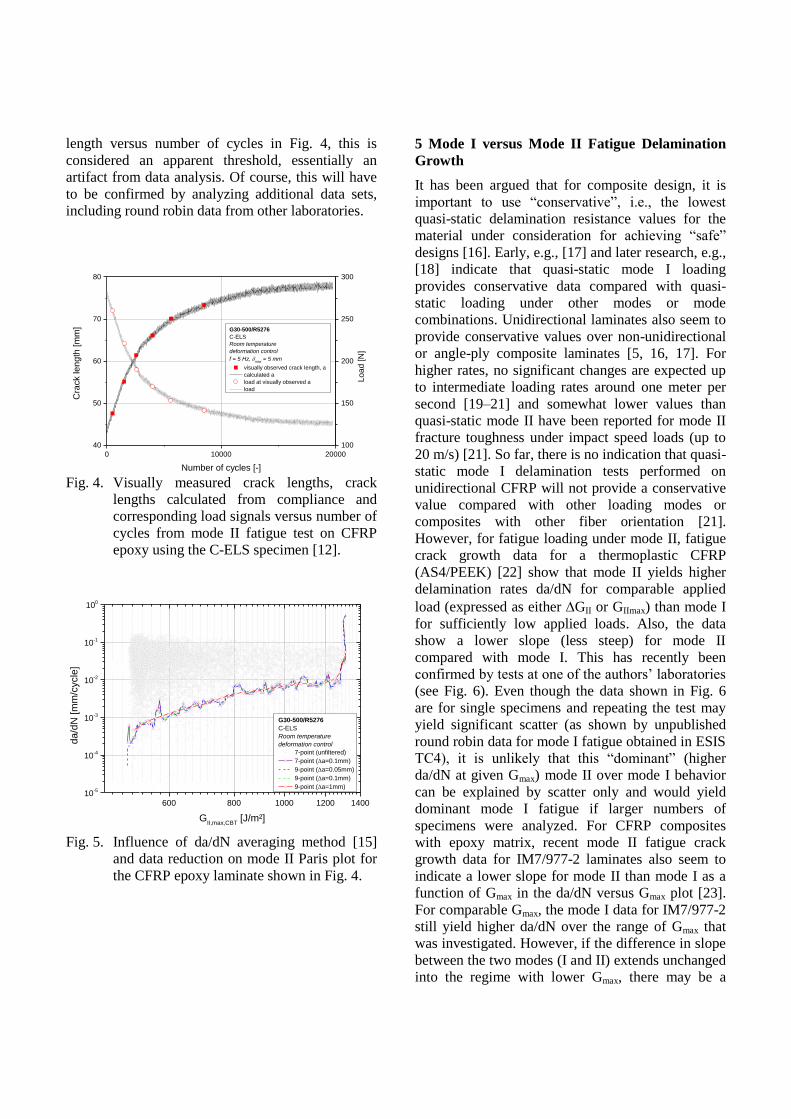
loading. Fig. 4 shows the evolution of the load trace
in a mode II test and the corresponding crack length,
calculated from pairs of load and displacement
values. Similar to mode I tests under displacement
control, the scatter in load signal increases with
increasing number of cycles and, at the same time,
decreasing load. This scatter in load results in
increasing scatter in crack lengths calculated from
compliance with increasing number of cycles (see
Fig. 4). In two of the authors’ laboratories, the
scatter in load amounted between a few tenths of
Newton to about 1 N for mode I, i.e., between about
1 to 3% (at loads of 30-50 N) and between about 1 N
to 3 N for mode II, i.e., between about 1 to 2.5% (at
loads of 100 to 300 N). It may seem somewhat
surprising that a scatter of less than 3% in the load
has a significant effect on the delamination length
calculated from machine compliance (Fig. 4). This
effect, however, becomes even more important in
the evaluation of the delamination growth rate,
da/dN, as shown in Fig. 5. It can be noted here that a
similar and, again, significant amount of scatter is
observed in the Paris plot for mode I fatigue loading.
When the crack growth rate under mode II fatigue
loading, da/dN, is determined from calculated crack
lengths via 7-point fitting [15] without previously
filtering the data, large scatter bands are obtained in
the Paris plot (see Fig. 5). One approach to reduce
this scatter is to eliminate all data points which do
not correspond to a certain delamination length
increase, a. Fig. 5 on the one hand shows the
influence of the magnitude of a and on the other,
the influence of two different incremental
polynomial methods, in this case 7- and 9-point
fitting, on scatter in da/dN. In the case of 9-point
fitting and elimination of data that does not meet a
crack length increment of minimum 0.05 mm an
apparent mode II threshold is received. This type of
threshold, however, does not appear for the other
fitting approaches, including 9-point fitting requiring
larger values of a. Therefore, and also since there is
no clear plateau visible in the evolution of crack
10 100 1000 10000
10-7
10-6
10-5
10-4
10-3
10-2
10-1
100
101
102
da
/dN
(m
m/c
ycle
)
GIC
, GIIC
, GImax
, GIImax
[J/m²]
G30-500/R5259
Room temperature, R = 0.1
GII, ELS, fatigue (f=3Hz,
max= 12mm, a
0=44.70mm)
GII, ELS, fatigue (f=3Hz,
max= 12mm, a
0=44.70mm) visual
, GII, ELS, fatigue (f=3Hz,
max= 5mm, a
0=39.75mm)
GIc, DCB, monotonic
GIIc, 3ENF, monotonic
GIIc, ELS, monotonic
GI, DCB, fatigue (f=5Hz)
10 100 100010
-7
10-6
10-5
10-4
10-3
10-2
10-1
da
/dN
[m
m/c
ycle
]
GI max
[J/m²]
G30-500/R5276
Room temperature, R = 0.1
Lab A
Lab B
Lab C
Lab D
Lab E
length versus number of cycles in Fig. 4, this is
considered an apparent threshold, essentially an
artifact from data analysis. Of course, this will have
to be confirmed by analyzing additional data sets,
including round robin data from other laboratories.
Fig. 4. Visually measured crack lengths, crack
lengths calculated from compliance and
corresponding load signals versus number of
cycles from mode II fatigue test on CFRP
epoxy using the C-ELS specimen [12].
Fig. 5. Influence of da/dN averaging method [15]
and data reduction on mode II Paris plot for
the CFRP epoxy laminate shown in Fig. 4.
5 Mode I versus Mode II Fatigue Delamination
Growth
It has been argued that for composite design, it is
important to use “conservative”, i.e., the lowest
quasi-static delamination resistance values for the
material under consideration for achieving “safe”
designs [16]. Early, e.g., [17] and later research, e.g.,
[18] indicate that quasi-static mode I loading
provides conservative data compared with quasi-
static loading under other modes or mode
combinations. Unidirectional laminates also seem to
provide conservative values over non-unidirectional
or angle-ply composite laminates [5, 16, 17]. For
higher rates, no significant changes are expected up
to intermediate loading rates around one meter per
second [19–21] and somewhat lower values than
quasi-static mode II have been reported for mode II
fracture toughness under impact speed loads (up to
20 m/s) [21]. So far, there is no indication that quasi-
static mode I delamination tests performed on
unidirectional CFRP will not provide a conservative
value compared with other loading modes or
composites with other fiber orientation [21].
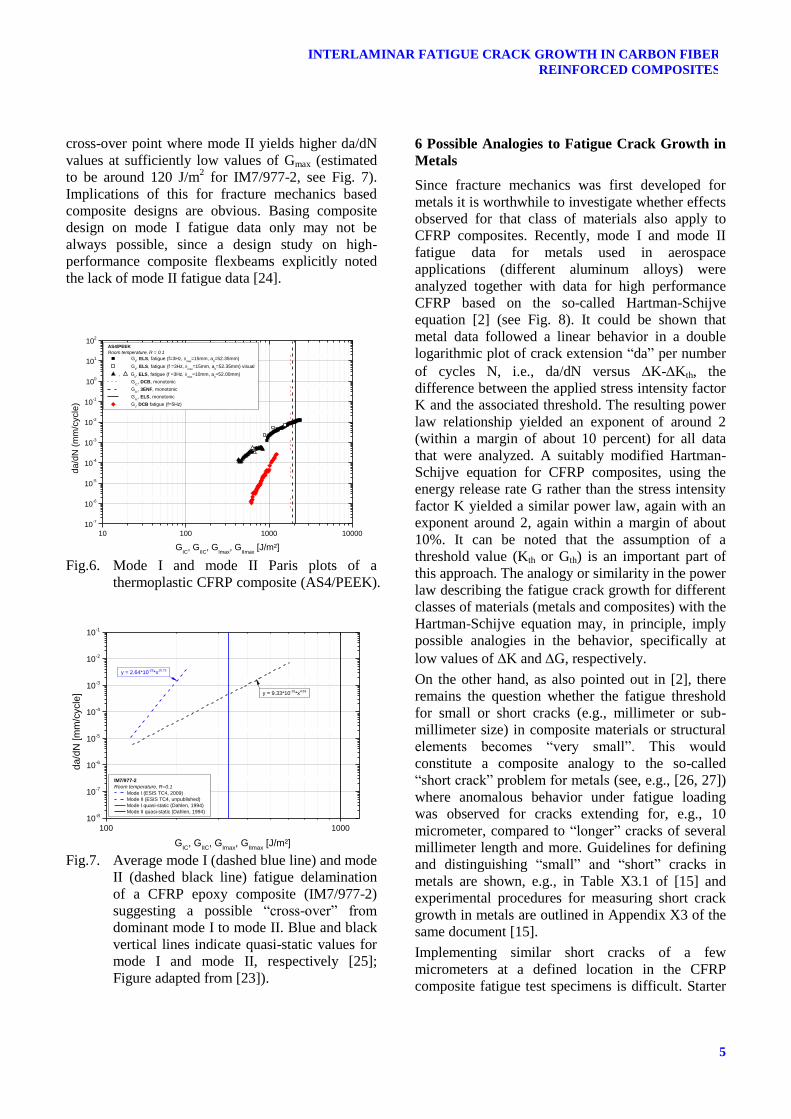
However, for fatigue loading under mode II, fatigue
crack growth data for a thermoplastic CFRP
(AS4/PEEK) [22] show that mode II yields higher
delamination rates da/dN for comparable applied
load (expressed as either GII or GIImax) than mode I
for sufficiently low applied loads. Also, the data
show a lower slope (less steep) for mode II
compared with mode I. This has recently been
confirmed by tests at one of the authors’ laboratories
(see Fig. 6). Even though the data shown in Fig. 6
are for single specimens and repeating the test may
yield significant scatter (as shown by unpublished
round robin data for mode I fatigue obtained in ESIS
TC4), it is unlikely that this “dominant” (higher
da/dN at given Gmax) mode II over mode I behavior
can be explained by scatter only and would yield
dominant mode I fatigue if larger numbers of
specimens were analyzed. For CFRP composites
with epoxy matrix, recent mode II fatigue crack
growth data for IM7/977-2 laminates also seem to
indicate a lower slope for mode II than mode I as a
function of Gmax in the da/dN versus Gmax plot [23].
For comparable Gmax, the mode I data for IM7/977-2
still yield higher da/dN over the range of Gmax that
was investigated. However, if the difference in slope
between the two modes (I and II) extends unchanged
into the regime with lower Gmax, there may be a
0 10000 20000
40
50
60
70
80
Cra
ck le
ng
th [m
m]
Number of cycles [-]
G30-500/R5276
C-ELS
Room temperature
deformation control
f = 5 Hz, max
= 5 mm
visually observed crack length, a
calculated a
load at visually observed a
load
100
150
200
250
300
Lo
ad
[N
]
600 800 1000 1200 140010
-5
10-4
10-3
10-2
10-1
100
G30-500/R5276
C-ELS
Room temperature
deformation control
7-point (unfiltered)
7-point (a=0.1mm)
9-point (a=0.05mm)
9-point (a=0.1mm)
9-point (a=1mm)
da
/dN
[m
m/c
ycle
]
GII,max,CBT
[J/m²]
5
INTERLAMINAR FATIGUE CRACK GROWTH IN CARBON FIBER
REINFORCED COMPOSITES
cross-over point where mode II yields higher da/dN
values at sufficiently low values of Gmax (estimated
to be around 120 J/m2 for IM7/977-2, see Fig. 7).
Implications of this for fracture mechanics based
composite designs are obvious. Basing composite
design on mode I fatigue data only may not be
always possible, since a design study on high-
performance composite flexbeams explicitly noted
the lack of mode II fatigue data [24].
Fig.6. Mode I and mode II Paris plots of a
thermoplastic CFRP composite (AS4/PEEK).
Fig.7. Average mode I (dashed blue line) and mode
II (dashed black line) fatigue delamination
of a CFRP epoxy composite (IM7/977-2)
suggesting a possible “cross-over” from
dominant mode I to mode II. Blue and black
vertical lines indicate quasi-static values for
mode I and mode II, respectively [25];
Figure adapted from [23]).
6 Possible Analogies to Fatigue Crack Growth in
Metals
Since fracture mechanics was first developed for
metals it is worthwhile to investigate whether effects
observed for that class of materials also apply to
CFRP composites. Recently, mode I and mode II
fatigue data for metals used in aerospace
applications (different aluminum alloys) were
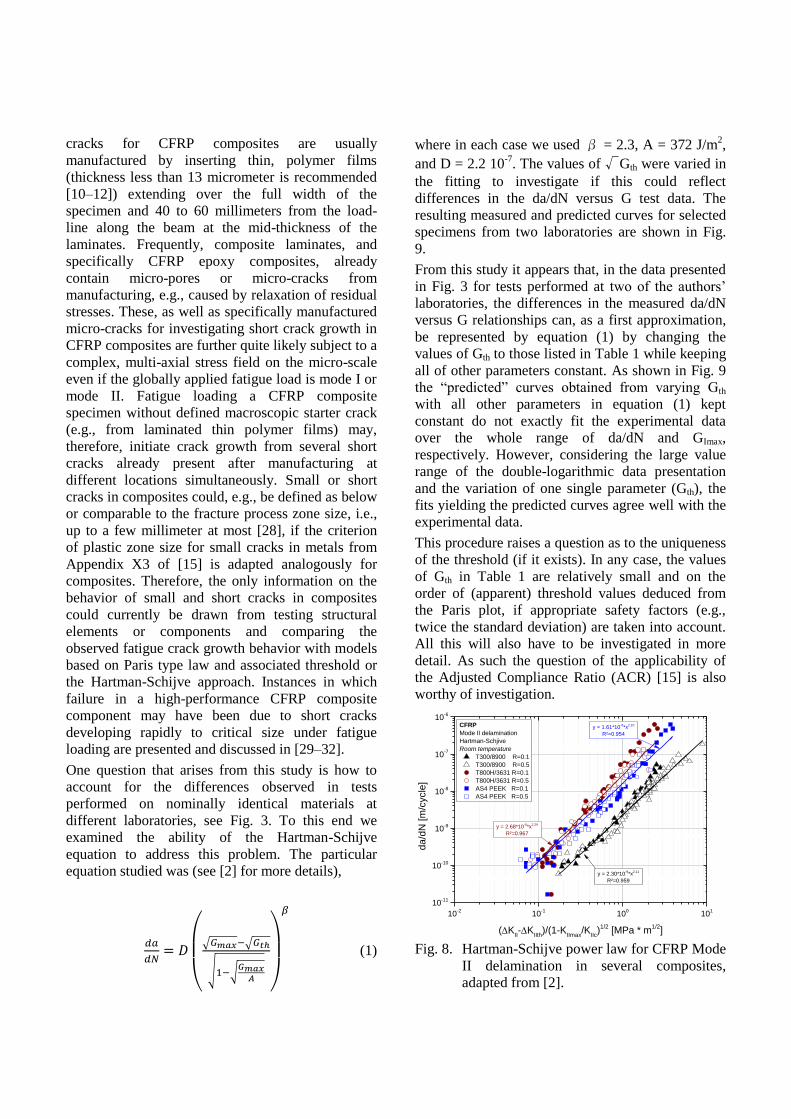
analyzed together with data for high performance
CFRP based on the so-called Hartman-Schijve
equation [2] (see Fig. 8). It could be shown that
metal data followed a linear behavior in a double
logarithmic plot of crack extension “da” per number
of cycles N, i.e., da/dN versus K-Kth, the
difference between the applied stress intensity factor
K and the associated threshold. The resulting power
law relationship yielded an exponent of around 2
(within a margin of about 10 percent) for all data
that were analyzed. A suitably modified Hartman-
Schijve equation for CFRP composites, using the
energy release rate G rather than the stress intensity
factor K yielded a similar power law, again with an
exponent around 2, again within a margin of about
10%. It can be noted that the assumption of a
threshold value (Kth or Gth) is an important part of
this approach. The analogy or similarity in the power
law describing the fatigue crack growth for different
classes of materials (metals and composites) with the
Hartman-Schijve equation may, in principle, imply
possible analogies in the behavior, specifically at
low values of K and G, respectively.
On the other hand, as also pointed out in [2], there
remains the question whether the fatigue threshold
for small or short cracks (e.g., millimeter or sub-
millimeter size) in composite materials or structural
elements becomes “very small”. This would
constitute a composite analogy to the so-called
“short crack” problem for metals (see, e.g., [26, 27])
where anomalous behavior under fatigue loading
was observed for cracks extending for, e.g., 10
micrometer, compared to “longer” cracks of several
millimeter length and more. Guidelines for defining
and distinguishing “small” and “short” cracks in
metals are shown, e.g., in Table X3.1 of [15] and
experimental procedures for measuring short crack
growth in metals are outlined in Appendix X3 of the
same document [15].
Implementing similar short cracks of a few
micrometers at a defined location in the CFRP
composite fatigue test specimens is difficult. Starter
10 100 1000 10000
10-7
10-6
10-5
10-4
10-3
10-2
10-1
100
101
102
AS4/PEEK
Room temperature, R = 0.1
GII, ELS, fatigue (f=3Hz,
max=15mm, a
0=52.35mm)
GII, ELS, fatigue (f =3Hz,
max=15mm, a
0=52.35mm) visual
, GII, ELS, fatigue (f =3Hz,
max=10mm, a
0=52.00mm)
GIC, DCB, monotonic
GIIc, 3ENF, monotonic
GIIc, ELS, monotonic
GI, DCB fatigue (f=5Hz)
da
/dN
(m
m/c
ycle
)
GIC
, GIIC
, GImax
, GIImax
[J/m²]
100 100010
-8
10-7
10-6
10-5
10-4
10-3
10-2
10-1
y = 2.64*10-28
*x10.75
y = 9.33*10-16
*x4.63
IM7/977-2
Room temperature, R=0.1
Mode I (ESIS TC4, 2009)
Mode II (ESIS TC4, unpublished)
Mode I quasi-static (Dahlen, 1994)
Mode II quasi-static (Dahlen, 1994)
da
/dN
[m
m/c
ycle
]
GIC
, GIIC
, GImax
, GIImax
[J/m²]
cracks for CFRP composites are usually
manufactured by inserting thin, polymer films
(thickness less than 13 micrometer is recommended
[10–12]) extending over the full width of the
specimen and 40 to 60 millimeters from the load-
line along the beam at the mid-thickness of the
laminates. Frequently, composite laminates, and
specifically CFRP epoxy composites, already
contain micro-pores or micro-cracks from
manufacturing, e.g., caused by relaxation of residual
stresses. These, as well as specifically manufactured
micro-cracks for investigating short crack growth in
CFRP composites are further quite likely subject to a
complex, multi-axial stress field on the micro-scale
even if the globally applied fatigue load is mode I or
mode II. Fatigue loading a CFRP composite
specimen without defined macroscopic starter crack
(e.g., from laminated thin polymer films) may,
therefore, initiate crack growth from several short
cracks already present after manufacturing at
different locations simultaneously. Small or short
cracks in composites could, e.g., be defined as below
or comparable to the fracture process zone size, i.e.,
up to a few millimeter at most [28], if the criterion
of plastic zone size for small cracks in metals from
Appendix X3 of [15] is adapted analogously for
composites. Therefore, the only information on the
behavior of small and short cracks in composites
could currently be drawn from testing structural
elements or components and comparing the
observed fatigue crack growth behavior with models
based on Paris type law and associated threshold or
the Hartman-Schijve approach. Instances in which
failure in a high-performance CFRP composite
component may have been due to short cracks
developing rapidly to critical size under fatigue
loading are presented and discussed in [29–32].
One question that arises from this study is how to
account for the differences observed in tests
performed on nominally identical materials at
different laboratories, see Fig. 3. To this end we
examined the ability of the Hartman-Schijve
equation to address this problem. The particular
equation studied was (see [2] for more details),
(
√ √
√ √
)
(1)
where in each case we used β = 2.3, A = 372 J/m2,
and D = 2.2 10-7
. The values of √Gth were varied in
the fitting to investigate if this could reflect
differences in the da/dN versus G test data. The
resulting measured and predicted curves for selected
specimens from two laboratories are shown in Fig.
9.
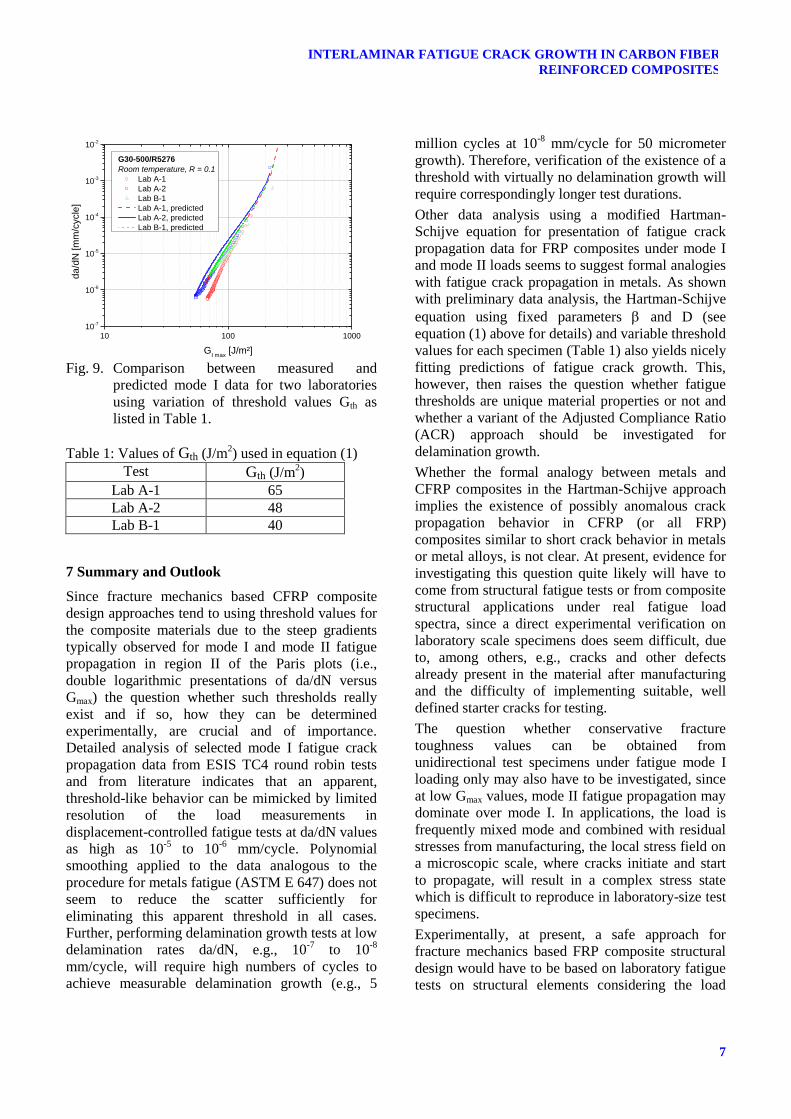
From this study it appears that, in the data presented
in Fig. 3 for tests performed at two of the authors’
laboratories, the differences in the measured da/dN
versus G relationships can, as a first approximation,
be represented by equation (1) by changing the
values of Gth to those listed in Table 1 while keeping
all of other parameters constant. As shown in Fig. 9
the “predicted” curves obtained from varying Gth
with all other parameters in equation (1) kept
constant do not exactly fit the experimental data
over the whole range of da/dN and GImax,
respectively. However, considering the large value
range of the double-logarithmic data presentation
and the variation of one single parameter (Gth), the
fits yielding the predicted curves agree well with the
experimental data.
This procedure raises a question as to the uniqueness
of the threshold (if it exists). In any case, the values
of Gth in Table 1 are relatively small and on the
order of (apparent) threshold values deduced from
the Paris plot, if appropriate safety factors (e.g.,
twice the standard deviation) are taken into account.
All this will also have to be investigated in more
detail. As such the question of the applicability of
the Adjusted Compliance Ratio (ACR) [15] is also
worthy of investigation.
Fig. 8. Hartman-Schijve power law for CFRP Mode
II delamination in several composites,
adapted from [2].
10-2
10-1
100
101
10-11
10-10
10-9
10-8
10-7
10-6
CFRP
Mode II delamination
Hartman-Schjive
Room temperature
T300/8900 R=0.1
T300/8900 R=0.5
T800H/3631 R=0.1
T800H/3631 R=0.5
AS4 PEEK R=0.1
AS4 PEEK R=0.5
y = 1.61*10-8*x
2.10
R²=0.954
y = 2.30*10-9*x
2.11
R²=0.959
da
/dN
[m
/cycle
]
(KII-K
IIth)/(1-K
IImax/K
IIc)1/2
[MPa * m1/2
]
y = 2.68*10-8*x
2.29
R²=0.967
7
INTERLAMINAR FATIGUE CRACK GROWTH IN CARBON FIBER
REINFORCED COMPOSITES
Fig. 9. Comparison between measured and
predicted mode I data for two laboratories
using variation of threshold values Gth as
listed in Table 1.
Table 1: Values of Gth (J/m2) used in equation (1)
Test Gth (J/m2)
Lab A-1 65
Lab A-2 48
Lab B-1 40
7 Summary and Outlook
Since fracture mechanics based CFRP composite
design approaches tend to using threshold values for
the composite materials due to the steep gradients
typically observed for mode I and mode II fatigue
propagation in region II of the Paris plots (i.e.,
double logarithmic presentations of da/dN versus
Gmax) the question whether such thresholds really
exist and if so, how they can be determined
experimentally, are crucial and of importance.
Detailed analysis of selected mode I fatigue crack
propagation data from ESIS TC4 round robin tests
and from literature indicates that an apparent,
threshold-like behavior can be mimicked by limited
resolution of the load measurements in
displacement-controlled fatigue tests at da/dN values
as high as 10-5
to 10-6
mm/cycle. Polynomial
smoothing applied to the data analogous to the
procedure for metals fatigue (ASTM E 647) does not
seem to reduce the scatter sufficiently for
eliminating this apparent threshold in all cases.
Further, performing delamination growth tests at low
delamination rates da/dN, e.g., 10-7
to 10-8
mm/cycle, will require high numbers of cycles to
achieve measurable delamination growth (e.g., 5
million cycles at 10-8
mm/cycle for 50 micrometer
growth). Therefore, verification of the existence of a
threshold with virtually no delamination growth will
require correspondingly longer test durations.
Other data analysis using a modified Hartman-
Schijve equation for presentation of fatigue crack
propagation data for FRP composites under mode I
and mode II loads seems to suggest formal analogies
with fatigue crack propagation in metals. As shown
with preliminary data analysis, the Hartman-Schijve
equation using fixed parameters and D (see
equation (1) above for details) and variable threshold
values for each specimen (Table 1) also yields nicely
fitting predictions of fatigue crack growth. This,
however, then raises the question whether fatigue
thresholds are unique material properties or not and
whether a variant of the Adjusted Compliance Ratio
(ACR) approach should be investigated for
delamination growth.
Whether the formal analogy between metals and
CFRP composites in the Hartman-Schijve approach
implies the existence of possibly anomalous crack
propagation behavior in CFRP (or all FRP)
composites similar to short crack behavior in metals
or metal alloys, is not clear. At present, evidence for
investigating this question quite likely will have to
come from structural fatigue tests or from composite
structural applications under real fatigue load
spectra, since a direct experimental verification on
laboratory scale specimens does seem difficult, due
to, among others, e.g., cracks and other defects
already present in the material after manufacturing
and the difficulty of implementing suitable, well
defined starter cracks for testing.
The question whether conservative fracture
toughness values can be obtained from
unidirectional test specimens under fatigue mode I
loading only may also have to be investigated, since
at low Gmax values, mode II fatigue propagation may
dominate over mode I. In applications, the load is
frequently mixed mode and combined with residual
stresses from manufacturing, the local stress field on
a microscopic scale, where cracks initiate and start
to propagate, will result in a complex stress state
which is difficult to reproduce in laboratory-size test
specimens.
Experimentally, at present, a safe approach for
fracture mechanics based FRP composite structural
design would have to be based on laboratory fatigue
tests on structural elements considering the load
10 100 100010
-7
10-6
10-5
10-4
10-3
10-2
da
/dN
[m
m/c
ycle
]
GI max
[J/m²]
G30-500/R5276
Room temperature, R = 0.1
Lab A-1
Lab A-2
Lab B-1
Lab A-1, predicted
Lab A-2, predicted
Lab B-1, predicted
spectra from the intended application and
implementing a sufficient safety factor in the
number of cycles tested, while simultaneously
monitoring delamination crack propagation or
damage accumulation. Use of a “no growth”
approach with respect to cracks in CFRP composites
design requires the existence of a threshold and/or
the absence of anomalous short crack behavior.
Even if a threshold can be shown to exist at some
value of Gmax, defining a safe value taking the
inherent scatter in the experimental data into account
could then result in very low values (possibly a few
tens of J/m2 or even lower) which effectively may
exclude structural designs using that approach.
In any case, fatigue crack propagation in CFRP
composites will have to be further investigated. This
will require additional data from round robin tests
under mode I and mode II loading from different
laboratories for comparative data analysis. ESIS
TC4 will start new round robin activities this year
with a different type of CFRP laminate. Threshold
behavior will be one of the focal points in tests and
data analysis.
Acknowledgment
Mode II fatigue data obtained by Dr. G. Dell’Anno
(Cranfield University, UK) and discussions with
members of ESIS TC4 as well as numerous
comments and suggestions by Prof. A.J. Kinloch
(Imperial College London, UK) on the topics of this
manuscript are gratefully acknowledged.
References
[1] R.F. Gibson “A review of recent research on
mechanics of multifunctional composite
materials and structures”. Composite Structures,
Vol. 92, No. 12, pp. 2793–2810, 2010
[2] R. Jones, S. Pitt, A. Brunner and D. Hui
“Application of the Hartman–Schijve equation
to represent mode I and mode II fatigue
delamination growth in composites”. Composite
Structures, Vol. 94, No. 4, pp. 1343–1351,
2012
[3] J. Schön, T. Nyman, A. Blom and H. Ansell “A
numerical and experimental investigation of
delamination behaviour in the DCB specimen”.
Composite Science and Technology, Vol. 60, pp.
173–184, 2000
[4] R.H. Martin “Incorporating interlaminar
fracture mechanics into design”. Proceedings of
the Institution of Mechanical Engineers, Part L:
Journal of Materials Design and Applications,
Vo. 214, No. 2, pp. 91–97, 2000
[5] A.J. Brunner, B.R.K. Blackman and P. Davies
“A status report on delamination resistance
testing of polymer–matrix composites”.
Engineering Fracture Mechanics, Vol. 75, No.
9, pp. 2779–2794, 2008
[6] S. Stelzer, A.J. Brunner, A. Argüelles, N.
Murphy and G. Pinter “Mode I delamination
fatigue crack growth in unidirectional fiber
reinforced composites: Development of a
standardized test procedure”. Composites
Science and Technology, Vol. 72, No. 10, pp.
1102–1107, 2012
[7] A.J. Brunner, I. Paris and G. Pinter “Fatigue
propagation test development for polymer-
matrix fibre-reinforced laminates”. Proceedings
of 12th International Conference on Fracture
ICF-12, Montreal, paper No. 00371, pp. 1-8,
2009
[8] R. Jones, S. Pitt, D. Hui D and A.J. Brunner
“Fatigue crack growth in nano-composites”.
Composite Structures, Vol. 99, pp. 375–379,
2013
[9] ASTM - American Society for Testing and
Materials. “ASTM D6115: - Standard test
method for mode I fatigue delamination growth
onset of unidirectional fiber-reinforced polymer
matrix composites”, 1997
[10] ASTM - American Society for Testing and
Materials. “ASTM D5528 - Standard test
method for mode I interlaminar fracture
toughness of unidirectional fiber-reinforced
polymer matrix composites”, 2001
[11] ISO - International Organization for
Standardization. “ISO 15024 - Fibre-reinforced
plastic composites — Determination of mode I
interlaminar fracture toughness, GIC, for
unidirectionally reinforced materials”, 2001
[12] ISO - International Organization for
Standardization. “ISO 15114 - Fibre-reinforced
plastic composites — The determination of the
Mode II fracture resistance, GIIC, for
unidirectionally reinforced materials using the
calibrated end loaded split (C-ELS) test and an
effective crack length approach”, 2011.
[13] A.J. Brunner, N. Murphy and G. Pinter
“Development of a standardized procedure for
the characterization of interlaminar
delamination propagation in advanced
composites under fatigue mode I loading
9
INTERLAMINAR FATIGUE CRACK GROWTH IN CARBON FIBER
REINFORCED COMPOSITES
conditions”. Engineering Fracture Mechanics,
Vol. 76, No. 18, pp. 2678–2689, 2009
[14] A.J. Brunner, S. Stelzer, G. Pinter and G.
Terrasi “Mode II fatigue delamination
resistance of advanced fiber-reinforced
polymer–matrix laminates: Towards the
development of a standardized test procedure”.
International Journal of Fatigue, Vol. 50, pp.
57–62, 2013
[15] ASTM - American Society for Testing and
Materials. “ASTM E647 - Standard test method
for measurement of fatigue crack growth rates”,
2013
[16] A.J. Brunner “Experimental aspects of mode I
and mode II fracture toughness testing of fibre-
reinforced polymer-matrix composites”.
Computer Methods in Applied Mechanics and
Engineering, Vol. 185, No. 2-4, pp. 161–172,
2000
[17] D.J. Nicholls and J.P. Gallagher “Determination
of GIC in angle ply composites using a
cantilever beam test method”. Journal of
Reinforced Plastics and Composites, Vol. 2, No.
1, pp. 2–17, 1983
[18] T.K. O'Brien “Composite interlaminar shear
fracture toughness, GIIc: Shear measurement or
sheer myth?” In: Bucinell RB, editor.
Composite Materials: Fatigue and Fracture:
ASTM STP 1330. West Conshohocken, PA:
American Society for Testing and Materials, pp.
3–18, 1998
[19] T. Kusaka, M. Hojo, Y. Mai, T. Kurokawa, T.
Nojima and S. Ochiai “Rate dependence of
mode I fracture behaviour in carbon-
fibre/epoxy composite laminates”. Composites
Science and Technology, Vol. 58, pp. 591–602,
1998
[20] T. Kusaka, M. Hojo, S. Ochiai and T.
Kurokawa “Rate-dependent mode
II interlaminar fracture behavior of carbon-
fiber/epoxy composite laminates”. Materials
Science Research International, Vol. 5, No. 2,
pp. 98–103, 1999
[21] T. Kusaka, T. Kurokawa, M. Hojo and S.
Ochiai “Evaluation of mode II interlaminar
fracture toughness of composite laminates
under impact loading”. Key Engineering
Materials, Vol. 141-143, pp. 477–500, 1998
[22] R.H. Martin and G.B. Murri “Characterization
of mode I and mode II delamination growth and
thresholds in AS4/PEEK composites”. In:
Garbo S, editor. Composite Materials: Testing
and Design: ASTM STP 1059. West
Conshohocken, PA: American Society for
Testing and Materials, pp. 251–270, 1990
[23] A.J. Brunner “Fracture mechanics of polymer
composites for aerospace industry”. In: Irving P,
Soutis C, editors. Polymer composites in the
aerospace industry. Cambridge: Woodhead
Publishing Limited; at press.
[24] G.B. Murri “Testing and life prediction for
composite rotor hub flexbeams”. International
Journal of Fatigue, Vol. 28, No. 10, pp. 1124–
1135, 2006
[25] C. Dahlen and G.S. Springer “Delamination
growth in composites under cyclic loads”.
Journal of Composite Materials, Vol. 28, No. 8,
pp. 732–781, 1994
[26] R.A. Smith “On the short cracks limitations of
fracture mechanics”. International Journal of
Fracture, Vol. 13, No. 5, pp. 717–720, 1977
[27] R.A. Smith, Y. Liu and L. Grabowski. “Short
fatigue crack growth behavior in waspaloy at
room and elevated temperatures”. Fatigue &
Fracture of Engineering Materials & Structures,
Vol. 19, No. 12, pp. 1505–1514, 1996
[28] A.J. Brunner, B.R.K. Blackman and J.G.
Williams “Calculating a damage parameter and
bridging stress from GIC delamination tests on
fibre composites”. Composites Science and
Technology, Vol. 66, No. 6, pp. 785–795, 2006
[29] G. Savage “Sub-critical crack growth in highly
stressed Formula 1 race car composite
suspension components”. Engineering Failure
Analysis, Vol. 16, No. 2, pp. 608–617, 2009
[30] P. Chalkley and R. Geddes “Service history of
the F-111 wing pivot fitting upper surface
boron/epoxy doublers: DSTO-TN-0168”.
Department of Defence, September 1998.
[31] D. Raizenne “Case history: CF116 upper wing
skin fatigue enhancement boron doubler”. In:
Baker A, Rose L, Jones R, editors. Advances in
the bonded composite repair of metallic aircraft
structure. Amsterdam: Elsevier; 2002.
[32] W. Seneviratne, J. Tomblin and T. Cravens
“Durability and residual strength assessment of
F/A-18 A-D wing-root stepped-lap joint”.
Proceedings 11th AIAA ATIO Conference,
AIAA Centennial of Naval Aviation Forum,
Virginia Beach, 2011.