Embed Size (px)
Citation preview

International Evidence on Long-Run Money Demand
Luca Benati University of Bern
Robert E. Lucas, Jr. University of Chicago
Juan-Pablo Nicolini Federal Reserve Bank of Minneapolis
Warren Weber University of South Carolina, Bank of Canada, and
Federal Reserve Bank of Atlanta
Working Paper 737 February 2017
Keywords: Long-run money demand; Cointegration JEL classification: E41, C32
The views expressed herein are those of the authors and not necessarily those of the Federal Reserve Bank of Minneapolis or the Federal Reserve System. __________________________________________________________________________________________
Federal Reserve Bank of Minneapolis • 90 Hennepin Avenue • Minneapolis, MN 55480-0291 https://www.minneapolisfed.org/research/

International Evidence on
Long-Run Money Demand∗
Luca Benati
University of Bern†Robert E. Lucas, Jr.
University of Chicago‡
Juan-Pablo Nicolini
Federal Reserve Bank
of Minneapolis§
Warren Weber
University of South Carolina, Bank of Canada and
Federal Reserve Bank of Atlanta¶
Abstract
We explore the long-run demand for M 1 based on a data set that has
comprised 32 countries since 1851. In many cases, cointegration tests identify
a long-run equilibrium relationship between either velocity and the short rate
or M 1, GDP, and the short rate. Evidence is especially strong for the United
States and the United Kingdom over the entire period since World War I and
for moderate and high-inflation countries.
With the exception of high-inflation countries–for which a “log-log” spec-
ification is preferred–the data often prefer the specification in the levels of
velocity and the short rate originally estimated by Selden (1956) and Latané
(1960). This is especially clear for the United States and other low-inflation
countries.
∗We wish to thank G. Cavaliere, J. Fernandez-Villaverde, H. Luetkepohl, A. Marcet, E. Nelson,and P. Teles for useful discussions or comments. Special thanks to J. Ayres, N. Gorton, E. Werner,
and J. Yano for invaluable help with the data. The usual disclaimers apply.†Department of Economics, University of Bern, Schanzeneckstrasse 1, CH-3001, Bern, Switzer-
land. Email: [email protected]‡Department of Economics, University of Chicago, 1126 East 59th Street, Chicago, Illinois 60637,
United States. Email: [email protected]§Federal Reserve Bank of Minneapolis, 90 Hennepin Avenue, Minneapolis, MN 55401, United
States. Email: [email protected]¶ Email: [email protected]
1
1 Introduction
The idea that the quantity of money in an economy can be measured and analyzed
with some accuracy, and that changes in this quantity can be related in systematic
ways to changes in interest rates, output, and prices, has had a long but checkered
history. The postwar work of Friedman, Schwartz, Brunner, Meltzer, and others led
to a common vocabulary for different definitions of money and well-documented data
sets covering many countries over long time periods. Theoretical models proposed by
Baumol, Tobin, and others described well how changes in the money supply affect
other variables, and their predictions conformed well to evidence, at least at the low
frequencies. Yet, over recent decades many economists have come to the view that
monetary aggregates convey no useful information and have turned to macroeconomic
models in which measures of money do not appear at all. One driver of this change
was the alleged instability of the relationship between these series.
Our own conclusions in this paper are almost an exact opposite of this widespread
view. We review the evidence on empirical money demand functions, using annual
data on money (1, for us), nominal GDP, and short-term interest rates from 32
countries over periods that range in some cases to over 100 years. We find remark-
able stability in long-run money demand behavior in many countries and an equally
surprising sameness across different countries. In some cases of instability, anomalies
have straightforward explanations. We describe these cases, and others that are less
easy to dismiss, in some detail below.
In Section 2 we develop a generalized version of the Baumol-Tobin model that
will guide our empirical investigation. We set up the model and then work out its
main predictions. We draw the conclusions described above in two steps. The first is
described in Section 3, where we simply plot the implied predictions of a particular
case of the model against the data for all countries we have. We also show low-
frequency evidence, using the band-pass filter. We find this informal visual evidence
quite remarkable. The second is described in Sections 4 to 8, where we describe
the econometric analysis of this evidence, based on cointegration methods, and we
provide formal statistical tests that forcefully support the hypothesis of a stable long-
run money demand.
2 A Model of Money Demand
We begin by developing a simple model that will guide our empirical investigation. We
study a labor-only, representative agent economy with uncertainty in which making
transactions is costly. We let be the state at time and let = {0 1 }
The preferences of the representative agent are
0
∞X=0
(())
2

where () is his consumption given history up through date , and the function
is differentiable, increasing, and concave. The goods production technology is
given by () = () = ()()where () is time devoted to the production of
the consumption good and () is an exogenous stochastic process. The agent is
endowed in each period with a unit of time, with () allocated to goods production
and 1− () used to carry out transactions.
We assume that households choose the number of “trips to the bank” in the
manner of the classic Baumol-Tobin (BT) model. At the beginning of a period, a
household begins with some nominal wealth that can be allocated to the transactional
asset () or to nontransactional assets, risk-free government bonds or other state-
contingent assets ( +1). During the first of the subperiods, one member of the
household uses money to buy consumption goods. During this same initial subperiod,
another member of the household produces and sells goods in exchange for money.
At the end of the subperiod, producers transfer to the bank the proceeds from their
transactions. The situation at the beginning of the second subperiod thus replicates
exactly the situation at the beginning of the first. This process is repeated times
during the period. The choice of this variable will be the only economically relevant
decision made by households. Purchases over a period are then subject to a cash-in-
advance constraint ()() ≤()().
BT assumed that the cost of carrying out these transactions increases linearly in
the number of trips. We will consider this case here and also allow for other forms
for this cost function. Specifically, we describe the total cost of making transac-
tions, measured in units of time, by a nonnegative, increasing, and smooth function
(() ()) where () is an exogenous stochastic process. The variable ()
thus introduces some unobserved randomness into the model. This is essential to
motivate the econometric analysis that is the core of the paper. It can be interpreted
as changes over time in the technology to adjust portfolios available to households.
We assume that (0 ()) = 0 so the time involved in no trips to the banks is zero.
Equilibrium in the labor market and the equality of production and consumption
imply
1 = () + (() ())
() = ()(1− (() ()))
The real wage is equal to () and the nominal wage is () ()
At the beginning of each period, an agent starts with nominal wealth (), which
can be allocated to (), interest-bearing bonds, (), or state-contingent assets
( +1). Let ( +1) be the price of an Arrow-Debreu security, bought at
in state , which pays off one unit of money in state +1. The agent’s allocation of
these assets is then restricted by
() +() +X+1
( +1)( +1) ≤ ()
3

If we divide both sides by () and let e( +1) denote the price of the state-
contingent asset divided by the probability of the state, we can write this constraint
as
() + () +h( +1)(
+1) e( +1)i≤ () (1)
where lowercase letters are real values and where ( +1) ≡ (+1) () denotes
the gross inflation rate between period in state and period +1 in state ( +1).
We treat the gross nominal return on short-term bonds, (), as an exogenous
process determined by monetary policy.1 This implies that the behavior of the growth
rate of the money supply is restricted by other equilibrium conditions, as is well known
and as we show in Online Appendix B.1.2
So far, we have been silent with respect to what our measure of money, (),
accounts for. For the theoretical analysis, we allow for money to pay a nominal
return, lower than the one paid by bonds, which we call (). As we will show, this
is an important aspect of the theory. We explain our choices for both the particular
monetary aggregate and its return in detail below, when discussing the empirical
analysis.
We can now determine the agent’s wealth next period, contingent on the actions
taken in the current period and the realization of the exogenous shock +1 In nominal
units, this is
( +1) ≤ ()() +()() +( +1)
+£1− (() ())
¤() () + ( +1) (
+1)− ()()
where ( +1) is the real value of the monetary transfer the government makes to
the representative agent. Dividing by the price level (+1), we obtain
( +1) ≤ ()() + ()()
( +1)+ ( +1) (2a)
+[1− (() ())] ()− ()
( +1)+ ( +1)
Finally, the cash-in-advance constraint can be written in real terms as
() ≤ ()() (3)
We now consider the decision problem of a single, atomistic agent who takes as given
the prices e( +1), the inflation rate ( +1), the interest rate (
) the real
wage (), and the shock (). Given the initial wealth (), this agent chooses
1When policy is described as a sequence of interest rates, there may be indeterminacy of the
price level. Real money balances will, however, be unique. In this paper, we ignore issues regarding
the determination of the price level.2The Online Appendix can be found at: https://sites.google.com/site/lucabenatiswebpage/
4

his consumption (), the number of bank trips (), and the assets (), (),
and ( +1) that he chooses to hold. These choices then determine the wealth
( +1) that he carries into the next period conditional on +1 These choices are
restricted by equations (1), (2a), and (3).
The Bellman equation describing the decision problem is
() = max(0)
()− h+ +
h(0)(0) e(0)
i−
i− [−]
+
∙ (
+ + [1− ()] −
(0)+ (0) + (0))
¸
where, for simplicity, we omitted the dependence of current variables on the state,
and where 0 denotes the future state.As we show in Online Appendix B.2, the first order plus equilibrium conditions can
be combined to yield a solution for the equilibrium number of portfolio adjustments,
as follows:
∗ ≡ (−) = 2()
1− () (4)
which gives an extended squared root formula for the equilibrium value of .3
Note first that, using just subindexes to indicate the dependency on the state, the
solution for real money balances relative to output is
( )
(∗ )=
(∗ ) (∗ )
=1
(∗ )
which does not depend on .
Now we would like to discuss the several empirical implications of this solution
that do not depend on the particular functional form assumed for the function ().
First, the theory implies an income elasticity equal to one. This is the specification we
will study for much of the paper. In Online Appendix G, we allow for a more general
specification that does not restrict the income elasticity to be one, and where we are
able to test this unitary income elasticity implication. Second, because ( ) is
differentiable with a strictly positive derivative, some of its properties are inherited
by the function (∗ ). In particular, up to a linear approximation, the stochasticproperties of the money-to-output ratio, , are inherited from the stochastic
properties of ∗ and This has testable implications as long as is stationary, as
we will assume throughout the paper. Specifically, if ∗ is stationary, so should be whereas if it is the case that
∗ has a unit root, should have a unit root
too. As it turns out, for the specifications of the function ( ) that we explore in
the theory and use in the empirical section, these properties hold exactly, not only in
a linear approximation.
3The squared root formula is the by-now-classic solution of the Baumol-Tobin formulation.
5

2.1 Analysis of the solution
We now consider three alternative functional forms for ( ) They deliver ap-
proximations to functional forms that have been used in empirical work and which
we will explore in the following sections.
The exponential case Consider first the function ( ) = . In this case,
equation (4) becomes
+1
1−
= ∗
Note that is the cost of inflation in units of time, so it represents the welfare
cost of inflation as a ratio of first-best output. This ratio is arbitrarily close to zero
when the interest rate ∗ is small. For moderate interest rates, the welfare cost isnegligible. Even for relatively high interest rates, estimates of the welfare cost of
inflation are hardly above 4%, so the denominator in the expression above would
range from 1 to 0.96. We therefore use the approximation 1 − ' 1 and write
the solution as +1 ' ∗ . Taking logs, we then obtain
ln + ln + ( + 1) ln = ln ∗ (5)
which is the log-log function typically used in the literature. The BT case is the one
obtained by assuming that the function ((∗ )) is linear, or = 1 which implies aninterest rate elasticity of 12
The Selden-Latané specification A less well-known specification is obtained for
the following cost function:
( ) = ln(+ ) ++
+ −µ ln +
+
¶
where the term¡ ln + +
¢guarantees that (0 ) = 0 and so the function
is increasing. The function is concave, so it means that the marginal cost of making
transactions is decreasing with the number of transactions (or, what is the same,
decreasing with the nominal interest rate).
In this case, the solution is given by
2
1
(+)2 [(+ )− − ]
1− ( )= ∗
If, as before, we proceed with the approximation 1− ( ) ' 1, we obtain
2
( + )2[(+ )− − ] ' ∗
6

Thus, for small values of , the solution can be approximated by
− ' ∗ (6)
which implies a linear relationship between velocity and the interest rate.
This empirical specification was used by Richard Selden (1956) over half a century
ago, and, to the very best of our knowledge, it has been used again in the literature
only once, by Henry Allen Latané (1960). The main reason for considering this long-
forgotten specification is that, as we will discuss in Section 8, for several low-inflation
countries–first and foremost, the United States–the data seem to quite clearly prefer
it over the traditional log-log one discussed above and the semi-log specification that
we discuss next.
The semi-log Finally, consider the following specification:
( ) = − ln(+ )
+ − +
+ +
µln
+
+
¶
where again the term on the right-hand side implies (0 ) = 0
In addition, we assume + (1− ln ) for all , so that the function is alwaysincreasing in . This function is also concave as the one before. The main difference
between this function and the two studied above is that it asymptotes a constant (the
term in parentheses on the right-hand side) as the number of trips grows arbitrarily
large.
In this case, the solution is given by
2
( + )2
[ (ln(+ )− 1) + + ]
1− ( )= ∗
If, as before, we ignore the term 1 − ( ) and also consider relatively low values
for , we obtain a linear relationship between the log of velocity and the interest rate,
which corresponds to the well-known semi-log specification.
3 A First Look at the Data
The functional forms considered in the previous section deliver expressions that can
be suitably taken to the data. The formal econometric analysis is presented in the
following sections. As a first descriptive step, in this section we present the data and
compare them to the theory. To do so, we focus on the particular case in which the
function is linear in which corresponds to the BT case of the log-log specification
in which the elasticity is constant and equal to 12.
Before doing that, we need to address the issue of how we map our theoretical con-
struct to the data. As the model makes clear, the choice of the natural aggregate
7

22
Figure 1 The raw data: short rate (plus 1%), ratio between nominal M1 and nominal GDP, and fitted Baumol-Tobin specification

23
Figure 2 The raw data: short rate (plus 1%), ratio between nominal M1 and nominal GDP, and fitted Baumol-Tobin specification

24
Figure 3 The raw data: short rate (plus 1%), ratio between nominal M1 and nominal GDP, and fitted Baumol-Tobin specification

comes associated with the discussion of the nominal return of that particular aggre-
gate , since real money balances in the model depend not on the interest rate on
bonds but rather on the spread between that rate and the rate paid by money. Since
we do not have data on the interest rate paid by deposits, we choose to work with
1, which in most countries includes cash and checking accounts. We will proceed
under the assumption that, in the countries we study, checking accounts do not pay
interest. Although this is a questionable assumption, it is certainly more appropriate
for1 than for broader aggregates, which typically include interest-paying deposits.4
As for cash, we follow Alvarez and Lippi (2009) and assume that it entails a negative
return, associated with the risk of being lost or stolen. Alvarez and Lippi (2009)
estimate the cost of holding cash to be close to 2% using detailed individual data
from Italy. In addition, and to simplify, we assume that cash is about half of total
money so that = 0.99.
This is a very important assumption when considering the log-log specification,
since it implies that real money balances have a satiation point when the interest rate
on bonds is zero, as is the case for some countries in the sample. Indeed, if on the
contrary we assume that = 1, the log-log curve goes to infinity as → 1. As
can be seen in the evidence we show in this section, this does not seem to be the case
for countries that did experience several periods of almost zero interest rates, such as
the United States and Japan. This assumption also plays an important role in the
formal econometric tests because it often improves the performance of the empirical
version of the log-log model.5
A caveat must be made explicit. Payments in this model are for household pur-
chases of final goods, so they ignore other transactions where cash and deposits are
used, such as paying employees and suppliers of intermediate goods and to clear asset
exchanges. We are implicitly treating all these payments–which are much larger than
final goods payments–as proportional to final goods payments. This will require in-
troducing a constant of proportionality as another free parameter in the model, which
will be country specific.
In other words, the theory we developed is not aimed at matching levels of 1
over GDP but rather changes in this ratio as the interest rate changes. Therefore, one
way to see our descriptive exercise is as using one free parameter per country, to allow
for a country-specific intercept, while the slope will be given by the BT assumption
of a linear technology, so that the elasticity is equal to 0.5.
Figures 1 to 3 show scatterplots of the short rate and of the ratio between nom-
inal 1 and nominal GDP (that is, the inverse of 1 velocity), together with the
4It is the case, for instance, that deposits did pay interest in the United States after Regulation
Q was modified in the early 1980s. It is also the case that some deposits included in 1 did pay
interest in very high-inflation countries such as Argentina and Brazil.5For example, as we will see, for Switzerland for the period 1851-1906, the bootstrapped p-values
for Johansen’s trace and maximum eigenvalue tests of no cointegration between the logarithm of
1 velocity and the short rate are 0.160 and 0.113 without the Alvarez-Lippi 1% correction to the
short rate, but they fall to 0.094 and 0.057 with the correction.
8

theoretical curve that corresponds to an approximation of equation (5), namely, the
BT case, so
=
( + 1)
12 (7)
where is nominal income at time in country and is a country-specific
constant. As mentioned above, we let ∗ = − 099 where
is the gross short
term interest rate at time in country . In three cases in which we could not find a
(sufficiently long) interest rate series,6 we use inflation as a proxy for the opportunity
cost of money. For a detailed description of the data and the sources for each country,
see Online Appendix B.
The grouping of countries has been largely arbitrary. The first row of Figure 1
contains countries that belonged, at some point, to the Commonwealth. The second
row contains countries that experienced very high inflation rates, and the interest rate
(i.e., the horizontal axis) is in a logarithmic scale because of the magnitudes reached
by inflation and interest rates in these countries. In the second row of Figure 1, there
are two countries, Argentina and Brazil, for which we highlight the most recent period
(since 1991 and since 1995, respectively). These are the two countries in our sample
that experienced recurrent periods of very high inflation that lasted over a decade.
The blue squares correspond to the periods that followed the successful stabilization
years: 1991 for Argentina and 1995 for Brazil. These points are highlighted because
in both cases, the points following a successful stabilization lie below the theoretical
curve that matches the previous period.
Figure 2 reports countries for which the theoretical curve is visually a still decent
approximation to the data. The first row of Figure 3 shows countries for which the
fit gets worse,7 but still there seems to be some relationship between the theory and
the data, whereas the second row of Figure 3 shows countries for which there seems
to be no connection between theory and data.
In all of these figures, the data are shown with different colors and markers (dot,
square, triangle, and star) under four circumstances: () data for the gold standard,
up until 1913,8 are always shown with a color different from that used for subsequent
years; () when we have data for nonconsecutive subperiods (e.g., as in the case for
France); () when we have different series for the short rate that cannot be linked
(e.g., as is the case for Venezuela); and () when we want to highlight drastic changes
6Specifically, Mexico, Chile (for the period 1941-2012), and Brazil (for the period 1934-2012).7For the Netherlands, the two world wars and their aftermath had been characterized by an
anomalous behavior of velocity, which in some cases reached values ranging between 50 and almost
200. Because of this, in our econometric analysis we will uniquely focus on the period 1950-1992.8Although we take the gold standard to have ended in August 1914 with the outbreak of WWI,
in fact, marking the exact date of its end is all but impossible because Richard Nixon’s closing of
the “gold window” in August 1971 was the culmination of a decades-long unraveling process that
had started with WWI. (For a fascinating discussion of such progressive unraveling, see, e.g., Barro
(1982).) We take August 1914 as the date marking the end of the gold standard mostly because we
regard WWI as the single most important shock to the system.
9

25
Figure 4 Low-frequency components of short rate and ratio between nominal M1 and nominal GDP for selected countries

26
Figure 5 Low-frequency components of short rate and ratio between nominal M1 and nominal GDP for selected countries

in the relationship between velocity and the short rate (e.g., as is the case for the
Netherlands and Portugal). Finally, for the United States we show with a different
color the “standard” 1 aggregate for the period since 1984, in order to highlight
how the failure to correct 1, as in Lucas and Nicolini (2015), leads to the apparent
breakdown of the relationship between velocity and the short rate documented by
several authors.9 In our view, it is remarkable how well this simple theory performs
in this first inspection for a large set of countries, in spite of a few apparent failures.
Figures 4 and 5 present evidence in the spirit of Lucas (1980) by plotting the
low-frequency components of the same series shown in the scatterplots in Figures
1-3.10 The components have been extracted via the filter proposed by Christiano and
Fitzgerald (2003).11 We find this evidence, consistently pointing toward a negative
correlation between 1 velocity and the short rate at very low frequencies, quite
simply remarkable. Although the main empirical body of the paper will be based
on cointegration tests, the evidence in Figures 4-5 is, possibly, even more convincing
because it is based on a simple technique such as linear filtering, which uniquely
hinges on defining a specific frequency band of interest.
Despite the attractiveness of looking at simple plots, however, the previous analy-
sis has several limitations. One would like to formally test whether, as some of our
simple technologies imply, the ratio between real money balances and output inherits
a unit root when the short-term interest rate exhibits a unit root. We also want to
formally test whether the estimated elasticities are indeed equal to 1/2, as the simple
BT specification suggests, when using the log-log specification. In addition, we would
also like to let the data indicate which of the three specifications appear to provide a
better fit, and therefore learn something regarding the shape of the function ( ).
To the extent that the interest rate and velocity exhibit a unit root–which, as we
discuss in Section 5, appears to be overwhelmingly the case–we can use cointegration
techniques to test whether there is a statistical long-run relationship between the two
series, and therefore between the interest rate and the ratio of money balances to
GDP. This is a particularly important question, since the distinction between short
run and long run has always been at the center of the discussion in empirical studies of
the money demand. Cointegration techniques are particularly suited to address this
distinction formally, with the advantage that the cointegration residual provides a
measure of the short-run deviations. The remainder of the paper contains the formal
econometric analysis of our data set.
9See, first and foremost, Friedman and Kuttner (1992).10To be precise: we left out six countries for which evidence was weaker.11Specifically, if the sample length, , is greater than 50 years, we extract the components of
the series with cycles slower than 30 years. If 40 ≤50, 30 ≤40, 20 ≤30, we extract thecomponents with cycles slower than 25, 20, and 15 years, respectively.
10

4 Main Features of Our Approach
In this paper we explore the long-run demand for1 via cointegration methods. The
main reason is that, as we will show, the hypothesis that the short-term interest rate
(in levels or in logs) exhibits a unit root is clearly supported by the data for most
countries. At the same time, the debate over the stability of the money demand has
long made the distinction between the short and the long run. This distinction is
totally absent in our model, but a large theoretical literature has developed to try to
understand the large and sustained deviations of observed real money balances from
their theoretical counterparts: the “short-run” deviations of money demand.12
The entire notion of cointegration boils down to the existence of a long-run rela-
tionship between series driven by permanent shocks. Those permanent shocks are the
main source of identification of the relationship between the short-term interest rate
and real money balances over GDP, which we will discuss in what follows. The exis-
tence of the cointegration relationship implies that, in the long run, any permanent
increase in the interest rate maps into a corresponding permanent decrease in real
money balances: the exact amount will be described by the estimated cointegrating
vector. In addition, any deviation of the two series from their long-run relationship–
that is, what is technically known as the cointegration residual–is transitory, and it
is bound to disappear in the long run. Accordingly, the persistence of this cointegra-
tion residual became an explicit measure of the “short-run” deviations. This is why,
since the early 1990s, cointegration has become the standard approach for searching
for a long-run money demand.13
It is important to highlight two aspects of our empirical strategy. First, we will
perform tests that take either cointegration or no cointegration as the null hypothesis
(specifically, Shin’s, and Johansen’s). Although the overwhelming majority of the
papers in the literature have been based on Johansen’s procedure, there is no reason–
especially within the present context–to regard no cointegration as the “natural null
hypothesis.” Rather, it might reasonably be argued that, since we are here searching
for the presence of a long-run money demand for transaction purposes, cointegration
should be regarded as the natural null,14 so that tests should just be based on Shin’s
(1994) procedure. A key reason for not eschewing Johansen’s approach altogether,
however, is that, as we document via Monte Carlo simulations, Johansen’s procedure
exhibits an overall better performance, and it produces more informative results. This
is why, in the end, we decided to use both approaches.
Second, we perform our analysis separately for the gold standard and for the
12See Grossman and Weiss (1983) or Rotemberg (1984) for early contributions or Alvarez and
Lippi (2014) for a recent one.13See, in particular, Friedman and Kuttner (1992), Stock and Watson (1993), and Ball (2001).14When dealing with a money demand for transaction purposes, cointegration should be regarded
as the “natural null hypothesis” because basic economic logic suggests that–up to fluctuations in
the opportunity cost of money–the nominal quantity of money demanded should be proportional
to the nominal volume of transactions (i.e., to nominal GDP).
11

subsequent period. As has been extensively documented,15 the stochastic properties
of inflation in the former period had been radically different from the latter, with
inflation being statistically indistinguishable from white noise most of the time. By
the Fisher equation, this implies that, unless the natural rate of interest had contained
a sizeable permanent component (due, e.g., to permanent shifts in trend productivity
growth), nominal interest rates should be expected to have been stationary, too, which
would preclude them from being entered in any cointegrated system or cointegrating
regression.16 Therefore, the integration properties of nominal interest rates during the
gold standard period ought to be separately checked, or otherwise we would run the
risk of performing cointegration analysis based on a series that had been stationary
for a significant portion of the sample period.
In the next section, we study the integration properties of the data, where we show
that the presence of unit roots seems very robust. The following section discusses
the bootstrapping procedures that are involved in the cointegration tests and in the
estimations procedures. We then discuss the Monte Carlo evidence that provides
measures of the performance of the tests. Finally, we discuss how to interpret the
outcome of the tests, in view of the Monte Carlo evidence, before analyzing the
results.
5 Integration Properties of the Data
A necessary condition for using cointegration methods is that all series feature a
unit root. In this section, we briefly summarize the main results from the extensive
investigation of the integration properties of the data. For a full discussion, see Online
Appendix C. Although in the main text we will only study bivariate systems with1
velocity and the short-term interest rate, we now discuss the integration properties
of all variables, since in Online Appendix G we report estimates of systems including
money balances and GDP separately, in order to test the hypothesis of unitary income
elasticity.
Tables C.1a-C.1b report, for the series in our data set, bootstrapped p-values for
Elliot, Rothenberg, and Stock (1996) tests.17 For nominal GDP and nominal 1,
which exhibit obvious trends, the tests are based on models including an intercept
15See Barsky (1987) and Benati (2008).16A key assumption underlying both Johansen’s and Shin’s cointegration tests is that all of the
variables entering either the multivariate system (in the former case) or the single-equation cointe-
grating regression (in the latter case) are integrated of order one. See Hamilton (1994, very first
sentence of p. 636) and Shin (1994, p. 92).17For either series, p-values have been computed by bootstrapping 10,000 times estimated
ARIMA(p,1,0) processes. In all cases, the bootstrapped processes are of a length equal to the
series under investigation. As for the lag order, p, since, as it is well known, results from unit root
tests may be sensitive to the specific lag order that is being used, for reasons of robustness we
consider two alternative lag orders, either 1 or 2 years.
12

and a time trend.18 For the short rate and velocity, on the other hand, they are based
on models including an intercept but no time trend. For the short rate, the rationale
for not including a time trend is obvious: the notion that nominal interest rates may
follow an upward path,19 in which they grow over time, is manifestly absurd.20 For
1 velocity, on the other hand, things are, at first sight, less obvious. The reason
for not including a time trend originates from the fact that here we are focusing on
a demand for money for transaction purposes (so this argument holds for 1, but it
would not hold for broader aggregates). The resulting natural assumption of unitary
income elasticity logically implies that, if the demand for 1 is stable, 1 velocity
should inherit the stochastic properties of the opportunity cost of money. In turn,
this implies that the type of unit root tests we run for 1 velocity should be the
same as those we run for the nominal rate.
For both velocity and the short rate, we report results for either the levels or the
logarithms of the series. For GDP and 1, on the other hand, we only consider tests
based on the logarithms of the series. The reason is that the level of either series is
manifestly characterized by exponential-type growth, which is why these series are
never considered in levels but rather are always considered in logarithms. For our
purposes, this would not be a problem if Elliot et al.’s unit root tests allowed for the
alternative of stationarity around an exponential time trend rather than a linear one.
Since this is not the case, for both GDP and1 we are necessarily compelled to only
consider tests based on their logarithms.
Finally, for the short-term rate we report results based on both the simple series
(either in levels or in logarithms) and the simple series corrected along the lines of
Alvarez and Lippi (2009), by adding to it a 1% cost of either losing cash or having it
stolen.
Evidence of a unit root in 1 velocity and the short rate is typically strong, with
the bootstrapped p-values being almost uniformly greater than the 10% significance
level we take as our benchmark throughout the entire paper, and often significantly
so. The following exceptions ought to be briefly discussed:
() In a few cases, results based on the two alternative lag orders we consider
produce contrasting evidence.21 In these cases, we regard the null of a unit root as
not having been convincingly rejected, and in what follows we therefore proceed under
the assumption that these series are I(1).
18We include a time trend because, as discussed by Hamilton (1994, p. 501), for example, the
model used for unit root tests should also be a meaningful one under the alternative.19The possibility of a downward path is ruled out by the zero lower bound.20This does not rule out the possibility that, over specific sample periods in which inflation ex-
hibits permanent variation (such as post-WWII samples dominated by the Great Inflation episode),
nominal interest rates are I(1), too. Rather, by the Fisher effect, we should expect this to be the
case. Historically, however, a unit root in inflation has been the exception rather than the rule–see
Benati (2008).21This is the case, for example, for the logarithms of velocity and the short rate for Israel, for log
velocity for Chile for the period 1940-1995, and for the short rate for West Germany.
13

() Under the gold standard, a unit root is rejected for both the level and the
logarithm of the short rate (either with or without the 1% correction) for Canada,
Finland, France, and Spain, and it is rejected for Switzerland based on the logarithm
of the short rate with the 1% correction. In all of these cases, stationarity of the short
rate precludes it from being entered in any cointegrated system or cointegrating re-
gression.22 By the same token, a unit root in the level of the short rate is rejected
for Argentina, Brazil for the period 1934-2012, and Chile for the period 1941-2012,
whereas in neither case is it rejected based on the logarithms. For all of these three
cases, we will therefore eschew the Selden-Latané specification. Under the gold stan-
dard a unit root in either the level or the logarithm of velocity is rejected for Italy:
in this case, we will therefore uniquely consider unrestricted specifications for GDP,
1, and the short rate.
() For Taiwan, a unit root in velocity is rejected based on the level but not
based on the logarithm. In this case, we will eschew the Selden-Latané specification.
Evidence of a unit root in the logarithms of nominal GDP and nominal 1 is,
likewise, typically strong.23 For GDP, a unit root is rejected only for Bolivia and for
France under the gold standard (the latter rejection is ultimately irrelevant, since,
as previously mentioned, for France the interest rate is stationary, so that it is not
possible to analyze cointegrated systems). As for 1, it is rejected only for Israel,
Canada (1967-2013), and Finland (1914-1985). For Bolivia, Israel, Canada (1967-
2013), and Finland (1914-1985), we will therefore eschew unrestricted specifications
for GDP, 1, and the short rate, and we will uniquely focus on bivariate systems
with velocity and the short rate.24
We now turn to a brief discussion of methodological issues pertaining to boot-
strapping cointegrated processes.
22See footnote 16.23Again, in those few cases in which results based on the two alternative lag orders produce
contrasting evidence, we regard the null of a unit root as not having been convincingly rejected, and
we proceed under the assumption that the series is I(1).24A necessary condition for performing either Johansen’s or Shin’s cointegration tests is that the
series under investigation contain a unit root, and that their order of integration is not greater than
one. Tables C.2a-C.2b in the Online Appendix C report bootstrapped p-values for Elliot et al.’s
(1996) unit root tests with an intercept but no time trend, for either the log- or the first-differences
of 1 velocity and the short rate, and for the log-differences of nominal 1 and nominal GDP. In
brief (for details, see the discussion in Online Appendix C.3), in a few cases it is not possible to reject
a unit root in, for example, the log-differences or the first-differences of 1 velocity and the short
rate (this is the case for Morocco and for Portugal under the gold standard), or the log-differences
of nominal GDP and/or nominal 1. In all of these cases, we will therefore eschew the relevant
specifications, and in what follows we will therefore uniquely focus on specifications for which all
series are I(1).
14

6 Issues Pertaining to Bootstrapping
Everything in this paper is bootstrapped25–specifically, both the p-values for the
cointegration tests and, more generally, all of the objects of interest, such as the
coefficients on the short rate in the estimated long-run money demand functions. In
this section, we therefore briefly discuss () details of the bootstrapping procedures
we use and () how such procedures perform, in particular in terms of comparative
performance. In our discussion, we will extensively refer to Online Appendices D and
E, which contain the Monte Carlo evidence motivating both some of our choices and
the way in which we will interpret the empirical evidence.
6.1 Details of the bootstrapping procedures
We bootstrap Johansen’s tests via the procedure proposed by Cavaliere et al. (2012;
henceforth, CRT). In a nutshell, CRT’s procedure is based on the notion of comput-
ing critical and p-values by bootstrapping the model that is relevant under the null
hypothesis.26 All of the technical details can be found in CRT, to which the reader
is referred. We select the VAR lag order as the maximum27 between the lag orders
chosen by the Schwartz and the Hannan-Quinn criteria28 for the VAR in levels.
As for Shin’s tests, to the very best of our knowledge, no one has yet provided
anything comparable to what CRT did for Johansen’s procedure (in fact, we were
not able to find a single paper discussing how to bootstrap Shin’s test statistic).
The bootstrap procedure we propose in Online Appendix E is based on exactly the
same idea underlying CRT, that is, computing critical and p-values by bootstrapping
the process that is relevant under the null hypothesis. Within the present context,
this implies that the process to be bootstrapped is the vector error-correction model
25As for Johansen’s tests, the rationale for bootstrapping critical and p-values was provided by
Johansen (2002) himself, who showed how, in small samples, trace and maximum eigenvalue tests
based on asymptotic critical values typically tend to perform poorly. Since this is a small-sample
issue, as a matter of logic we should expect Shin’s (1994) tests to suffer from an analogous poor
performance, thus justifiying the use of a bootstrapping procedure. Appendix B provides an ad-
ditional rationale for bootstrapping Shin’s tests: as we show there, even in very large samples, the
distributions of Shin’s test statistics coincide with the asymptotic distribution reported in Shin’s
(1994) Table 1 only if the cointegration residual has no persistence.26This means that for tests of the null of no cointegration against the alternative of one or more
cointegrating vectors, the model that is being bootstrapped is a simple, noncointegrated VAR in dif-
ferences. For the maximum eigenvalue tests of h versus h+1 cointegrating vectors, on the other hand,
the model that ought to be bootstrapped is the VECM estimated under the null of h cointegrating
vectors.27We consider the maximum between the lag orders chosen by the SIC and HQ criteria because
the risk associated with selecting a lag order smaller than the true one (model misspecification) is
more serious than the one resulting from choosing a lag order greater than the true one (overfitting).28On the other hand, we do not consider the Akaike Information Criterion since, as discussed
by Luetkepohl (1991), for example, for systems featuring I(1) series, the AIC is an inconsistent lag
selection criterion, in the sense of not choosing the correct lag order asymptotically.
15

(VECM) estimated under the null of one cointegration vector. Apart from this, and
with the exception of two comparatively less important technical issues we discuss in
Section E.2.1 of Online Appendix E, the procedure we are proposing for Shin’s tests
is very similar to the one proposed by CRT for Johansen’s ones.
6.2 Monte Carlo evidence
Table 1 below and Table E.1 in the Online Appendix report Monte Carlo evidence
on the performance of the two bootstrapping procedures for Johansen’s and Shin’s
tests, respectively, which is discussed in detail in Sections E.3.1 and E.3.2 of Appen-
dix E. In either case, we perform the Monte Carlo simulations based on two types
of data generation processes (DGPs), featuring no cointegration and cointegration,
respectively. For either DGP, we consider five alternative sample lengths: = 50,
100, 200, 500, and 1,000.
The main findings emerging from Table 1 can be summarized as follows.
If the true DGP features no cointegration, CRT’s procedure performs very well ir-
respective of the sample size, with empirical rejection frequencies (henceforth, ERFs)
very close to the 10% significance level. This is in line with the Monte Carlo evidence
reported in CRT’s Table I, p. 1731, and with the analogous evidence reported in
Benati (2015).
Table 1 Monte Carlo evidence on the performance of Johansen’s
tests of the null of no cointegration, bootstrapped as in Cavaliere
et al.’s (2012): fractions of replications for which no cointegra-
tion is rejected at the 10% level
Sample length:
T = 50 T = 100 T = 200 T = 500 T = 1000
True data generation process: no cointegration
0.116 0.098 0.105 0.107 0.119
Persistence of the
cointegration residual True data generation process: cointegration
= 0 0.774 1.000 1.000 1.000 1.000
= 0.25 0.584 0.993 1.000 1.000 1.000
= 0.5 0.350 0.882 1.000 1.000 1.000
= 0.75 0.184 0.433 0.937 1.000 1.000
= 0.9 0.117 0.167 0.328 0.958 1.000
= 0.95 0.114 0.120 0.164 0.533 0.966 Based on the trace test of the null of no cointegration against the alternative of
1 or more cointegrating vectors. Based on 1,000 Monte Carlo replications and,
for each of them, on 5,000 bootstrap replications.
16

If, however, the true DGP does feature cointegration, Johansen’s tests29 perform
well only if the persistence of the cointegration residual is sufficiently low or the
sample size is sufficiently large (or both). If, however, the cointegration residual is
persistent and the sample size is small, the test fails to detect cointegration a nonneg-
ligible fraction of the time.30 This is conceptually in line with some of the evidence
reported by Engle and Granger (1987), and it has a straightforward explanation: as
the cointegration residual becomes more and more persistent, it gets closer and closer
to a random walk (in which case there would be no cointegration), and the procedure
therefore needs larger and larger samples to detect the truth (i.e., that the residual
is highly persistent but ultimately stationary).
Turning to Shin’s tests, the main findings emerging from Table E.1 in Online
Appendix E can be summarized as follows.
If the true DGP features cointegration, then the greater the persistence of the
cointegration residual, the more the proposed bootstrap procedure improves upon
Shin’s asymptotic critical values.31
If the DGP features no cointegration, however, even in large samples the proposed
bootstrapped procedure produces ERFs far from the ideal of 100%. For = 1000, for
example, cointegration is rejected only about 38% of the time and, based on smaller
sample lengths, much less than that.
6.2.1 Summing up
The preceding discussion can be summarized as follows.
If Johansen’s tests do detect cointegration, we should have a reasonable presump-
tion that cointegration is indeed there. If, on the other hand, they do not detect
it, a possible explanation is that the sample period is too short or the cointegration
residual is highly persistent (or both).
Lack of rejection of the null of cointegration based on Shin’s tests and our boot-
strapping procedure does not represent strong evidence that cointegration truly is
there. Further, rejection of the null of cointegration does not appear to be especially
informative about the true nature of the DGP because the ERFs are not significantly
different conditional on the two possible states of the world. Another way to put
all this is that results from Shin’s tests appear, overall, as less informative than the
corresponding results produced by Johansen’s tests bootstrapped as in CRT.
We now turn to the issue of what we should expect to obtain from cointegration
tests before running them, based on () the persistence of the cointegration residuals
29Table 1 only reports results based on the trace test, but evidence based on the maximum
eigenvalue test is near-identical.30For example, with = 100, cointegration will be detected, at the 10% level, 43.3% of the time
if = 0.75 and just 12.0% of the time if = 0.95.31For example, for = 100, if = 0.95, tests based on asymptotic critical values would lead
a researcher to reject the null of cointegration at the 10% level 72.1% of the time, whereas the
bootstrap-based procedure only rejects 25.1% of the time.
17

and () the just-discussed Monte Carlo evidence on how such persistence affects the
performance of the tests for a given sample length.
7 What ShouldWe Expect fromCointegration Tests?
In Section 8 we will perform cointegration tests based on about three dozen samples.
Performing such a large number of tests implies that, even if cointegration truly is
there in all samples and even under ideal conditions (e.g., Shin’s tests incorrectly
rejecting the null of cointegration % of the times at the % level), a certain number
of fluke results is to be expected. Further, the Monte Carlo evidence we discussed in
the previous section suggests that–in line with Engle and Granger (1987)–detecting
a cointegration relationship can be extremely difficult when the sample period is com-
paratively short or the cointegration residual is highly persistent (or both). In this
section, we therefore start by exploring how persistent “candidate cointegration resid-
uals” (defined below) actually are. Based on this and on the series’ actual sample
lengths, we then discuss what we should reasonably expect to obtain from cointegra-
tion tests before running them.
7.1 How persistent are “candidate cointegration residuals”?
Tables SELA.1, SL.1, LL.1, and LLCO.1 in the online appendix report Hansen (1999)
“grid bootstrap” median-unbiased (henceforth, MUB) estimates of the sum of the AR
coefficients in AR(2) representations for the “candidate cointegration residuals” in our
data set.32 By “candidate cointegration residual” (henceforth, CCR), we mean the
linear combination of the I(1) variables in the system that will indeed be regarded
as a cointegration residual if cointegration is detected. We label it as “candidate”
because, as the Monte Carlo evidence in the previous section has shown, if a cointe-
gration residual is highly persistent, cointegration might well not be detected even if
it is there, which would prevent the candidate from being identified as a true cointe-
gration residual. For reasons of robustness, we report results based on two alternative
estimators of the cointegration vector: Johansen’s and Stock and Watson’s (1993).
Results based on either estimator are qualitatively similar and point toward a
nonnegligible extent of persistence of the CCRs. At the same time, our data set
exhibits a wide extent of heterogeneity in terms of the estimated persistence. Focusing
on the results based on the log-log specification for high-inflation countries, and on
the Selden-Latané specification for all other countries, the MUB estimate based on
Johansen’s estimator of the cointegration vector–let us label it as
–ranges from
a minimum of 0.30 for Australia to a maximum of 1.00 for Portugal (1966-1998). By
classifying the
’s, in an admittedly quite arbitrary fashion, as “highly persistent”
32Results are based on 2,000 bootstrap replications for each possible value of the sum of the AR
coefficients in the grid. Bootstrapping has been performed as in Diebold and Chen (1996).
18

(
≥0.8), “moderately persistent” (0.4
0.8), and “not very persistent”
(
≤0.4), we end up with 16
’s in the first group, 15 in the second, and 3
in the third. Results based on Stock and Watson’s estimator point toward an even
greater extent of persistence, with the number of MUB estimates in the three groups
being equal to 21, 10, and 3, respectively.
7.2 Implications
Under these circumstances, statistical tests will often have a hard time detecting
cointegration even if it truly is there. This will be especially so in those cases in
which
is high and the sample period is comparatively short, such as Turkey.
As we discuss in the next section, based on none of the three specifications (Selden-
Latané, semi-log, and log-log) do Johansen’s tests detect any evidence of cointegration
between velocity and the short rate for this country. Such a failure of Johansen’s
tests to detect evidence of cointegration is especially startling in the light of the
evidence reported in panel (1,2) of Figure 5, highlighting very strongly the correlated
fluctuations in velocity and the short rate at low frequencies. This finding has a
straightforward explanation: given the comparatively short sample period (46 years)
and the high persistence of the CCR (with, e.g.,
in Table SELA.1 equal to
either 0.92 or 0.94), it is not surprising that Johansen’s procedure does not reject the
null of no cointegration. Rather, based on the evidence reported in Table 1, this is
to be expected : when the true DGP features cointegration, with = 50 and = 0.9
Johansen’s tests correctly reject the null of no cointegration only 11.7% of the time.
This is qualitatively and even quantitatively in line with the Monte Carlo evidence
reported by Engle and Granger (1987) for cointegration tests based on the Dickey-
Fuller test statistic. This means that if cointegration were truly there in Turkish data,
given the sample length we are working with and the specific characteristics of the
DGP, we would have a nearly 90% chance of not detecting it. The same logic applies
to several other countries for which Johansen’s tests will not detect cointegration, in
spite of the strong visual evidence in Figures 4-5.
The takeaway for the reader is that the results from cointegration tests we discuss
in the next section should not be taken strictly at face value. Rather, they ought to be
interpreted in light of the Monte Carlo evidence on the performance of cointegration
tests reported in Tables 1 and E.1, and of the evidence on the persistence of the CCRs
reported in Tables SELA.1, SL.1, LL.1, and LLCO.1.33
Let us now turn to the results from cointegration tests.
33This is very much in the spirit of Lucas’ (1988) interpretation of econometric results that, taken
at face value, appeared to contradict the findings of Meltzer (1963).
19

8 Searching for a Long-Run Money Demand
Table 2 reports results of tests from either Johansen or Shin for cointegration between
log velocity (the inverse of the ratio of nominal 1 to nominal GDP) and the log
of the short rate, which corresponds to the basic Baumol-Tobin constant elasticity
specification. As mentioned above, following Alvarez and Lippi (2009), the short rate
has been corrected by adding the expected cost of either losing cash or having it
stolen, which we calibrate to 1%. In Table 3 we report the results for the Selden-
Latané specification, which corresponds to an elasticity that is increasing over time.
The corresponding set of results based on the semi-log specification are reported in
Table SL2 in the online appendix and are discussed in Online Appendix G. We do not
discuss them here because they are systematically weaker than those based on either
the log-log or the Selden-Latané specifications. In a nutshell, as we will see, the data
seem to prefer the Selden-Latané specification at comparatively low interest rates (i.e.,
those associated with countries such as the United States or the United Kingdom)
and the log-log specification at high or very high interest rates (e.g., for countries
such as Argentina or Israel), whereas evidence based on the semi-log specification is
never strong.
Figures 6 to 10 report the estimation results for the log-log specification.34 In
the top rows, we report the candidate cointegration residuals produced by either
Johansen’s or Stock and Watson’s (1993) estimators, and in the bottom rows the
bootstrapped distributions35 of the corresponding estimates of the coefficient on the
log of the short rate (i.e., the interest rate elasticity of money demand). For each
bootstrapped distribution we also report the mean, the median, and the 5th and
95th percentiles. Figures SELA.1 to SELA.6 in the online appendix report the cor-
responding set of results based on the Selden-Latané specification, whereas Figures
SL.1 to SL.6 report results for the semi-log specification. For the reasons discussed
above, in all cases we report both candidate cointegration residuals and estimates of
the coefficients on the short rate for all countries rather than only for those for which
statistical tests detect evidence of cointegration.
8.1 Evidence from cointegration tests
8.1.1 Unrestricted tests of the null of cointegration
Although this paper mostly focuses on the results produced by bivariate systems,
we want to briefly discuss those produced by Shin’s tests of the null of cointegration
applied to unrestricted specifications featuring (the logarithm of) the short rate and
the logarithms of nominal GDP and1. The reason for doing so is that they represent
34Again, these results are based on the “corrected” short rate, incorporating the expected cost of
either losing cash or having it stolen.35Bootstrapping has been implemented as in Cavaliere et al. (2012) based on the estimated VECM
conditional on one cointegration vector.
20

Table 2 Cointegration tests between the logarithms of M1 velocity and a short-term rate
I: Johansen’s tests
Maximum
Country Period Trace eigenvalue II: Shin’s tests
Argentina 1914-2009 21.303 (0.032) 18.866 (0.023) 0.567 (0.288)
Australia 1941-1989 6.111 (0.800) 6.102 (0.709) 0.369 (0.126)
1969-2015 10.268 (0.506) 9.373 (0.405) 0.245 (0.395)
Belgium 1946-1990 23.319 (0.011) 21.225 (0.010) 0.106 (0.736)
Bolivia 1980-2013 15.480 (0.255) 15.134 (0.154) 0.156 (0.249)
Brazil 1974-2012 20.904 (0.049) 15.221 (0.093) 0.325 (0.104)
1934-2012 20.270 (0.034) 16.842 (0.037) 2.043 (0.011)
Canada 1926-2006 12.533 (0.306) 11.202 (0.229) 0.722 (0.182)
1967-2012 27.310 (0.010) 27.262 (0.003) 0.079 (0.705)
Chile 1940-1995 26.453 (0.013) 18.953 (0.033) 0.178 (0.244)
1941-2012 18.541 (0.059) 13.224 (0.119) 0.127 (0.725)
Colombia 1959-2011 6.603 (0.830) 4.896 (0.872) 0.225 (0.502)
Finland 1914-1985 7.225 (0.736) 5.019 (0.839) 1.447 (0.023)
Germany 1876-1913 9.947 (0.559) 8.689 (0.532) 0.522 (0.177)
Guatemala 1980-2012 18.939 (0.077) 17.261 (0.052) 0.072 (0.737)
Japan 1885-1913 11.938 (0.408) 10.737 (0.331) 0.435 (0.099)
1955-2013 13.502 (0.199) 13.502 (0.120) 0.098 (0.975)
Korea 1970-2014 6.698 (0.746) 6.075 (0.715) 0.282 (0.269)
Israel 1983-2014 41.66 (0.001) 40.773 (0.000) 0.135 (0.350)
Mexico 1985-2014 15.569 (0.230) 14.027 (0.205) 0.132 (0.285)
Netherlands 1950-1992 15.054 (0.166) 9.309 (0.401) 0.216 (0.413)
New Zealand 1934-2014 17.917 (0.075) 16.454 (0.044) 0.604 (0.354)
Norway 1946-2013 24.004 (0.016) 20.698 (0.015) 0.736 (0.157)
Portugal 1914-1965 20.699 (0.061) 19.887 (0.032) 0.120 (0.360)
1966-1998 19.392 (0.086) 14.975 (0.125) 0.074 (0.546)
South Africa 1967-2014 16.776 (0.131) 15.686 (0.080) 0.336 (0.160)
Spain 1941-1989 7.850 (0.642) 7.632 (0.537) 0.261 (0.256)
Switzerland 1851-1906 15.520 (0.094) 15.377 (0.057) 0.780 (0.192)
1948-2005 31.284 (0.001) 27.586 (0.001) 0.975 (0.064)
Taiwan 1962-2013 6.108 (0.816) 5.508 (0.794) 0.387 (0.131)
United Kingdom 1922-2014 15.684 (0.159) 15.361 (0.077) 0.951 (0.058)
United States
standard M 1 1915-2014 11.224 (0.342) 9.563 (0.320) 3.021 (0.015)
Lucas-Nicolini M 1 1915-2014 14.623 (0.187) 13.107 (0.137) 0.369 (0.290)
Venezuela 1962-1999 6.616 (0.771) 4.389 (0.888) 0.364 (0.094)
West Germany 1960-1989 12.243 (0.419) 12.194 (0.261) 0.442 (0.076) Bootstrapped p-values (in parentheses) are based on 10,000 bootstrap replications. Null of no cointegration against alternative of 1 or more cointegration vectors. Null of 0 versus 1 cointegration vectors.
2
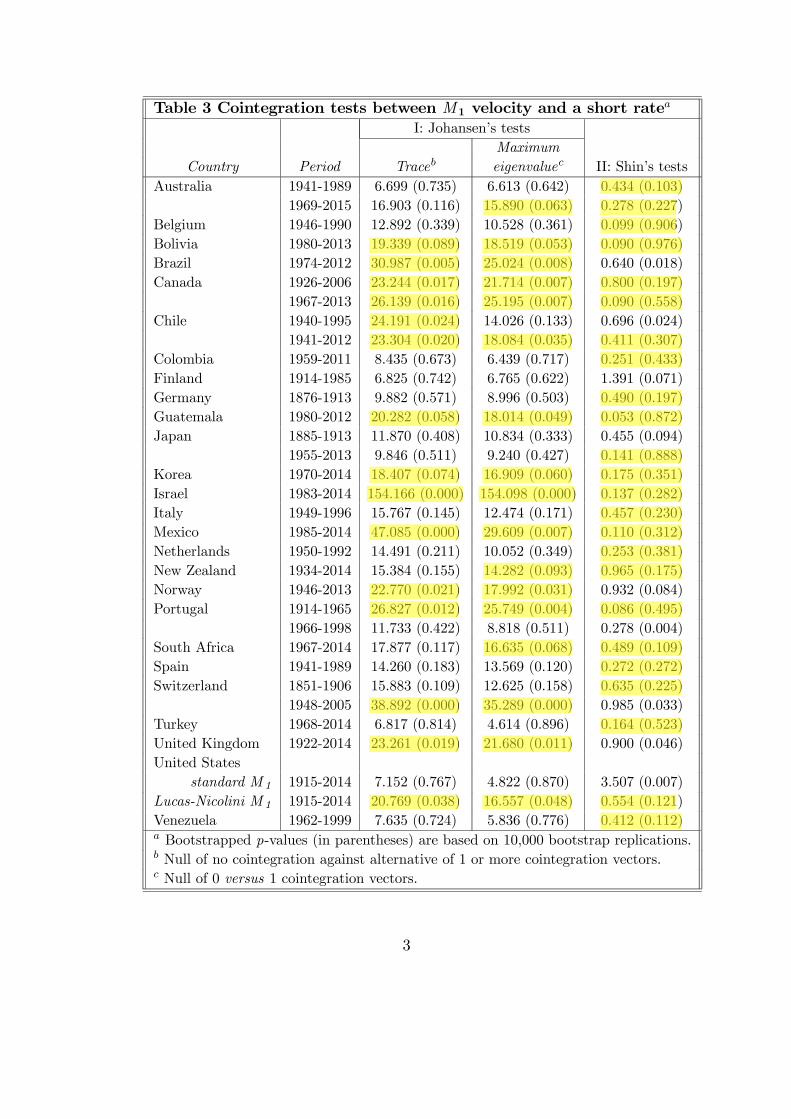
Table 3 Cointegration tests between M 1 velocity and a short rate
I: Johansen’s tests
Maximum
Country Period Trace eigenvalue II: Shin’s tests
Australia 1941-1989 6.699 (0.735) 6.613 (0.642) 0.434 (0.103)
1969-2015 16.903 (0.116) 15.890 (0.063) 0.278 (0.227)
Belgium 1946-1990 12.892 (0.339) 10.528 (0.361) 0.099 (0.906)
Bolivia 1980-2013 19.339 (0.089) 18.519 (0.053) 0.090 (0.976)
Brazil 1974-2012 30.987 (0.005) 25.024 (0.008) 0.640 (0.018)
Canada 1926-2006 23.244 (0.017) 21.714 (0.007) 0.800 (0.197)
1967-2013 26.139 (0.016) 25.195 (0.007) 0.090 (0.558)
Chile 1940-1995 24.191 (0.024) 14.026 (0.133) 0.696 (0.024)
1941-2012 23.304 (0.020) 18.084 (0.035) 0.411 (0.307)
Colombia 1959-2011 8.435 (0.673) 6.439 (0.717) 0.251 (0.433)
Finland 1914-1985 6.825 (0.742) 6.765 (0.622) 1.391 (0.071)
Germany 1876-1913 9.882 (0.571) 8.996 (0.503) 0.490 (0.197)
Guatemala 1980-2012 20.282 (0.058) 18.014 (0.049) 0.053 (0.872)
Japan 1885-1913 11.870 (0.408) 10.834 (0.333) 0.455 (0.094)
1955-2013 9.846 (0.511) 9.240 (0.427) 0.141 (0.888)
Korea 1970-2014 18.407 (0.074) 16.909 (0.060) 0.175 (0.351)
Israel 1983-2014 154.166 (0.000) 154.098 (0.000) 0.137 (0.282)
Italy 1949-1996 15.767 (0.145) 12.474 (0.171) 0.457 (0.230)
Mexico 1985-2014 47.085 (0.000) 29.609 (0.007) 0.110 (0.312)
Netherlands 1950-1992 14.491 (0.211) 10.052 (0.349) 0.253 (0.381)
New Zealand 1934-2014 15.384 (0.155) 14.282 (0.093) 0.965 (0.175)
Norway 1946-2013 22.770 (0.021) 17.992 (0.031) 0.932 (0.084)
Portugal 1914-1965 26.827 (0.012) 25.749 (0.004) 0.086 (0.495)
1966-1998 11.733 (0.422) 8.818 (0.511) 0.278 (0.004)
South Africa 1967-2014 17.877 (0.117) 16.635 (0.068) 0.489 (0.109)
Spain 1941-1989 14.260 (0.183) 13.569 (0.120) 0.272 (0.272)
Switzerland 1851-1906 15.883 (0.109) 12.625 (0.158) 0.635 (0.225)
1948-2005 38.892 (0.000) 35.289 (0.000) 0.985 (0.033)
Turkey 1968-2014 6.817 (0.814) 4.614 (0.896) 0.164 (0.523)
United Kingdom 1922-2014 23.261 (0.019) 21.680 (0.011) 0.900 (0.046)
United States
standard M 1 1915-2014 7.152 (0.767) 4.822 (0.870) 3.507 (0.007)
Lucas-Nicolini M 1 1915-2014 20.769 (0.038) 16.557 (0.048) 0.554 (0.121)
Venezuela 1962-1999 7.635 (0.724) 5.836 (0.776) 0.412 (0.112) Bootstrapped p-values (in parentheses) are based on 10,000 bootstrap replications. Null of no cointegration against alternative of 1 or more cointegration vectors. Null of 0 versus 1 cointegration vectors.
3

one extreme end of the spectrum within the full set of results. As we discuss in Online
Appendix G.1, based on unrestricted three-variables systems, it is almost impossible
to reject the null of cointegration.36 For the reasons discussed in Section 6.2,37 however,
these results should be downplayed. As we stressed there, lack of rejection of the null
of cointegration based on Shin’s tests and our bootstrapping procedure does not
represent strong evidence that cointegration is truly there38
Let us now turn to bivariate systems for velocity and the short rate.
8.1.2 Evidence from bivariate systems for velocity and the short rate
The log-log specification Based on the log-log specification, evidence of coin-
tegration is uniformly very strong for all of the high-inflation countries, with the
single exception of Bolivia, as well as for Belgium, Canada (1967-2013), Guatemala,
New Zealand, Norway, Portugal, and Switzerland. In all of these cases, p-values for
Johansen’s tests are below 10%, and p-values for Shin’s tests are above 10%.39
On the other hand, in four cases–Finland, Venezuela, West Germany, and Japan
under the gold standard–the opposite is true, with Johansen’s tests not rejecting the
null of no cointegration and Shin’s tests instead rejecting cointegration.
Finally, in almost all of the other cases, neither Johansen’s nor Shin’s tests reject
the null, thus producing contradictory evidence (e.g., this is the case for both the
United States and the United Kingdom). In this respect and based on our previous
discussion in Sections 6 and 7, two things ought to be stressed: on the one hand,
as we showed via Monte Carlo simulations, Johansen’s procedure exhibits an overall
better performance and produces more informative results. On the other hand, despite
even bootstrapping critical and p-values as in CRT (2012), Johansen’s tests still
suffer, in small samples, from the problem highlighted by Engle and Granger (1987).
The former issue suggests giving more weight to the results from Johansen’s tests–
pointing toward no cointegration–whereas the latter suggests that this result might
well be the figment of a comparatively short sample period or a highly persistent
cointegration residual (or both).40 So, in the end, evidence for this group of countries
36Specifically, at the 10% level, we obtain just four rejections of the null out of 33 tests based on
the semi-log specification, whereas based on the log-log specification with the 1% correction to the
short rate, we obtain only one rejection. (For the Selden-Latané specification, it is not possible to
consider unrestricted specifications.)37See also Section E.3.2 in Appendix E.38There is no need to remind the reader that using the asymptotic critical values reported in
Shin’s (1994) Table 1 is a nonstarter. On this, see the extended discussion in Appendix D.39To be precise, for Portugal (1966-1998) the p-value for the maximum eigenvalue tests is 0.125.
The overall picture for this country, however, clearly points toward cointegration. For Switzerland,
the p-value for Shin’s test for the period 1948-2005 is 0.064, but once again, overall evidence clearly
points toward cointegration.40For example, for the United States (based on the Lucas-Nicolini aggregate)
in Table
LLCO.1 in the online appendix is equal to either 0.77 or 0.79, whereas the corresponding figures for
the United Kingdom are 0.81 and 0.83.
21

is not clear-cut. Based on the discussion in Sections 6 and 7, on the respective sample
lengths and on the estimated persistence of the CCRs reported in Table LLCO.1
in the online appendix, and based on the CCRs themselves–which in several cases
appear quite clearly stationary (particularly for the United States and the United
Kingdom)–our own reading of the overall evidence is that in many cases, it is at
the very least compatible with the existence of a cointegration relationship between
velocity and the short rate.
The Selden-Latané specification Turning to the Selden-Latané specification,
evidence of cointegration is, once again, almost uniformly strong for high-inflation
countries. As for other countries, it is strong for Canada, Guatemala, Korea, Norway,
Portugal (1914-1965), and the United States based on Lucas and Nicolini’s (2015)1
aggregate.
On the other hand, in three cases–Finland, Japan under the Gold Standard,
and Portugal (1966-1998)–evidence clearly points toward no cointegration, with Jo-
hansen’s tests not rejecting the null of no cointegration and Shin’s tests instead re-
jecting cointegration.
In several other cases, neither Johansen’s nor Shin’s tests reject the null, thus
producing contradictory evidence. This is the case, for example, for Colombia, Japan
(1955-2013), the Netherlands, Spain, and Switzerland under the gold standard. For
all of these countries, the same considerations we made in the previous subsection
still apply, so that in these cases, the overall evidence is typically compatible with
the presence of cointegration between velocity and the short rate. Symmetrically,
for Norway, Switzerland (1948-2005), and the United Kingdom, both Johansen’s and
Shin’s tests reject the null. For Switzerland and the United Kingdom, our own reading
of the overall evidence (moreover, as discussed in Section 6, Johansen’s procedure is
more reliable than Shin’s) suggests that it is compatible with cointegration between
velocity and the short rate. As for Norway, things are less clear-cut: in particular,
the CCR shown in Figure SELA.4 does not appear as manifestly stationary.
8.1.3 Unrestricted tests of the null of no cointegration
Turning to specifications in which we do not impose unitary income elasticity, Tables
SL.4, LL.4, and LLCO.4 in the online appendix report results from Johansen’s tests of
no cointegration based on unrestricted specifications for (the logarithm of) the short
rate and the logarithms of nominal GDP and 1. As we discuss more extensively in
Online Appendix G.3, based on the log-log specification with the 1% correction to
the short rate, cointegration is detected based on both the trace and the maximum
eigenvalue tests for Argentina, Brazil (1974-2012), Canada (1967-2013), Japan (1955-
2013), Korea, Israel, the Netherlands, Norway, Portugal (1914-1965), and Switzerland
(1948-2005), whereas the two tests produce opposite results for Bolivia, Germany
(1876-2013), New Zealand, and South Africa.
22

27
Figure 6 Log-log specification with the 1% correction to the short rate, imposing unitary income elasticity: cointegration residuals and bootstrapped distributions of the coefficients on the log of the short rate

28
Figure 7 Log-log specification with the 1% correction to the short rate, imposing unitary income elasticity: cointegration residuals and bootstrapped distributions of the coefficients on the log of the short rate

29
Figure 8 Log-log specification with the 1% correction to the short rate, imposing unitary income elasticity: cointegration residuals and bootstrapped distributions of the coefficients on the log of the short rate

30
Figure 9 Log-log specification with the 1% correction to the short rate, imposing unitary income elasticity: cointegration residuals and bootstrapped distributions of the coefficients on the log of the short rate

31
Figure 10 Log-log specification with the 1% correction to the short rate, imposing unitary income
elasticity: cointegration residuals and bootstrapped distributions of the coefficients on the log of the short rate

8.2 The estimated coefficients on the short rate
We now turn our discussion to the bottom rows of Figures 6 to 10–showing the
estimated interest rate elasticities, which according to the Baumol-Tobin specification
ought to be equal to -1/2–and to Table LLCO.3 in the online appendix, reporting
bootstrapped p-values for testing the null hypothesis that the elasticity should be
equal to -1/2. Overall results are mixed, with the null being rejected in 17 cases out
of 32 based on Johansen’s estimator of the cointegration vector, and in 21 cases based
on Stock and Watson’s estimator.
The bottom rows of Figures SELA.1 to SELA.6 in the online appendix showminus
the estimated coefficients on the short rate41 based on the Selden-Latané specification,
whereas Table SELA.3 reports bootstrapped p-values for testing the null hypothesis
that the coefficients should be equal to -0.4. Since, different from Baumol-Tobin,
theory does not provide us with a numerical benchmark that can be used in order
to perform statistical tests, we have set such a benchmark to -0.4, which is roughly
equal to the median or modal estimates we obtain for the United States based on
the Lucas-Nicolini aggregate (see Figure SELA.6). (This is why Table SELA.3 does
not report results for the United States based on the Lucas-Nicolini aggregate.) The
null of -0.4 is rejected in 19 cases out of 33 based on Johansen’s estimator of the
cointegration vector, and in 25 cases based on Stock and Watson’s.
8.3 Toward a unified framework?
Is there any way to learn from this exercise which specification–log-log or Selden-
Latané–better fits the data? The econometric approach used herein does not nest the
two specifications, and it therefore does not allow us to formally test which of them is
better. Visual inspection, however, might favor the log-log specification. To see this,
we compare the point estimates of the parameters of both specifications for two sets
of countries. Both sets provide very good visual evidence, as reported in Section 3.
For all countries in both sets, there is strong evidence of cointegration in at least one
of the specifications. The first set comprises the United States, the United Kingdom,
Australia, Canada, and New Zealand. All of these countries experienced important
variations on their nominal interest rates, but they are low-inflation countries. The
second group is composed of Brazil, Bolivia, Chile, and Israel, all high-inflation coun-
tries.42 In the case of the log-log specification (see Figures 6 to 10) the estimates are
very similar and are around 1/2, as the BT linear technology implies, for most coun-
tries. Sometimes they are a bit smaller (as for the United States, Chile, or Brazil)
and sometimes a bit higher (as for the United Kingdom, New Zealand, or Israel),
41We report minus the coefficient on the short rate in order to make these results as comparable
as possible to those based on the log-log and semi-log specifications.42For Argentina, the Selden-Latané specification could not be estimated because, as explained in
the text, the necessary conditions were not fulfilled.
23

depending on the specific details of the statistical procedures used, but overall, the
sense that “one size fits all” dominates the estimates.
In contrast, when considering the Selden-Latané specification–see Figures SELA.1-
SELA.6 in Online Appendix II–the first set of countries consistently delivers esti-
mates between -0.5 and -0.4, whereas for some countries belonging to the second
group, the coefficient on the short rate can get to values such as -0.009 for Brazil or
-0.06 for Chile and is very precisely estimated.
Thus, if we are in search of a unified framework, the Baumol-Tobin specification
should be the preferred one. On the other hand, when focusing on the experience of
low-inflation countries, such as the United States, the United Kingdom, Canada, and
Australia, the Selden-Latané specification appears as the preferred one.
Therefore, one possible interpretation is that the technology that relates the num-
ber of transactions to total costs exhibits a decreasing marginal cost for low values of
interest rates, as implied by the Selden-Latane functional form, but that it eventually
becomes constant, as implied by the Baumol-Tobin specification.
9 Conclusions
We use a simple model of a transaction demand for money to guide a thorough
investigation of the stability of the long-run relationship between the ratio of money
to output and a short-term nominal interest rate. Our data set comprises 32 countries
for periods that range from 35 to 100 years. The log-log specification, which roughly
corresponds to the linear cost function assumed by Baumol and Tobin, with an income
elasticity of 1 and an interest rate elasticity close to 0.5, performs remarkably well
for almost all the countries. It is also the case, however, that a specification in which
the ratio of money to output is inversely related to a linear function of the short-term
nominal interest rate is a better description of the data if we focus on countries in
which the inflation rate has been in the low range, such as the United States or the
United Kingdom. Overall, while there are a few countries for which the relationship
cannot be detected, we find very strong evidence of a stable long-run money demand.
24

References
Alvarez, F., and F. Lippi (2009): “Financial Innovation and the TransactionsDemand for Cash,” Econometrica, 77(2), 363—402.
(2014): “Persistent Liquidity Effects and the Long Run Money Demand,”
American Economic Journal: Macroeconomics, 6(2), 71—107.
Ball, L. (2001): “Another Look at Long-RunMoney Demand,” Journal of MonetaryEconomics, 47(1), 31—44.
Barro, R. J. (1982): “United States Inflation and the Choice of Monetary Stan-dard,” in R. E. Hall, ed., ’Inflation: Causes and Effects’, University of Chicago
Press.
Barsky, R. (1987): “The Fisher Hypothesis and the Forecastability and Persistenceof Inflation,” Journal of Monetary Economics, 19(1), 3—24.
Benati, L. (2008): “Investigating Inflation Persistence Across Monetary Regimes,”Quarterly Journal of Economics, 123(3), 1005—1060.
(2015): “The Long-Run Phillips Curve: A Structural VAR Investigation,”
Journal of Monetary Economics, 76(November), 15—28.
Cavaliere, G., A. Rahbek, and A. M. R. Taylor (2012): “Bootstrap Determi-nation of the Cointegration Rank in Vector Autoregressive Models,” Econometrica,
80(4), 1721—1740.
Christiano, L. J., and T. J. Fitzgerald (2003): “The Bandpass Filter,” Inter-national Economic Review, 44(2), 435—465.
Diebold, F. X., and C. Chen (1996): “Testing Structural Stability with Endoge-nous Breakpoint: A Size Comparison of Analytic and Bootstrap Procedures,” Jour-
nal of Econometrics, 70(1), 221—241.
Elliot, G., T. J. Rothenberg, and J. H. Stock (1996): “Efficient Tests for anAutoregressive Unit Root,” Econometrica, 64(4), 813—836.
Engle, R. F., and C. W. J. Granger (1987): “Cointegration and Error Correc-tion: Representation, Estimation, and Testing,” Econometrica, 55(2), 251—276.
Friedman, B. M., and K. N. Kuttner (1992): “Money, Income, Prices, andInterest Rates,” American Economic Review, 82(3), 472—492.
Grossman, S., and L. Weiss (1983): “A Transactions-Based Model of the Mone-tary Transmission Mechanism,” American Economic Review, 73(5), 871—880.
25

Hamilton, J. (1994): Time Series Analysis. Princeton, NJ, Princeton UniversityPress.
Hansen, B. E. (1999): “The Grid Bootstrap and the Autoregressive Model,” Reviewof Economics and Statistics, 81(4), 594—607.
Johansen, S. (2002): “A Small Sample Correction for the Test of Cointegrating
Rank in the Vector Autoregressive Model,” Econometrica, 70(5), 1929—1961.
Latané, H. A. (1960): “Income Velocity and Interest Rates: A Pragmatic Ap-
proach,” Review of Economics and Statistics, 42(4), 445—449.
LucasJr., R. E. (1980): “Two Illustrations of the Quantity Theory of Money,”American Economic Review, 70(5), 1005—1014.
(1988): “Money Demand in the United States: A Quantitative Review,”
Carnegie-Rochester Conference Series on Public Policy, 29, 137—168.
LucasJr., R. E., and J.-P. Nicolini (2015): “On the Stability of Money Demand,”Journal of Monetary Economics, 73, 48—65.
Luetkepohl, H. (1991): Introduction to Multiple Time Series Analysis, 2nd edition.Springer-Verlag.
Meltzer, A. H. (1963): “The Demand for Money: The Evidence from the Time
Series,” Journal of Political Economy, 71(3), 219—246.
Rotemberg, J. J. (1984): “A Monetary Equilibrium Model with Transactions
Costs,” Journal of Political Economy, 92(1), 40—58.
Selden, R. T. (1956): “Monetary Velocity in the United States,” in M. Friedman,ed., SStudies in the Quantity Theory of MoneyŠ, University of Chicago Press, pp.
405—454.
Shin, Y. (1994): “A Residual-Based Test of the Null of Cointegration against theAlternative of No Cointegration,” Econometric Theory, 10(1 (Mar., 1994)), 91—115.
Stock, J. H., and M. W. Watson (1993): “A Simple Estimator of CointegratingVectors in Higher Order Integrated Systems,” Econometrica, 61(4), 783—820.
26