Embed Size (px)
Citation preview
International Journal of Environment, Agriculture and Biotechnology (IJEAB) Vol-2, Issue-1, Jan-Feb- 2017
http://dx.doi.org/10.22161/ijeab/2.1.22 ISSN: 2456-1878
www.ijeab.com Page | 165
Geochemical Processes and Assessment of Water
Quality for Irrigation of Al-Shagaya Field-C,
Kuwait Al-Ruwaih F.M., Shafiullah G.
Department of Earth and Environmental Sciences, Kuwait University, Kuwait
Abstract— Al-Shagaya Field-C is located southwest of
Kuwait City, where the brackish groundwater is produced
from the Dammam aquifer. The main objectives are to
recognize the major geochemical processes operating in
the aquifer and controlling its quality; in addition, to
evaluate the groundwater quality criteria for drinking and
irrigation. The investigation was carried out by
estimating pH, EC, TDS, TH, SAR, %Na, RSC, RSBC,
potential salinity, magnesium ratio, chloro-alkaline index,
Kelly’s ratio, Permeability index, and salinity hazard
respectively. The TDS ranges between 2474 and 3232
mg/l, with an average value of 2753mg/l and the water is
exceeding very hard. Groundwater shows Ca-Cl and Ca-
Mg-Cl genetic water types. Results revealed that the
groundwater is oversaturated with respect to dolomite
and calcite and under-saturated with respect to gypsum
and anhydrite. The main geochemical processes
controlling groundwater chemistry in the study area are
due to dissolution/ precipitation process along the path
flow. The major ions composition in groundwater of the
study area indicated that the water is not suitable for
drinking. However, the irrigation parameters revealed
that the groundwater is suitable for irrigation purposes.
Keywords— Dammam aquifer, saturation index, Gibb’s
ratio, hydro chemical facies & GIS.
I. INTRODUCTION
Kuwait covers an area of 18,000 km2 and lies in the north-
eastern corner of the Arabian Peninsula and occupies the
north-western part of the Arabian Gulf as shown in Fig
(1A).The climate is extremely hot and dry in summer and
mild to cold in winter . The rainfall is scarce with an
annual average precipitation of 115 mm. The average
evaporation is equal 17 mm/ day .The location of Kuwait
within the arid gives groundwater great importance. The
brackish groundwater in Kuwait is used in agriculture,
gardening and domestic purposes. Moreover, it is blend
with the fresh water produced by desalination plants to
make potable drinking water. The groundwater is
abstracted from two main aquifers, the Kuwait Group
aquifer, which is leaky to water-table aquifer, and the
Dammam aquifer is confined to semi-confined aquifer. Al-
shagaya area is located in the southwest of Kuwait and
was put in use in early 1970,s .This area includes five
water well fields. Fields A, B, C, D, and E supply Kuwait
city with brackish groundwater produced mainly from
Dammam aquifer at a peak rate of 60 MIGD, with an
expected quality of 4,000 mg/l of TDS, from a total of 115
production wells distributed over the five water-well
fields. The salinity of the Dammam aquifer increases from
southwest to north-northeast ranging from 2,500 to, 8,000
mg/l .The major hydro chemical water types are CaSO4 ,
Na2SO4 and NaCl [1] . Field-C is the area under
investigation, where Figs. 1B and 1C show the location
and the distribution of the water wells. Al-Shagaya Field-C
is located approximately 64 km to the south-west of
Kuwait City, with 32 wells produced groundwater from
the Dammam aquifer.
The objectives of this investigation are to identify the
water chemical types and hydro chemical processes
operating within the main aquifer, in addition to the
determination of degree of saturation of groundwater with
International Journal of Environment, Agriculture and Biotechnology (IJEAB) Vol-2, Issue-1, Jan-Feb- 2017
http://dx.doi.org/10.22161/ijeab/2.1.22 ISSN: 2456-1878
www.ijeab.com Page | 166
respect to some minerals. Moreover, the suitability of
groundwater for drinking and irrigation purposes will be
carried out.
Several studies were conducted to date addressing water
quality criteria for irrigation. In the research paper
published by [2] six soil samples were collected during
pre and post monsoon season from Coring mangrove
region of East Godavari estuaries for physicochemical of
pH, EC, TDS, TH, Cl- , SO42-, NO3
-, PO43-, Na+, K+, Ca2+,
and Mg2+, and irrigation parameters such % Na, SAR,
RSC, KR, and MH, were determined. The results showed
that the pH ranges from 7.2 – 7.8 and 7.0 – 7.5 and
indicate slight alkaline nature of the soils. Total hardness
ranges from 400 – 1550 mg/l pre and post monsoon
indicating the hardness of soils. The Magnesium Hazard
(MH) ranges from 61.93 – 93.4 pre and post monsoon,
exceeding the permissible limit of irrigation standards.
Higher Magnesium level in soil causes Magnesium
Hazard, so that the soil fertility will be depleted and
affects the crop yields. According to [3] Salinity and
Sodicity have been reported among the major problems of
irrigated agriculture across the world. The methods that
are commonly used as indices of salinity or sodicity in the
soils include electrical conductivity, Sodium Adsorption
Ratio (SAR) and Exchangeable Sodium Percentage. Also,
[4] found that the effect of high SAR can be poor soil tith,
and soils become sticky when wet resulting in reduced
water infiltration. Aza –Gnandji et. al. [5] found that high
salinity levels tend to affect soil structure and crop
productivity. And chloride is an essential plant
micronutrient, but, it’s toxic to some crops at higher
concentration. Sodium is important to some plant growth,
and at high concentrations, it is toxic to many plants. The
high salinity of water of C4-S2 class permits occasional
use and then only under favorable soil and plants of high
salt tolerance should be grown. Dastorani et. al. [6]
reported that the groundwater resources can be available
to help support development, and the limited recharge of
groundwater resources is dependent on the amount
duration and intensity of rainfall as well as soil properties.
According to a study conducted by [7] on the
groundwater quality in Abdalli area in Kuwait, it reveals
that most of the groundwater samples fall within class C3-
S4 in Wilcox salinity hazard diagram, which means poor
water quality for irrigation and it can be used in well –
drained soil. Moreover, with reference to [8], based on
Kelly’s ratio, water is classified for irrigation. Kelly’s
ratio of more than 1 indicates excess level of Na+ in water.
Therefore, water with Kelly’s ratio of less than 1 is
suitable for irrigation, while those with ratio more than 3
are unsuitable for irrigation. In addition, the authors [9]
pointed out that the higher level of TDS confirms the
unsuitability of water for drinking and irrigation purposes.
And the presence of magnesium in water would adversely
affect the soil quality rendering it unsuitable for
cultivation. If MH is less than 50 the water is safe and
suitable for irrigation. However, Narany et al. [10]
reported that bicarbonate hazard is usually represented in
term of RSC, which shows the tendency for calcium and
magnesium to participation as the soil become
concentrated. Therefore, the relative proportion of sodium
in the water is increased in the form of sodium
bicarbonate. According to [11] when electrical
conductivity values exceeded the permissible of limits
4000 µ mhos/cm, the water is considered of salinity
nature, and is not suitable for irrigation purposes .
II. GEOLOGY OF KUWAIT
2.1 Topography
The topography of Kuwait is generally flat, broken by
occasional low hills and shallow depressions. Elevations
range from sea level in the east to nearly 300 m in the
southwestern corner of the country. The Jal Az-Zor
escarpment form one of the main topographic features in
Kuwait [12]. The major depression, Wadi Al-Batin is a
valley along the western border with 8 to 11 Km and
relief of 70 m. The coast lies along the east of the country
and sabkha has developed along the coast. In the
northeastern part of the country a few barchans dunes up
to 25 m are found [13, 14].
2.2 Stratigraphy
The stratigraphical column of Kuwait was mainly
influenced by the stable shelf condition of the Arabian
plate, causing the deposition of shallow water sediments
and evaporates. The surface of Kuwait is formed by
sedimentary rocks and sediments ranging from Middle
Eocene to Recent. The Dammam Formation represents
the oldest exposed sedimentary rocks. The Recent
deposits of fine-grained beach sands cover southern coast
of Kuwait and the Neutral Zone.
Kuwait Group consists of the Dibdibba, Lower Fars, and
Ghar Formations in descending order. Dibdibba
Formation includes all rocks between the overlaying
Holocene deposits. It consists of fluviated sequence of
cross-bedded sands and gravel with subordinate
intercalations or lenticular bodies of sandy clays,
sandstone, conglomerate and siltstone. Lower Fars
Formation consists of sands, Quartz, loosely consolidated
gravels, clay and marl. The Ghar Formation consists
mainly of marine to terrestrial coarse and unconsolidated
sand, silt and gravel.
Hasa Group consists of three formations in descending
order; Dammam, Rus and Radhuma Formations.
Dammam Formation is considered the largest and the
most potential productive aquifer of brackish groundwater
in Kuwait. Its thickness ranges between 150 and 275 m
International Journal of Environment, Agriculture and Biotechnology (IJEAB) Vol-2, Issue-1, Jan-Feb- 2017
http://dx.doi.org/10.22161/ijeab/2.1.22 ISSN: 2456-1878
www.ijeab.com Page | 167
increases towards the northeast. Dammam Formation
consists mainly of dolomitic limestone and limestone
inter-bedded with shale at the base of the formation,
forms the relatively impermeable lower boundary over
most of the region. Rus Formation is composed of hard,
dense, massive anhydrite and unfossiliferous limestone.
Radhuma Formation consists mostly of anhydrite,
dolomitic and marly limestone with few fossiliferous
horizons [15].
2.3 Hydrology and Aquifer System
The most significant aquifer in Kuwait is the Tertiary-
Quaternary system. These are the upper clastic sediments of
the Kuwait Group aquifer, and the Dammam aquifer which
are separated by a confining layer of cherts and/or clay [16].
Under natural hydrological conditions, the flow through the
Kuwait aquifer is in SW-NE direction, from the main
recharge area in Saudi Arabia to the main discharge area in
the Arabian Gulf and Shaat Al-Arab. Generally, part of the
natural recharge of the Kuwait Group aquifer gains by
leakage from the Dammam aquifer, and also comes from
infiltration through the wadies and depressions, as well as
the lateral flow coming from Saudi Arabia [17]. The effect
of leakage between the two main aquifers may give rise to
the similarities of groundwater chemistries.
2.4 Objectives of the Study
The main objectives are to study the geochemistry of the
study area in order to recognize the prevailing and the
major geochemical processes that control the quality of
the groundwater. Moreover, the suitability of groundwater
for drinking and irrigation were evaluated by determining
physiochemical and irrigation parameters.
III. METHODOLOGY
In this study, the chemical analyses of the major cations
and anions such as Ca2+, Mg2+, Na+, K+, HCO3-, SO4
2-,
and Cl- expressed in mg/l were converted to equivalent
per million (e.p.m), (which is equivalent to mq/l) and
%e.p.m [18]. Ion balance equation was applied to validate
the accuracy of the chemical analyses where ±5% is
acceptable [19]. Also, the reaction error of all
groundwater samples was less than the accepted limit of
±10% [20] as in Table1 1.
To achieve these objectives a speciation model has been
used to determine the degree of saturation of groundwater
with respect to some minerals using WATEQ4F program
[21]. Along with the application of the Gibb’s ratio to
assess the functional sources of dissolved chemical
constituents and to recognize the main processes
governing the groundwater chemistry of the study area.
Hydrochemical facies interpretation is used to determine
flow pattern and origin of chemical histories of
groundwater by plotting of the major cations and anions
on the Piper diagram [22]. The assessment of
groundwater for irrigation purposes based on different
irrigation indices is carried out includes SAR, RSC, %Na,
residual sodium bicarbonate (RSBC), Permeability Index
(P.I) Potential Salinity (P.S) ), Salinity hazard,
magnesium ratio (MgR), Kelly’s ratio (KR), and chloro-
alkaline index (CAI-1). Wilcox diagram (1955), and
Doneen permeability index [23, 24] also have been
utilized for classification of groundwater for irrigation.
The spatial distribution of TDS, TH, RSC, SAR, gypsum
and calcite parameters, were illustrated using ArcGIS10
software.
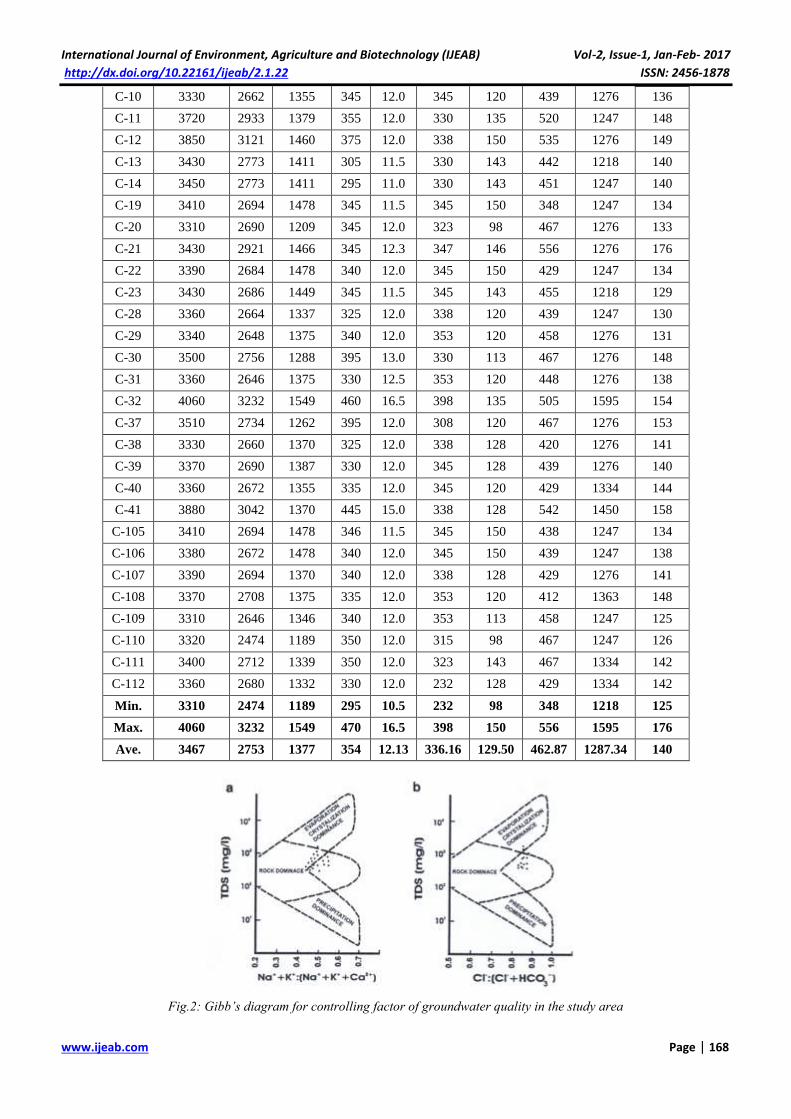
3.1 Mechanisms of Controlling Groundwater
Chemistry
It is important to study the relationship between the water
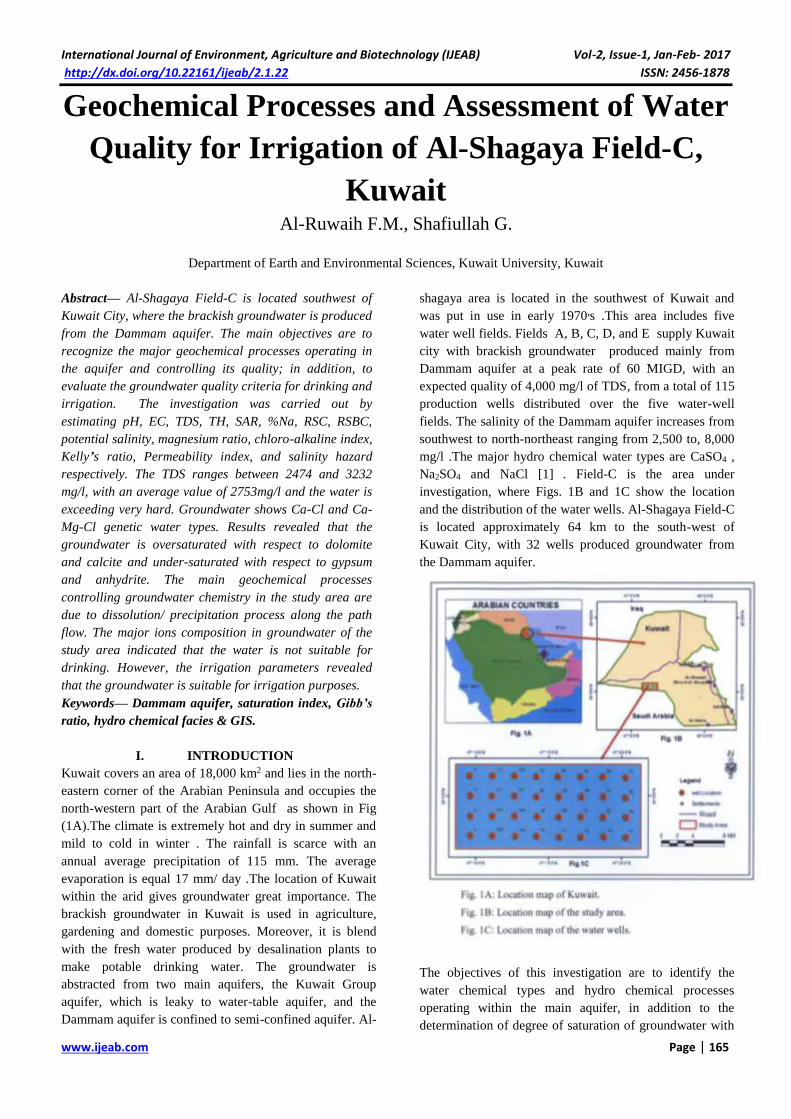
chemistry and the aquifer lithology. Gibb’s [25]
suggested a diagram that represents the ratio of dominant
anions and cations plotted against the value of TDS.
These ratios can be divided into two formula, the first
ratio is for the cations [(Na+ + K+) / (Na+ + K+ + Ca2+)],
and the second ratio is for the anions, Cl- / (Cl- + HCO-3)
as a function of TDS. This diagram is widely used to
evaluate the functional sources of dissolved constituents
such as precipitation-dominance, rock-dominance, and
evaporation-dominance. The chemical analyses of the
study area are plotted in the Gibb’s diagram as shown in
Fig. 2, and showed that the predominant samples fall into
the category of rock-water interaction field and few
samples are located in evaporation-dominance field ,
which revealed that the chemical weathering of rock-
forming minerals are influencing the groundwater quality
by dissolution of rock through which there is circulation,
while the data in the evaporation-dominance field indicate
that the increasing ions of Na+ and Cl- are in relation with
the increasing of the TDS.
Table.1: Chemical analysis results of the Al-Shagaya Field - C, (mg/l)
Well
No.
EC
µmohs/cm TDS T.Hard Na+ K+ Ca2+ Mg2+ Cl- SO4
- HCO3
-
C-1 3340 2644 1308 360 12.0 338 113 476 1247 126
C-2 3460 2736 1332 365 11.5 323 128 517 1262 131
C-3 3680 2883 1379 335 10.5 330 135 535 1218 126
C-4 3700 2864 1370 470 12.0 338 128 489 1363 145
International Journal of Environment, Agriculture and Biotechnology (IJEAB) Vol-2, Issue-1, Jan-Feb- 2017
http://dx.doi.org/10.22161/ijeab/2.1.22 ISSN: 2456-1878
www.ijeab.com Page | 168
C-10 3330 2662 1355 345 12.0 345 120 439 1276 136
C-11 3720 2933 1379 355 12.0 330 135 520 1247 148
C-12 3850 3121 1460 375 12.0 338 150 535 1276 149
C-13 3430 2773 1411 305 11.5 330 143 442 1218 140
C-14 3450 2773 1411 295 11.0 330 143 451 1247 140
C-19 3410 2694 1478 345 11.5 345 150 348 1247 134
C-20 3310 2690 1209 345 12.0 323 98 467 1276 133
C-21 3430 2921 1466 345 12.3 347 146 556 1276 176
C-22 3390 2684 1478 340 12.0 345 150 429 1247 134
C-23 3430 2686 1449 345 11.5 345 143 455 1218 129
C-28 3360 2664 1337 325 12.0 338 120 439 1247 130
C-29 3340 2648 1375 340 12.0 353 120 458 1276 131
C-30 3500 2756 1288 395 13.0 330 113 467 1276 148
C-31 3360 2646 1375 330 12.5 353 120 448 1276 138
C-32 4060 3232 1549 460 16.5 398 135 505 1595 154
C-37 3510 2734 1262 395 12.0 308 120 467 1276 153
C-38 3330 2660 1370 325 12.0 338 128 420 1276 141
C-39 3370 2690 1387 330 12.0 345 128 439 1276 140
C-40 3360 2672 1355 335 12.0 345 120 429 1334 144
C-41 3880 3042 1370 445 15.0 338 128 542 1450 158
C-105 3410 2694 1478 346 11.5 345 150 438 1247 134
C-106 3380 2672 1478 340 12.0 345 150 439 1247 138
C-107 3390 2694 1370 340 12.0 338 128 429 1276 141
C-108 3370 2708 1375 335 12.0 353 120 412 1363 148
C-109 3310 2646 1346 340 12.0 353 113 458 1247 125
C-110 3320 2474 1189 350 12.0 315 98 467 1247 126
C-111 3400 2712 1339 350 12.0 323 143 467 1334 142
C-112 3360 2680 1332 330 12.0 232 128 429 1334 142
Min. 3310 2474 1189 295 10.5 232 98 348 1218 125
Max. 4060 3232 1549 470 16.5 398 150 556 1595 176
Ave. 3467 2753 1377 354 12.13 336.16 129.50 462.87 1287.34 140
Fig.2: Gibb’s diagram for controlling factor of groundwater quality in the study area
International Journal of Environment, Agriculture and Biotechnology (IJEAB) Vol-2, Issue-1, Jan-Feb- 2017
http://dx.doi.org/10.22161/ijeab/2.1.22 ISSN: 2456-1878
www.ijeab.com Page | 169
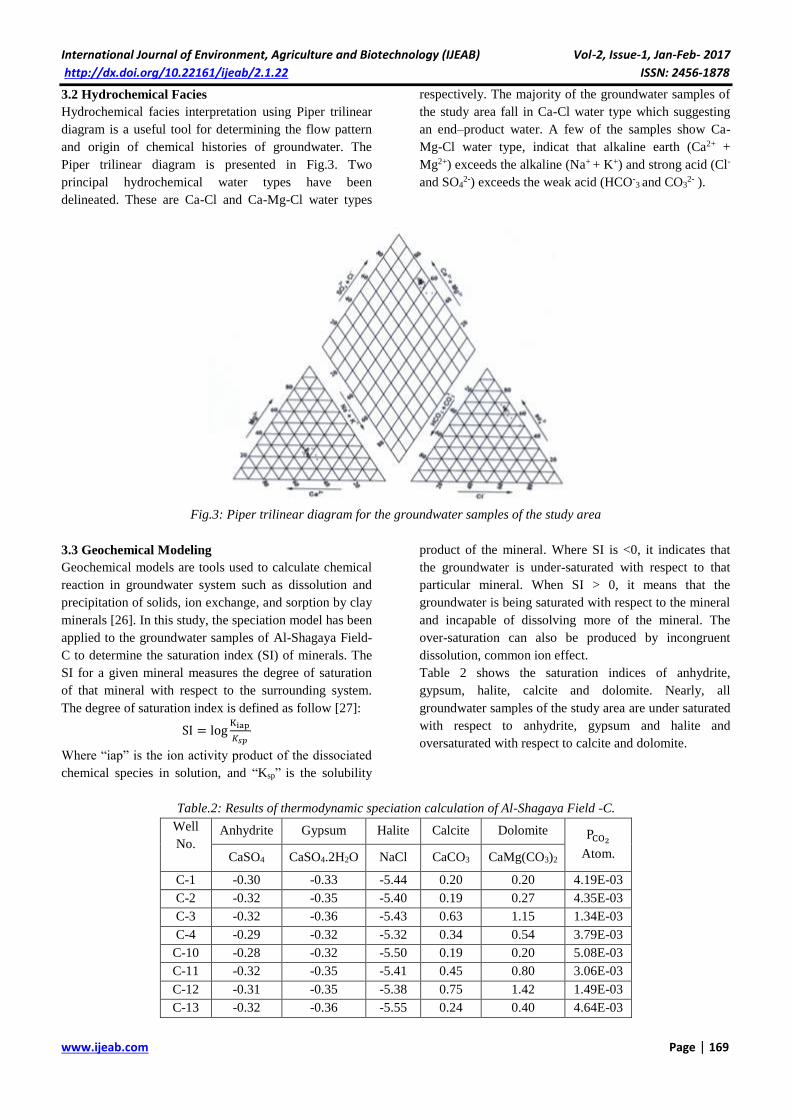
3.2 Hydrochemical Facies
Hydrochemical facies interpretation using Piper trilinear
diagram is a useful tool for determining the flow pattern
and origin of chemical histories of groundwater. The
Piper trilinear diagram is presented in Fig.3. Two
principal hydrochemical water types have been
delineated. These are Ca-Cl and Ca-Mg-Cl water types
respectively. The majority of the groundwater samples of
the study area fall in Ca-Cl water type which suggesting
an end–product water. A few of the samples show Ca-
Mg-Cl water type, indicat that alkaline earth (Ca2+ +
Mg2+) exceeds the alkaline (Na+ + K+) and strong acid (Cl-
and SO42-) exceeds the weak acid (HCO-
3 and CO32- ).
Fig.3: Piper trilinear diagram for the groundwater samples of the study area
3.3 Geochemical Modeling
Geochemical models are tools used to calculate chemical
reaction in groundwater system such as dissolution and
precipitation of solids, ion exchange, and sorption by clay
minerals [26]. In this study, the speciation model has been
applied to the groundwater samples of Al-Shagaya Field-
C to determine the saturation index (SI) of minerals. The
SI for a given mineral measures the degree of saturation
of that mineral with respect to the surrounding system.
The degree of saturation index is defined as follow [27]:
SI = logKiap
𝐾𝑠𝑝'
Where “iap” is the ion activity product of the dissociated
chemical species in solution, and “Ksp” is the solubility
product of the mineral. Where SI is <0, it indicates that
the groundwater is under-saturated with respect to that
particular mineral. When SI > 0, it means that the
groundwater is being saturated with respect to the mineral
and incapable of dissolving more of the mineral. The
over-saturation can also be produced by incongruent
dissolution, common ion effect.
Table 2 shows the saturation indices of anhydrite,
gypsum, halite, calcite and dolomite. Nearly, all
groundwater samples of the study area are under saturated
with respect to anhydrite, gypsum and halite and
oversaturated with respect to calcite and dolomite.
Table.2: Results of thermodynamic speciation calculation of Al-Shagaya Field -C.
Well
No.
Anhydrite Gypsum Halite Calcite Dolomite PCO2
Atom. CaSO4 CaSO4.2H2O NaCl CaCO3 CaMg(CO3)2
C-1 -0.30 -0.33 -5.44 0.20 0.20 4.19E-03
C-2 -0.32 -0.35 -5.40 0.19 0.27 4.35E-03
C-3 -0.32 -0.36 -5.43 0.63 1.15 1.34E-03
C-4 -0.29 -0.32 -5.32 0.34 0.54 3.79E-03
C-10 -0.28 -0.32 -5.50 0.19 0.20 5.08E-03
C-11 -0.32 -0.35 -5.41 0.45 0.80 3.06E-03
C-12 -0.31 -0.35 -5.38 0.75 1.42 1.49E-03
C-13 -0.32 -0.36 -5.55 0.24 0.40 4.64E-03
International Journal of Environment, Agriculture and Biotechnology (IJEAB) Vol-2, Issue-1, Jan-Feb- 2017
http://dx.doi.org/10.22161/ijeab/2.1.22 ISSN: 2456-1878
www.ijeab.com Page | 170
C-14 -0.31 -0.35 -5.55 0.14 0.19 5.80E-03
C-19 -0.29 -0.34 -5.60 0.24 0.39 4.42E-03
C-20 -0.30 -0.34 -5.47 0.49 0.75 2.20E-03
C-21 -0.24 -0.28 -4.94 0.11 -0.01 2.91E-03
C-22 -0.29 -0.33 -5.75 0.24 0.40 4.43E-03
C-23 -0.31 -0.34 -5.48 0.32 0.53 3.37E-03
C-28 -0.30 -0.33 -5.52 0.21 0.26 4.33E-03
C-29 -0.28 -0.31 -5.49 0.62 1.05 1.69E-03
C-30 -0.30 -0.34 -5.41 0.25 0.32 4.93E-03
C-31 -0.27 -0.31 -5.51 0.25 0.32 4.58E-03
C-32 -0.18 -0.22 -5.33 0.31 0.48 5.04E-03
C-37 -0.33 -0.37 -5.41 0.33 0.35 5.10E-03
C-38 -0.29 -0.24 -5.54 0.34 0.55 3.71E-03
C-39 -0.29 -0.32 -5.52 0.35 0.55 3.67E-03
C-40 -0.27 -0.31 -5.52 0.32 0.45 3.46E-03
C-41 -0.27 -0.31 -5.31 0.22 0.30 5.78E-03
C-105 -0.30 -0.34 -5.50 0.23 0.38 4.40E-03
C-106 -0.30 -0.34 -5.51 0.25 0.41 4.55E-03
C-107 -0.29 -0.33 -5.52 0.25 0.35 4.68E-03
C-108 -0.25 -0.29 -5.54 0.28 0.36 4.92E-03
C-109 -0.28 -0.32 -5.49 0.22 0.22 4.15E-03
C-110 -0.31 -0.35 -5.46 0.37 0.51 2.64E-03
C-111 -0.30 -0.34 -5.47 0.22 0.37 4.71E-03
C-112 -0.42 -0.45 -5.53 0.37 0.77 2.30E-03
Min. -0.42 -0.45 -5.75 0.11 -0.01 1.34E-03
Max. -0.18 -0.22 -4.94 0.75 1.42 5.80E-03
Ave. -0.29 -0.33 -5.46 0.31 0.48 3.93E-03
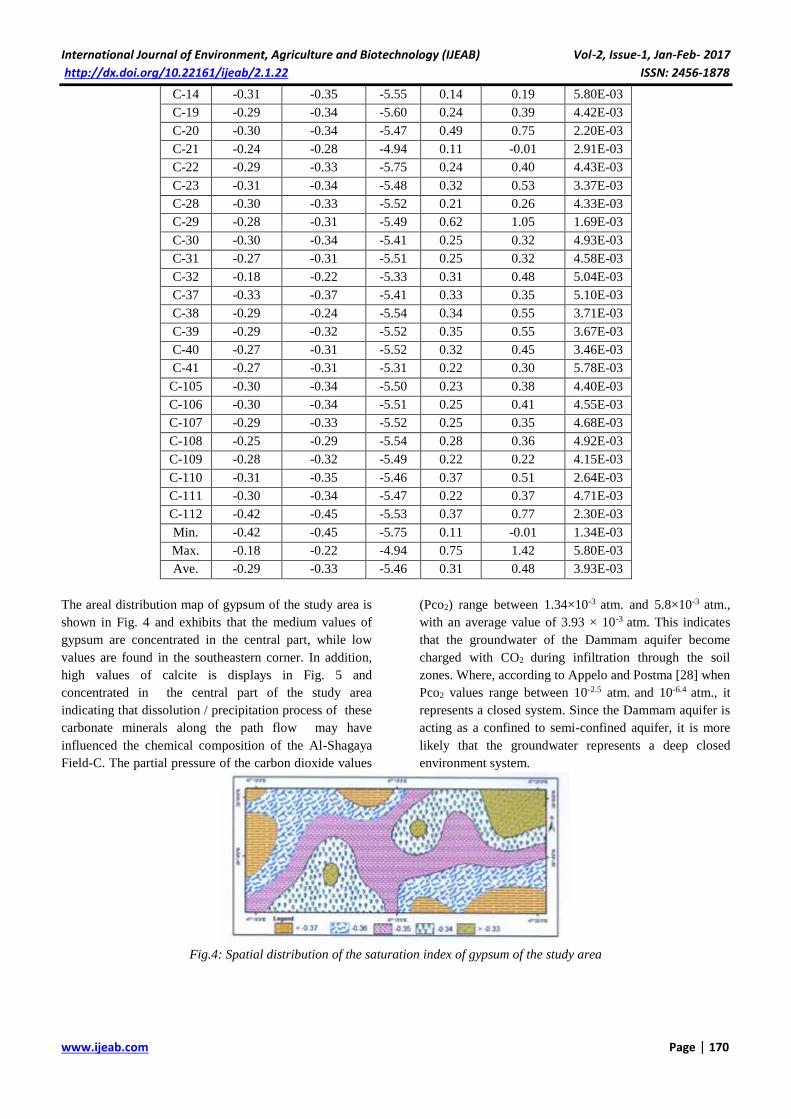
The areal distribution map of gypsum of the study area is
shown in Fig. 4 and exhibits that the medium values of
gypsum are concentrated in the central part, while low
values are found in the southeastern corner. In addition,
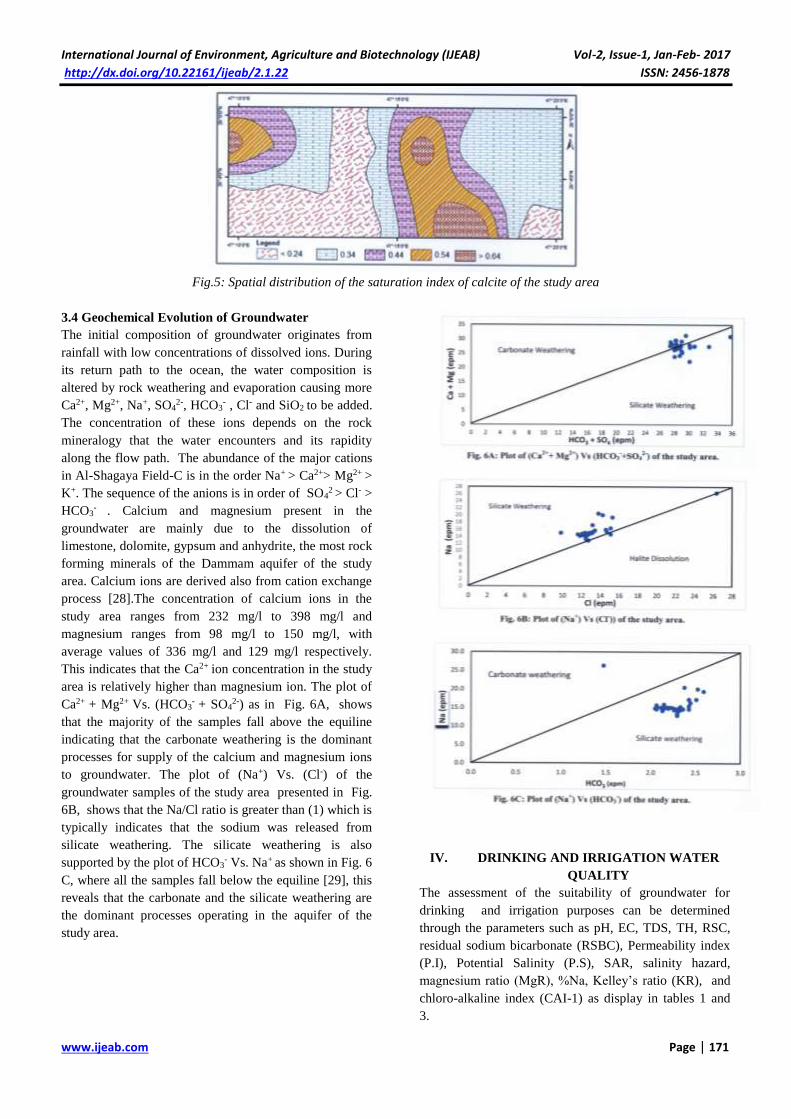
high values of calcite is displays in Fig. 5 and
concentrated in the central part of the study area
indicating that dissolution / precipitation process of these
carbonate minerals along the path flow may have
influenced the chemical composition of the Al-Shagaya
Field-C. The partial pressure of the carbon dioxide values
(Pco2) range between 1.34×10⁻³ atm. and 5.8×10⁻³ atm.,
with an average value of 3.93 × 10⁻³ atm. This indicates
that the groundwater of the Dammam aquifer become
charged with CO2 during infiltration through the soil
zones. Where, according to Appelo and Postma [28] when
Pco2 values range between 10-2.5 atm. and 10-6.4 atm., it
represents a closed system. Since the Dammam aquifer is
acting as a confined to semi-confined aquifer, it is more
likely that the groundwater represents a deep closed
environment system.
Fig.4: Spatial distribution of the saturation index of gypsum of the study area
International Journal of Environment, Agriculture and Biotechnology (IJEAB) Vol-2, Issue-1, Jan-Feb- 2017
http://dx.doi.org/10.22161/ijeab/2.1.22 ISSN: 2456-1878
www.ijeab.com Page | 171
Fig.5: Spatial distribution of the saturation index of calcite of the study area
3.4 Geochemical Evolution of Groundwater
The initial composition of groundwater originates from
rainfall with low concentrations of dissolved ions. During
its return path to the ocean, the water composition is
altered by rock weathering and evaporation causing more
Ca2+, Mg2+, Na+, SO42-, HCO3
- , Cl- and SiO2 to be added.
The concentration of these ions depends on the rock
mineralogy that the water encounters and its rapidity
along the flow path. The abundance of the major cations
in Al-Shagaya Field-C is in the order Na+ > Ca2+> Mg2+ >
K+. The sequence of the anions is in order of SO42 > Cl- >
HCO3- . Calcium and magnesium present in the
groundwater are mainly due to the dissolution of
limestone, dolomite, gypsum and anhydrite, the most rock
forming minerals of the Dammam aquifer of the study
area. Calcium ions are derived also from cation exchange
process [28].The concentration of calcium ions in the
study area ranges from 232 mg/l to 398 mg/l and
magnesium ranges from 98 mg/l to 150 mg/l, with
average values of 336 mg/l and 129 mg/l respectively.
This indicates that the Ca2+ ion concentration in the study
area is relatively higher than magnesium ion. The plot of
Ca2+ + Mg2+ Vs. (HCO3- + SO4
2-) as in Fig. 6A, shows
that the majority of the samples fall above the equiline
indicating that the carbonate weathering is the dominant
processes for supply of the calcium and magnesium ions
to groundwater. The plot of (Na+) Vs. (Cl-) of the
groundwater samples of the study area presented in Fig.
6B, shows that the Na/Cl ratio is greater than (1) which is
typically indicates that the sodium was released from
silicate weathering. The silicate weathering is also
supported by the plot of HCO3- Vs. Na+ as shown in Fig. 6
C, where all the samples fall below the equiline [29], this
reveals that the carbonate and the silicate weathering are
the dominant processes operating in the aquifer of the
study area.
IV. DRINKING AND IRRIGATION WATER
QUALITY
The assessment of the suitability of groundwater for
drinking and irrigation purposes can be determined
through the parameters such as pH, EC, TDS, TH, RSC,
residual sodium bicarbonate (RSBC), Permeability index
(P.I), Potential Salinity (P.S), SAR, salinity hazard,
magnesium ratio (MgR), %Na, Kelley’s ratio (KR), and
chloro-alkaline index (CAI-1) as display in tables 1 and
3.
International Journal of Environment, Agriculture and Biotechnology (IJEAB) Vol-2, Issue-1, Jan-Feb- 2017
http://dx.doi.org/10.22161/ijeab/2.1.22 ISSN: 2456-1878
www.ijeab.com Page | 172
Table.3: Irrigation water quality parameters for Al-Shagaya Field – C.
Well No. RSC RSBC P.I P.S SAR MgR % Na Kelly's
ratio CAI-1
C-1 -24.10 -14.80 40.88 26.41 4.33 35.53 37.17 0.60 -0.19
C-2 -24.50 -13.97 40.78 27.72 4.35 39.51 37.08 0.60 -0.11
C-3 -25.51 -14.40 37.99 27.77 3.92 40.28 34.36 0.53 0.02
C-4 -25.02 -14.49 45.96 27.98 5.52 38.43 42.46 0.75 -0.50
C-10 -24.86 -14.99 39.20 25.67 4.08 36.44 35.39 0.55 -0.24
C-11 -25.15 -14.04 39.52 27.65 4.16 40.28 35.65 0.56 -0.07
C-12 -26.76 -14.42 39.27 28.38 4.27 42.25 35.60 0.56 -0.10
C-13 -25.94 -14.17 35.62 25.15 3.53 41.67 31.75 0.47 -0.09
C-14 -25.94 -14.17 34.94 25.70 3.42 41.67 31.04 0.45 -0.03
C-19 -27.36 -15.02 37.00 22.80 3.90 41.75 33.46 0.51 -0.56
C-20 -22.00 -13.94 42.07 26.46 4.32 33.34 38.00 0.62 -0.16
C-21 -26.44 -14.43 37.68 28.97 3.92 40.95 33.61 0.51 0.02
C-22 -27.36 -15.02 36.69 25.08 3.85 41.75 33.12 0.50 -0.25
C-23 -26.86 -15.10 37.42 25.51 3.94 40.59 33.89 0.52 -0.19
C-28 -24.61 -14.74 38.16 25.37 3.87 36.92 34.33 0.53 -0.17
C-29 -25.34 -15.47 38.45 26.20 3.99 35.91 34.73 0.54 -0.17
C-30 -23.34 -14.04 43.64 26.46 4.79 36.08 39.70 0.67 -0.33
C-31 -25.22 -15.35 37.90 25.92 3.87 35.91 34.05 0.52 -0.16
C-32 -28.44 -17.34 42.37 30.85 5.09 35.86 38.93 0.65 -0.43
C-37 -22.73 -12.86 44.24 26.46 4.84 39.11 40.21 0.68 -0.33
C-38 -25.08 -14.56 37.70 25.13 3.82 38.43 33.79 0.52 -0.22
C-39 -25.45 -14.92 37.70 25.67 3.85 37.95 33.85 0.52 -0.18
C-40 -24.73 -14.86 38.67 25.99 3.96 36.44 34.72 0.54 -0.23
C-41 -24.81 -14.28 44.85 30.38 5.23 38.43 41.07 0.71 -0.29
C-105 -27.36 -15.02 37.06 25.34 3.92 41.75 33.52 0.51 -0.24
C-106 -27.29 -14.95 36.74 25.37 3.85 41.75 33.12 0.50 -0.22
C-107 -25.08 -14.56 38.66 25.39 4.00 38.43 34.81 0.54 -0.25
C-108 -25.06 -15.19 38.35 25.81 3.93 35.91 34.40 0.53 -0.28
C-109 -24.86 -15.57 38.90 25.90 4.03 34.54 35.21 0.55 -0.17
C-110 -21.71 -13.65 42.72 26.16 4.42 33.90 38.73 0.64 -0.18
C-111 -25.55 -13.79 38.86 27.06 4.08 42.19 35.07 0.55 -0.18
C-112 -19.78 -9.25 43.55 25.99 4.32 47.63 39.04 0.65 -0.21
Min. -28.44 -17.34 34.94 22.80 3.42 33.34 31.04 0.45 -0.56
Max. -19.78 -9.25 45.96 30.85 5.52 47.63 42.46 0.75 0.02
Ave. -25.13 -14.48 39.49 26.46 4.17 38.80 35.68 0.56 -0.21
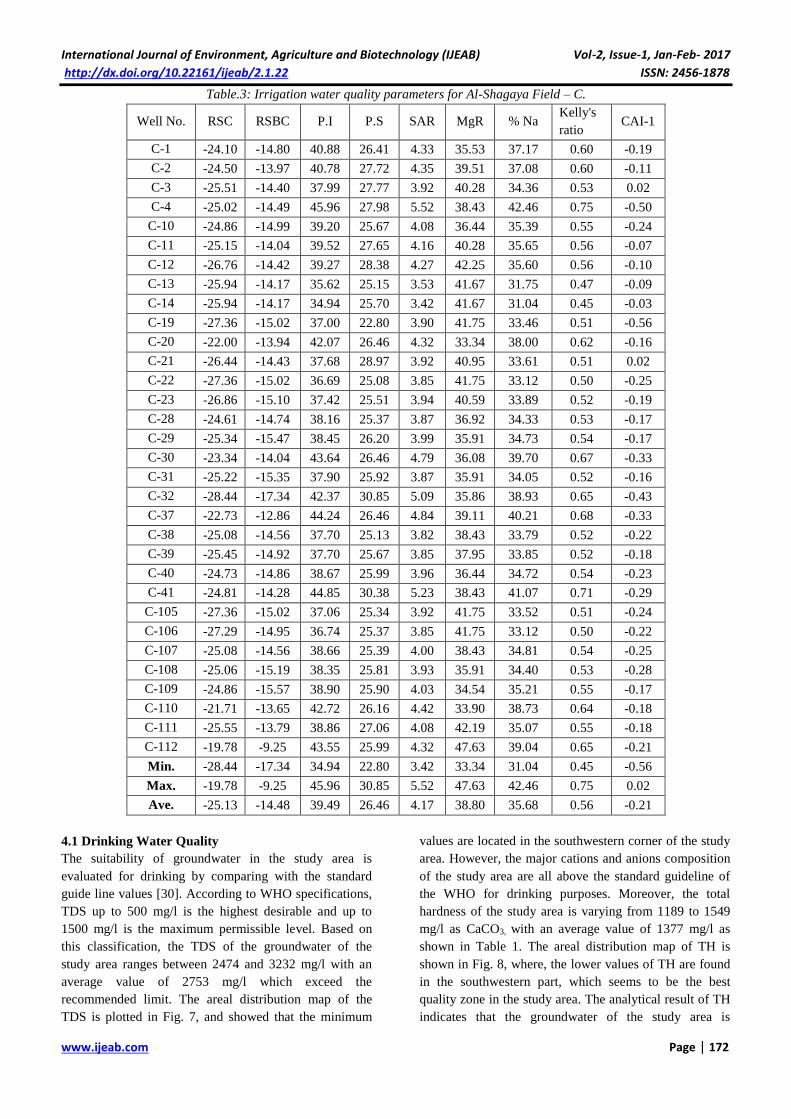
4.1 Drinking Water Quality
The suitability of groundwater in the study area is
evaluated for drinking by comparing with the standard
guide line values [30]. According to WHO specifications,
TDS up to 500 mg/l is the highest desirable and up to
1500 mg/l is the maximum permissible level. Based on
this classification, the TDS of the groundwater of the
study area ranges between 2474 and 3232 mg/l with an
average value of 2753 mg/l which exceed the
recommended limit. The areal distribution map of the
TDS is plotted in Fig. 7, and showed that the minimum
values are located in the southwestern corner of the study
area. However, the major cations and anions composition
of the study area are all above the standard guideline of
the WHO for drinking purposes. Moreover, the total
hardness of the study area is varying from 1189 to 1549
mg/l as CaCO3, with an average value of 1377 mg/l as
shown in Table 1. The areal distribution map of TH is
shown in Fig. 8, where, the lower values of TH are found
in the southwestern part, which seems to be the best
quality zone in the study area. The analytical result of TH
indicates that the groundwater of the study area is
International Journal of Environment, Agriculture and Biotechnology (IJEAB) Vol-2, Issue-1, Jan-Feb- 2017
http://dx.doi.org/10.22161/ijeab/2.1.22 ISSN: 2456-1878
www.ijeab.com Page | 173
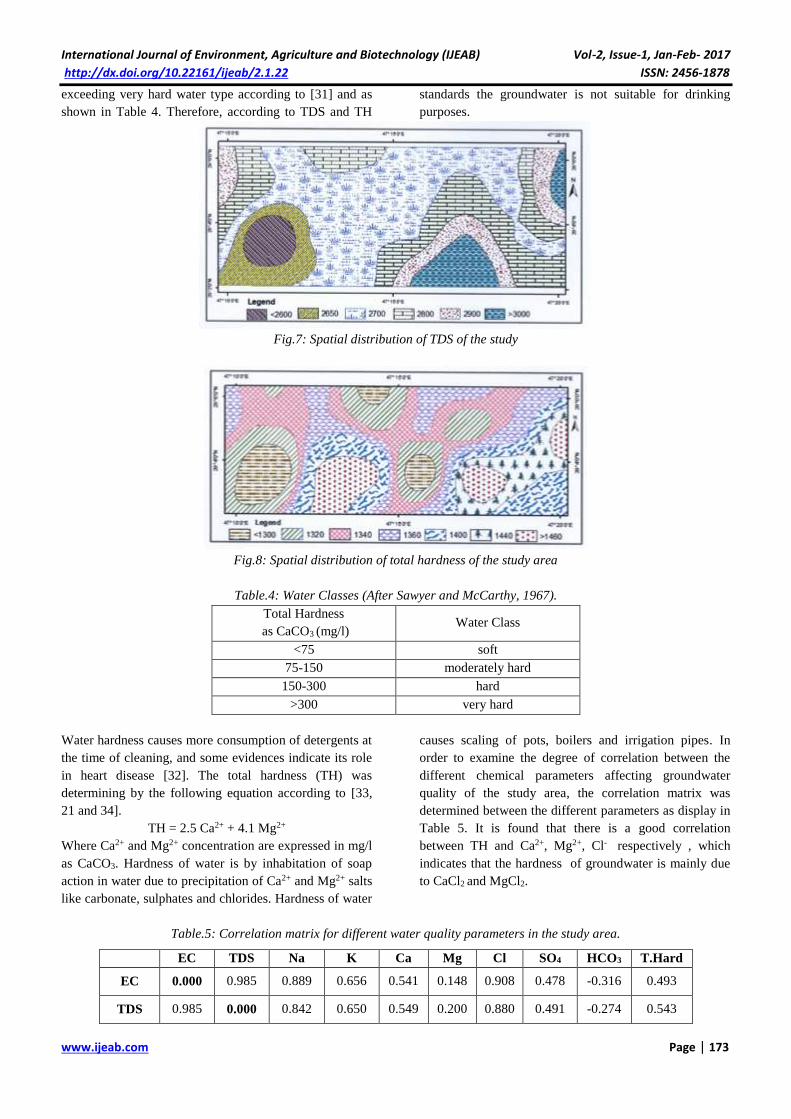
exceeding very hard water type according to [31] and as
shown in Table 4. Therefore, according to TDS and TH
standards the groundwater is not suitable for drinking
purposes.
Fig.7: Spatial distribution of TDS of the study
Fig.8: Spatial distribution of total hardness of the study area
Table.4: Water Classes (After Sawyer and McCarthy, 1967).
Total Hardness
as CaCO3 (mg/l)
Water Class
<75 soft
75-150 moderately hard
150-300 hard
>300 very hard
Water hardness causes more consumption of detergents at
the time of cleaning, and some evidences indicate its role
in heart disease [32]. The total hardness (TH) was
determining by the following equation according to [33,
21 and 34].
TH = 2.5 Ca2+ + 4.1 Mg2+
Where Ca2+ and Mg2+ concentration are expressed in mg/l
as CaCO3. Hardness of water is by inhabitation of soap
action in water due to precipitation of Ca2+ and Mg2+ salts
like carbonate, sulphates and chlorides. Hardness of water
causes scaling of pots, boilers and irrigation pipes. In
order to examine the degree of correlation between the
different chemical parameters affecting groundwater
quality of the study area, the correlation matrix was
determined between the different parameters as display in
Table 5. It is found that there is a good correlation
between TH and Ca2+, Mg2+, Cl- respectively , which
indicates that the hardness of groundwater is mainly due
to CaCl2 and MgCl2.
Table.5: Correlation matrix for different water quality parameters in the study area.
EC TDS Na K Ca Mg Cl SO4 HCO3 T.Hard
EC 0.000 0.985 0.889 0.656 0.541 0.148 0.908 0.478 -0.316 0.493
TDS 0.985 0.000 0.842 0.650 0.549 0.200 0.880 0.491 -0.274 0.543
International Journal of Environment, Agriculture and Biotechnology (IJEAB) Vol-2, Issue-1, Jan-Feb- 2017
http://dx.doi.org/10.22161/ijeab/2.1.22 ISSN: 2456-1878
www.ijeab.com Page | 174
4.2 Irrigation Water Quality
The suitability of groundwater for irrigation is depending
on the effect of mineral composition of water on the soil
and plants. The effect of the salt on soils causes change in
soil structure, permeability, and hence, it effects on plant
growth.
4.2.1 Residual Sodium Carbonate
Residual sodium carbonate (RSC) has been calculated to
determine the hazards effects of carbonate and
bicarbonate on quality of water for irrigation and is
expressed by the equation:
RSC = (HCO-3 + CO3
2-) – (Ca2+ + Mg2+)
Whereas, all ionic concentrations are expressed in meq/l.
The classification of irrigation water according to the
RSC presents in Table 6 after [35] , where water
containing more than 2.5 meq/l of RSC are not suitable
for irrigation, while those having < 1.25 meq/l is good for
irrigation [36].
Table.6: Water classes based on RSC (after Richards,
1954).
RSC value Water quality
<1.25 suitable
1.25-2.5 marginal
>2.5 not suitable
Eaton (1950) indicated that if waters which are used for
irrigation contain excess of HCO3- + CO3
2- than its
equivalent Ca2+ + Mg2+, there will be a residue of Na+ +
HCO3- when evaporation takes place and the pH of the
soil increase up to 3 [37]. When total carbonate levels
exceed the total amount of calcium and magnesium the
water quality diminished [38]. The calculated RSC values
of the groundwater samples of the study area are ranged
from -28.44 to -19.78 meq/l with an average value of -
25.2 meq/l. Negative RSC indicates that sodium buildup
is unlikely, since sufficient calcium and magnesium are in
excess of what can be precipitated as carbonates [39].
Hence, the groundwater of the study area is safe for
irrigation, and the minimum values of RSC are
distributed in the southeastern as well as central part of
the study area as displayed in Fig. 9.
Fig.9: Spatial distribution of RSC of the study area
Na 0.889 0.842 0.000 0.726 0.507 -0.067 0.821 0.569 -0.273 0.304
K 0.656 0.650 0.726 0.000 0.503 -0.115 0.486 0.847 0.089 0.316
Ca 0.541 0.549 0.507 0.503 0.000 0.102 0.467 0.305 -0.340 0.583
Mg 0.148 0.200 -0.067 -0.115 0.102 0.000 -
0.052 -0.057 0.138 0.778
Cl 0.908 0.880 0.821 0.486 0.467 -0.052 0.000 0.242 -0.565 0.273
SO4 0.478 0.491 0.569 0.847 0.305 -0.057 0.242 0.000 0.354 0.255
HCO3 -0.316 -0.274 -0.273 0.089 -0.340 0.138 -
0.565 0.354 0.000 -0.129
T.Hard 0.493 0.543 0.304 0.316 0.583 0.778 0.273 0.255 -0.129 0.000
International Journal of Environment, Agriculture and Biotechnology (IJEAB) Vol-2, Issue-1, Jan-Feb- 2017
http://dx.doi.org/10.22161/ijeab/2.1.22 ISSN: 2456-1878
www.ijeab.com Page | 175
4.2.2 Residual Sodium Bicarbonate (RSBC)
Residual sodium bicarbonate (RSBC) is calculated by the
following formulae according to [40]:
RSBC = HCO3- - Ca2+
It was found that the groundwater is considered
satisfactory with <5 meq/l for irrigation, according to the
criteria set by [40] and [41]. In the study area, the values
of the RSBC ranges between -17.34 and -9.25 meq/l
with an average value of -14.48 meq/l, which indicate
that groundwater is good for irrigation.
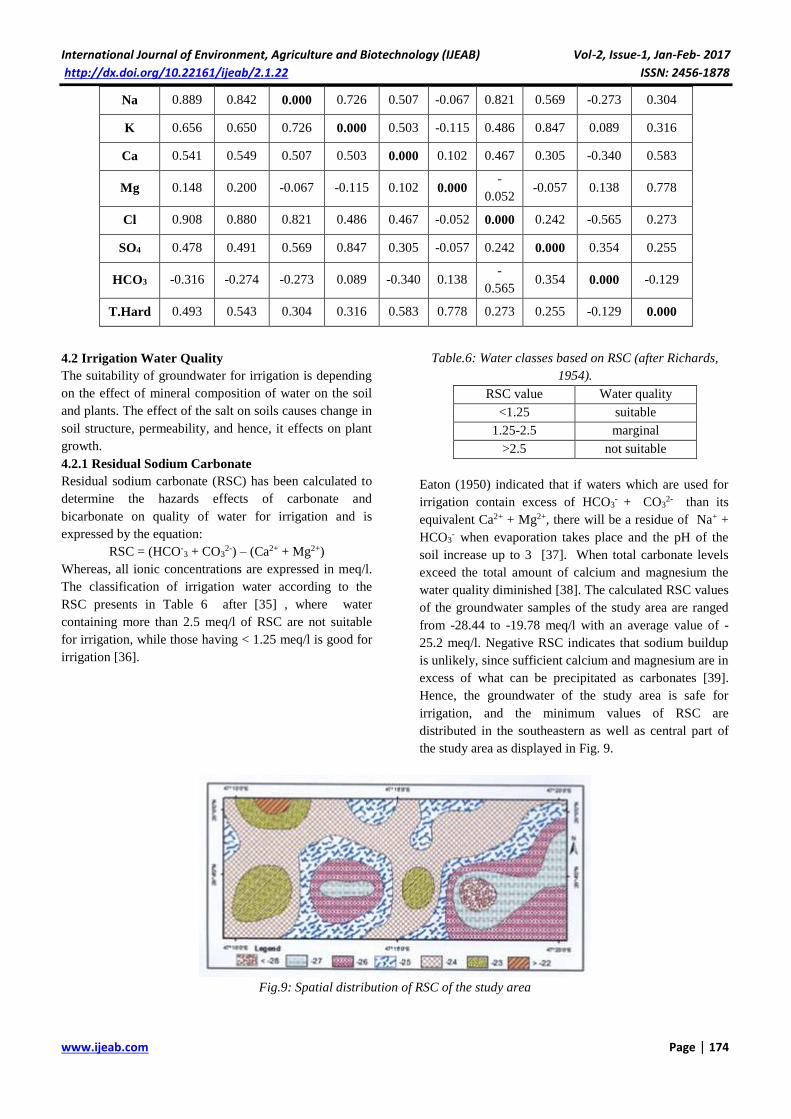
4.2.3 Permeability Index (P.I)
The permeability of soil is affected by long-term use of
irrigation water and is influenced by sodium, calcium,
magnesium and bicarbonate contents in soil. Doneen
(1964) set a criteria for assessing the suitability of water
for irrigation based on permeability index (P.I),
accordingly, waters can be classified as Class I, Class II
and Class III. The Class I and Class II waters are
categories as good for irrigation with 50-75% or more of
maximum permeability. Whereas, Class III water is
unsuitable with of 25% maximum permeability.
Therefore, soil permeability is affected by consistent use
of irrigation water which increases the presence of
sodium, calcium, magnesium and bicarbonate in the soil
[42].
The permeability index is used to measure the suitability
of water for irrigation purpose when compared with the
total ions in meq/l, it’s expressed as follow:
PI =Na+ + √HCO3
−
Ca2++Mg2++Na+ ∗ 100
In the present study, the P.I of the groundwater samples
ranged from 34.94% to 45.96 % with a mean value of 39.49
%, and it’s observed that all the groundwater samples fall in
class II category of Doneen Chart (Fig.10). Therefore, the
groundwater of the study area is good for use in irrigation.
Fig.10: Showing Doneen’s Chart of Permeability Index (after Doneen, 1964)
4.2.4 Potential Salinity (P.S)
Doneen, 1961 introduced an important parameter
“Potential Salinity” for assessing the suitability of water
for irrigation uses, which defined as chloride
concentration plus half of the sulphate concentration
expressed in meq/l.
Potential Salinity = Cl- + ½ SO42-
On the basis of the potential salinity Doneen (1961)
subdivided the irrigation water into three classes as
presented in Table 7. The potential salinity of the majority
of the analyzed groundwater samples of the study area
ranges between 22.8 meq/l and 30.85 meq/l with an
average value of 26.46 meq/l indicates high values of
potential salinity. However, it is found that the
classification of the groundwater of the study area for
irrigation purposes fall in Class III, therefore, the
groundwater should be used in case of a soil of high
permeability [43].
Table.7: Classification of irrigation water based on
potential salinity.
Class of water
Soil
Characteristics
Class
I
Class
II
Class
III
Soil of low
Permeability <3 3-5 >5
Soil of medium
Permeability <5 5-10 >10
Soil of high
Permeability <7 7-15 >15
International Journal of Environment, Agriculture and Biotechnology (IJEAB) Vol-2, Issue-1, Jan-Feb- 2017
http://dx.doi.org/10.22161/ijeab/2.1.22 ISSN: 2456-1878
www.ijeab.com Page | 176
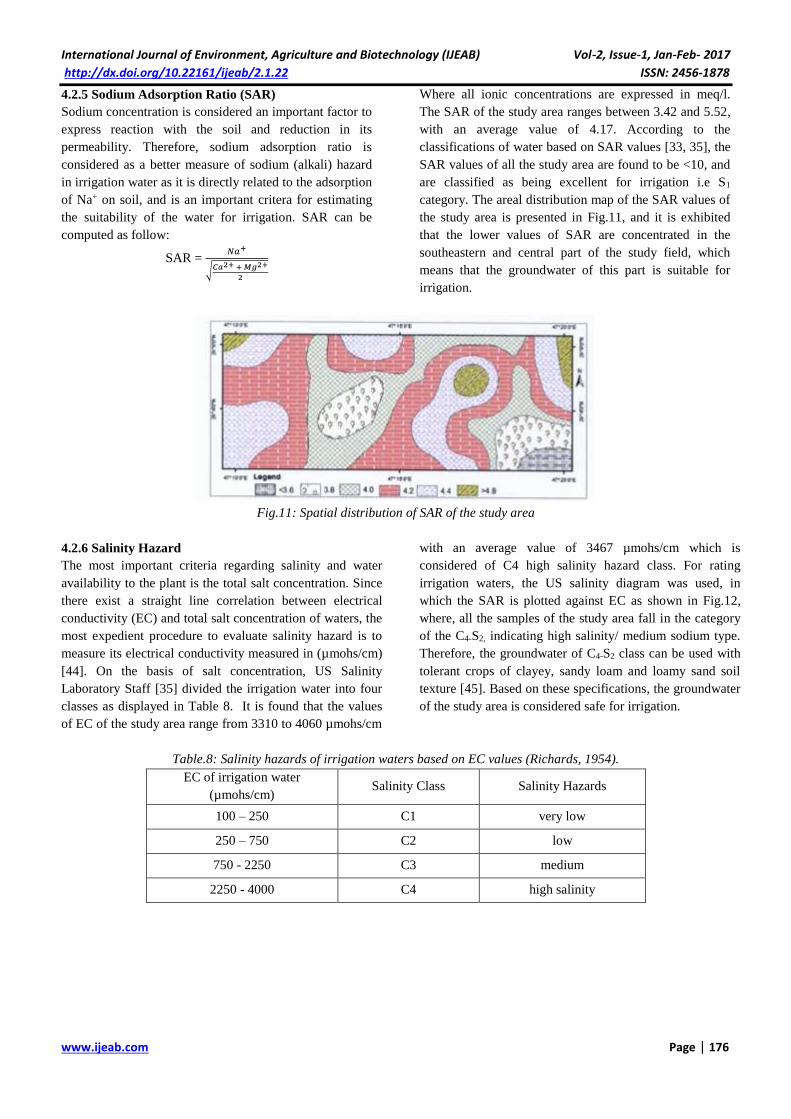
4.2.5 Sodium Adsorption Ratio (SAR)
Sodium concentration is considered an important factor to
express reaction with the soil and reduction in its
permeability. Therefore, sodium adsorption ratio is
considered as a better measure of sodium (alkali) hazard
in irrigation water as it is directly related to the adsorption
of Na+ on soil, and is an important critera for estimating
the suitability of the water for irrigation. SAR can be
computed as follow:
SAR = 𝑁𝑎+
√𝐶𝑎2+ + 𝑀𝑔2+
2
Where all ionic concentrations are expressed in meq/l.
The SAR of the study area ranges between 3.42 and 5.52,
with an average value of 4.17. According to the
classifications of water based on SAR values [33, 35], the
SAR values of all the study area are found to be <10, and
are classified as being excellent for irrigation i.e S1
category. The areal distribution map of the SAR values of
the study area is presented in Fig.11, and it is exhibited
that the lower values of SAR are concentrated in the
southeastern and central part of the study field, which
means that the groundwater of this part is suitable for
irrigation.
Fig.11: Spatial distribution of SAR of the study area
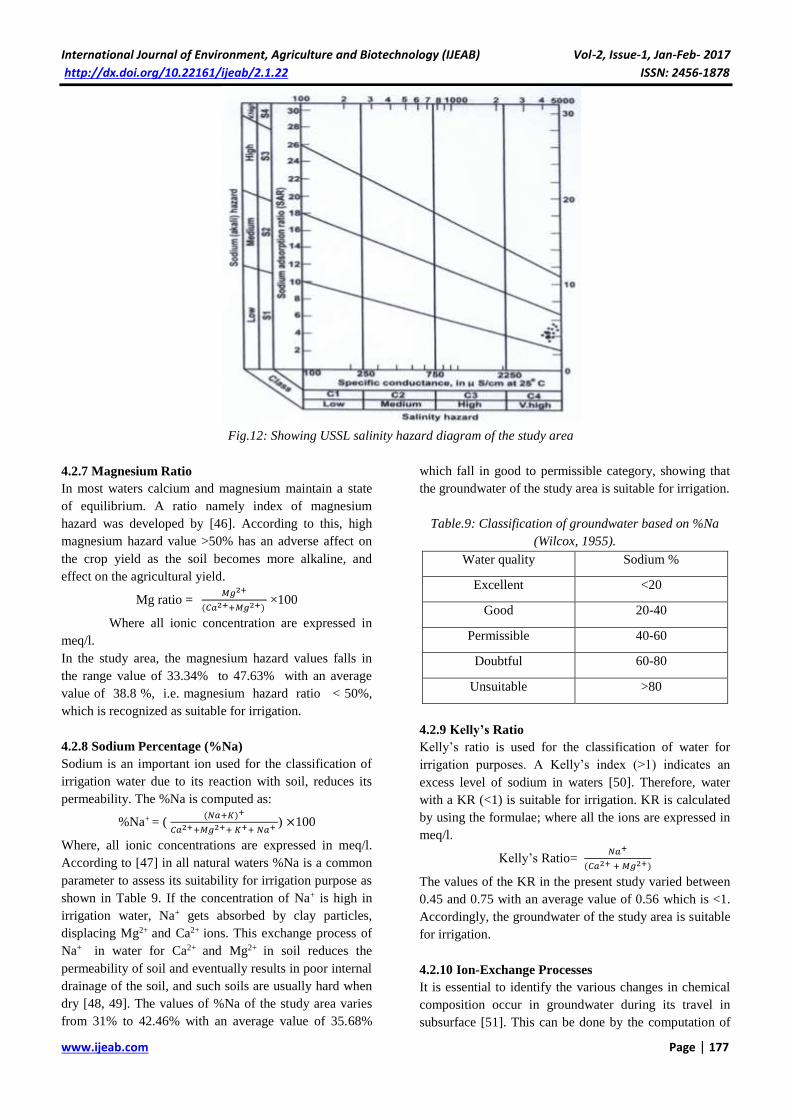
4.2.6 Salinity Hazard
The most important criteria regarding salinity and water
availability to the plant is the total salt concentration. Since
there exist a straight line correlation between electrical
conductivity (EC) and total salt concentration of waters, the
most expedient procedure to evaluate salinity hazard is to
measure its electrical conductivity measured in (µmohs/cm)
[44]. On the basis of salt concentration, US Salinity
Laboratory Staff [35] divided the irrigation water into four
classes as displayed in Table 8. It is found that the values
of EC of the study area range from 3310 to 4060 µmohs/cm
with an average value of 3467 µmohs/cm which is
considered of C4 high salinity hazard class. For rating
irrigation waters, the US salinity diagram was used, in
which the SAR is plotted against EC as shown in Fig.12,
where, all the samples of the study area fall in the category
of the C4-S2, indicating high salinity/ medium sodium type.
Therefore, the groundwater of C4-S2 class can be used with
tolerant crops of clayey, sandy loam and loamy sand soil
texture [45]. Based on these specifications, the groundwater
of the study area is considered safe for irrigation.
Table.8: Salinity hazards of irrigation waters based on EC values (Richards, 1954).
EC of irrigation water
(µmohs/cm) Salinity Class Salinity Hazards
100 – 250 C1 very low
250 – 750 C2 low
750 - 2250 C3 medium
2250 - 4000 C4 high salinity
International Journal of Environment, Agriculture and Biotechnology (IJEAB) Vol-2, Issue-1, Jan-Feb- 2017
http://dx.doi.org/10.22161/ijeab/2.1.22 ISSN: 2456-1878
www.ijeab.com Page | 177
Fig.12: Showing USSL salinity hazard diagram of the study area
4.2.7 Magnesium Ratio
In most waters calcium and magnesium maintain a state
of equilibrium. A ratio namely index of magnesium
hazard was developed by [46]. According to this, high
magnesium hazard value >50% has an adverse affect on
the crop yield as the soil becomes more alkaline, and
effect on the agricultural yield.
Mg ratio = 𝑀𝑔2+
(𝐶𝑎2++𝑀𝑔2+) ×100
Where all ionic concentration are expressed in
meq/l.
In the study area, the magnesium hazard values falls in
the range value of 33.34% to 47.63% with an average
value of 38.8 %, i.e. magnesium hazard ratio < 50%,
which is recognized as suitable for irrigation.
4.2.8 Sodium Percentage (%Na)
Sodium is an important ion used for the classification of
irrigation water due to its reaction with soil, reduces its
permeability. The %Na is computed as:
%Na+ = ( (𝑁𝑎+𝐾)+
𝐶𝑎2++𝑀𝑔2++ 𝐾++ 𝑁𝑎+ ) ×100
Where, all ionic concentrations are expressed in meq/l.
According to [47] in all natural waters %Na is a common
parameter to assess its suitability for irrigation purpose as
shown in Table 9. If the concentration of Na+ is high in
irrigation water, Na+ gets absorbed by clay particles,
displacing Mg2+ and Ca2+ ions. This exchange process of
Na+ in water for Ca2+ and Mg2+ in soil reduces the
permeability of soil and eventually results in poor internal
drainage of the soil, and such soils are usually hard when
dry [48, 49]. The values of %Na of the study area varies
from 31% to 42.46% with an average value of 35.68%
which fall in good to permissible category, showing that
the groundwater of the study area is suitable for irrigation.
Table.9: Classification of groundwater based on %Na
(Wilcox, 1955).
Water quality Sodium %
Excellent <20
Good 20-40
Permissible 40-60
Doubtful 60-80
Unsuitable >80
4.2.9 Kelly’s Ratio
Kelly’s ratio is used for the classification of water for
irrigation purposes. A Kelly’s index (>1) indicates an
excess level of sodium in waters [50]. Therefore, water
with a KR (<1) is suitable for irrigation. KR is calculated
by using the formulae; where all the ions are expressed in
meq/l.
Kelly’s Ratio= 𝑁𝑎+
(𝐶𝑎2+ + 𝑀𝑔2+)
The values of the KR in the present study varied between
0.45 and 0.75 with an average value of 0.56 which is <1.
Accordingly, the groundwater of the study area is suitable
for irrigation.
4.2.10 Ion-Exchange Processes
It is essential to identify the various changes in chemical
composition occur in groundwater during its travel in
subsurface [51]. This can be done by the computation of
International Journal of Environment, Agriculture and Biotechnology (IJEAB) Vol-2, Issue-1, Jan-Feb- 2017
http://dx.doi.org/10.22161/ijeab/2.1.22 ISSN: 2456-1878
www.ijeab.com Page | 178
the chloro-alkaline index -1 which is suggested by [52] to
indicate ion exchange between the groundwater and its
host environment during residence or travel. The value of
the index CAI-1, can be positive or negative. If the value
is positive then it explains that the exchange of Na+ and
K+ ions are from water with Mg2+ and Ca2+ ions of the
rocks. And if the index is negative, then it means that
there is an exchange Mg2+ and Ca2+ of water with Na+ and
K+ ions from rocks, so the exchange is in indirect base
indicating chloro-alkaline disequilibrium. The chloro-
alkaline index-1 is calculated using the following
formulae:
Chloro-alkaline index = 𝐶𝑙−− (𝑁𝑎++ 𝐾+)
𝐶𝑙−
Whereas, all ionic concentrations are expressed in meq/l.
The chloro-alkaline index -1 is calculated for the
groundwater samples of the study area and it has been
found that CAI-1 values all are negative, and range from -
0.56 to -0.21,with an average value of -0.21 indicating
that all the groundwater samples have indirect base-
exchange reaction.
V. CONCLUSION
The interpretation of the hydrochemical analysis of Field-
C reveals that the groundwater is brackish and exceeding
very hard. The sequence of the major ions is in the
following order: Na+ > Ca2+> Mg2+ > K+ and SO42-
> Cl- >
HCO-3. Alkali earth exceeds alkalis and strong acids
exceed weak acids. The dominated hydrochemical facies
of groundwater is Ca-Cl and Ca-Mg-Cl genetic water
types. The determination of the saturated index indicated
that all groundwater samples of the study area were
under-saturated with respect to the sulphate minerals, and
oversaturated with respect to carbonate minerals. Gibb’s
plot revealed that the chemical weathering of rock-
forming minerals is the dominant process, where there is
an interaction between rock chemistry and percolating
waters in the subsurface. The irrigation parameters reveal
that the groundwater is good and suitable for irrigation
and concentrated along the southwestern and central parts
of the study area. Meanwhile, the major ions
compositions in groundwater indicate that the water is not
suitable for drinking purpose.
ACKNOWLEDGMENTS
The authors would like to thank the Ministry of
Electricity and Water for providing the chemical analyses
of the Al-Shagaya Field-C. In addition, authors are highly
appreciated to the distinguished reviewers for their
insightful suggestions and comments.
REFERENCES
[1] Al-Ruwaih, F.M. (2001). Hydrochemical investigation on
the clastic and carbonate aquifers, Kuwait Bulletin of
Engineering Geology and the Environment. vol. 60, 4,
310 –314.
[2] Kumari, B. V., Murthy, Y. L. N., & Machiraju, P. V.
S, (2015). Quality Evaluation of soil in Coringa
Mangroves region in East Godarari District for
Assessement of its Quality for Application.
International Journal.of Engineering and Technical
Research. ISSN:2321-0869, vol. 3, Issue–5, 461-
468.
[3] Chemura, A., Kutywayo, D., Chagwesha, T.M., &
Chidoko, P. (2014). An assessment of irrigation water
quality and selected parameters at Mutema irrigation
scheme, Zimbabwe. Journal of water Resources and
protection. vol. 6, 130 – 140.
[4] Yidana, M.S., Sakyi, P.A., & Starmp, G. (2011).
Analysis of the salinity suitability of surface water
for irrigation purposes: The Southwest and Coastal
River System in Ghana. Journal of Water Resources
and Protection. vol.3, no. 1, 695 – 710.
[5] Aza-Gnandji, CD R., Xu, Y., Raitt, L., & Levy, J.
(2013). Salinity of irrigation water in Phillippi
farming area of the Cape Flats, Cape Town, South
Africa. Water of South Africa, Vol. 39, no. 2, 199 –
209.
[6] Dastorani, M.T., Heshmati, M., & Sadeghzadeh,
M.A. (2010). Evaluation of the efficiency of surface
and subsurface irrigation in dryland environments.
Irrigation and Drainage. 559, 129 – 137.
[7] Al-Enezi, A. H. (2015). Groundwater quality and its
effect on soil in Abdalli area in the state of Kuwait.
Kingdom of Bahrain. Arabian Gulf University.
College of Graduate Studies M.sc. Thesis, 75pp.
[8] Ramesh, k., & Elango, L. ( 2012). Groundwater
quality and suitability for domestic and agriculture
use in Tondiar river basin, Tamil Nadu, India.
Environmental Monitoring Assessement. 184, 3887
– 3899.
[9] Lakshmi, J. K., Machiraju, P.V.S., & UdayaBhaskar,
P. (2014). Physicochemical and microbial
characterization of subsurface waters near a non
point source for assessment of quality for end use
applications. International Journal of Current
Chemical sciences. vol. 3, Issue 1, 4 – 11.
[10] Narany, T. S., Ramli, M. F., Aris, A. Z., Sulaiman,
W. N. Z., & Fakharian, K. (2012). Assessment of
groundwater quality for irrigation purpose in Amol
Plaine, Iran. 6th Internatioal symposium on
Advances in Science and Technology, Malaysia,
Kuala Lumpur, 21 – 25 March.
[11] Rama Rao, D., Satyanarayana, T., & Machiraju, P.
V. S. (2012). Assessment of groundwater quality for
application in KaKinada coast. Pelagia Research
Library. Der Chemica Sinica. vol. 3, 1, 287-291.
International Journal of Environment, Agriculture and Biotechnology (IJEAB) Vol-2, Issue-1, Jan-Feb- 2017
http://dx.doi.org/10.22161/ijeab/2.1.22 ISSN: 2456-1878
www.ijeab.com Page | 179
[12] Fuchs, W., Gattinger, T.E., & Holzer, H.F. (1968).
Explanatory text to the synoptic geologic map of
Kuwait. A surface geology of Kuwait and the
Neutral zone. Geological Survey of Austria, Vienn,
87 pp.
[13] Omar, S.S., Al-Yaqubi, A., & Senay, Y. (1981).
Stratigraphy of the Kuwait-Basrah area. In: Hibitat
of Oil. American Association of Petroleum Geology
Bulletin. 22,1252-1278.
[14] Al-Sulaimi, J.S., & Al-Ruwaih, F.M. (2005).
Geology and natural resources of Kuwait. Academic
Publication Council, Kuwait University, 501 pp.
[15] Al-Ruwaih, F.M., & Ben-Essa, S.A. (2004).
Hygrogeological and hydrochemical study of the Al-
Shagaya Field-F, Kuwait. Bulletin of Engineering
Geology and Environment. 63,57-70.
[16] Al-Ruwaih, F.M., Talebi, L., & Hadi, K.M. (2005).
Major geological processes in the evolution of
Eocene carbonate aquifer, Kuwait. Kuwait Journal
of Science and Engineering. 32, 1,119-144.
[17] Al-Ruwaih, F.M., Al-Hmoud, J. M., & Al-Dhaferri,
Z.M. (2012). Characterization and evaluation of the
confined limestone aquifer in Kuwait. Journal of the
Gulf and Arabian Peninsula Studies. vol.3, no.146,
17-49.
[18] Fetter, W.C. (2001). Applied hydrogeology. 4th ed.
Prentice-Hall, Inc. 598pp.
[19] Saether, O.M., & De-Caritat, P. (1997).
Geochemical processes, weathering and
groundwater recharge in catchments. Balkema,
Rotterdam. The Netherlands, 400pp.
[20] Hem, J.D. (1991). Study and interpretation of
chemical characteristics of natural Water. (3rd ed).
Book 2254: Scientific publ. Jodhpur, India.
[21] Ball, J.W., & Nordstrom, D.K. (1992). Geochemical
model to calculate speciation of major, trace and
redox elements in natural waters. Report, U.S.
Geological Survey, International Groundwater
Modeling Center, U.S.A.
[22] Piper, A.M. (1953). A graphical procedure in
geochemical interpretation of water analyses. Trans.
Am. Geophys. Union . 25, 914-923.
[23] Doneen, L.D. (1961). The influence of crop and soil
on percolating water. Proceedings of Groundwater
Recharge Conference, California, U.S.A.
[24] Doneen, L.D. (1964). Notes on water quality in
agriculture. In Davis, C.A., Water Science and
Engineering, University of California.
[25] Gibbs, R.T. (1970). Mechanisms controlling world’s
water chemistry. Science, vol., 170, 1088-1090.
[26] Plummer, L.N. (1984). Geochemical modeling: A
comparison of forward and inverse method. In:
Hitchon, B., & Wallick, E.I. (Eds.). Proceeding of
First Canadian Conference of Hydrogeology: Partial
application of groundwater geochemistry. National
Water Well Association, Canada, Worthington, OH,
U.S.A.
[27] Deutsch, W.J. (1997). Groundwater geochemistry:
fundamentals and applications to contamination.
Lewis Publishers, New York, , U.S.A, 221pp.
[28] Appelo, C.A.J., & Postma, D. (2005). Geochemistry,
groundwater and pollution. Balkema, Rotterdam,
The Netherlands, 649pp.
[29] Datta, P.S., & Tyagi, S.K. (1996). Major ion
chemistry of groundwater in Delhi area: chemical
weathering processes and groundwater flow regime.
J. Geol. Soc. India. 47,179-188.
[30] WHO. (2008). Guidelines for drinking-water quality
[Electronic Source]: incorporations, 3rd ed. WHO,
Geneva, 515pp.
[31] Sawyer, G.N., & McCarthy, D.L. (1967). Chemistry
of sanitary engineers, 2nd ed., Mc Grow Hill, New
York, 518pp.
[32] Schroeder, H.A. (1960). Relations between hardness
of water and death rate from certain chronic and
degenerative diseases in the United States, J. Chron.
Disease. 12,586-591.
[33] Todd, D.K., & Mays, L.W. ( 2005). Groundwater
hydrology. John wiley & sons, Inc, 3rd ed., 636 pp.
[34] Raghunath, H.M. (2007). Groundwater. 3rd ed., New
age International Publishers, 504pp.
[35] Richards, L.A. (1954). Diagnosis and improvement
of saline and alkaline soils. US Department of
Agriculture Hand Book, 60pp.
[36] Taqveem, A.K., & Abbasi, A.M. (2013). Synthesis
of parameters used to check the suitability of water
for irrigation purposes. International J. of
Environmental Science, vol.3, no.6 , 2031-2038.
[37] Eaton, E.M. (1950). Significance of carbonate in
irrigation water. Soil Sci. 69, 12-133.
[38] Sundaray, S.K., Nayak, B.B. , & Bhatta, D. (2009).
Environmental studies on river waters quality with
reference to suitability for agricultural purposes:
Mahanadi river esturarine system, India- a case
study, Environmental Monitoring and Assessment,
155, 227-243.
[39] Satyanarayanan, M., Balaram, V., Al Hussin, M. S.,
Al Jemaili, M. A., Rao, T.G., Mathur, R., Dasaram,
B., & Ramesh, S.L. (2007). Assessment of
groundwater quality in structurally deformed
granitic terrain in Hyderabad, India.. Environmental
Monitoring and Assessment, 113, 117-127.
[40] Gupta, S.K. , & Gupta, I.C. (1987). Management of
saline soils and water. Oxford and IBH Publication
Coy, New Delhi, India, 399pp.
International Journal of Environment, Agriculture and Biotechnology (IJEAB) Vol-2, Issue-1, Jan-Feb- 2017
http://dx.doi.org/10.22161/ijeab/2.1.22 ISSN: 2456-1878
www.ijeab.com Page | 180
[41] Oladeji, O.S., Adewoye, A.O., & Adegbola, A.A.
(2012). Suitability assessment of groundwater
resources for irrigation around Otte Village, Kwara
State, Nigeria. Int. J. of Applied Sciences and
Engineering Research, Vol. 1, Issue 3, 434-445.
[42] Chandu, S. N., Subbarao, N.V., & Prakash, S. R.
(1995). Suitability of groundwater for domestic and
irrigation purposes in some part of Jhansi District,
U. P. Bhujal Newa, 10, 1, 12-17.
[43] El-Nakhal, H.A., & Ashour, M.M. (1986). Water
quality of the area west of Karak City, Jordan. Qatar
Univ. Sci. Bull, 6, 273-285.
[44] Chhabra, R. (1996). Soil salinity and water quality.
A.A. Balkema Publishers, U.S.A. 284pp.
[45] Kanwar, J.S., & Kanwar, B.S. (1969). Quality of
irrigation waters. Trans. 9th Intern. Congr. Soil Sci.1,
391-403.
[46] Paliwal, K.V. (1972). Irrigation with saline water.
Monogram No.2 (new series). I A R I, New Delhi,
198pp.
[47] Wilcox, L.V. (1955). Classification and use of
irrigation waters. US Department of Agriculture,
Washington. D.C, 19pp.
[48] Collins, R., & Jenkins, A. (1996). The impact of
agricultural land use on stream chemistry in the
middle hills of the Himalayas, Nepal. J. Hydrology,
185,71-86.
[49] Saleh, A., Al-Ruwaih, F. M., & Shehata, M. (1999).
Hydrogeochemical processes operating within the
main aquifers of Kuwait. J. Arid Environments,
42,195-209.
[50] Kelly, W.P. (1951). Alkali soils- their formation
properties and reclamation. 3rd ed. Reinhold
publication, New York, U.S.A, 92pp.
[51] Al-Ahmdi, M. E. (2013). Hydrochemical
characterization of groundwater in wadi
Sayyah, Western Saudi Arabia . Applied Water
Science. 3, 721-732.
[52] Schoeller, H .(1977). Geochemistry of groundwater.
In groundwater Studies- An international guide for
research and practice (ch. 15, p.p. 1-18 ) .Paris :
UNESCO.