Embed Size (px)
Citation preview
Metrologia 48 (2011) Tech. Suppl. 06018
INTERNATIONAL KEY COMPARISON OF MEASUREMENTS OF NEUTRON SOURCE EMISSION RATE (1999-2005) – CCRI(III)-K9.AmBe
N.J. Roberts1* and L.N. Jones National Physical Laboratory (NPL), Teddington, UK
Z. Wang, Y. Liu, Q. Wang, X. Chen, H. Luo and C. Rong China Institute of Atomic Energy (CIAE), Beijing, PR of China
M. Králik Czech Metrology Institute (CMI), Praha, Czech Republic
H. Park and K.O. Choi Korea Research Institute of Standards and Science (KRISS), Daejeon, Republic of Korea
W.W. Pereira and E.S. da Fonseca National Laboratory of Metrology of Ionizing Radiation (LNMRI), Rio de Janeiro, Brazil
P. Cassette Laboratoire National Henri Becquerel (LNE-LNHB), Paris, France
M.S. Dewey National Institute of Standards and Technology (NIST), Gaithersburg, USA
N.N. Moiseev and I.A. Kharitonov D.I. Mendeleyev Institute for Metrology (VNIIM), St. Petersburg, Russia
ABSTRACT
Section III (neutron measurements) of the Comité Consultatif des Rayonnements Ionisants, CCRI, conducted a key comparison of primary measurements of the neutron emission rate of an 241Am-Be(α,n) radionuclide source. A single 241Am-Be(α,n) source was circulated to all the participants between 1999 and 2005. Eight laboratories participated – the CIAE (China), CMI (Czech Republic), KRISS (Republic of Korea), LNMRI (Brazil), LNE-LNHB (France), NIST (USA), NPL (UK), and the VNIIM (Russian Federation) – with the NPL making their measurements at the start and repeating them near the end of the exercise to verify the stability of the source. Each laboratory reported the emission rate into 4π sr together with a detailed uncertainty budget. All participants used the manganese bath technique, with the VNIIM also making measurements using an associated particle technique. The CMI, KRISS, VNIIM, and later the NPL, also measured the anisotropy of the source although this was not a formal part of the comparison. The first draft report was released in May 2006 and having been discussed and modified by the participants and subsequently reviewed by the CCRI(III), the present paper is now the final report of the comparison.
1 corresponding author: [email protected]
1/35
Metrologia 48 (2011) Tech. Suppl. 06018
TABLE OF CONTENTS
1 Introduction.............................................................................................................................. 3 2 The 241Am-Be(α,n) radionuclide source .................................................................................. 3 3 Neutron emission rate measurement techniques of the laboratories........................................ 4
3.1 CIAE ................................................................................................................................ 4 3.2 CMI .................................................................................................................................. 5 3.3 KRISS .............................................................................................................................. 5 3.4 LNMRI............................................................................................................................. 6 3.5 LNE-LNHB...................................................................................................................... 6 3.6 NIST................................................................................................................................. 7 3.7 NPL .................................................................................................................................. 7 3.8 VNIIM.............................................................................................................................. 8
3.8.1 Mn bath method ....................................................................................................... 8 3.8.2 Associated particles method..................................................................................... 8
3.9 Summary of manganese bath features.............................................................................. 9 3.10 Correction factors used by the participants...................................................................... 9
4 Results.................................................................................................................................... 10 5 Analysis of results.................................................................................................................. 11
5.1 Consideration of the data as reported by the participants .............................................. 11 5.1.1 Largest consistent subset method........................................................................... 12
5.2 Normalization of measured values to ENDF/B-VI.0 oxygen(n,α) cross section .......... 15 6 Summary and Conclusion ...................................................................................................... 16 7 Acknowledgements................................................................................................................ 17 8 Appendices............................................................................................................................. 18
8.1 Appendix A: Reference value and degrees of equivalence............................................ 18 8.2 Appendix B: Uncertainty budgets reported by the participants ..................................... 21
8.2.1 Uncertainties reported by CIAE............................................................................. 21 8.2.2 Uncertainties reported by CMI............................................................................... 22 8.2.3 Uncertainties reported by KRISS........................................................................... 23 8.2.4 Uncertainties reported by LNE-LNHB .................................................................. 24 8.2.5 Uncertainties reported by LNMRI ......................................................................... 25 8.2.6 Uncertainties reported by NIST ............................................................................. 26 8.2.7 Uncertainties reported by NPL............................................................................... 27 8.2.8 Uncertainties reported by VNIIM .......................................................................... 28 8.2.9 Comparison of Mn bath uncertainties from all participants................................... 30
8.3 Appendix C: Anisotropy measurements ........................................................................ 31 8.3.1 CMI ........................................................................................................................ 31 8.3.2 KRISS .................................................................................................................... 31 8.3.3 VNIIM.................................................................................................................... 32 8.3.4 NPL ........................................................................................................................ 32 8.3.5 Results .................................................................................................................... 32
9 References.............................................................................................................................. 35
2/35
Metrologia 48 (2011) Tech. Suppl. 06018
1 INTRODUCTION International comparisons of neutron source emission rate are staged infrequently and typically take many years to perform. The only previous comparisons involving large numbers of participants were those carried out between 1959 and 1965 involving a Ra-Be(α,n) source1, and between 1979 and 1984 involving three different 252Cf sources2. It is the aim of Section III (neutron metrology) of the Comité Consultatif des Rayonnements Ionisants (CCRI) to compare the realization of standards of all relevant neutron quantities over a ten-year cycle, so it was decided in 1999 to arrange a new international comparison of neutron source emission rate. Eight laboratories participated and they were: China Institute of Atomic Energy (CIAE), Beijing, Peoples Republic of China
Czech Metrology Institute (CMI), Praha, Czech Republic
Korea Research Institute of Standards and Science (KRISS), Daejeon, Republic of Korea
National Laboratory of Metrology of Ionizing Radiation (LNMRI), Rio de Janeiro, Brazil
Laboratoire National Henri Becquerel (LNE-LNHB), Paris, France
National Institute of Standards and Technology (NIST), Gaithersburg, USA
National Physical Laboratory (NPL), Teddington, UK
D.I. Mendeleyev Institute for Metrology (VNIIM), St. Petersburg, Russia The comparison measurements were made over the period 1999 to 2005, some of the delays being due to border security measured, and the draft A report was released in May 2006. This report was discussed at the CCRI(III) meeting in 2007, where a number of issues were raised. Those regarding the two initial outliers were subsequently resolved by the participants and the Draft B report was discussed in 2009 with the final version with the KCRV and degrees of equivalence being approved in 2011. 2 THE 241Am-Be(α,n) RADIONUCLIDE SOURCE
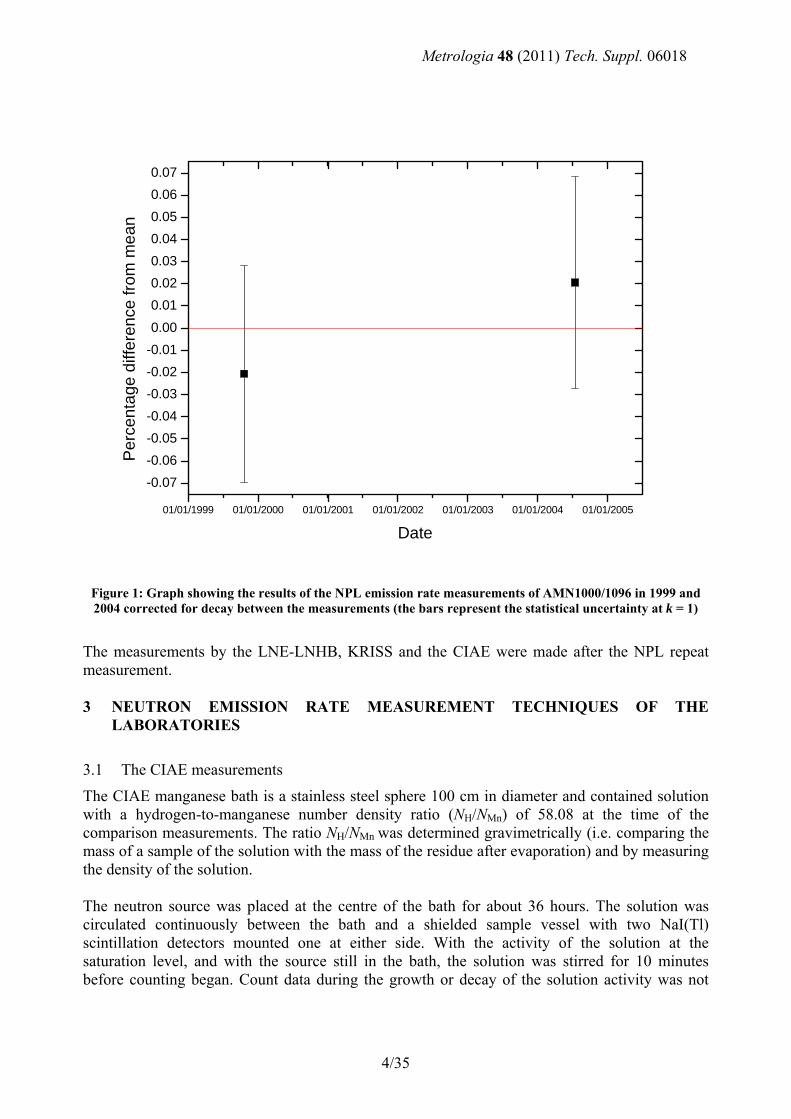
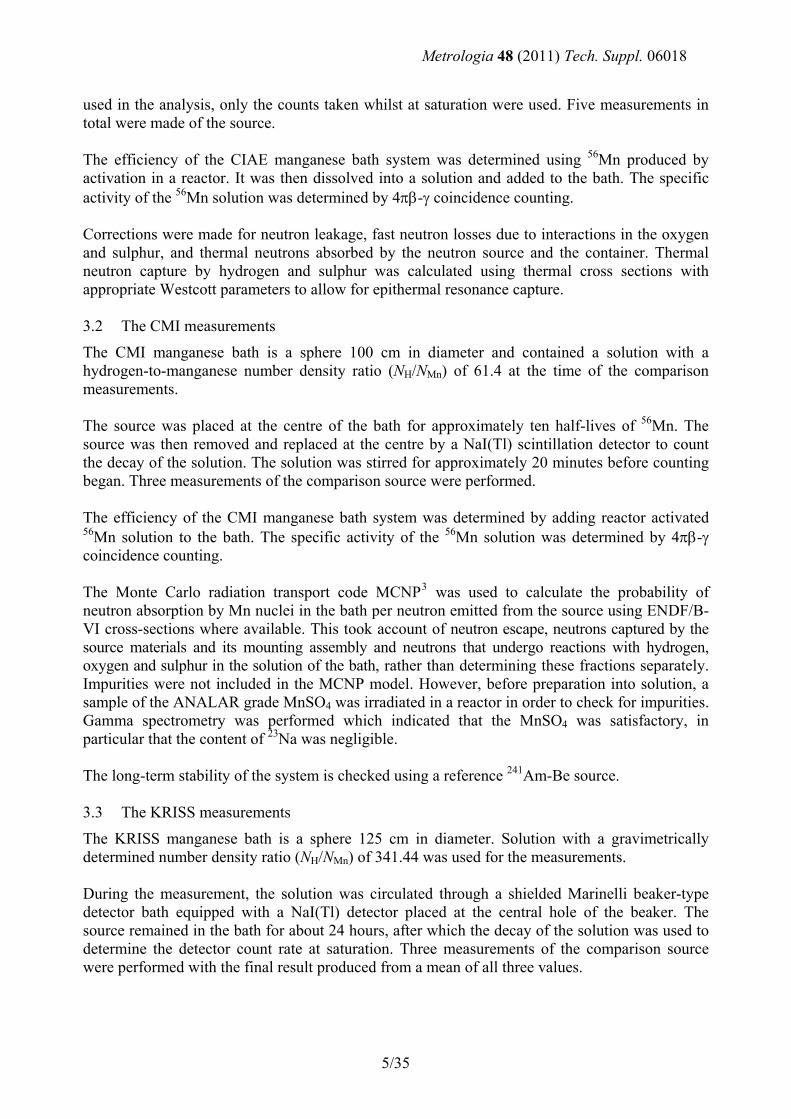
The neutron source used was a sealed 241Am-Be(α,n) source (model AMN22, serial number AMN1000/1096) owned by the NPL, which had a nominal activity of 37 GBq (1 Ci). It is in an X3 capsule (outer length 31 mm, outer diameter 22.4 mm) a type currently manufactured by QSA Global. The source was chosen for its long half-life and stable decay process, and also because it is representative of the type and size of neutron sources commonly used at the present time in calibration laboratories. After the NPL had made the first measurement the source was sent to each participant in turn. The NPL coordinated the scheduling of participants, with each laboratory being responsible for sending the source on to the next participant. In 2004, towards the end of the exercise, the source returned to NPL for a repeat measurement. Figure 1 shows the excellent agreement between the two measurements, which gives confidence that the only change in the emission rate of the source that has occurred has been due to the radioactive decay of the 241Am.
3/35
Metrologia 48 (2011) Tech. Suppl. 06018
01/01/1999 01/01/2000 01/01/2001 01/01/2002 01/01/2003 01/01/2004 01/01/2005
-0.07-0.06-0.05-0.04-0.03-0.02-0.010.000.010.020.030.040.050.060.07
P
erce
ntag
e di
ffere
nce
from
mea
n
Date
Figure 1: Graph showing the results of the NPL emission rate measurements of AMN1000/1096 in 1999 and 2004 corrected for decay between the measurements (the bars represent the statistical uncertainty at k = 1)
The measurements by the LNE-LNHB, KRISS and the CIAE were made after the NPL repeat measurement. 3 NEUTRON EMISSION RATE MEASUREMENT TECHNIQUES OF THE
LABORATORIES
3.1 The CIAE measurements
The CIAE manganese bath is a stainless steel sphere 100 cm in diameter and contained solution with a hydrogen-to-manganese number density ratio (NH/NMn) of 58.08 at the time of the comparison measurements. The ratio NH/NMn was determined gravimetrically (i.e. comparing the mass of a sample of the solution with the mass of the residue after evaporation) and by measuring the density of the solution. The neutron source was placed at the centre of the bath for about 36 hours. The solution was circulated continuously between the bath and a shielded sample vessel with two NaI(Tl) scintillation detectors mounted one at either side. With the activity of the solution at the saturation level, and with the source still in the bath, the solution was stirred for 10 minutes before counting began. Count data during the growth or decay of the solution activity was not
4/35
Metrologia 48 (2011) Tech. Suppl. 06018
used in the analysis, only the counts taken whilst at saturation were used. Five measurements in total were made of the source. The efficiency of the CIAE manganese bath system was determined using 56Mn produced by activation in a reactor. It was then dissolved into a solution and added to the bath. The specific activity of the 56Mn solution was determined by 4πβ-γ coincidence counting. Corrections were made for neutron leakage, fast neutron losses due to interactions in the oxygen and sulphur, and thermal neutrons absorbed by the neutron source and the container. Thermal neutron capture by hydrogen and sulphur was calculated using thermal cross sections with appropriate Westcott parameters to allow for epithermal resonance capture. 3.2 The CMI measurements
The CMI manganese bath is a sphere 100 cm in diameter and contained a solution with a hydrogen-to-manganese number density ratio (NH/NMn) of 61.4 at the time of the comparison measurements. The source was placed at the centre of the bath for approximately ten half-lives of 56Mn. The source was then removed and replaced at the centre by a NaI(Tl) scintillation detector to count the decay of the solution. The solution was stirred for approximately 20 minutes before counting began. Three measurements of the comparison source were performed. The efficiency of the CMI manganese bath system was determined by adding reactor activated 56Mn solution to the bath. The specific activity of the 56Mn solution was determined by 4πβ-γ coincidence counting. The Monte Carlo radiation transport code MCNP3 was used to calculate the probability of neutron absorption by Mn nuclei in the bath per neutron emitted from the source using ENDF/B-VI cross-sections where available. This took account of neutron escape, neutrons captured by the source materials and its mounting assembly and neutrons that undergo reactions with hydrogen, oxygen and sulphur in the solution of the bath, rather than determining these fractions separately. Impurities were not included in the MCNP model. However, before preparation into solution, a sample of the ANALAR grade MnSO4 was irradiated in a reactor in order to check for impurities. Gamma spectrometry was performed which indicated that the MnSO4 was satisfactory, in particular that the content of 23Na was negligible. The long-term stability of the system is checked using a reference 241Am-Be source. 3.3 The KRISS measurements
The KRISS manganese bath is a sphere 125 cm in diameter. Solution with a gravimetrically determined number density ratio (NH/NMn) of 341.44 was used for the measurements. During the measurement, the solution was circulated through a shielded Marinelli beaker-type detector bath equipped with a NaI(Tl) detector placed at the central hole of the beaker. The source remained in the bath for about 24 hours, after which the decay of the solution was used to determine the detector count rate at saturation. Three measurements of the comparison source were performed with the final result produced from a mean of all three values.
5/35
Metrologia 48 (2011) Tech. Suppl. 06018
The efficiency of the KRISS manganese bath system was determined using reactor-activated 56Mn dissolved into a solution and added to the bath. The specific activity of the 56Mn solution was determined by 4πβ-γ coincidence counting. The MCNP code version 4C was used to calculate the probability of 56Mn production per neutron emitted from the source. This took account of neutron leakage, neutron capture by the source materials and its mounting assembly, the neutron reactions with hydrogen, oxygen and sulphur nuclei, and epithermal capture by the manganese nuclei. The ENDF/B-VI cross-sections were used where available. Impurities in the solution were analysed chemically using ICP-OES (Inductively Coupled Plasma Optical Emission Spectrometry) and shown to be present only at very low concentrations (< 40 ppm for all impurities). The MCNP code was used to estimate that the impurities had a negligible effect and therefore the impurities were not included in the final model of the manganese bath. The long-term stability of the system was checked using a reference 241Am-Be source. 3.4 The LNMRI measurements
The LNMRI manganese bath is a static system where, after the source has irradiated the solution to saturation, a NaI(Tl) scintillator is placed at the centre of the bath to measure the decay. The bath is a sphere 100 cm in diameter and the solution hydrogen-to-manganese ratio was gravimetrically determined to be 30.09. The efficiency of the system is determined by irradiating a sample of the solution in a reactor. An ionization chamber is used to standardize the sample, and the remainder is returned to the manganese bath where the NaI(Tl) scintillator measures the decay of the activity. The ionization chamber is calibrated using a reference sample calibrated absolutely by the 4πβ-γ coincidence method. The fraction of neutrons captured by the source itself and the source immersion assembly was calculated using an MCNP simulation. Losses due to leakage and fast neutron capture in the solution were calculated by logarithmic regression to experimental data4. Thermal neutron capture by hydrogen and sulphur was calculated using thermal cross sections with appropriate Westcott parameters to allow for epithermal resonance capture. Impurities in the solution were considered to be negligible based on an analysis using ICP-MS (Inductively Coupled Plasma Mass Spectrometry). 3.5 The LNE-LNHB measurements
In the LNE-LNHB system the activity of the solution while the source is in the bath was recorded using a NaI(Tl) detector in a sampling loop. Once at saturation, 20 ml samples of solution were taken from the bath and counted using a Cerenkov counter to yield the activity per mass. The Cerenkov counter was calibrated using a 4πCerenkov-γ coincidence counting experiment involving MnSO4 solution enriched in 56Mn by irradiation using an 241Am-Be source in a graphite pile. The solution in the bath had a concentration (NH/NMn) of 49.17, determined gravimetrically and by ionic chromatography after dilution. Corrections for the leakage fraction, the capture in the source and source mounting assembly, and the capture by (n,p) and (n,α) reactions in sulphur and oxygen, and thermal neutron capture by
6/35
Metrologia 48 (2011) Tech. Suppl. 06018
nuclei other than manganese were calculated using MCNP version 4C3. The ENDF/B-VI cross-sections were used where available. The fraction of thermal neutron capture by manganese was also calculated using thermal cross-sections which agreed with the MCNP value to within 0.07%. The MCNP value was used in the final analysis. Impurities in the solution were not considered. 3.6 The NIST measurements
The NIST manganese bath is operated in comparison mode where the neutron emission rate of an unknown source is compared with that of NBS-1, the US national neutron reference 226Ra-Be(γ,n) source. The bath is a sphere 129 cm in diameter and the solution had a concentration (NH/NMn) of approximately 54 for the comparison measurements. Two measurements were made of the comparison source two months apart with measurements of NBS-1 made before the first, in between, and two months after the second measurement of the comparison source. Measurements of the former BIPM Ra-Be source were also made before, between, and after the comparison source measurements. Each source was placed at the centre of the manganese bath for a minimum of twenty half-lives with the solution flowing in a simple circulation loop to ensure thorough mixing of the activity. Once satisfied that the activity is at saturation, the flow of the solution is diverted into a shielded Marinelli beaker with a NaI scintillator positioned inside to count the 56Mn activity. The source remains inside the bath while the counting is performed. Corrections were applied to allow for the difference in the leakage fraction, the capture in the source and source mounting assembly, and the fast neutron capture by sulphur and oxygen. The corrections used were based upon in-house calculations rather than MCNP because of concerns that the O(n,α) cross-section in ENDF/B-VI is too high. Impurities in the solution were considered too low to be significant given that the degree of thermal neutron impurity capture would be the same for NBS-1 and the comparison source and would therefore cancel. 3.7 The NPL measurements
The NPL manganese bath is a sphere 98 cm in diameter. Solution with hydrogen-to-manganese number density ratios (NH/NMn) of 33.50 and 33.81 was used for the 1999 and 2004 measurements respectively. The concentration was determined gravimetrically in each case. The solution was continuously circulated through a shielded reservoir where two NaI scintillators were used to measure the activity of the solution before being pumped back into the bath. The saturated count-rate was obtained from the counting cycles when the source was in the bath as well as from those after the source had been removed. Both NPL measurements consisted of two separate bath irradiations performed within a week of each other. The NaI detectors were calibrated by adding an active solution of 56Mn to the bath, the activity concentration of which had been determined by absolute 4πβ-γ coincidence counting at the NPL. This is performed annually, although the calibration is repeated approximately every 3 months using 56Mn solution standardized using an ionization chamber. A linear fit is made to the efficiency measurements to interpolate or extrapolate to the day of a neutron source measurement. The MCNP4C code was used to calculate the leakage fraction, the capture in the source and source mounting assembly, and the capture by (n,p) and (n,α) reactions in sulphur and oxygen
7/35
Metrologia 48 (2011) Tech. Suppl. 06018
using ENDF/B-VI cross-sections where available. Thermal neutron capture by hydrogen, sulphur, and solution impurities was calculated using thermal cross sections with appropriate Westcott parameters to allow for epithermal resonance capture. A hydrogen-to-manganese cross-section ratio derived from measurements in the NPL manganese bath was used5. The impurity levels were taken from a chemical analysis of the solution. 3.8 The VNIIM measurements
3.8.1 Mn bath method
The VNIIM bath is a cylinder 85 cm in diameter and for the comparison measurement, solution with a hydrogen-to-manganese number density ratio (NH/NMn) of 48.85 was used. Two irradiations of the solution were performed; one of 23.5 hours and another of 61.6 hours. The activity of the solution was derived from the gamma count rate of a NaI(Tl) scintillation detector placed at the centre of the bath after the source had been removed. The efficiency of the system was determined using active manganese solution. The correction for neutron leakage from the bath was determined experimentally. Corrections for self-capture in the source material and fast neutron capture by sulphur and oxygen were made using simplified calculations based on ENDF/B-VI cross-sections. Thermal neutron capture by hydrogen and sulphur was calculated using thermal cross sections with appropriate parameters to allow for epithermal resonance capture. A correction for absorption of thermal neutrons by impurities was made using the impurity data supplied by the manufacturers of the manganese sulphate. 3.8.2 Associated particles method
The neutron source emission rate was determined using the all-wave graphite comparator6 relative to the neutron fluence rate from the T(d,n)4He reaction as determined by associated alpha particle counting. The comparator consists of a graphite sphere, 4 m in diameter, with a central spherical cavity, 0.4 m in diameter, in which the source was located. Measurements were made using a 3He thermal neutron detector at thirty-eight different distances from the centre of the sphere. The epithermal neutron contribution for each position was corrected by making measurements with the detector under cadmium. Corrections were made for (n,α) capture in the graphite from the 241Am-Be source and the T(d,n)4He reaction using a Monte Carlo method. Allowance was also made for neutron capture in the target chamber shell.
8/35
Metrologia 48 (2011) Tech. Suppl. 06018
3.9 Summary of manganese bath features
The features of all eight manganese bath facilities are listed in Table 1. Table 1: Summary of manganese bath parameters
Laboratory Bath size NH/NMn
Correction factor method
ENDF/B-VI.0
oxygen?
Impurity correction?
Activity counting system
CIAE 100 cm diameter 58.08 In-house
calculations Yes No Circulation of solution
CMI 100 cm diameter 61.4 MCNP Yes No*
Static detector in
bath
KRISS 125 cm diameter 341.44 MCNP Yes No* Circulation
of solution
LNE-LNHB
100 cm diameter 49.17 MCNP Yes No Extraction
of sample
LNMRI 100 cm diameter 30.09
MCNP+in-house
calculations No No
Static detector in
bath
NIST 129 cm diameter 54 In-house
calculations No No** Circulation of solution
NPL 98 cm diameter 33.5 MCNP+thermal
calculation Yes Yes Circulation of solution
VNIIM 85 cm
diameter cylinder
48.846
Experimental leakage + in-
house calculations
Yes Yes
(manufacturer’s data)
Static detector in
bath
* Analytical measurements were made to confirm that the level of impurities was very low and therefore did not need to be corrected. ** Due to the ratio method used by the NIST the effect of any impurities is considered to cancel. 3.10 Correction factors used by the participants
The majority of participants calculated the fraction of neutrons captured by manganese nuclei by determining the fractions lost to competing mechanisms rather than evaluating the manganese capture fraction directly. The two exceptions were the CMI and the KRISS who calculated the manganese capture fraction directly using MCNP. Using the equation of Axton7 the competing mechanisms are defined in the following equation:
( )LSOfεAQ
−−−=
1 (1)
where:
Q is the neutron source emission rate, A is the saturation count rate of the 56Mn produced in the bath,
9/35
Metrologia 48 (2011) Tech. Suppl. 06018
ε is the counting efficiency defined as the counting rate per unit 56Mn disintegration throughout the system,
O is the fraction of neutrons lost due to capture in fast neutron reactions in oxygen or sulphur, S is the fraction of the neutrons which are captured by the source and its mounting assembly, L is the fraction of neutrons which escape from the boundaries of the bath, f is the fraction of the remaining neutrons which are captured by manganese.
The values of O, S and L depend on the energy spectrum of the source, the concentration of the solution, the material and geometry of the source mounting assembly, and the size and shape of the bath. Apart from the energy spectrum, the other parameters vary from participant to participant so it is not possible to compare directly the values of O, S, and L. The manganese thermal fraction (f) varies only with solution concentration if the solution impurities are negligible
Table 2: Summary of manganese bath correction factors as reported
Laboratory NH/NMn Oxygen and sulphur fast capture (O)
Source and assembly
capture (S)
Leakage (L)
Thermal Mn capture
fraction (f) f(1-O-S-L)
CIAE 58.08 3.0 % 0.4 % 1.5 % 0.4088 0.3888
CMI 61.4 0.3670
KRISS 341.44 0.1023
LNE-LNHB 49.17 3.5 % 2.0 % 1.5 % 0.4434 0.4124
LNMRI 30.09 2.731 % 0.08 % 1.112 % 0.563 0.5369
NIST 54 2.879 % 0.823 % 0.257 %
NPL 33.5 3.33 % 1.57 % 1.41 % 0.5371 0.5032
VNIIM 48.846 2.8 % 0.1 % 3.2 % 0.4474 0.4201
4 RESULTS The emission rates submitted by each participant with expanded uncertainties (i.e. at k = 2) are given in Table 3. All have been corrected to the reference date of 1 January 2000.
10/35
Metrologia 48 (2011) Tech. Suppl. 06018
Table 3: Emission rates corrected to 1 January 2000 with expanded uncertainties
Laboratory Emission rate (× 106 s–1) Uncertainty [k = 2] (× 106 s–1)
CIAE 2.380 0.031
CMI 2.432 0.039
KRISS 2.442 0.029
LNE-LNHB 2.299 0.064
LNMRI 2.440 0.028
NIST 2.409 0.053
NPL* 2.432 0.030
VNIIM# 2.470 0.024 * The NPL value is a mean of the measurements made in 1999 and 2004. # The VNIIM value is a mean of the manganese bath and associated particle measurements. 5 ANALYSIS OF RESULTS
5.1 Consideration of the data as reported by the participants
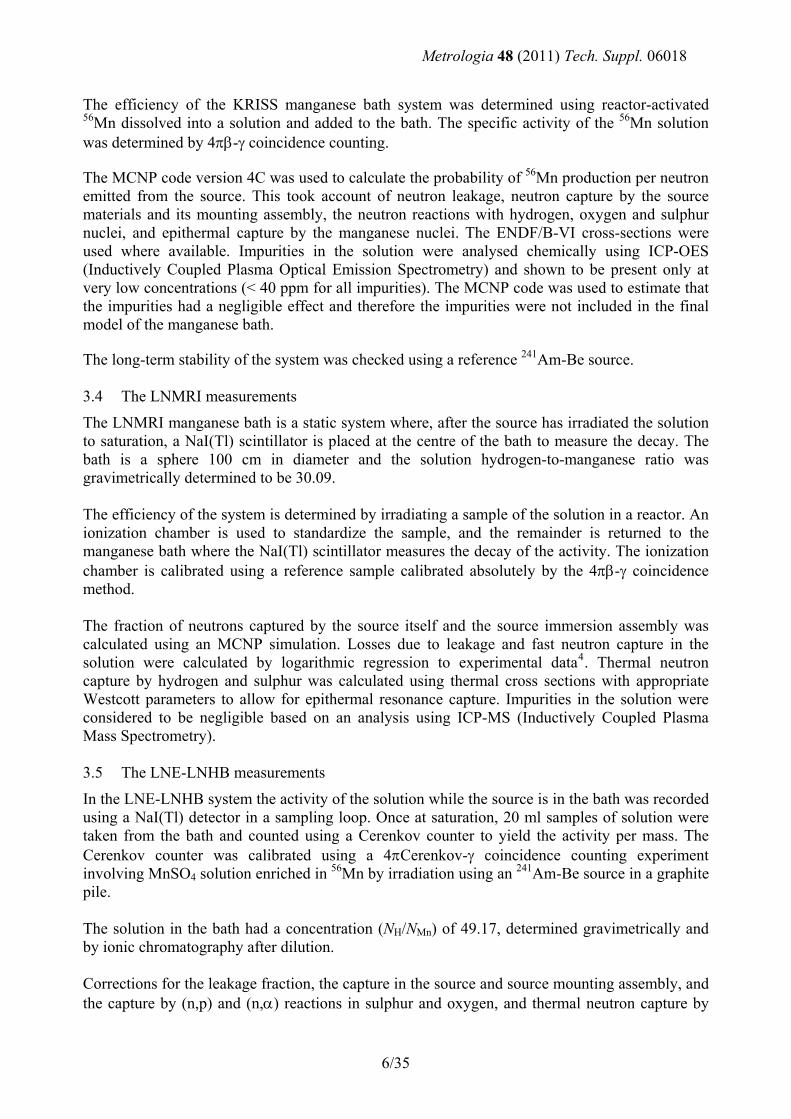
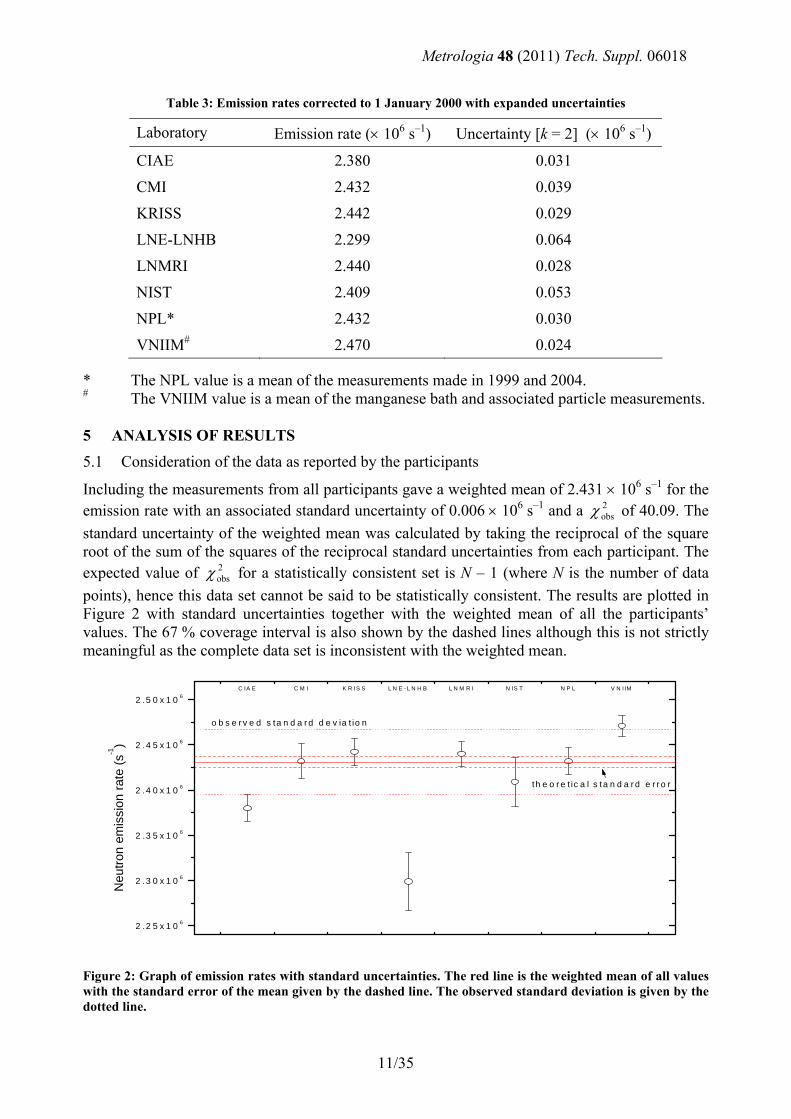
Including the measurements from all participants gave a weighted mean of 2.431 × 10⁶ s–1 for the emission rate with an associated standard uncertainty of 0.006 × 10⁶ s–1 and a of 40.09. The standard uncertainty of the weighted mean was calculated by taking the reciprocal of the square root of the sum of the squares of the reciprocal standard uncertainties from each participant. The expected value of for a statistically consistent set is N – 1 (where N is the number of data points), hence this data set cannot be said to be statistically consistent. The results are plotted in
2obsχ
2obsχ
Figure 2 with standard uncertainties together with the weighted mean of all the participants’ values. The 67 % coverage interval is also shown by the dashed lines although this is not strictly meaningful as the complete data set is inconsistent with the weighted mean.
2 .2 5 x 1 0 6
2 .3 0 x 1 0 6
2 .3 5 x 1 0 6
2 .4 0 x 1 0 6
2 .4 5 x 1 0 6
2 .5 0 x 1 0 6C IA E C M I K R IS S L N E - L N H B L N M R I N IS T N P L V N IIM
Neu
tron
emis
sion
rate
(s-1)
o b s e r v e d s ta n d a r d d e v ia t io n
th e o r e t ic a l s ta n d a r d e r r o r
Figure 2: Graph of emission rates with standard uncertainties. The red line is the weighted mean of all values with the standard error of the mean given by the dashed line. The observed standard deviation is given by the dotted line.
11/35
Metrologia 48 (2011) Tech. Suppl. 06018
The χ2 contribution is defined as d2/u(measured value)2 and the χ2 contributions are given in Table 4. The CIAE, LNE-LNHB, and the VNIIM were all asked to recheck their calculations before the results were released, but none reported any numerical errors.
Table 4: χ2 contributions when all participants are included
Laboratory χ2 contribution
CIAE 10.877
CMI 0.002
KRISS 0.563
LNE-LNHB 17.046
LNMRI 0.402
NIST 0.697
NPL 0.003
VNIIM 10.498
5.1.1 Largest consistent subset method
An approach8 has been developed at the NPL for evaluating key comparison and similar data sets, with software produced in MATLAB to implement the approach. The software evaluates the observed χ2 value from the measured data xi and their associated standard uncertainties u(xi), i = 1, …, N, using the usual relation:
( )
2
1∑=
⎟⎟⎠
⎞⎜⎜⎝
⎛ −=
N
i i
i
xuyx2
obsχ ,
where y is the trial KCRV (Key Comparison Reference Value) calculated as the weighted mean,
N is the number of participants. The expected value of for a statistically consistent set is N – 1. If is significantly greater than this, the largest consistent subset (LCS) of the data is determined. This set is obtained by excluding as little as possible of the data. The weighted mean, its associated standard uncertainty and the value are again calculated, based on this subset.
2obsχ 2
obsχ
2obsχ
12/35
Metrologia 48 (2011) Tech. Suppl. 06018
As stated in section 5.1 of this report, if the measurements from all participants are included a weighted mean of 2.431 × 10⁶ s–1 with an associated standard uncertainty of 0.006 × 10⁶ s–1 and a
of 40.09 are obtained. It is clear from 2obsχ Figure 2 and from the large value of that the data
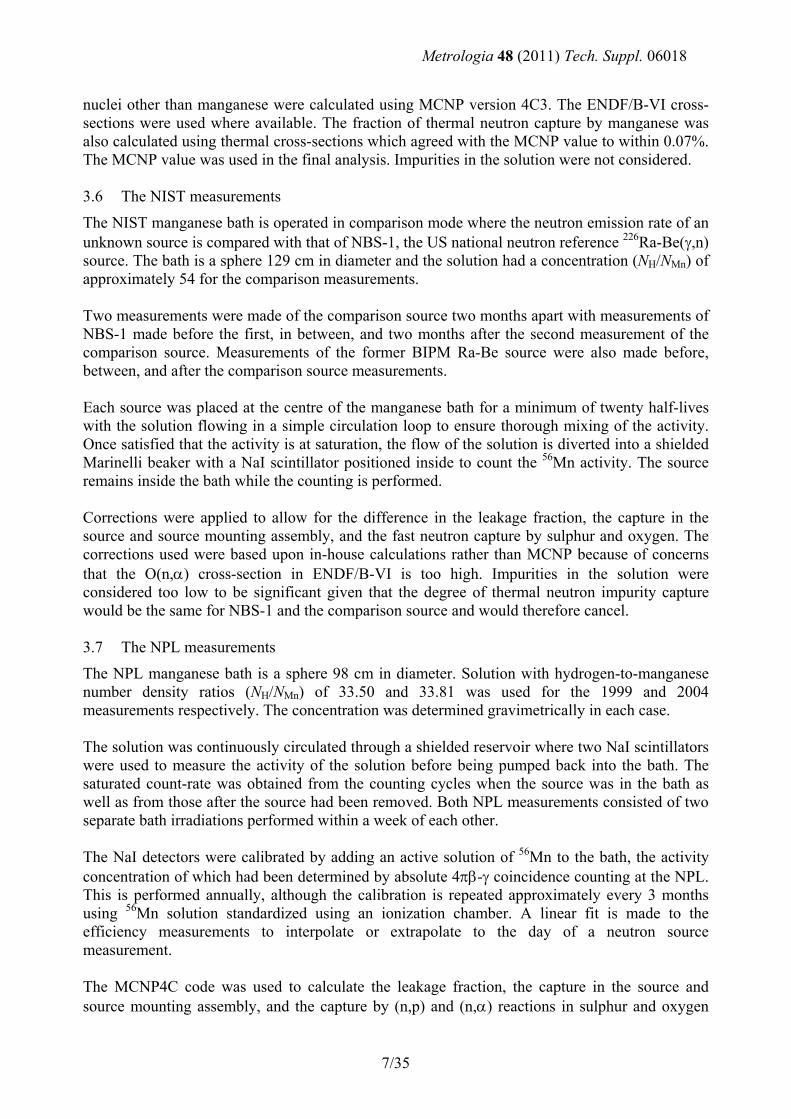
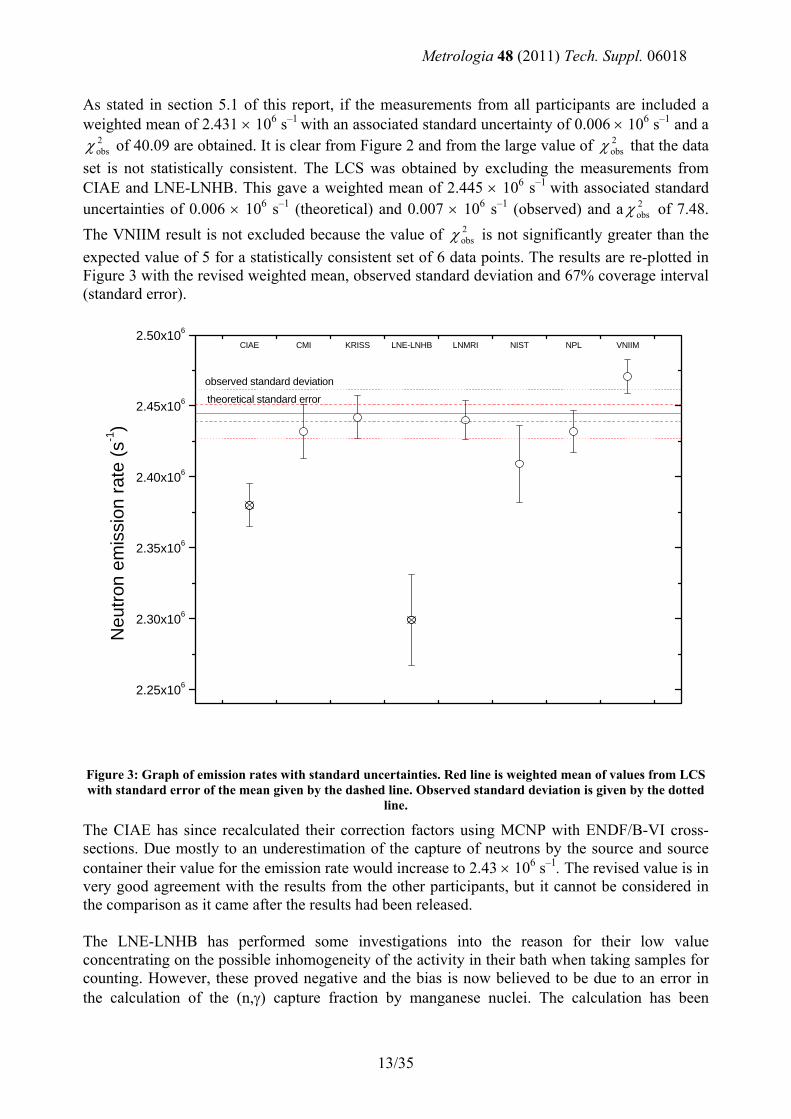
set is not statistically consistent. The LCS was obtained by excluding the measurements from CIAE and LNE-LNHB. This gave a weighted mean of 2.445 × 10⁶ s–1 with associated standard uncertainties of 0.006 × 10⁶ s–1 (theoretical) and 0.007 × 10⁶ s–1 (observed) and a of 7.48. The VNIIM result is not excluded because the value of is not significantly greater than the expected value of 5 for a statistically consistent set of 6 data points. The results are re-plotted in
2obsχ
2obsχ
2obsχ
Figure 3 with the revised weighted mean, observed standard deviation and 67% coverage interval (standard error).
2.25x10⁶
2.30x10⁶
2.35x10⁶
2.40x10⁶
2.45x10⁶
2.50x10⁶
CIAE CMI KRISS LNE-LNHB LNMRI NIST NPL VNIIM
theoretical standard error
Neu
tron
emis
sion
rate
(s-1)
observed standard deviation
Figure 3: Graph of emission rates with standard uncertainties. Red line is weighted mean of values from LCS with standard error of the mean given by the dashed line. Observed standard deviation is given by the dotted
line.
The CIAE has since recalculated their correction factors using MCNP with ENDF/B-VI cross-sections. Due mostly to an underestimation of the capture of neutrons by the source and source container their value for the emission rate would increase to 2.43 × 10⁶ s–1. The revised value is in very good agreement with the results from the other participants, but it cannot be considered in the comparison as it came after the results had been released. The LNE-LNHB has performed some investigations into the reason for their low value concentrating on the possible inhomogeneity of the activity in their bath when taking samples for counting. However, these proved negative and the bias is now believed to be due to an error in the calculation of the (n,γ) capture fraction by manganese nuclei. The calculation has been
13/35
Metrologia 48 (2011) Tech. Suppl. 06018
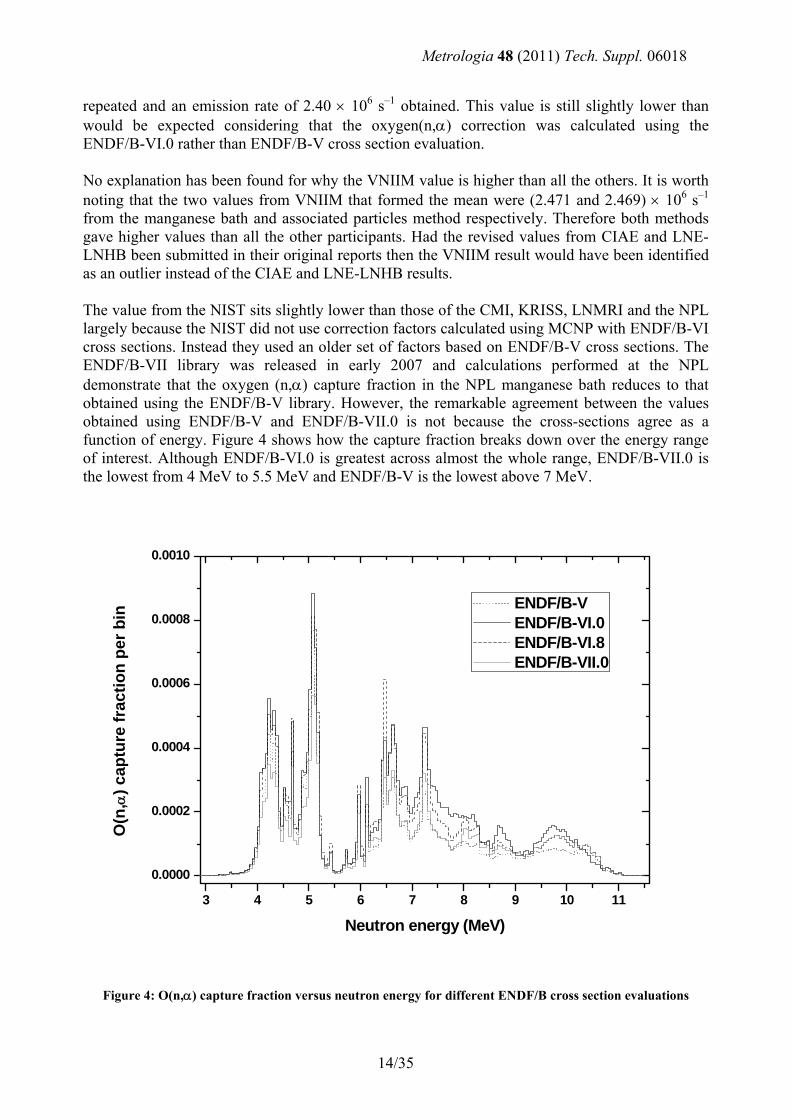
repeated and an emission rate of 2.40 × 10⁶ s–1 obtained. This value is still slightly lower than would be expected considering that the oxygen(n,α) correction was calculated using the ENDF/B-VI.0 rather than ENDF/B-V cross section evaluation. No explanation has been found for why the VNIIM value is higher than all the others. It is worth noting that the two values from VNIIM that formed the mean were (2.471 and 2.469) × 106 s–1 from the manganese bath and associated particles method respectively. Therefore both methods gave higher values than all the other participants. Had the revised values from CIAE and LNE-LNHB been submitted in their original reports then the VNIIM result would have been identified as an outlier instead of the CIAE and LNE-LNHB results. The value from the NIST sits slightly lower than those of the CMI, KRISS, LNMRI and the NPL largely because the NIST did not use correction factors calculated using MCNP with ENDF/B-VI cross sections. Instead they used an older set of factors based on ENDF/B-V cross sections. The ENDF/B-VII library was released in early 2007 and calculations performed at the NPL demonstrate that the oxygen (n,α) capture fraction in the NPL manganese bath reduces to that obtained using the ENDF/B-V library. However, the remarkable agreement between the values obtained using ENDF/B-V and ENDF/B-VII.0 is not because the cross-sections agree as a function of energy. Figure 4 shows how the capture fraction breaks down over the energy range of interest. Although ENDF/B-VI.0 is greatest across almost the whole range, ENDF/B-VII.0 is the lowest from 4 MeV to 5.5 MeV and ENDF/B-V is the lowest above 7 MeV.
3 4 5 6 7 8 9 10 11
0.0000
0.0002
0.0004
0.0006
0.0008
0.0010
O(n
,α) c
aptu
re fr
actio
n pe
r bin
Neutron energy (MeV)
ENDF/B-V ENDF/B-VI.0 ENDF/B-VI.8 ENDF/B-VII.0
Figure 4: O(n,α) capture fraction versus neutron energy for different ENDF/B cross section evaluations
14/35
Metrologia 48 (2011) Tech. Suppl. 06018
Evaluations of the O(n,α) cross section rely heavily on measurements of the inverse 13C(α,n)16O reaction (such as those by Harissopulos et al.(9)) due to the limited amount of published data on the 16O(n,α)13C reaction. However, measurements have recently been made of the 16O(n,α)13C reaction by a team at IRMM(10). These showed good agreement with the ENDF/B-VII.0 values up to around 4.5 MeV. However above this energy their values are higher than those of ENDF/B-VII.0 and the disagreement increases with energy for each of the resonances up to 7.2 MeV, more in line with the values of ENDF/B-VI.0. It is hoped that a revised version of the ENDF/B-VII data can be produced from the IRMM measurements which should give an O(n,α) capture fraction in the manganese bath falling somewhere between the values obtained using ENDF/B-VI.0 and ENDF/B-VII.0. 5.2 Normalization of measured values to ENDF/B-VI.0 oxygen(n,α) cross section
The LNMRI and NIST were asked to recalculate their correction factor for fast neutron capture in oxygen and sulphur using the ENDF/B-VI.0 cross section tables for oxygen. The reported and revised values for each participant are given in Table 5.
Table 5: Oxygen and sulphur fast neutron capture correction (O) as reported and based on ENDF/B-VI.0 O(n,α) cross section table for each participant. Both CMI and KRISS calculated the Mn(n,γ) capture fraction
directly so did not report values for O.
Laboratory Oreport OENDF/B-
VI.0 NH/NMn
CIAE 0.030 0.030 58.08
CMI - - 61.4
KRISS - - 341.44
LNE-LNHB 0.035 0.035 49.17
LNMRI 0.02731 0.03494 30.09
NIST 0.02879 0.03329 54
NPL 0.0333 0.0333 33.5
VNIIM 0.028 0.028 48.846
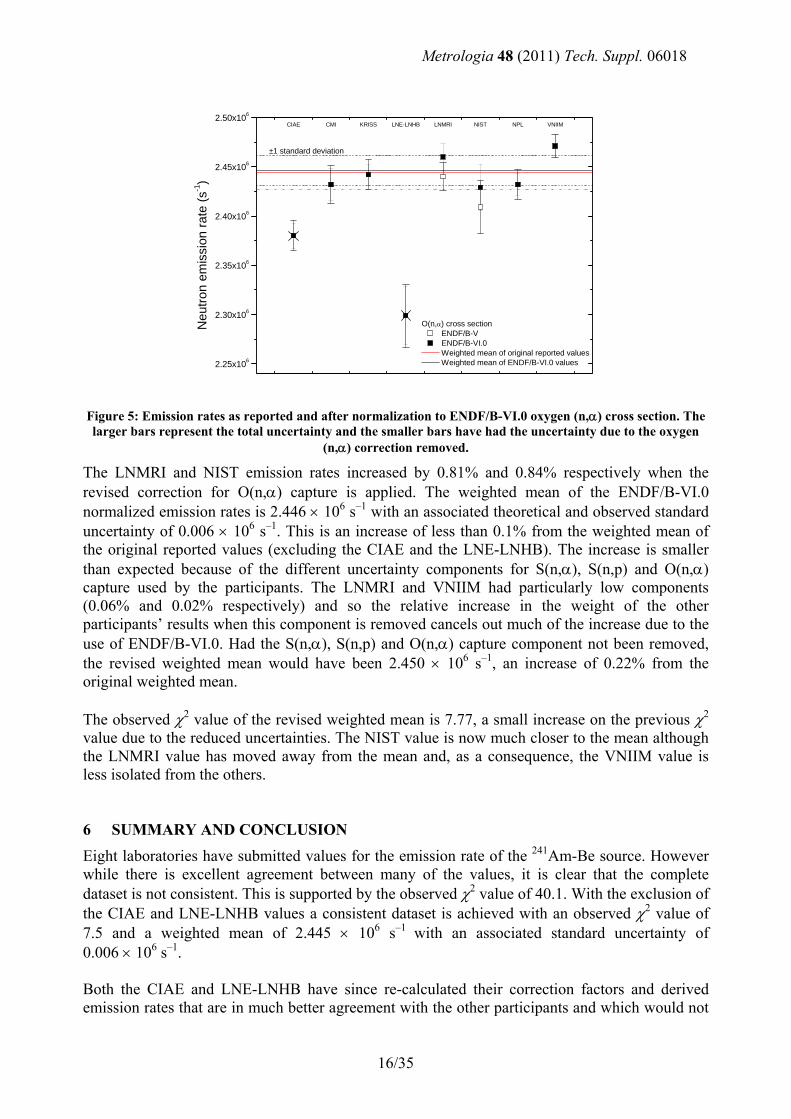
Values for the emission rate of the source based on the same O(n,α) cross section table were then available for all participants. This allowed the results of the participants to be compared without the use of different O(n,α) cross section evaluations being a factor. The O(n,α) cross section uncertainty components could also be removed from the analysis of the results as they are clearly correlated. Figure 5 shows the original and revised values together with the original and revised weighted means.
15/35
Metrologia 48 (2011) Tech. Suppl. 06018
2.25x10⁶
2.30x10⁶
2.35x10⁶
2.40x10⁶
2.45x10⁶
2.50x10⁶
CIAE CMI KRISS LNE-LNHB LNMRI NIST NPL VNIIM
O(n,α) cross section ENDF/B-V ENDF/B-VI.0 Weighted mean of original reported values Weighted mean of ENDF/B-VI.0 values
Neu
tron
emis
sion
rate
(s-1)
±1 standard deviation
Figure 5: Emission rates as reported and after normalization to ENDF/B-VI.0 oxygen (n,α) cross section. The larger bars represent the total uncertainty and the smaller bars have had the uncertainty due to the oxygen
(n,α) correction removed.
The LNMRI and NIST emission rates increased by 0.81% and 0.84% respectively when the revised correction for O(n,α) capture is applied. The weighted mean of the ENDF/B-VI.0 normalized emission rates is 2.446 × 10⁶ s–1 with an associated theoretical and observed standard uncertainty of 0.006 × 10⁶ s–1. This is an increase of less than 0.1% from the weighted mean of the original reported values (excluding the CIAE and the LNE-LNHB). The increase is smaller than expected because of the different uncertainty components for S(n,α), S(n,p) and O(n,α) capture used by the participants. The LNMRI and VNIIM had particularly low components (0.06% and 0.02% respectively) and so the relative increase in the weight of the other participants’ results when this component is removed cancels out much of the increase due to the use of ENDF/B-VI.0. Had the S(n,α), S(n,p) and O(n,α) capture component not been removed, the revised weighted mean would have been 2.450 × 10⁶ s–1, an increase of 0.22% from the original weighted mean. The observed χ2 value of the revised weighted mean is 7.77, a small increase on the previous χ2 value due to the reduced uncertainties. The NIST value is now much closer to the mean although the LNMRI value has moved away from the mean and, as a consequence, the VNIIM value is less isolated from the others. 6 SUMMARY AND CONCLUSION Eight laboratories have submitted values for the emission rate of the 241Am-Be source. However while there is excellent agreement between many of the values, it is clear that the complete dataset is not consistent. This is supported by the observed χ2 value of 40.1. With the exclusion of the CIAE and LNE-LNHB values a consistent dataset is achieved with an observed χ2 value of 7.5 and a weighted mean of 2.445 × 10⁶ s–1 with an associated standard uncertainty of 0.006 × 10⁶ s–1. Both the CIAE and LNE-LNHB have since re-calculated their correction factors and derived emission rates that are in much better agreement with the other participants and which would not
16/35
Metrologia 48 (2011) Tech. Suppl. 06018
be classed as outliers. However, the changes were made after the results were circulated so cannot be included in the KCRV or degrees of equivalence. Two participants, LNMRI and NIST, used an older cross section evaluation (ENDF/B-V) to calculate the O(n,α) capture correction. After normalising their values by using the ENDF/B-VI.0 evaluation, a revised weighted mean of 2.446 × 10⁶ s–1, with an associated standard uncertainty of 0.006 × 10⁶ s–1, was obtained. The overall spread of results is a little higher than expected. The reason for the VNIIM result differing from the others is not clear and is of particular concern given that it derives from both a manganese bath and an associated particle measurement and so was obtained, in part, from a completely independent method to all the others. 7 ACKNOWLEDGEMENTS The authors would like to thank Dr Vic Lewis for initiating the exercise, Dr Horst Klein for collating and checking the participants’ reports before the evaluation, and Professor Maurice Cox for his help with the evaluation. The evaluation of the comparison was funded by the UK National Measurement System Policy Unit and was Deliverable (iv) of Project 3.4 in its 2004 to 2007 Programme for Ionising Radiation Monitoring Metrology.
17/35
Metrologia 48 (2011) Tech. Suppl. 06018
8 APPENDICES 8.1 Appendix A: Reference value and degrees of equivalence
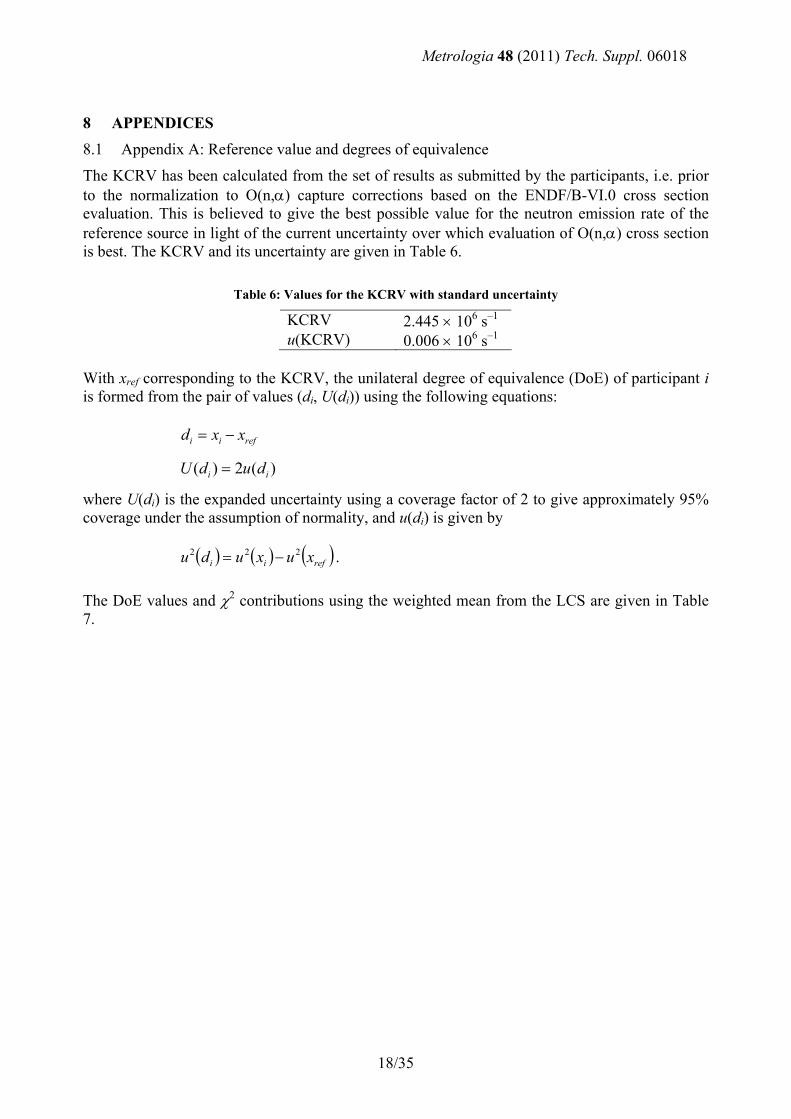
The KCRV has been calculated from the set of results as submitted by the participants, i.e. prior to the normalization to O(n,α) capture corrections based on the ENDF/B-VI.0 cross section evaluation. This is believed to give the best possible value for the neutron emission rate of the reference source in light of the current uncertainty over which evaluation of O(n,α) cross section is best. The KCRV and its uncertainty are given in Table 6.
Table 6: Values for the KCRV with standard uncertainty
KCRV 2.445 × 10⁶ s–1 u(KCRV) 0.006 × 10⁶ s–1
With xref corresponding to the KCRV, the unilateral degree of equivalence (DoE) of participant i is formed from the pair of values (di, U(di)) using the following equations:
refii xxd −=
)(2)( ii dudU =
where U(di) is the expanded uncertainty using a coverage factor of 2 to give approximately 95% coverage under the assumption of normality, and u(di) is given by
( ) ( ) ( )refii xuxudu 222 −= .
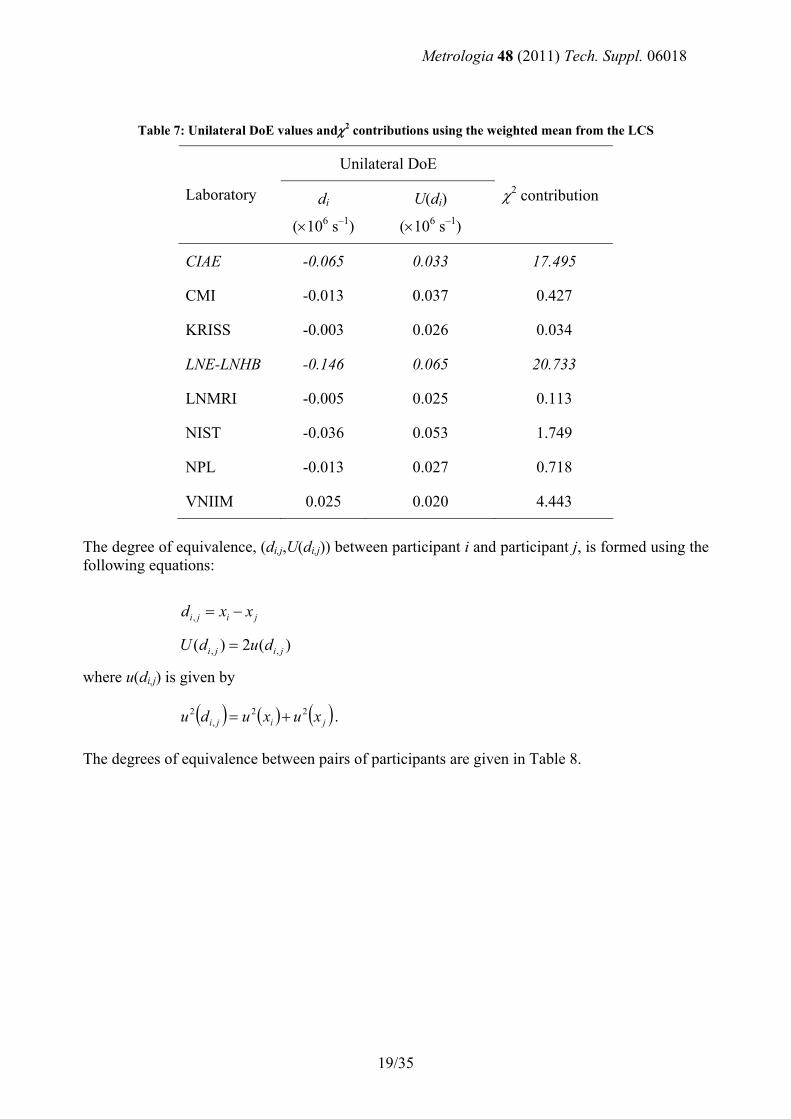
The DoE values and χ2 contributions using the weighted mean from the LCS are given in Table 7.
18/35
Metrologia 48 (2011) Tech. Suppl. 06018
19/35
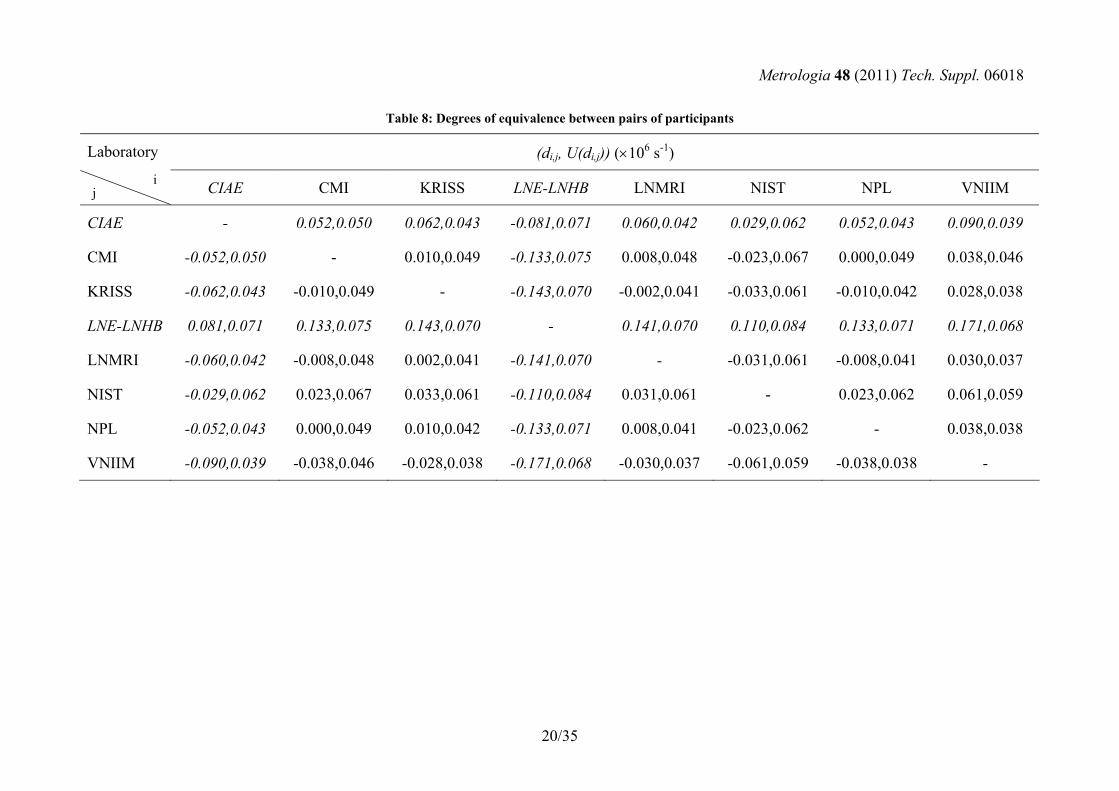
The degrees of equivalence between pairs of participants are given in Table 8.
where u(di,j) is given by
Table 7: Unilateral DoE values andχ2 contributions using the weighted mean from the LCS
Unilateral DoE
Laboratory di
(×106 s–1)
U(di)
(×106 s–1)
χ2 contribution
CIAE -0.065 0.033 17.495
CMI -0.013 0.037 0.427
KRISS -0.003 0.026 0.034
LNE-LNHB -0.146 0.065 20.733
LNMRI -0.005 0.025 0.113
NIST -0.036 0.053 1.749
NPL -0.013 0.027 0.718
VNIIM 0.025 0.020 4.443
The degree of equivalence, (di,j,U(di,j)) between participant i and participant j, is formed using the following equations:
jiji xxd −=,
)(2)( ,, jiji dudU =
( ) ( )
( jiji xuxudu 22,
2 += ).
Metrologia 48 (2011) Tech. Suppl. 06018
20/35
Laboratory (di,j, U(di,j)) (×106 s-1)
CIAE CMI KRISS LNE-LNHB LNMRI NIST NPL VNIIM
CIAE - 0.052,0.050 0.062,0.043 -0.081,0.071 0.060,0.042 0.029,0.062 0.052,0.043 0.090,0.039
CMI -0.052,0.050 - 0.010,0.049 -0.133,0.075 0.008,0.048 -0.023,0.067 0.000,0.049 0.038,0.046
KRISS -0.062,0.043 -0.010,0.049 - -0.143,0.070 -0.002,0.041 -0.033,0.061 -0.010,0.042 0.028,0.038
LNE-LNHB 0.081,0.071 0.133,0.075 0.143,0.070 - 0.141,0.070 0.110,0.084 0.133,0.071 0.171,0.068
LNMRI -0.060,0.042 -0.008,0.048 0.002,0.041 -0.141,0.070 - -0.031,0.061 -0.008,0.041 0.030,0.037
NIST -0.029,0.062 0.023,0.067 0.033,0.061 -0.110,0.084 0.031,0.061 - 0.023,0.062 0.061,0.059
NPL -0.052,0.043 0.000,0.049 0.010,0.042 -0.133,0.071 0.008,0.041 -0.023,0.062 - 0.038,0.038
VNIIM -0.090,0.039 -0.038,0.046 -0.028,0.038 -0.171,0.068 -0.030,0.037 -0.061,0.059 -0.038,0.038 -
Table 8: Degrees of equivalence between pairs of participants
i
j

Metrologia 48 (2011) Tech. Suppl. 06018
8.2 Appendix B: Uncertainty budgets reported by the participants
8.2.1 Uncertainties reported by CIAE Table 9: Component uncertainties for CIAE Mn bath measurement
Items Uncertainties (%) Type of uncertainty
(1) Correction of neutron leakage from the border walls of the bath 0.15 B
(2) Fast neutron loss correction due to oxygen and sulfur 0.30 B
(3) Correction of thermal neutrons capture in neutron source and source container 0.04 B
(4) Ratio of thermal neutron cross-section of sulfur and manganese 0.16 B
(5) Concentration measurement 0.30 B
(6) Impurity contribution 0.10 B
(7) Manganese resonance capture correction 0.10 B
(8) Efficiency measurement 0.43 B
(9) Counting statistic 0.11 A
Combined standard uncertainty 0.67
21/35
Metrologia 48 (2011) Tech. Suppl. 06018
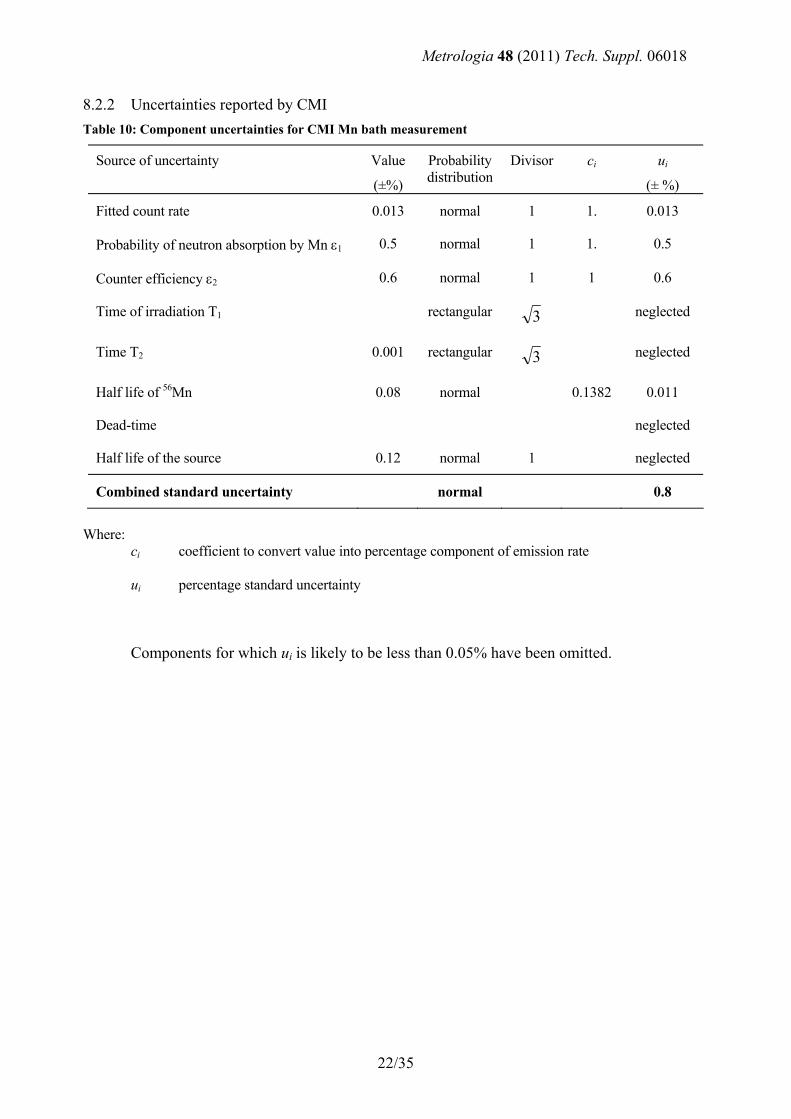
8.2.2 Uncertainties reported by CMI Table 10: Component uncertainties for CMI Mn bath measurement
Source of uncertainty Value
(±%)
Probability distribution
Divisor ci ui
(± %)
Fitted count rate 0.013 normal 1 1. 0.013
Probability of neutron absorption by Mn ε1 0.5 normal 1 1. 0.5
Counter efficiency ε2 0.6 normal 1 1 0.6
Time of irradiation T1 rectangular 3 neglected
Time T2 0.001 rectangular 3 neglected
Half life of 56Mn 0.08 normal 0.1382 0.011
Dead-time neglected
Half life of the source 0.12 normal 1 neglected
Combined standard uncertainty normal 0.8
Where: ci coefficient to convert value into percentage component of emission rate ui percentage standard uncertainty Components for which ui is likely to be less than 0.05% have been omitted.
22/35
Metrologia 48 (2011) Tech. Suppl. 06018
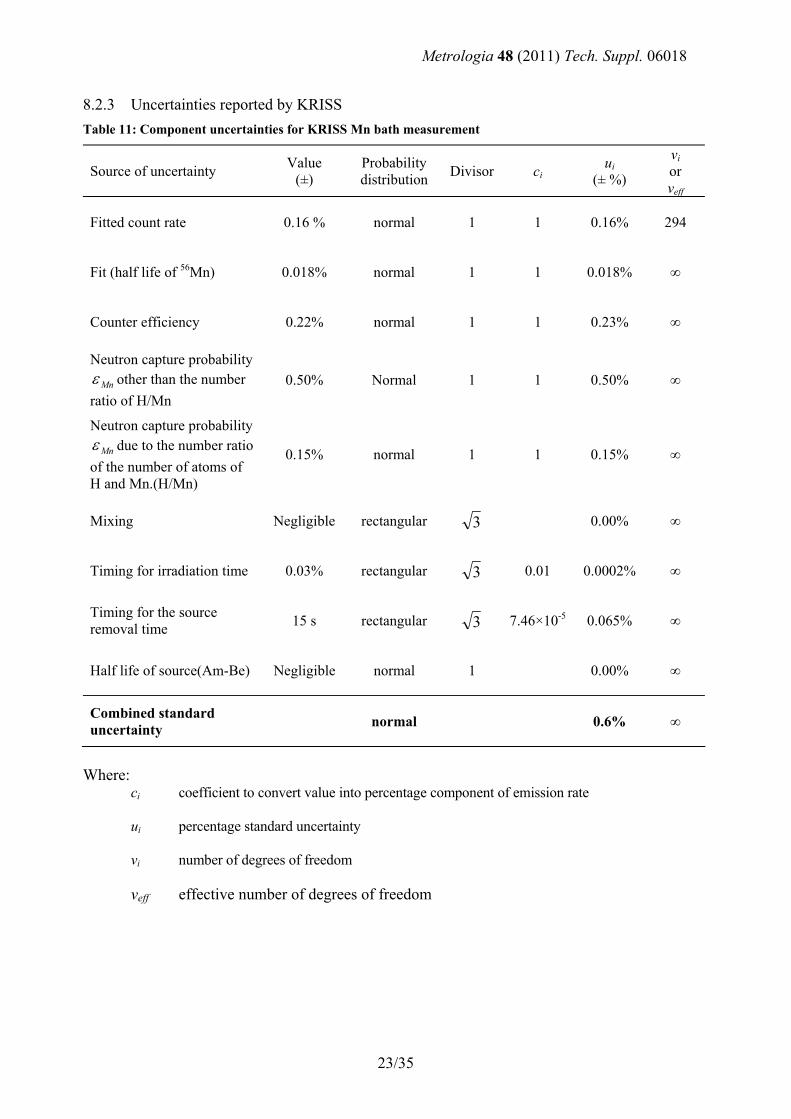
8.2.3 Uncertainties reported by KRISS Table 11: Component uncertainties for KRISS Mn bath measurement
Source of uncertainty Value (±)
Probability distribution Divisor ci
ui (± %)
νi or νeff
Fitted count rate 0.16 % normal 1 1 0.16% 294
Fit (half life of 56Mn) 0.018% normal 1 1 0.018% ∞
Counter efficiency 0.22% normal 1 1 0.23% ∞
Neutron capture probability Mnε other than the number
ratio of H/Mn 0.50% Normal 1 1 0.50% ∞
Neutron capture probability Mnε due to the number ratio
of the number of atoms of H and Mn.(H/Mn)
0.15% normal 1 1 0.15% ∞
Mixing Negligible rectangular 3 0.00% ∞
Timing for irradiation time 0.03% rectangular 3 0.01 0.0002% ∞
Timing for the source removal time 15 s rectangular 3 7.46×10⁻⁵ 0.065% ∞
Half life of source(Am-Be) Negligible normal 1 0.00% ∞
Combined standard uncertainty normal 0.6% ∞
Where: ci coefficient to convert value into percentage component of emission rate ui percentage standard uncertainty vi number of degrees of freedom veff effective number of degrees of freedom
23/35
Metrologia 48 (2011) Tech. Suppl. 06018
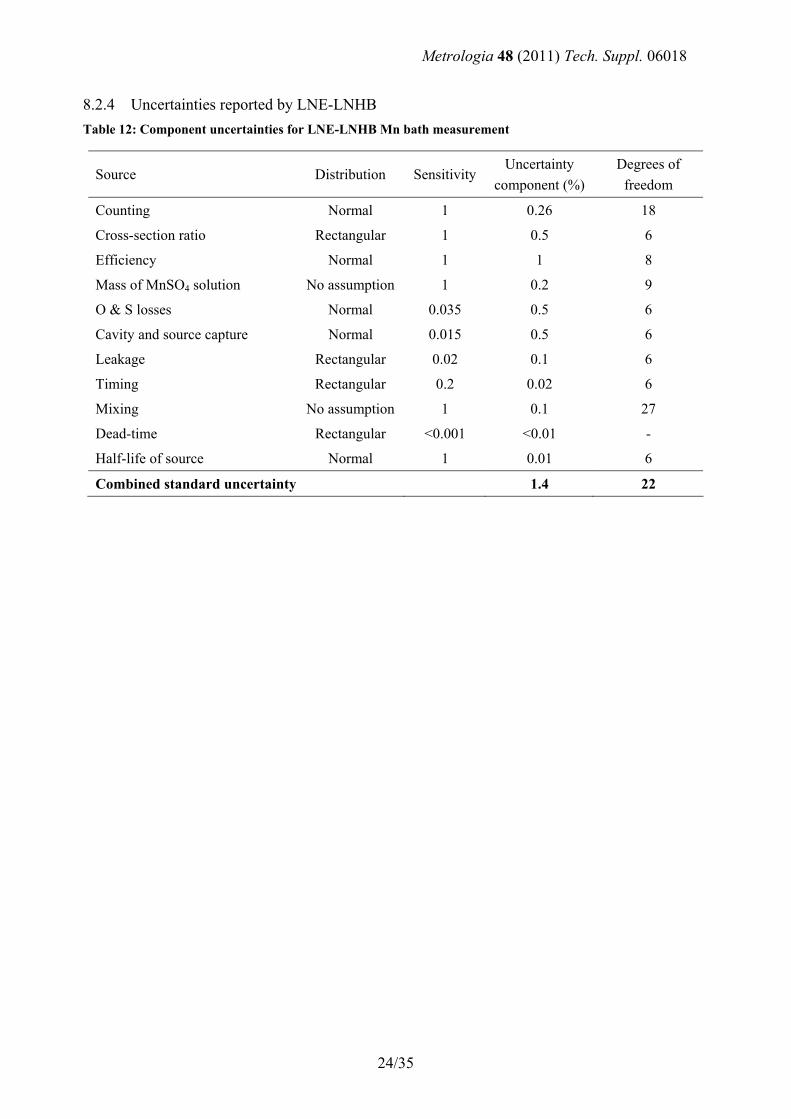
8.2.4 Uncertainties reported by LNE-LNHB Table 12: Component uncertainties for LNE-LNHB Mn bath measurement
Source Distribution Sensitivity Uncertainty
component (%) Degrees of
freedom
Counting Normal 1 0.26 18
Cross-section ratio Rectangular 1 0.5 6
Efficiency Normal 1 1 8
Mass of MnSO4 solution No assumption 1 0.2 9
O & S losses Normal 0.035 0.5 6
Cavity and source capture Normal 0.015 0.5 6
Leakage Rectangular 0.02 0.1 6
Timing Rectangular 0.2 0.02 6
Mixing No assumption 1 0.1 27
Dead-time Rectangular <0.001 <0.01 -
Half-life of source Normal 1 0.01 6
Combined standard uncertainty 1.4 22
24/35
Metrologia 48 (2011) Tech. Suppl. 06018
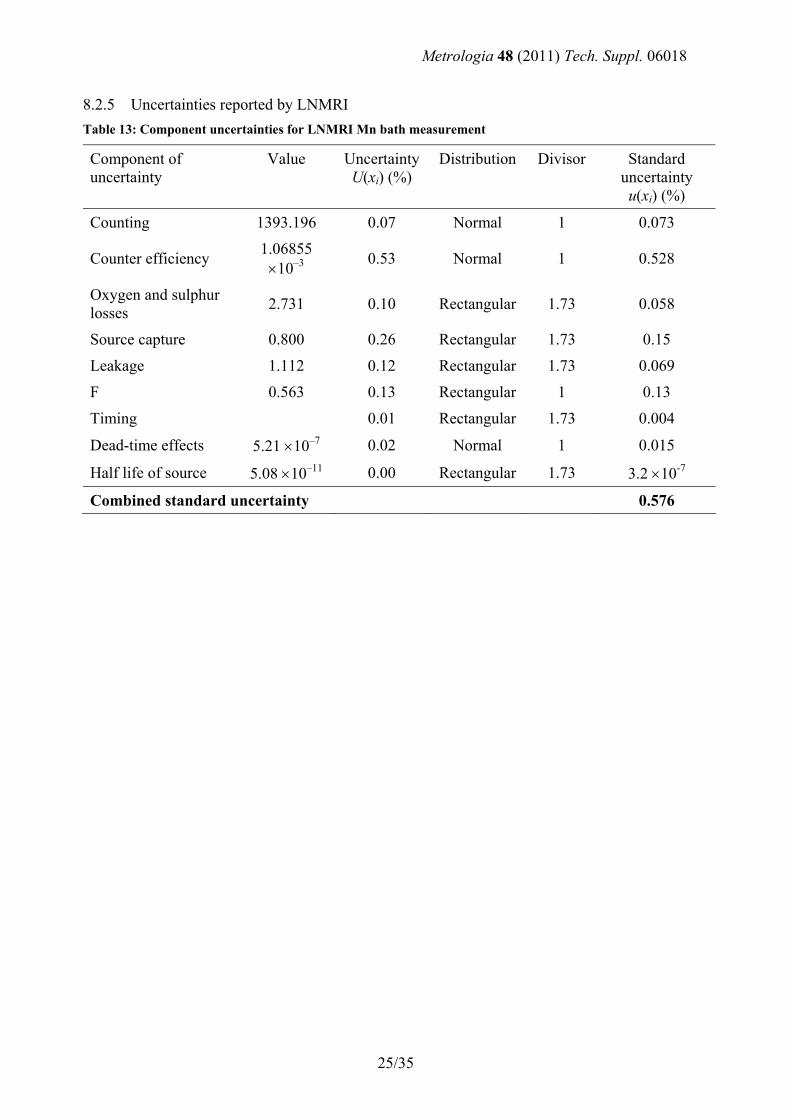
8.2.5 Uncertainties reported by LNMRI Table 13: Component uncertainties for LNMRI Mn bath measurement
Component of uncertainty
Value Uncertainty U(xi) (%)
Distribution Divisor Standard uncertainty u(xi) (%)
Counting 1393.196 0.07 Normal 1 0.073
Counter efficiency 1.06855 ×10⁻³ 0.53 Normal 1 0.528
Oxygen and sulphur losses 2.731 0.10 Rectangular 1.73 0.058
Source capture 0.800 0.26 Rectangular 1.73 0.15
Leakage 1.112 0.12 Rectangular 1.73 0.069
F 0.563 0.13 Rectangular 1 0.13
Timing 0.01 Rectangular 1.73 0.004
Dead-time effects 5.21 ×10⁻⁷ 0.02 Normal 1 0.015
Half life of source 5.08 ×10⁻¹¹ 0.00 Rectangular 1.73 3.2 ×10⁻⁷
Combined standard uncertainty 0.576
25/35
Metrologia 48 (2011) Tech. Suppl. 06018
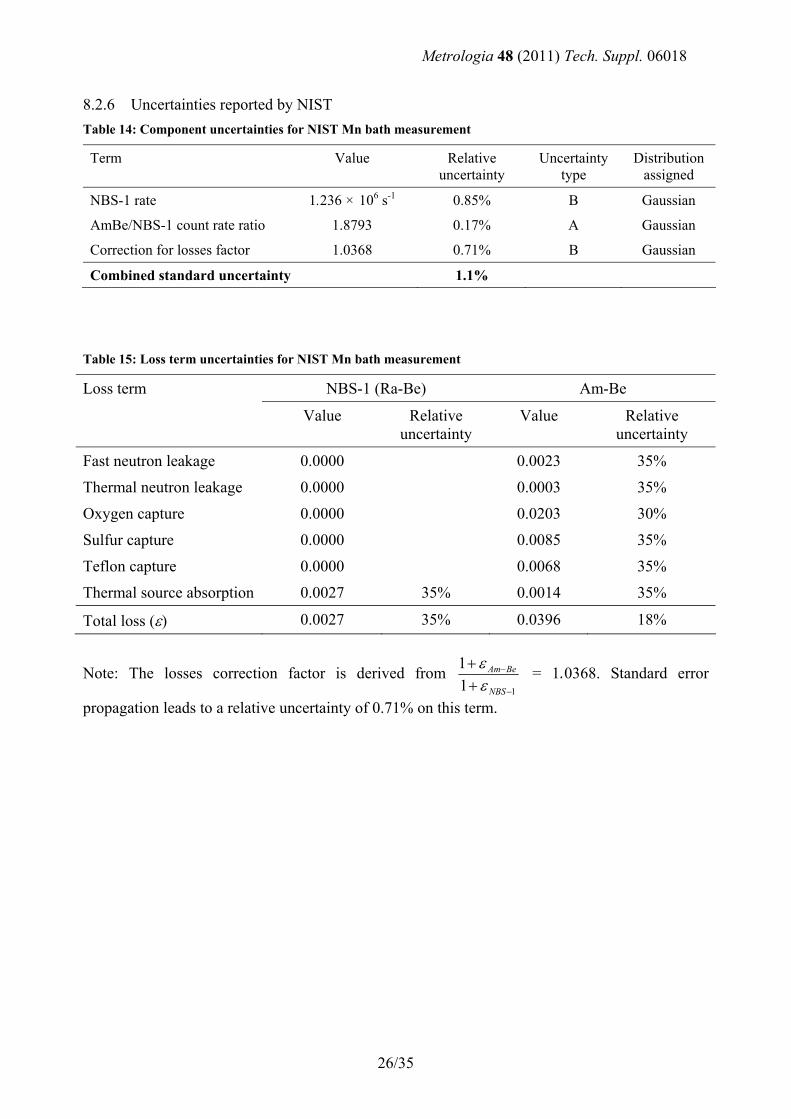
8.2.6 Uncertainties reported by NIST Table 14: Component uncertainties for NIST Mn bath measurement
Term Value Relative uncertainty
Uncertainty type
Distribution assigned
NBS-1 rate 1.236 × 10⁶ s-1 0.85% B Gaussian
AmBe/NBS-1 count rate ratio 1.8793 0.17% A Gaussian
Correction for losses factor 1.0368 0.71% B Gaussian
Combined standard uncertainty 1.1% Table 15: Loss term uncertainties for NIST Mn bath measurement
Loss term NBS-1 (Ra-Be) Am-Be
Value Relative uncertainty
Value Relative uncertainty
Fast neutron leakage 0.0000 0.0023 35%
Thermal neutron leakage 0.0000 0.0003 35%
Oxygen capture 0.0000 0.0203 30%
Sulfur capture 0.0000 0.0085 35%
Teflon capture 0.0000 0.0068 35%
Thermal source absorption 0.0027 35% 0.0014 35%
Total loss (ε) 0.0027 35% 0.0396 18%
Note: The losses correction factor is derived from 11
1−
−
++
NBS
BeAm
εε = 1.0368. Standard error
propagation leads to a relative uncertainty of 0.71% on this term.
26/35
Metrologia 48 (2011) Tech. Suppl. 06018
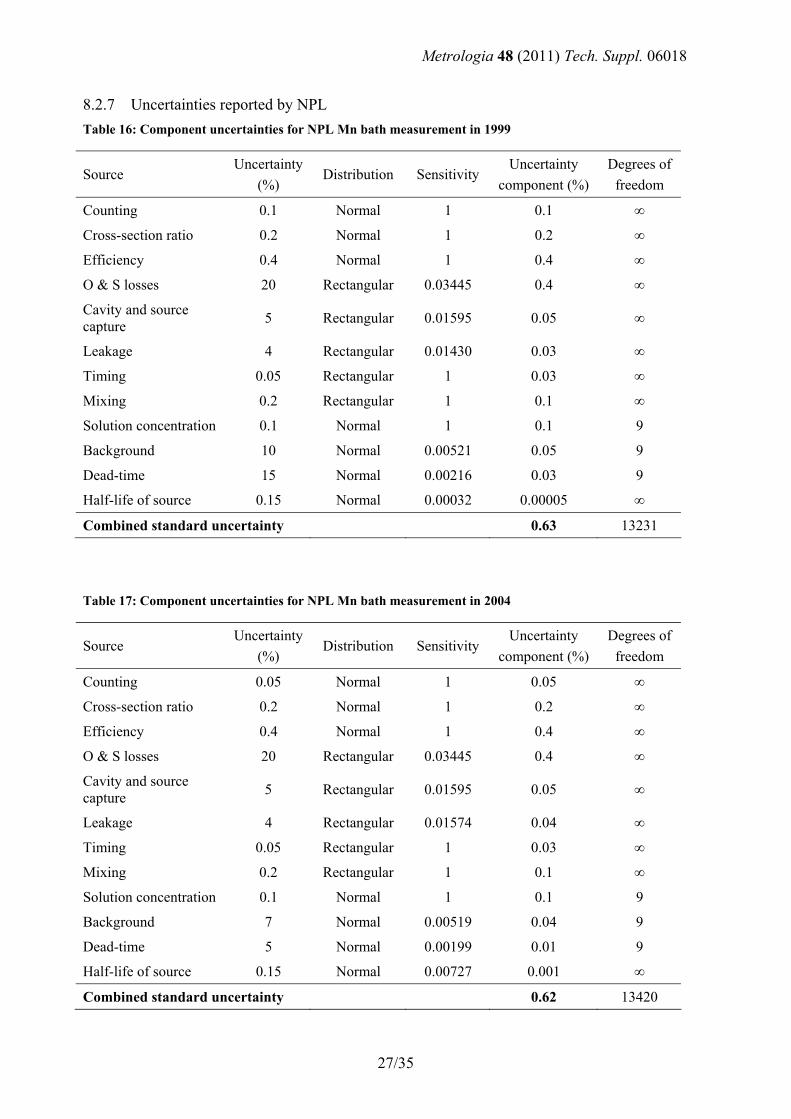
8.2.7 Uncertainties reported by NPL Table 16: Component uncertainties for NPL Mn bath measurement in 1999
Uncertainty Source
(%) Distribution Sensitivity
Uncertainty component (%)
Degrees of freedom
Counting 0.1 Normal 1 0.1 ∞
Cross-section ratio 0.2 Normal 1 0.2 ∞
Efficiency 0.4 Normal 1 0.4 ∞
O & S losses 20 Rectangular 0.03445 0.4 ∞
Cavity and source capture 5 Rectangular 0.01595 0.05 ∞
Leakage 4 Rectangular 0.01430 0.03 ∞
Timing 0.05 Rectangular 1 0.03 ∞
Mixing 0.2 Rectangular 1 0.1 ∞
Solution concentration 0.1 Normal 1 0.1 9
Background 10 Normal 0.00521 0.05 9
Dead-time 15 Normal 0.00216 0.03 9
Half-life of source 0.15 Normal 0.00032 0.00005 ∞
Combined standard uncertainty 0.63 13231
Table 17: Component uncertainties for NPL Mn bath measurement in 2004
Uncertainty Source
(%) Distribution Sensitivity
Uncertainty component (%)
Degrees of freedom
Counting 0.05 Normal 1 0.05 ∞
Cross-section ratio 0.2 Normal 1 0.2 ∞
Efficiency 0.4 Normal 1 0.4 ∞
O & S losses 20 Rectangular 0.03445 0.4 ∞
Cavity and source capture 5 Rectangular 0.01595 0.05 ∞
Leakage 4 Rectangular 0.01574 0.04 ∞
Timing 0.05 Rectangular 1 0.03 ∞
Mixing 0.2 Rectangular 1 0.1 ∞
Solution concentration 0.1 Normal 1 0.1 9
Background 7 Normal 0.00519 0.04 9
Dead-time 5 Normal 0.00199 0.01 9
Half-life of source 0.15 Normal 0.00727 0.001 ∞
Combined standard uncertainty 0.62 13420
27/35
Metrologia 48 (2011) Tech. Suppl. 06018
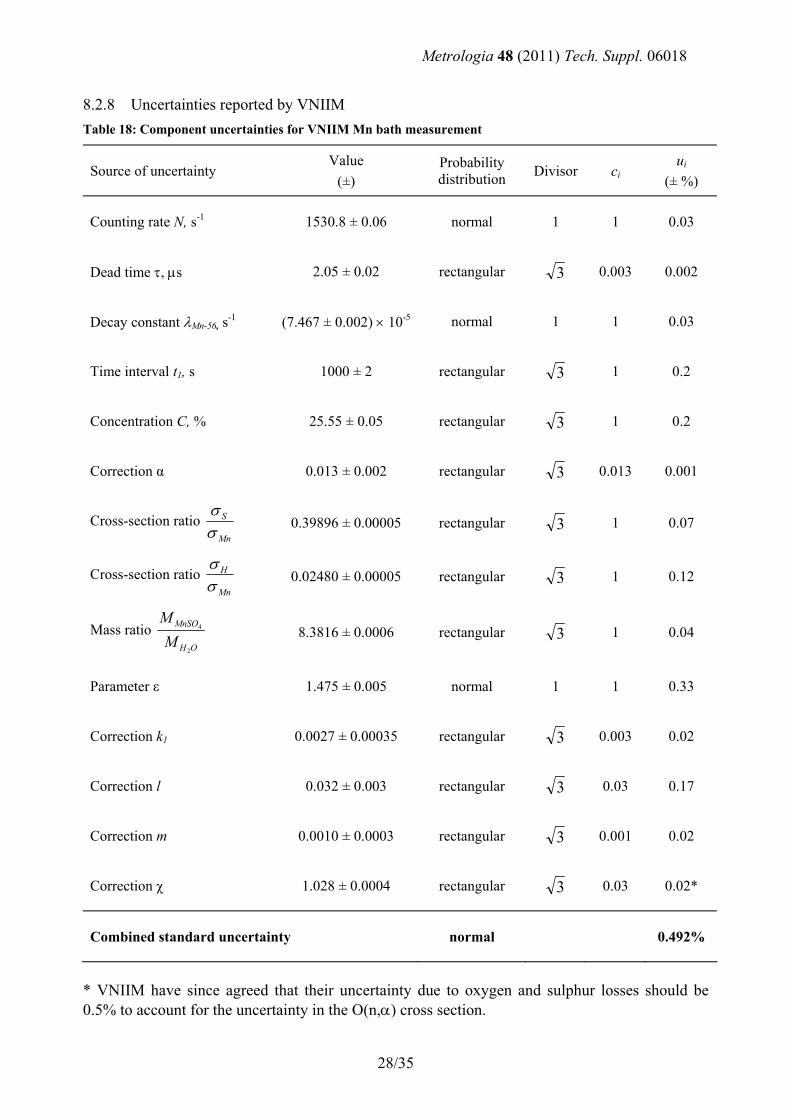
8.2.8 Uncertainties reported by VNIIM Table 18: Component uncertainties for VNIIM Mn bath measurement
Source of uncertainty Value
(±) Probability distribution Divisor ci
ui
(± %)
Counting rate N, s-1 1530.8 ± 0.06 normal 1 1 0.03
Dead time τ, μs 2.05 ± 0.02 rectangular 3 0.003 0.002
Decay constant λMn-56, s-1 (7.467 ± 0.002) × 10-5 normal 1 1 0.03
Time interval t1, s 1000 ± 2 rectangular 3 1 0.2
Concentration C, % 25.55 ± 0.05 rectangular 3 1 0.2
Correction α 0.013 ± 0.002 rectangular 3 0.013 0.001
Cross-section ratio Mn
S
σσ
0.39896 ± 0.00005 rectangular 3 1 0.07
Cross-section ratio Mn
H
σσ
0.02480 ± 0.00005 rectangular 3 1 0.12
Mass ratio OH
MnSO
MM
2
4 8.3816 ± 0.0006 rectangular 3 1 0.04
Parameter ε 1.475 ± 0.005 normal 1 1 0.33
Correction k1 0.0027 ± 0.00035 rectangular 3 0.003 0.02
Correction l 0.032 ± 0.003 rectangular 3 0.03 0.17
Correction m 0.0010 ± 0.0003 rectangular 3 0.001 0.02
Correction χ 1.028 ± 0.0004 rectangular 3 0.03 0.02*
Combined standard uncertainty normal 0.492%
* VNIIM have since agreed that their uncertainty due to oxygen and sulphur losses should be 0.5% to account for the uncertainty in the O(n,α) cross section.
28/35
Metrologia 48 (2011) Tech. Suppl. 06018
29/35
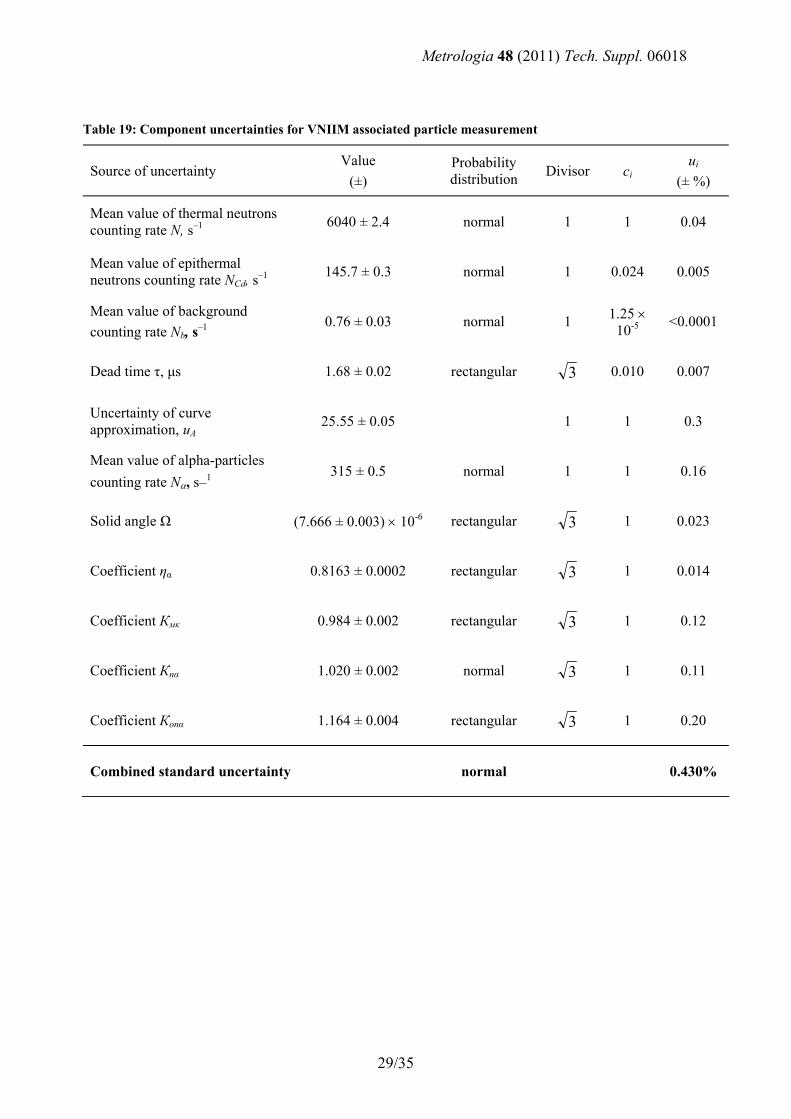
Table 19: Component uncertainties for VNIIM associated particle measurement
Source of uncertainty Value
(±) Probability distribution Divisor ci
ui
(± %)
Mean value of thermal neutrons counting rate N, s–1 6040 ± 2.4 normal 1 1 0.04
Mean value of epithermal neutrons counting rate NCd, s–1 145.7 ± 0.3 normal 1 0.024 0.005
Mean value of background counting rate Nb, s–1
0.76 ± 0.03 normal 1 1.25 × 10⁻⁵ <0.0001
Dead time τ, μs 1.68 ± 0.02 rectangular 3 0.010 0.007
Uncertainty of curve approximation, uA 25.55 ± 0.05 1 1 0.3
Mean value of alpha-particles counting rate Nα, s–1
315 ± 0.5 normal 1 1 0.16
Solid angle Ω (7.666 ± 0.003) × 10-6 rectangular 3 1 0.023
Coefficient ηα 0.8163 ± 0.0002 rectangular 3 1 0.014
Coefficient Кмк 0.984 ± 0.002 rectangular 3 1 0.12
Coefficient Кnα 1.020 ± 0.002 normal 3 1 0.11
Coefficient Кonα 1.164 ± 0.004 rectangular 3 1 0.20
Combined standard uncertainty normal 0.430%
Metrologia 48 (2011) Tech. Suppl. 06018
30/35
Source of uncertainty Probability distribution CIAE CMI KRISS LNE-LNHB LNMRI NIST NPL VNIIM
Counting normal 0.11 0.013 0.16 0.26 0.073 0.17 0.05 0.03
Cross section ratios normal 0.16 0.5 0.13** 0.2 0.18
Counter efficiency normal 0.43 0.6 0.23 1 0.53 0.4 0.33
Oxygen and sulphur losses rectangular 0.41 0.5* 0.5* 0.5 0.058 0.65 0.4 0.02#
Source and source holder capture rectangular 0.04 * * 0.5 0.15 0.28 0.05 0.02
Leakage rectangular 0.15 * * 0.1 0.069 0.08 0.04 0.17
Mixing rectangular negligible 0.1 0.1
Timing rectangular negligible 0.065 0.02 0.0043 0.03 0.2
Dead-time effects rectangular negligible <0.01 0.017 0.01 0.002
Half life of source normal negligible negligible 0.01 negligible 0.001
Concentration measurement normal/rectangular 0.30 0.15 ** 0.1 0.2
Impurity contribution rectangular 0.10 0.02
Manganese resonance rectangular 0.10 0.001
Half life of Mn-56 normal 0.011 0.018 0.03
Mass of MnSO4 solution no assumption 0.2
Background normal 0.04
Count rate of reference source normal 0.85
Combined standard uncertainty normal 0.67 0.8 0.6 1.4 0.58 1.1 0.62 0.49
Expanded uncertainty normal (k = 2) 1.3 1.6 1.2 2.8 1.2 2.2 1.2 0.98
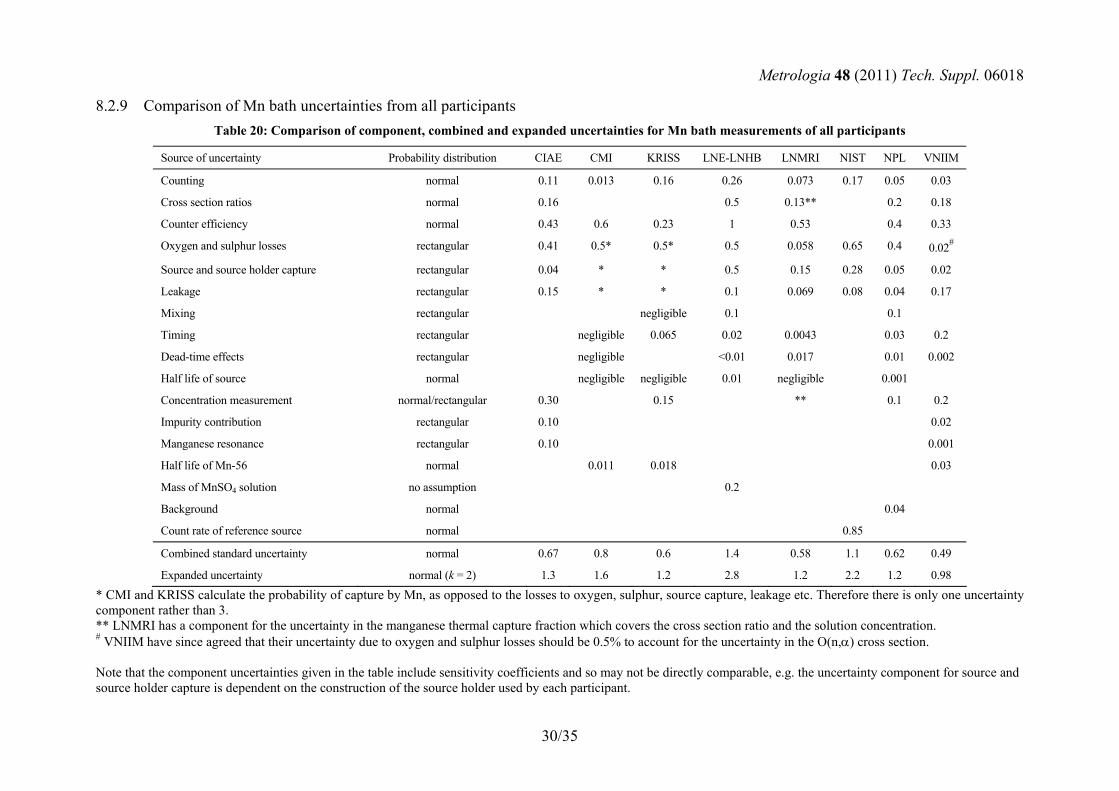
8.2.9 Comparison of Mn bath uncertainties from all participants
Table 20: Comparison of component, combined and expanded uncertainties for Mn bath measurements of all participants
* CMI and KRISS calculate the probability of capture by Mn, as opposed to the losses to oxygen, sulphur, source capture, leakage etc. Therefore there is only one uncertainty component rather than 3. ** LNMRI has a component for the uncertainty in the manganese thermal capture fraction which covers the cross section ratio and the solution concentration. # VNIIM have since agreed that their uncertainty due to oxygen and sulphur losses should be 0.5% to account for the uncertainty in the O(n,α) cross section. Note that the component uncertainties given in the table include sensitivity coefficients and so may not be directly comparable, e.g. the uncertainty component for source and source holder capture is dependent on the construction of the source holder used by each participant.
Metrologia 48 (2011) Tech. Suppl. 06018
8.3 Appendix C: Anisotropy measurements
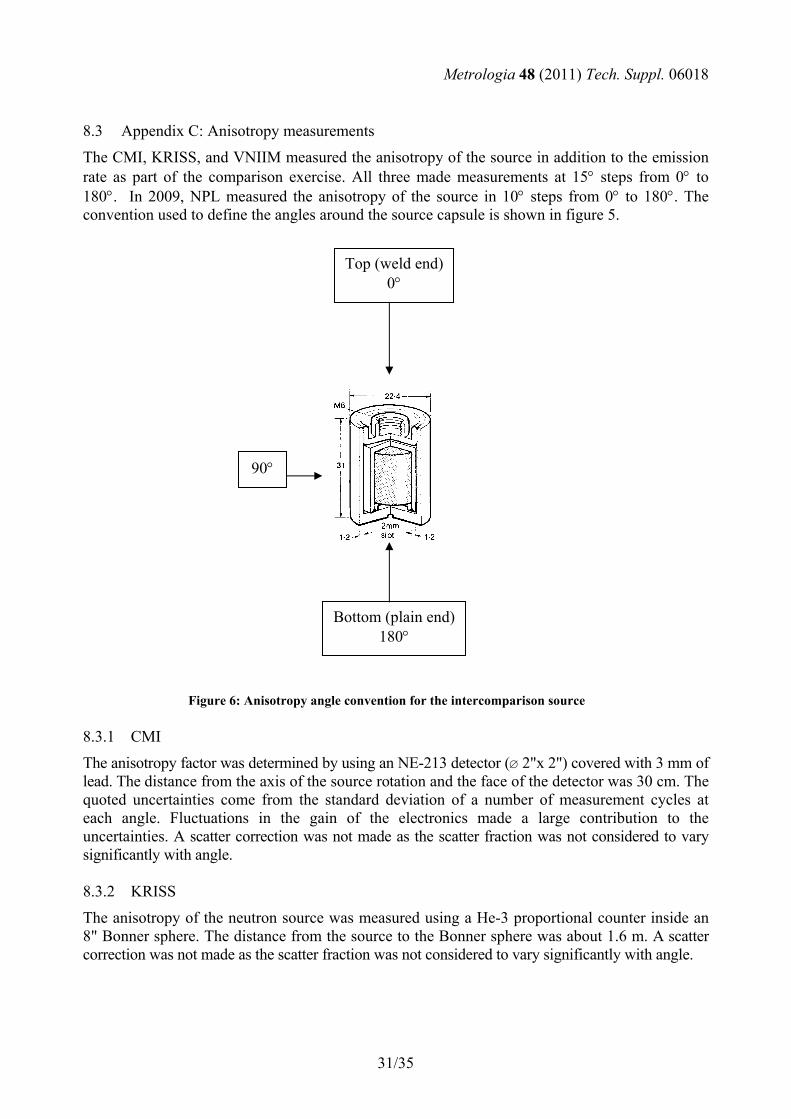
The CMI, KRISS, and VNIIM measured the anisotropy of the source in addition to the emission rate as part of the comparison exercise. All three made measurements at 15° steps from 0° to 180°. In 2009, NPL measured the anisotropy of the source in 10° steps from 0° to 180°. The convention used to define the angles around the source capsule is shown in figure 5.
Top (weld end) 0°
Bottom (plain end) 180°
90°
Figure 6: Anisotropy angle convention for the intercomparison source 8.3.1 CMI
The anisotropy factor was determined by using an NE-213 detector (∅ 2"x 2") covered with 3 mm of lead. The distance from the axis of the source rotation and the face of the detector was 30 cm. The quoted uncertainties come from the standard deviation of a number of measurement cycles at each angle. Fluctuations in the gain of the electronics made a large contribution to the uncertainties. A scatter correction was not made as the scatter fraction was not considered to vary significantly with angle. 8.3.2 KRISS
The anisotropy of the neutron source was measured using a He-3 proportional counter inside an 8" Bonner sphere. The distance from the source to the Bonner sphere was about 1.6 m. A scatter correction was not made as the scatter fraction was not considered to vary significantly with angle.
31/35
Metrologia 48 (2011) Tech. Suppl. 06018
8.3.3 VNIIM
A long counter was used to measure the anisotropy of the source at a distance of 1.5 m. The scatter contribution was measured using a boron loaded polyethylene shadow cone between the source and the detector. A minimum of 5 × 10⁵ pulses were recorded at each angle, however the uncertainties were not explicitly stated. 8.3.4 NPL
Measurements were made with both long counters available at NPL: • A De Pangher long counter designed by De Pangher and Nichols11 with a 38 mm outer
diameter BF3 tube. The one in use at NPL is one of a batch of six made by Centronic in the late 1960s12.
• A McTaggart type13, built at NPL, with a 50 mm outer diameter BF3 tube for greater efficiency. From hereon it will be referred to as the NPL long counter.
Both long counters were nominally at 2 m from the source and scatter contributions were measured using a shadow cone and subtracted. 8.3.5 Results
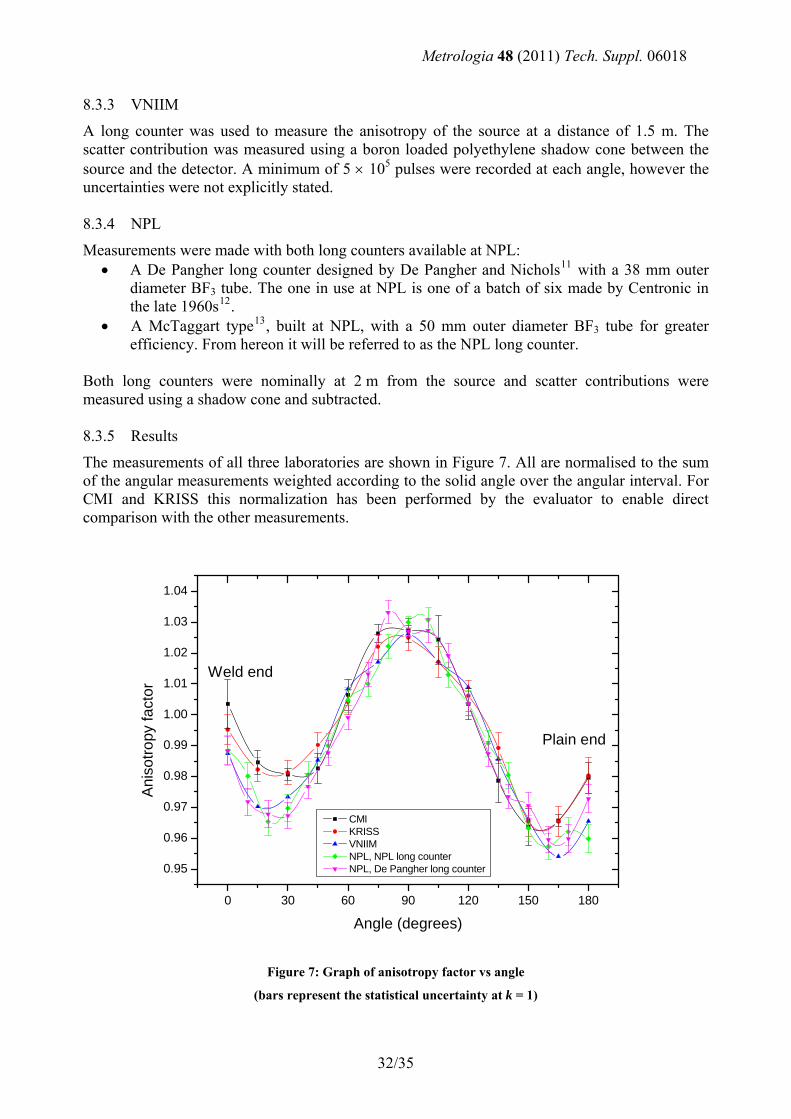
The measurements of all three laboratories are shown in Figure 7. All are normalised to the sum of the angular measurements weighted according to the solid angle over the angular interval. For CMI and KRISS this normalization has been performed by the evaluator to enable direct comparison with the other measurements.
0 30 60 90 120 150 180
0.95
0.96
0.97
0.98
0.99
1.00
1.01
1.02
1.03
1.04
Plain end
CMI KRISS VNIIM NPL, NPL long counter NPL, De Pangher long counter
Ani
sotro
py fa
ctor
Angle (degrees)
Weld end
Figure 7: Graph of anisotropy factor vs angle
(bars represent the statistical uncertainty at k = 1)
32/35
Metrologia 48 (2011) Tech. Suppl. 06018
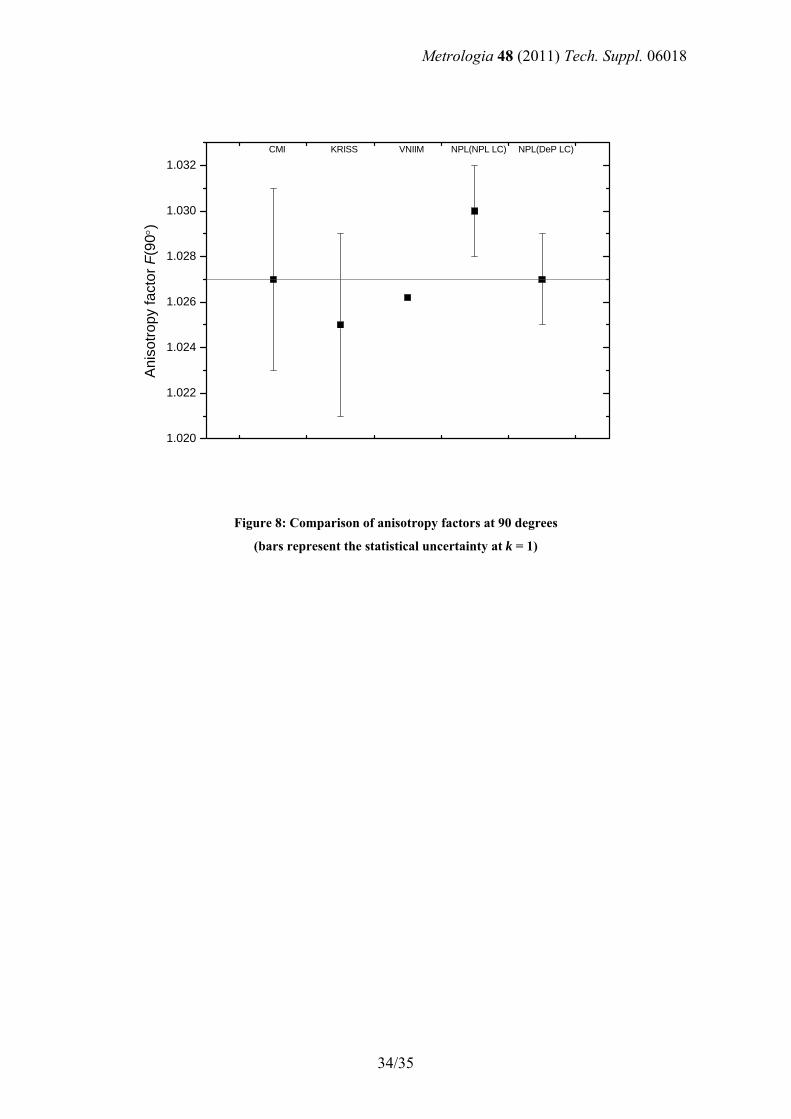
It can be seen that there is good agreement between all participants over much of the angular range. The CMI and KRISS measurements agree extremely well with each other, as do the NPL and VNIIM measurements to a lesser extent. This could be because the CMI and KRISS did not correct for room scatter whereas the NPL and VNIIM did. If the other uncorrelated contributions to the uncertainty, such as source positioning and scatter variations, were included in the plot then the agreement would be even better for all angles. For the NPL measurements the extra uncertainty component was estimated as 0.43%. The angle of most significance is 90° as this is the conventional angle for positioning any instrument or device being irradiated by the source. The anisotropy factors of each laboratory at 90°, F(90°), are given in Table 21.
Table 21: Anisotropy factors at 90° with statistical uncertainties at k = 1
F(90°) CMI 1.027 ± 0.004 KRISS 1.025 ± 0.004 VNIIM 1.0262 NPL (NPL LC) 1.030 ± 0.002 NPL (De Pangher LC) 1.027 ± 0.002
The simple mean of the measured values is 1.027 as shown in Figure 1. The measurement made with the NPL long counter is the only point whose statistical uncertainty bars do not straddle the simple mean, but if the full uncorrelated uncertainty of ± 0.005 is considered then it can be said that all points straddle the simple mean. This represents excellent agreement, although it is not unexpected given that it is only a relative fluence measurement around the source.
33/35
Metrologia 48 (2011) Tech. Suppl. 06018
1.020
1.022
1.024
1.026
1.028
1.030
1.032CMI KRISS VNIIM NPL(NPL LC) NPL(DeP LC)
Ani
sotro
py fa
ctor
F(9
0°)
Figure 8: Comparison of anisotropy factors at 90 degrees
(bars represent the statistical uncertainty at k = 1)
34/35

Metrologia 48 (2011) Tech. Suppl. 06018
9 REFERENCES 1 Naggiar V, Rapport sur la comparaison internationale de la mesure du taux d’émission de la
source de neutrons Ra-Be (α,n) du Conseil National de Recherches n° 200-1 par la méthode de ralentissement des neutrons dans une solution de sulfate de manganèse, in Recueil de Travaux du BIPM, Vol. 1, 1966-1967
(http://www.bipm.org/utils/common/pdf/rapportBIPM/1967/00.pdf) 2 Axton E J, Intercomparison of Neutron-Source Emission Rates (1979-1984), Metrologia, 23,
129-144, 1987 3 Briesmeister J F, Ed., MCNP – A General Monte Carlo N-Particle Transport Code, Version
4C (LA-13709-M), 2000 4 Schuch A L, Calibração de Monitores de Nêutrons com Moderadores e Aplicação na
Determinação de Fatores de Correção de Dosímetros de Albedo, M.Sc. thesis, IME, Rio de Janeiro, Brasil, 1978.
5 Axton E J, The thermal-neutron capture cross-sections of Mn and S, J. Nucl. Energy, 13,
No. 11, 627-628, 1986. 6 VNIIM, A brief description of the VNIIM’s facilities for measuring of neutron flux and
neutron fluence rate, CCRI(III)/01-14, presented at CCRI(III) 14th meeting in May 2001, http://www.bipm.fr/cc/CCRI(III)/Allowed/14/CCRI(III)01-14.pdf
7 Axton E J, Bardell A G, Neutron Yield from the Spontaneous Fission of 252Cf (ν ),
Metrologia, 21, 59-74, 1985 8 Cox M G, The evaluation of key comparison data: determining the largest consistent subset,
Metrologia, 44, 187-200, 2007 9 Harissopulos S, Becker H W, Hammer J W, Lagoyannis A, Rolfs C, Strieder F, Cross section
of the 13C(α,n)16O reaction: A background for the measurement of geo-neutrinos, Phys. Rev. C, 72, 062081(R), 2005
10 Giorginis G, Khryachkov V, Corcalciuc V, Kievets M, The cross section of the 16O(n,α)13C
reaction in the MeV energy range, in Proc. Int. Conf. on Nucl. Data for Sci. and Technology (ND2007), April 22-27, 2007, Nice, France, EDP Sciences, 525-528, 2008
11 De Pangher J, and Nichols L L, A Precision Long Counter for Measuring Fast Neutron Flux
Density, Pacific Northwest Laboratory Report BNWL-260, 1966. 12 Marshall T O, Some Tests on the Consistency of the Performance of Six Precision Long
Counters Intended as Secondary Standards for the Measurement of Fast Neutron Flux Densities, Health Physics 18, 427-429, 1970.
13 McTaggart M H, A Study of the Neutron Long Counter, AWRE report NR/A-1/59, 1959.
35/35


![Neutron Scattering Measurements - Indico [Home]indico.ictp.it/event/a14288/session/85/contribution/349/...1 The Gaerttner LINAC Center Neutron Scattering Measurements Professor and](https://img.pdfslide.net/doc/110x75/5acf46027f8b9a71028c787f/neutron-scattering-measurements-indico-home-the-gaerttner-linac-center-neutron.jpg)