Embed Size (px)
Citation preview
International Stormwater Best Management Practices (BMP) Database
Pollutant Category Summary:
Metals
Prepared by
Wright Water Engineers, Inc. Geosyntec Consultants, Inc.
Under Support From
Water Environment Research Foundation Federal Highway Administration
Environment and Water Resources Institute of the American Society of Civil Engineers
August 2011
International Stormwater BMP Database
Pollutant Category Summary: Metals Page ii August 2011
Disclaimer The BMP Database (“Database”) was developed as an account of work sponsored by the Water Environment Research Foundation (WERF), the American Society of Civil Engineers (ASCE)/Environmental and Water Resources Institute (EWRI), the American Public Works Association (APWA), the Federal Highway Administration (FHWA), and U.S. Environmental Protection Agency (USEPA) (collectively, the “Sponsors”). The Database is intended to provide a consistent and scientifically defensible set of data on Best Management Practice (“BMP”) designs and related performance. Although the individuals who completed the work on behalf of the Sponsors (“Project Team”) made an extensive effort to assess the quality of the data entered for consistency and accuracy, the Database information and/or any analysis results are provided on an “AS-IS” basis and use of the Database, the data information, or any apparatus, method, or process disclosed in the Database is at the user’s sole risk. The Sponsors and the Project Team disclaim all warranties and/or conditions of any kind, express or implied, including, but not limited to any warranties or conditions of title, non-infringement of a third party’s intellectual property, merchantability, satisfactory quality, or fitness for a particular purpose. The Project Team does not warrant that the functions contained in the Database will meet the user’s requirements or that the operation of the Database will be uninterrupted or error free, or that any defects in the Database will be corrected.
UNDER NO CIRCUMSTANCES, INCLUDING CLAIMS OF NEGLIGENCE, SHALL THE SPONSORS OR THE PROJECT TEAM MEMBERS BE LIABLE FOR ANY DIRECT, INDIRECT, INCIDENTAL, SPECIAL, OR CONSEQUENTIAL DAMAGES INCLUDING LOST REVENUE, PROFIT OR DATA, WHETHER IN AN ACTION IN CONTRACT OR TORT ARISING OUT OF OR RELATING TO THE USE OF OR INABILITY TO USE THE DATABASE, EVEN IF THE SPONSORS OR THE PROJECT TEAM HAVE BEEN ADVISED OF THE POSSIBILITY OF SUCH DAMAGES.
The Project Team’s tasks have not included, and will not include in the future, recommendations of one BMP type over another. However, the Project Team's tasks have included reporting on the performance characteristics of BMPs based upon the entered data and information in the Database, including peer reviewed performance assessment techniques. Use of this information by the public or private sector is beyond the Project Team’s influence or control. The intended purpose of the Database is to provide a data exchange tool that permits characterization of BMPs solely upon their measured performance using consistent protocols for measurements and reporting information.
The Project Team does not endorse any BMP over another and any assessments of performance by others should not be interpreted or reported as the recommendations of the Project Team or the Sponsors.
International Stormwater BMP Database
Pollutant Category Summary: Metals Page iii August 2011
Acknowledgements1
Report Preparation
Primary Authors: Jane Clary, Wright Water Engineers, Inc. Marc Leisenring, P.E., Geosyntec Consultants, Inc. Paul Hobson, Geosyntec Consultants, Inc.
Reviewers:
Eric Strecker, P.E. Geosyntec Consultants, Inc. Jonathan Jones, P.E., D.WRE, Wright Water Engineers, Inc. Marcus Quigley, P.E., D.WRE, Geosyntec Consultants, Inc. Shirley E. Clark, Ph.D., P.E., D.WRE, Penn State Harrisburg Robert Pitt, P.E., Ph.D., BCEE, D.WRE, University of Alabama
Research by Others WERF, 2003. Metals Removal Technologies for Urban Stormwater. Prepared by Pauline
Johnson, Robert Pitt, S. Rocky Durrans, Matilda Urrutia, and Shirley Clark. WERF Report 97-IRM-2.
Pitt, Robert and Shirley Clark, 2010. Evaluation of Biofiltration Media for Engineered Natural
Treatment Systems. Expert Panel Metals Background Report for Santa Susana Field Laboratory. Prepared for Geosyntec Consultants for The Boeing Company. May 10.
Project Information WERF Project Director: Jeff Moeller, P.E., Water Environment Research Foundation
Principal Investigators: Jonathan Jones, P.E., D.WRE, Wright Water Engineers, Inc. Eric Strecker, P.E., Geosyntec Consultants, Inc. Project Managers/Contacts for More information: Jane Clary, Project Manager, Wright Water Engineers, Inc. Marcus Quigley, P.E., D.WRE, Project Manager, Geosyntec Consultants, Inc. Project Steering Committee: Patricia A. Cazenas, Office of Project Development and Environmental Review, Federal Highway Administration (FHWA) Brian Parsons, P.E., Environmental and Water Resources Institute of American Society of Civil Engineers (EWRI-ASCE) Eric Strassler, Office of Water/Office of Science & Technology, U.S. Environmental Protection Agency (USEPA)
1 Report authors diligently incorporated review comments received on this summary; however, in some cases, suggested additional analyses beyond the scope of this broad-level summary were not completed. Additional analyses that may be explored in the future are summarized in the Recommendations section of this paper.

International Stormwater BMP Database
Pollutant Category Summary: Metals Page iv August 2011
Project Subcommittee: Michael E. Barrett, Ph.D., P.E., Center for Research in Water Resources, University of Texas Bob Carr, P.E., Water Resources Modeling, American Public Works Association (APWA) David R. Graves, Environmental Science Bureau, New York State Dept. of Transportation Gregory E. Granato, U.S. Geological Survey (USGS) Jesse Pritts, P.E., Engineering and Analysis Division, Office of Water/Office of Science & Technology, USEPA
International Stormwater BMP Database
Pollutant Category Summary: Metals Page v August 2011
Table of Contents 1 INTRODUCTION .......................................................................................................... 1
1.1 REGULATORY CONTEXT .................................................................................................. 2 1.2 TYPICAL SOURCES OF METALS IN URBAN RUNOFF ........................................................ 4 1.3 DOMINANT FORMS FOUND IN STORMWATER .............................................................. 8 1.4 CONSIDERATIONS FOR METALS SAMPLING AND ANALYSIS ......................................... 11
2 SUMMARY OF REMOVAL MECHANISMS ................................................................... 14
2.1 DOMINANT REMOVAL MECHANISMS .......................................................................... 14 2.1.1 Sedimentation ........................................................................................................... 14 2.1.2 Filtration: Inert Filtration and Sorption .................................................................... 14 2.1.3 Minor Removal Mechanisms .................................................................................... 15
2.2 CONDITIONS INFLUENCING DOMINANT REMOVAL MECHANISMS ............................. 16 2.2.1 Partitioning and Particulate Association .................................................................. 16 2.2.2 pH .............................................................................................................................. 17 2.2.3 Organic Content ........................................................................................................ 17 2.2.4 Redox ......................................................................................................................... 18
2.3 BMP DESIGN CONSIDERATIONS.................................................................................... 18 2.3.1 General Guidance ...................................................................................................... 18 2.3.2 Sedimentation BMPs ................................................................................................. 19 2.3.3 Filtration BMPs .......................................................................................................... 20 2.3.4 Swales ....................................................................................................................... 21
3 GENERAL BMP PERFORMANCE DATA CHARACTERISTICS AND AVAILABILITY ............. 22
3.1 INVENTORY OF AVAILABLE METALS DATA IN DATABASE ............................................. 22 3.2 CATEGORY-LEVEL BMP ANALYSIS FOR METALS ........................................................... 28
3.2.1 Arsenic ....................................................................................................................... 34 3.2.2 Cadmium ................................................................................................................... 36 3.2.3 Chromium .................................................................................................................. 38 3.2.4 Copper ....................................................................................................................... 40 3.2.5 Iron ............................................................................................................................ 42 3.2.6 Lead ........................................................................................................................... 44 3.2.7 Nickel ......................................................................................................................... 46 3.2.8 Zinc ............................................................................................................................ 48
4 SUMMARY OF PERFORMANCE ANALYSIS RESULTS .................................................... 50
5 RECOMMENDATIONS AND LIMITATIONS .................................................................. 53
6 REFERENCES ............................................................................................................. 54
7 ATTACHMENTS ......................................................................................................... 58

Pollutant Category Summary: Metals Page 1 August 2011
Basic Terminology (Adapted from Weiner 2008; USGS 2009)
Dissolved Metals (typically more correctly referred to as “filtered” metals). Refers to metals present in a water quality sample that has been filtered through a 0.45 µm to 2 µm filter, acidified to a pH of 2, then analyzed in a laboratory. A “true” dissolved sample requires field-filtering; however, in practice, dissolved metals samples are often filtered and acidified in a laboratory.
Total Metals. Refers to metals present in a non-filtered sample after the sample is “digested” in an acidic solution until essentially all of the metals are extracted into soluble forms for analysis.
Colloid. Particles intermediate in size between those found in solution and suspension that can remain evenly distributed without settling out.
Ion. An atom or group of atoms that carries a positive or negative electric charge as a result of having lost or gained one or more electrons.
Ligand. A molecule or ion that binds to a metal cation to form a complex. When metals bind with ligands, they are typically less toxic to aquatic life.
Sorption. Process of constituents becoming bound to particles by attractive chemical and electrostatic forces.
Ion Exchange. The reversible interchange of ions between a solid and a liquid. As water passes through a porous media, ions in the water can become attached to oppositely charged sites on media surfaces or be incorporated into the lattice structure through molecular sieving.
Flocculation. The process by which suspended colloidal or very fine particles combine into larger masses.
Redox Potential. A measure of the availability of electrons for exchange between chemical species, also known as oxidation-reduction potential. Redox conditions influence the solubility of certain metals.
Bioaccumulation. Biological sequestering of a substance at a higher concentration than that at which it occurs in the surrounding water.
POLLUTANT CATEGORY SUMMARY: METALS
1 INTRODUCTION The U.S. Environmental Protection Agency (EPA) has identified metals as the second overall leading cause of water quality impairment in the U.S. (EPA 2011b). Metals are among the most common stormwater pollutants and can be present at potentially harmful concentrations in urban runoff (Shaver et al. 2007; CWP 2003). Metals in urban stormwater originate primarily from automobile-related activities and the exposure of building materials to rain (WERF 2003). Elevated concentrations of some naturally abundant metals such as iron may be associated with erosion of soils. Atmospheric deposition of metals may also be an issue, particularly in the case of mercury, as a result of air emissions from coal-fired power plants, waste incinerators, certain manufacturing facilities, and other sources (EPA 2005). This summary provides statistical analysis for selected metals data contained in the International Stormwater BMP Database. Over 20 different metals are reported in studies in the BMP Database. The analysis data set for this technical summary was limited to the eight most frequently reported total and dissolved metals, including over 32,000 records for: • Arsenic • Cadmium • Chromium • Copper
• Iron • Lead • Nickel • Zinc
Attachment 1 to this summary provides detailed statistical evaluation of each BMP-metal
International Stormwater BMP Database
Pollutant Category Summary: Metals Page 2 August 2011
combination, and Attachment 2 provides the underlying data set used in the analysis.
1.1 Regulatory Context
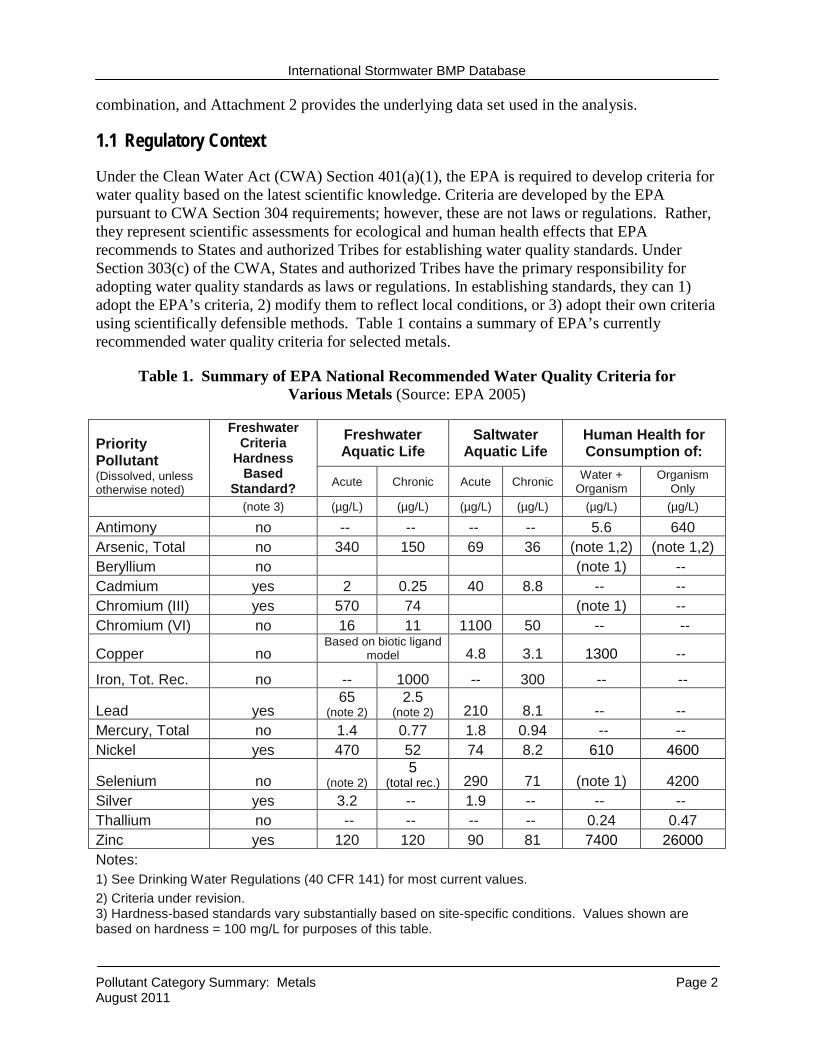
Under the Clean Water Act (CWA) Section 401(a)(1), the EPA is required to develop criteria for water quality based on the latest scientific knowledge. Criteria are developed by the EPA pursuant to CWA Section 304 requirements; however, these are not laws or regulations. Rather, they represent scientific assessments for ecological and human health effects that EPA recommends to States and authorized Tribes for establishing water quality standards. Under Section 303(c) of the CWA, States and authorized Tribes have the primary responsibility for adopting water quality standards as laws or regulations. In establishing standards, they can 1) adopt the EPA’s criteria, 2) modify them to reflect local conditions, or 3) adopt their own criteria using scientifically defensible methods. Table 1 contains a summary of EPA’s currently recommended water quality criteria for selected metals.
Table 1. Summary of EPA National Recommended Water Quality Criteria for Various Metals (Source: EPA 2005)
Priority Pollutant (Dissolved, unless otherwise noted)
Freshwater Criteria
Hardness Based
Standard?
Freshwater Aquatic Life
Saltwater Aquatic Life
Human Health for Consumption of:
Acute Chronic Acute Chronic Water + Organism
Organism Only
(note 3) (µg/L) (µg/L) (µg/L) (µg/L) (µg/L) (µg/L)
Antimony no -- -- -- -- 5.6 640 Arsenic, Total no 340 150 69 36 (note 1,2) (note 1,2) Beryllium no (note 1) -- Cadmium yes 2 0.25 40 8.8 -- -- Chromium (III) yes 570 74 (note 1) -- Chromium (VI) no 16 11 1100 50 -- --
Copper no Based on biotic ligand
model 4.8 3.1 1300 --
Iron, Tot. Rec. no -- 1000 -- 300 -- --
Lead yes 65
(note 2) 2.5
(note 2) 210 8.1 -- -- Mercury, Total no 1.4 0.77 1.8 0.94 -- -- Nickel yes 470 52 74 8.2 610 4600
Selenium no (note 2) 5
(total rec.) 290 71 (note 1) 4200 Silver yes 3.2 -- 1.9 -- -- -- Thallium no -- -- -- -- 0.24 0.47 Zinc yes 120 120 90 81 7400 26000 Notes: 1) See Drinking Water Regulations (40 CFR 141) for most current values. 2) Criteria under revision. 3) Hardness-based standards vary substantially based on site-specific conditions. Values shown are based on hardness = 100 mg/L for purposes of this table.
International Stormwater BMP Database
Pollutant Category Summary: Metals Page 3 August 2011
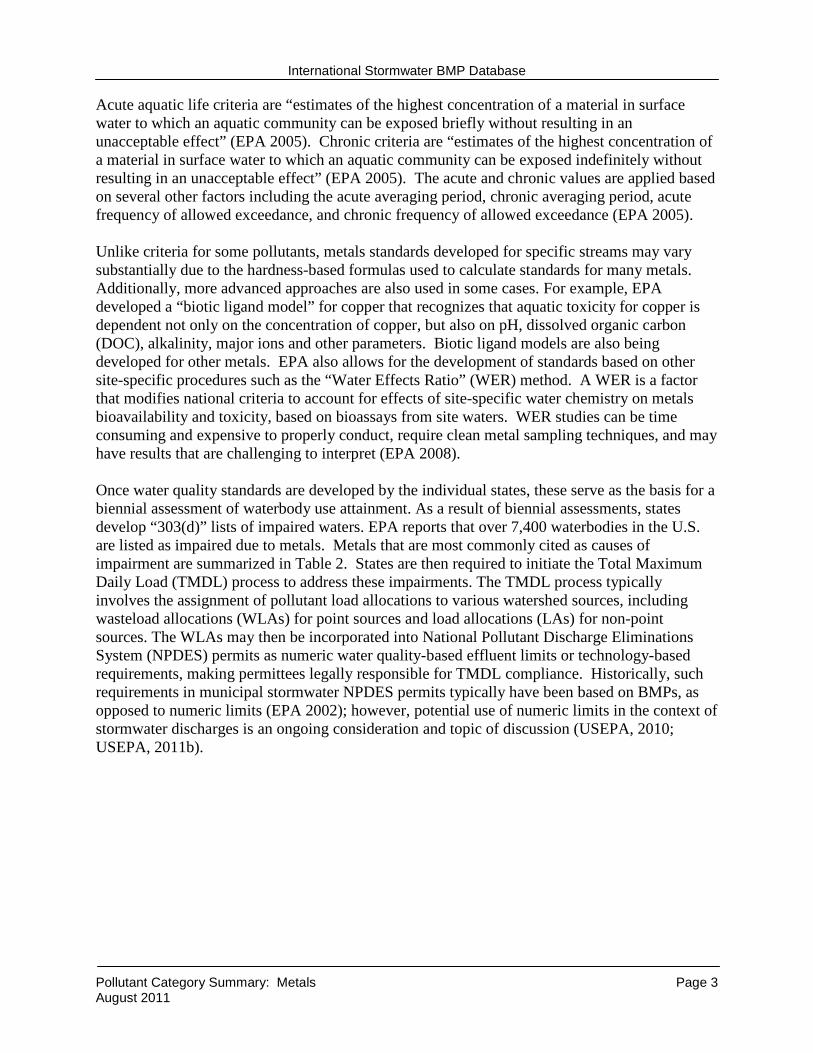
Acute aquatic life criteria are “estimates of the highest concentration of a material in surface water to which an aquatic community can be exposed briefly without resulting in an unacceptable effect” (EPA 2005). Chronic criteria are “estimates of the highest concentration of a material in surface water to which an aquatic community can be exposed indefinitely without resulting in an unacceptable effect” (EPA 2005). The acute and chronic values are applied based on several other factors including the acute averaging period, chronic averaging period, acute frequency of allowed exceedance, and chronic frequency of allowed exceedance (EPA 2005). Unlike criteria for some pollutants, metals standards developed for specific streams may vary substantially due to the hardness-based formulas used to calculate standards for many metals. Additionally, more advanced approaches are also used in some cases. For example, EPA developed a “biotic ligand model” for copper that recognizes that aquatic toxicity for copper is dependent not only on the concentration of copper, but also on pH, dissolved organic carbon (DOC), alkalinity, major ions and other parameters. Biotic ligand models are also being developed for other metals. EPA also allows for the development of standards based on other site-specific procedures such as the “Water Effects Ratio” (WER) method. A WER is a factor that modifies national criteria to account for effects of site-specific water chemistry on metals bioavailability and toxicity, based on bioassays from site waters. WER studies can be time consuming and expensive to properly conduct, require clean metal sampling techniques, and may have results that are challenging to interpret (EPA 2008). Once water quality standards are developed by the individual states, these serve as the basis for a biennial assessment of waterbody use attainment. As a result of biennial assessments, states develop “303(d)” lists of impaired waters. EPA reports that over 7,400 waterbodies in the U.S. are listed as impaired due to metals. Metals that are most commonly cited as causes of impairment are summarized in Table 2. States are then required to initiate the Total Maximum Daily Load (TMDL) process to address these impairments. The TMDL process typically involves the assignment of pollutant load allocations to various watershed sources, including wasteload allocations (WLAs) for point sources and load allocations (LAs) for non-point sources. The WLAs may then be incorporated into National Pollutant Discharge Eliminations System (NPDES) permits as numeric water quality-based effluent limits or technology-based requirements, making permittees legally responsible for TMDL compliance. Historically, such requirements in municipal stormwater NPDES permits typically have been based on BMPs, as opposed to numeric limits (EPA 2002); however, potential use of numeric limits in the context of stormwater discharges is an ongoing consideration and topic of discussion (USEPA, 2010; USEPA, 2011b).
International Stormwater BMP Database
Pollutant Category Summary: Metals Page 4 August 2011
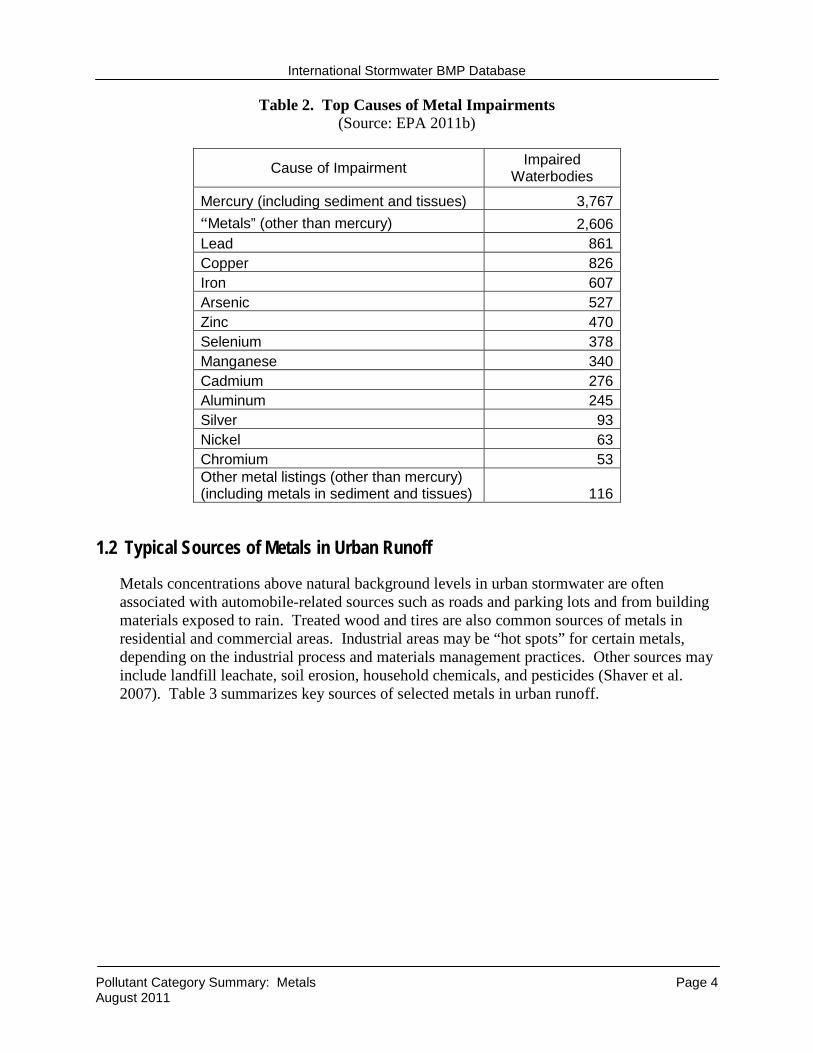
Table 2. Top Causes of Metal Impairments (Source: EPA 2011b)
Cause of Impairment
Impaired Waterbodies
Mercury (including sediment and tissues) 3,767 “Metals” (other than mercury) 2,606 Lead 861 Copper 826 Iron 607 Arsenic 527 Zinc 470 Selenium 378 Manganese 340 Cadmium 276 Aluminum 245 Silver 93 Nickel 63 Chromium 53 Other metal listings (other than mercury) (including metals in sediment and tissues) 116
1.2 Typical Sources of Metals in Urban Runoff
Metals concentrations above natural background levels in urban stormwater are often associated with automobile-related sources such as roads and parking lots and from building materials exposed to rain. Treated wood and tires are also common sources of metals in residential and commercial areas. Industrial areas may be “hot spots” for certain metals, depending on the industrial process and materials management practices. Other sources may include landfill leachate, soil erosion, household chemicals, and pesticides (Shaver et al. 2007). Table 3 summarizes key sources of selected metals in urban runoff.
International Stormwater BMP Database
Pollutant Category Summary: Metals Page 5 August 2011
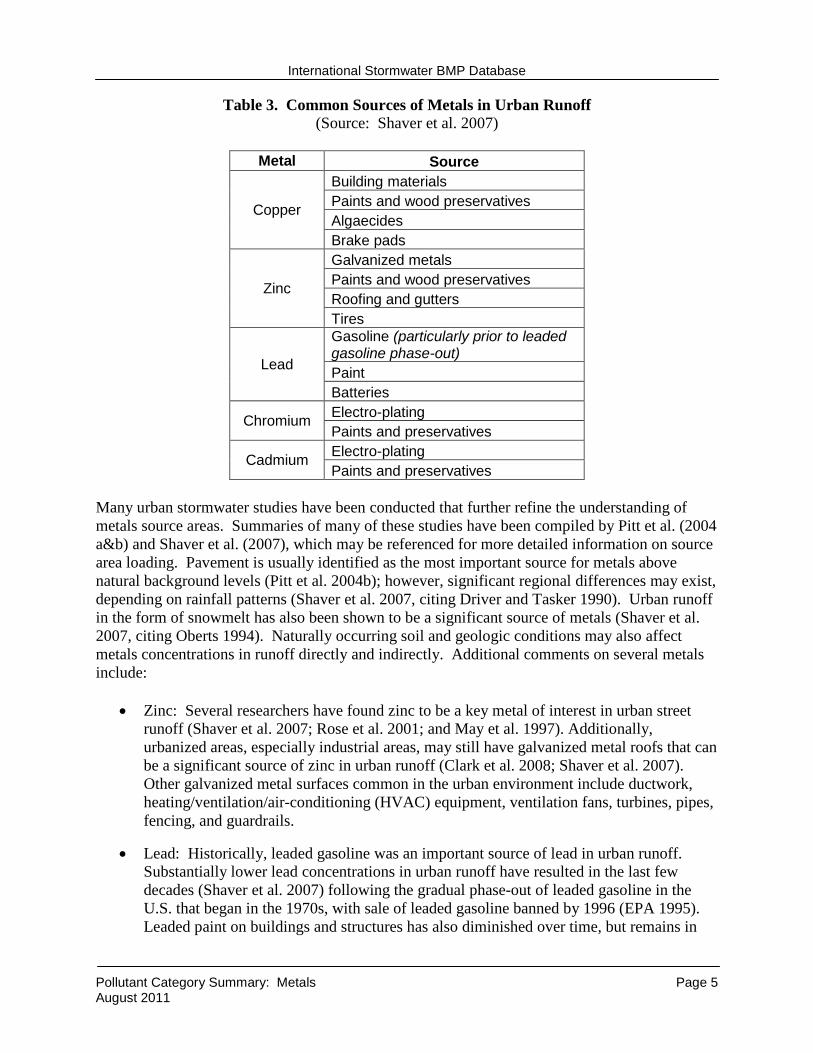
Table 3. Common Sources of Metals in Urban Runoff (Source: Shaver et al. 2007)
Metal Source
Copper
Building materials Paints and wood preservatives Algaecides Brake pads
Zinc
Galvanized metals Paints and wood preservatives Roofing and gutters Tires
Lead
Gasoline (particularly prior to leaded gasoline phase-out) Paint Batteries
Chromium Electro-plating Paints and preservatives
Cadmium Electro-plating Paints and preservatives
Many urban stormwater studies have been conducted that further refine the understanding of metals source areas. Summaries of many of these studies have been compiled by Pitt et al. (2004 a&b) and Shaver et al. (2007), which may be referenced for more detailed information on source area loading. Pavement is usually identified as the most important source for metals above natural background levels (Pitt et al. 2004b); however, significant regional differences may exist, depending on rainfall patterns (Shaver et al. 2007, citing Driver and Tasker 1990). Urban runoff in the form of snowmelt has also been shown to be a significant source of metals (Shaver et al. 2007, citing Oberts 1994). Naturally occurring soil and geologic conditions may also affect metals concentrations in runoff directly and indirectly. Additional comments on several metals include:
• Zinc: Several researchers have found zinc to be a key metal of interest in urban street runoff (Shaver et al. 2007; Rose et al. 2001; and May et al. 1997). Additionally, urbanized areas, especially industrial areas, may still have galvanized metal roofs that can be a significant source of zinc in urban runoff (Clark et al. 2008; Shaver et al. 2007). Other galvanized metal surfaces common in the urban environment include ductwork, heating/ventilation/air-conditioning (HVAC) equipment, ventilation fans, turbines, pipes, fencing, and guardrails.
• Lead: Historically, leaded gasoline was an important source of lead in urban runoff. Substantially lower lead concentrations in urban runoff have resulted in the last few decades (Shaver et al. 2007) following the gradual phase-out of leaded gasoline in the U.S. that began in the 1970s, with sale of leaded gasoline banned by 1996 (EPA 1995). Leaded paint on buildings and structures has also diminished over time, but remains in
International Stormwater BMP Database
Pollutant Category Summary: Metals Page 6 August 2011
some areas, including soils where improper leaded paint removal has occurred (WERF 2003).
• Mercury: Although mercury is not a focus of this technical summary, atmospheric fallout (primarily from fossil fuel power plants) is a key source of mercury (EPA 2005).
• Iron and Aluminum: Iron and aluminum are abundant in the earth’s crust and are often associated with naturally occurring soil and geologic conditions. High concentrations of these metals may be exacerbated where erosion is occurring in a watershed or within a stream channel.
• Selenium: High selenium concentrations may occur in groundwater and surface waters in contact with geologic materials naturally high in selenium. Although elevated selenium is not a common urban runoff issue, it is noteworthy in the context of urban stormwater management in areas where infiltration of urban stormwater may result in increased subsurface discharges to streams via underdrains or interflow.
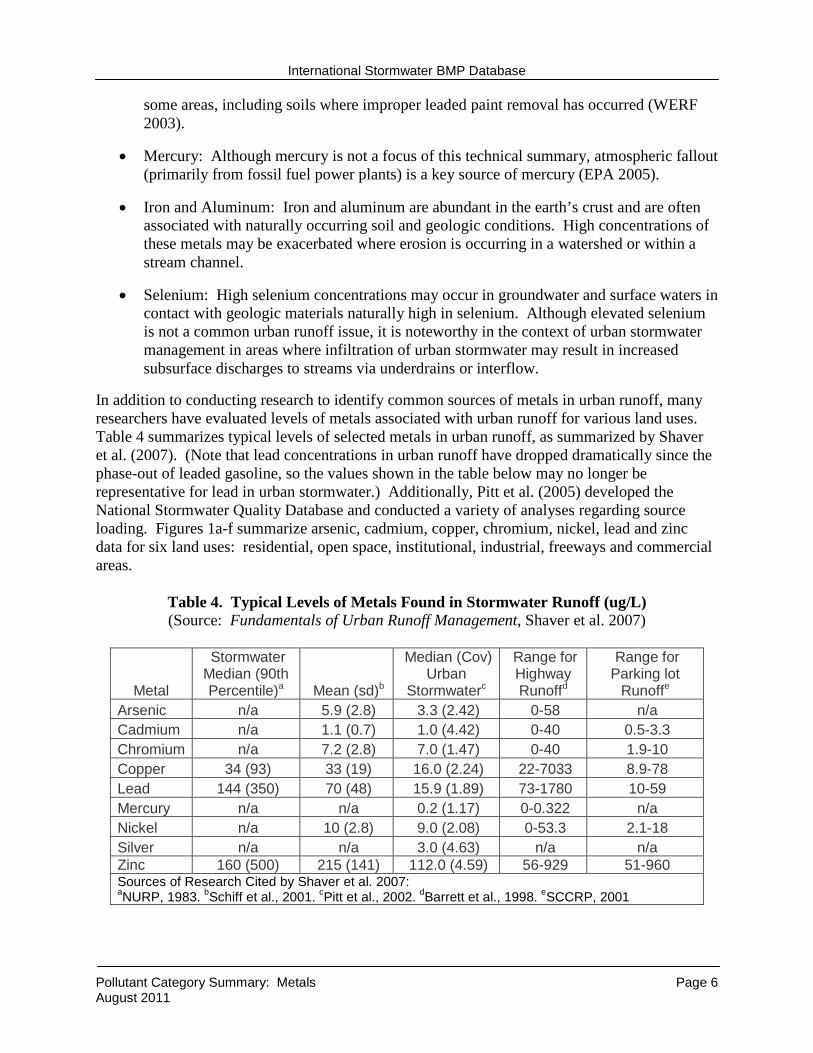
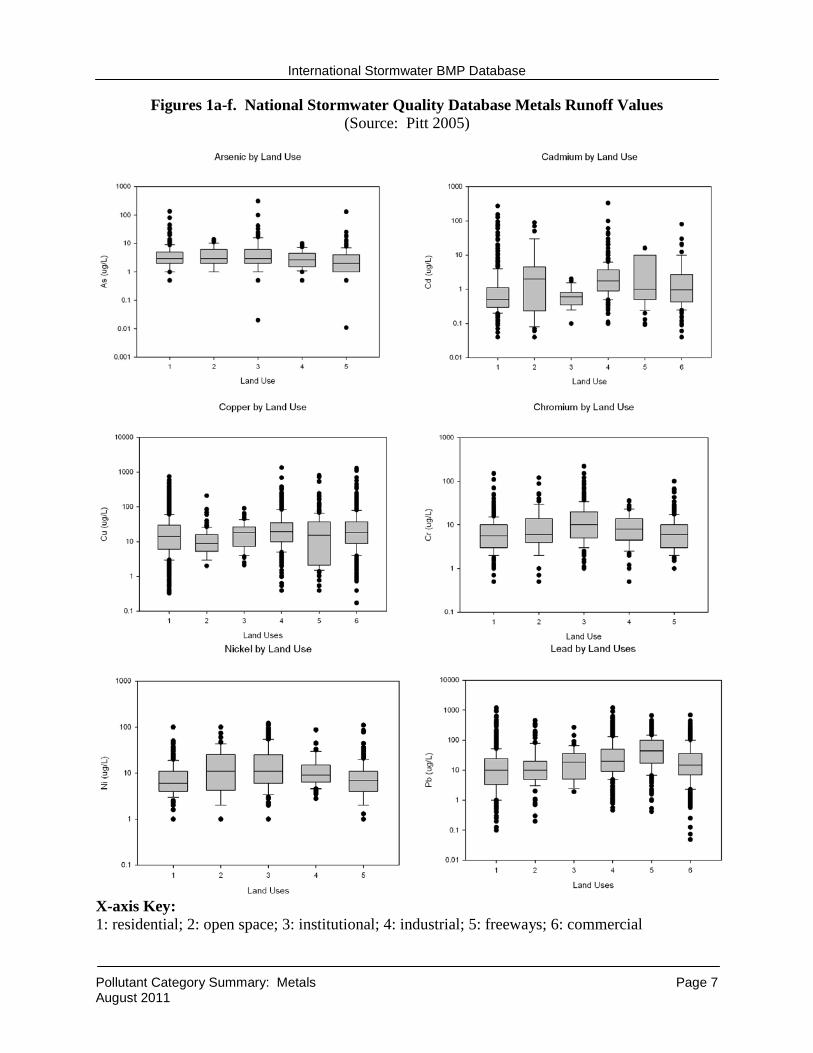
In addition to conducting research to identify common sources of metals in urban runoff, many researchers have evaluated levels of metals associated with urban runoff for various land uses. Table 4 summarizes typical levels of selected metals in urban runoff, as summarized by Shaver et al. (2007). (Note that lead concentrations in urban runoff have dropped dramatically since the phase-out of leaded gasoline, so the values shown in the table below may no longer be representative for lead in urban stormwater.) Additionally, Pitt et al. (2005) developed the National Stormwater Quality Database and conducted a variety of analyses regarding source loading. Figures 1a-f summarize arsenic, cadmium, copper, chromium, nickel, lead and zinc data for six land uses: residential, open space, institutional, industrial, freeways and commercial areas.
Table 4. Typical Levels of Metals Found in Stormwater Runoff (ug/L) (Source: Fundamentals of Urban Runoff Management, Shaver et al. 2007)
Metal
Stormwater Median (90th Percentile)a Mean (sd)b
Median (Cov) Urban
Stormwaterc
Range for Highway Runoffd
Range for Parking lot
Runoffe Arsenic n/a 5.9 (2.8) 3.3 (2.42) 0-58 n/a Cadmium n/a 1.1 (0.7) 1.0 (4.42) 0-40 0.5-3.3 Chromium n/a 7.2 (2.8) 7.0 (1.47) 0-40 1.9-10 Copper 34 (93) 33 (19) 16.0 (2.24) 22-7033 8.9-78 Lead 144 (350) 70 (48) 15.9 (1.89) 73-1780 10-59 Mercury n/a n/a 0.2 (1.17) 0-0.322 n/a Nickel n/a 10 (2.8) 9.0 (2.08) 0-53.3 2.1-18 Silver n/a n/a 3.0 (4.63) n/a n/a Zinc 160 (500) 215 (141) 112.0 (4.59) 56-929 51-960 Sources of Research Cited by Shaver et al. 2007: aNURP, 1983. bSchiff et al., 2001. cPitt et al., 2002. dBarrett et al., 1998. eSCCRP, 2001
International Stormwater BMP Database
Pollutant Category Summary: Metals Page 7 August 2011
Figures 1a-f. National Stormwater Quality Database Metals Runoff Values (Source: Pitt 2005)
X-axis Key: 1: residential; 2: open space; 3: institutional; 4: industrial; 5: freeways; 6: commercial
International Stormwater BMP Database
Pollutant Category Summary: Metals Page 8 August 2011
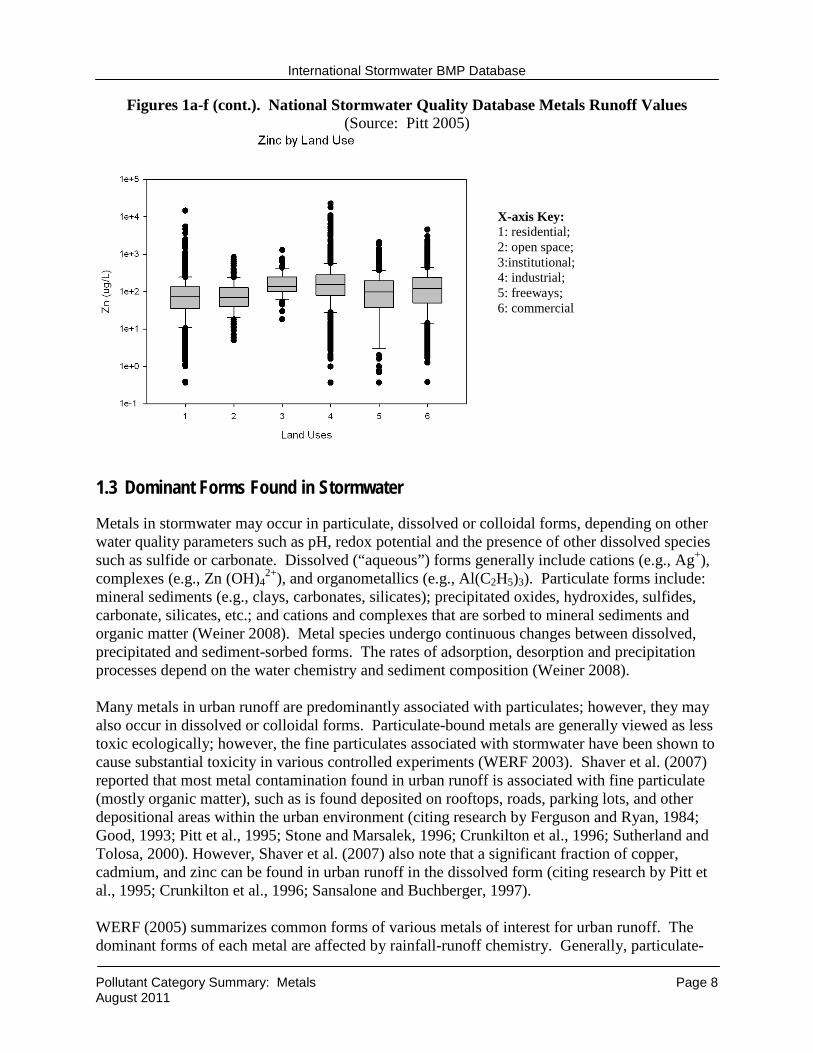
Figures 1a-f (cont.). National Stormwater Quality Database Metals Runoff Values (Source: Pitt 2005)
X-axis Key: 1: residential; 2: open space; 3:institutional; 4: industrial; 5: freeways; 6: commercial
1.3 Dominant Forms Found in Stormwater
Metals in stormwater may occur in particulate, dissolved or colloidal forms, depending on other water quality parameters such as pH, redox potential and the presence of other dissolved species such as sulfide or carbonate. Dissolved (“aqueous”) forms generally include cations (e.g., Ag+), complexes (e.g., Zn (OH)4
2+), and organometallics (e.g., Al(C2H5)3). Particulate forms include: mineral sediments (e.g., clays, carbonates, silicates); precipitated oxides, hydroxides, sulfides, carbonate, silicates, etc.; and cations and complexes that are sorbed to mineral sediments and organic matter (Weiner 2008). Metal species undergo continuous changes between dissolved, precipitated and sediment-sorbed forms. The rates of adsorption, desorption and precipitation processes depend on the water chemistry and sediment composition (Weiner 2008). Many metals in urban runoff are predominantly associated with particulates; however, they may also occur in dissolved or colloidal forms. Particulate-bound metals are generally viewed as less toxic ecologically; however, the fine particulates associated with stormwater have been shown to cause substantial toxicity in various controlled experiments (WERF 2003). Shaver et al. (2007) reported that most metal contamination found in urban runoff is associated with fine particulate (mostly organic matter), such as is found deposited on rooftops, roads, parking lots, and other depositional areas within the urban environment (citing research by Ferguson and Ryan, 1984; Good, 1993; Pitt et al., 1995; Stone and Marsalek, 1996; Crunkilton et al., 1996; Sutherland and Tolosa, 2000). However, Shaver et al. (2007) also note that a significant fraction of copper, cadmium, and zinc can be found in urban runoff in the dissolved form (citing research by Pitt et al., 1995; Crunkilton et al., 1996; Sansalone and Buchberger, 1997). WERF (2005) summarizes common forms of various metals of interest for urban runoff. The dominant forms of each metal are affected by rainfall-runoff chemistry. Generally, particulate-
International Stormwater BMP Database
Pollutant Category Summary: Metals Page 9 August 2011
bound forms are easier to remove than dissolved forms. Metals can form complexes with various ligands, most commonly including carbonate (CO3
2-), sulfate (SO42-), phosphate (PO4
3-), hydroxide (OH-), chloride (Cl-), and dissolved organic matter (DOM). Brief descriptions of common forms include:
• Arsenic: Arsenic is generally not present as an ionic species unless complexed as an oxyanion, with HAsO4
-2 and H2AsO4-1 being dominant forms in urban runoff. Speciation
of arsenic is highly dependent on pH and redox conditions.
• Cadmium: Common forms in surface waters include complexes with organics (CdDOM), carbonate (CdCO3), sulfates (CdSO4) and dissolved ionic forms (Cd2+), and to lesser degrees, CdHPO4 and CdCl+. Complexes with organics and ionic cadmium are predominant in urban rainfall-runoff, with cadmium existing predominantly in the dissolved state.
• Chromium: Common forms in rainfall-runoff include Cr(OH)3, Cr(OH)2+ and Cr(OH)21+.
Species such as Cr3+ or CrDOM are generally small (<5 percent) in comparison.
• Copper: Copper complexes with five key chemical groups: organics (CuDOM), carbonate (CuCO3), hydroxide (CuOH+), sulfates (CuSO4), and to lesser degrees, chlorides (CuCl). These complexes may be classified as particulate-bound or dissolved depending on the size. Of these, complexes with organics (CuDOM) and carbonate (CuCO3) are predominant in urban rainfall-runoff.
• Iron: Iron is generally present in two oxidation states: ferrous (Fe2+) and ferric (Fe3+). Ferric iron is dominant under oxidized conditions present in most urban runoff, whereas ferrous iron is dominant under reducing conditions, which may be present in wetlands and groundwater. Ferric iron forms stable complexes with a variety of ligands, most notably insoluble oxyhydroxides (e.g., Fe(OH)3). Insoluble complexes tend to settle or remain adsorbed to living and dead organic matter unless anoxic conditions occur. Other important compounds formed by ferric iron include ferric phosphate (FePO4), iron-humate complexes and ferric hyroxide-phosphate complexes (Kadlec and Wallace 2009). The fraction of dissolved iron tends to be low in well aerated waters with pH above 5. For dissolved iron to be present in larger fractions, reducing or anaerobic conditions are needed (Weiner 2008).
• Lead: Common and predominant species of lead are similar to copper: organics (PbDOM), carbonate (PbCO3), and to a lesser degree, hydroxide (PbOH+), and Pb2+.
• Nickel: Common forms include complexes with organics (NiDOM) and dissolved ionic forms (Ni2+), and to a lesser degree, carbonates (NiCO3), sulfates (NiSO4) and bicarbonate (NiHCO3
-1). Complexes with organics (NiDOM) and divalent Ni2+ tend to be predominant in urban rainfall-runoff.
• Zinc: Common species in runoff include complexes with organics (ZnDOM), dissolved ionic forms (Zn2+), and to lesser degrees, carbonates (ZnCO3) and sulfates (ZnSO4).
International Stormwater BMP Database
Pollutant Category Summary: Metals Page 10 August 2011
Complexes with organics (ZnDOM) and divalent Zn2+ tend to be predominant in urban rainfall-runoff.
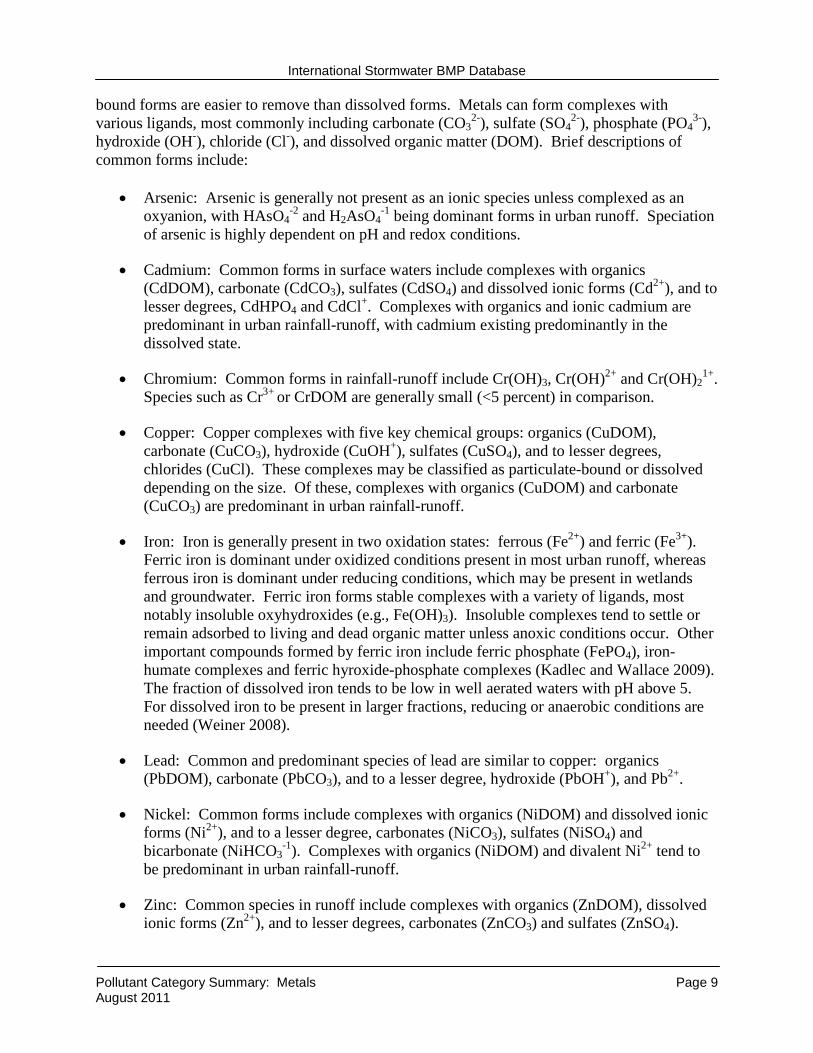
Metals association data are important for estimating the level of control that may be associated with different BMP designs. Concentrations of metals such as chromium, zinc, iron and lead can be substantially reduced by a reduction in particulates, as shown in Table 5. Copper and cadmium can also be removed to a lesser degree by removing particulates. This information is important to understand because it informs both the BMP selection process as well as expectations of potential performance. For example, WERF (2003) reports that most well-designed wet detention ponds can remove particulates down to about 1 to 5 µm, depending on rain conditions and drainage area. Smaller ponds may only be able to remove particulates down to 20 µm, but ponds cannot remove the filterable fraction (<0.45 µm) relying solely on physical processes. Long hydraulic retention times (on the order of days to weeks) are generally needed for biochemical processes such as microbially mediated transformations and plant uptake.
Table 5. Percent Reduction in Various Metals After Removal of Various Particulate Sizes (Source: WERF 2003)
Particle Size (µm)
Metal >20 >5 >1 >0.45 Cadmium 20 22 22 22 Copper 26 34 34 37 Lead 41 62 76 82 Iron 52 63 95 97 Zinc 64 70 70 72 Chromium 69 81 82 84
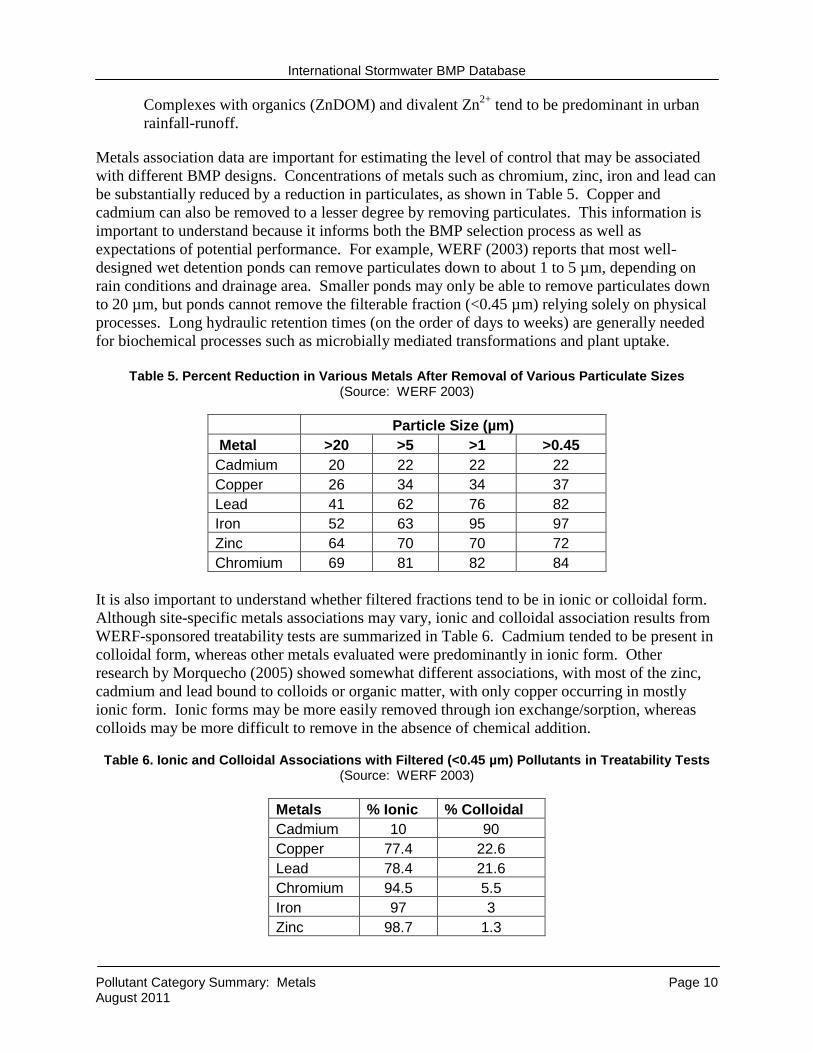
It is also important to understand whether filtered fractions tend to be in ionic or colloidal form. Although site-specific metals associations may vary, ionic and colloidal association results from WERF-sponsored treatability tests are summarized in Table 6. Cadmium tended to be present in colloidal form, whereas other metals evaluated were predominantly in ionic form. Other research by Morquecho (2005) showed somewhat different associations, with most of the zinc, cadmium and lead bound to colloids or organic matter, with only copper occurring in mostly ionic form. Ionic forms may be more easily removed through ion exchange/sorption, whereas colloids may be more difficult to remove in the absence of chemical addition.
Table 6. Ionic and Colloidal Associations with Filtered (<0.45 µm) Pollutants in Treatability Tests (Source: WERF 2003)
Metals % Ionic % Colloidal Cadmium 10 90 Copper 77.4 22.6 Lead 78.4 21.6 Chromium 94.5 5.5 Iron 97 3 Zinc 98.7 1.3
International Stormwater BMP Database
Pollutant Category Summary: Metals Page 11 August 2011
Related to the likelihood of particle association of various metals, it is also important to understand the likelihood of the metals disassociating from the particulates under ranges of pH conditions potentially present in stormwater BMPs. WERF (2003) conducted experiments to evaluate the likelihood of metals disassociating from particulates under pH conditions ranging from 4 to 11. Results showed that the metals remained strongly bound to the particulates during long exposures to the extreme pH conditions likely to occur in stormwater sediments, where particle bound metals accumulate. Zinc was an exception to this finding at a pH of 4. Other conclusions included that metals will also likely remain strongly bound to the particulates in stormwater control device sumps or detention pond sediments where particulate-bound metals are captured. Similarly, tests of filter media under aerobic and anaerobic conditions showed that metals were not mobilized under anaerobic conditions. However, it was also noted that under specific conditions, co-precipitation of metals by iron- and sulfate-reducing bacteria could occur in stormwater BMPs.
1.4 Considerations for Metals Sampling and Analysis
As discussed in Section 1.1, most water quality criteria for metals are in the dissolved form due to concerns related to aquatic toxicity. As a result, urban stormwater monitoring objectives may include characterization of dissolved metals concentrations. This can either be determined by sample analysis, or in some cases through models. While sampling and analysis for total forms of metals is relatively straightforward, there are some challenges associated with dissolved metals sampling and analysis. This section highlights some of these challenges, as included in the Urban Stormwater BMP Performance Monitoring Manual (Geosyntec and WWE 2009), which provides monitoring guidance as part of the BMP Database project. First, there are important issues to understand with regard to the widely used term “dissolved” metals, which are more appropriately characterized as “filtered” metals. Analysis results for “dissolved metals” should be reported in the context of type and nominal pore size of membrane filter used in the laboratory analysis so that the end-user can differentiate whether the metals are truly ionic or potentially colloidal and complexed. Because standard laboratory filtration methods cannot differentiate between ionic and colloidal molecules, the term “dissolved” is ambiguous and only a small proportion of the metals in a filtered water sample may be truly dissolved. Tuccillo (2006) evaluated metals concentrations in stormwater samples after sequential filtration through 5µm, 0.45 µm, and 10 kDafilters. 2
Chromium, iron and lead tended to be mostly associated with the larger size fractions (>5µm), while copper and zinc concentrations were more distributed across the particle size range. For one of the samples, 40% of the copper was associated with particles less than 10 kDa. Four out of six samples had greater than 50% of the zinc associated with particles less than 10kDa. None of the samples had a large percentage of the total metal mass in the 10 kDa to 0.45 µm range, which indicates that the use of a 0.45 µm filter for differentiating particulate from dissolved metals may be reasonably accurate in most cases. Larger filter sizes may produce significantly inaccurate estimates of dissolved metals concentrations.
Dissolved metals can partition and repartition within the time required to collect and process a stormflow sample. Dissolved metal sampling artifacts can also significantly affect measured 2 kDa = kilodalton, which is a unit of molecular weight. In this context, it refers to ultrafiltration of the sample.
International Stormwater BMP Database
Pollutant Category Summary: Metals Page 12 August 2011
concentration. Because many trace elements are associated with solids, there are more detection-limit issues with filtered metals. Other problems include sample contamination, adsorption, desorption, digestion issues, pre- and post-processing holding times, under-acidification, over-acidification, sample splitting procedural problems, and so on (Breault and Granato, 2002). Another important factor to consider with regard to the distribution of pollutants between the dissolved and particulate phases is where in the system the sample is collected. Runoff collected in pipes with little sediment will generally have a higher percentage of pollutants present in the dissolved form. Runoff collected in receiving waters will generally have a higher percentage of pollutants present in particulate form due to higher concentrations of suspended solids that act as adsorption sites for pollutants. It is difficult to determine how much of the dissolved pollutants found in storm system pipes will remain in the dissolved form when they are mixed with suspended sediments in receiving waters. As a result, it is difficult to determine the ecological significance of moderate levels of dissolved pollutants present within the conveyance system. In addition, hardness and pH values for receiving waters are often different than those for stormwater. For example, in some areas, hardness of runoff appears to increase as it travels across concrete surfaces; therefore, the chemical composition of the drainage system may also have an impact on total versus dissolved metals concentrations. Hardness and pH affect the bio-availability of metals, further complicating prediction of the ecological impact of dissolved metals. Researchers may want to consider collection of whole-water metals and related geochemical data, in addition to dissolved metals monitoring, depending on the specific objectives of the study. For example, when dissolved metals are of special interest to a project, researchers may also want to consider modeling the geochemical speciation of the metals in the runoff, in the BMP, and in the receiving water. If sediment, pH, alkalinity, major ions, hardness, and dissolved organic compounds (DOC) are sampled, models can be used to estimate metals partitioning. For example, EPA has adopted a biotic ligand model for copper, and WERF is working on biotic ligand models for nickel and other metals. On a related note, researchers conducting work in multiple locations should be aware that dissolved metals data are less transferable than whole-water metals data because of the previously discussed data quality issues, the varying geochemical conditions that will occur at a given site from storm-to-storm and season-to-season, and the varying geochemical conditions that will occur from site-to-site and region-to-region.
If loads to the receiving waters are of concern (e.g., discharge to a lake known to be a water quality limited waterbody), it may be desirable to determine total recoverable metals to assess the relative load from different sources. Total recoverable metals data can also be used to assess potential issues involving metals in sediment (Breault and Granato, 2002). Finally, if monitoring objectives and site-specific conditions require dissolved metals analysis, researchers may need to consider ultra-clean sampling procedures, depending on study objectives.
International Stormwater BMP Database
Pollutant Category Summary: Metals Page 13 August 2011
Supplemental Information on Dissolved and Total Metals Monitoring and Receiving Water Effects Modeling
Burton, G.A., and R. E. Pitt. 2002. Stormwater Effects Handbook: A Toolbox for Watershed Managers, Scientists and Engineers. Lewis Publishers. www.crcpress.com.
EPA. 1994. The Biotic Ligand Model: Technical Support Document for Its Application to the Evaluation of Water Quality Criteria for Copper. (EPA 822R03027). http://yosemite.epa.gov/water/owrccatalog.nsf/0/e693bcf79893c3e085256e23005fcd3b?OpenDocument
Granato et al. 2002. National Highway Runoff Water-Quality Data and Methodology Synthesis, Volume I--Technical issues for monitoring highway runoff and urban stormwater. FHWA-EP- 03-054. http://ma.water.usgs.gov/fhwa/fhwaep.htm
Horowitz et al. 1994. U.S. Geological Survey protocol for the collection and processing of surface-water samples for the subsequent determination of inorganic constituents in filtered water. OFR 94-539. http://pubs.er.usgs.gov/usgspubs/citfor/ofr/ofr94539?currow=6
Water Environment Research Foundation (WERF). 2004. Development of a Biotic Ligand Model for Nickel: Phase I. http://www.werf.org/AM/CustomSource/Downloads/uGetExecutiveSummary.cfm?FILE=ES-01-ECO-10T.pdf&ContentFileID=7450
International Stormwater BMP Database
Pollutant Category Summary: Metals Page 14 August 2011
2 SUMMARY OF REMOVAL MECHANISMS
2.1 Dominant Removal Mechanisms
Metals removal is a function of partitioning (particulate vs. dissolved); if dissolved (i.e., aqueous or filtered), treatability is a function of concentration and speciation, and if particulate-bound, treatability is a function of association of metals to various particle sizes. Generally, particulate-bound metals can be removed by sedimentation, filtration and coagulation-flocculation (WERF 2005). Most stormwater treatment systems are passive; therefore, sedimentation and filtration are considered dominant mechanisms. Dissolved metals can be removed from water mainly by sorption and precipitation processes. Sorption processes include adsorption, surface complexation and ion exchange. Metals complexed in aqueous solution and uncharged aqueous complexes (i.e. CuCO3) are very difficult to remove unless precipitated or advanced unit operations such as reverse osmosis are applied (WERF 2005). Some metals can form volatile metal-organic compounds in the natural environment by microbial reactions. For these, volatilization can be an important removal mechanism. Bioaccumulation in plants (“phytoremediation”) can be a useful removal mechanism. Biotransformation of metals, in which redox reactions involving bacteria can cause some metals to precipitate, has also been shown to be a removal mechanism (Weiner 2008). However, both uptake and microbially-mediated transformation processes can be slow compared to the time scale of rainfall-runoff events. As such, these are generally considered minor processes (see Section 2.1.3). 2.1.1 Sedimentation
Sedimentation of particulates is a dominant removal mechanism for particulate-bound metals. The effectiveness of sedimentation as a metals removal mechanism is a function of the association of the metal to particles of different sizes and densities in the overall distribution. A detailed discussion of sedimentation processes is provided in the BMP Database Pollutant Category Summary for Solids (Geosyntec and WWE 2011), which may be referenced for more information. 2.1.2 Filtration: Inert Filtration and Sorption
Inert filtration includes physical filtration processes, but does not encompass chemical and biological processes of complexation, precipitation, biological uptake, and others that may occur in filter media. Sorption is a general term encompassing the processes of absorption and adsorption. Of these, adsorption – the binding of aqueous species to surfaces– is the most important mechanism in the removal of metals in stormwater BMPs. Adsorption itself is a general term that encompasses the processes commonly referred to as physical adsorption, ion exchange, surface complexation, and some types of precipitation. Sorption processes are extremely complex and are influenced by a
International Stormwater BMP Database
Pollutant Category Summary: Metals Page 15 August 2011
variety of factors including pH, dissolved organic matter, carbonate concentrations, co-constituents competing for adsorption sites (e.g. magnesium, calcium, phosphorus, etc.), presence of other sorbed metal hydrates, and other factors. Discussion of adsorption models is beyond the scope of the discussion; see research by Schnoor (1996), Davis et al. (2001), Sansalone et al. (2006), and Karathanasis (1999) for more information. 2.1.3 Minor Removal Mechanisms
Several removal mechanisms that may also provide metals removal, though to a lesser degree than sedimentation and filtration, include chemical precipitation, bacterially-mediated processes, and plant uptake of metals. Chemical Precipitation Precipitation of metals is considered to be a minor removal mechanism as compared to sedimentation and sorption in typical stormwater treatment facilities. Active precipitation typically requires modification of pH and/or addition of a precipitating agent such as calcium carbonate. These are not considered to be common practices for urban stormwater management. However, precipitation may occur passively due to natural changes in water chemistry or at a micro-scale as a part of the adsorption process. For example, precipitation may occur in the pores of media such as zeolite and granular activated carbon, which are better known as sorbents (WERF, 2003). Likewise, sorption of metals onto inactive bacteria cells can be easily mistaken for bacteria-mediated precipitation (discussed below). Microbially-mediated Metals Removal Microbially-mediated metals removal includes elements of sorption and precipitation. Processes that may be important in stormwater treatment facilities include microbially-mediated precipitation, oxidation-reduction, bioaccumulation, and biosorption. Extra-cellular precipitation occurs when microorganisms produce metabolic products that are excreted and result in the immobilization of metals. Bioaccumulation refers to the active accumulation of metals by living microorganisms as part of metabolism and passive binding of metals to negatively-charged functional groups on the surface of microorganisms. Oxidation and reduction of metals by bacteria can remove soluble metals from solution; however little has been studied about the effect of this process on metals, particularly within stormwater BMPs (WERF, 2003). Plant Uptake (“Phytoremediation”) Plant uptake of dissolved metals is understood to be a function of plant type, density and contact time with water. Plant uptake of dissolved metals is believed to be minor compared to sorption. However, swale experiments summarized in WERF (2003) found that soluble metals (Cu, Cr, Pb, Zn, and Cd) were taken up by all three of the species of grass studied (Centipede, Kentucky Bluegrass, and Zoysia) after only 24 hours of contact time. Sun and Davis (2007) found plant uptake in lab-scale bioretention studies to be nearly ten times lower than sorption, but noted that greater biomass per filter volume would likely increase this ratio. Studies (Ye et al., 2001; Ye et al., 1997) have found that wetland plants tend to accumulate more copper in their roots when
International Stormwater BMP Database
Pollutant Category Summary: Metals Page 16 August 2011
iron and manganese plaque is present on roots. Sun and Davis (2007) found that the majority of metal accumulation occurs in roots. Foliage can be more easily removed from stormwater treatment facilities than roots, indicating that plants perhaps primarily provide a metals sequestering function, as opposed to removing metals from the system. Thus, the potential exists for sorbed metals to be released back into solution as roots decay.
2.2 Conditions Influencing Dominant Removal Mechanisms
This section is intended to generally identify the key characteristics and conditions that may influence the dominant removal mechanisms listed above. Because discussion of these conditions quickly becomes very complex, the discussion is limited to generalizations. These factors generally include partitioning and particulate association and speciation of the metal. As discussed in Section 1.3, speciation of metals is a function of water chemistry, including factors such as pH, redox conditions, presence of organic matter and other factors (Weiner 2008).
2.2.1 Partitioning and Particulate Association
Particle size and density are important factors in particle settling velocity as well as important factors affecting whether a particle will be removed by filtration. Therefore, particle size distribution3
and densities of influent stormwater are major factors in the overall portion of particles a BMP would be expected to remove. As discussed in Section 1.3, the fraction of metals that can be removed through sedimentation and filtration is dependent on two additional factors:
• The fraction of metals bound to particulates, and
• The fraction of particulate-bound metals associated with each particle size and density range (i.e., bin).
See Section 1.3 for a general discussion of the expected particle associations for various metals. Such associations would be expected to vary based on site-specific conditions and may vary during runoff events, with equilibrium being approached toward the end of the storm event as metals partition to entrained solids (Glenn et al. 2002). Studies of metals associations in runoff from a variety of land uses have shown varying association of metals with particulates. For example, research on highway runoff has shown that copper concentrations on solids can vary significantly from one event to another, and copper concentrations tend to increase with decreasing particle size (Sansalone and Burchberger, 1997). This is consistent with the general understanding that partitioning to particles increases with a greater specific surface area (surface area per unit volume or mass). When coupled with particle size distribution, the total contribution of the different particle size bins to metals concentration can be estimated. Studies of highway sediment have generally found that the greatest total metal mass is associated with particles larger than 75 µm (Sansalone
3 Particle size distribution refers to a list of values or mathematical expression that describes the relative amount of particles present (by volume or weight), sorted according to size (Hendricks, 2006).
International Stormwater BMP Database
Pollutant Category Summary: Metals Page 17 August 2011
and Burchberger, 1997; Sansalone and Ying, 2008), however this is heavily skewed by the mass of larger particles which would be expected to settle very quickly in stormwater conveyance and treatment systems, and would not typically be represented in a TSS sample depending on the collection method. In general, runoff from upland source areas (e.g., road surfaces) will have larger particles, but as stormwater is conveyed through the drainage system, the particle size distribution is graded towards finer particles. Consequently, the control of particles less than 75 µm is critical for effective urban stormwater treatment. Studies summarized in WERF (2003) indicate that median particle size for many urban stormwater drainage systems is typically about 30 µm and particles less than 10 µm can often make up more than 20 percent of the total filtered residue weight. With these conditions, higher metal mass may be associated with the smaller particles. 2.2.2 pH
The pH of stormwater is integrally related to speciation, partitioning and sorption processes. The pH in a stormwater treatment system is usually determined by the prevailing environmental conditions, and normally is in the range of 6 to 9 (Weiner 2008). Perhaps the most important effect of pH is its influence on the speciation of dissolved metals between the free ionic form and stable complexes. Partitioning of most metals generally favors the particulate fraction under high pH and favors the dissolved fraction under low pH (WERF, 2005). For example, a batch study on bioretention media found that little adsorption of copper occurred at pH of 4, and more than 80 percent of total copper was adsorbed at pH of 7 (Sun and Davis, 2001). Wastewater literature has shown that dissolved copper concentrations may decrease by up to three orders of magnitude as pH increases from 6 to 8 (Metcalf and Eddy, 2003). Both suggest that dissolved copper is reduced with increasing pH. Due to acidic rainfall, particularly in the eastern U.S., leaching of metals from natural and anthropogenic materials may initially occur. However, as rainfall becomes runoff the pH may increase rapidly due to contact with minerals in soils or concrete. An increase in pH and the presence of suspended solids will cause most metals to become more particulate bound. Sansalone and Ying (2008) found that metals were dominated by the particulate fraction for a concrete-paved watershed after 24 hours of quiescent retention. 2.2.3 Organic Content
The presence of biodegradable organic materials plays an important role in metals treatment (Weiner 2008). For example, the presence of humic substances promotes sorption of copper to particulates (Minton, 2005). However, the complexes that form between copper and organic material is a function of the available active sorption sites on the organic matter. Studies have shown that filter media containing peat and organic material, such as compost, provide high sorption of certain metals. Inorganic filter media with a high cation exchange capacity (e.g. zeolite) have also been shown to perform well in removing certain metals, indicating that organics are not required to remove metals via filtration (WERF, 2003). However, zeolites may need longer contact times for effective removal. Also, organic materials have multiple active sorption sites and can participate in many different types of biochemical
International Stormwater BMP Database
Pollutant Category Summary: Metals Page 18 August 2011
reactions other than sorption that can assist with metals species transformation and immobilization. 2.2.4 Redox
Redox potential is regulated by the dissolved oxygen level. Dissolved oxygen in stormwater is depleted mainly by biodegradation processes that decompose organic matter (Weiner 2008). Metals can be characterized as redox-sensitive or redox-insensitive, according to how strongly their solubility is influenced by changes in redox potential, within a range normally achievable under environmental or water treatment conditions. Redox-sensitive metals are those that can undergo changes in oxidation state (outer orbital electron structure) under common environmental or water treatment conditions, often resulting in solubility changes (typically more soluble under oxidizing conditions, but the formation of complexes also affects solubility). Redox insensitive metals do not change their oxidation state within the redox conditions common in the environment or water treatment systems (Weiner 2008). Redox-sensitive metalloids (arsenic and selenium) tend to behave the opposite of redox-sensitive metals. Redox-sensitive and insensitive metals can generally be characterized as:
• Common Redox-Sensitive Metals: Chromium, Copper, Iron, Manganese, Mercury, Molybdenum, Thallium, Uranium, Vanadium
• Common Redox-Insensitive Metals: Aluminum, Barium, Cadmium, Lead, Nickel, Zinc • Common Redox-Sensitive Metalloids: Arsenic, Selenium
Oxidizing conditions (greater than about 2 ppm of dissolved oxygen), are optimal for removal of organic materials (BOD) by biodegradation, and (when pH is high enough) precipitation of redox-sensitive metals as hydroxides and carbonates. However, redox-insensitive metals and redox-sensitive metalloids tend to be present as soluble species under oxidizing conditions. Reducing conditions (less than about 1 ppm of dissolved oxygen) and non-acid pH values are optimal for precipitation of redox-insensitive metals and redox-sensitive metalloids. In addition, because reducing conditions slow biodegradation processes markedly, organic sediments and debris accumulate, immobilizing dissolved metals by surface adsorption, as evidenced by the efficiency of wetlands in this respect.
2.3 BMP Design Considerations
2.3.1 General Guidance
For effective removal of metals, BMPs should be designed to address the characteristics of the metal(s) of interest, often requiring a treatment train approach that integrates sedimentation and filtration components for most effective removal of metals. Pitt and Clark (2010) provide these specific design recommendations based on results of extensive research related to optimization of BMP performance to remove metals to low levels:
• Design to the Pollutant of Interest: For most BMPs, treatment effectiveness varies depending on the pollutant of interest and the influent characteristics of the targeted
International Stormwater BMP Database
Pollutant Category Summary: Metals Page 19 August 2011
pollutants (e.g., filterable fraction, ionic forms, associations with different particle sizes, etc.). BMPs selections and design features should be targeted to these characteristics.
• Treatment Train: In many cases, a combination of treatment processes is needed. A treatment train incorporating different unit processes that target different pollutant characteristics can be designed as separate units dispersed throughout a drainage area, or they can be adjacent. In the cases of strict numeric discharge limits, redundancy is often necessary to provide the most robust control. In many cases, and similar to wastewater treatment facilities, an effective treatment train is composed of sedimentation unit processes followed by filtration unit processes (media filtration, infiltration through amended soils, bioretention/biofiltration devices, etc.) with the logic being to remove first the particles that will interfere with and/or shorten the life of the filtration devices.
• Sedimentation: Well-designed sedimentation practices typically are effective in removing particulates and associated particulate-bound pollutants down to approximately 5 to 10 μm for properly sized facilities (i.e., low surface overflow rates).
• Filtration/Sorption: Even though sedimentation may remove particles smaller than 10 μm, the reliable removal of pollutants and their associated particulates with diameters smaller than about 10 to 25 μm is typically accomplished using filtration techniques (such as biofiltration or bioretention BMPs), where particles as small as 1-2 μm may be removed. The removal of “dissolved” metals depends on the metal form (ionic, complexed, etc.) and on the chemical composition of the sorption/ion-exchange media.
Other treatment processes that have been shown to be effective by enhancing sedimentation include chemical precipitation and coagulation, particularly for copper, lead and zinc. Wetlands may provide additional benefits through biologically-mediated control processes (WERF 2003).
Although most metals migrate poorly through soils, infiltration of stormwater may be a concern in industrial areas that have high concentrations of dissolved metals and in areas with shallow groundwater (particularly areas with sandy soils). Amended soils have been shown to substantially reduce the migration of metals to groundwater and may enable use of infiltration in areas with sandy soils, depending on site-specific circumstances (WERF 2003).
Additional guidance on several specific BMP types follows. 2.3.2 Sedimentation BMPs
Many BMPs provide sedimentation functions, including wet ponds, dry ponds, wetlands, various manufactured devices, grass swales, and so on. Sedimentation processes are most effective for larger and denser particles. In general, BMPs with long retention times and laminar flows will provide effective sedimentation. Extensive treatability testing by WERF (2003) showed dramatic reductions in metals toxicity with increased retention times. The hydraulic retention time of water in the treatment system is important because it determines the amount of time available for settling of particles, as well as for biochemical reactions that facilitate transformation and/or removal of dissolved pollutants (Weiner 2008).
International Stormwater BMP Database
Pollutant Category Summary: Metals Page 20 August 2011
Shallow flow depths and the presence of vegetation in the flow path can also accelerate sedimentation by increasing Manning’s roughness and creating localized quiescent zones. If removal of finer particles is an objective, then longer settling times are often needed. In the case of colloids, coagulant addition may be necessary to remove particles, but may not be allowed or appropriate in all situations, depending on site-specific conditions, long-term maintenance requirements, and local regulations. 2.3.3 Filtration BMPs
Based on investigation of twelve media filter studies, WERF (2003) concluded that characterization of stormwater characteristics is important prior to selecting treatment media because the type and quantity of metals, pH, sediment, and other runoff characteristics may vary considerably between sites. Different filtration media have differing “order of preference” for removal of metals. The researchers found that removal efficiencies of various media changed with varying influent metal concentration. Media that were effective at high metals concentrations were outperformed by some media at low metals concentrations typically found in stormwater. A contact time of approximately 15 minutes is typically sufficient to remove the majority of the pollutant that the medium is capable of removing. Also, first-order rate constants computed from breakthrough curves developed from continuous flow through media tests were found to be several orders of magnitude lower than rate constants computed from batch kinetics tests, suggesting the latter should not be used for determining media treatment performance. The researchers also indicate that clogging typically begins to occur well before adsorption sites have been exhausted, which is a concern particularly for granular media where surface filtration dominates as compared to fibrous media where depth filtration dominates (WERF, 2003). WERF (2003) also tested upflow filter columns to evaluate whether an upflow filter design increases the time before clogging and improves overall treatment performance. As compared to typical downflow filters, upflow columns provided greater control of hydraulic residence times (i.e., less short-circuiting) and reduced clogging of the media by solids. A concern with media filters, in general, and particularly upflow filters is the potential for the media to become anaerobic. Studies on the effect of anaerobiosis on metal retention by filter systems have indicated that metals are not significantly mobilized from filter systems under anaerobic conditions. Critical source areas such as industrial sites may particularly benefit from use of specially designed (optimized) sorption/filtration media (WERF 2003). Extensive research by Pitt and Clark (2010) focused on optimization of media for removal of copper, cadmium, lead and other pollutants at an industrial site with numeric effluent permit limits and resulted in these conclusions:
• Media mixtures perform more consistently under a broader range of conditions than single-media designs. The mixtures capitalize on the pollutant removal strengths of their components, while providing other components that may address the weaknesses (such as the release of cations in large concentrations during ion exchange).
• Media mixtures that are most robust (longest run times before clogging, with moderate flow rates and suitable contact times for pollutant removal) are:
International Stormwater BMP Database
Pollutant Category Summary: Metals Page 21 August 2011
o Rhyolite sand, surface-modified zeolite (SMZ), and granular activated carbon
(GAC) mixture (blended mixture) and the Rhyolite sand, SMZ, GAC-Peat Moss mixture (blended mixture). They had very similar performance attributes. The added peat provided some additional benefits for metal reductions at high flow rates. The GAC in these mixtures (when mixed with the other components) also provided better control for a number of other constituents, including nitrates.
o Site filter sand-GAC-site Zeolite (layered) clogged earlier, but possibly would have fewer exceedances overall. The drawback to the layering of the filter components is the change in flow rate and contact time.
o In general, a media mix with 30-35% sand, 20-30% zeolite (including a portion
with surface modification for increased ion exchange capacity), and 30% GAC provided a good balance between hydraulic capacity and treatment effectiveness.
• All of the media tested had very high levels (approaching 90%) of removals of particulates, even down to very small particle sizes (as small as 3 μm), with concurrent good removals of pollutants strongly associated with the particulates (such as for total aluminum, iron, and lead).
• Maintenance by scraping the surface layers of most of the media was only partially effective at restoring the flow through rate, with improved flow rates lasting for only short durations. Surface media removal was only somewhat more effective than simply scraping the media surface, again with improvements not lasting long. The lack of substantial flow rate recovery indicates that penetration of small solids is occurring below the media surface to depths where surface maintenance practices do not extend. It is expected that vegetation in a biofilter, with underlying media mixtures, will provide longer run times before clogging than biofilters without vegetation.
When selecting a filtration media, it is important to carefully weigh the benefits of metals reduction achieved against potential for clogging and other effects like changes in pH (WERF 2003). 2.3.4 Swales
Grass swales can reduce metal concentrations through a combination of sedimentation and infiltration through the soil, and biological uptake. WERF (2003) concluded that the hydraulic characteristics of grass swales appear to be more important than grass species for removing metals from stormwater during single storm events. Because of the potentials for both sediment deposition and scouring, swales can have a positive or negative influence on water quality, depending on whether scour of previously deposited materials occurs. Long term performance, taking into account the benefits of infiltration, has shown significant metal retention in swale systems. Use of amended soils may help to improve infiltration along swales in some areas. Optimization of vegetated swales involves consideration of permissible velocity, slope, infiltration rate, grass selection, channel shape/size and maintenance. Designs that maximize
International Stormwater BMP Database
Pollutant Category Summary: Metals Page 22 August 2011
hydraulic residence time for sedimentation, while preserving infiltration and biological uptake pathways, are beneficial for metals removal (WERF 2003). Research focused on various plant species providing phytoremediation concluded that any grass added to the surface of a swale system would represent a positive influence on metal uptake. Species resilient to drought and nutritionally frugal may be particularly good choices (WERF 2003). 3 GENERAL BMP PERFORMANCE DATA CHARACTERISTICS AND
AVAILABILITY
3.1 Inventory of Available Metals Data in Database
As of January 2011, the BMP Database contained over 73,000 records for metals. Screening of the metals data set was completed to narrow the analysis data set to metals with adequate sample populations considered appropriate for analysis. Representative data screening included exclusion of base flow samples from BMP studies, exclusion of grab samples for BMPs without permanent pools, exclusion of studies with a gross imbalance in the number of inflow and outflow sample results, and exclusion of studies with fewer than three runoff event mean concentration (EMC) inflow and outflow results for the constituent of interest. Additionally, analysis was not conducted for BMP categories with less than three BMP studies or for non-structural BMPs. The screened data set contained over 32,000 records. Categorical performance evaluations were conducted for all of the major BMP categories and the most common metals observed in urban stormwater, including arsenic, cadmium, chromium, copper, iron, lead, nickel, and zinc. The bioretention data set was relatively limited for metals data, so this BMP type was only included in the total copper, iron and zinc analysis. Nonetheless, several individual studies have relatively strong data sets for other metals that researchers may choose to review on an individual BMP basis. Similarly, the porous pavement, wetland channel and wetland basin data sets were also limited for most metals, typically with three to five studies (corresponding to approximately 30-60 storm events per category). (Performance analysis for individual studies can be obtained from the on-line BMP Database search tool at www.bmpdatabase.org, which returns PDF summaries of performance for individual BMPs.)
Table 7a-d summarizes studies and individual data points by BMP category and measurement type, following basic data screening. As shown in the tables, some BMP categories are well represented in the database, while others are not. For BMP categories without permanent pools, these data points were restricted to EMC data. For BMPs with permanent pools (e.g., retention ponds and wetland basins) where the variability in effluent concentrations would be expected to be lower, grab samples were also allowed and averaged to represent the storm event. While BMP sampling protocols recommend lagging effluent samples according to the estimated hydraulic residence time within a BMP, this may not always be practical for a given BMP or sampling event. Also, for BMPs with permanent pools, the influent and effluent samples may not necessarily represent the same storm event, depending on the size of the storm relative to the permanent pool volume.
International Stormwater BMP Database
Pollutant Category Summary: Metals Page 23 August 2011
In Table 7a-d below, the term “manufactured device” is listed as a BMP category. Manufactured devices included in the BMP Database incorporate a broad range of unit treatment processes that may result in widely varying performance for individual devices within this broad category. For example, some manufactured devices rely on hydrodynamic gravitational separation only, some provide filtration, others provide peak attenuation, and some provide a treatment train of multiple unit processes. The “manufactured device” category summarized in this document provides only a gross characterization of the range of performance provided by this overly broad category. More refined analysis is required based on finer segmentation by unit treatment processes in order to draw conclusions for a particular type of device. (Such analysis was beyond the scope of this technical summary, but may be conducted in the future.) As a result of updates to the database in 2010, each manufactured device is now characterized according to primary, secondary and tertiary unit treatment processes in place for the device, so additional unit process-based analysis can be conducted independently, if desired. Three “filter”, three “porous pavement” and two “wetland basin” BMP categories are included in Table 7a-d. As shown in the table, the number of studies for many constituents is very limited for these BMP sub-classes. While the performance of these BMP sub-classes may differ, the limited number of data points does not allow for a robust analysis of statistical differences. Therefore, these BMP sub-classes were lumped into the three parent BMP categories of “media filter,” “porous pavement” and “wetland basin.” Again, as more studies are received that include these sub-classes of BMPs, then it may be appropriate to analyze these sub-classes separately. Finally, four porous pavement studies and two grass swale studies utilized a reference watershed approach to characterize the influent concentrations. The analysis presented here assumes the reference watershed effluent was representative of the influent concentrations to these BMPs; therefore, the reference outflows were included in the data sets representing inflow to the BMPs. Several other BMP sub-classes included in the database were not analyzed due to limited data sets.
International Stormwater BMP Database
Pollutant Category Summary: Metals Page 24 August 2011
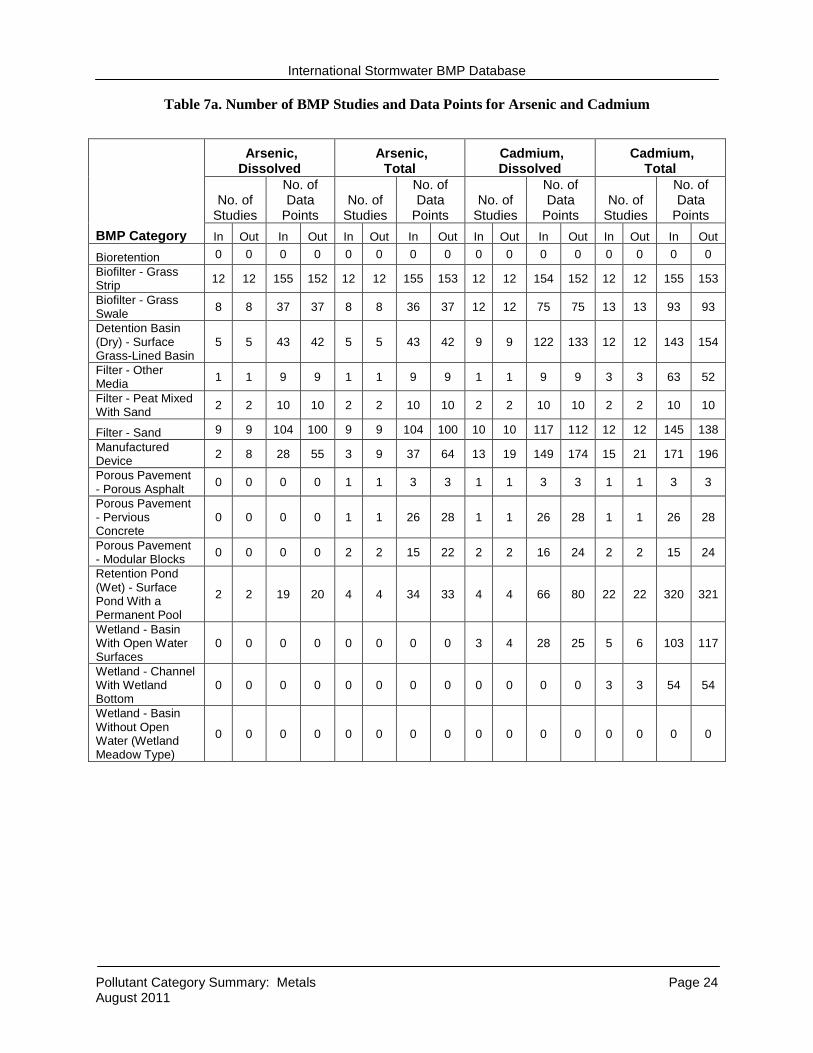
Table 7a. Number of BMP Studies and Data Points for Arsenic and Cadmium
BMP Category
Arsenic, Dissolved
Arsenic, Total
Cadmium, Dissolved
Cadmium, Total
No. of Studies
No. of Data
Points No. of
Studies
No. of Data
Points No. of
Studies
No. of Data
Points No. of
Studies
No. of Data
Points In Out In Out In Out In Out In Out In Out In Out In Out
Bioretention 0 0 0 0 0 0 0 0 0 0 0 0 0 0 0 0 Biofilter - Grass Strip 12 12 155 152 12 12 155 153 12 12 154 152 12 12 155 153
Biofilter - Grass Swale 8 8 37 37 8 8 36 37 12 12 75 75 13 13 93 93
Detention Basin (Dry) - Surface Grass-Lined Basin
5 5 43 42 5 5 43 42 9 9 122 133 12 12 143 154
Filter - Other Media 1 1 9 9 1 1 9 9 1 1 9 9 3 3 63 52
Filter - Peat Mixed With Sand 2 2 10 10 2 2 10 10 2 2 10 10 2 2 10 10
Filter - Sand 9 9 104 100 9 9 104 100 10 10 117 112 12 12 145 138 Manufactured Device 2 8 28 55 3 9 37 64 13 19 149 174 15 21 171 196
Porous Pavement - Porous Asphalt 0 0 0 0 1 1 3 3 1 1 3 3 1 1 3 3
Porous Pavement - Pervious Concrete
0 0 0 0 1 1 26 28 1 1 26 28 1 1 26 28
Porous Pavement - Modular Blocks 0 0 0 0 2 2 15 22 2 2 16 24 2 2 15 24
Retention Pond (Wet) - Surface Pond With a Permanent Pool
2 2 19 20 4 4 34 33 4 4 66 80 22 22 320 321
Wetland - Basin With Open Water Surfaces
0 0 0 0 0 0 0 0 3 4 28 25 5 6 103 117
Wetland - Channel With Wetland Bottom
0 0 0 0 0 0 0 0 0 0 0 0 3 3 54 54
Wetland - Basin Without Open Water (Wetland Meadow Type)
0 0 0 0 0 0 0 0 0 0 0 0 0 0 0 0
International Stormwater BMP Database
Pollutant Category Summary: Metals Page 25 August 2011
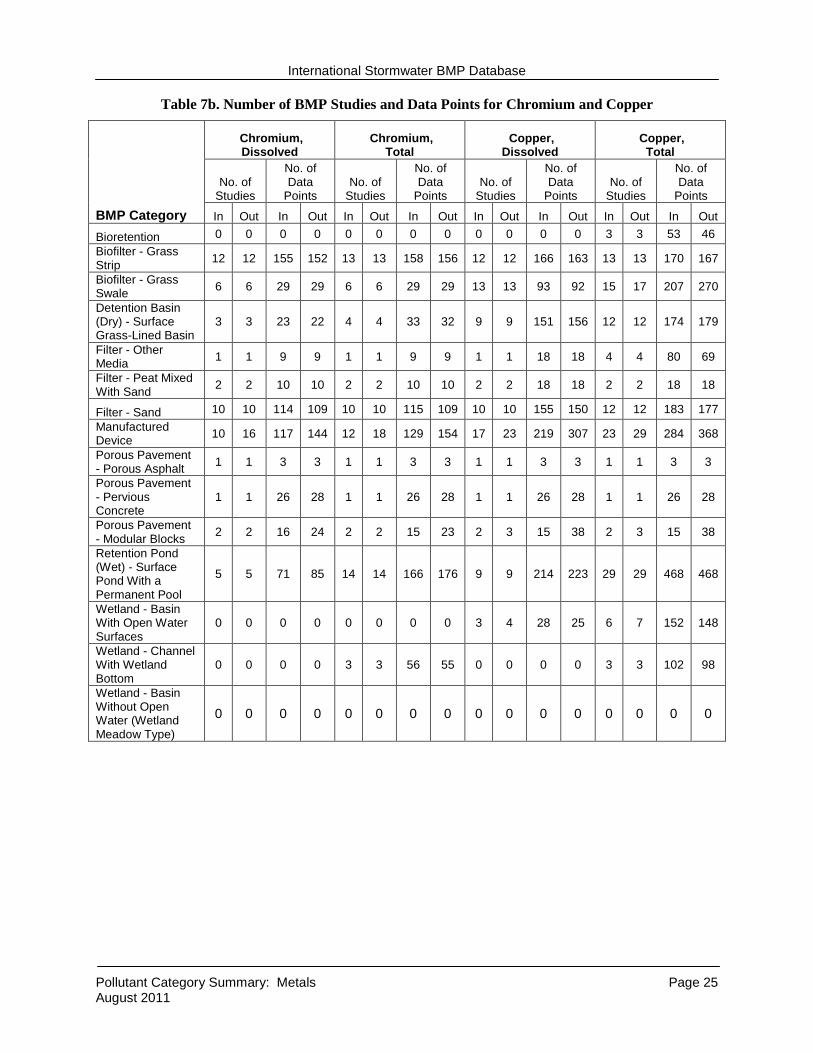
Table 7b. Number of BMP Studies and Data Points for Chromium and Copper
BMP Category
Chromium, Dissolved
Chromium, Total
Copper, Dissolved
Copper, Total
No. of Studies
No. of Data
Points No. of
Studies
No. of Data
Points No. of
Studies
No. of Data
Points No. of
Studies
No. of Data
Points
In Out In Out In Out In Out In Out In Out In Out In Out
Bioretention 0 0 0 0 0 0 0 0 0 0 0 0 3 3 53 46 Biofilter - Grass Strip 12 12 155 152 13 13 158 156 12 12 166 163 13 13 170 167
Biofilter - Grass Swale 6 6 29 29 6 6 29 29 13 13 93 92 15 17 207 270
Detention Basin (Dry) - Surface Grass-Lined Basin
3 3 23 22 4 4 33 32 9 9 151 156 12 12 174 179
Filter - Other Media 1 1 9 9 1 1 9 9 1 1 18 18 4 4 80 69
Filter - Peat Mixed With Sand 2 2 10 10 2 2 10 10 2 2 18 18 2 2 18 18
Filter - Sand 10 10 114 109 10 10 115 109 10 10 155 150 12 12 183 177 Manufactured Device 10 16 117 144 12 18 129 154 17 23 219 307 23 29 284 368
Porous Pavement - Porous Asphalt 1 1 3 3 1 1 3 3 1 1 3 3 1 1 3 3
Porous Pavement - Pervious Concrete
1 1 26 28 1 1 26 28 1 1 26 28 1 1 26 28
Porous Pavement - Modular Blocks 2 2 16 24 2 2 15 23 2 3 15 38 2 3 15 38
Retention Pond (Wet) - Surface Pond With a Permanent Pool
5 5 71 85 14 14 166 176 9 9 214 223 29 29 468 468
Wetland - Basin With Open Water Surfaces
0 0 0 0 0 0 0 0 3 4 28 25 6 7 152 148
Wetland - Channel With Wetland Bottom
0 0 0 0 3 3 56 55 0 0 0 0 3 3 102 98
Wetland - Basin Without Open Water (Wetland Meadow Type)
0 0 0 0 0 0 0 0 0 0 0 0 0 0 0 0
International Stormwater BMP Database
Pollutant Category Summary: Metals Page 26 August 2011
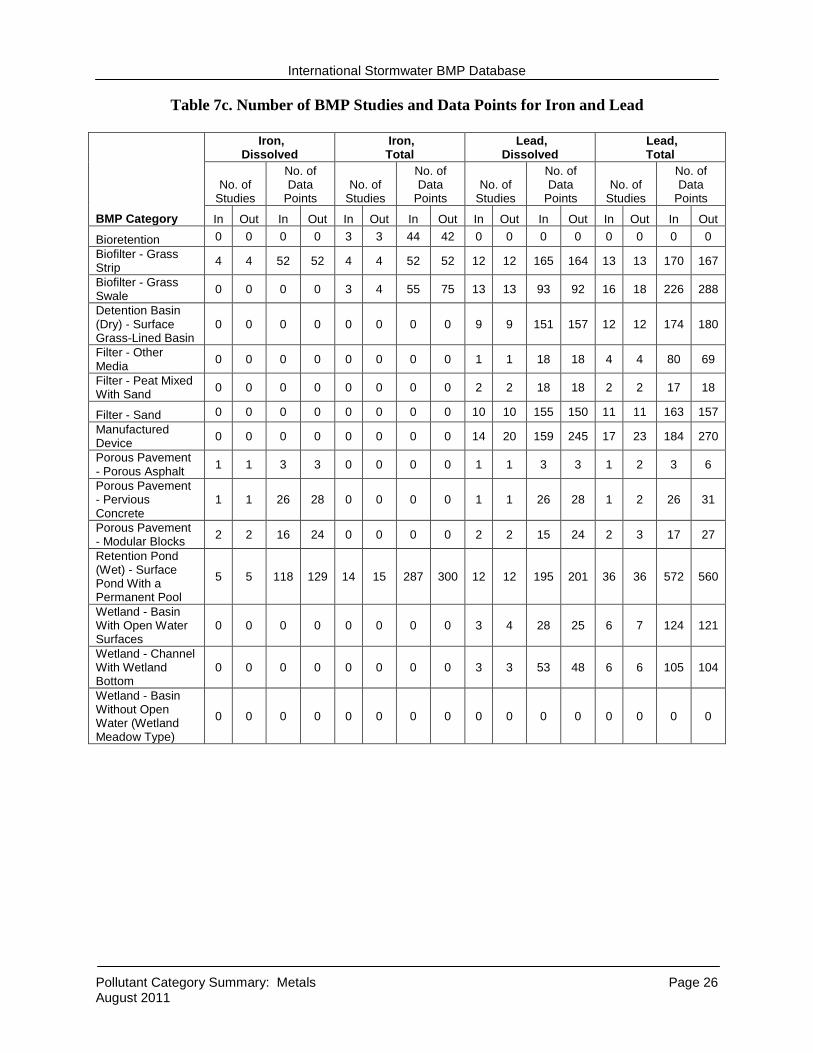
Table 7c. Number of BMP Studies and Data Points for Iron and Lead
BMP Category
Iron, Dissolved
Iron, Total
Lead, Dissolved
Lead, Total
No. of Studies
No. of Data
Points No. of
Studies
No. of Data
Points No. of
Studies
No. of Data
Points No. of
Studies
No. of Data
Points
In Out In Out In Out In Out In Out In Out In Out In Out
Bioretention 0 0 0 0 3 3 44 42 0 0 0 0 0 0 0 0 Biofilter - Grass Strip 4 4 52 52 4 4 52 52 12 12 165 164 13 13 170 167
Biofilter - Grass Swale 0 0 0 0 3 4 55 75 13 13 93 92 16 18 226 288
Detention Basin (Dry) - Surface Grass-Lined Basin
0 0 0 0 0 0 0 0 9 9 151 157 12 12 174 180
Filter - Other Media 0 0 0 0 0 0 0 0 1 1 18 18 4 4 80 69
Filter - Peat Mixed With Sand 0 0 0 0 0 0 0 0 2 2 18 18 2 2 17 18
Filter - Sand 0 0 0 0 0 0 0 0 10 10 155 150 11 11 163 157 Manufactured Device 0 0 0 0 0 0 0 0 14 20 159 245 17 23 184 270
Porous Pavement - Porous Asphalt 1 1 3 3 0 0 0 0 1 1 3 3 1 2 3 6
Porous Pavement - Pervious Concrete
1 1 26 28 0 0 0 0 1 1 26 28 1 2 26 31
Porous Pavement - Modular Blocks 2 2 16 24 0 0 0 0 2 2 15 24 2 3 17 27
Retention Pond (Wet) - Surface Pond With a Permanent Pool
5 5 118 129 14 15 287 300 12 12 195 201 36 36 572 560
Wetland - Basin With Open Water Surfaces
0 0 0 0 0 0 0 0 3 4 28 25 6 7 124 121
Wetland - Channel With Wetland Bottom
0 0 0 0 0 0 0 0 3 3 53 48 6 6 105 104
Wetland - Basin Without Open Water (Wetland Meadow Type)
0 0 0 0 0 0 0 0 0 0 0 0 0 0 0 0
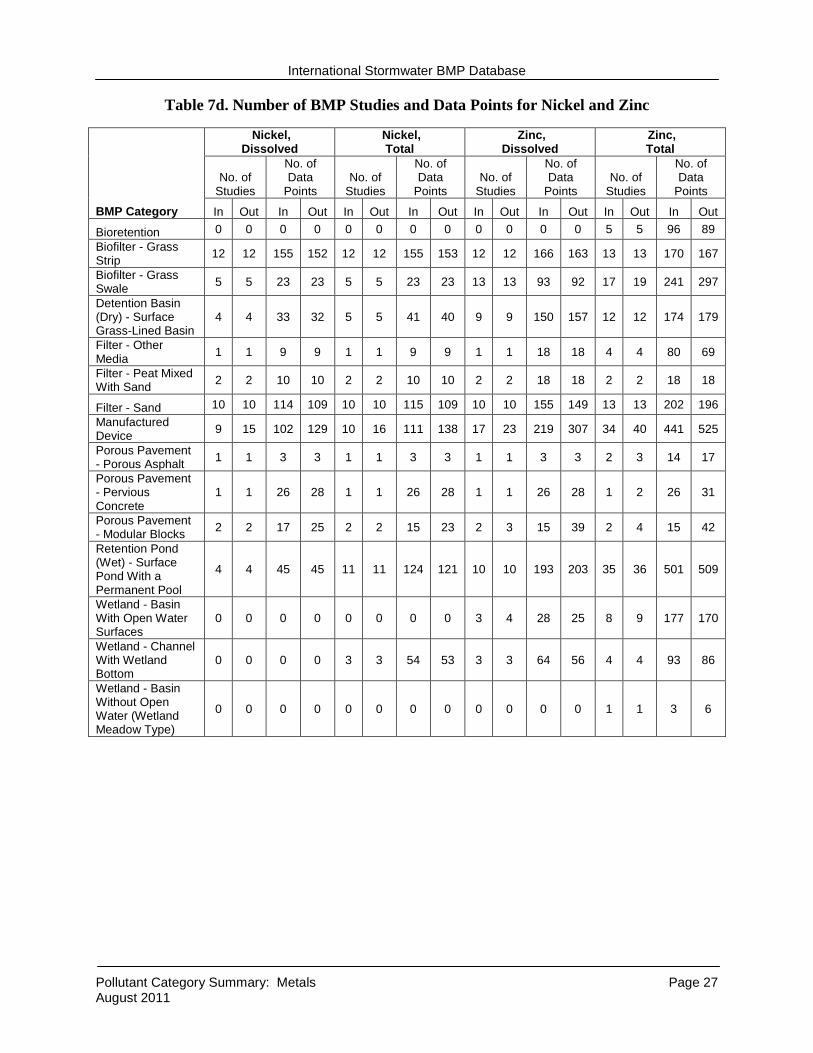
International Stormwater BMP Database
Pollutant Category Summary: Metals Page 27 August 2011
Table 7d. Number of BMP Studies and Data Points for Nickel and Zinc
BMP Category
Nickel, Dissolved
Nickel, Total
Zinc, Dissolved
Zinc, Total
No. of Studies
No. of Data
Points No. of
Studies
No. of Data
Points No. of
Studies
No. of Data
Points No. of
Studies
No. of Data
Points
In Out In Out In Out In Out In Out In Out In Out In Out
Bioretention 0 0 0 0 0 0 0 0 0 0 0 0 5 5 96 89 Biofilter - Grass Strip 12 12 155 152 12 12 155 153 12 12 166 163 13 13 170 167
Biofilter - Grass Swale 5 5 23 23 5 5 23 23 13 13 93 92 17 19 241 297
Detention Basin (Dry) - Surface Grass-Lined Basin
4 4 33 32 5 5 41 40 9 9 150 157 12 12 174 179
Filter - Other Media 1 1 9 9 1 1 9 9 1 1 18 18 4 4 80 69
Filter - Peat Mixed With Sand 2 2 10 10 2 2 10 10 2 2 18 18 2 2 18 18
Filter - Sand 10 10 114 109 10 10 115 109 10 10 155 149 13 13 202 196 Manufactured Device 9 15 102 129 10 16 111 138 17 23 219 307 34 40 441 525
Porous Pavement - Porous Asphalt 1 1 3 3 1 1 3 3 1 1 3 3 2 3 14 17
Porous Pavement - Pervious Concrete
1 1 26 28 1 1 26 28 1 1 26 28 1 2 26 31
Porous Pavement - Modular Blocks 2 2 17 25 2 2 15 23 2 3 15 39 2 4 15 42
Retention Pond (Wet) - Surface Pond With a Permanent Pool
4 4 45 45 11 11 124 121 10 10 193 203 35 36 501 509
Wetland - Basin With Open Water Surfaces
0 0 0 0 0 0 0 0 3 4 28 25 8 9 177 170
Wetland - Channel With Wetland Bottom
0 0 0 0 3 3 54 53 3 3 64 56 4 4 93 86
Wetland - Basin Without Open Water (Wetland Meadow Type)
0 0 0 0 0 0 0 0 0 0 0 0 1 1 3 6
International Stormwater BMP Database
Pollutant Category Summary: Metals Page 28 August 2011
3.2 Category-level BMP Analysis for Metals
Overall category-level BMP performance summaries have been developed for dissolved and total forms of arsenic, cadmium, chromium, copper, iron, lead, nickel and zinc. The analysis focuses on the distribution of effluent water quality for individual events by BMP category, thereby providing greater weight to those BMPs within a BMP category for which there are a larger number of data points reported. In other words, the performance analysis presented in this technical summary is “storm-weighted,” as opposed to “BMP weighted.”4
Data sets included in the analysis were screened and categorized according to the criteria in Section 3.1. The BMP categories included in this analysis are bioretention, bioswales, dry detention basins (surface/grass-lined), filter strips, manufactured devices, media filters, porous pavement, retention ponds (surface pond with a permanent pool), wetland basins (basin with open water surface), and wetland channels (swales and channels with wetland vegetation). The effectiveness and range of unit treatment processes present in a particular BMP may vary depending on the BMP design. Several other BMP categories and sub-classes are included in the database, but these have been excluded from this analysis due to limited data sets available for meaningful categorical comparisons.
The analysis approach used for metals generally follows the approach described in the Pollutant Category Summary for Solids (Geosyntec and WWE 2011). One substantive difference between the metals and sediment analysis is that wide-ranging detection limits are present in the BMP Database metals data set, with large percentages of the data sets below detection limits, as summarized in Table 8a-c. This complicates the performance analysis for metals. The method chosen to address non-detects for purposes of this big-picture, broad-level analysis is the regression-on-order statistics (ROS) method as described by Helsel and Hirsch (2002). This method was selected to estimate values for non-detects in the metals analysis to enable use of the variable detection limit data sets. The ROS method was only applied to data sets with less than 80% non-detects and greater than or equal to three detects. If the data set did not meet this criterion, then one-half of the detection limit was used. Other approaches to handling detection limits may be utilized, depending on the objectives of the analysis. Be aware that the manner in which non-detects are addressed may affect the results of the analysis and affect the reliability of conclusions drawn based on the analysis (Pitt 2007). Although the analysis in this technical summary used a high threshold of percent non-detects, those choosing a more conservative analysis approach may use Tables 8a through 8c, combined with the numbers of non-detects provided in Attachment 1 to screen (exclude) analysis results at lower thresholds of non-detects. In general, the porous pavement data set is most affected by high percentages of non-detects. Tables 9 through 23 that follow provide footnotes identifying where non-detects are expected to be limiting factors regarding the reliability of the conclusions
4 There are several viable approaches to evaluating data in the BMP Database. Two general approaches that have been presented in the past (Geosyntec Consultants and Wright Water Engineers, 2008) are the “BMP-weighted” and “storm-weighted” approaches. The BMP-weighted approach represents each BMP with one value representing the central tendency and variability of each individual BMP study, whereas the storm-weighted approach combines all of the storm events for the BMPs in each category and analyzes the overall storm-based data set, with each storm weighted equally. The storm-weighted approach has been selected for this memorandum as it provides a much larger data set for analysis.
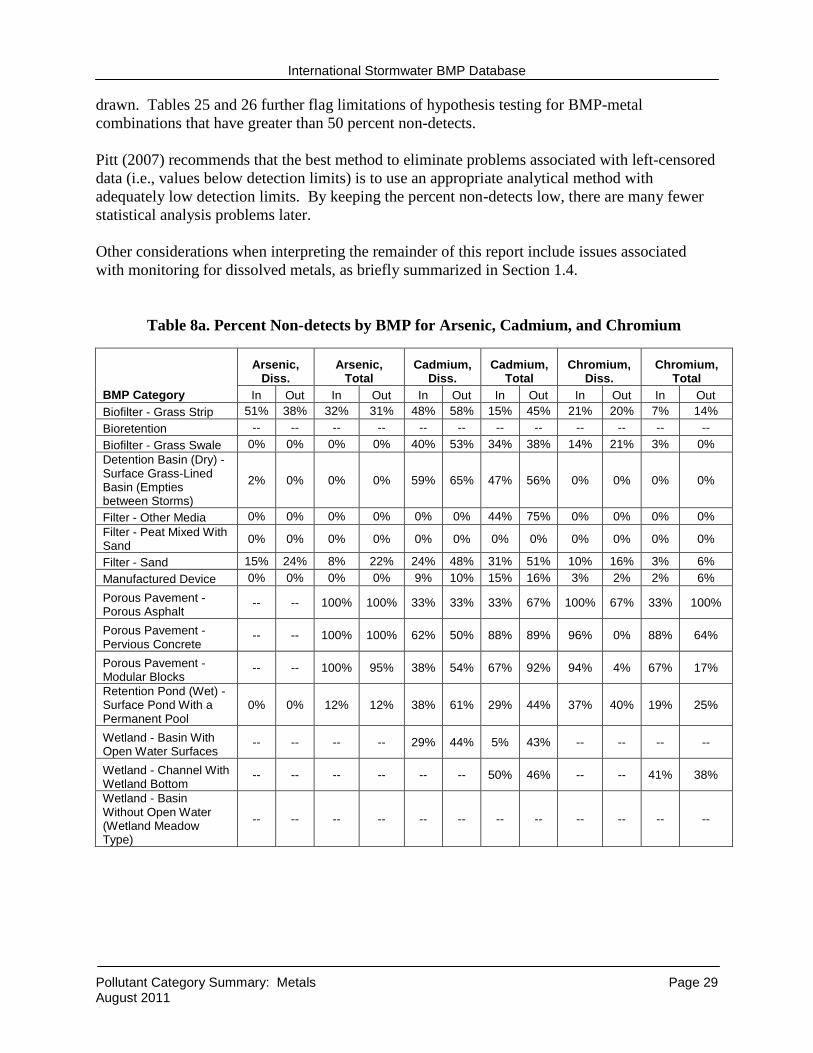
International Stormwater BMP Database
Pollutant Category Summary: Metals Page 29 August 2011
drawn. Tables 25 and 26 further flag limitations of hypothesis testing for BMP-metal combinations that have greater than 50 percent non-detects. Pitt (2007) recommends that the best method to eliminate problems associated with left-censored data (i.e., values below detection limits) is to use an appropriate analytical method with adequately low detection limits. By keeping the percent non-detects low, there are many fewer statistical analysis problems later. Other considerations when interpreting the remainder of this report include issues associated with monitoring for dissolved metals, as briefly summarized in Section 1.4.
Table 8a. Percent Non-detects by BMP for Arsenic, Cadmium, and Chromium
BMP Category
Arsenic, Diss.
Arsenic, Total
Cadmium, Diss.
Cadmium, Total
Chromium, Diss.
Chromium, Total
In Out In Out In Out In Out In Out In Out Biofilter - Grass Strip 51% 38% 32% 31% 48% 58% 15% 45% 21% 20% 7% 14% Bioretention -- -- -- -- -- -- -- -- -- -- -- -- Biofilter - Grass Swale 0% 0% 0% 0% 40% 53% 34% 38% 14% 21% 3% 0% Detention Basin (Dry) - Surface Grass-Lined Basin (Empties between Storms)
2% 0% 0% 0% 59% 65% 47% 56% 0% 0% 0% 0%
Filter - Other Media 0% 0% 0% 0% 0% 0% 44% 75% 0% 0% 0% 0% Filter - Peat Mixed With Sand 0% 0% 0% 0% 0% 0% 0% 0% 0% 0% 0% 0%
Filter - Sand 15% 24% 8% 22% 24% 48% 31% 51% 10% 16% 3% 6% Manufactured Device 0% 0% 0% 0% 9% 10% 15% 16% 3% 2% 2% 6%
Porous Pavement - Porous Asphalt
-- -- 100% 100% 33% 33% 33% 67% 100% 67% 33% 100%
Porous Pavement - Pervious Concrete
-- -- 100% 100% 62% 50% 88% 89% 96% 0% 88% 64%
Porous Pavement - Modular Blocks
-- -- 100% 95% 38% 54% 67% 92% 94% 4% 67% 17%
Retention Pond (Wet) - Surface Pond With a Permanent Pool
0% 0% 12% 12% 38% 61% 29% 44% 37% 40% 19% 25%
Wetland - Basin With Open Water Surfaces
-- -- -- -- 29% 44% 5% 43% -- -- -- --
Wetland - Channel With Wetland Bottom
-- -- -- -- -- -- 50% 46% -- -- 41% 38%
Wetland - Basin Without Open Water (Wetland Meadow Type)
-- -- -- -- -- -- -- -- -- -- -- --
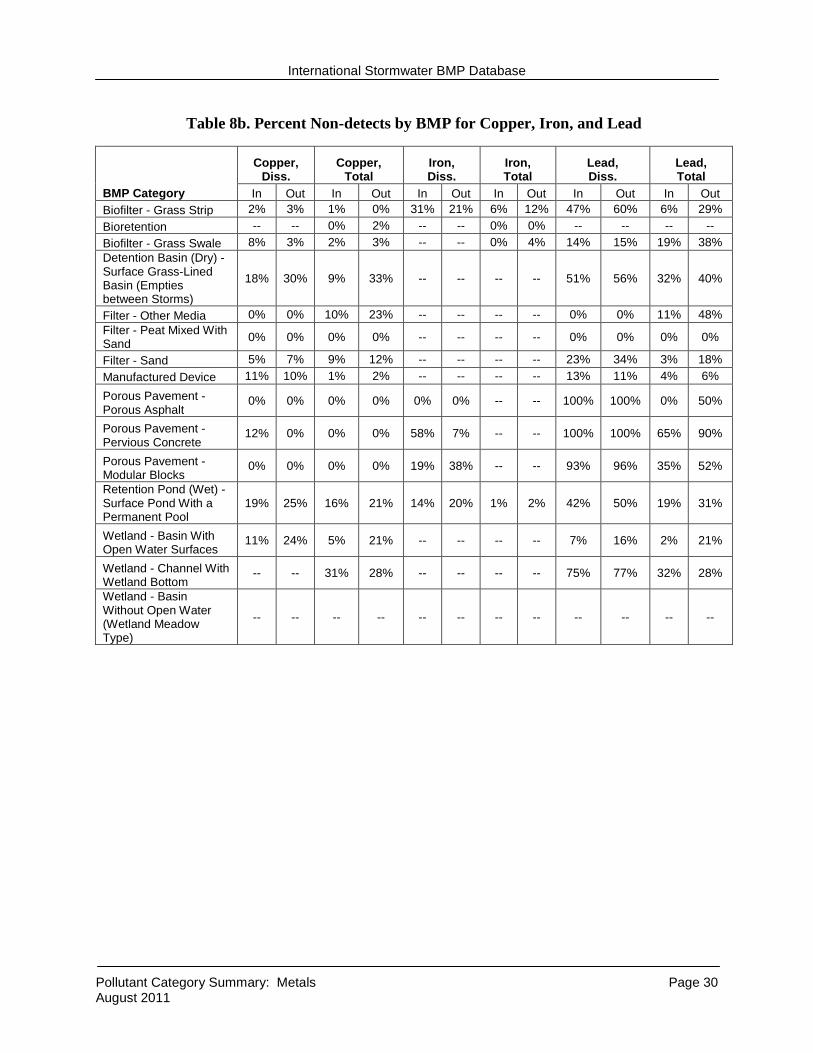
International Stormwater BMP Database
Pollutant Category Summary: Metals Page 30 August 2011
Table 8b. Percent Non-detects by BMP for Copper, Iron, and Lead
BMP Category
Copper, Diss.
Copper, Total
Iron, Diss.
Iron, Total
Lead, Diss.
Lead, Total
In Out In Out In Out In Out In Out In Out Biofilter - Grass Strip 2% 3% 1% 0% 31% 21% 6% 12% 47% 60% 6% 29% Bioretention -- -- 0% 2% -- -- 0% 0% -- -- -- -- Biofilter - Grass Swale 8% 3% 2% 3% -- -- 0% 4% 14% 15% 19% 38% Detention Basin (Dry) - Surface Grass-Lined Basin (Empties between Storms)
18% 30% 9% 33% -- -- -- -- 51% 56% 32% 40%
Filter - Other Media 0% 0% 10% 23% -- -- -- -- 0% 0% 11% 48% Filter - Peat Mixed With Sand 0% 0% 0% 0% -- -- -- -- 0% 0% 0% 0%
Filter - Sand 5% 7% 9% 12% -- -- -- -- 23% 34% 3% 18% Manufactured Device 11% 10% 1% 2% -- -- -- -- 13% 11% 4% 6%
Porous Pavement - Porous Asphalt
0% 0% 0% 0% 0% 0% -- -- 100% 100% 0% 50%
Porous Pavement - Pervious Concrete
12% 0% 0% 0% 58% 7% -- -- 100% 100% 65% 90%
Porous Pavement - Modular Blocks
0% 0% 0% 0% 19% 38% -- -- 93% 96% 35% 52%
Retention Pond (Wet) - Surface Pond With a Permanent Pool
19% 25% 16% 21% 14% 20% 1% 2% 42% 50% 19% 31%
Wetland - Basin With Open Water Surfaces
11% 24% 5% 21% -- -- -- -- 7% 16% 2% 21%
Wetland - Channel With Wetland Bottom
-- -- 31% 28% -- -- -- -- 75% 77% 32% 28%
Wetland - Basin Without Open Water (Wetland Meadow Type)
-- -- -- -- -- -- -- -- -- -- -- --
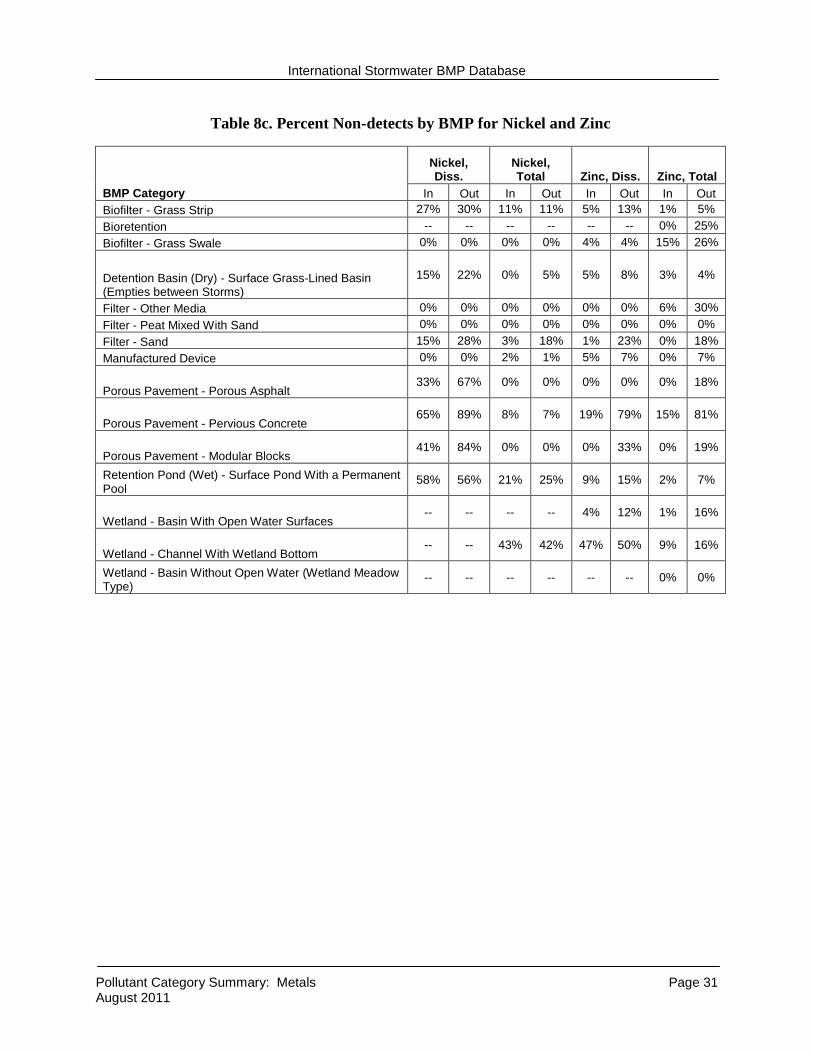
International Stormwater BMP Database
Pollutant Category Summary: Metals Page 31 August 2011
Table 8c. Percent Non-detects by BMP for Nickel and Zinc
BMP Category
Nickel, Diss.
Nickel, Total Zinc, Diss. Zinc, Total
In Out In Out In Out In Out Biofilter - Grass Strip 27% 30% 11% 11% 5% 13% 1% 5% Bioretention -- -- -- -- -- -- 0% 25% Biofilter - Grass Swale 0% 0% 0% 0% 4% 4% 15% 26%
Detention Basin (Dry) - Surface Grass-Lined Basin (Empties between Storms)
15% 22% 0% 5% 5% 8% 3% 4%
Filter - Other Media 0% 0% 0% 0% 0% 0% 6% 30% Filter - Peat Mixed With Sand 0% 0% 0% 0% 0% 0% 0% 0% Filter - Sand 15% 28% 3% 18% 1% 23% 0% 18% Manufactured Device 0% 0% 2% 1% 5% 7% 0% 7%
Porous Pavement - Porous Asphalt 33% 67% 0% 0% 0% 0% 0% 18%
Porous Pavement - Pervious Concrete 65% 89% 8% 7% 19% 79% 15% 81%
Porous Pavement - Modular Blocks 41% 84% 0% 0% 0% 33% 0% 19%
Retention Pond (Wet) - Surface Pond With a Permanent Pool
58% 56% 21% 25% 9% 15% 2% 7%
Wetland - Basin With Open Water Surfaces -- -- -- -- 4% 12% 1% 16%
Wetland - Channel With Wetland Bottom -- -- 43% 42% 47% 50% 9% 16%
Wetland - Basin Without Open Water (Wetland Meadow Type)
-- -- -- -- -- -- 0% 0%
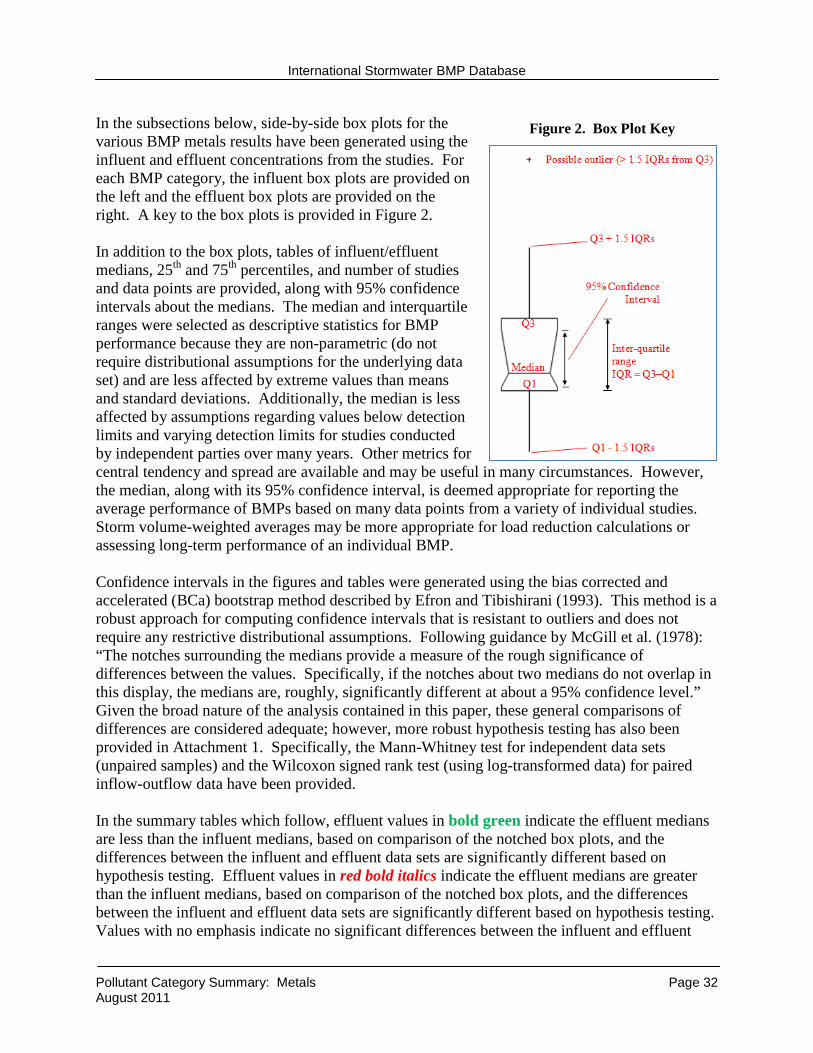
International Stormwater BMP Database
Pollutant Category Summary: Metals Page 32 August 2011
In the subsections below, side-by-side box plots for the various BMP metals results have been generated using the influent and effluent concentrations from the studies. For each BMP category, the influent box plots are provided on the left and the effluent box plots are provided on the right. A key to the box plots is provided in Figure 2. In addition to the box plots, tables of influent/effluent medians, 25th and 75th percentiles, and number of studies and data points are provided, along with 95% confidence intervals about the medians. The median and interquartile ranges were selected as descriptive statistics for BMP performance because they are non-parametric (do not require distributional assumptions for the underlying data set) and are less affected by extreme values than means and standard deviations. Additionally, the median is less affected by assumptions regarding values below detection limits and varying detection limits for studies conducted by independent parties over many years. Other metrics for central tendency and spread are available and may be useful in many circumstances. However, the median, along with its 95% confidence interval, is deemed appropriate for reporting the average performance of BMPs based on many data points from a variety of individual studies. Storm volume-weighted averages may be more appropriate for load reduction calculations or assessing long-term performance of an individual BMP. Confidence intervals in the figures and tables were generated using the bias corrected and accelerated (BCa) bootstrap method described by Efron and Tibishirani (1993). This method is a robust approach for computing confidence intervals that is resistant to outliers and does not require any restrictive distributional assumptions. Following guidance by McGill et al. (1978): “The notches surrounding the medians provide a measure of the rough significance of differences between the values. Specifically, if the notches about two medians do not overlap in this display, the medians are, roughly, significantly different at about a 95% confidence level.” Given the broad nature of the analysis contained in this paper, these general comparisons of differences are considered adequate; however, more robust hypothesis testing has also been provided in Attachment 1. Specifically, the Mann-Whitney test for independent data sets (unpaired samples) and the Wilcoxon signed rank test (using log-transformed data) for paired inflow-outflow data have been provided. In the summary tables which follow, effluent values in bold green indicate the effluent medians are less than the influent medians, based on comparison of the notched box plots, and the differences between the influent and effluent data sets are significantly different based on hypothesis testing. Effluent values in red bold italics indicate the effluent medians are greater than the influent medians, based on comparison of the notched box plots, and the differences between the influent and effluent data sets are significantly different based on hypothesis testing. Values with no emphasis indicate no significant differences between the influent and effluent
Figure 2. Box Plot Key
International Stormwater BMP Database
Pollutant Category Summary: Metals Page 33 August 2011
central tendencies. BMP category-metal combinations where the inflow or outflow data set has greater than 80 percent non-detects are also shown with no font emphasis (formatting), indicating conclusions regarding statistical differences should not be drawn without more in-depth analysis of the data set. Hypothesis test results in Attachment 1 were used to determine whether statistically significant differences were present between the influent and effluent data sets. For the majority of the BMP-parameter combinations, comparison of the notched boxplots and the statistical tests result in similar conclusions. Be aware that for some BMP types, a statistically significant difference between influent and effluent concentrations may not be present, but the effluent concentrations achieved by the BMP are relatively low and may be comparable to the performance of other BMPs that have statistically significant differences between inflow and outflow. For example, data sets that have low influent concentrations and similarly low effluent concentration (i.e., clean water in = clean water out) may not show statistically significant differences. However this does not necessarily imply that the BMP would not have been effective at higher influent concentrations. Attachment 1 to this memorandum is a data analysis report for metals, organized by BMP type. The report contains additional summary statistics (e.g., mean, median, standard deviation, skewness, 25th and 75th percentiles) and hypothesis testing, as previously described. Influent/effluent box plots, probability plots and scatter plots are also presented in the Attachment 1 summary report. Although the narrative of this report presents the median for purposes of category-level performance evaluations, other researchers may choose to evaluate and utilize other statistical measures provided in Attachment 1. Performance analysis results for each metal of interest are summarized below, followed by tabular and graphical summaries for each constituent. Narrative observations regarding performance are based on comparison of the confidence intervals for the influent and effluent means, as well as results of the Mann-Whitney hypothesis test results in Attachment 1. Statistically significant differences based on hypothesis test results are footnoted in the tables. Footnotes provided in the tables also generally apply to the figures associated with the tables (e.g., limitations associated with data sets with high percentages of non-detects apply to both tables and figures).
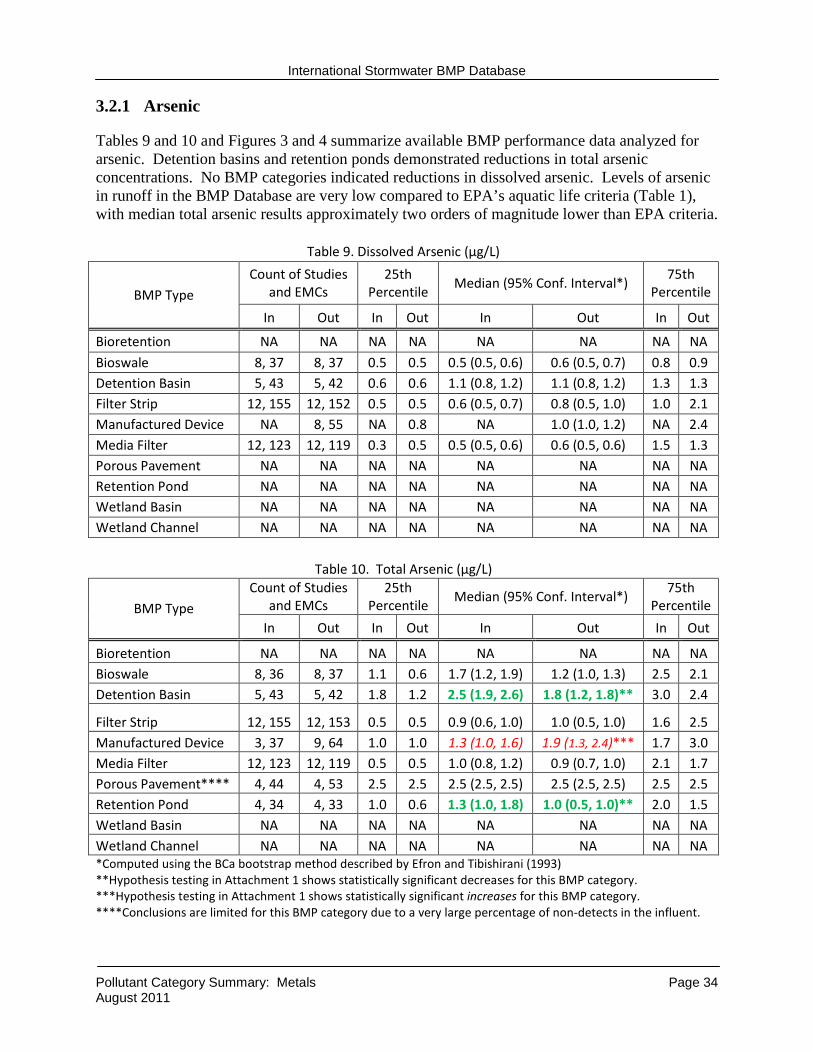
International Stormwater BMP Database
Pollutant Category Summary: Metals Page 34 August 2011
3.2.1 Arsenic
Tables 9 and 10 and Figures 3 and 4 summarize available BMP performance data analyzed for arsenic. Detention basins and retention ponds demonstrated reductions in total arsenic concentrations. No BMP categories indicated reductions in dissolved arsenic. Levels of arsenic in runoff in the BMP Database are very low compared to EPA’s aquatic life criteria (Table 1), with median total arsenic results approximately two orders of magnitude lower than EPA criteria.
Table 9. Dissolved Arsenic (µg/L)
BMP Type Count of Studies
and EMCs 25th
Percentile Median (95% Conf. Interval*)
75th Percentile
In Out In Out In Out In Out
Bioretention NA NA NA NA NA NA NA NA
Bioswale 8, 37 8, 37 0.5 0.5 0.5 (0.5, 0.6) 0.6 (0.5, 0.7) 0.8 0.9 Detention Basin 5, 43 5, 42 0.6 0.6 1.1 (0.8, 1.2) 1.1 (0.8, 1.2) 1.3 1.3 Filter Strip 12, 155 12, 152 0.5 0.5 0.6 (0.5, 0.7) 0.8 (0.5, 1.0) 1.0 2.1 Manufactured Device NA 8, 55 NA 0.8 NA 1.0 (1.0, 1.2) NA 2.4 Media Filter 12, 123 12, 119 0.3 0.5 0.5 (0.5, 0.6) 0.6 (0.5, 0.6) 1.5 1.3 Porous Pavement NA NA NA NA NA NA NA NA Retention Pond NA NA NA NA NA NA NA NA Wetland Basin NA NA NA NA NA NA NA NA Wetland Channel NA NA NA NA NA NA NA NA
Table 10. Total Arsenic (µg/L)
BMP Type Count of Studies
and EMCs 25th
Percentile Median (95% Conf. Interval*)
75th Percentile
In Out In Out In Out In Out
Bioretention NA NA NA NA NA NA NA NA Bioswale 8, 36 8, 37 1.1 0.6 1.7 (1.2, 1.9) 1.2 (1.0, 1.3) 2.5 2.1 Detention Basin 5, 43 5, 42 1.8 1.2 2.5 (1.9, 2.6) 1.8 (1.2, 1.8)** 3.0 2.4
Filter Strip 12, 155 12, 153 0.5 0.5 0.9 (0.6, 1.0) 1.0 (0.5, 1.0) 1.6 2.5 Manufactured Device 3, 37 9, 64 1.0 1.0 1.3 (1.0, 1.6) 1.9 (1.3, 2.4)*** 1.7 3.0 Media Filter 12, 123 12, 119 0.5 0.5 1.0 (0.8, 1.2) 0.9 (0.7, 1.0) 2.1 1.7 Porous Pavement**** 4, 44 4, 53 2.5 2.5 2.5 (2.5, 2.5) 2.5 (2.5, 2.5) 2.5 2.5 Retention Pond 4, 34 4, 33 1.0 0.6 1.3 (1.0, 1.8) 1.0 (0.5, 1.0)** 2.0 1.5 Wetland Basin NA NA NA NA NA NA NA NA Wetland Channel NA NA NA NA NA NA NA NA *Computed using the BCa bootstrap method described by Efron and Tibishirani (1993) **Hypothesis testing in Attachment 1 shows statistically significant decreases for this BMP category. ***Hypothesis testing in Attachment 1 shows statistically significant increases for this BMP category. ****Conclusions are limited for this BMP category due to a very large percentage of non-detects in the influent.
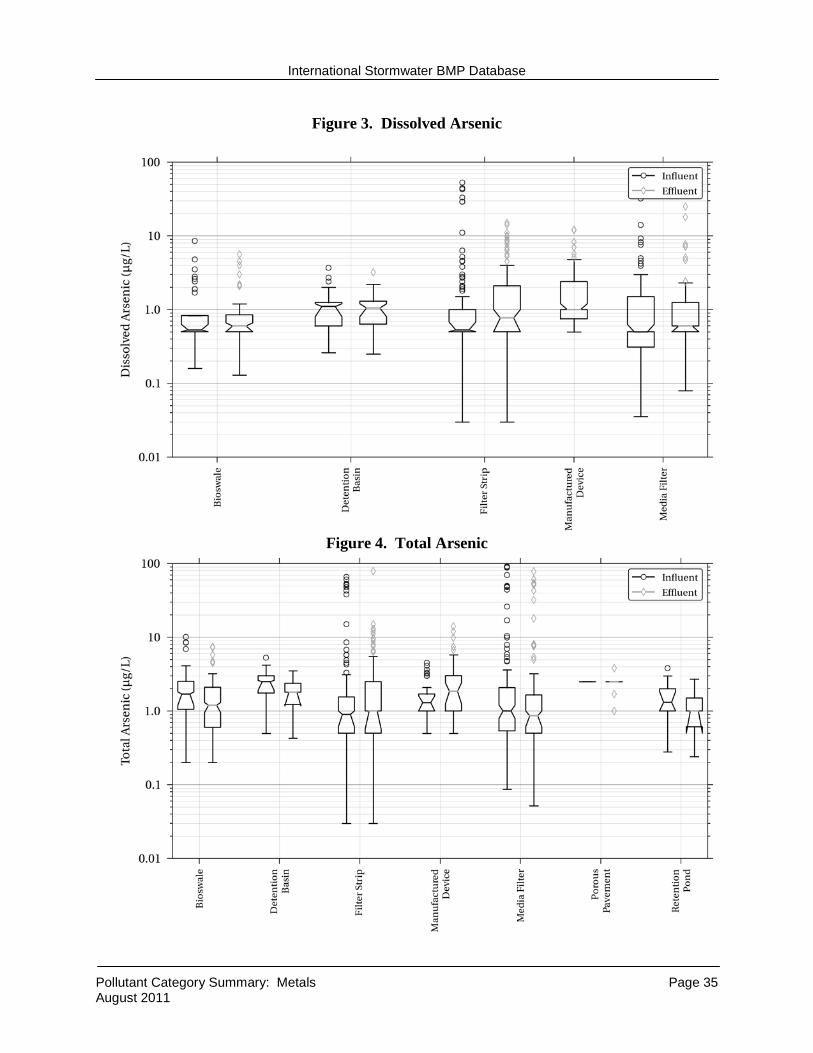
International Stormwater BMP Database
Pollutant Category Summary: Metals Page 35 August 2011
Figure 3. Dissolved Arsenic
Figure 4. Total Arsenic
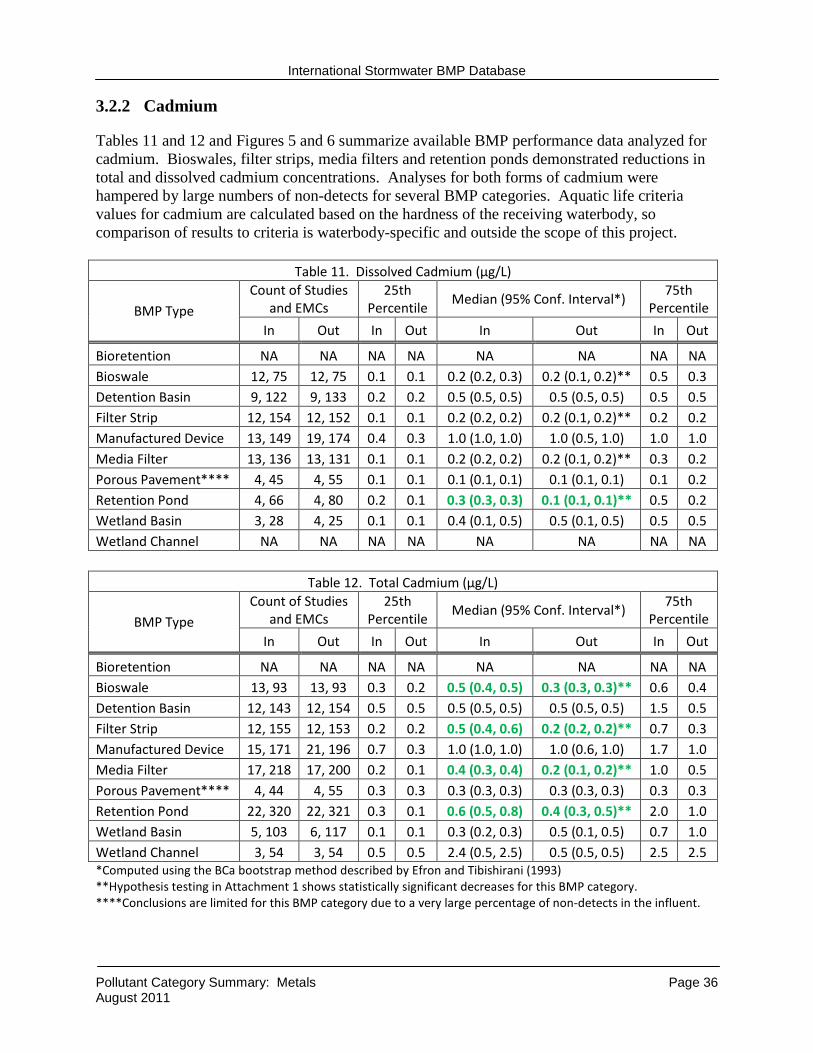
International Stormwater BMP Database
Pollutant Category Summary: Metals Page 36 August 2011
3.2.2 Cadmium
Tables 11 and 12 and Figures 5 and 6 summarize available BMP performance data analyzed for cadmium. Bioswales, filter strips, media filters and retention ponds demonstrated reductions in total and dissolved cadmium concentrations. Analyses for both forms of cadmium were hampered by large numbers of non-detects for several BMP categories. Aquatic life criteria values for cadmium are calculated based on the hardness of the receiving waterbody, so comparison of results to criteria is waterbody-specific and outside the scope of this project.
Table 11. Dissolved Cadmium (µg/L)
BMP Type Count of Studies
and EMCs 25th
Percentile Median (95% Conf. Interval*)
75th Percentile
In Out In Out In Out In Out
Bioretention NA NA NA NA NA NA NA NA Bioswale 12, 75 12, 75 0.1 0.1 0.2 (0.2, 0.3) 0.2 (0.1, 0.2)** 0.5 0.3 Detention Basin 9, 122 9, 133 0.2 0.2 0.5 (0.5, 0.5) 0.5 (0.5, 0.5) 0.5 0.5 Filter Strip 12, 154 12, 152 0.1 0.1 0.2 (0.2, 0.2) 0.2 (0.1, 0.2)** 0.2 0.2 Manufactured Device 13, 149 19, 174 0.4 0.3 1.0 (1.0, 1.0) 1.0 (0.5, 1.0) 1.0 1.0 Media Filter 13, 136 13, 131 0.1 0.1 0.2 (0.2, 0.2) 0.2 (0.1, 0.2)** 0.3 0.2 Porous Pavement**** 4, 45 4, 55 0.1 0.1 0.1 (0.1, 0.1) 0.1 (0.1, 0.1) 0.1 0.2 Retention Pond 4, 66 4, 80 0.2 0.1 0.3 (0.3, 0.3) 0.1 (0.1, 0.1)** 0.5 0.2 Wetland Basin 3, 28 4, 25 0.1 0.1 0.4 (0.1, 0.5) 0.5 (0.1, 0.5) 0.5 0.5 Wetland Channel NA NA NA NA NA NA NA NA
Table 12. Total Cadmium (µg/L)
BMP Type Count of Studies
and EMCs 25th
Percentile Median (95% Conf. Interval*)
75th Percentile
In Out In Out In Out In Out
Bioretention NA NA NA NA NA NA NA NA Bioswale 13, 93 13, 93 0.3 0.2 0.5 (0.4, 0.5) 0.3 (0.3, 0.3)** 0.6 0.4 Detention Basin 12, 143 12, 154 0.5 0.5 0.5 (0.5, 0.5) 0.5 (0.5, 0.5) 1.5 0.5 Filter Strip 12, 155 12, 153 0.2 0.2 0.5 (0.4, 0.6) 0.2 (0.2, 0.2)** 0.7 0.3 Manufactured Device 15, 171 21, 196 0.7 0.3 1.0 (1.0, 1.0) 1.0 (0.6, 1.0) 1.7 1.0 Media Filter 17, 218 17, 200 0.2 0.1 0.4 (0.3, 0.4) 0.2 (0.1, 0.2)** 1.0 0.5 Porous Pavement**** 4, 44 4, 55 0.3 0.3 0.3 (0.3, 0.3) 0.3 (0.3, 0.3) 0.3 0.3 Retention Pond 22, 320 22, 321 0.3 0.1 0.6 (0.5, 0.8) 0.4 (0.3, 0.5)** 2.0 1.0 Wetland Basin 5, 103 6, 117 0.1 0.1 0.3 (0.2, 0.3) 0.5 (0.1, 0.5) 0.7 1.0 Wetland Channel 3, 54 3, 54 0.5 0.5 2.4 (0.5, 2.5) 0.5 (0.5, 0.5) 2.5 2.5 *Computed using the BCa bootstrap method described by Efron and Tibishirani (1993) **Hypothesis testing in Attachment 1 shows statistically significant decreases for this BMP category. ****Conclusions are limited for this BMP category due to a very large percentage of non-detects in the influent.
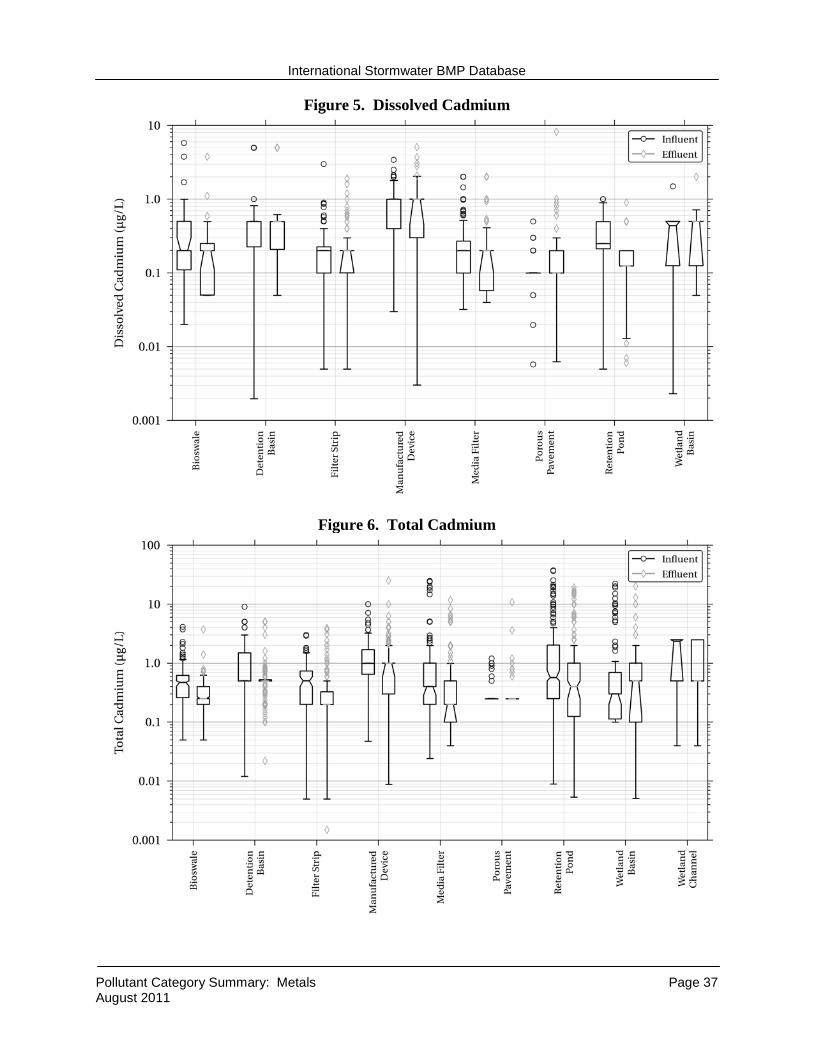
International Stormwater BMP Database
Pollutant Category Summary: Metals Page 37 August 2011
Figure 5. Dissolved Cadmium
Figure 6. Total Cadmium
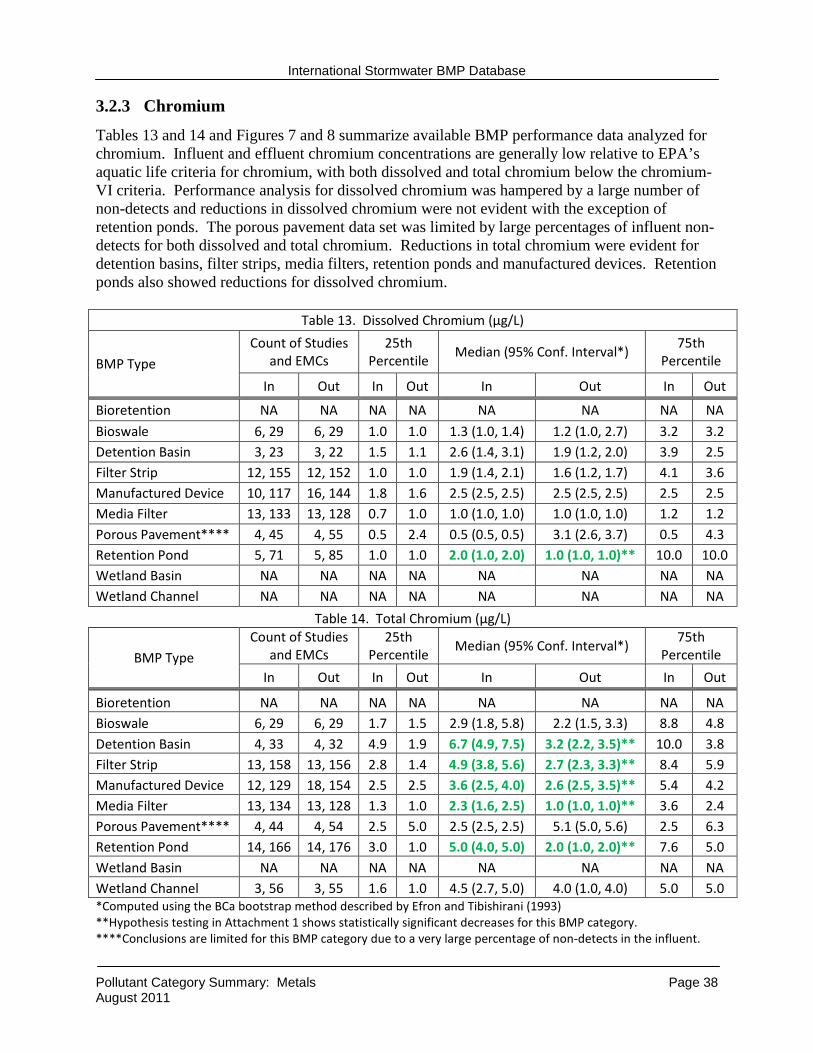
International Stormwater BMP Database
Pollutant Category Summary: Metals Page 38 August 2011
3.2.3 Chromium
Tables 13 and 14 and Figures 7 and 8 summarize available BMP performance data analyzed for chromium. Influent and effluent chromium concentrations are generally low relative to EPA’s aquatic life criteria for chromium, with both dissolved and total chromium below the chromium-VI criteria. Performance analysis for dissolved chromium was hampered by a large number of non-detects and reductions in dissolved chromium were not evident with the exception of retention ponds. The porous pavement data set was limited by large percentages of influent non-detects for both dissolved and total chromium. Reductions in total chromium were evident for detention basins, filter strips, media filters, retention ponds and manufactured devices. Retention ponds also showed reductions for dissolved chromium.
Table 13. Dissolved Chromium (µg/L)
BMP Type Count of Studies
and EMCs 25th
Percentile Median (95% Conf. Interval*)
75th Percentile
In Out In Out In Out In Out
Bioretention NA NA NA NA NA NA NA NA
Bioswale 6, 29 6, 29 1.0 1.0 1.3 (1.0, 1.4) 1.2 (1.0, 2.7) 3.2 3.2 Detention Basin 3, 23 3, 22 1.5 1.1 2.6 (1.4, 3.1) 1.9 (1.2, 2.0) 3.9 2.5 Filter Strip 12, 155 12, 152 1.0 1.0 1.9 (1.4, 2.1) 1.6 (1.2, 1.7) 4.1 3.6 Manufactured Device 10, 117 16, 144 1.8 1.6 2.5 (2.5, 2.5) 2.5 (2.5, 2.5) 2.5 2.5 Media Filter 13, 133 13, 128 0.7 1.0 1.0 (1.0, 1.0) 1.0 (1.0, 1.0) 1.2 1.2 Porous Pavement**** 4, 45 4, 55 0.5 2.4 0.5 (0.5, 0.5) 3.1 (2.6, 3.7) 0.5 4.3 Retention Pond 5, 71 5, 85 1.0 1.0 2.0 (1.0, 2.0) 1.0 (1.0, 1.0)** 10.0 10.0 Wetland Basin NA NA NA NA NA NA NA NA Wetland Channel NA NA NA NA NA NA NA NA
Table 14. Total Chromium (µg/L)
BMP Type Count of Studies
and EMCs 25th
Percentile Median (95% Conf. Interval*)
75th Percentile
In Out In Out In Out In Out
Bioretention NA NA NA NA NA NA NA NA Bioswale 6, 29 6, 29 1.7 1.5 2.9 (1.8, 5.8) 2.2 (1.5, 3.3) 8.8 4.8 Detention Basin 4, 33 4, 32 4.9 1.9 6.7 (4.9, 7.5) 3.2 (2.2, 3.5)** 10.0 3.8 Filter Strip 13, 158 13, 156 2.8 1.4 4.9 (3.8, 5.6) 2.7 (2.3, 3.3)** 8.4 5.9 Manufactured Device 12, 129 18, 154 2.5 2.5 3.6 (2.5, 4.0) 2.6 (2.5, 3.5)** 5.4 4.2 Media Filter 13, 134 13, 128 1.3 1.0 2.3 (1.6, 2.5) 1.0 (1.0, 1.0)** 3.6 2.4 Porous Pavement**** 4, 44 4, 54 2.5 5.0 2.5 (2.5, 2.5) 5.1 (5.0, 5.6) 2.5 6.3 Retention Pond 14, 166 14, 176 3.0 1.0 5.0 (4.0, 5.0) 2.0 (1.0, 2.0)** 7.6 5.0 Wetland Basin NA NA NA NA NA NA NA NA Wetland Channel 3, 56 3, 55 1.6 1.0 4.5 (2.7, 5.0) 4.0 (1.0, 4.0) 5.0 5.0 *Computed using the BCa bootstrap method described by Efron and Tibishirani (1993) **Hypothesis testing in Attachment 1 shows statistically significant decreases for this BMP category. ****Conclusions are limited for this BMP category due to a very large percentage of non-detects in the influent.
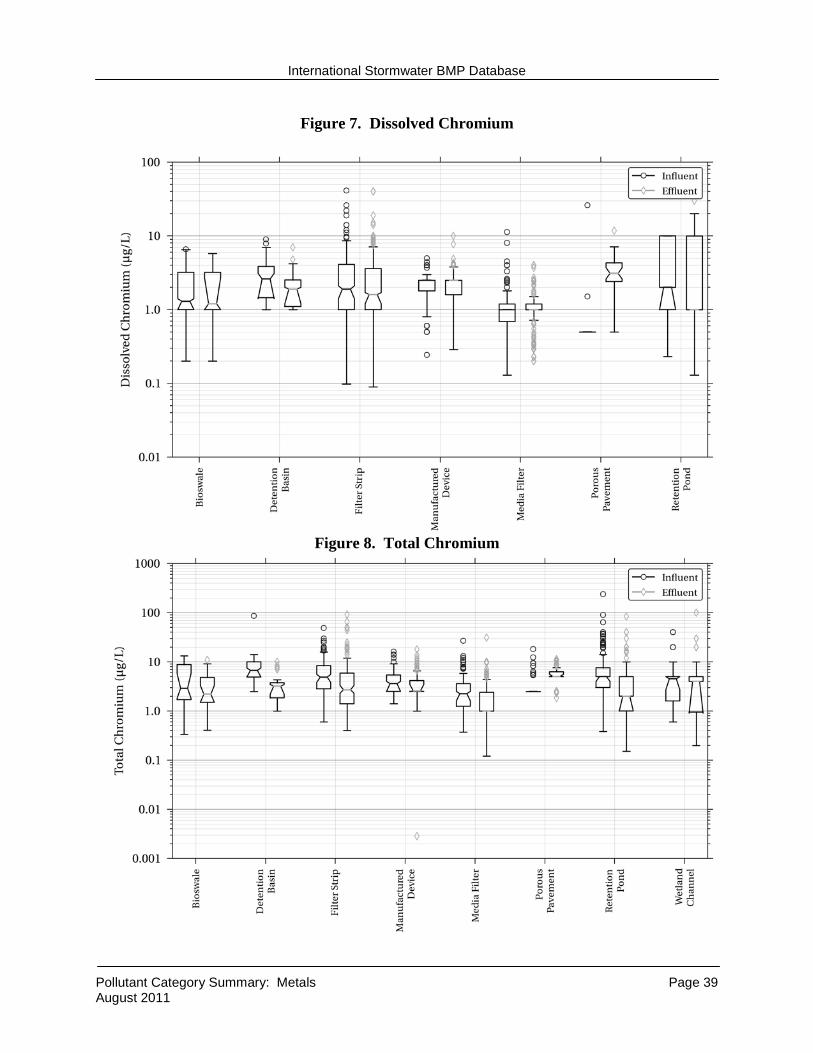
International Stormwater BMP Database
Pollutant Category Summary: Metals Page 39 August 2011
Figure 7. Dissolved Chromium
Figure 8. Total Chromium
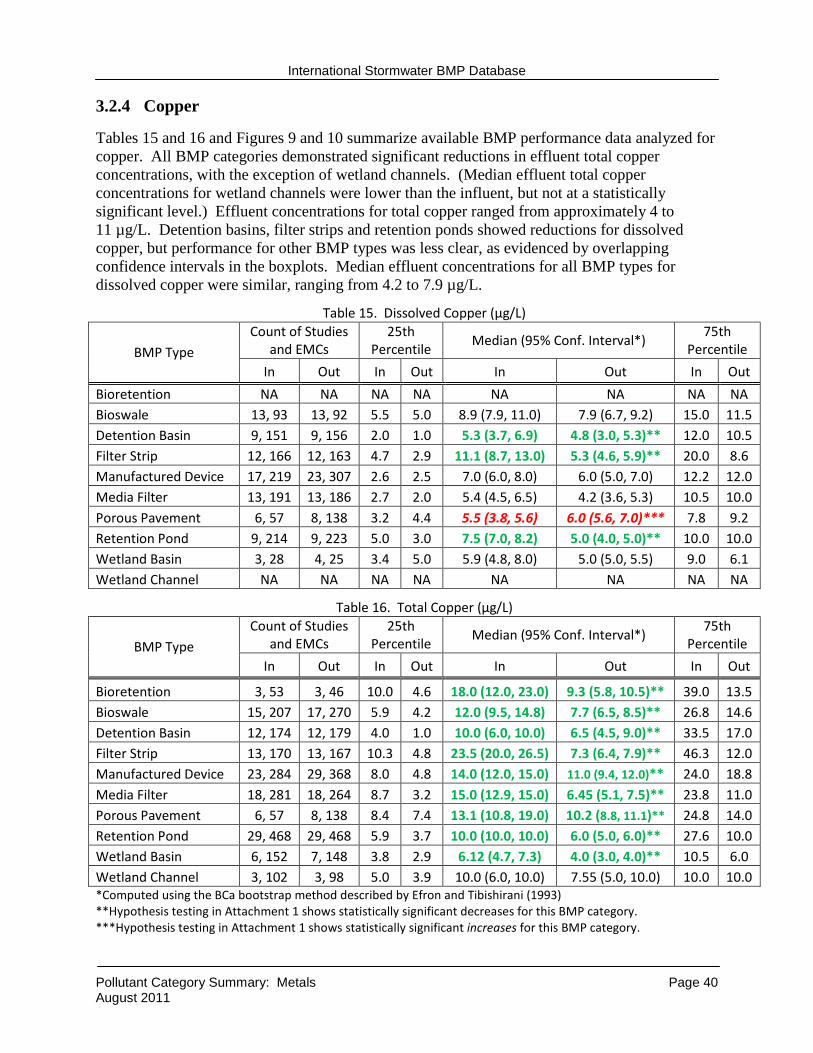
International Stormwater BMP Database
Pollutant Category Summary: Metals Page 40 August 2011
3.2.4 Copper
Tables 15 and 16 and Figures 9 and 10 summarize available BMP performance data analyzed for copper. All BMP categories demonstrated significant reductions in effluent total copper concentrations, with the exception of wetland channels. (Median effluent total copper concentrations for wetland channels were lower than the influent, but not at a statistically significant level.) Effluent concentrations for total copper ranged from approximately 4 to 11 µg/L. Detention basins, filter strips and retention ponds showed reductions for dissolved copper, but performance for other BMP types was less clear, as evidenced by overlapping confidence intervals in the boxplots. Median effluent concentrations for all BMP types for dissolved copper were similar, ranging from 4.2 to 7.9 µg/L.
Table 15. Dissolved Copper (µg/L)
BMP Type Count of Studies
and EMCs 25th
Percentile Median (95% Conf. Interval*)
75th Percentile
In Out In Out In Out In Out
Bioretention NA NA NA NA NA NA NA NA Bioswale 13, 93 13, 92 5.5 5.0 8.9 (7.9, 11.0) 7.9 (6.7, 9.2) 15.0 11.5 Detention Basin 9, 151 9, 156 2.0 1.0 5.3 (3.7, 6.9) 4.8 (3.0, 5.3)** 12.0 10.5 Filter Strip 12, 166 12, 163 4.7 2.9 11.1 (8.7, 13.0) 5.3 (4.6, 5.9)** 20.0 8.6 Manufactured Device 17, 219 23, 307 2.6 2.5 7.0 (6.0, 8.0) 6.0 (5.0, 7.0) 12.2 12.0 Media Filter 13, 191 13, 186 2.7 2.0 5.4 (4.5, 6.5) 4.2 (3.6, 5.3) 10.5 10.0 Porous Pavement 6, 57 8, 138 3.2 4.4 5.5 (3.8, 5.6) 6.0 (5.6, 7.0)*** 7.8 9.2 Retention Pond 9, 214 9, 223 5.0 3.0 7.5 (7.0, 8.2) 5.0 (4.0, 5.0)** 10.0 10.0 Wetland Basin 3, 28 4, 25 3.4 5.0 5.9 (4.8, 8.0) 5.0 (5.0, 5.5) 9.0 6.1 Wetland Channel NA NA NA NA NA NA NA NA
Table 16. Total Copper (µg/L)
BMP Type Count of Studies
and EMCs 25th
Percentile Median (95% Conf. Interval*)
75th Percentile
In Out In Out In Out In Out
Bioretention 3, 53 3, 46 10.0 4.6 18.0 (12.0, 23.0) 9.3 (5.8, 10.5)** 39.0 13.5 Bioswale 15, 207 17, 270 5.9 4.2 12.0 (9.5, 14.8) 7.7 (6.5, 8.5)** 26.8 14.6 Detention Basin 12, 174 12, 179 4.0 1.0 10.0 (6.0, 10.0) 6.5 (4.5, 9.0)** 33.5 17.0 Filter Strip 13, 170 13, 167 10.3 4.8 23.5 (20.0, 26.5) 7.3 (6.4, 7.9)** 46.3 12.0 Manufactured Device 23, 284 29, 368 8.0 4.8 14.0 (12.0, 15.0) 11.0 (9.4, 12.0)** 24.0 18.8 Media Filter 18, 281 18, 264 8.7 3.2 15.0 (12.9, 15.0) 6.45 (5.1, 7.5)** 23.8 11.0 Porous Pavement 6, 57 8, 138 8.4 7.4 13.1 (10.8, 19.0) 10.2 (8.8, 11.1)** 24.8 14.0 Retention Pond 29, 468 29, 468 5.9 3.7 10.0 (10.0, 10.0) 6.0 (5.0, 6.0)** 27.6 10.0 Wetland Basin 6, 152 7, 148 3.8 2.9 6.12 (4.7, 7.3) 4.0 (3.0, 4.0)** 10.5 6.0 Wetland Channel 3, 102 3, 98 5.0 3.9 10.0 (6.0, 10.0) 7.55 (5.0, 10.0) 10.0 10.0 *Computed using the BCa bootstrap method described by Efron and Tibishirani (1993) **Hypothesis testing in Attachment 1 shows statistically significant decreases for this BMP category. ***Hypothesis testing in Attachment 1 shows statistically significant increases for this BMP category.
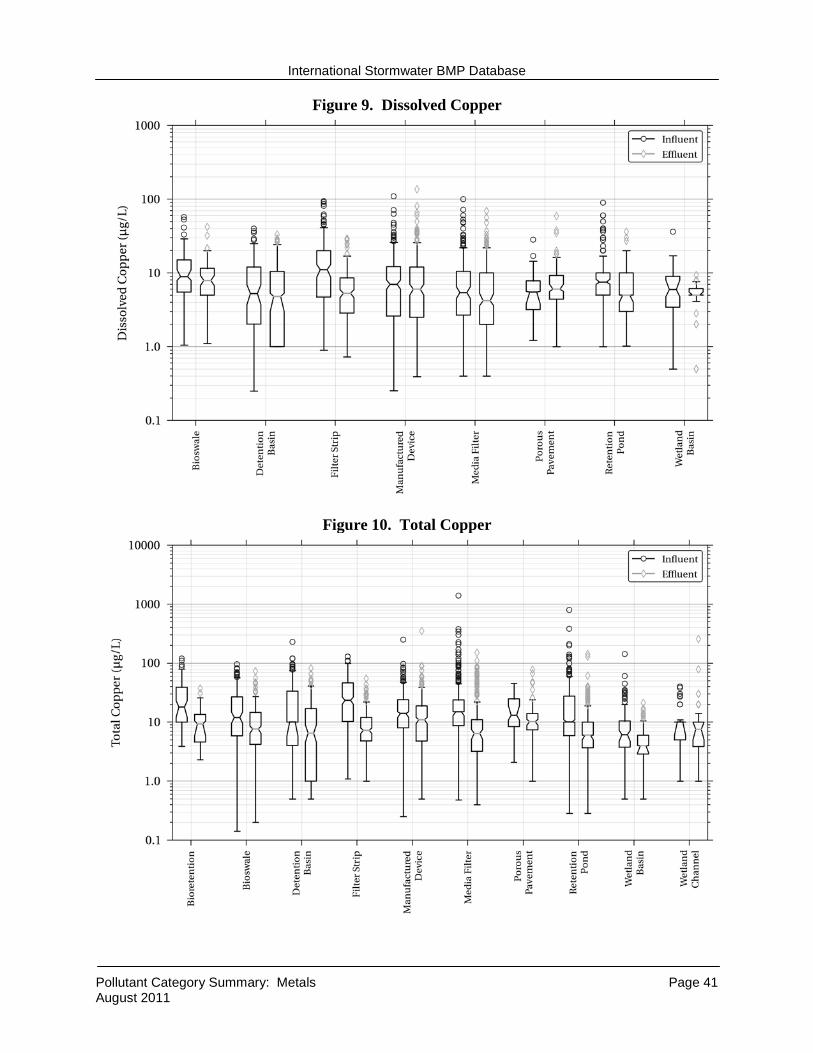
International Stormwater BMP Database
Pollutant Category Summary: Metals Page 41 August 2011
Figure 9. Dissolved Copper
Figure 10. Total Copper
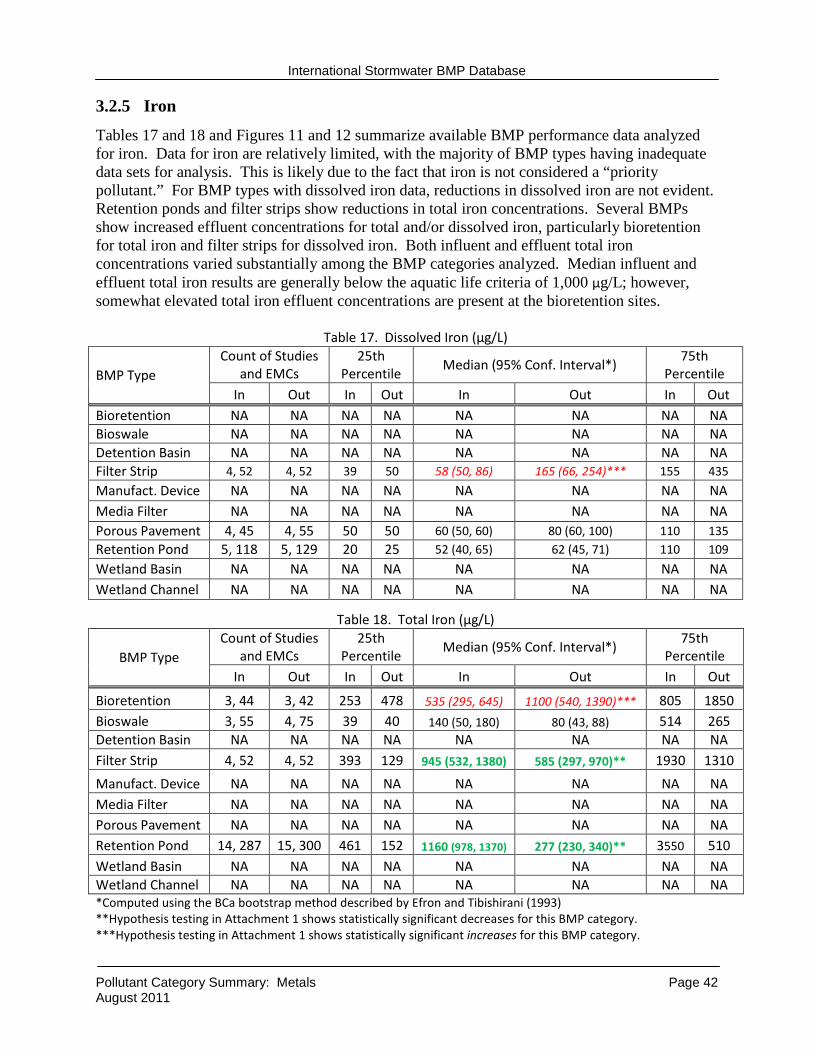
International Stormwater BMP Database
Pollutant Category Summary: Metals Page 42 August 2011
3.2.5 Iron
Tables 17 and 18 and Figures 11 and 12 summarize available BMP performance data analyzed for iron. Data for iron are relatively limited, with the majority of BMP types having inadequate data sets for analysis. This is likely due to the fact that iron is not considered a “priority pollutant.” For BMP types with dissolved iron data, reductions in dissolved iron are not evident. Retention ponds and filter strips show reductions in total iron concentrations. Several BMPs show increased effluent concentrations for total and/or dissolved iron, particularly bioretention for total iron and filter strips for dissolved iron. Both influent and effluent total iron concentrations varied substantially among the BMP categories analyzed. Median influent and effluent total iron results are generally below the aquatic life criteria of 1,000 µg/L; however, somewhat elevated total iron effluent concentrations are present at the bioretention sites.
Table 17. Dissolved Iron (µg/L)
BMP Type Count of Studies
and EMCs 25th
Percentile Median (95% Conf. Interval*)
75th Percentile
In Out In Out In Out In Out Bioretention NA NA NA NA NA NA NA NA Bioswale NA NA NA NA NA NA NA NA Detention Basin NA NA NA NA NA NA NA NA Filter Strip 4, 52 4, 52 39 50 58 (50, 86) 165 (66, 254)*** 155 435
Manufact. Device NA NA NA NA NA NA NA NA Media Filter NA NA NA NA NA NA NA NA Porous Pavement 4, 45 4, 55 50 50 60 (50, 60) 80 (60, 100) 110 135 Retention Pond 5, 118 5, 129 20 25 52 (40, 65) 62 (45, 71) 110 109
Wetland Basin NA NA NA NA NA NA NA NA Wetland Channel NA NA NA NA NA NA NA NA
Table 18. Total Iron (µg/L)
BMP Type Count of Studies
and EMCs 25th
Percentile Median (95% Conf. Interval*)
75th Percentile
In Out In Out In Out In Out
Bioretention 3, 44 3, 42 253 478 535 (295, 645) 1100 (540, 1390)*** 805 1850 Bioswale 3, 55 4, 75 39 40 140 (50, 180) 80 (43, 88) 514 265 Detention Basin NA NA NA NA NA NA NA NA Filter Strip 4, 52 4, 52 393 129 945 (532, 1380) 585 (297, 970)** 1930 1310
Manufact. Device NA NA NA NA NA NA NA NA Media Filter NA NA NA NA NA NA NA NA Porous Pavement NA NA NA NA NA NA NA NA Retention Pond 14, 287 15, 300 461 152 1160 (978, 1370) 277 (230, 340)** 3550 510 Wetland Basin NA NA NA NA NA NA NA NA Wetland Channel NA NA NA NA NA NA NA NA *Computed using the BCa bootstrap method described by Efron and Tibishirani (1993) **Hypothesis testing in Attachment 1 shows statistically significant decreases for this BMP category. ***Hypothesis testing in Attachment 1 shows statistically significant increases for this BMP category.
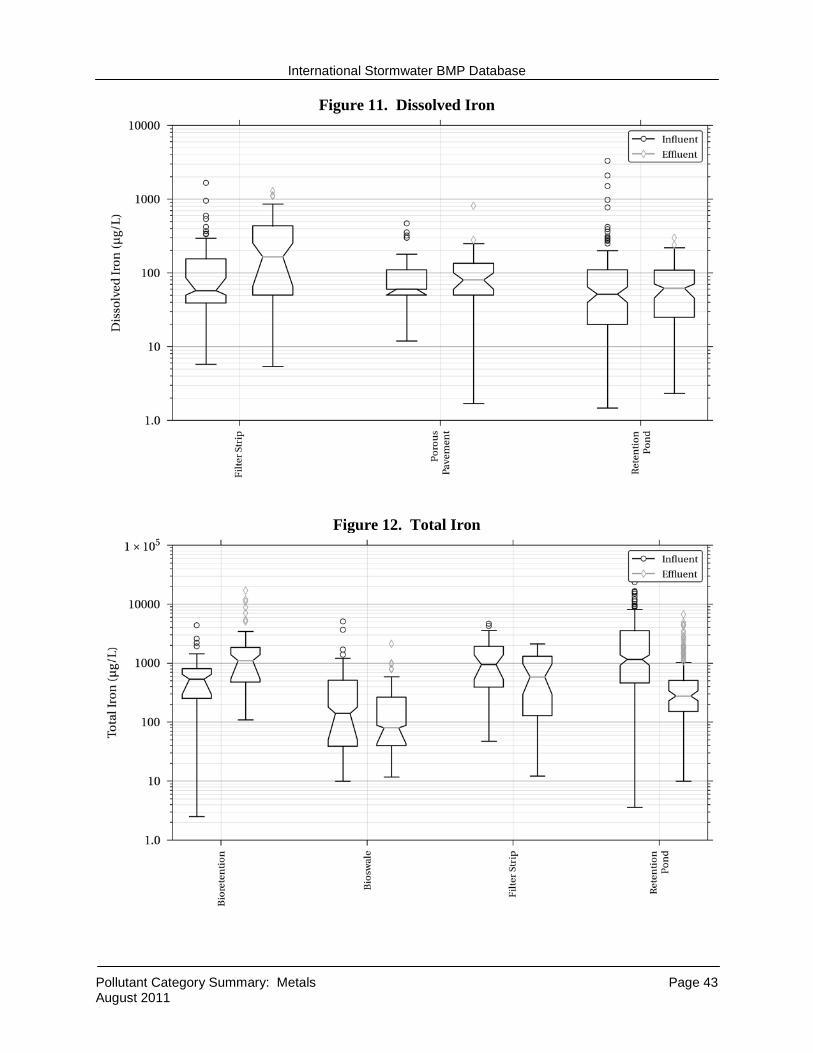
International Stormwater BMP Database
Pollutant Category Summary: Metals Page 43 August 2011
Figure 11. Dissolved Iron
Figure 12. Total Iron
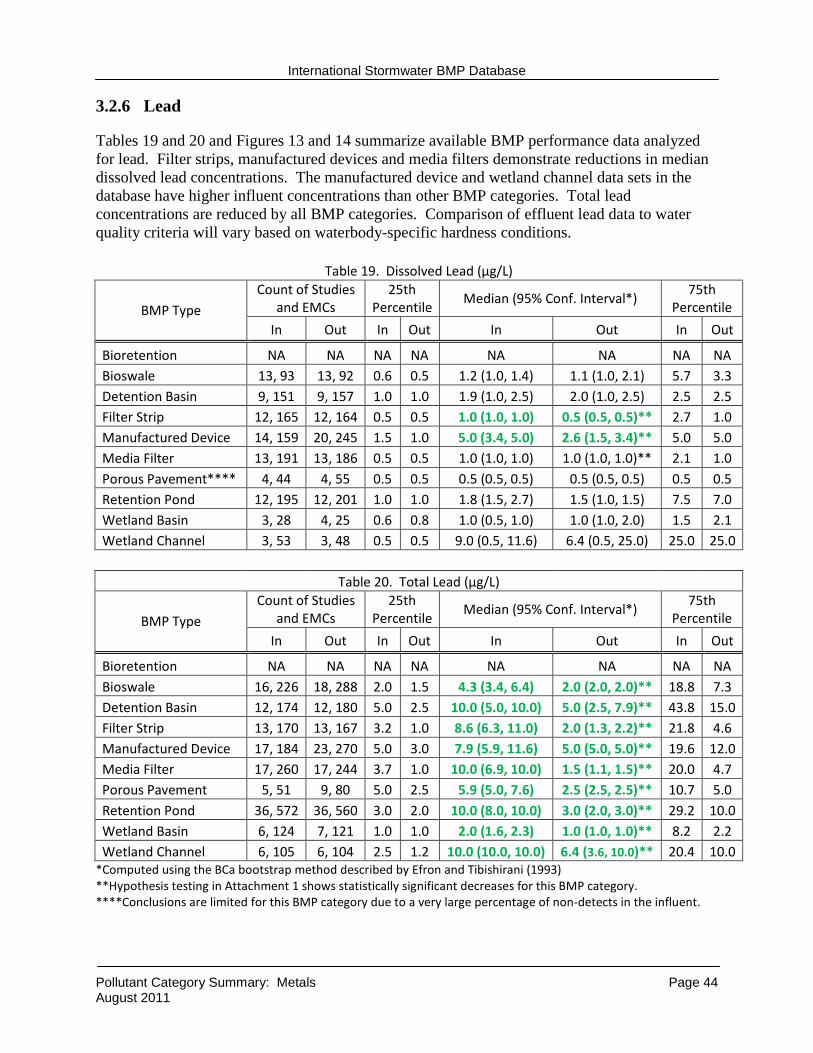
International Stormwater BMP Database
Pollutant Category Summary: Metals Page 44 August 2011
3.2.6 Lead
Tables 19 and 20 and Figures 13 and 14 summarize available BMP performance data analyzed for lead. Filter strips, manufactured devices and media filters demonstrate reductions in median dissolved lead concentrations. The manufactured device and wetland channel data sets in the database have higher influent concentrations than other BMP categories. Total lead concentrations are reduced by all BMP categories. Comparison of effluent lead data to water quality criteria will vary based on waterbody-specific hardness conditions.
Table 19. Dissolved Lead (µg/L)
BMP Type Count of Studies
and EMCs 25th
Percentile Median (95% Conf. Interval*)
75th Percentile
In Out In Out In Out In Out
Bioretention NA NA NA NA NA NA NA NA Bioswale 13, 93 13, 92 0.6 0.5 1.2 (1.0, 1.4) 1.1 (1.0, 2.1) 5.7 3.3 Detention Basin 9, 151 9, 157 1.0 1.0 1.9 (1.0, 2.5) 2.0 (1.0, 2.5) 2.5 2.5 Filter Strip 12, 165 12, 164 0.5 0.5 1.0 (1.0, 1.0) 0.5 (0.5, 0.5)** 2.7 1.0 Manufactured Device 14, 159 20, 245 1.5 1.0 5.0 (3.4, 5.0) 2.6 (1.5, 3.4)** 5.0 5.0 Media Filter 13, 191 13, 186 0.5 0.5 1.0 (1.0, 1.0) 1.0 (1.0, 1.0)** 2.1 1.0 Porous Pavement**** 4, 44 4, 55 0.5 0.5 0.5 (0.5, 0.5) 0.5 (0.5, 0.5) 0.5 0.5 Retention Pond 12, 195 12, 201 1.0 1.0 1.8 (1.5, 2.7) 1.5 (1.0, 1.5) 7.5 7.0 Wetland Basin 3, 28 4, 25 0.6 0.8 1.0 (0.5, 1.0) 1.0 (1.0, 2.0) 1.5 2.1 Wetland Channel 3, 53 3, 48 0.5 0.5 9.0 (0.5, 11.6) 6.4 (0.5, 25.0) 25.0 25.0
Table 20. Total Lead (µg/L)
BMP Type Count of Studies
and EMCs 25th
Percentile Median (95% Conf. Interval*)
75th Percentile
In Out In Out In Out In Out
Bioretention NA NA NA NA NA NA NA NA Bioswale 16, 226 18, 288 2.0 1.5 4.3 (3.4, 6.4) 2.0 (2.0, 2.0)** 18.8 7.3 Detention Basin 12, 174 12, 180 5.0 2.5 10.0 (5.0, 10.0) 5.0 (2.5, 7.9)** 43.8 15.0 Filter Strip 13, 170 13, 167 3.2 1.0 8.6 (6.3, 11.0) 2.0 (1.3, 2.2)** 21.8 4.6 Manufactured Device 17, 184 23, 270 5.0 3.0 7.9 (5.9, 11.6) 5.0 (5.0, 5.0)** 19.6 12.0 Media Filter 17, 260 17, 244 3.7 1.0 10.0 (6.9, 10.0) 1.5 (1.1, 1.5)** 20.0 4.7 Porous Pavement 5, 51 9, 80 5.0 2.5 5.9 (5.0, 7.6) 2.5 (2.5, 2.5)** 10.7 5.0 Retention Pond 36, 572 36, 560 3.0 2.0 10.0 (8.0, 10.0) 3.0 (2.0, 3.0)** 29.2 10.0 Wetland Basin 6, 124 7, 121 1.0 1.0 2.0 (1.6, 2.3) 1.0 (1.0, 1.0)** 8.2 2.2 Wetland Channel 6, 105 6, 104 2.5 1.2 10.0 (10.0, 10.0) 6.4 (3.6, 10.0)** 20.4 10.0
*Computed using the BCa bootstrap method described by Efron and Tibishirani (1993) **Hypothesis testing in Attachment 1 shows statistically significant decreases for this BMP category. ****Conclusions are limited for this BMP category due to a very large percentage of non-detects in the influent.
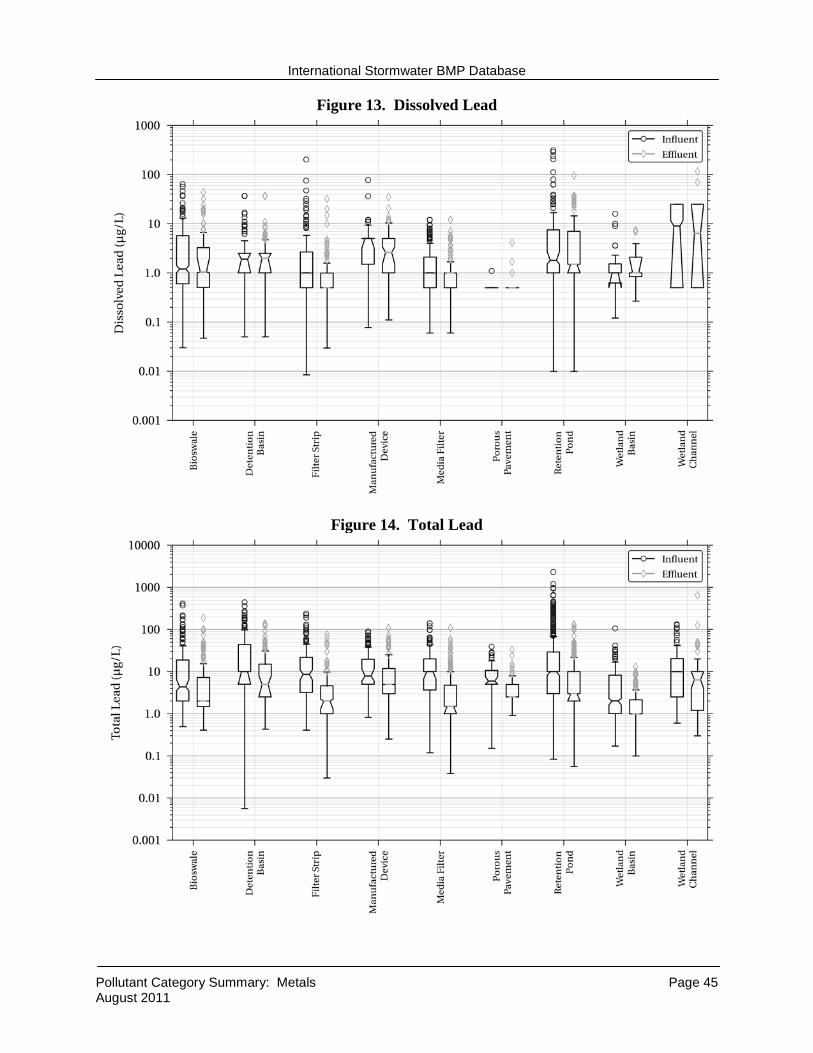
International Stormwater BMP Database
Pollutant Category Summary: Metals Page 45 August 2011
Figure 13. Dissolved Lead
Figure 14. Total Lead
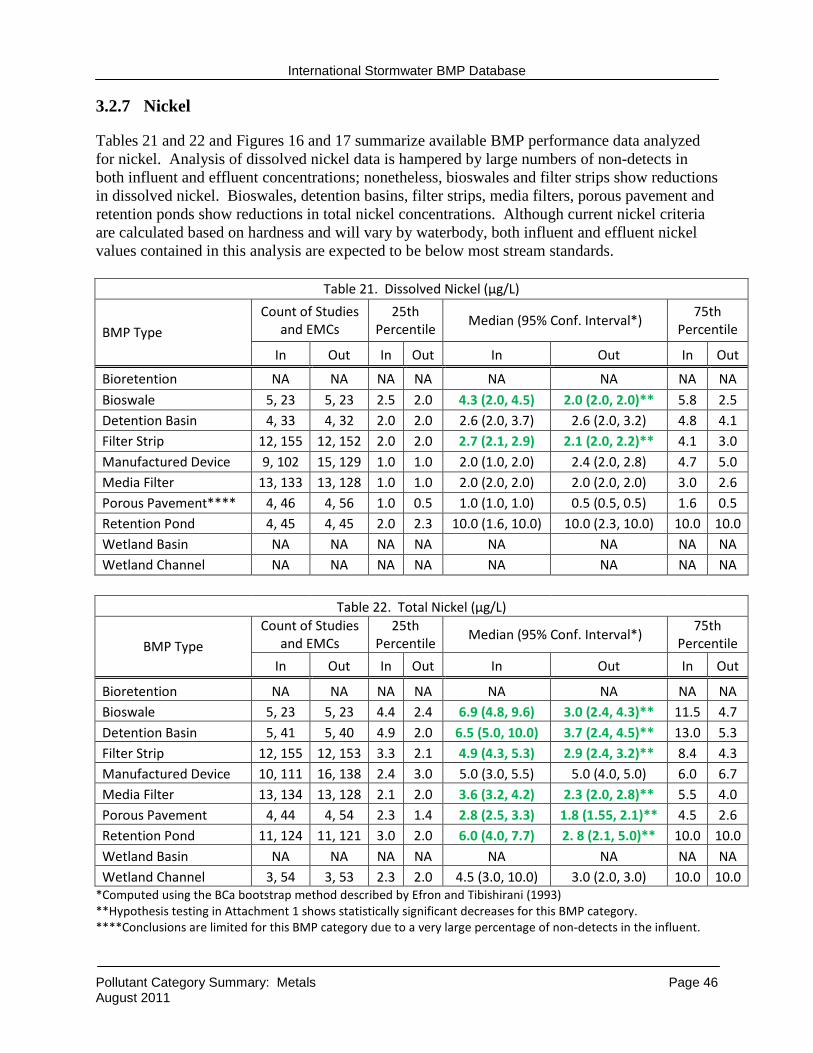
International Stormwater BMP Database
Pollutant Category Summary: Metals Page 46 August 2011
3.2.7 Nickel
Tables 21 and 22 and Figures 16 and 17 summarize available BMP performance data analyzed for nickel. Analysis of dissolved nickel data is hampered by large numbers of non-detects in both influent and effluent concentrations; nonetheless, bioswales and filter strips show reductions in dissolved nickel. Bioswales, detention basins, filter strips, media filters, porous pavement and retention ponds show reductions in total nickel concentrations. Although current nickel criteria are calculated based on hardness and will vary by waterbody, both influent and effluent nickel values contained in this analysis are expected to be below most stream standards.
Table 21. Dissolved Nickel (µg/L)
BMP Type Count of Studies
and EMCs 25th
Percentile Median (95% Conf. Interval*)
75th Percentile
In Out In Out In Out In Out
Bioretention NA NA NA NA NA NA NA NA
Bioswale 5, 23 5, 23 2.5 2.0 4.3 (2.0, 4.5) 2.0 (2.0, 2.0)** 5.8 2.5 Detention Basin 4, 33 4, 32 2.0 2.0 2.6 (2.0, 3.7) 2.6 (2.0, 3.2) 4.8 4.1 Filter Strip 12, 155 12, 152 2.0 2.0 2.7 (2.1, 2.9) 2.1 (2.0, 2.2)** 4.1 3.0 Manufactured Device 9, 102 15, 129 1.0 1.0 2.0 (1.0, 2.0) 2.4 (2.0, 2.8) 4.7 5.0 Media Filter 13, 133 13, 128 1.0 1.0 2.0 (2.0, 2.0) 2.0 (2.0, 2.0) 3.0 2.6 Porous Pavement**** 4, 46 4, 56 1.0 0.5 1.0 (1.0, 1.0) 0.5 (0.5, 0.5) 1.6 0.5 Retention Pond 4, 45 4, 45 2.0 2.3 10.0 (1.6, 10.0) 10.0 (2.3, 10.0) 10.0 10.0 Wetland Basin NA NA NA NA NA NA NA NA Wetland Channel NA NA NA NA NA NA NA NA
Table 22. Total Nickel (µg/L)
BMP Type Count of Studies
and EMCs 25th
Percentile Median (95% Conf. Interval*)
75th Percentile
In Out In Out In Out In Out
Bioretention NA NA NA NA NA NA NA NA Bioswale 5, 23 5, 23 4.4 2.4 6.9 (4.8, 9.6) 3.0 (2.4, 4.3)** 11.5 4.7 Detention Basin 5, 41 5, 40 4.9 2.0 6.5 (5.0, 10.0) 3.7 (2.4, 4.5)** 13.0 5.3 Filter Strip 12, 155 12, 153 3.3 2.1 4.9 (4.3, 5.3) 2.9 (2.4, 3.2)** 8.4 4.3 Manufactured Device 10, 111 16, 138 2.4 3.0 5.0 (3.0, 5.5) 5.0 (4.0, 5.0) 6.0 6.7 Media Filter 13, 134 13, 128 2.1 2.0 3.6 (3.2, 4.2) 2.3 (2.0, 2.8)** 5.5 4.0 Porous Pavement 4, 44 4, 54 2.3 1.4 2.8 (2.5, 3.3) 1.8 (1.55, 2.1)** 4.5 2.6 Retention Pond 11, 124 11, 121 3.0 2.0 6.0 (4.0, 7.7) 2. 8 (2.1, 5.0)** 10.0 10.0 Wetland Basin NA NA NA NA NA NA NA NA Wetland Channel 3, 54 3, 53 2.3 2.0 4.5 (3.0, 10.0) 3.0 (2.0, 3.0) 10.0 10.0
*Computed using the BCa bootstrap method described by Efron and Tibishirani (1993) **Hypothesis testing in Attachment 1 shows statistically significant decreases for this BMP category. ****Conclusions are limited for this BMP category due to a very large percentage of non-detects in the influent.
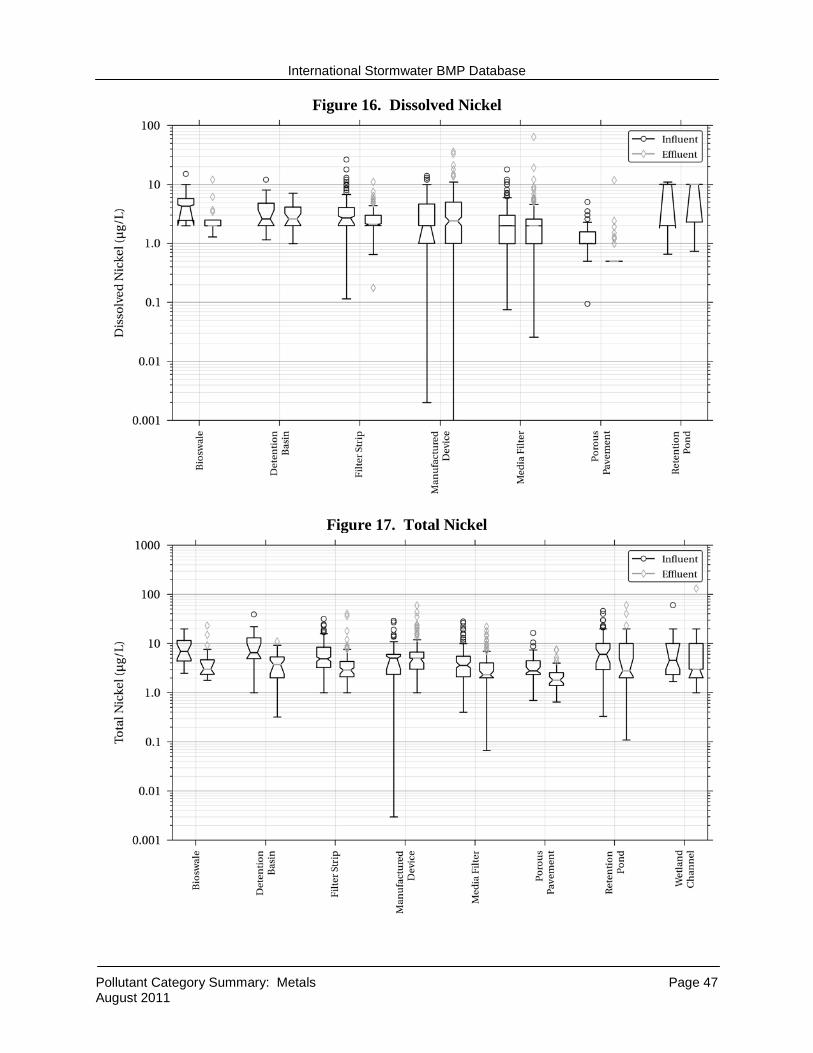
International Stormwater BMP Database
Pollutant Category Summary: Metals Page 47 August 2011
Figure 16. Dissolved Nickel
Figure 17. Total Nickel
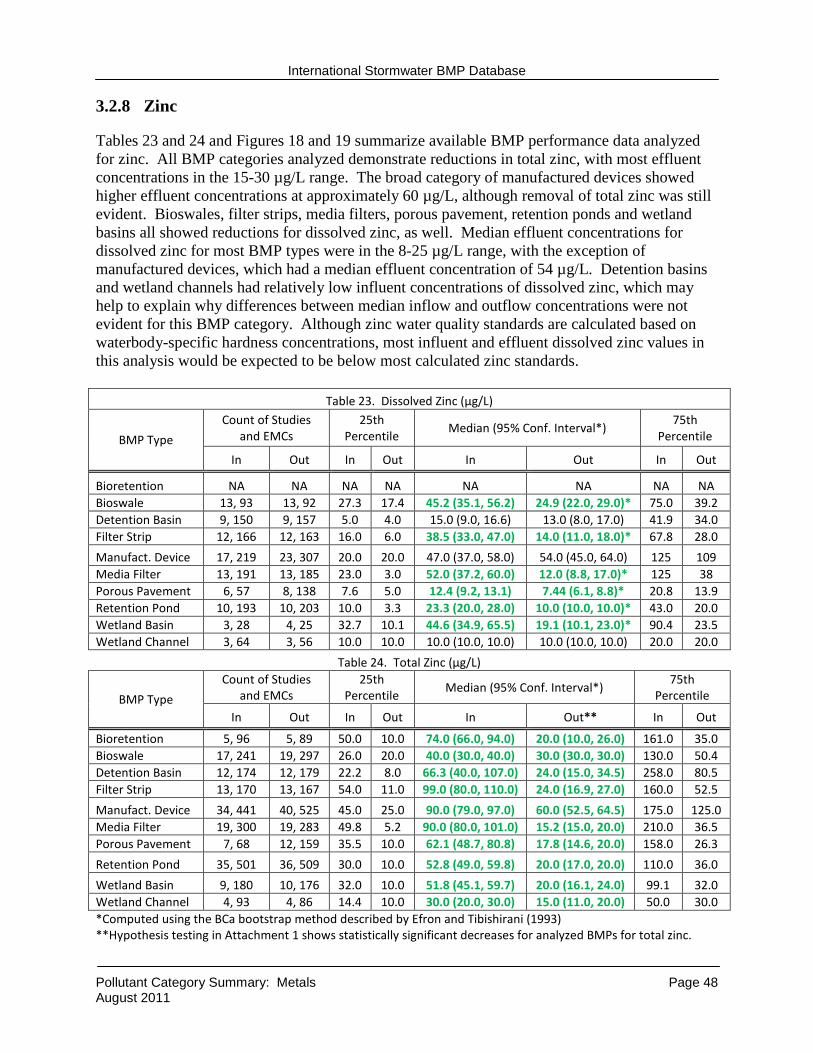
International Stormwater BMP Database
Pollutant Category Summary: Metals Page 48 August 2011
3.2.8 Zinc
Tables 23 and 24 and Figures 18 and 19 summarize available BMP performance data analyzed for zinc. All BMP categories analyzed demonstrate reductions in total zinc, with most effluent concentrations in the 15-30 µg/L range. The broad category of manufactured devices showed higher effluent concentrations at approximately 60 µg/L, although removal of total zinc was still evident. Bioswales, filter strips, media filters, porous pavement, retention ponds and wetland basins all showed reductions for dissolved zinc, as well. Median effluent concentrations for dissolved zinc for most BMP types were in the 8-25 µg/L range, with the exception of manufactured devices, which had a median effluent concentration of 54 µg/L. Detention basins and wetland channels had relatively low influent concentrations of dissolved zinc, which may help to explain why differences between median inflow and outflow concentrations were not evident for this BMP category. Although zinc water quality standards are calculated based on waterbody-specific hardness concentrations, most influent and effluent dissolved zinc values in this analysis would be expected to be below most calculated zinc standards.
Table 23. Dissolved Zinc (µg/L)
BMP Type
Count of Studies and EMCs
25th Percentile
Median (95% Conf. Interval*) 75th
Percentile
In Out In Out In Out In Out
Bioretention NA NA NA NA NA NA NA NA Bioswale 13, 93 13, 92 27.3 17.4 45.2 (35.1, 56.2) 24.9 (22.0, 29.0)* 75.0 39.2 Detention Basin 9, 150 9, 157 5.0 4.0 15.0 (9.0, 16.6) 13.0 (8.0, 17.0) 41.9 34.0 Filter Strip 12, 166 12, 163 16.0 6.0 38.5 (33.0, 47.0) 14.0 (11.0, 18.0)* 67.8 28.0
Manufact. Device 17, 219 23, 307 20.0 20.0 47.0 (37.0, 58.0) 54.0 (45.0, 64.0) 125 109 Media Filter 13, 191 13, 185 23.0 3.0 52.0 (37.2, 60.0) 12.0 (8.8, 17.0)* 125 38 Porous Pavement 6, 57 8, 138 7.6 5.0 12.4 (9.2, 13.1) 7.44 (6.1, 8.8)* 20.8 13.9 Retention Pond 10, 193 10, 203 10.0 3.3 23.3 (20.0, 28.0) 10.0 (10.0, 10.0)* 43.0 20.0 Wetland Basin 3, 28 4, 25 32.7 10.1 44.6 (34.9, 65.5) 19.1 (10.1, 23.0)* 90.4 23.5 Wetland Channel 3, 64 3, 56 10.0 10.0 10.0 (10.0, 10.0) 10.0 (10.0, 10.0) 20.0 20.0
Table 24. Total Zinc (µg/L)
BMP Type
Count of Studies and EMCs
25th Percentile
Median (95% Conf. Interval*) 75th
Percentile
In Out In Out In Out** In Out
Bioretention 5, 96 5, 89 50.0 10.0 74.0 (66.0, 94.0) 20.0 (10.0, 26.0) 161.0 35.0 Bioswale 17, 241 19, 297 26.0 20.0 40.0 (30.0, 40.0) 30.0 (30.0, 30.0) 130.0 50.4 Detention Basin 12, 174 12, 179 22.2 8.0 66.3 (40.0, 107.0) 24.0 (15.0, 34.5) 258.0 80.5 Filter Strip 13, 170 13, 167 54.0 11.0 99.0 (80.0, 110.0) 24.0 (16.9, 27.0) 160.0 52.5
Manufact. Device 34, 441 40, 525 45.0 25.0 90.0 (79.0, 97.0) 60.0 (52.5, 64.5) 175.0 125.0 Media Filter 19, 300 19, 283 49.8 5.2 90.0 (80.0, 101.0) 15.2 (15.0, 20.0) 210.0 36.5 Porous Pavement 7, 68 12, 159 35.5 10.0 62.1 (48.7, 80.8) 17.8 (14.6, 20.0) 158.0 26.3
Retention Pond 35, 501 36, 509 30.0 10.0 52.8 (49.0, 59.8) 20.0 (17.0, 20.0) 110.0 36.0
Wetland Basin 9, 180 10, 176 32.0 10.0 51.8 (45.1, 59.7) 20.0 (16.1, 24.0) 99.1 32.0 Wetland Channel 4, 93 4, 86 14.4 10.0 30.0 (20.0, 30.0) 15.0 (11.0, 20.0) 50.0 30.0 *Computed using the BCa bootstrap method described by Efron and Tibishirani (1993) **Hypothesis testing in Attachment 1 shows statistically significant decreases for analyzed BMPs for total zinc.
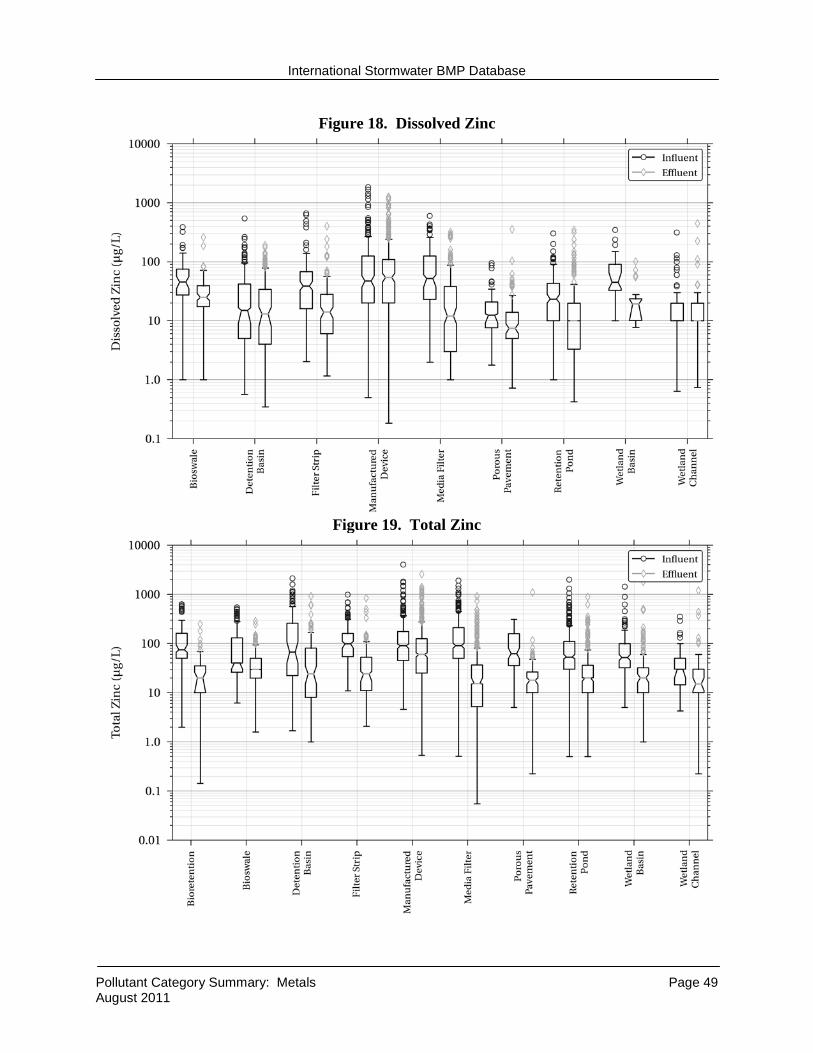
International Stormwater BMP Database
Pollutant Category Summary: Metals Page 49 August 2011
Figure 18. Dissolved Zinc
Figure 19. Total Zinc
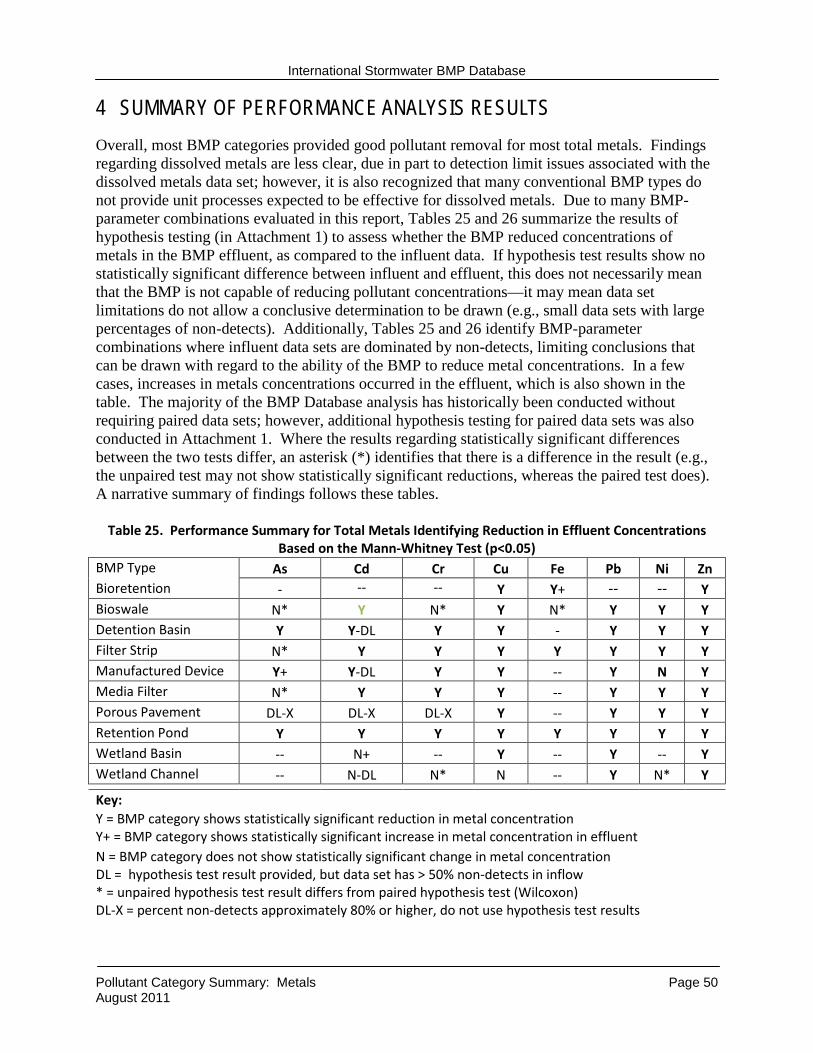
International Stormwater BMP Database
Pollutant Category Summary: Metals Page 50 August 2011
4 SUMMARY OF PERFORMANCE ANALYSIS RESULTS Overall, most BMP categories provided good pollutant removal for most total metals. Findings regarding dissolved metals are less clear, due in part to detection limit issues associated with the dissolved metals data set; however, it is also recognized that many conventional BMP types do not provide unit processes expected to be effective for dissolved metals. Due to many BMP-parameter combinations evaluated in this report, Tables 25 and 26 summarize the results of hypothesis testing (in Attachment 1) to assess whether the BMP reduced concentrations of metals in the BMP effluent, as compared to the influent data. If hypothesis test results show no statistically significant difference between influent and effluent, this does not necessarily mean that the BMP is not capable of reducing pollutant concentrations—it may mean data set limitations do not allow a conclusive determination to be drawn (e.g., small data sets with large percentages of non-detects). Additionally, Tables 25 and 26 identify BMP-parameter combinations where influent data sets are dominated by non-detects, limiting conclusions that can be drawn with regard to the ability of the BMP to reduce metal concentrations. In a few cases, increases in metals concentrations occurred in the effluent, which is also shown in the table. The majority of the BMP Database analysis has historically been conducted without requiring paired data sets; however, additional hypothesis testing for paired data sets was also conducted in Attachment 1. Where the results regarding statistically significant differences between the two tests differ, an asterisk (*) identifies that there is a difference in the result (e.g., the unpaired test may not show statistically significant reductions, whereas the paired test does). A narrative summary of findings follows these tables.
Table 25. Performance Summary for Total Metals Identifying Reduction in Effluent Concentrations Based on the Mann-Whitney Test (p<0.05)
BMP Type As Cd Cr Cu Fe Pb Ni Zn Bioretention - -- -- Y Y+ -- -- Y Bioswale N* Y N* Y N* Y Y Y Detention Basin Y Y-DL Y Y - Y Y Y Filter Strip N* Y Y Y Y Y Y Y Manufactured Device Y+ Y-DL Y Y -- Y N Y Media Filter N* Y Y Y -- Y Y Y Porous Pavement DL-X DL-X DL-X Y -- Y Y Y Retention Pond Y Y Y Y Y Y Y Y Wetland Basin -- N+ -- Y -- Y -- Y Wetland Channel -- N-DL N* N -- Y N* Y
Key: Y = BMP category shows statistically significant reduction in metal concentration
Y+ = BMP category shows statistically significant increase in metal concentration in effluent N = BMP category does not show statistically significant change in metal concentration
DL = hypothesis test result provided, but data set has > 50% non-detects in inflow * = unpaired hypothesis test result differs from paired hypothesis test (Wilcoxon) DL-X = percent non-detects approximately 80% or higher, do not use hypothesis test results
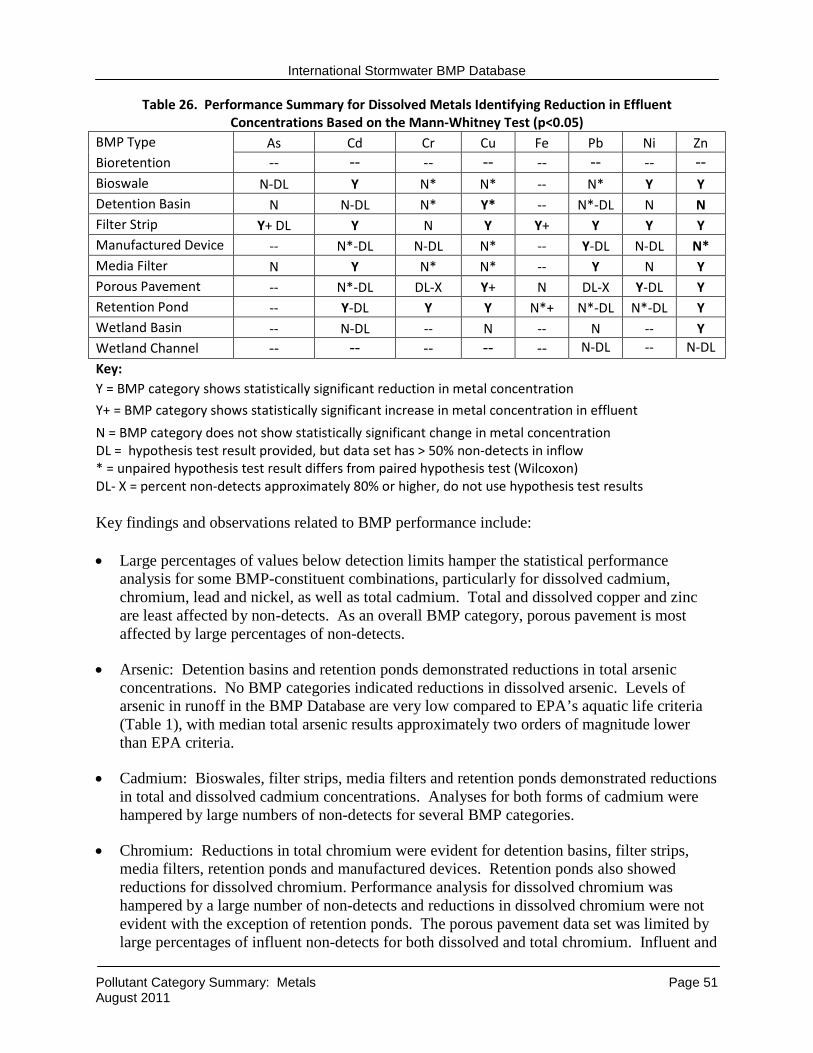
International Stormwater BMP Database
Pollutant Category Summary: Metals Page 51 August 2011
Table 26. Performance Summary for Dissolved Metals Identifying Reduction in Effluent Concentrations Based on the Mann-Whitney Test (p<0.05)
BMP Type As Cd Cr Cu Fe Pb Ni Zn Bioretention -- -- -- -- -- -- -- -- Bioswale N-DL Y N* N* -- N* Y Y Detention Basin N N-DL N* Y* -- N*-DL N N Filter Strip Y+ DL Y N Y Y+ Y Y Y Manufactured Device -- N*-DL N-DL N* -- Y-DL N-DL N* Media Filter N Y N* N* -- Y N Y Porous Pavement -- N*-DL DL-X Y+ N DL-X Y-DL Y Retention Pond -- Y-DL Y Y N*+ N*-DL N*-DL Y Wetland Basin -- N-DL -- N -- N -- Y Wetland Channel -- -- -- -- -- N-DL -- N-DL
Key: Y = BMP category shows statistically significant reduction in metal concentration
Y+ = BMP category shows statistically significant increase in metal concentration in effluent
N = BMP category does not show statistically significant change in metal concentration DL = hypothesis test result provided, but data set has > 50% non-detects in inflow
* = unpaired hypothesis test result differs from paired hypothesis test (Wilcoxon) DL- X = percent non-detects approximately 80% or higher, do not use hypothesis test results Key findings and observations related to BMP performance include: • Large percentages of values below detection limits hamper the statistical performance
analysis for some BMP-constituent combinations, particularly for dissolved cadmium, chromium, lead and nickel, as well as total cadmium. Total and dissolved copper and zinc are least affected by non-detects. As an overall BMP category, porous pavement is most affected by large percentages of non-detects.
• Arsenic: Detention basins and retention ponds demonstrated reductions in total arsenic concentrations. No BMP categories indicated reductions in dissolved arsenic. Levels of arsenic in runoff in the BMP Database are very low compared to EPA’s aquatic life criteria (Table 1), with median total arsenic results approximately two orders of magnitude lower than EPA criteria.
• Cadmium: Bioswales, filter strips, media filters and retention ponds demonstrated reductions in total and dissolved cadmium concentrations. Analyses for both forms of cadmium were hampered by large numbers of non-detects for several BMP categories.
• Chromium: Reductions in total chromium were evident for detention basins, filter strips, media filters, retention ponds and manufactured devices. Retention ponds also showed reductions for dissolved chromium. Performance analysis for dissolved chromium was hampered by a large number of non-detects and reductions in dissolved chromium were not evident with the exception of retention ponds. The porous pavement data set was limited by large percentages of influent non-detects for both dissolved and total chromium. Influent and
International Stormwater BMP Database
Pollutant Category Summary: Metals Page 52 August 2011
effluent chromium concentrations were generally low relative to EPA’s aquatic life criteria for chromium, with both dissolved and total chromium below the chromium-VI criteria.
• Copper: All BMP categories demonstrated significant reductions in effluent total copper concentrations, with the exception of wetland channels. (Median effluent total copper concentrations for wetland channels were lower than the influent, but not at a statistically significant level.) Effluent concentrations for total copper ranged from approximately 4 to 11 µg/L. Detention basins, filter strips and retention ponds showed reductions for dissolved copper, but performance for other BMP types was less clear, as evidenced by overlapping confidence intervals in the boxplots. Median effluent concentrations for all BMP types for dissolved copper were similar, ranging from 4.2 to 7.9 µg/L.
• Iron: Data for iron are relatively limited, with the majority of BMP types having inadequate data sets for analysis. This is likely due to the fact that iron is not considered a “priority pollutant.” For BMP types with dissolved iron data, reductions in dissolved iron are not evident, with influent and effluent distributions overlapping. Retention ponds and filter strips show reductions in total iron concentrations; whereas, other BMP categories have overlapping influent and effluent concentrations. Several BMP types suggest increased effluent concentrations for total and/or dissolved iron, particularly bioretention for total iron and filter strips for dissolved iron. Native soils and placed media mixes may have high iron content, which may be mobilized under reduced conditions. Both influent and effluent total iron concentrations varied substantially among the BMP categories analyzed. Median influent and effluent total iron results are generally below the aquatic life criteria of 1,000 µg/L; however, somewhat elevated total iron concentrations are present at the bioretention sites in this analysis.
• Lead: Total lead concentrations are reduced by all BMP categories. Filter strips, manufactured devices and media filters demonstrate reductions in median dissolved lead concentrations. The manufactured device and wetland channel data sets in the database have higher influent concentrations than other BMP categories. Comparison of effluent lead data to water quality criteria will vary based on waterbody-specific hardness conditions.
• Nickel: Bioswales, detention basins, filter strips, media filters, porous pavement and retention ponds show reductions in total nickel concentrations. Analysis of dissolved nickel data is hampered by large numbers of non-detects in both influent and effluent concentrations; nonetheless, bioswales and filter strips show reductions in dissolved nickel. Although current nickel criteria are calculated based on hardness and will vary by waterbody, both influent and effluent nickel values contained in this analysis are expected to be below most stream standards.
• Zinc: All BMP categories analyzed demonstrate reductions in total zinc, with most effluent concentrations in the 15-30 µg/L range. The broad category of manufactured devices showed higher effluent concentrations at approximately 60 µg/L, although removal of total zinc was still evident. Bioswales, filter strips, media filters, porous pavement, retention ponds and wetland basins all showed reductions for dissolved zinc, as well. Median effluent concentrations for dissolved zinc for most BMP types were in the 8-25 µg/L range, with the exception of manufactured devices, which had a median effluent concentration of 54 µg/L.
International Stormwater BMP Database
Pollutant Category Summary: Metals Page 53 August 2011
Detention basins and wetland channels had relatively low influent concentrations of dissolved zinc, which may help to explain why differences between median inflow and outflow concentrations were not evident for this BMP category. Although zinc water quality standards are calculated based on waterbody-specific hardness concentrations, most influent and effluent dissolved zinc values in this analysis would be expected to be below most calculated zinc standards.
5 RECOMMENDATIONS AND LIMITATIONS Recommendations and limitations for use of the BMP Database data set and these performance analysis summaries include: • Several BMP categories have very limited metals data sets, particularly bioretention, porous
pavement, wetland basins and wetland swales. Additional data for these BMP categories is needed to conduct meaningful analyses and/or strengthen conclusions regarding BMP performance.
• The manufactured device category contains a wide range of unit treatment processes. Additional analysis of subclasses of manufactured devices based on unit treatment processes would be beneficial for this category, particularly since effluent concentrations for this overall BMP category were higher than some of the other BMP categories for several metals. Because manufactured devices tend to be installed in dirtier, space-limited, ultra-urban areas, higher effluent concentrations may be related to higher influent concentrations in such settings. For this reason, it may be worthwhile to compare performance of various BMP categories in similar land-use settings.
• Although this analysis used a more advanced method for addressing non-detects, as opposed to a simple substitution method, the data analysis is still influenced by large numbers of non-detects. Additional evaluation or screening of the data set may be warranted, depending on the objectives of the research being conducted. For advanced methods for handling non-detects, see Helsel (2005) and Helsel and Hirsch (2002). Close attention to adequately low detection limits for metals as part of monitoring plan development can help reduce issues during data analysis (Pitt 2007).
• Statistical analysis provided in this broad-scale evaluation would be enhanced by power analysis, which considers variation of the data and numbers of valid observations needed to predict the level of pollutant concentration reduction that could be detected from the data set. For guidance on applying these techniques, see Burton and Pitt (2004) and/or Appendix D of the Urban Stormwater BMP Monitoring Manual (www.bmpdatabase.org, Geosyntec and WWE 2008).
• For BMP-parameter combinations with moderate to high percentages of non-detects, database users may want to supplement the findings of this broad-level evaluation with analysis results for individual BMP studies, downloadable from the on-line BMP Database search tool (www.bmpdatabase.org).
International Stormwater BMP Database
Pollutant Category Summary: Metals Page 54 August 2011
• Researchers using the dissolved metals data set should be aware of several issues related to monitoring, analyzing and interpreting dissolved metals, as discussed in Section 1.4 above.
6 REFERENCES Barrett, M., L.B. Irish, J.F. Malina, and R.J. Charbeneau. 1998. Characterization of highway
runoff in Austin, Texas. Journal of Environmental Engineering. 124(2): 131-137.
Clark, S.E., Steele, K.A., Spicher, Siu, C.Y.S., Lalor, M.M., Pitt, R., and J.T. Kirby. 2008. “Roofing materials’ contributions to stormwater runoff pollution,” Journal of Irrigation and Drainage Engineering. Vol. 134. no. 5, pp. 638-645.
Breault, R.F., and Granato, G.E., 2002, A Synopsis of Technical Issues for Monitoring Trace Elements in Highway and Urban Runoff. In: National Highway Runoff Water-Quality Data and Methodology Synthesis, Volume I -- Technical issues for monitoring highway runoff and urban stormwater. Granato, G.E., Zenone, C., and Cazenas, P.A. (eds.). Washington, D.C., U.S. Department of Transportation, Federal Highway Administration, FHWA-EP-03-054, 479.
Crunkilton, R., J. Kleist, J. Ramcheck, W. DeVita, and D. Villeneuve. 1996. Assessment of the Response of Aquatic Organism to Long-term In Situ Exposures of Urban Runoff. Effects of Watershed Development and Management of Aquatic Ecosystems, Proceedings of the ASCE Conference. Roesner, L.A. Editor. Snowbird, Utah.
Davis, A.P., Shokouhian, M., Sharma, H. and C. Minami, 2001. Laboratory Study of Biological Retention for Urban Storm Water Management. Water Environment Research, 73(1), 5-14.
Driver, N.E. and G.D. Tasker. 1990. Techniques for Estimation of Storm-Runoff Loads, Volumes, and Selected Constituent Concentrations in Urban Watersheds in the United States. Water Supply Paper 2363. U.S. Geological Survey, Reston, VA.
Ferguson, J.E. and D.E. Ryan. 1984. The elemental composition of street dust from large and small urban areas related to city type, source, and particulate size. The Science of the Total Environment 34: 101-116.
Geosyntec and Wright Water Engineers, 2009. Urban Stormwater BMP Performance Monitoring. Prepared under support by the USEPA, WERF, FHWA and EWRI/ASCE. (http://www.bmpdatabase.org/MonitoringEval.htm#MonitoringGuidance).
Geosyntec and Wright Water Engineers, 2011. International Stormwater BMP Database Pollutant Summary Category: Solids (TSS, TDS and Turbidity). (http://www.bmpdatabase.org/BMPPerformance.htm)
Glenn, D. III, Dingfang, L., Sansalone, J. 2002. Influence of Chemistry and Suspended Solids on Partitioning on Heavy Metals to particles – Considerations for In-situ Controls of Urban Stormwater Quality. Proceedings of the Ninth International Conference on Urban Drainage, Sept. 8-13. Portland, OR.
International Stormwater BMP Database
Pollutant Category Summary: Metals Page 55 August 2011
Good, J. 1993. Roof Runoff as a Diffuse Source of Metals and Aquatic Toxicology in Stormwater. Water Science Technology 28(3-5): 317-322.
Granato, G.E., Zenone, C., and Cazenas, P.A. (eds.). 2002. National Highway Runoff Water-Quality Data and Methodology Synthesis, Volume I --Technical issues for monitoring highway runoff and urban stormwater. U.S. Department of Transportation, Federal Highway Administration. FHWA-EP- 03-054. 479 p.
Helsel D.R., and Hirsch, R.M. 2002. Statistical Methods in Water Resources, U.S. Geological Survey, Techniques of Water-Resources Investigations Book 4, Chapter A3. (accessible on-line only at http://pubs.usgs.gov/twri/twri4a3/)
Helsel, D.R. 2005. Nondetects and data analysis: New York, Wiley, 250 p.
Hendricks, D. W. 2006. Water Treatment Unit Processes: Physical and Chemical. CRC Press.
Hsieh, C. and A.P. Davis, 2005. Evaluation and Optimization of Bioretention Media for Treatment of Urban Storm Water Runoff. Journal of Environmental Engineering. ASCE, 131(11), 1521-1531.
Kadlec, R.H. and Wallace, S.D. 2008. Treatment Wetlands (2nd edition). CRC Press.
Karathanasis, A.D., 1999. Subsurface Migration of Copper and Zinc Mediated by Soil Colloids. Soil Sci. Soc. Am. J., July 1, 1999; 63(4): 830 - 838.
May, C.W., Horner, R.R., Karr, J.R., Mar, B.W., and E.B.Welch. 1997. Effects of urbanization on small streams in the Puget Sound lowland eco-region. Watershed Protection Techniques 2(4): 483-494.
McGill, R., Tukey; J. W. and W. A. Larsen. 1978. Variations of Box Plots, The American Statistician, Vol. 32, No. 1., pp. 12-16.
Metcalf & Eddy, 2003. Wastewater Engineering, Treatment and Reuse. New Delhi: Tata. McGraw-Hill Publishing Company Limited.
Minton, G. 2005. Stormwater Treatment. Sheridan Books, Inc., Chelsea, Michigan.
Morquecho, R. 2005. Pollutant Associations with Particulates in Stormwater, dissertation submitted in partial fulfillment of the requirements for the degree of Doctor of Philosophy in the Department of Civil and Environmental Engineering in the Graduate School of the University of Alabama, Tuscaloosa.
Oberts, G. 1994. Influence of Snowmelt Dynamics on Stormwater Runoff Quality. Watershed Protection Techniques. 1(2):55-61.
Pitt, R., R. Field, M. Lalor, and M. Brown. 1995. Urban stormwater toxic pollutants: assessment, sources, and treatability. Water Environment Research 67(3):260-275.
International Stormwater BMP Database
Pollutant Category Summary: Metals Page 56 August 2011
Pitt, R. 2002. Receiving Water Impacts Associated with Urban Runoff. In: Hoffman, D., B. Rattner, G. Burton, and J. Cairns, Editors: Handbook of Ecotoxicology, 2nd Edition. CRC Press NY.
Pitt, R. 2007. Module 4a: Effects of Non-Detected Observations and Selection of Analytical Methods. February 21, 2007. http://rpitt.eng.ua.edu/Class/ExperimentalDesignFieldSampling/Module%204/Test.htm
Pitt, R. and S. Clark, 2010. Evaluation of Biofiltration Media for Engineered Natural Treatment Systems. Expert Panel Metals Background Report for Santa Susana Field Laboratory. Prepared for Geosyntec Consultants for The Boeing Company. May 10.
Pitt, R. Bannerman, R. Clark, S. and D. Williamson, 2004a. Source of Pollutants in Urban Areas (Part 1) – Older Monitoring Projects, Chapter 23 in CHI Monograph 13, Effective Modeling of Urban Water Systems. W. James, K.N. Irvine, E.A. McBean and R.E. Pitt eds.
Pitt, R. Bannerman, R. Clark, S. and D. Williamson, 2004b. Source of Pollutants in Urban Areas (Part 2) – Recent Sheetflow Monitoring, Chapter 24 in CHI Monograph 13, Effective Modeling of Urban Water Systems. W. James, K.N. Irvine, E.A. McBean and R.E. Pitt eds.
Rose, S., M.S. Crean, D.K. Sheheen, and A.M. Ghazi. 2001. Comparative zinc dynamics in Atlanta metropolitan region streams and street runoff. Cases and Solutions On-Line. Springer-Verlag.
Sansalone, J. and G.Ying. 2008. Partitioning and granulometric distribution of metal leachate from urban traffic dry deposition particulate matter subject to acidic rainfall and runoff retention. Water Research. 42(15):4146-4162.
Sansalone, J. J. and S. G. Buchberger. 1997. Characterization of Solid and Metal Element Distributions in Urban Highway Stormwater. Wat. Sci. Tech. 36(8-9):155-160.
Schiff, K., Bay, S. and D. Diehl. 2003. Stormwater toxicity in Chollas Creek and San Diego Bay, California. Environmental Monitoring and Assessment 81: 119-132.
Schnoor, J. L., 1996. Environmental Modeling: Fate and Transport of Pollutants in Water, Air, and Soil. Wiley and Sons, New York, New York.
Shaver, E., Horner, R., Skupien, J., May, C., and G. Ridley. 2007. Fundamentals of Urban Runoff Management: Technical and Institutional Issues, 2nd Edition.
Snoeyink, V.L. and D.Jenkins. 1980. Water Chemistry. John Wiley & Son, Inc. New York.
Stone, M. and J. Marsalek. 1996. Trace metal composition and speciation in street sediment. Air and Soil Pollution 87: 149-169.
Sun, X. and A.P. Davis, 2007. Heavy Metal Fates in Laboratory Bioretention Systems. Chemosphere, 66(9), 1601-1609.
International Stormwater BMP Database
Pollutant Category Summary: Metals Page 57 August 2011
Sutherland, R.A. and C.A. Tolosa. 2000. Multi-element analysis of road-deposited sediment in an urban drainage basin, Honolulu, Hawaii. Environmental Pollution 110: 483-495.
U.S. Geological Survey (USGS). 2009. Glossary of Hydrologic Terms. Accessed online http://or.water.usgs.gov/projs_dir/willgw/glossary.html
United States Environmental Protection Agency (USEPA). 1983. Results of Nationwide Urban Runoff Program. EPA-PB/84-185552.
USEPA. 1995. Leaded Gas Phaseout, Air Quality Fact Sheet. June, 1995
USEPA. 2005. Mercury Maps: Linking Air Deposition and Fish Contamination on a National Scale, Fact Sheet. http://water.epa.gov/type/watersheds/datait/maps/fs.cfm#back
USEPA. 2008. An Introduction to the Biotic Ligand Model. EPA Standards Academy Training Module Powerpoint. (http://water.epa.gov/learn/training/standardsacademy/upload/2008_08_20_standards_academy_special_blm_presentation.pdf).
USEPA. 2010. Memorandum from James Hanlon, Director of the Office of Wastewater Management, and Denise Keehner, Director of Wetlands, Oceans and Watersheds, to EPA Water Management Division Directors for Region 1- 10 regarding “Revisions to the November 22, 2002 Memorandum ‘Establishing Total Maximum Daily Load (TMDL) Wasteload Allocations (WLAs) for Strom Water Sources and NPDES Permit Requirements Based on Those WLAs’.” November 12, 2010.
USEPA. 2011a. Untitled EPA Memorandum Requesting Comments on the November 12, 2010 USEPA Memorandum regarding “Revisions to the November 22, 2002 Memorandum ‘Establishing Total Maximum Daily Load (TMDL) Wasteload Allocations (WLAs) for Storm Water Sources and NPDES Permit Requirements Based on Those WLAs.” March 17, 2011.
USEPA. 2011b. Watershed Assessment, Tracking & Environmental Results. Retrieved July 19, 2011, from http://iaspub.epa.gov/waters10/attains_nation_cy.control?p_report_type=T#causes_303d
Weiner, E.R., 2008. Applications of Environmental Aquatic Chemistry, Second Edition. CRC Press: Boca Raton, FL.
WERF, 2003. Metals Removal Technologies for Urban Stormwater. Prepared by Pauline Johnson, Robert Pitt, S. Rocky Durrans, Matilda Urrutia, and Shirley Clark. WERF Report 97-IRM-2. Water Environment Federation (publisher), Alexandria, VA; IWA Publishing, London.
WERF, 2005. Critical Assessment of Stormwater Treatment Controls and Control Selection Issues. Prepared by E.W. Strecker, W.C Huber, J.P. Heaney, D. Bodine, J.J. Sansalone, M.M. Quigley, D. Pankani, M. Leisenring, and P. Thayumanavan. 02-SW-01. Water Environment Federation (publisher), Alexandria, VA; IWA Publishing, London.
International Stormwater BMP Database
Pollutant Category Summary: Metals Page 58 August 2011
Ye, Z. H., Baker, A. J. M., Wong, M. H., Willis, A. J., 1997. Copper and nickel uptake, accumulation and tolerance in Typha latifolia with and without iron plaque on the root surface. New Phytologist, 136(3): 481-488 .
Ye, Z.H., Cheung, K.C.; Wong, M.H., 2001. Copper uptake in Typha latifolia as affected by iron and manganese plaque on the root surface. Canadian Journal of Botany, 79(3): 314-320. NRC Research Press.
7 ATTACHMENTS Attachment 1. Statistical Summary Report Attachment 2. Analysis Data Set in Excel (accessible through www.bmpdatabase.org)