Embed Size (px)
Citation preview

ORIGINAL ARTICLE
International validation of a urinary biomarker panelfor identification of active lupus nephritis in children
Eve Mary Dorothy Smith1& Andrea Lyn Jorgensen2
& Angela Midgley1 & Louise Oni1 &
Beatrice Goilav3 & Chaim Putterman4& Dawn Wahezi5 & Tamar Rubinstein5
&
Diana Ekdawy1 & Rachel Corkhill1 & Caroline Ann Jones6 & Stephen David Marks7 &
Paul Newland8& Clarissa Pilkington9
& Kjell Tullus7 & Michael William Beresford1,10
Received: 28 April 2016 /Revised: 26 June 2016 /Accepted: 14 July 2016 /Published online: 3 September 2016# The Author(s) 2016. This article is published with open access at Springerlink.com
AbstractBackground Conventional markers of juvenile-onset system-ic lupus erythematosus (JSLE) disease activity fail to ade-quately identify lupus nephritis (LN). While individual novelurine biomarkers are good at detecting LN flares, biomarkerpanels may improve diagnostic accuracy. The aim of thisstudy was to assess the performance of a biomarker panel toidentify active LN in two international JSLE cohorts.
Methods Novel urinary biomarkers, namely vascular cell ad-hesion molecule-1 (VCAM-1), monocyte chemoattractantprotein 1 (MCP-1), lipocalin-like prostaglandin D synthase(LPGDS), transferrin (TF), ceruloplasmin, alpha-1-acid gly-coprotein (AGP) and neutrophil gelatinase-associatedlipocalin (NGAL), were quantified in a cross-sectional studythat included participants of the UK JSLE Cohort Study(Cohort 1) and validated within the Einstein Lupus Cohort
Electronic supplementary material The online version of this article(doi:10.1007/s00467-016-3485-3) contains supplementary material,which is available to authorized users.
* Eve Mary Dorothy [email protected]
Andrea Lyn [email protected]
Angela [email protected]
Louise [email protected]
Beatrice [email protected]
Chaim [email protected]
Dawn [email protected]
Tamar [email protected]
Diana [email protected]
Rachel [email protected]
Caroline Ann [email protected]
Stephen David [email protected]
Paul [email protected]
Clarissa [email protected]
Kjell [email protected]
Michael William [email protected]
1 Department of Women’s and Children’s Health, Institute ofTranslational Medicine, Institute of Child Health in the Park, AlderHey Children’s Hospital and University of Liverpool, Eaton Road,Liverpool L12 2AP, UK
2 Department of Biostatistics, Institute of Translational Medicine,University of Liverpool, Liverpool, UK
3 Division of Nephrology, Children’s Hospital at Montefiore andAlbert Einstein College of Medicine, Bronx, NY, USA
Pediatr Nephrol (2017) 32:283–295DOI 10.1007/s00467-016-3485-3

(Cohort 2). Binary logistic regression modelling and receiveroperating characteristic curve analysis [area under the curve(AUC)] were used to identify and assess combinations of bio-markers for diagnostic accuracy.Results A total of 91 JSLE patients were recruited across bothcohorts, of whom 31 (34 %) had active LN and 60 (66 %) hadno LN. Urinary AGP, ceruloplasmin, VCAM-1, MCP-1 andLPGDS levels were significantly higher in those patients withactive LN than in non-LN patients [all corrected p values (pc)< 0.05] across both cohorts. Urinary TF also differed betweenpatient groups in Cohort 2 (pc = 0.001). Within Cohort 1, theoptimal biomarker panel included AGP, ceruloplasmin,LPGDS and TF (AUC 0.920 for active LN identification).These results were validated in Cohort 2, with the samemarkers resulting in the optimal urine biomarker panel(AUC 0.991).Conclusion In two international JSLE cohorts, urinary AGP,ceruloplasmin, LPGDS and TF demonstrate an ‘excellent’ability for accurately identifying active LN in children.
Keywords Lupus nephritis . Urine biomarkers .
Glomerulonephritis . BILAG . Systemic lupus erythematosus
Introduction
Juvenile-onset systemic lupus erythematosus (JSLE) is a life-threatening multi-system autoimmune disease that displays amore aggressive course than adult onset SLE [1–3]. Morerenal manifestations occur in childhood, with up to 80 % ofJSLE patients developing lupus nephritis (LN) within the first5 years from diagnosis [1, 4–9]. LN is characterised by arelapsing and remitting course, requiring close surveillanceand prompt treatment to prevent renal damage. Worldwide,the 5-year renal survival rate in children with LN has beenshown to vary between 44 and 94 % [10–13].
Renal histology is the gold standard for diagnosing andpredicating renal prognosis in LN, but only provides a snap-shot of a discrete area of the kidney and is rarely repeated formonitoring purposes due to its invasive nature [14, 15].Composite disease activity scores, such as the British IslesLupus Assessment Group (BILAG) score or the SystemicLupus Erythematosus Disease Activity Index (SELENASLEDAI), and a number of traditional clinical biomarkerscan be used to assess JSLE disease activity; however their rolein monitoring LN within the clinic is limited [16–19].
Over recent years, numerous individual novel urinary bio-markers have been investigated for monitoring LN diseaseactivity. These have outperformed both traditional and novelserum biomarkers, including monocyte chemoattractantprotein-1 (MCP-1), neutrophil gelatinase associated lipocalin1 (NGAL), vascular cell adhesion molecule-1 (VCAM-1) andtumour necrosis-like weak inducer of apoptosis (TWEAK)[20–26]. Using a proteomic approach, urinary transferrin(TF), ceruloplasmin, lipocalin-type prostaglandin D synthase(LPGDS), alpha-1-acid glycoprotein (AGP), albumin and al-bumin fragments have been shown to differentiate betweenchildren with active LN and no LN [27]. When assessed lon-gitudinally, LPGDS, AGP and TF levels were all elevated upto 3 months before the LN flare [27].
No individual urine biomarker has achieved an ‘excellent’predictive value [area under the receiver operating character-istic (ROC) curve (AUC) > 0.9] to date. Combining urinarybiomarkers in a ‘biomarker panel’ has been shown to improvethe ability to predict renal function loss in a combinedpaediatric/adult SLE cohort with LN [28] and relate to LNhistological features [29] and activity [30].
This study therefore aimed to build on previous work [22,25–27, 31–33] by exploring the most promising candidateurinary biomarkers to date used in combination, namelyVCAM-1, MCP-1, NGAL, ceruloplasmin, TF, LPGDS andAGP in a paediatric cohort from the UK (UK JSLE CohortStudy), to assess which novel biomarker combinations canimprove the identification of active LN. Since the JSLE phe-notype and disease severity varies by ethnicity and race [2, 4,34], we sought to confirm our results in a validation cohortfrom the USA [Einstein Lupus Cohort (ELC)] [35] in order toidentify a urinary biomarker panel which is internationallyapplicable. Such a transatlantic comparison of a biomarkerpanel provides considerable strength to this study and thevalidation of this panel.
Methods
Patients
This study was based on two cross-sectional JSLE cohorts: theexploratory UK JSLE Cohort [1], which included all recruited
284 Pediatr Nephrol (2017) 32:283–295
4 Division of Rheumatology, Albert Einstein College of Medicine andMontefiore Medical Center, Bronx, NY, USA
5 Division of Pediatric Rheumatology, Children’s Hospital atMontefiore and Albert Einstein College of Medicine, Bronx, NY,USA
6 Department of Paediatric Nephrology, Alder Hey Children’s NHSFoundation Trust, Liverpool, UK
7 Department of Paediatric Nephrology, Great Ormond Street Hospital,London, UK
8 Biochemistry Department, Alder Hey Children’s NHS FoundationTrust, Liverpool, UK
9 Department of Paediatric Rheumatology, Great Ormond StreetHospital, London, UK
10 Department of Paediatric Rheumatology, Alder Hey Children’s NHSFoundation Trust, Liverpool, UK
patients from Alder Hey Children’s NHS Foundation Trust,Liverpool, and Great Ormond Street NHS Hospital forChildren, London, UK. The validation cohort included ELCpatients who were followed regularly at lupus clinics at theChildren’s Hospital at Montefiore, Bronx, NY, USA [35]. Inboth cohorts, urine samples were collected during routine clin-ical care together with detailed demographic data, self-reported ethnicity/race data, clinical laboratory results andmedication information. Disease activity data were deter-mined using the BILAG2004 disease activity score [36, 37].Eligible patients were diagnosed with JSLE prior to 16 yearsof age and met four or more of the revised American Collegeof Rheumatology (ACR) SLE classification criteria [38].Patients were excluded if they had a urinary tract infectionor if no urine samples had been collected.
Renal disease activity classification
Patients were categorised according to the renal domain of theBILAG2004 disease activity score, defined as follows:BILAG2004 grade A/B: severe, moderate disease respective-ly; grade D, inactive disease but previous system involvement;grade E, system has never been involved [37]. The compositerenal BILAG score consists of six items, including proteinuria[defined in terms of urine dipstick or urine protein/albumin-to-creatinine ratio (UACR) or 24-h protein levels], deterioratingrenal function [based on plasma creatinine (Cr) and glomeru-lar filtration rate (GFR)], presence of active urinary sediment,hypertension, nephrotic syndrome and histological evidenceof active nephritis in the previous 3 months, with different testscore cut-offs relating to the different disease activity catego-ries. In both cohorts, all patients with active LN had biopsy-proven LN during their disease course. Renal disease activitywas therefore defined as having a renal BILAG2004 score ofA or B with previous histological confirmation of LN. Non-LN was defined by a renal BILAG2004 score of D or E. Thisstudy sought to identify biomarkers that differentiate betweenthe binary outcome of active versus no LN, therefore renalBILAG2004 C patients (where a patient had mild or improv-ing renal disease) were excluded.
Urine sample selection
In Cohort 1, when more than one patient’s urine sample hadbeen collected, urine biomarkers were quantified in a singlesample for inclusion within this study (cross-sectional ap-proach). A sample from a patient with active LN (active-LNsample) was chosen for inclusion where available in order toallow as many patients with active LN as possible to contributeto the study. If a patient contributed a sample that was inactivefor LN (inactive-LN sample), then the first sample collectedwith adequate aliquots for quantification of the whole biomark-er panel was included. In Cohort 2, 23/30 study patients had an
active-LN sample available and 14/30 had and inactive-LN(non-LN) sample available. Urine biomarker levels were quan-tified in all samples, however, 16 of these active-LN and all 14non-LN samples contributed to the cross-sectional analysis inorder to provide similar patient numbers per group. The otherseven active-LN samples were subsequently included in anal-yses comparing urine biomarker concentrations in biopsy ver-sus renal BILAG-defined active LN.
Extra-renal disease activity classification
To allow assessment of biomarker levels according to whetherextra-renal JSLE disease activity was present or not, patientswere subdivided further as having ‘any active extra-renal in-volvement’ if they had a BILAG2004 of A or B in any of theremaining domains (constitutional, mucocutaneous, neuropsy-chiatric, musculoskeletal, cardiorespiratory, gastrointestinal,ophthalmic or haematological) or ‘no extra-renal involvement’if they had a BILAG2004 score of D or E in all extra-renaldomains. Biomarker levels were therefore compared in active/non-LN patients with and without extra-renal involvement.
Laboratory techniques
Urine dipstick and/or microscopy and culture excluded infec-tion. Samples were centrifuged at 2000 rpm for 10 min.Aliquots of the urine supernatant were made and stored at−80 °C until analysis. Pre-coated enzyme-linked immunosor-bent assay (ELISA) kits were used to quantify urinary cerulo-plasmin (Assaypro, St Charles, MO), TF (GenWay, SanDiego, CA), LPGDS (BioVendor, Brno, Czech Republic),AGP and MCP-1 (R&D Systems Ltd., Minneapolis, MN).An R&D systems duo-kit (R&D Systems Ltd.) was used toquantify urinary VCAM-1 following internal validation (95%spike recovery, 104 % linearity of dilution, co-efficients ofinter/intra-assay variability 5.1 and 7.5 %, respectively). Theceruloplasmin, LPGDS,MCP-1 and AGP assays are commer-cially validated for use in urine and were used in accordancewith the respective manufacturer’s instructions. UrinaryNGAL and Cr concentrations were measured using AbbottArchitect assays (Abbott Laboratories, Dallas, TX). All bio-marker results were standardised for urinary Cr concentrationand presented in units per milligram Cr (mgCr).
Statistical analysis
Summary statistics for demographics (age at diagnosis, cur-rent age, gender, ethnicity), baseline clinical data (medicationuse and laboratory parameters) and biomarker data (cerulo-plasmin, TF, LPGDS, MCP-1, VCAM-1, AGP and NGAL)were provided in terms of median values and interquartileranges (IQR). Univariate logistic regression (quantitative data)and Pearson’s Chi-square test (binary data) were used to
Pediatr Nephrol (2017) 32:283–295 285

assess for differences in demographic and clinical factors be-tween different patient groups. Due to the number of factorsexplored, a Bonferroni adjustment was applied to account formultiple testing (16 comparisons per cohort).
Mann–Whitney U tests with Bonferroni adjustments wereused to compare biomarker concentrations between active-LNand non-LN patients (7 comparisons). Correlation betweenthe individual urine biomarkers was assessed usingSpearman’s rank correlation tests. The grading of correlation
co-efficients (r) can vary, but for the purposes of this study0.2–0.3 = weak/little correlation, 0.3–0.7 =moderate correla-tion and 0.7–1.0 = strong correlation [39]. A binary logisticregression model was fitted to assess for association betweena combination of biomarkers and LN status (outcome: active-LN active = 1; non-LN JSLE = 0). All novel biomarkers (log-transformed) were included in an initial model and the‘stepAIC’ function in R [40] applied to select a final model.This function compares models based on all possible
Table 1 Clinical, demographic and laboratory measurements at the time of urinary biomarker quantification
Variables Exploratory Cohort 1 (UK JSLE Cohort) Validation Cohort 2 [Einstein Lupus Cohort (USA)]
Active-LNa (n = 15) Non-LNa ( n = 46) pcb Active-LNa (n = 16) Non-LNa (n = 14) pc
b
Age at time of analysis (years) 16 [15–17] 15 [14–18] ns 15 [14–17] 18 [15–19] ns
Disease duration (years) 2.8 [0.7–3.9] 2.4 [0.8–4.8] ns 3.1 [1.2–4.8] 1.7 [0.5–5.6] ns
Femalec 13 (86.7) 35 (62.5) ns 16 (100) 10 (71) ns
ACRd 5 [4–7] 5 [4–7] ns 5 [5.0–5.8] 5 [4.5–6.0] ns
Ethnicitye
Caucasian 2 (13) 23 (50) 0 (0) 0 (0)
Africanf 3 (20) 5 (11) 11 (69) 5 (36)
Hispanic 0 (0) 0 (0) 5 (31) 8 (57)
Caribbean 2 (13) 2 (4) ns 0 (0) 0 (0) ns
Mixed race 3 (20) 0 (0) 0 (0) 0 (0)
Indian 3 (21) 11 (24) 0 (0) 1 (7)
Chinese 2 (13) 5 (11) 0 (0) 0 (0)
Medication useg
Prednisolone 12 (80) 21 (46) ns 14 (88) 12 (86) ns
Mycophenolate mofetil 11 (73) 19 (41) ns 7 (44) 3 (21) ns
Cyclophosphamide ever 3 (20) 2 (4) ns 9 (56) 4 (29) ns
Rituximab ever 5 (33) 0 (0) 0.02 6 (38) 5 (36) ns
ACEi/AT2 4 (27) 6 (13) ns 10 (63) 1 (7) 0.03
Glomerular filtration rateh 100 [70–112] 116 [105–127] ns 126 [90–160] 110 [100–123] ns
Urinary albumin-to-creatinine(Cr) ratio (mg/mmolCr)
92 [23–153] 1 [1–2] <0.01 555 [137–2059] 9 [3–19] 0.03
Serum creatinine (μmol/L) 57 [50–86] 53 [46–61] ns 53 [44–71] 66 [62–73] ns
dsDNA (IU/L) 48 [15–263] 2 [0.1–52] ns 156 [96–179] 87 [23–178] ns
C3 (g/L) 1.0 [0.5–1.2] 1.1 [1–1.2] ns 0.8 [0.7–1.0] 1.0 [0.8–1.2] ns
ESR (mm/h)i 55 [20–90] 9 [3–23] <0.01 − − −
Data are expressed as median values with the interquartile range (IQ) in square brackets, or as numbers with the percentage in parenthesis, as appropriate
JSLE, Juvenile-onset systemic lupus erythematosus; LN, lupus nephritis; ACEi/AT2, angiotensin-converting enzyme inhibitor/angiotensin 2 blocker;dsDNA, anti-double-stranded DNA antibody; C3, complement component 3; ESR, erythrocyte sedimentation ratea Classification of the patients into active-LN/Non-LN groups is described in section Urine sample selectionb p values are Bonferroni-corrected p values (pc) from Chi-squared tests or univariate binary regression, as appropriate. ns = pc > 0.05c Gender data missing on one Cohort 1 patientd ACR, Number of American College of Rheumatology criteria for systemic lupus erythematosus (SLE) fulfilled at diagnosise Self-reported ethnicity data shownfWithin Cohort 2, African American patients were also included in this categoryg Current medication use is described for regular medications; those medications taken in courses/intermittently are described as having been used ‘ever’hmls/mini ESR was not routinely measured in Cohort 2
286 Pediatr Nephrol (2017) 32:283–295
combinations of biomarkers and chooses the model with theminimum Akaike information criterion (AIC) value. The AICis a measure of the relative quality of a model relative to eachof the other models, with a lower value meaning better quality.The AUC for the final model was calculated. Each of theremaining novel biomarkers was then added back into thefinal model in turn (step-wise), in order of statistical signifi-cance according to the original model including all novel bio-markers, and the AUC for each updated model calculated.This procedure allowed exploration of the effect of each bio-marker on the model’s AUC, as well as an assessment ofwhich combination of biomarkers led to the optimal AUC.This final process was repeated in the ELC validation cohortin order to determine whether the findings could be replicated.The data were then pooled to identify the optimal combinedmodel. AUC values of 1.0–0.9, 0.9–0.8, 0.8–0.7, 0.7–0.6 and0.6–0.5 were considered to be excellent, good, fair, poor andfail, respectively [41].
To assess the renal specificity of the urine biomarkersand whether biomarker levels vary according to whetherextra-renal JSLE disease activity is present, biomarkerlevels in patients with ‘any active extra-renal involve-ment’ were compared to those with ‘no extra-renal in-volvement’ (Mann–Whitney U tests with a Bonferroniadjustment for the 7 biomarkers examined). Similarly,when comparing urinary biomarker levels in patientswhere a diagnosis of LN was made on the basis of recentrenal biopsy results versus BILAG-defined nephritisalone, Bonferroni-adjusted Mann–Whitney U tests werealso used. The ability of traditional biomarkers to identifyactive LN was investigated using binary logistic regres-sion models for each/a combination of biomarkers (log-transformed) and LN status, and the AUC calculated.
Data analysis was undertaken using the Statistics Packagefor Social Sciences (SPSS; IBM Corp., Armonk, NY) version21.0 and R version 3.1.1 [40]. Graphical illustrations weregenerated using GraphPad Prism version 6.0 (GraphpadSoftware, San Diego, CA). Where Bonferroni adjustmentwas made to account for multiple testing, the Bonferronicorrected p value, pc, is reported.
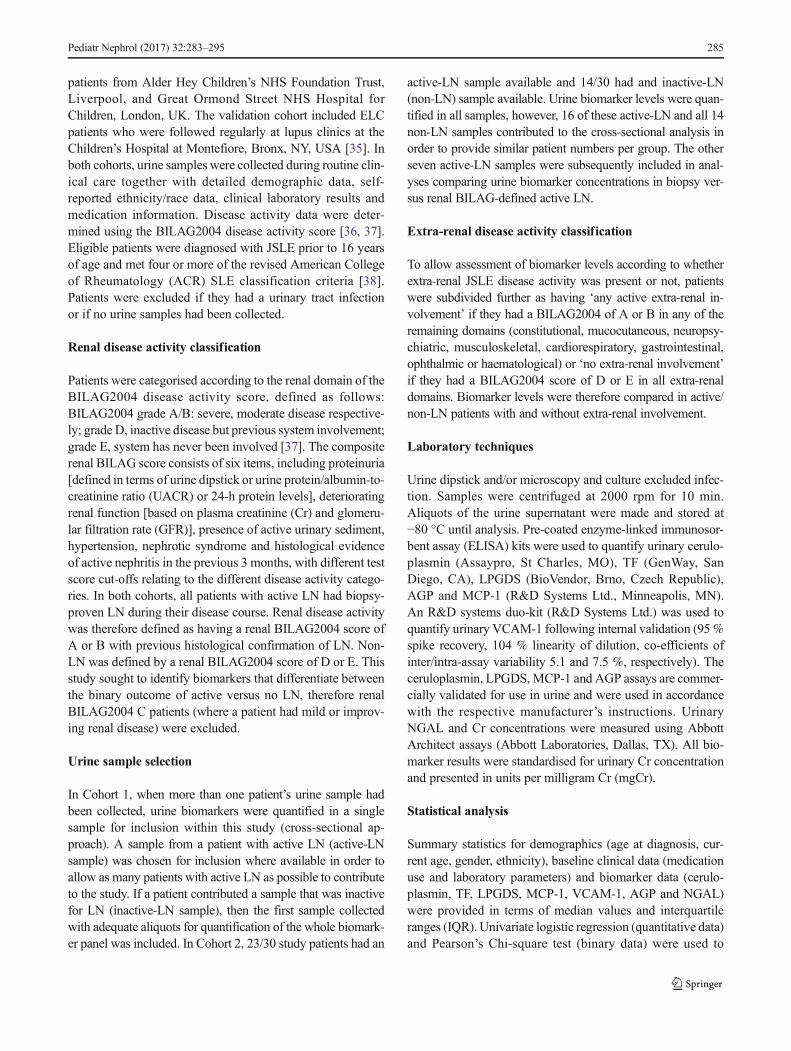
Fig. 1 Distribution of biomarker concentrations in active-/non-lupusnephritis (LN) patients with juvenile-onset systemic lupus erythematosus(JSLE) from Cohorts 1 (UK JSLE Cohort) and 2 [Einstein Lupus Cohort(ELC)]. Horizontal line Median value for each group. Mann–Whitney Utests were used to compare the distribution of biomarker concentrationsbetween patient groups within each cohort. A Bonferroni adjustment wasapplied to account for multiple testing. Corrected p values (pc) are reported.Vascular cell adhesion molecule-1 (VCAM-1) biomarker data were notavailable from one active-LN patient from Cohort 1; neutrophilgelatinase-associated lipocalin (NGAL) data were not available from threeactive-LN and 15 non-LN patients from Cohort 1. AGPAlpha-1-acid gly-coprotein, CP ceruloplasmin, LPGDS lipocalin-like prostaglandin D syn-thase, TF transferrin, MCP-1 monocyte chemoattractant protein 1, Cr cre-atinine. See section Urine sample selection for definition of active-/non-LN
b
Pediatr Nephrol (2017) 32:283–295 287
Results
Cohort 1—exploratory cohort (UK JSLE Cohort Study)
Clinical and demographic data
The UK JSLE Study cohort consisted of 61 patients withJSLE, of whom 15 (25 %) were classed as JSLE withactive LN (2/15 renal BILAG score = A, 13/15 = B) and46 (75 %) as JSLE with inactive LN (non-LN; 27/46 renalBILAG score = D, 19/46 = E). Active and non-LN JSLEpatients had a median age of 15.8 [IQR 14.8–17.1] and15.4 [IQR 13.8–17.5] years, respectively, with disease du-ration of 2.8 [IQR 0.7–3.9] and 2.4 [IQR 0.8–4.8] years atthe time of biomarker analysis. Females comprised86.7 % of the active-LN patients and 62.5 % of the non-LN patients. There was no difference in ethnicity betweenpatient groups. All JSLE patients had a median of fiveACR classification criteria at diagnosis [IQR 4–7]. Allactive-LN patients had biopsy-proven LN during their dis-ease course, with the majority having InternationalSociety of Nephrology/Renal Pathology Society 2003(ISN/RPS) class III (59 %) or IV (27 %) LN. Class II(7 %) and mixed class II/V (7 %) LN was seen in theremaining patients (see Table 1).
Compared to non-LN patients, more active-LN patientshad received rituximab (pc < 0.05), but the use of other med-ications did not differ significantly between the patient groups.Of the laboratory parameters investigated, the UACR anderythrocyte sedimentation rate (ESR) were significantlyhigher in the active-LN patients (all pc < 0.05) (see Table 1).
Novel urinary biomarkers
Figure 1 depicts the distribution of novel urinary biomark-er concentrations standardised to urinary Cr in patientswith active LN and no LN. Patients with active LN hadsignificantly higher urinary concentrations of AGP, ceru-loplasmin, VCAM-1, MCP-1 and LPGDS than non-LNpatients [all pc < 0.05; see Fig. 1 and ElectronicSupplementary Material (ESM) 1]. Urinary TF andNGAL concentrations did not differ significantly betweenthe patient groups (pc = 0.06 and 1.0, respectively; see
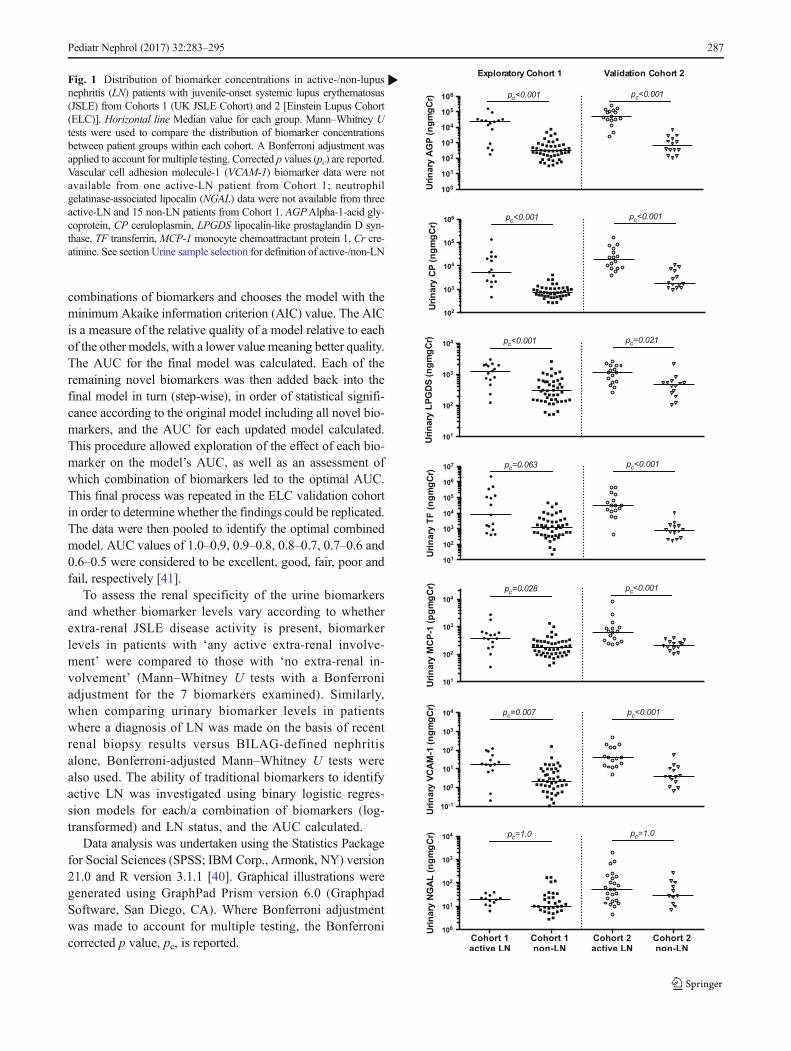
Fig. 2 Urine biomarker concentrations in active-/non- lupus nephritis (LN)patients with/without extra-renal juvenile-onset systemic lupus erythematosus(JSLE) activity. Biomarker concentrations were standardised to urinarycreatinine and expressed as median values. Horizontal line Median valuefor each group. Mann–Whitney U tests were used to compare biomarkerconcentrations between patient groups. A Bonferroni adjustment was appliedto account for multiple testing. Corrected p values (pc) are reported. Vascularcell adhesion molecule-1 (VCAM-1) measurement is missing from onepatient; neutrophil gelatinase-associated lipocalin (NGAL) data were notavailable from three active-LN and 15 non-LN patients
b
288 Pediatr Nephrol (2017) 32:283–295
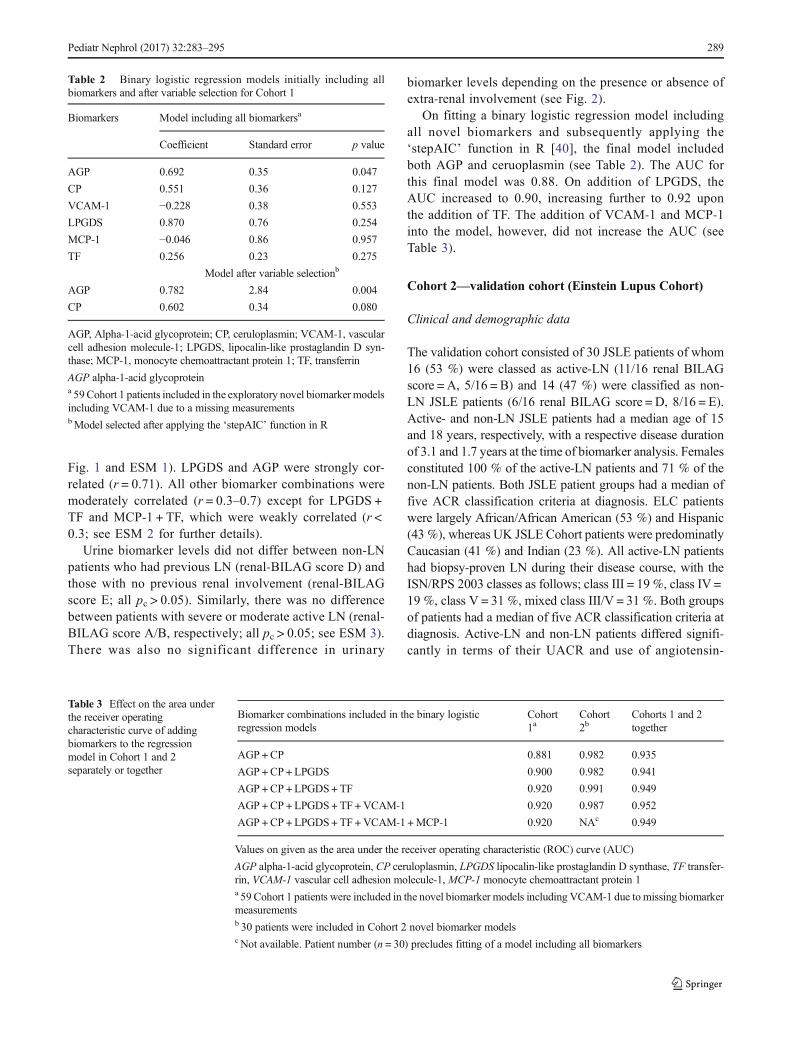
Fig. 1 and ESM 1). LPGDS and AGP were strongly cor-related (r = 0.71). All other biomarker combinations weremoderately correlated (r = 0.3–0.7) except for LPGDS +TF and MCP-1 + TF, which were weakly correlated (r <0.3; see ESM 2 for further details).
Urine biomarker levels did not differ between non-LNpatients who had previous LN (renal-BILAG score D) andthose with no previous renal involvement (renal-BILAGscore E; all pc > 0.05). Similarly, there was no differencebetween patients with severe or moderate active LN (renal-BILAG score A/B, respectively; all pc > 0.05; see ESM 3).There was also no significant difference in urinary
biomarker levels depending on the presence or absence ofextra-renal involvement (see Fig. 2).
On fitting a binary logistic regression model includingall novel biomarkers and subsequently applying the‘stepAIC’ function in R [40], the final model includedboth AGP and ceruoplasmin (see Table 2). The AUC forthis final model was 0.88. On addition of LPGDS, theAUC increased to 0.90, increasing further to 0.92 uponthe addition of TF. The addition of VCAM-1 and MCP-1into the model, however, did not increase the AUC (seeTable 3).
Cohort 2—validation cohort (Einstein Lupus Cohort)
Clinical and demographic data
The validation cohort consisted of 30 JSLE patients of whom16 (53 %) were classed as active-LN (11/16 renal BILAGscore = A, 5/16 = B) and 14 (47 %) were classified as non-LN JSLE patients (6/16 renal BILAG score = D, 8/16 = E).Active- and non-LN JSLE patients had a median age of 15and 18 years, respectively, with a respective disease durationof 3.1 and 1.7 years at the time of biomarker analysis. Femalesconstituted 100 % of the active-LN patients and 71 % of thenon-LN patients. Both JSLE patient groups had a median offive ACR classification criteria at diagnosis. ELC patientswere largely African/African American (53 %) and Hispanic(43 %), whereas UK JSLE Cohort patients were predominatlyCaucasian (41 %) and Indian (23 %). All active-LN patientshad biopsy-proven LN during their disease course, with theISN/RPS 2003 classes as follows; class III = 19 %, class IV =19 %, class V = 31 %, mixed class III/V = 31 %. Both groupsof patients had a median of five ACR classification criteria atdiagnosis. Active-LN and non-LN patients differed signifi-cantly in terms of their UACR and use of angiotensin-
Table 2 Binary logistic regression models initially including allbiomarkers and after variable selection for Cohort 1
Biomarkers Model including all biomarkersa
Coefficient Standard error p value
AGP 0.692 0.35 0.047
CP 0.551 0.36 0.127
VCAM-1 −0.228 0.38 0.553
LPGDS 0.870 0.76 0.254
MCP-1 −0.046 0.86 0.957
TF 0.256 0.23 0.275
Model after variable selectionb
AGP 0.782 2.84 0.004
CP 0.602 0.34 0.080
AGP, Alpha-1-acid glycoprotein; CP, ceruloplasmin; VCAM-1, vascularcell adhesion molecule-1; LPGDS, lipocalin-like prostaglandin D syn-thase; MCP-1, monocyte chemoattractant protein 1; TF, transferrin
AGP alpha-1-acid glycoproteina 59Cohort 1 patients included in the exploratory novel biomarker modelsincluding VCAM-1 due to a missing measurementsbModel selected after applying the ‘stepAIC’ function in R
Table 3 Effect on the area underthe receiver operatingcharacteristic curve of addingbiomarkers to the regressionmodel in Cohort 1 and 2separately or together
Biomarker combinations included in the binary logisticregression models
Cohort1a
Cohort2b
Cohorts 1 and 2together
AGP +CP 0.881 0.982 0.935
AGP +CP + LPGDS 0.900 0.982 0.941
AGP +CP + LPGDS+ TF 0.920 0.991 0.949
AGP +CP + LPGDS+ TF +VCAM-1 0.920 0.987 0.952
AGP +CP + LPGDS+ TF +VCAM-1 +MCP-1 0.920 NAc 0.949
Values on given as the area under the receiver operating characteristic (ROC) curve (AUC)
AGP alpha-1-acid glycoprotein, CP ceruloplasmin, LPGDS lipocalin-like prostaglandin D synthase, TF transfer-rin, VCAM-1 vascular cell adhesion molecule-1, MCP-1 monocyte chemoattractant protein 1a 59 Cohort 1 patients were included in the novel biomarker models including VCAM-1 due to missing biomarkermeasurementsb 30 patients were included in Cohort 2 novel biomarker modelsc Not available. Patient number (n = 30) precludes fitting of a model including all biomarkers
Pediatr Nephrol (2017) 32:283–295 289
converting enzyme inhibitors (ACEi)/angiotensin 2 blockers(AT2) (both p < 0.05, see Table 1).
Novel urine biomarkers
Figure 1 shows the distribution of novel urinary biomark-er concentrations in Cohort 2, relative to Cohort 1 pa-tients. Patients with active LN had significantly higherurinary concentrations of AGP, ceruloplasmin, LPGDS,TF, MCP-1 and VCAM-1 than non-LN patients (all pc <0.05). NGAL levels did not differ between patient groupsin either cohort (pc = 1.0). Ceruloplasmin and MCP-1,AGP, TF were all strongly correlated. LPGDS was alsostrongly correlated with AGP and VCAM-1. AGP wasstrongly correlated with VCAM-1 and TF (all r > 0.7).All other biomarker combinations were moderately corre-lated (r = 0.3–0.7; see ESM 2 for further details).
A binary logistic regression model was fitted withCohort 2 data, adding the data on each variable in a step-wise manner one at a time in the same order as was donefor Cohort 1. The model including AGP, ceruoplasmin,LPGDS and TF again produced the optimal AUC(0.991). As a combination of biomarkers led to excellentidentification of active LN in both cohorts, AUCs werealso calculated for both cohort datasets combined (seeTable 3). A combined Cohort 1 and Cohort 2 model, in-cluding AGP, ceruoplasmin, LPGDS and TF, again gaveexcellent AUC (0.949); however adding VCAM-1 slightlyimproved the AUC further (0.952). The ROC generatedby this optimal Cohort 1 and 2 model is shown in Fig. 3.
Urine biomarker concentrations in biopsy versus renalBILAG-defined active LN
Urine biomarker levels from 12 samples from Cohort 2patients which were taken at the time of or within 6 weeksof renal biopsy were compared with those of 11 patientsamples with a current composite renal BILAG score-based diagnosis of active LN (but a previous history ofhaving had biopsy-defined active LN). Urinary AGP, ce-ruloplasmin, LPGDS, TF, MCP-1 and VCAM-1 levels didnot differ significantly between the two groups of active-LN patients (all pc = 1.0; see Fig. 4). Urine samples fromCohort 1 patients were not available close to the time ofrenal biopsy; therefore, comparable groups were not avail-able for inclusion in these analyses. The study was under-powered to assess for differences in any of the urinarybiomarkers according to ISN/RPS 2003 subclass.
Ability of traditional biomarkers to identify active LN
Traditional biomarkers which do not contribute to the com-posite renal BILAG score were assessed for their ability toidentify active LN. ESR was the best traditional biomarker,with a fair AUC of 0.796 (ESR was only measured routinelywithin cohort 1). Complement component 3 (C3) and double-stranded DNA showed a poor ability to identify active LN inboth cohorts (AUC from 0.617 to 0.645). C4 performed theworst, with an AUC of 0.593 and 0.482 in Cohort 1 and 2,respectively. Inclusion of all traditional biomarkers together ina regression model did not improve the AUC. Addition ofESR, the best traditional biomarker, to the optimal UK novelbiomarker combination, including AGP, LPGDS, TF and ce-ruloplasmin, did not improve the AUC further (AUC 0.910;see TableI4).
Discussion
To optimise effective management of LN, readily availableand easily measured biomarkers are urgently needed withinclinical practice. Early diagnosis and prompt treatment ofLN can improve long-term renal survival [18]. The inva-sive nature of renal biopsy limits its clinical utility, espe-cially in childhood. By simultaneously measuring urinaryAGP, ceruloplasmin, VCAM-1, TF, LPGDS, MCP-1 andNGAL at a single patient visit in two ethnically diversecohorts of JSLE patients, the aim of this study was to de-rive and internationally validate a biomarker panel whichcould improve identification of active LN, over and aboveindividual biomarkers. Across both cohorts we have dem-onstrated an optimal urine biomarker combination that in-cludes AGP, ceruoplasmin, LPGDS and TF with excellentAUC values for active LN identification (AUC 0.920 and
Fig. 3 The receiver operating characteristic (ROC) cure generated fromthe optimal binary logistic regression model when data from both cohortswere combined. Optimal model includes Alpha-1-acid glycoprotein(AGP), ceruloplasmin, lipocalin-like prostaglandin D synthase(LPGDS), transferrin (TF) and vascular cell adhesion molecule-1(VCAM-1) [area under the ROC curve (AUC) 0.952]
290 Pediatr Nephrol (2017) 32:283–295

0.991 for Cohorts 1 and 2, respectively). Furthermore, thepresence of extra-renal disease activity does not appear toinfluence the accuracy of this panel of urine biomarkers.This is therefore the first LN urine biomarker panel studyto include a exploratory and validation cohort, providing afirm foundation for future development of a clinical urinebiomarker panel test.
Previous studies complementing our work have fo-cussed on identifying biomarker combinations reflectiveof LN histological subtypes in patients with biopsy-proven LN. Brunner et al. investigated 28 childhood-onset and 48 adult-onset SLE patients, assessing biomarkercombinations differentiating biopsy-defined activity, chro-nicity or membranous LN in samples taken within 2 monthsof biopsy. The best predictive ability detected by theseauthors was for LN activity, when MCP-1, AGP, cerulo-plasmin and the urine protein-to-creatinine ratio were con-sidered together (AUC 0.850) [29]. Within the UK JSLECohort and the ELC, we have demonstrated stronger AUCvalues (0.920 and 0.991, respectively) for the identificationof active LN with the combination of urinary AGP, ceru-loplasmin, LPGDS and TF. This result supports the impor-tance of a combination approach to urinary biomarkers inLN, in these JSLE cohorts. In our present study, when theresults from both the UK Cohort and ELC are pooled,VCAM-1 adds to the diagnostic ability of the above bio-marker panel, indicating that further investigation of therole of VCAM-1 in combination with other biomarkersfor discriminating active LN in children is required. TheUK JSLE Cohort consisted of predominately Caucasianand Indian patients, whereas the ELC cohort comprisedmainly African American and Hispanic patients. Notably,African and African American patients often have moresevere kidney involvement in SLE [4, 34, 42] .Interestingly, within our study the optimal biomarker panelperformed even better in the validation ELC than in theexploratory UK JSLE Cohort.
More recently, Brunner et al. have looked at additional bio-markers in samples taken at the time of biopsy from 47 childrenwith ISN/RPS class II–V LN [30]. These authors demonstratedthat NGAL, MCP-1, ceruloplasmin, adiponectin, hematopexinand kidney injury molecule-1 were the best predictors of LNactivity status as assessed by the National Institute for HealthActivity Index (NIH-AI), leading them to propose a biomarker-based Renal Activity Index for Lupus (RAIL) algorithm [30].Our current study examined a sub-set of these markers for theirability to identify BILAG-defined active LN rather than NIH-AI status. The promising results of Brunner et al. [30] require
Fig. 4 Urine biomarker concentrations in Cohort 2 patients with LN andno recent biopsy (BILAG-defined active LN; n = 11) versus patients withbiopsy-defined active LN (n = 12). Closed symbols Median, Whiskersinterquartile range. British Isles Lupus Assessment Group (BILAG), lu-pus nephritis (LN)
b
Pediatr Nephrol (2017) 32:283–295 291

further validation in larger prospective, multi-ethnic cohorts. Incontrast to the markers validated in our current study, it remainsunclear whether the biomarkers proposed by Brunner et al. [30]would be able to differentiate patients with active LN fromthose with inactive LN, as all patients in the their study haddefinite biopsy-defined LN.
Our data demonstrate the key utility of urinary biomarkersin monitoring LN. We have demonstrated and validated anexcellent panel of biomarkers which differentiate JSLE pa-tients with active LN and no current LN. As discussed above,Brunner et al. [30] have also proposed a distinct biomarkerpanel which accurately correlates with NIH-AI status. A largeinternational prospective study or clinical trial is thereforewarranted. This would longitudinally assess the biomarkersvalidated in the current study for initial identification of activeLN, followed by assessment of LN severity using the addi-tional markers included in the RAIL as a proxy for histologicalchanges. An international collaborative study will most prob-ably be needed to be sufficiently powered given the multiplic-ity of biomarkers studied, distinct kidney biopsy features seenand the ethnic differences seen in JSLE severity.
In our current study we could not demonstrate a significantdifference in urinary NGAL levels between those patientswith active LN and those with non-LN in either the UKCohort Study or the ELC. This is in contrast with previouswork which has shown NGAL to be highly sensitive/specificfor the identification of biopsy-proven LN in children [26].These results may be explained by differences in the timingof the sample and the outcome measures used. Urinary NGALhas previously been shown to be a useful predictor ofimpending flare in both the UK JSLE Cohort [26] and in an
adult SLE study of the ELC which included a UniversityCollege London validation cohort [43]. Kiani et al. were alsounable to detect an association between urinary NGAL andLN in a prospective study that included 107 adult SLE patients[44]. These observations may be due to urinary NGAL levelspeaking before flares and then receding before the event be-comes clinically detectable [45]. Urinary NGAL has also beendemonstrated as a marker of renal damage in LN [46], whichmay also explain why patients with a history of biopsy-provenLN have higher urinary NGAL levels. These observationssuggest that NGAL requires further testing longitudinally aspart of a urine biomarker panel despite the results seen in thecurrent study, as it may able to predict active nephritis andinactive nephritis occurrence.
It is interesting to consider the origin and renal speci-ficity of the novel biomarkers. AGP belongs to theimmunocalin family, a group of immunomodulatory bind-ing proteins. It is mainly produced by the liver but hasalso been reported in other cell types (macrophages [47],endothelial cells [48] and monocytes [49]). In active LN,increased production of AGP as part of the acute phaseresponse, coupled with AGP production by cells infiltrat-ing the kidney, may be responsible for the high urinarylevels demonstrated. TF and ceruloplasmin are plasmaproteins, primarily responsible for carrying iron and cop-per, respectively. Differing from albumin in terms of theirmolecular radii and isoelectric points, urinary ceruloplas-min and TF have been shown to predict the onset ofmicroalbuminuria in diabetic nephropathy [50]. LPGDS,a member of the lipocalin superfamily responsible forprostaglandin D2 production, is similar to albumin interms of chemical properties, but it is much smaller[51]. In type-2 diabetes, urinary LPGDS has been shownto increase in the early stages of kidney injury [52].Urinary VCAM-1 levels have previously been shown tobe higher than blood levels, suggesting that the inflamedkidney may represent an important source of urinaryVCAM-1 [33].
Certain limitations of our study warrant recognition andshould be addressed in future work. As our definition ofactive LN was based on the composite renal BILAG score,calculated from proteinuria, GFR, blood pressure, activeurine sediment, plasma creatinine and recent biopsy find-ings, we could not directly compare such traditionalmarkers with the novel urinary biomarkers studied. Dueto the cross-sectional nature of this study we are unableto comment on the relationship of such biomarkers withother stages of the fluctuating LN disease course (e.g. pre-diction of flare/remission). Validation in a larger, longitu-dinal, prospectively collected study is therefore necessary,including children and young people with the full range ofmild, severe and inactive disease phenotypes from a rangeof patient cohorts (including Asian and African cohorts).
Table 4 Area under the ROC curve values corresponding to the abilityof traditional biomarkers to identify active lupus nephritis alone and incombination with novel biomarkers
Traditional biomarkers AUC
Cohort 1 Cohort 2
dsDNA 0.617 0.643
C3 0.645 0.638
C4 0.593 0.482
ESR 0.796 NAa
All traditional biomarkers 0.783 0.670b
Optimal novel biomarker combination(AGP + CP + LPGDS + TF) + ESR
0.910 NAa
AUC values obtained from logistic regression model probabilities foreach traditional biomarker and all biomarkers together
dsDNA double strand DNA, ESR erythrocyte sedimentation rate, AGPAlpha-1-acid glycoprotein, CP ceruloplasmin, LPGDS lipocalin-likeprostaglandin D synthase, TF transferrina Not available; ESR was not routinely measured in Cohort 2b ESR data missing from the Cohort 2 model
292 Pediatr Nephrol (2017) 32:283–295

With further prospective validation, it may become appar-ent that fewer biomarkers together can produce acceptableaccuracy for active LN identification (e.g. AGP and ceru-loplasmin) due to the level of correlation seen betweenbiomarkers (especially for Cohort 2). This would potential-ly make it a simpler point-of-care testing device for bio-marker quantification. Concurrent investigation of the roleof such biomarkers in vitro or in LN mouse models willalso help to improve understand of LN pathophysiology.
Conclusions
Patients with JSLE have significant renal involvement and thepotential to develop irreversible renal damage as the result ofLN relapses that are either unrecognised, not identified earlyenough or not treated sufficiently [4, 53]. This study has dem-onstrated and validated a renal-specific excellent novel urinebiomarker panel for the recognition of active LN in two eth-nically diverse JSLE populations, thereby providing consider-able strength to these findings. Further validation in larger,longitudinal, prospectively collected studies is required to de-fine biomarker profiles that predict LN relapses and responseto treatment. It is anticipated that a future urinary biomarkerpoint-of-care testing device will help to improve the renaloutcomes for JSLE patients through biomarker-led renal mon-itoring in routine clinical practice.
Acknowledgments The authors would like to acknowledge all patientsand their families for participating in this study, as well as all the supportgiven by the entire multi-disciplinary team within each of the paediatriccentres. The study was supported by the National Institute of HealthResearch (NIHR) Clinical Research Network (CRN), with special thanksto all children and CRN Research Nurses and staff in both centres, theNIHR Alder Hey Clinical Research Facility for Experimental Medicineand all those who have supported the work of the UK JSLE Study Groupto date. Specific acknowledgement goes to the clinical teams, consultants,research nurses and clinical nurse specialists in each centre, including:Yvonne Glackin, Olivia Lloyd, Susan Wadeson and Collette Hodgson.Special recognition also goes to Dr. Duncan Appleby for database andinformation technology support, Graham Jeffers for laboratory support,Carla Roberts for co-ordination of the UK JSLE Cohort study and NicoleJordan for co-ordination of the Einstein Lupus Cohort.
Author contributions EMDS, LO, AM, DE, RC, CAJ, SDM, PN, CP,KT, BG, CP, DW, TR and MWB all participated in conception, design ofthe study, acquisition and interpretation of data. EMDS, DE, RC, PNcarried out the ELISA assays. ES and AJ performed the statistical analy-sis. All authors were involved in drafting the manuscript and revising itcritically for important intellectual content. They have also all read andgiven final approval of the version to be published.
Compliance with ethical standards All procedures performed in stud-ies involving human participants were in accordance with the ethicalstandards of the institutional and/or national research committee and withthe 1964 Helsinki declaration and its later amendments or comparableethical standards. Patient assent/consent and parental consent was obtain-ed to participate in the studies. Full ethical approvals were in place from
the National Research Ethics Service North West, Liverpool East, UK(reference 06/Q1502/77) and the Institutional Review Board at Einstein-Montefiore (IRB 2000–154).
Conflicts of interest There has not been any financial support or otherbenefits from commercial sources for the work reported on in this man-uscript. The authors do not have any financial interests that could create apotential conflict of interest or the appearance of a conflict of interest withregard to the work.
Funding This work was supported by the Alder HeyChildren’s KidneyFund through a training fellowship [UOG10065 to ES]. Lupus UK alsoprovides financial support for co-ordination of the UK JSLE CohortStudy. TR is supported by the Lupus Foundation of America CareerDevelopment Award, and the NIH (National Institutes of Health) LoanRepayment Program for Pediatric Research. BG is supported by theChildren’s Hospital at Montefiore Young Investigator Award. CP andBG are supported by NIH/NCI 1U19CA179564 and NIH/NCI1UH2/3TR000933.
The funding bodies detailed above were not involved in the design,collection, analysis, and interpretation of data; in the writing of the man-uscript; and in the decision to submit the manuscript for publication.
Open Access This article is distributed under the terms of the CreativeCommons At t r ibut ion 4 .0 In te rna t ional License (h t tp : / /creativecommons.org/licenses/by/4.0/), which permits unrestricted use,distribution, and reproduction in any medium, provided you giveappropriate credit to the original author(s) and the source, provide a linkto the Creative Commons license, and indicate if changes were made.
References
1. Watson L, LeoneV, Pilkington C, Tullus K, Rangaraj S,McDonaghJE, Gardner-Medwin J, Wilkinson N, Riley P, Tizard J, Armon K,Sinha MD, Ioannou Y, Archer N, Bailey K, Davidson J, BaildamEM, Cleary G,McCann LJ, BeresfordMW (2012) Disease activity,severity, and damage in the UK Juvenile-Onset Systemic LupusErythematosus Cohort. Arthritis Rheum 64(7):2356–2365
2. Tucker LB, Uribe AG, Fernandez M, Vila LM, McGwin G, ApteM, Fessler BJ, Bastian HM, Reveille JD, Alarcon GS (2008)Adolescent onset of lupus results in more aggressive disease andworse outcomes: results of a nested matched case–control studywithin LUMINA, a multiethnic US cohort (LUMINA LVII).Lupus 17(4):314–322
3. Mina R, Brunner HI (2010) Pediatric lupus-are there differences inpresentation, genetics, response to therapy, and damage accrualcompared with adult lupus? Rheum Dis Clin N Am 36(1):53–80
4. Hiraki LT, LuB, Alexander SR, Shaykevich T, AlarconGS, SolomonDH, Winkelmayer WC, Costenbader KH (2011) End-stage renaldisease due to lupus nephritis among children in the US, 1995–2006. Arthritis Rheum 63(7):1988–1997. doi:10.1002/art.30350
5. Tucker LB, Menon S, Schaller JG, Isenberg DA (1995) Adult- andchildhood-onset systemic lupus erythematosus: a comparison ofonset, clinical features, serology, and outcome. Br J Rheumatol34(9):866–872
6. Hiraki LT, Benseler SM, Tyrrell PN, Hebert D, Harvey E,Silverman ED (2008) Clinical and laboratory characteristics andlong-term outcome of pediatric systemic lupus erythematosus: alongitudinal study. J Pediatr 152(4):550–556
7. Font J, Cervera R, Espinosa G, Pallares L, Ramos-Casals M,Jimenez S, Garcia-Carrasco M, Seisdedos L, Ingelmo M (1998)Systemic lupus erythematosus (SLE) in childhood: analysis of
Pediatr Nephrol (2017) 32:283–295 293

clinical and immunological findings in 34 patients and comparisonwith SLE characteristics in adults. Ann Rheum Dis 57(8):456–459
8. Barron KS, Silverman ED, Gonzales J, Reveille JD (1993) Clinical,serologic, and immunogenetic studies in childhood-onset systemiclupus erythematosus. Arthritis Rheum 36(3):348–354
9. Appel AE, Sablay LB, Golden RA, Barland P, Grayzel AI, Bank N(1978) The effect of normalization of serum complement and anti-DNA antibody on the course of lupus nephritis: a two year prospec-tive study. Am J Med 64(2):274–283
10. Hagelberg S, Lee Y, Bargman J, Mah G, Schneider R, Laskin C,Eddy A, Gladman D, Urowitz M, Hebert D, Silverman E (2002)Longterm followup of childhood lupus nephritis. J Rheumatol29(12):2635–2642
11. Sun L, Xu H, Liu HM, Zhou LJ, Cao Q, Shen Q, Fang XY (2011)Long-term follow-up of 101 cases with pediatric lupus nephritis in asingle center in Shanghai. Zhonghua Er Ke Za Zhi 49(11):819–824
12. Lee BS, Cho HY, Kim EJ, Kang HG, Ha IS, Cheong HI, Kim JG,Lee HS, Choi Y (2007) Clinical outcomes of childhood lupus ne-phritis: a single center’s experience. Pediatr Nephrol 22(2):222–231
13. Ataei N, Haydarpour M, Madani A, Esfahani ST, Hajizadeh N,Moradinejad MH, Gholmohammadi T, Arbabi S, Haddadi M(2008) Outcome of lupus nephritis in Iranian children: prognosticsignificance of certain features. Pediatr Nephrol 23(5):749–755
14. Preda A, Van Dijk LC, Van Oostaijen JA, Pattynama PM (2003)Complication rate and diagnostic yield of 515 consecutiveultrasound-guided biopsies of renal allografts and native kidneysusing a 14-gauge Biopty gun. Eur Radiol 13(3):527–530
15. Blake KD, Madden S, Taylor BW, Rees L (1996) Psychologicaland clinical effects of renal biopsy performed using sedation.Pediatr Nephrol 10(6):693–695
16. Faurschou M, Starklint H, Halberg P, Jacobsen S (2006) Prognosticfactors in lupus nephritis: diagnostic and therapeutic delay increasesthe risk of terminal renal failure. J Rheumatol 33(8):1563–1569
17. Esdaile JM, Levinton C, Federgreen W, Hayslett JP, Kashgarian M(1989) The clinical and renal biopsy predictors of long-term out-come in lupus nephritis: a study of 87 patients and review of theliterature. Q J Med 72(269):779–833
18. Esdaile JM, Joseph L, MacKenzie T, Kashgarian M, Hayslett JP(1994) The benefit of early treatment with immunosuppressiveagents in lupus nephritis. J Rheumatol 21(11):2046–2051
19. Illei GG, Tackey E, Lapteva L, Lipsky PE (2004) Biomarkers insystemic lupus erythematosus: II. Markers of disease activity.Arthritis Rheum 50(7):2048–2065
20. Schwartz N, Rubinstein T, Burkly LC, Collins CE, Blanco I, Su L,Hojaili B, Mackay M, Aranow C, Stohl W, Rovin BH, MichaelsonJS, Putterman C (2009) Urinary TWEAK as a biomarker of lupusnephritis: a multicenter cohort study. Arthritis Res Ther 11(5):R143
21. Abujam B, Cheekatla S, Aggarwal A (2013) Urinary CXCL-10/IP-10 and MCP-1 as markers to assess activity of lupus nephritis.Lupus 22(6):614–623
22. Howe HS, Kong KO, Thong BY, LawWG, Chia FL, Lian TY, LauTC, Chng HH, Leung BP (2012) Urine sVCAM-1 and sICAM-1levels are elevated in lupus nephritis. Int J Rheum Dis 15(1):13–16
23. Suzuki M, Wiers KM, Klein-Gitelman MS, Haines KA, Olson J,Onel KB, O’Neil K, Passo MH, Singer NG, Tucker L, Ying J,Devarajan P, Brunner HI (2008) Neutrophil gelatinase-associatedlipocalin as a biomarker of disease activity in pediatric lupus ne-phritis. Pediatr Nephrol 23(3):403–412
24. Abd-Elkareem MI, Al Tamimy HM, Khamis OA, Abdellatif SS,Hussein MR (2010) Increased urinary levels of the leukocyte adhe-sion molecules ICAM-1 and VCAM-1 in human lupus nephritiswith advanced renal histological changes: preliminary findings.Clin Exp Nephrol 14(6):548–557
25. Singh S, Wu T, Xie C, Vanarsa K, Han J, Mahajan T, Oei HB, AhnC, Zhou XJ, Putterman C, Saxena R, Mohan C (2012) Urine
VCAM-1 as a marker of renal pathology activity index in lupusnephritis. Arthritis Res Ther 14(4):R164
26. Watson L, Tullus K, Pilkington C, Chesters C, Marks SD, NewlandP, Jones CA, Beresford MW (2013) Urine biomarkers for monitor-ing juvenile lupus nephritis: a prospective longitudinal study.Pediatr Nephrol 29(3):397–405
27. Suzuki M, Wiers K, Brooks EB, Greis KD, Haines K, Klein-Gitelman MS, Olson J, Onel K, O’Neil KM, Silverman ED,Tucker L, Ying J, Devarajan P, Brunner HI (2009) Initial validationof a novel protein biomarker panel for active pediatric lupus nephri-tis. Pediatr Res 65(5):530–536
28. Abulaban K, Brunner H, Nelson SL, Bennett M, Ying J, Song H,Kimmel P, Kusek J, Feldman H, Ramachandran V, Rovin BH(2014) Urine biomarkers role in predicting the future developmentof renal functional loss with lupus nephritis in children and adults.Arthritis Rheum 66[Suppl 11]:S111
29. Brunner HI, Bennett MR, Mina R, Suzuki M, Petri M, Kiani AN,Pendl J, Witte D, Ying J, Rovin BH, Devarajan P (2012)Association of noninvasively measured renal protein biomarkerswith histologic features of lupus nephritis. Arthritis Rheum 64(8):2687–2697
30. Brunner HI, Bennett M, Abulaban K, Klein-GitelmanM, O’Neil K,Tucker L, Ardoin S, Rouster-Stevens K, Onel K, Singer N,Eberhard BA, Jung L, Imundo L, Wright T, Witte D, Rovin B,Ying J, Devarajan P (2015) Development of a novel renal activityindex of lupus nephritis in children & young adults. Arthritis CareRes (Hoboken) 68(7):1003–1011
31. Molad Y, Miroshnik E, Sulkes J, Pitlik S, Weinberger A, MonseliseY (2002) Urinary soluble VCAM-1 in systemic lupus erythemato-sus: a clinical marker for monitoring disease activity and damage.Clin Exp Rheumatol 20(3):403–406
32. Watson L, Midgley A, Pilkington C, Tullus K, Marks S, Holt R,Jones C, Beresford M (2012) Urinary monocyte chemoattractantprotein 1 and alpha 1 acid glycoprotein as biomarkers of renaldisease activity in juvenile-onset systemic lupus erythematosus.Lupus 21(5):496–501
33. Wu T, Xie C, Wang HW, Zhou XJ, Schwartz N, Calixto S, MackayM, Aranow C, Putterman C, Mohan C (2007) Elevated urinaryVCAM-1, P-selectin, soluble TNF receptor-1, and CXC chemokineligand 16 in multiple murine lupus strains and human lupus nephri-tis. J Immunol 179(10):7166–7175
34. Nee R, Martinez-Osorio J, Yuan CM, Little DJ, Watson MA,Agodoa L, Abbott KC (2015) Survival Disparity of AfricanAmerican Versus Non-African American Patients With ESRDDue to SLE. Am J Kidney Dis 66(4):630–637
35. Schwartz N, Su L, Burkly LC, Mackay M, Aranow C, Kollaros M,Michaelson JS, Rovin B, Putterman C (2006) Urinary TWEAK andthe activity of lupus nephritis. J Autoimmun 27(4):242–250
36. Marks SD, Pilkington C, Woo P, Dillon MJ (2004) The use of theBritish Isles Lupus Assessment Group (BILAG) index as a validtool in assessing disease activity in childhood-onset systemic lupuserythematosus. Rheumatology 43(9):1186–1189
37. Isenberg DA, Rahman A, Allen E, Farewell V, Akil M, Bruce IN,D’Cruz D, Griffiths B, Khamashta M, Maddison P, McHugh N,Snaith M, Teh LS, Yee CS, Zoma A, Gordon C (2005) BILAG2004. Development and initial validation of an updated version ofthe British Isles Lupus Assessment Group’s disease activity indexfor patients with systemic lupus erythematosus. Rheumatology44(7):902–906
38. Tan EM, Cohen AS, Fries JF, Masi AT, McShane DJ, Rothfield NF,Schaller JG, Talal N, Winchester RJ (1982) The 1982 revisedcriteria for the classification of systemic lupus erythematosus.Arthritis Rheum 25(11):1271–1277
39. Harris M, Taylor G (2014) Medical statistics made easy 3, 3rd edn.Scion Publishing Limited, Banbury
294 Pediatr Nephrol (2017) 32:283–295

40. R Core Team (2013) R: a language and environment for statisticalcomputing. R Foundation for Statistical Computing, Vienna.Available at:http://www.r-project.org/. Accessed 31 Aug 2015
41. Akobeng AK (2007) Understanding diagnostic tests 3: Receiveroperating characteristic curves. Acta Paediatr 96(5):644–647
42. Dall’Era M, Levesque V, Solomons N, TrumanM,Wofsy D (2015)Identification of clinical and serological factors during inductiontreatment of lupus nephritis that are associated with renal outcome.Lupus Sci Med 2(1), e000089
43. Rubinstein T, Pitashny M, Levine B, Schwartz N, Schwartzman J,Weinstein E, Pego-Reigosa JM, Lu TY, Isenberg D, Rahman A,Putterman C (2010) Urinary neutrophil gelatinase-associatedlipocalin as a novel biomarker for disease activity in lupus nephritis.Rheumatology 49(5):960–971
44. Kiani AN, Wu T, Fang H, Zhou XJ, Ahn CW, Magder LS, MohanC, Petri M (2012) Urinary vascular cell adhesion molecule, but notneutrophil gelatinase-associated lipocalin, is associated with lupusnephritis. J Rheumatol 39(6):1231–1237
45. PitashnyM, Schwartz N, QingX, Hojaili B, AranowC,MackayM,Putterman C (2007) Urinary lipocalin-2 is associated with renaldisease activity in human lupus nephritis. Arthritis Rheum 56(6):1894–1903
46. Yang CC, Hsieh SC, Li KJ, Wu CH, Lu MC, Tsai CY, Yu CL(2012) Urinary neutrophil gelatinase-associated lipocalin is a po-tential biomarker for renal damage in patients with systemic lupuserythematosus. J Biomed Biotechnol 2012:759313
47. Fournier T, Bouach N, Delafosse C, Crestani B, Aubier M (1999)Inducible expression and regulation of the alpha 1-acid
glycoprotein gene by alveolar macrophages: prostaglandin E2 andcyclic AMP act as new positive stimuli. J Immunol 163(5):2883–2890
48. Sorensson J, Matejka GL, Ohlson M, Haraldsson B (1999) Humanendothelial cells produce orosomucoid, an important component ofthe capillary barrier. Am J Physiol 276(2):530–534
49. Nakamura T, Board PG, Matsushita K, Tanaka H, Matsuyama T,Matsuda T (1993) Alpha 1-acid glycoprotein expression in humanleukocytes: possible correlation between alpha 1-acid glycoproteinand inflammatory cytokines in rheumatoid arthritis. Inflammation17(1):33–45
50. Ohara N, Hanyu O, Hirayama S, Nakagawa O, Aizawa Y, Ito S,Sone H (2014) Hypertension increases urinary excretion of immu-noglobulin G, ceruloplasmin and transferrin in normoalbuminuricpatients with type 2 diabetes mellitus. J Hypertens 32(2):432–438
51. Urade Y, Hayaishi O (2000) Biochemical, structural, genetic, phys-iological, and pathophysiological features of lipocalin-typeprostaglandin D synthase. Biochim Biophys Acta 1482(1–2):259–271
52. Hirawa N, Uehara Y, Ikeda T, Gomi T, Hamano K, Totsuka Y,Yamakado M, Takagi M, Eguchi N, Oda H, Seiki K, Nakajima H,Urade Y (2001) Urinary prostaglandin D synthase (beta-trace) ex-cretion increases in the early stage of diabetes mellitus. Nephron87(4):321–327
53. Otten MH, Cransberg K, van RossumMA, Groothoff JW, Kist-vanHolthe JE, Ten Cate R, Van Suijlekom-Smit LW (2010)Disease activity patterns in juvenile systemic lupus erythe-matosus and its relation to early aggressive treatment. Lupus19(13):1550–1556
Pediatr Nephrol (2017) 32:283–295 295