Embed Size (px)
Citation preview
Intersection Control Evaluation
Stadium Road at
Pohl Road
in Mankato, Blue Earth County, Minnesota
Mankato/North Mankato Area Planning Organization
October 2016
SRF No. 016 09243


Intersection Control Evaluation ii SRF Consulting Group, Inc. Stadium Road at Pohl Road
Table of Contents
Introduction .......................................................................................................................................... 1
Existing Intersection Characteristics ................................................................................................. 3
Future Conditions ................................................................................................................................ 5
Traffic Volumes .................................................................................................................................... 7
Analysis of Alternatives ..................................................................................................................... 10
Alternatives Assessment .................................................................................................................... 16
Conclusions and Recommendations ............................................................................................... 17
Appendix ............................................................................................................................................. 20
H:\Projects\09000\9243\SD\Reports\9243 ICE Pohl Stadium 2016-10-26.docx

Intersection Control Evaluation 1 SRF Consulting Group, Inc. Stadium Road at Pohl Road
Introduction
This report contains the intersection control evaluation results for the Stadium Road (CSAH
60) at Pohl Road intersection in Mankato, Blue Earth County, Minnesota (see Figure 1). The
purpose of the evaluation was to analyze the intersection control alternatives for the
intersection to identify the long-term preferred intersection control. The following intersection
control alternatives were considered applicable and are analyzed within this report:
All-Way Stop Control
Roundabout Control
Traffic Signal Control
A mini-roundabout variation was also explored. According to Mini-Roundabouts Technical
Summary (Federal Highway Administration, 2010), mini-roundabouts are best suited/most
efficient in lower speed environments (30 mph or less), and are generally recommended for
intersections where the total entering daily traffic volume does not exceed approximately
15,000 vehicles. The intersection currently has 17,700 entering vehicles and Stadium Road has
a posted speed of 40 mph. Large vehicles are typically required to over-run the fully traversable
central island, and high volumes of large vehicles will significantly reduce the capacity of a
mini-roundabout, and may lead to rapid wear of the roadway markings. Based on these factors,
the mini-roundabout option was not analyzed further at the study intersection.
A detailed warrants analysis, operational analysis, safety analysis, and planning-level cost
analysis were performed to determine the preferred intersection control alternative. In
addition to these analyses, other factors considered for this evaluation that were applicable to
determining the long-term preferred intersection control included:
Right-of-Way Considerations
Transportation System Considerations
Pedestrian and Bicycle Considerations
Local Acceptance

Figure 1Intersection Control Evaluation
Stadium Road at Pohl Road016 09243
October 2016
Study Intersection
Image Source: Microsoft Bing Maps
North
Study
Intersection

Intersection Control Evaluation 3 SRF Consulting Group, Inc. Stadium Road at Pohl Road
Existing Intersection Characteristics
Existing Conditions
The study intersection is located in the City of Mankato, Blue Earth County, as shown in
Figure 1. Stadium Road (CSAH 60) is a three-lane undivided county road with a speed limit
of 40 mph and is functionally classified as a Minor Arterial. Pohl Road was recently restriped
from a four-lane to a three-lane undivided roadway. Pohl Road is a city street with a speed
limit of 30 mph and is functionally classified as a Major Collector north of Stadium Road and
a Local road to the south of Stadium Road. The intersection of Stadium Road and Pohl Road
is skewed and is currently all-way stop controlled. There are bicycle and pedestrian
accommodations on both sides of Stadium Road and the west side of Pohl Road. There are
marked pedestrian crossings that cross Pohl Road on both sides of Stadium Road.
The adjacent area has primarily residential land uses with some industrial to the south and east.
Minnesota State University is located approximately one mile to the west. The existing lane
configurations for the Stadium Road and Pohl Road intersection are listed in Table 1 below
and are shown in Figure 2.
Table 1. Existing Conditions
Leg Configuration
Eastbound Stadium Road One left-turn lane and one shared thru/right-turn lane
Westbound Stadium Road One left-turn lane and one shared thru/right-turn lane
Northbound Pohl Road One left-turn lane and one shared thru/right-turn lane
Southbound Pohl Road One left-turn lane and one shared thru/right-turn lane
Crash History
Crash data was obtained from the Minnesota Crash Mapping Analysis Tool (MnCMAT)
database for a five-year period from 2011 to 2015. There were thirteen recorded crashes at the
study intersection during the analysis period. Detailed crash data is provided in the Appendix.
This results in a crash rate of 0.40 crashes per million entering vehicles, which is slightly above
the statewide average of 0.35 for all-way stop controlled intersections, but is still well below
the critical crash rate of 0.54 (0.95 level of confidence) for this intersection.

H:\
Proje
cts\0
9000\9
243\C
AD
_BIM\G
raphics\9
243 Fig
ure 2 - E
xisting C
onditio
ns.d
gn
October 2016016 09243
Existing Conditions
Intersection Control Evaluation
Stadium Road at Pohl Road
Figure 2
1000
scale in feet
50
PO
HL
RD.
STADIUM RD.
PO
HL
RD.
STADIUM RD.

Intersection Control Evaluation 5 SRF Consulting Group, Inc. Stadium Road at Pohl Road
Future Conditions
Based on discussions with city staff in the summer of 2016, no short-term improvements to
Stadium Road, Pohl Road, or the study intersection are planned. Future development south
of the study intersection will likely necessitate an intersection control change to support traffic
growth. For the alternatives analysis, the existing lane configurations under all-way stop
control (listed in Table 1 and shown in Figure 2) were assumed to be the same for the traffic
signal control alternative. The lane configurations for the roundabout control alternative are
listed in Table 2 below and are shown in Figure 3. The roundabout concept shown is offset
from the center of the existing intersection to minimize impacts to the property in the
northeast quadrant.
Table 2. Proposed Lane Configurations for Roundabout Control Alternative
Leg Configuration
Eastbound Stadium Road One shared lane (all movements)
Westbound Stadium Road One shared lane (all movements)
Northbound Pohl Road One shared lane (all movements)
Southbound Pohl Road One shared lane (all movements)


Intersection Control Evaluation 7 SRF Consulting Group, Inc. Stadium Road at Pohl Road
Traffic Volumes
Hourly traffic volumes including the existing a.m. and p.m. peak hour were collected in early
May 2016 by the City of Mankato prior to the conclusions of the spring term at Minnesota
State University and are shown in Figure 4. Pedestrian and bicycle volumes were also collected.
Growth rates from the MAPO 2045 Transportation Plan (1.6% for the north leg, 1.3% for
the east leg, 2.5% for the south leg, and 1.0% for the west leg) were used to determine
Forecasted Year 2036 peak hour turning movement volumes, which are shown in Figure 5.

Figure 4Intersection Control Evaluation
Stadium Road at Pohl Road016 09243
October 2016
Existing Year 2016 Volumes
Image Source: Microsoft Bing Maps
North
45 (45)
240 (435)
75 (160)
60
(140)
60
(75)
45
(25)
(120) 40
(395) 305
(45) 30
(35)
40
(60)
70
(110)
125
Legend
XX = A.M. Peak [7:15-8:15]
(XX) = P.M. Peak [4:45-5:45]

Figure 5Intersection Control Evaluation
Stadium Road at Pohl Road016 09243
October 2016
Forecasted Year 2036 Volumes
Image Source: Microsoft Bing Maps
North
55 (55)
300 (545)
95 (200)
80
(185)
80
(100)
60
(35)
(140) 50
(475) 370
(50) 35
(55)
60
(90)
105
(165)
190
Legend
XX = A.M. Peak
(XX) = P.M. Peak

Intersection Control Evaluation 10 SRF Consulting Group, Inc. Stadium Road at Pohl Road
Analysis of Alternatives
The analysis of the all-way stop control, traffic signal control, and roundabout control
alternatives included a warrants analysis, operational analysis, planning-level crash analysis, and
a planning-level cost analysis. Existing Year 2016 and Forecasted Year 2036 volumes with
proposed lane configurations discussed previously were used for the analysis.
Warrants Analysis
A warrants analysis was performed for the traffic signal control alternative as outlined in the
February 2015 Minnesota Manual on Uniform Traffic Control Devices (MN MUTCD). The signal
warrants analysis was based on the assumptions shown in Table 3.
Table 3. Warrants Analysis Assumptions
Leg Geometry Speed
Eastbound Mainline (Stadium Road) 2 or more approach lanes 40 mph
Westbound Mainline (Stadium Road) 2 or more approach lanes 40 mph
Northbound Minor Street (Pohl Road) 2 or more approach lanes 30 mph
Southbound Minor Street (Pohl Road) 2 or more approach lanes 30 mph
Because of the shared northbound and southbound thru/right-turn lanes, minor approach
right turns were included in the analysis. Table 4 provides a summary of the results of the
warrants analysis. The detailed warrants analysis can be found in the Appendix.

Intersection Control Evaluation 11 SRF Consulting Group, Inc. Stadium Road at Pohl Road
Table 4. Warrants Analysis Results
MN MUTCD Warrant Hours
Required
Year 2016
Volumes
Forecasted Year 2036
Volumes
Hours Met Warrant Met Hours Met Warrant Met
Warrant 1A: Minimum
Vehicular Volume 8 3 No 10 Yes
Warrant 1B: Interruption
of Continuous Traffic 8 4 No 8 Yes
Warrant 1C: Combination
of Warrants 8 9 Yes 11 Yes
Warrant 2: Four-Hour
Volume 4 2 No 9 Yes
Warrant 3B: Peak-Hour
Volume 1 0 No 2 Yes
Multi-way Stop
Applications Condition C 8 14 Yes 15 Yes
Warrants 4-9 were investigated but were determined to be not applicable. Results of the
warrants analysis indicate that Existing Year 2016 volumes satisfy the MN MUTCD warrant
requirements for traffic signal Warrant 1 (Condition C), while Forecasted Year 2036 volumes
satisfy the MN MUTCD warrant requirements for traffic signal Warrants 1 (Conditions A, B,
and C), 2, and 3B.
Operational Analysis
An initial planning-level analysis was performed for the roundabout control alternative based
on Highway Capacity Manual methods found in NCHRP Report 672 Roundabouts: An
Informational Guide, Second Edition (Transportation Research Board, 2010). The analysis involved
testing the theoretical capacity of a single-lane roundabout against the Forecasted Year 2036
entering and circulating volumes. As shown in Chart 1, the Forecasted Year 2036 volumes do
not exceed the theoretical capacity of a single-lane roundabout. Therefore, a single lane
roundabout was selected for further analysis.

Intersection Control Evaluation 12 SRF Consulting Group, Inc. Stadium Road at Pohl Road
Chart 1. Single-Lane Roundabout Entry Lane Capacity (Forecasted Year 2036 volumes)
Operational analysis of the roundabout control alternative was performed using RODEL and
Highway Capacity Software (HCS). RODEL is a software program that is based on existing
roundabout operational research and uses an empirical formula method to determine
roundabout delay based on geometric features and traffic flows. RODEL is the current
MnDOT accepted analysis tool for evaluating roundabouts. HCS is based on methodologies
found in the 2010 Highway Capacity Manual (HCM) which is considered a conservative
approach to determining the capacity of a roundabout. It is important to note that RODEL
and HCS only report “stop” or “control” delay. Therefore, in order to determine the total
delay, “geometric” delay, or delay due to vehicle deceleration and acceleration through an
intersection, must be added to the “stop” or “control” delay.
The detailed operational analysis of all-way stop control and traffic signal control was
performed using methods outlined in the 2010 HCM using Synchro/SimTraffic.
Synchro/SimTraffic is capable of calculating various measures of effectiveness such as control
delay, queuing, and total travel time impacts. SimTraffic results are reported for the analysis.
The operational analysis identified a Level of Service (LOS), which indicates how well an
intersection is operating based on average delay per vehicle. Intersections are given a ranking
from LOS A to LOS F. LOS A indicates the best traffic operation and LOS F indicates an
intersection where demand exceeds capacity. LOS A through LOS D are generally considered
acceptable. RODEL results for a Confidence Level (CL) of 50% and 85% were determined.
0
200
400
600
800
1000
1200
0 200 400 600 800 1000 1200
Cap
acit
y (p
c/h
)
Conflicting Flow Rate (pc/h)
A.M. Peak P.M. Peak capacity against one conflicting lane

Intersection Control Evaluation 13 SRF Consulting Group, Inc. Stadium Road at Pohl Road
50% CL results are typically used for roundabout analysis while the 85% CL results indicate
the sensitivity of the roundabout design. When a substantial degradation in LOS is expected
from 50% CL to 85% CL, designers should exercise caution in the design of the roundabout
to ensure adequate capacity is provided.
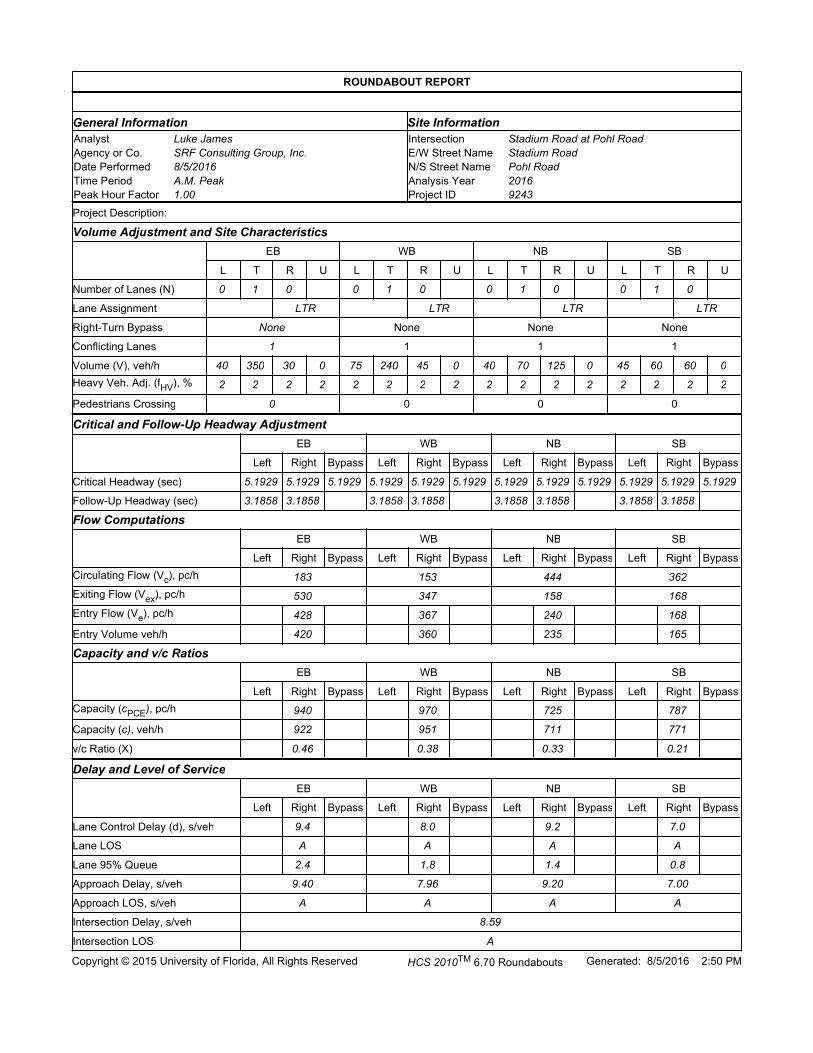
Tables 5 and 6 provide a summary of the operational analysis for Existing Year 2016 and
Forecasted Year 2036 conditions, respectively. Detailed operational analysis results can be
found in the Appendix.
Table 5. Existing Year 2016 Operational Analysis Results
Alternative Analysis Tool
A.M. Peak P.M. Peak
Delay (1)
(sec/veh) LOS
Delay (1)
(sec/veh) LOS
All-Way Stop Control Synchro/SimTraffic 5/7 A/A 12/15 B/B
Traffic Signal Control Synchro/SimTraffic 7/9 A/A 12/13 B/B
Roundabout Control
HCS 2010 9/9 A/A 15/17 B/C
RODEL 50% CL 5/5 A/A 7/8 A/A
85% CL 7/7 A/A 13/17 B/C
(1) Control/stop delay is reported. Overall results are followed by the worst approach results.
Table 6. Forecasted Year 2036 Operational Analysis Results
Alternative Analysis Tool
A.M. Peak P.M. Peak
Delay (1)
(sec/veh) LOS
Delay (1)
(sec/veh) LOS
All-Way Stop Control Synchro/SimTraffic 14/26 B/D >100/>100 F/F
Traffic Signal Control Synchro/SimTraffic 9/10 A/B 20/22 C/C
Roundabout Control
HCS 2010 11/14 B/B 32/46 D/E
RODEL 50% CL 6/6 A/A 12/17 B/C
85% CL 9/10 A/A 49/93 E/F
(1) Control/stop delay is reported. Overall results are followed by the worst approach results.
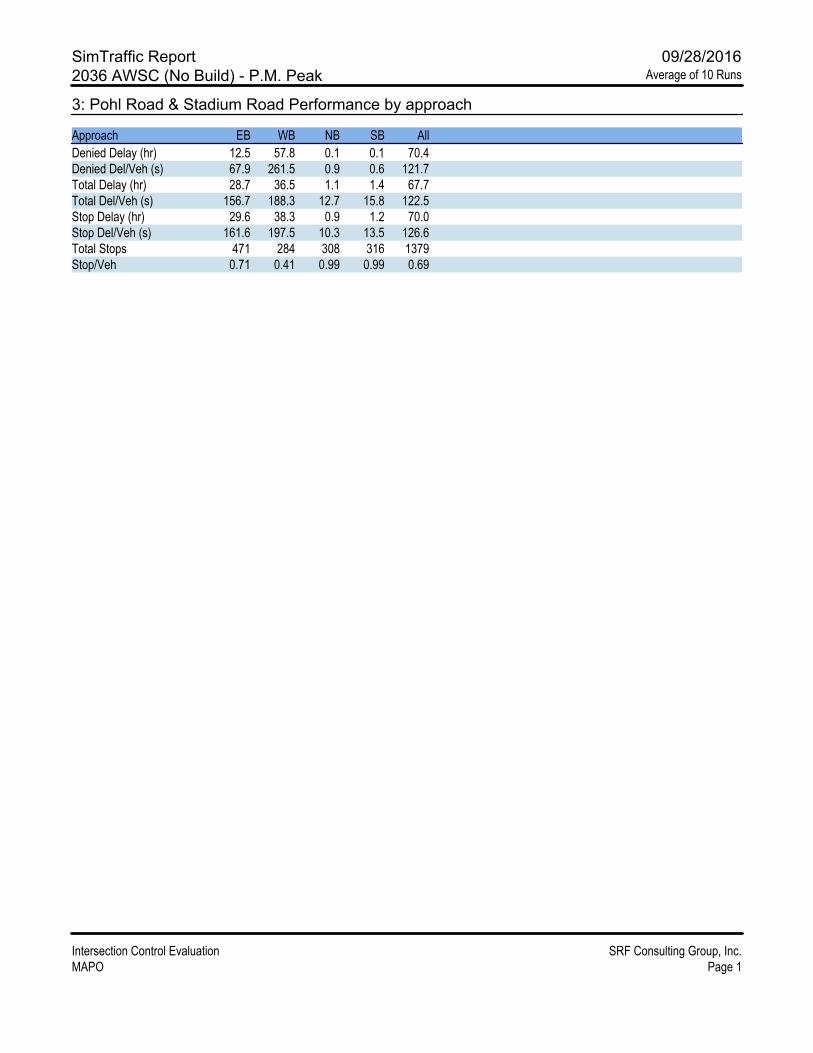
Results of the operational analysis indicate that under the existing all-way stop control, the
intersection operates with an acceptable level of service. However, by Forecasted Year 2036,
the all-way stop control alternative would operate with an unacceptable level of service during
the p.m. peak. Therefore the all-way stop control alternative was not considered further as a
viable long-term alternative. The traffic signal control and roundabout control alternatives
would operate with acceptable levels of service under forecasted conditions, though the single
lane roundabout control alternative would be near capacity during the p.m. peak. The p.m.
peak hour factor is 0.95, which indicates this peak hour volume is sustained over the entire
peak hour.

Intersection Control Evaluation 14 SRF Consulting Group, Inc. Stadium Road at Pohl Road
Safety Analysis
A crash analysis was performed to determine the projected crashes per year for Year 2016 and
Forecasted Year 2036 conditions for the study intersection. Crash rates from the MnDOT
Green Sheets (2011 to 2015 data) were used for the crash analysis of the alternatives.
According to NCHRP Report 672 Roundabouts: An Informational Guide, Second Edition
(Transportation Research Board, 2010), the conversion of an all-way stop controlled
intersection to a roundabout has an insignificant impact on safety. Therefore, the crash rate
for all-way stop control was used for the roundabout control alternative. A summary of the
crash analysis is shown in Table 7.
Table 7. Crash Analysis Results
Alternative
Intersection
AADT
(2016)
Intersection
AADT
(2036)
Crash
Rate
Projected
Crashes/Year
(2016)
Projected
Crashes/Year
(2036)
Traffic Signal Control 17,700 22,700
0.52 4 5
Roundabout Control 0.35 2 3
Based on the results of the crash analysis, the roundabout control alternative is anticipated to
have slightly less crashes than the traffic signal control alternative.
Studies have determined that the installation of a roundabout can improve overall safety of an
intersection when compared to other forms of intersection control. Roundabouts typically
have fewer conflict points than conventional intersections and the geometry of a roundabout
induces lower speeds for vehicles approaching and traversing an intersection. With lower
speeds, the severity of the crashes is decreased. A roundabout virtually eliminates right-angle
and left-turn head-on crashes. Studies have shown the frequency of injury crashes is reduced
more than property damage only crashes.
At a roundabout, drivers must be aware of traffic traveling around the circle when merging on
or off the roundabout. Conversely, drivers at a traditional intersection must be aware of
vehicles at all approaches and the movements they are making. This issue is most prevalent at
stop-controlled intersections where there is not a traffic signal to control vehicle movements.

Intersection Control Evaluation 15 SRF Consulting Group, Inc. Stadium Road at Pohl Road
Planning-Level Cost Analysis
Capital Costs
The traffic signal control alternative can utilize the existing geometric conditions, therefore
the cost for this alternative would only be the cost of installing a traffic signal system, along
with ADA improvements. The roundabout control alternative would require substantial
reconstruction at and leading up to the intersection, which results in a much higher cost than
the traffic signal control alternative.
Operation and Maintenance Costs
Traffic signals typically have higher operation and maintenance costs than roundabouts
because of the electricity required to operate the signal and routine maintenance required to
keep the signal in operation. Operation and maintenance costs associated with a roundabout
can vary depending on the amount of illumination required or landscaping alternatives used
for the center island.
A cost analysis summary is shown in Table 8. Detailed cost analysis results can be found in
the Appendix.
Table 8. Cost Analysis Summary
Alternative Capital Costs (1) Operation/Maintenance Costs
(annual)
Traffic Signal Control $300,000 $4,000-$6,000
Roundabout Control $1,130,000 $500-$1,000
(1) Does not include engineering or right-of-way costs.

Intersection Control Evaluation 16 SRF Consulting Group, Inc. Stadium Road at Pohl Road
Alternatives Assessment
Right-of-Way Considerations
The intersection geometry for the traffic signal control alternative would use existing
conditions and therefore no additional right-of-way would be expected. Construction of a
roundabout at the study intersection would require additional right-of-way in all four
quadrants of the intersection. As previously stated, the roundabout was designed off center to
avoid impacts to the property in the northeast quadrant. Therefore, right-of-way impacts in
the other three quadrants are more significant, but do not require building acquisition.
Transportation System Considerations
There are three existing traffic signals two-thirds of a mile west of the study intersection at
Monks Avenue, Warren Street, and Ellis Avenue. These three traffic signals are at the
Minnesota State University campus and are spaced a quarter mile apart. The traffic signal
control alternative would extend the continuity of this intersection control type to the west,
however, it would likely not operate in coordination with the three signals to the west. There
is an existing roundabout two-thirds of a mile east of the study intersection at the Stadium
Road and Victory Drive intersection. The roundabout control alternative would match with
the intersection control to the east. The roundabout control alternative could be considered
a traffic calming measure for the surrounding residential area.
Pedestrian and Bicycle Considerations
As previously mentioned, there are trails/sidewalks on both sides of Stadium Road and the
west side of Pohl Road. Both Stadium Road and Pohl Road also have shoulders that can be
utilized as bike lanes. Pedestrian accommodations can be provided regardless of selected
intersection control. The design of a roundabout allows pedestrians to cross one direction of
traffic at a time with a refuge space in the middle of each leg of the roundabout, and these
short crossing distances and reduced travel speeds of traffic improve pedestrian safety. Their
route is slightly longer since they are kept to the outside of the inscribed circle. The roundabout
concept design shown includes slip ramps to transition bicyclists between on-street bike lanes
and multi-use trails around the perimeter of the roundabout. The design of signalized
intersections can create a safe environment for pedestrian crossings with the use of pedestrian
signal phasing. This phasing allows pedestrians to safely cross an intersection while vehicular
movements are served. Although signalized intersections can provide indications showing
pedestrian right-of-way, potential conflicts can come from red-light running through vehicles
and permissive turning traffic.

Intersection Control Evaluation 17 SRF Consulting Group, Inc. Stadium Road at Pohl Road
Local Acceptance
Drivers are familiar with traveling through signalized intersections since there are many
intersections in the area under this type of traffic control. Drivers are also familiar with
traveling through roundabout controlled intersections since there are many existing
roundabouts throughout the Mankato area including one two-thirds of a mile east at Stadium
Road and Victory Drive.
Conclusions and Recommendations
The following conclusions are provided for this intersection control evaluation for the
Stadium Road at Pohl Road intersection in Mankato, Blue Earth County, Minnesota:
Warrants Analysis
Results of the warrants analysis indicate that Existing Year 2016 volumes satisfy the MN
MUTCD warrant requirements for traffic signal Warrant 1 (Condition C), while
Forecasted Year 2036 volumes satisfy the MN MUTCD warrant requirements for traffic
signal Warrants 1 (Conditions A, B, and C), 2, and 3B.
Operational Analysis
Results of the operational analysis indicate that all-way stop is not a viable alternative long-
term. Both the traffic signal control and roundabout control alternatives would operate
with acceptable levels of service under forecasted conditions, but the roundabout control
alternative would be near capacity during the p.m. peak.
Safety Analysis
Based on the results of the crash analysis, the roundabout control alternative is anticipated
to have slightly less crashes than the traffic signal control alternative. Roundabouts
typically have fewer conflict points than conventional intersections and the geometry of a
roundabout induces lower speeds for vehicles approaching and traversing an intersection.
With lower speeds, the severity of the crashes is decreased.
Planning-Level Cost Analysis
The traffic signal control alternative can utilize the existing geometric conditions, therefore
the cost for this alternative would only be the cost of installing a traffic signal system, along
with ADA improvements, which would be approximately $300,000. The roundabout
control alternative would require substantial reconstruction at and leading up to the
intersection, which results in a much higher cost estimate of approximately $1,130,000.
Traffic signals typically have higher operation and maintenance costs because of the
electricity required to operate the signal and routine maintenance required to keep the
signal in operation. Operation and maintenance costs associated with a roundabout can
vary depending on the amount of illumination required or landscaping alternatives used
for the center island.

Intersection Control Evaluation 18 SRF Consulting Group, Inc. Stadium Road at Pohl Road
Right-of-Way Considerations
The intersection geometry for the traffic signal control alternative would use existing
conditions and therefore no additional right-of-way would be expected. Construction of a
roundabout at the study intersection would require additional right-of-way in all four
quadrants of the intersection. The roundabout was designed off center to avoid impacts
to the property in the northeast quadrant. Therefore, right-of-way impacts in the other
three quadrants are more significant, but do not require building acquisition. The
roundabout control alternative could be considered a traffic calming measure for the
surrounding residential area.
Transportation System Considerations
There are three existing traffic signals at Minnesota State University two-thirds of a mile
west of the study intersection. The traffic signal control alternative would extend the
continuity of this intersection control to the west, however, it would likely not operate in
coordinate with the three signals to the west. There is an existing roundabout two-thirds
of a mile east of the study intersection at the Stadium Road and Victory Drive intersection.
The roundabout control alternative would match with the intersection control to the east
through the residential area.
Pedestrian and Bicycle Considerations
The design of signalized intersections can take pedestrian crossings and safety into
consideration with the use of pedestrian signal phasing. The design of a roundabout allows
pedestrians to cross one direction of traffic at a time on each leg of the roundabout. Their
route is slightly longer since they are kept to the outside of the inscribed circle.
Local Acceptance
Drivers are familiar with traveling through signalized intersections since there are many
intersections in the area under this type of traffic control. Drivers are also familiar with
traveling through roundabout controlled intersections since there are many existing
roundabouts throughout the Mankato area including one two-thirds of a mile east at
Stadium Road and Victory Drive.
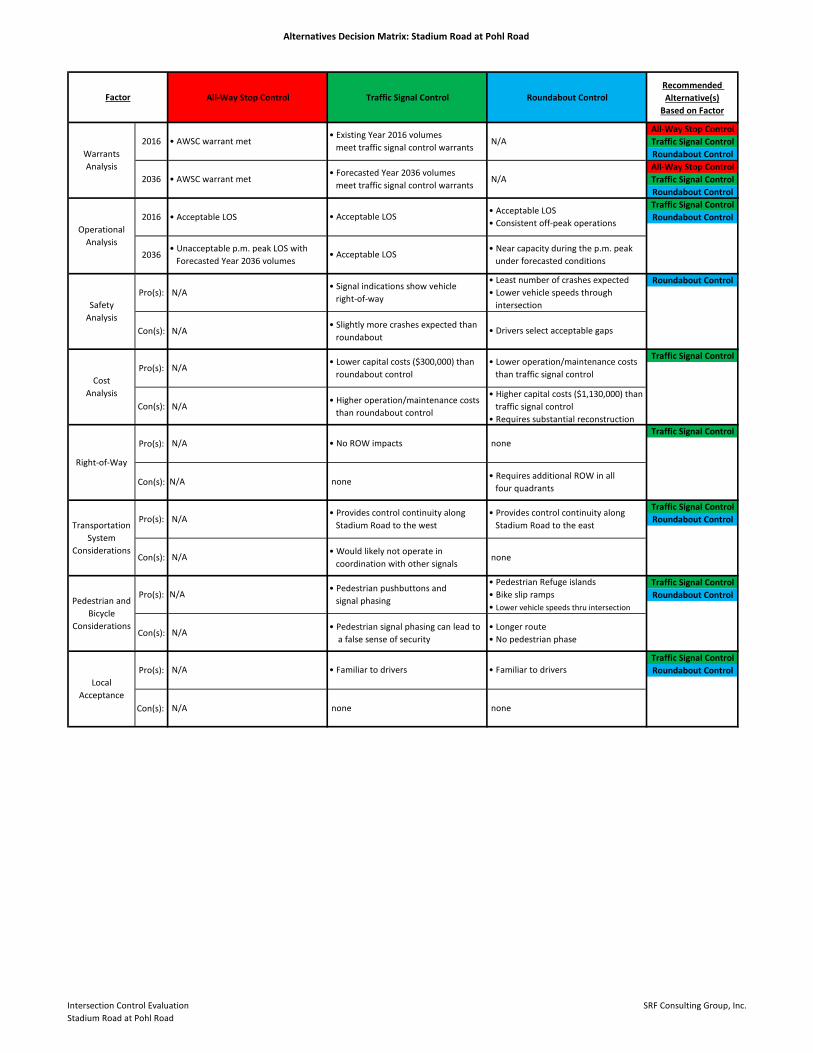
A decision matrix was developed to help evaluate the key factors and is provided on the
following page. Based on the results of this Intersection Control Evaluation, both the traffic
signal control and roundabout control alternatives are viable options for the Stadium Road at
Pohl Road intersection. A roundabout would have more capital and right-of-way costs, but
would have lower annual operation and maintenance costs. The traffic signal control and
roundabout control alternatives have comparable operations near-term and during the
forecasted a.m. peak, but the roundabout control alternative would be near capacity during
the p.m. peak under forecasted conditions. However, compared to a traffic signal, a
roundabout would have more consistent off-peak operations throughout the day when traffic
volumes are lower. Therefore, the roundabout control alternative is recommended.
Alternatives Decision Matrix: Stadium Road at Pohl Road
All-Way Stop Control Traffic Signal Control Roundabout Control
Recommended
Alternative(s)
Based on Factor
All-Way Stop Control
Traffic Signal Control
Roundabout Control
All-Way Stop Control
Traffic Signal Control
Roundabout Control
Traffic Signal Control
Roundabout Control
Roundabout Control
Con(s): N/A• Slightly more crashes expected than
roundabout• Drivers select acceptable gaps
Traffic Signal Control
Con(s): N/A• Higher operation/maintenance costs
than roundabout control
• Higher capital costs ($1,130,000) than
traffic signal control
• Requires substantial reconstruction
Traffic Signal Control
Con(s): N/A none• Requires additional ROW in all
four quadrants
Traffic Signal Control
Roundabout Control
Con(s): N/A• Would likely not operate in
coordination with other signals none
Traffic Signal Control
Roundabout Control
Con(s): N/A• Pedestrian signal phasing can lead to
a false sense of security
• Longer route
• No pedestrian phase
Traffic Signal Control
Roundabout Control
Con(s): N/A none none
Factor
• AWSC warrant met• Existing Year 2016 volumes
meet traffic signal control warrants N/A
Warrants
Analysis
2016
2036 • AWSC warrant met• Forecasted Year 2036 volumes
meet traffic signal control warrants N/A
2016 • Acceptable LOS • Acceptable LOS• Acceptable LOS
• Consistent off-peak operationsOperational
Analysis
2036• Unacceptable p.m. peak LOS with
Forecasted Year 2036 volumes• Acceptable LOS
• Near capacity during the p.m. peak
under forecasted conditions
Safety
Analysis
Pro(s): N/A• Signal indications show vehicle
right-of-way
• Least number of crashes expected
• Lower vehicle speeds through
intersection
Cost
Analysis
Pro(s): N/A• Lower capital costs ($300,000) than
roundabout control
• Lower operation/maintenance costs
than traffic signal control
Right-of-Way
Pro(s): N/A • No ROW impacts none
Transportation
System
Considerations
Pro(s): N/A• Provides control continuity along
Stadium Road to the west
• Provides control continuity along
Stadium Road to the east
Pedestrian and
Bicycle
Considerations
Pro(s): N/A• Pedestrian pushbuttons and
signal phasing
• Pedestrian Refuge islands
• Bike slip ramps
• Lower vehicle speeds thru intersection
Local
Acceptance
Pro(s): N/A • Familiar to drivers • Familiar to drivers
Intersection Control Evaluation
Stadium Road at Pohl Road
SRF Consulting Group, Inc.

Intersection Control Evaluation 20 SRF Consulting Group, Inc. Stadium Road at Pohl Road
Appendix
2011-2015 Crash History
Existing Year 2016 Warrants Analysis
Forecasted Year 2036 Warrants Analysis
Existing Year 2016 Detailed Operational Analysis
Forecasted Year 2036 Detailed Operational Analysis
Detailed Cost Analysis

2011-2015 Crash History

Crash Detail ReportStadium Road and Pohl Road
Report Version 1.0 March 2010
MANKATO
07/30/2011
County: City:
Severity:
Road Type:
Crash Type:
Surf Cond:
Light Cond:
Weather 1:
Weather 2: # of Vehicles:
First Event:
To Junction:
Traffic Device:
Speed Limit:
Diagram:
Reliability:
Officer:
Trav Dir:
Veh Act:
Veh Type:
Age:
Gender:
Cond:
Cont Fact 1
Cont Fact 2
Unit 1 Unit 2 Unit 3
Sys:
Route:
05-MSAS
24200140 000+00.363Crash ID: Date: Time:
Road Char:
POSSIBLE INJURY
2 LANES UNDIV 2_WAY
STRAIGHT AND LEVEL
COLL W/MV IN TRANSPORT
DRY
DARK - STREET LIGHTS ON
CLEAR
CLEAR
ON ROADWAY
4-LEGGED INTERSECTION
STOP SIGN 4-WAY
40
REAR END
CONFIDENT
2.00
112110156
BLUE EARTH
2156
EAST
STOPPED TRAFFIC
PASSENGER CAR
18
M
NORMAL
NO IMPROPER DRIVING
NO IMPROPER DRIVING
E
STRAIGHT AHEAD
PASSENGER CAR
17
M
NORMAL
DISTRACTION
FAIL TO YIELD ROW
MANKATO
08/23/2011
County: City:
Severity:
Road Type:
Crash Type:
Surf Cond:
Light Cond:
Weather 1:
Weather 2: # of Vehicles:
First Event:
To Junction:
Traffic Device:
Speed Limit:
Diagram:
Reliability:
Officer:
Trav Dir:
Veh Act:
Veh Type:
Age:
Gender:
Cond:
Cont Fact 1
Cont Fact 2
Unit 1 Unit 2 Unit 3
Sys:
Route:
04-CSAH
07000060 001+00.650Crash ID: Date: Time:
Road Char:
POSSIBLE INJURY
NOT SPECIFIED
NOT SPECIFIED
COLL W/MV IN TRANSPORT
DRY
DARK - STREET LIGHTS ON
CLOUDY
NOT SPECIFIED
NOT SPECIFIED
NOT SPECIFIED
STOP SIGN 4-WAY
40
REAR END
CONFIDENT
2.00
112410226
BLUE EARTH
0555
W
STRAIGHT AHEAD
PASSENGER CAR
45
M
NOT SPECIFIED
NOT SPECIFIED
NOT SPECIFIED
MC
00
PASSENGER CAR
20
M
NOT SPECIFIED
NOT SPECIFIED
NOT SPECIFIED
08/01/2016 Page 1 of 7MnCMAT 1.0.0

MANKATO
10/16/2012
County: City:
Severity:
Road Type:
Crash Type:
Surf Cond:
Light Cond:
Weather 1:
Weather 2: # of Vehicles:
First Event:
To Junction:
Traffic Device:
Speed Limit:
Diagram:
Reliability:
Officer:
Trav Dir:
Veh Act:
Veh Type:
Age:
Gender:
Cond:
Cont Fact 1
Cont Fact 2
Unit 1 Unit 2 Unit 3
Sys:
Route:
05-MSAS
24200140 000+00.364Crash ID: Date: Time:
Road Char:
PROPERTY DAMAGE
4_6 LANES UNDIV 2_WAY
STRAIGHT AND LEVEL
COLL W/MV IN TRANSPORT
WET
DAYLIGHT
CLOUDY
CLOUDY
ON ROADWAY
4-LEGGED INTERSECTION
STOP SIGN 4-WAY
30
REAR END
CONFIDENT
2.00
122900077
BLUE EARTH
0936
S
RIGHT TURN
PASSENGER CAR
42
M
NORMAL
IMPROPERLY PARKED
NO IMPROPER DRIVING
S
RIGHT TURN
PASSENGER CAR
50
M
NORMAL
FOLLOWING TOO CLOSELY
NO IMPROPER DRIVING
MANKATO
12/10/2012
County: City:
Severity:
Road Type:
Crash Type:
Surf Cond:
Light Cond:
Weather 1:
Weather 2: # of Vehicles:
First Event:
To Junction:
Traffic Device:
Speed Limit:
Diagram:
Reliability:
Officer:
Trav Dir:
Veh Act:
Veh Type:
Age:
Gender:
Cond:
Cont Fact 1
Cont Fact 2
Unit 1 Unit 2 Unit 3
Sys:
Route:
05-MSAS
24200140 000+00.374Crash ID: Date: Time:
Road Char:
PROPERTY DAMAGE
4_6 LANES UNDIV 2_WAY
STRAIGHT AND LEVEL
COLL W/SIGN POLE
ICE/PACKED SNOW
DAYLIGHT
CLEAR
NOT SPECIFIED
OFF ROADWAY ON SHOULDER
4-LEGGED INTERSECTION
STOP SIGN 4-WAY
30
OTHER
CONFIDENT
1.00
123450082
BLUE EARTH
0747
S
STRAIGHT AHEAD
PASSENGER CAR
46
F
NORMAL
WEATHER
SKIDDING
08/01/2016 Page 2 of 7MnCMAT 1.0.0

MANKATO
08/23/2013
County: City:
Severity:
Road Type:
Crash Type:
Surf Cond:
Light Cond:
Weather 1:
Weather 2: # of Vehicles:
First Event:
To Junction:
Traffic Device:
Speed Limit:
Diagram:
Reliability:
Officer:
Trav Dir:
Veh Act:
Veh Type:
Age:
Gender:
Cond:
Cont Fact 1
Cont Fact 2
Unit 1 Unit 2 Unit 3
Sys:
Route:
04-CSAH
07000060 001+00.650Crash ID: Date: Time:
Road Char:
POSSIBLE INJURY
NOT SPECIFIED
NOT SPECIFIED
COLL W/MV IN TRANSPORT
DRY
DAYLIGHT
CLEAR
NOT SPECIFIED
NOT SPECIFIED
NOT SPECIFIED
STOP SIGN 4-WAY
40
REAR END
CONFIDENT
2.00
132680037
BLUE EARTH
1500
EAST
STOPPED TRAFFIC
PASSENGER CAR
19
M
NOT SPECIFIED
NOT SPECIFIED
NOT SPECIFIED
E
PARKED
SPORT UNTILITY VEHICLE
18
M
NOT SPECIFIED
NOT SPECIFIED
NOT SPECIFIED
MANKATO
09/22/2013
County: City:
Severity:
Road Type:
Crash Type:
Surf Cond:
Light Cond:
Weather 1:
Weather 2: # of Vehicles:
First Event:
To Junction:
Traffic Device:
Speed Limit:
Diagram:
Reliability:
Officer:
Trav Dir:
Veh Act:
Veh Type:
Age:
Gender:
Cond:
Cont Fact 1
Cont Fact 2
Unit 1 Unit 2 Unit 3
Sys:
Route:
04-CSAH
07000060 001+00.656Crash ID: Date: Time:
Road Char:
PROPERTY DAMAGE
NOT SPECIFIED
NOT SPECIFIED
COLL W/MV IN TRANSPORT
DRY
DAYLIGHT
CLEAR
NOT SPECIFIED
NOT SPECIFIED
NOT SPECIFIED
STOP SIGN 4-WAY
REAR END
CONFIDENT
2.00
132970051
BLUE EARTH
1740
W
STRAIGHT AHEAD
MOTORCYCLE
57
M
NOT SPECIFIED
NOT SPECIFIED
NOT SPECIFIED
SE
RIGHT TURN
PASSENGER CAR
24
F
NOT SPECIFIED
NOT SPECIFIED
NOT SPECIFIED
08/01/2016 Page 3 of 7MnCMAT 1.0.0

MANKATO
11/21/2013
County: City:
Severity:
Road Type:
Crash Type:
Surf Cond:
Light Cond:
Weather 1:
Weather 2: # of Vehicles:
First Event:
To Junction:
Traffic Device:
Speed Limit:
Diagram:
Reliability:
Officer:
Trav Dir:
Veh Act:
Veh Type:
Age:
Gender:
Cond:
Cont Fact 1
Cont Fact 2
Unit 1 Unit 2 Unit 3
Sys:
Route:
04-CSAH
07000060 001+00.649Crash ID: Date: Time:
Road Char:
PROPERTY DAMAGE
NOT SPECIFIED
NOT SPECIFIED
COLL W/MV IN TRANSPORT
ICE/PACKED SNOW
DAYLIGHT
SNOW
NOT SPECIFIED
NOT SPECIFIED
NOT SPECIFIED
STOP SIGN 4-WAY
40
REAR END
CONFIDENT
2.00
133580083
BLUE EARTH
1633
EAST
STRAIGHT AHEAD
PASSENGER CAR
18
M
NOT SPECIFIED
NOT SPECIFIED
NOT SPECIFIED
E
STOPPED TRAFFIC
PASSENGER CAR
20
F
NOT SPECIFIED
NOT SPECIFIED
NOT SPECIFIED
MANKATO
04/09/2014
County: City:
Severity:
Road Type:
Crash Type:
Surf Cond:
Light Cond:
Weather 1:
Weather 2: # of Vehicles:
First Event:
To Junction:
Traffic Device:
Speed Limit:
Diagram:
Reliability:
Officer:
Trav Dir:
Veh Act:
Veh Type:
Age:
Gender:
Cond:
Cont Fact 1
Cont Fact 2
Unit 1 Unit 2 Unit 3
Sys:
Route:
04-CSAH
07000060 001+00.650Crash ID: Date: Time:
Road Char:
PROPERTY DAMAGE
2 LANES UNDIV 2_WAY
STRAIGHT AND LEVEL
COLL W/MV IN TRANSPORT
DRY
DARK - STREET LIGHTS ON
CLEAR
CLEAR
ON ROADWAY
4-LEGGED INTERSECTION
STOP SIGN 4-WAY
30
RIGHT ANGLE
CONFIDENT
2.00
140990204
BLUE EARTH
2201
W
START TRAFFIC
PICKUP TRUCK
30
M
NORMAL
NOT SPECIFIED
NOT SPECIFIED
SE
LEFT TURN
PICKUP TRUCK
20
M
UNDER THE INFLUENCE
IMPROPER LANE
FAIL TO YIELD ROW
08/01/2016 Page 4 of 7MnCMAT 1.0.0

MANKATO
03/20/2014
County: City:
Severity:
Road Type:
Crash Type:
Surf Cond:
Light Cond:
Weather 1:
Weather 2: # of Vehicles:
First Event:
To Junction:
Traffic Device:
Speed Limit:
Diagram:
Reliability:
Officer:
Trav Dir:
Veh Act:
Veh Type:
Age:
Gender:
Cond:
Cont Fact 1
Cont Fact 2
Unit 1 Unit 2 Unit 3
Sys:
Route:
05-MSAS
24200140 000+00.364Crash ID: Date: Time:
Road Char:
PROPERTY DAMAGE
NOT SPECIFIED
NOT SPECIFIED
COLL W/MV IN TRANSPORT
DRY
DAYLIGHT
CLEAR
NOT SPECIFIED
NOT SPECIFIED
NOT SPECIFIED
STOP SIGN 4-WAY
30
SIDESWIPE PASSING
CONFIDENT
2.00
141120069
BLUE EARTH
1613
S
STRAIGHT AHEAD
PASSENGER CAR
69
F
NOT SPECIFIED
NOT SPECIFIED
NOT SPECIFIED
N
LEFT TURN
PASSENGER CAR
22
M
NOT SPECIFIED
NOT SPECIFIED
NOT SPECIFIED
MANKATO
04/23/2014
County: City:
Severity:
Road Type:
Crash Type:
Surf Cond:
Light Cond:
Weather 1:
Weather 2: # of Vehicles:
First Event:
To Junction:
Traffic Device:
Speed Limit:
Diagram:
Reliability:
Officer:
Trav Dir:
Veh Act:
Veh Type:
Age:
Gender:
Cond:
Cont Fact 1
Cont Fact 2
Unit 1 Unit 2 Unit 3
Sys:
Route:
04-CSAH
07000060 001+00.650Crash ID: Date: Time:
Road Char:
PROPERTY DAMAGE
2 LANES UNDIV 2_WAY
UNKNOWN
COLL W/MV IN TRANSPORT
UNKNOWN
99
UNKNOWN
NOT SPECIFIED
ON ROADWAY
4-LEGGED INTERSECTION
STOP SIGN 4-WAY
40
REAR END
CONFIDENT
2.00
141130108
BLUE EARTH
1807
W
STOPPED TRAFFIC
PICKUP TRUCK
26
M
NORMAL
NO IMPROPER DRIVING
NOT SPECIFIED
W
SLOWING TRAFFIC
PASSENGER CAR
21
M
NORMAL
DISTRACTION
NOT SPECIFIED
08/01/2016 Page 5 of 7MnCMAT 1.0.0

MANKATO
08/25/2015
County: City:
Severity:
Road Type:
Crash Type:
Surf Cond:
Light Cond:
Weather 1:
Weather 2: # of Vehicles:
First Event:
To Junction:
Traffic Device:
Speed Limit:
Diagram:
Reliability:
Officer:
Trav Dir:
Veh Act:
Veh Type:
Age:
Gender:
Cond:
Cont Fact 1
Cont Fact 2
Unit 1 Unit 2 Unit 3
Sys:
Route:
04-CSAH
07000060 001+00.650Crash ID: Date: Time:
Road Char:
PROPERTY DAMAGE
NOT SPECIFIED
NOT SPECIFIED
COLL W/MV IN TRANSPORT
DRY
DAYLIGHT
CLEAR
NOT SPECIFIED
NOT SPECIFIED
NOT SPECIFIED
STOP SIGN 4-WAY
REAR END
CONFIDENT
2.00
152670051
BLUE EARTH
1602
MC
STOPPED TRAFFIC
SPORT UNTILITY VEHICLE
44
F
NOT SPECIFIED
NOT SPECIFIED
NOT SPECIFIED
MC
PARKED
PASSENGER CAR
49
F
NOT SPECIFIED
NOT SPECIFIED
NOT SPECIFIED
MANKATO
08/27/2015
County: City:
Severity:
Road Type:
Crash Type:
Surf Cond:
Light Cond:
Weather 1:
Weather 2: # of Vehicles:
First Event:
To Junction:
Traffic Device:
Speed Limit:
Diagram:
Reliability:
Officer:
Trav Dir:
Veh Act:
Veh Type:
Age:
Gender:
Cond:
Cont Fact 1
Cont Fact 2
Unit 1 Unit 2 Unit 3
Sys:
Route:
04-CSAH
07000060 001+00.649Crash ID: Date: Time:
Road Char:
PROPERTY DAMAGE
NOT SPECIFIED
NOT SPECIFIED
COLL W/MV IN TRANSPORT
WET
DARK - STREET LIGHTS OFF
RAIN
NOT SPECIFIED
NOT SPECIFIED
NOT SPECIFIED
STOP SIGN 4-WAY
40
REAR END
CONFIDENT
2.00
152710071
BLUE EARTH
1615
EAST
STOPPED TRAFFIC
SPORT UNTILITY VEHICLE
26
M
NOT SPECIFIED
NOT SPECIFIED
NOT SPECIFIED
E
STRAIGHT AHEAD
PASSENGER CAR
22
F
NOT SPECIFIED
NOT SPECIFIED
NOT SPECIFIED
08/01/2016 Page 6 of 7MnCMAT 1.0.0

MANKATO
10/01/2015
County: City:
Severity:
Road Type:
Crash Type:
Surf Cond:
Light Cond:
Weather 1:
Weather 2: # of Vehicles:
First Event:
To Junction:
Traffic Device:
Speed Limit:
Diagram:
Reliability:
Officer:
Trav Dir:
Veh Act:
Veh Type:
Age:
Gender:
Cond:
Cont Fact 1
Cont Fact 2
Unit 1 Unit 2 Unit 3
Sys:
Route:
04-CSAH
07000060 001+00.650Crash ID: Date: Time:
Road Char:
PROPERTY DAMAGE
4_6 LANES UNDIV 2_WAY
STRAIGHT AND LEVEL
COLL W/MV IN TRANSPORT
DRY
DAYLIGHT
CLEAR
NOT SPECIFIED
ON ROADWAY
4-LEGGED INTERSECTION
STOP SIGN 4-WAY
40
OTHER
CONFIDENT
3.00
152740192
BLUE EARTH
1820
W
STRAIGHT AHEAD
PASSENGER CAR
19
M
NORMAL
DISREGARD TRAFFIC DEVICE
OTHER VEHICLE DEFECT
N
STRAIGHT AHEAD
PASSENGER CAR
21
F
NORMAL
NO IMPROPER DRIVING
NOT SPECIFIED
S
STOPPED TRAFFIC
VAN OR MINIVAN
77
M
NORMAL
SKIDDING
NOT SPECIFIED
WORK AREA: Statewide - FILTER: CRASH_YEAR('2011','2012','2013','2014','2015'), TRAFFIC_CONTROL_DEVICE_CODE('03') - SPATIAL FILTER
APPLIED
Selection Filter:
Analyst: Notes:
Luke James
08/01/2016 Page 7 of 7MnCMAT 1.0.0

Existing Year 2016 Warrants Analysis

WARRANTS ANALYSIS Existing Year 2016
Stadium Road (CSAH 60) at Pohl Road
Intersection Control Evaluation Studies
MAPO
Location : MAPO Speed (mph) Lanes
Date: 9/28/2016 40 2 or more Major Approach 1:
Luke James 40 2 or more Major Approach 3:
Population Less than 10,000: No 30 2 or more Minor Approach 2:
Seventy Percent Factor Used: No 30 2 or more Minor Approach 4:
Major Major Total Minor Minor Largest
Hour Approach 1 Approach 3 1 + 3 600 900 Approach 2 Approach 4 Minor App. 200 100 Condition A Condition B A B 300 200
6 - 7 AM 176 154 330 71 55 71 X
7 - 8 AM 343 335 678 X 201 164 201 X X X X X X
8 - 9 AM 294 271 565 155 134 155 X X X
9 - 10 AM 218 308 526 126 106 126 X X X
10 - 11 AM 255 262 517 124 115 124 X X X
11 - 12 AM 324 319 643 X 163 146 163 X X X X
12 - 1 PM 379 354 733 X 191 156 191 X X X X X
1 - 2 PM 410 376 786 X 168 151 168 X X X X X
2 - 3 PM 400 415 815 X 189 190 190 X X X X X
3 - 4 PM 439 469 908 X X 177 186 186 X X X X X X
4 - 5 PM 515 554 1069 X X 213 215 215 X X X X X X X X
5 - 6 PM 517 630 1147 X X 194 250 250 X X X X X X X X
6 - 7 PM 415 487 902 X X 151 177 177 X X X X X X
7 - 8 PM 419 400 819 X 122 143 143 X X X X
8 - 9 PM 335 385 720 X 85 125 125 X X X X
9 - 10 PM 228 305 533 69 116 116 X X
10 - 11 PM 141 170 311 39 61 61 X
3 4 9 9
Warrant 1A: Minimum Vehicular Volume
Warrant 1B: Interruption of Continuous Traffic
Warrant 1C: Combination of Warrants
Warrant 2: Four-Hour Vehicular Volume
Warrant 3B: Peak Hour
MWSA (C): Multiway Stop Applications Condition C
Met/Not Met
Warrant Met Met Same Hours
3 8 Not Met
Hours Met Hours Required
MWSA (C)
14 8
Bac
kgro
un
d
Info
rmat
ion Approach
Eastbound Stadium Road (CSAH 60)
Westbound Stadium Road (CSAH 60)
Northbound Pohl Road
Southbound Pohl Road
Analysis Prepared By:
War
ran
ts A
nal
ysis
: W
arra
nts
1A
, 1B
an
d 1
C
Warrant Met Combination
0 1 Not Met
14
Met - Multiway Stop Applications
4War
ran
t
Su
mm
ary
Warrant and Description
2
Not Met
9 8 Met - Warrant 1C Satisfied
4 8
Not Met

WARRANTS ANALYSIS Existing Year 2016
Stadium Road (CSAH 60) at Pohl Road
Intersection Control Evaluation Studies
MAPO
Number of Hours Satisfying Requirements:
Notes: 1. 115 VPH APPLIES AS THE LOWER THRESHOLD VOLUME FOR A MINOR STREET APPROACH WITH TWO OR MORE LANES AND 80 VPH APPLIES AS
THE LOWER THRESHOLD VOLUME FOR A MINOR STREET APPROACHING WITH ONE LANE.
War
ran
ts A
nal
ysis
: W
arra
nt
2
2
0
100
200
300
400
500
600
700
800
900
1000
1100
100 200 300 400 500 600 700 800 900 1000 1100 1200 1300 1400 1500 1600 1700 1800 1900 2000
MIN
OR
ST
RE
ET
HIG
H V
OLU
ME
A
PP
RO
AC
H -
-V
PH
MAJOR STREET -- TOTAL OF BOTH APPROACHES -- VPH
WARRANT 2 - FOUR-HOUR VEHICULAR VOLUME

WARRANTS ANALYSIS Existing Year 2016
Stadium Road (CSAH 60) at Pohl Road
Intersection Control Evaluation Studies
MAPO
Number of Hours Satisfying Requirements:
Notes: 1. 150 VPH APPLIES AS THE LOWER THRESHOLD VOLUME FOR A MINOR STREET APPROACH WITH TWO OR MORE LANES AND 100 VPH APPLIES AS
THE LOWER THRESHOLD VOLUME FOR A MINOR STREET APPROACHING WITH ONE LANE.
0
War
ran
ts A
nal
ysis
: W
arra
nt
3
0
100
200
300
400
500
600
700
800
900
1000
1100
100 200 300 400 500 600 700 800 900 1000 1100 1200 1300 1400 1500 1600 1700 1800 1900 2000
MIN
OR
ST
RE
ET
HIG
H V
OLU
ME
A
PP
RO
AC
H -
-V
PH
MAJOR STREET -- TOTAL OF BOTH APPROACHES -- VPH
WARRANT 3 - PEAK HOUR

Forecasted Year 2036 Warrants Analysis

WARRANTS ANALYSIS Forecasted Year 2036
Stadium Road (CSAH 60) at Pohl Road
Intersection Control Evaluation Studies
MAPO
Location : MAPO Speed (mph) Lanes
Date: 9/28/2016 40 2 or more Major Approach 1:
Luke James 40 2 or more Major Approach 3:
Population Less than 10,000: No 30 2 or more Minor Approach 2:
Seventy Percent Factor Used: No 30 2 or more Minor Approach 4:
Major Major Total Minor Minor Largest
Hour Approach 1 Approach 3 1 + 3 600 900 Approach 2 Approach 4 Minor App. 200 100 Condition A Condition B A B 300 200
6 - 7 AM 211 194 405 107 73 107 X X
7 - 8 AM 412 422 834 X 302 216 302 X X X X X X X
8 - 9 AM 353 341 694 X 233 177 233 X X X X X X
9 - 10 AM 262 388 650 X 189 140 189 X X X X
10 - 11 AM 306 330 636 X 186 152 186 X X X X
11 - 12 AM 389 402 791 X 245 193 245 X X X X X X X
12 - 1 PM 455 446 901 X X 287 206 287 X X X X X X X X
1 - 2 PM 492 474 966 X X 252 199 252 X X X X X X X X
2 - 3 PM 480 523 1003 X X 284 251 284 X X X X X X X X
3 - 4 PM 527 591 1118 X X 266 246 266 X X X X X X X X
4 - 5 PM 618 698 1316 X X 320 284 320 X X X X X X X X
5 - 6 PM 620 794 1414 X X 291 330 330 X X X X X X X X
6 - 7 PM 498 614 1112 X X 227 234 234 X X X X X X X X
7 - 8 PM 503 504 1007 X X 183 189 189 X X X X X X
8 - 9 PM 402 485 887 X 128 165 165 X X X X X
9 - 10 PM 274 384 658 X 104 153 153 X X X
10 - 11 PM 169 214 383 59 81 81 X
10 8 14 11
Warrant 1A: Minimum Vehicular Volume
Warrant 1B: Interruption of Continuous Traffic
Warrant 1C: Combination of Warrants
Warrant 2: Four-Hour Vehicular Volume
Warrant 3B: Peak Hour
MWSA (C): Multiway Stop Applications Condition C
2
War
ran
t
Su
mm
ary
Warrant and Description Hours Met
1 Met - Warrant 3B Satisfied
15 8 Met - Multiway Stop Applications
Met - Warrant 1B Satisfied
11 8 Met - Warrant 1C Satisfied
9 4 Met - Warrant 2 Satisfied
8 8
Hours Required Met/Not Met
10 8 Met - Warrant 1A Satisfied
MWSA (C)
15
Bac
kgro
un
d
Info
rmat
ion Approach
Eastbound Stadium Road (CSAH 60)
Analysis Prepared By: Westbound Stadium Road (CSAH 60)
Northbound Pohl Road
Southbound Pohl Road
War
ran
ts A
nal
ysis
: W
arra
nts
1A
, 1B
an
d 1
C
Warrant Met Warrant Met Met Same Hours Combination

WARRANTS ANALYSIS Forecasted Year 2036
Stadium Road (CSAH 60) at Pohl Road
Intersection Control Evaluation Studies
MAPO
Number of Hours Satisfying Requirements:
Notes: 1. 115 VPH APPLIES AS THE LOWER THRESHOLD VOLUME FOR A MINOR STREET APPROACH WITH TWO OR MORE LANES AND 80 VPH APPLIES AS
THE LOWER THRESHOLD VOLUME FOR A MINOR STREET APPROACHING WITH ONE LANE.
War
ran
ts A
nal
ysis
: W
arra
nt
2
9
0
100
200
300
400
500
600
700
800
900
1000
1100
100 200 300 400 500 600 700 800 900 1000 1100 1200 1300 1400 1500 1600 1700 1800 1900 2000
MIN
OR
ST
RE
ET
HIG
H V
OLU
ME
A
PP
RO
AC
H -
-V
PH
MAJOR STREET -- TOTAL OF BOTH APPROACHES -- VPH
WARRANT 2 - FOUR-HOUR VEHICULAR VOLUME

WARRANTS ANALYSIS Forecasted Year 2036
Stadium Road (CSAH 60) at Pohl Road
Intersection Control Evaluation Studies
MAPO
Number of Hours Satisfying Requirements:
Notes: 1. 150 VPH APPLIES AS THE LOWER THRESHOLD VOLUME FOR A MINOR STREET APPROACH WITH TWO OR MORE LANES AND 100 VPH APPLIES AS
THE LOWER THRESHOLD VOLUME FOR A MINOR STREET APPROACHING WITH ONE LANE.
War
ran
ts A
nal
ysis
: W
arra
nt
3
2
0
100
200
300
400
500
600
700
800
900
1000
1100
100 200 300 400 500 600 700 800 900 1000 1100 1200 1300 1400 1500 1600 1700 1800 1900 2000
MIN
OR
ST
RE
ET
HIG
H V
OLU
ME
A
PP
RO
AC
H -
-V
PH
MAJOR STREET -- TOTAL OF BOTH APPROACHES -- VPH
WARRANT 3 - PEAK HOUR

Existing Year 2016 Detailed Operational Analysis
All-Way Stop Control

SimTraffic Report 09/28/2016
2016 AWSC (Existing) - A.M. Peak Average of 10 Runs
Intersection Control Evaluation SRF Consulting Group, Inc.
MAPO Page 1
3: Pohl Road & Stadium Road Performance by approach
Approach EB WB NB SB All
Denied Delay (hr) 0.1 0.1 0.1 0.1 0.3
Denied Del/Veh (s) 0.8 1.1 0.9 1.2 1.0
Total Delay (hr) 1.4 1.0 0.5 0.3 3.2
Total Del/Veh (s) 13.3 10.0 7.2 6.9 10.0
Stop Delay (hr) 0.7 0.4 0.3 0.2 1.7
Stop Del/Veh (s) 6.9 4.5 4.9 4.5 5.4
Total Stops 382 357 236 172 1147
Stop/Veh 0.99 1.00 0.99 1.00 0.99

SimTraffic Report 09/28/2016
2016 AWSC (Existing) - A.M. Peak Average of 10 Runs
Intersection Control Evaluation SRF Consulting Group, Inc.
MAPO Page 2
Intersection: 3: Pohl Road & Stadium Road
Movement EB EB WB WB NB NB SB SB
Directions Served L TR L TR L TR L TR
Maximum Queue (ft) 54 187 55 116 50 90 58 76
Average Queue (ft) 24 76 31 58 25 50 27 40
95th Queue (ft) 49 134 50 95 51 80 51 62
Link Distance (ft) 966 966 966 966
Upstream Blk Time (%)
Queuing Penalty (veh)
Storage Bay Dist (ft) 160 250 100 120
Storage Blk Time (%) 1 0 0
Queuing Penalty (veh) 0 0 0

SimTraffic Report 09/28/2016
2016 AWSC (Existing) - P.M. Peak Average of 10 Runs
Intersection Control Evaluation SRF Consulting Group, Inc.
MAPO Page 1
3: Pohl Road & Stadium Road Performance by approach
Approach EB WB NB SB All
Denied Delay (hr) 0.2 0.3 0.0 0.0 0.5
Denied Del/Veh (s) 1.2 1.4 0.8 0.6 1.1
Total Delay (hr) 2.8 3.9 0.5 0.6 7.9
Total Del/Veh (s) 18.2 21.4 8.9 9.5 17.0
Stop Delay (hr) 1.8 2.7 0.4 0.5 5.4
Stop Del/Veh (s) 11.6 14.9 6.7 7.3 11.7
Total Stops 555 650 206 238 1649
Stop/Veh 0.99 0.99 0.99 0.99 0.99

SimTraffic Report 09/28/2016
2016 AWSC (Existing) - P.M. Peak Average of 10 Runs
Intersection Control Evaluation SRF Consulting Group, Inc.
MAPO Page 2
Intersection: 3: Pohl Road & Stadium Road
Movement EB EB WB WB NB NB SB SB
Directions Served L TR L TR L TR L TR
Maximum Queue (ft) 168 260 188 311 62 106 46 124
Average Queue (ft) 46 114 50 141 24 52 17 61
95th Queue (ft) 107 208 116 259 53 86 45 99
Link Distance (ft) 966 966 966 966
Upstream Blk Time (%)
Queuing Penalty (veh)
Storage Bay Dist (ft) 160 250 100 120
Storage Blk Time (%) 5 3 0 0
Queuing Penalty (veh) 6 5 0 0

Existing Year 2016 Detailed Operational Analysis
Traffic Signal Control

SimTraffic Report 09/29/2016
2016 Signal - A.M. Peak Average of 10 Runs
Intersection Control Evaluation SRF Consulting Group, Inc.
MAPO Page 1
3: Pohl Road & Stadium Road Performance by approach
Approach EB WB NB SB All
Denied Delay (hr) 0.1 0.1 0.1 0.1 0.3
Denied Del/Veh (s) 0.8 1.1 0.8 1.1 0.9
Total Delay (hr) 1.1 1.1 0.6 0.5 3.3
Total Del/Veh (s) 10.4 10.4 9.8 10.6 10.3
Stop Delay (hr) 0.6 0.7 0.5 0.4 2.2
Stop Del/Veh (s) 5.8 6.6 7.6 8.5 6.8
Total Stops 178 183 154 117 632
Stop/Veh 0.47 0.50 0.66 0.66 0.55

SimTraffic Report 09/29/2016
2016 Signal - A.M. Peak Average of 10 Runs
Intersection Control Evaluation SRF Consulting Group, Inc.
MAPO Page 2
Intersection: 3: Pohl Road & Stadium Road
Movement EB EB WB WB NB NB SB SB
Directions Served L TR L TR L TR L TR
Maximum Queue (ft) 64 172 93 141 66 118 77 98
Average Queue (ft) 24 73 38 63 25 55 30 43
95th Queue (ft) 57 134 75 116 56 95 64 81
Link Distance (ft) 966 966 966 966
Upstream Blk Time (%)
Queuing Penalty (veh)
Storage Bay Dist (ft) 160 250 100 120
Storage Blk Time (%) 0 0 1 0 0
Queuing Penalty (veh) 0 0 0 0 0

SimTraffic Report 09/29/2016
2016 Signal - P.M. Peak Average of 10 Runs
Intersection Control Evaluation SRF Consulting Group, Inc.
MAPO Page 1
3: Pohl Road & Stadium Road Performance by approach
Approach EB WB NB SB All
Denied Delay (hr) 0.2 0.3 0.0 0.0 0.5
Denied Del/Veh (s) 1.2 1.4 0.8 0.6 1.2
Total Delay (hr) 3.0 3.2 0.9 1.1 8.3
Total Del/Veh (s) 19.0 17.5 15.7 16.1 17.6
Stop Delay (hr) 1.9 2.0 0.8 0.9 5.7
Stop Del/Veh (s) 12.2 10.9 13.3 13.4 12.0
Total Stops 370 413 156 184 1123
Stop/Veh 0.65 0.62 0.73 0.75 0.66

SimTraffic Report 09/29/2016
2016 Signal - P.M. Peak Average of 10 Runs
Intersection Control Evaluation SRF Consulting Group, Inc.
MAPO Page 2
Intersection: 3: Pohl Road & Stadium Road
Movement EB EB WB WB NB NB SB SB
Directions Served L TR L TR L TR L TR
Maximum Queue (ft) 234 342 158 308 66 146 84 175
Average Queue (ft) 64 151 65 147 25 67 20 79
95th Queue (ft) 146 279 125 257 59 117 59 137
Link Distance (ft) 966 966 966 966
Upstream Blk Time (%)
Queuing Penalty (veh)
Storage Bay Dist (ft) 160 250 100 120
Storage Blk Time (%) 0 7 1 3 2
Queuing Penalty (veh) 0 8 2 1 1

Existing Year 2016 Detailed Operational Analysis
Roundabout Control (HCS)
ROUNDABOUT REPORT
General Information Site Information
Analyst Luke James
Agency or Co. SRF Consulting Group, Inc.
Date Performed 8/5/2016
Time Period A.M. Peak
Peak Hour Factor 1.00
Intersection Stadium Road at Pohl Road
E/W Street Name Stadium Road
N/S Street Name Pohl Road
Analysis Year 2016
Project ID 9243
Project Description:
Volume Adjustment and Site Characteristics
EB WB NB SB
L T R U L T R U L T R U L T R U
Number of Lanes (N) 0 1 0 0 1 0 0 1 0 0 1 0
Lane Assignment LTR LTR LTR LTR
Right-Turn Bypass None None None None
Conflicting Lanes 1 1 1 1
Volume (V), veh/h 40 350 30 0 75 240 45 0 40 70 125 0 45 60 60 0
Heavy Veh. Adj. (fHV
), % 2 2 2 2 2 2 2 2 2 2 2 2 2 2 2 2
Pedestrians Crossing 0 0 0 0
Critical and Follow-Up Headway Adjustment
EB WB NB SB
Left Right Bypass Left Right Bypass Left Right Bypass Left Right Bypass
Critical Headway (sec) 5.1929 5.1929 5.1929 5.1929 5.1929 5.1929 5.1929 5.1929 5.1929 5.1929 5.1929 5.1929
Follow-Up Headway (sec) 3.1858 3.1858 3.1858 3.1858 3.1858 3.1858 3.1858 3.1858
Flow Computations
EB WB NB SB
Left Right Bypass Left Right Bypass Left Right Bypass Left Right Bypass
Circulating Flow (Vc), pc/h 183 153 444 362
Exiting Flow (Vex
), pc/h 530 347 158 168
Entry Flow (Ve), pc/h 428 367 240 168
Entry Volume veh/h 420 360 235 165
Capacity and v/c Ratios
EB WB NB SB
Left Right Bypass Left Right Bypass Left Right Bypass Left Right Bypass
Capacity (cPCE), pc/h 940 970 725 787
Capacity (c), veh/h 922 951 711 771
v/c Ratio (X) 0.46 0.38 0.33 0.21
Delay and Level of Service
EB WB NB SB
Left Right Bypass Left Right Bypass Left Right Bypass Left Right Bypass
Lane Control Delay (d), s/veh 9.4 8.0 9.2 7.0
Lane LOS A A A A
Lane 95% Queue 2.4 1.8 1.4 0.8
Approach Delay, s/veh 9.40 7.96 9.20 7.00
Approach LOS, s/veh A A A A
Intersection Delay, s/veh 8.59
Intersection LOS A
Copyright © 2015 University of Florida, All Rights Reserved HCS 2010TM 6.70 Roundabouts Generated: 8/5/2016 2:50 PM

ROUNDABOUT REPORT
General Information Site Information
Analyst Luke James
Agency or Co. SRF Consulting Group, Inc.
Date Performed 8/5/2016
Time Period P.M. Peak
Peak Hour Factor 1.00
Intersection Stadium Road at Pohl Road
E/W Street Name Stadium Road
N/S Street Name Pohl Road
Analysis Year 2016
Project ID 9243
Project Description:
Volume Adjustment and Site Characteristics
EB WB NB SB
L T R U L T R U L T R U L T R U
Number of Lanes (N) 0 1 0 0 1 0 0 1 0 0 1 0
Lane Assignment LTR LTR LTR LTR
Right-Turn Bypass None None None None
Conflicting Lanes 1 1 1 1
Volume (V), veh/h 120 395 45 0 160 435 45 0 35 60 110 0 25 75 140 0
Heavy Veh. Adj. (fHV
), % 2 2 2 2 2 2 2 2 2 2 2 2 2 2 2 2
Pedestrians Crossing 0 0 0 0
Critical and Follow-Up Headway Adjustment
EB WB NB SB
Left Right Bypass Left Right Bypass Left Right Bypass Left Right Bypass
Critical Headway (sec) 5.1929 5.1929 5.1929 5.1929 5.1929 5.1929 5.1929 5.1929 5.1929 5.1929 5.1929 5.1929
Follow-Up Headway (sec) 3.1858 3.1858 3.1858 3.1858 3.1858 3.1858 3.1858 3.1858
Flow Computations
EB WB NB SB
Left Right Bypass Left Right Bypass Left Right Bypass Left Right Bypass
Circulating Flow (Vc), pc/h 265 219 551 643
Exiting Flow (Vex
), pc/h 541 622 230 286
Entry Flow (Ve), pc/h 571 653 209 245
Entry Volume veh/h 560 640 205 240
Capacity and v/c Ratios
EB WB NB SB
Left Right Bypass Left Right Bypass Left Right Bypass Left Right Bypass
Capacity (cPCE), pc/h 867 907 651 594
Capacity (c), veh/h 850 890 639 583
v/c Ratio (X) 0.66 0.72 0.32 0.41
Delay and Level of Service
EB WB NB SB
Left Right Bypass Left Right Bypass Left Right Bypass Left Right Bypass
Lane Control Delay (d), s/veh 15.3 17.3 9.9 12.5
Lane LOS C C A B
Lane 95% Queue 5.1 6.4 1.4 2.0
Approach Delay, s/veh 15.30 17.27 9.87 12.49
Approach LOS, s/veh C C A B
Intersection Delay, s/veh 14.98
Intersection LOS B
Copyright © 2015 University of Florida, All Rights Reserved HCS 2010TM 6.70 Roundabouts Generated: 8/5/2016 2:53 PM

Existing Year 2016 Detailed Operational Analysis
Roundabout Control (RODEL)


Forecasted Year 2036 Detailed Operational Analysis
All-Way Stop Control

SimTraffic Report 09/28/2016
2036 AWSC (No Build) - A.M. Peak Average of 10 Runs
Intersection Control Evaluation SRF Consulting Group, Inc.
MAPO Page 1
3: Pohl Road & Stadium Road Performance by approach
Approach EB WB NB SB All
Denied Delay (hr) 0.1 0.1 0.1 0.1 0.4
Denied Del/Veh (s) 0.9 1.2 0.9 1.1 1.0
Total Delay (hr) 4.1 1.8 1.2 0.6 7.7
Total Del/Veh (s) 32.1 14.5 12.0 9.0 18.5
Stop Delay (hr) 3.3 1.1 1.0 0.4 5.8
Stop Del/Veh (s) 26.1 8.6 9.6 6.5 13.9
Total Stops 458 450 354 222 1484
Stop/Veh 1.00 0.99 0.99 1.00 1.00

SimTraffic Report 09/28/2016
2036 AWSC (No Build) - A.M. Peak Average of 10 Runs
Intersection Control Evaluation SRF Consulting Group, Inc.
MAPO Page 2
Intersection: 3: Pohl Road & Stadium Road
Movement EB EB WB WB NB NB SB SB
Directions Served L TR L TR L TR L TR
Maximum Queue (ft) 200 424 67 200 105 185 68 97
Average Queue (ft) 49 150 35 83 33 77 31 50
95th Queue (ft) 165 360 55 153 67 137 57 81
Link Distance (ft) 966 966 966 966
Upstream Blk Time (%)
Queuing Penalty (veh)
Storage Bay Dist (ft) 160 250 100 120
Storage Blk Time (%) 18 0 0 5 0
Queuing Penalty (veh) 10 0 0 3 0
SimTraffic Report 09/28/2016
2036 AWSC (No Build) - P.M. Peak Average of 10 Runs
Intersection Control Evaluation SRF Consulting Group, Inc.
MAPO Page 1
3: Pohl Road & Stadium Road Performance by approach
Approach EB WB NB SB All
Denied Delay (hr) 12.5 57.8 0.1 0.1 70.4
Denied Del/Veh (s) 67.9 261.5 0.9 0.6 121.7
Total Delay (hr) 28.7 36.5 1.1 1.4 67.7
Total Del/Veh (s) 156.7 188.3 12.7 15.8 122.5
Stop Delay (hr) 29.6 38.3 0.9 1.2 70.0
Stop Del/Veh (s) 161.6 197.5 10.3 13.5 126.6
Total Stops 471 284 308 316 1379
Stop/Veh 0.71 0.41 0.99 0.99 0.69

SimTraffic Report 09/28/2016
2036 AWSC (No Build) - P.M. Peak Average of 10 Runs
Intersection Control Evaluation SRF Consulting Group, Inc.
MAPO Page 2
Intersection: 3: Pohl Road & Stadium Road
Movement EB EB WB WB NB NB SB SB
Directions Served L TR L TR L TR L TR
Maximum Queue (ft) 260 983 350 1025 72 162 56 174
Average Queue (ft) 236 769 343 961 31 73 22 87
95th Queue (ft) 348 1227 416 1138 60 124 51 149
Link Distance (ft) 966 966 966 966
Upstream Blk Time (%) 45 85
Queuing Penalty (veh) 0 0
Storage Bay Dist (ft) 160 250 100 120
Storage Blk Time (%) 0 93 100 0 4 5
Queuing Penalty (veh) 0 130 199 0 2 2

Forecasted Year 2036 Detailed Operational Analysis
Traffic Signal Control

SimTraffic Report 09/29/2016
2036 Signal - A.M. Peak Average of 10 Runs
Intersection Control Evaluation SRF Consulting Group, Inc.
MAPO Page 1
3: Pohl Road & Stadium Road Performance by approach
Approach EB WB NB SB All
Denied Delay (hr) 0.1 0.2 0.1 0.1 0.4
Denied Del/Veh (s) 0.8 1.2 0.9 1.1 1.0
Total Delay (hr) 1.8 1.9 1.2 0.8 5.7
Total Del/Veh (s) 14.2 14.9 12.0 12.3 13.6
Stop Delay (hr) 1.1 1.3 0.9 0.6 3.9
Stop Del/Veh (s) 8.5 10.1 9.1 10.0 9.4
Total Stops 238 264 236 150 888
Stop/Veh 0.53 0.57 0.65 0.66 0.59

SimTraffic Report 09/29/2016
2036 Signal - A.M. Peak Average of 10 Runs
Intersection Control Evaluation SRF Consulting Group, Inc.
MAPO Page 2
Intersection: 3: Pohl Road & Stadium Road
Movement EB EB WB WB NB NB SB SB
Directions Served L TR L TR L TR L TR
Maximum Queue (ft) 103 218 135 204 75 196 76 112
Average Queue (ft) 32 103 56 89 32 84 36 52
95th Queue (ft) 73 178 109 161 67 151 68 97
Link Distance (ft) 966 966 966 966
Upstream Blk Time (%)
Queuing Penalty (veh)
Storage Bay Dist (ft) 160 250 100 120
Storage Blk Time (%) 0 1 0 0 4 0
Queuing Penalty (veh) 0 1 0 0 3 0

SimTraffic Report 09/29/2016
2036 Signal - P.M. Peak Average of 10 Runs
Intersection Control Evaluation SRF Consulting Group, Inc.
MAPO Page 1
3: Pohl Road & Stadium Road Performance by approach
Approach EB WB NB SB All
Denied Delay (hr) 0.2 0.3 0.1 0.1 0.7
Denied Del/Veh (s) 1.4 1.6 0.9 0.7 1.3
Total Delay (hr) 5.9 7.2 1.7 1.7 16.5
Total Del/Veh (s) 31.7 31.8 19.3 19.4 28.1
Stop Delay (hr) 4.1 4.9 1.4 1.4 11.9
Stop Del/Veh (s) 21.9 21.7 16.2 16.3 20.2
Total Stops 551 667 228 224 1670
Stop/Veh 0.82 0.82 0.72 0.72 0.79

SimTraffic Report 09/29/2016
2036 Signal - P.M. Peak Average of 10 Runs
Intersection Control Evaluation SRF Consulting Group, Inc.
MAPO Page 2
Intersection: 3: Pohl Road & Stadium Road
Movement EB EB WB WB NB NB SB SB
Directions Served L TR L TR L TR L TR
Maximum Queue (ft) 260 478 334 470 91 204 80 207
Average Queue (ft) 89 235 116 256 38 98 28 103
95th Queue (ft) 207 460 260 437 75 171 66 175
Link Distance (ft) 966 966 966 966
Upstream Blk Time (%) 0
Queuing Penalty (veh) 0
Storage Bay Dist (ft) 160 250 100 120
Storage Blk Time (%) 0 20 0 11 0 8 0 7
Queuing Penalty (veh) 0 28 1 23 0 5 0 2
Forecasted Year 2036 Detailed Operational Analysis
Roundabout Control (HCS)

ROUNDABOUT REPORT
General Information Site Information
Analyst Luke James
Agency or Co. SRF Consulting Group, Inc.
Date Performed 8/5/2016
Time Period A.M. Peak
Peak Hour Factor 1.00
Intersection Stadium Road at Pohl Road
E/W Street Name Stadium Road
N/S Street Name Pohl Road
Analysis Year 2036
Project ID 9243
Project Description:
Volume Adjustment and Site Characteristics
EB WB NB SB
L T R U L T R U L T R U L T R U
Number of Lanes (N) 0 1 0 0 1 0 0 1 0 0 1 0
Lane Assignment LTR LTR LTR LTR
Right-Turn Bypass None None None None
Conflicting Lanes 1 1 1 1
Volume (V), veh/h 50 370 35 0 95 300 55 0 60 105 190 0 60 80 80 0
Heavy Veh. Adj. (fHV
), % 2 2 2 2 2 2 2 2 2 2 2 2 2 2 2 2
Pedestrians Crossing 0 0 0 0
Critical and Follow-Up Headway Adjustment
EB WB NB SB
Left Right Bypass Left Right Bypass Left Right Bypass Left Right Bypass
Critical Headway (sec) 5.1929 5.1929 5.1929 5.1929 5.1929 5.1929 5.1929 5.1929 5.1929 5.1929 5.1929 5.1929
Follow-Up Headway (sec) 3.1858 3.1858 3.1858 3.1858 3.1858 3.1858 3.1858 3.1858
Flow Computations
EB WB NB SB
Left Right Bypass Left Right Bypass Left Right Bypass Left Right Bypass
Circulating Flow (Vc), pc/h 240 219 489 464
Exiting Flow (Vex
), pc/h 632 449 214 214
Entry Flow (Ve), pc/h 464 459 362 224
Entry Volume veh/h 455 450 355 220
Capacity and v/c Ratios
EB WB NB SB
Left Right Bypass Left Right Bypass Left Right Bypass Left Right Bypass
Capacity (cPCE), pc/h 889 907 693 710
Capacity (c), veh/h 872 890 679 697
v/c Ratio (X) 0.52 0.51 0.52 0.32
Delay and Level of Service
EB WB NB SB
Left Right Bypass Left Right Bypass Left Right Bypass Left Right Bypass
Lane Control Delay (d), s/veh 11.1 10.6 13.6 9.1
Lane LOS B B B A
Lane 95% Queue 3.1 2.9 3.1 1.3
Approach Delay, s/veh 11.15 10.64 13.57 9.10
Approach LOS, s/veh B B B A
Intersection Delay, s/veh 11.27
Intersection LOS B
Copyright © 2015 University of Florida, All Rights Reserved HCS 2010TM 6.70 Roundabouts Generated: 8/5/2016 2:54 PM

ROUNDABOUT REPORT
General Information Site Information
Analyst Luke James
Agency or Co. SRF Consulting Group, Inc.
Date Performed 8/5/2016
Time Period P.M. Peak
Peak Hour Factor 1.00
Intersection Stadium Road at Pohl Road
E/W Street Name Stadium Road
N/S Street Name Pohl Road
Analysis Year 2036
Project ID 9243
Project Description:
Volume Adjustment and Site Characteristics
EB WB NB SB
L T R U L T R U L T R U L T R U
Number of Lanes (N) 0 1 0 0 1 0 0 1 0 0 1 0
Lane Assignment LTR LTR LTR LTR
Right-Turn Bypass None None None None
Conflicting Lanes 1 1 1 1
Volume (V), veh/h 140 475 50 0 200 545 55 0 55 90 165 0 35 100 185 0
Heavy Veh. Adj. (fHV
), % 2 2 2 2 2 2 2 2 2 2 2 2 2 2 2 2
Pedestrians Crossing 0 0 0 0
Critical and Follow-Up Headway Adjustment
EB WB NB SB
Left Right Bypass Left Right Bypass Left Right Bypass Left Right Bypass
Critical Headway (sec) 5.1929 5.1929 5.1929 5.1929 5.1929 5.1929 5.1929 5.1929 5.1929 5.1929 5.1929 5.1929
Follow-Up Headway (sec) 3.1858 3.1858 3.1858 3.1858 3.1858 3.1858 3.1858 3.1858
Flow Computations
EB WB NB SB
Left Right Bypass Left Right Bypass Left Right Bypass Left Right Bypass
Circulating Flow (Vc), pc/h 342 291 663 816
Exiting Flow (Vex
), pc/h 689 801 291 357
Entry Flow (Ve), pc/h 678 816 316 326
Entry Volume veh/h 665 800 310 320
Capacity and v/c Ratios
EB WB NB SB
Left Right Bypass Left Right Bypass Left Right Bypass Left Right Bypass
Capacity (cPCE), pc/h 803 845 582 500
Capacity (c), veh/h 787 828 571 490
v/c Ratio (X) 0.84 0.97 0.54 0.65
Delay and Level of Service
EB WB NB SB
Left Right Bypass Left Right Bypass Left Right Bypass Left Right Bypass
Lane Control Delay (d), s/veh 28.2 45.7 16.2 23.4
Lane LOS D E C C
Lane 95% Queue 9.9 15.7 3.2 4.6
Approach Delay, s/veh 28.25 45.71 16.24 23.35
Approach LOS, s/veh D E C C
Intersection Delay, s/veh 32.39
Intersection LOS D
Copyright © 2015 University of Florida, All Rights Reserved HCS 2010TM 6.70 Roundabouts Generated: 8/5/2016 2:56 PM

Forecasted Year 2036 Detailed Operational Analysis
Roundabout Control (RODEL)


Detailed Cost Analysis

SRF Comm No 9243H:\Projects\09000\9243\HI-MU\EXCEL\Estimate\9243ConceptCostEst_SpecYr_2016.xlsx
PRINTED: 10/6/2016 8:11 AM
Concept Cost Estimate (based upon 2016 bid price information)
Prepared By: SRF Consulting Group, Inc., Date 10/2016
UNIT EST. EST.ITEM DESCRIPTION PRICE QUANTITY AMOUNT
PAVING AND GRADING COSTSGrP 1 Excavation - common & subgrade cu. yd. $7.00 4,900 $34,300GrP 2 Granular Subgrade (CV) cu. yd. $14.00 2,900 $40,600GrP 3 County Road Pavement (1) sq. yd. $32.00 5,870 $187,840GrP 4 Concrete Median (1) sq. yd. $40.00 600 $24,000GrP 5 Walk / Trail (1) sq. yd. $25.00 1,820 $45,500GrP 6 ADA Pedestrian Curb Ramp each $800.00 20 $16,000GrP 7 Concrete Curb and Gutter lin. ft. $12.00 4,120 $49,440GrP 8 Removals - Pavement sq. yd. $2.50 8,380 $20,950
SUBTOTAL PAVING AND GRADING COSTS: $418,630
DRAINAGE, UTILITIES AND EROSION CONTROLDr 1 Local Utilities - Sanitary Sewers lin. ft.Dr 2 Local Utilities - Watermains lin. ft.Dr 3 Water Quality Ponds l.s.Dr 5 Drainage - urban (10-30%) 30% $126,000Dr 6 Turf Establishment & Erosion Control 10% $42,000Dr 7 Landscaping
SUBTOTAL DRAINAGE, UTILITIES AND EROSION CONTROL $168,000
SIGNAL AND LIGHTING COSTSSGL 1 Signals (permanent) each $200,000SGL 2 At Grade Intersection Lighting (permanent - non signalized)each $10,000 12 $120,000
SUBTOTAL SIGNAL AND LIGHTING COSTS: $120,000
SIGNING & STRIPING COSTSSGN 1 Mainline Signing (C&D) mile $20,000 0.3 $6,000SGN 2 Mainline Striping mile $10,000 0.3 $3,000
SUBTOTAL SIGNING & STRIPING COSTS: $9,000
SUBTOTAL CONSTRUCTION COSTS: $715,630
MISCELLANEOUS COSTSM 1 Mobilization 6% $43,000M 2 Non Quantified Minor Items (10% to 30%) 20% $143,000M 3 Temporary Pavement & Drainage 2% $14,000M 4 Traffic Control 4% $29,000
SUBTOTAL MISCELLANEOUS COSTS: $229,000
ESTIMATED TOTAL CONSTRUCTION COSTS without Contingency: $944,630
1 Contingency or "risk" (10% to 30%) 20% $189,000
ESTIMATED TOTAL CONSTRUCTION COSTS PLUS CONTINGENCY: $1,133,630
OTHER PROJECT COSTS:
R/W ACQUISITIONS Lump Sum
DESIGN ENG. & CONSTRUCTION ADMIN. Lump Sum
SUBTOTAL OTHER PROJECT COSTS
TOTAL PROJECT COST (based upon 2016 bid price information) $1,133,630
INFLATION COST (CURRENT YR. TO YR. OF OPENING)Years 3%
TOTAL PROJECT COST (OPENING YEAR DOLLARS) $1,133,630
NOTE: (1) Includes aggregate base class 5.
MAJOR ITEMS NOT INCLUDED: - Local utilities (sanitary sewer or watermain) - Water quality ponds or other BMPs - R/W acquisitions - Engineering design fees - Inflation
Stadium Road at Pohl Road
UNIT