Embed Size (px)
Citation preview
Intracoronary injection of mononuclear bone marrow cells after acute myocardial infarction
Lessons from the ASTAMI trial
Ketil Lunde, Rikshospitalet University Hospital, Oslo, Norway
The 4th Symposium on Stem Cell Therapy and Cardiovascular Biology, Madrid, 26thApril 2007
Presenter disclosure information :
No conflicts of interest

Nature 2001;410:701-705
Circulation 2002;106:1913-1918
Background
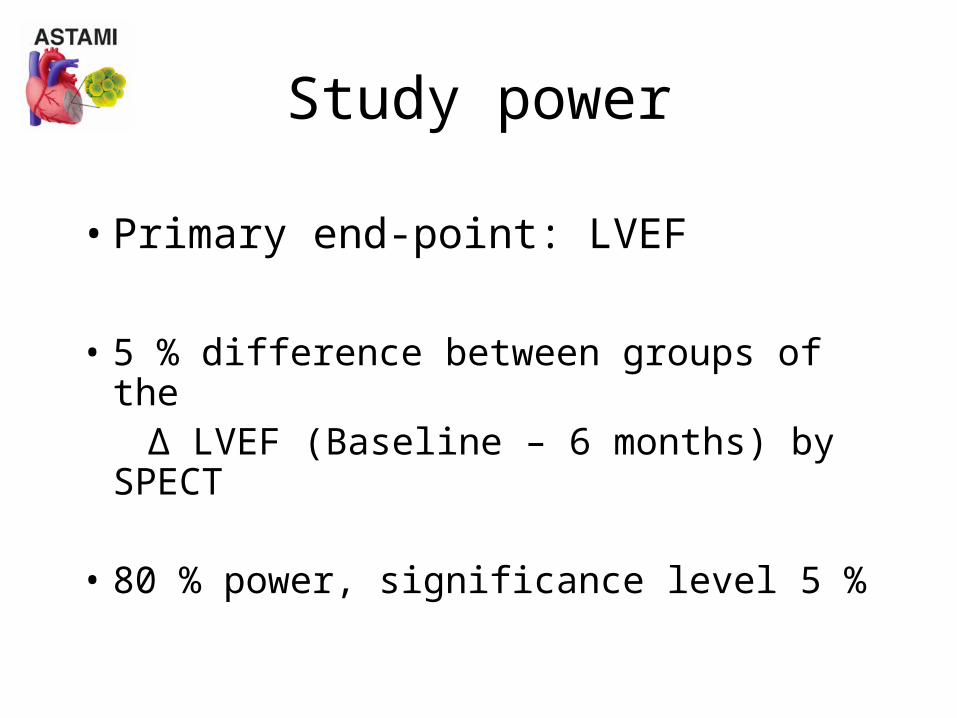
Study power
• Primary end-point: LVEF
• 5 % difference between groups of the ∆ LVEF (Baseline – 6 months) by
SPECT
• 80 % power, significance level 5 %

Day 0: Acute Anterior Wall Myocardial Infarction
PCI with stent on LAD culprit lesion
Day 3-5: Randomization
2-3 weeks: MRI, bicycle exercise tests, SF-36
mBMC group
n=50
Control group
n=50
Day 4-8:
Bone marrow aspiration and intracoronary mBMC injection
6 months follow-up:99mTc-MIBI SPECT, Echocardiography, MRI, Coronary angiography, SF-36
Study design
12 months follow up: Echocardiography
3 months follow up: Echocardiography
Day 4-7: Baseline recordings, 99mTc-MIBI SPECT, Echocardiography
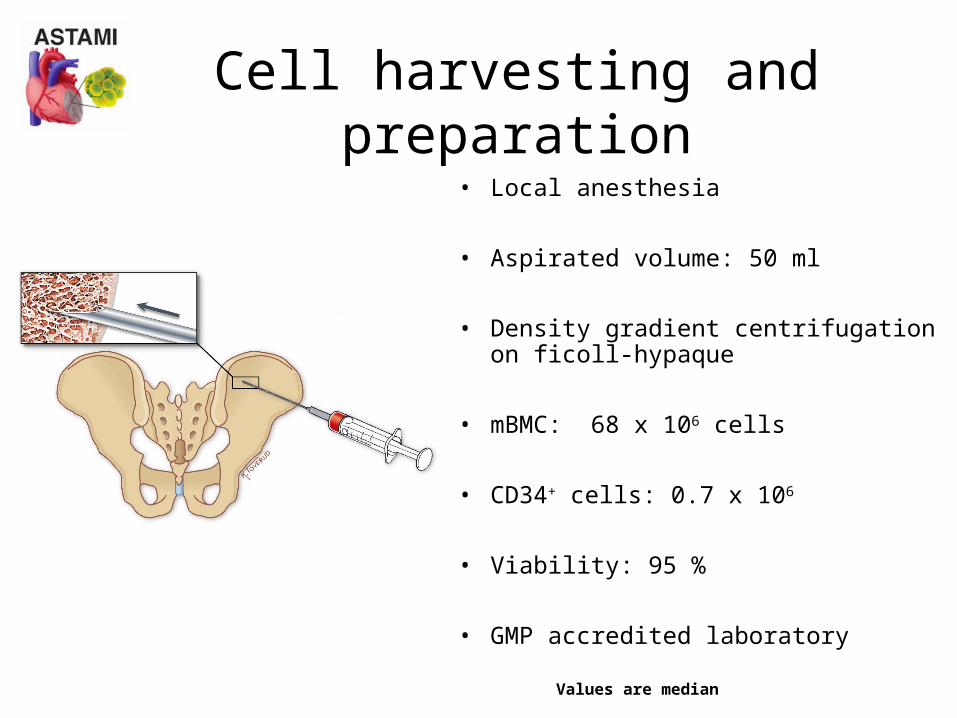
Cell harvesting and preparation
• Local anesthesia
• Aspirated volume: 50 ml
• Density gradient centrifugation on ficoll-hypaque
• mBMC: 68 x 106 cells
• CD34+ cells: 0.7 x 10⁶
• Viability: 95 %
• GMP accredited laboratory
Values are median

Cell preparation in ASTAMI
• The ASTAMI Study protocol for– Isolation of mononuclear cells– Overnight storage– Viability testing
• Proven successful for treatment of patients with hematological diseases
Egeland et al, Eur Heart J 2007;letter to editor (in press)
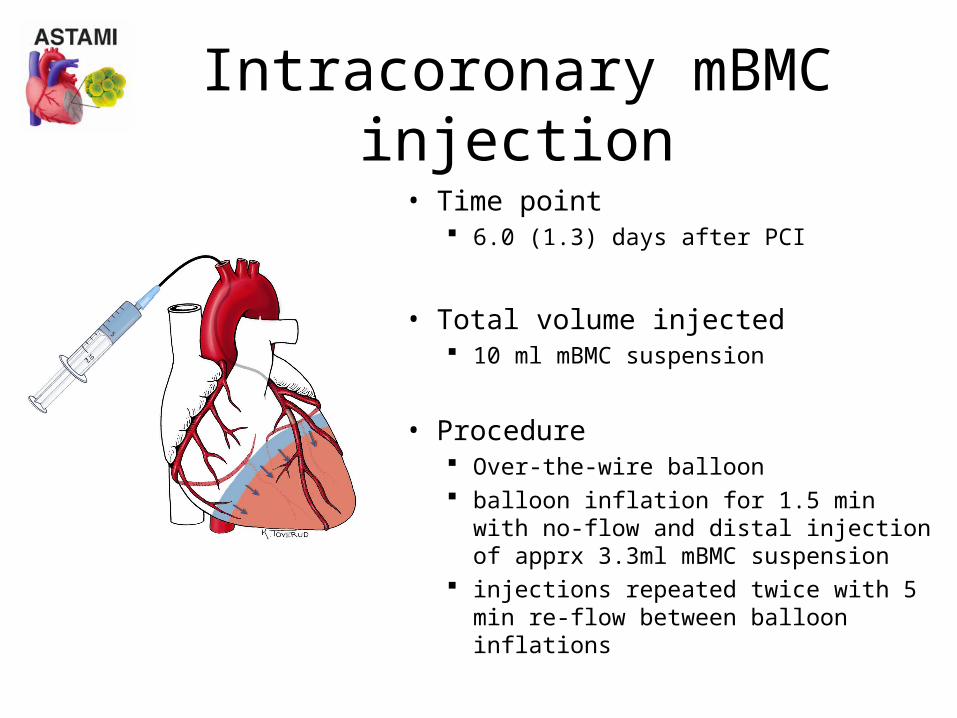
Intracoronary mBMC injection
• Time point 6.0 (1.3) days after PCI
• Total volume injected 10 ml mBMC suspension
• Procedure Over-the-wire balloon balloon inflation for 1.5 min with no-
flow and distal injection of apprx 3.3ml mBMC suspension
injections repeated twice with 5 min re-flow between balloon inflations
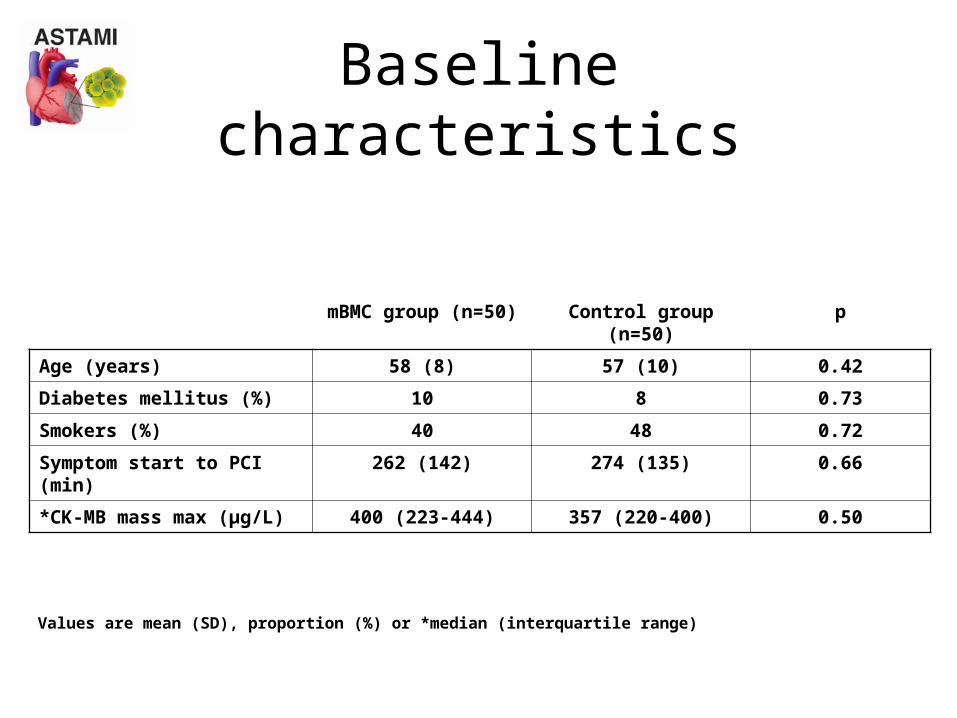
Baseline characteristics
mBMC group (n=50) Control group (n=50) p
Age (years) 58 (8) 57 (10) 0.42
Diabetes mellitus (%) 10 8 0.73
Smokers (%) 40 48 0.72
Symptom start to PCI (min) 262 (142) 274 (135) 0.66
*CK-MB mass max (µg/L) 400 (223-444) 357 (220-400) 0.50
Values are mean (SD), proportion (%) or *median (interquartile range)
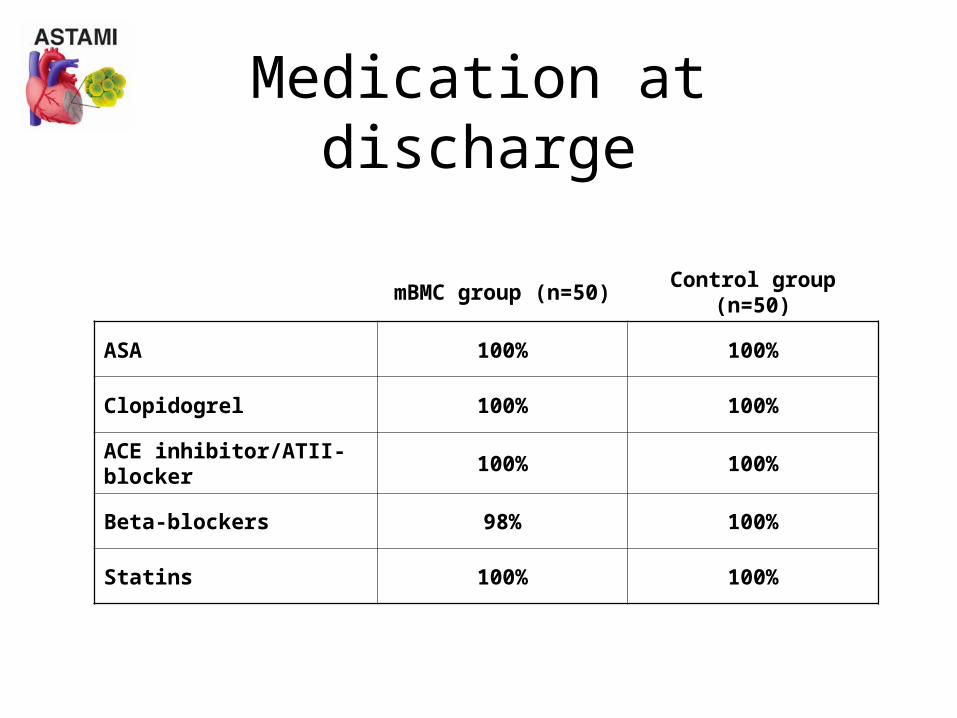
Medication at discharge
mBMC group (n=50) Control group (n=50)
ASA 100% 100%
Clopidogrel 100% 100%
ACE inhibitor/ATII-blocker
100% 100%
Beta-blockers 98% 100%
Statins 100% 100%
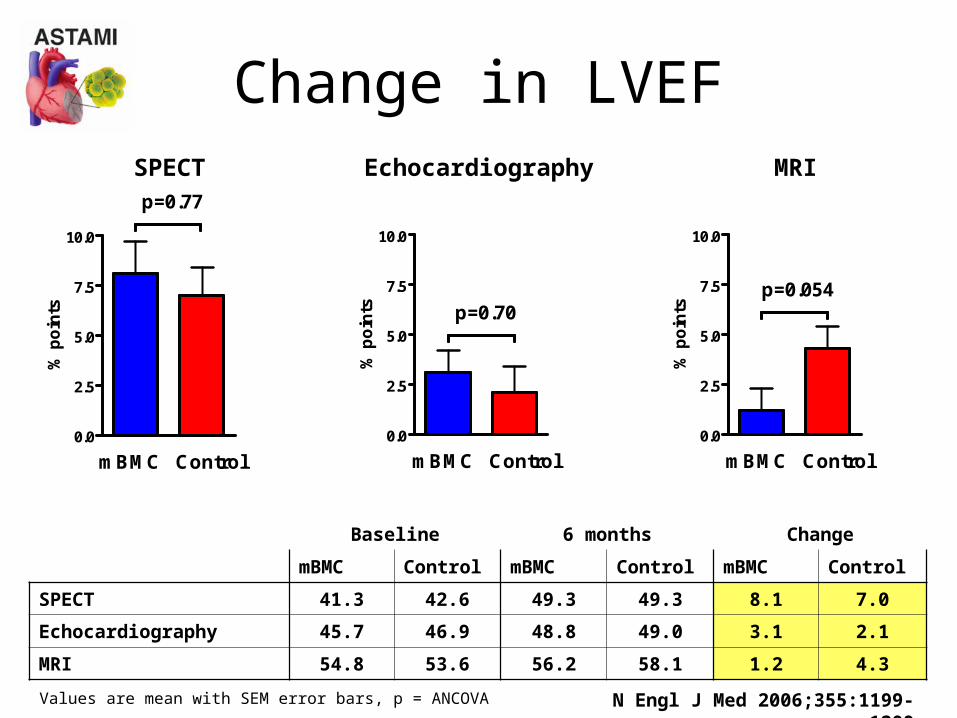
Change in LVEF
Baseline 6 months Change
mBMC Control mBMC Control mBMC Control
SPECT 41.3 42.6 49.3 49.3 8.1 7.0
Echocardiography 45.7 46.9 48.8 49.0 3.1 2.1
MRI 54.8 53.6 56.2 58.1 1.2 4.3
Values are mean with SEM error bars, p = ANCOVA N Engl J Med 2006;355:1199-1209
0.0
2.5
5.0
7.5
10.0
p=0.77
mBMC Control
% p
oin
ts
0.0
2.5
5.0
7.5
10.0
mBMC Control
p=0.70
% p
oin
ts
Echocardiography
0.0
2.5
5.0
7.5
10.0
mBMC Control
p=0.054
% p
oin
ts
SPECT MRI
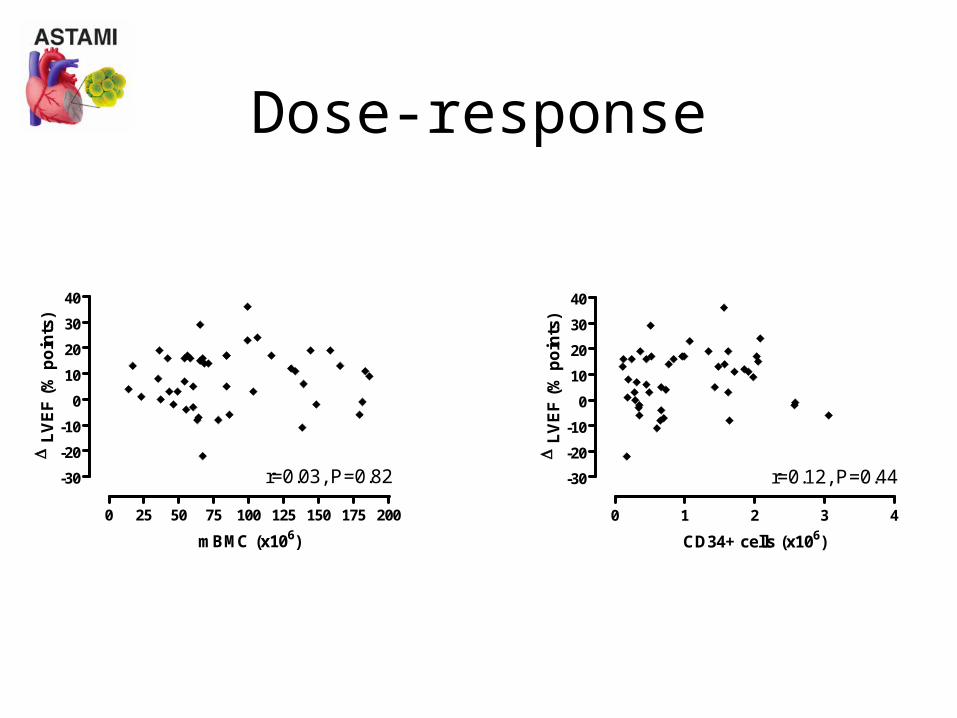
0 25 50 75 100 125 150 175 200
-30
-20
-10
0
10
20
30
40
r=0.03, P=0.82
mBMC (x106)
L
VE
F (
% p
oin
ts)
Dose-response
0 1 2 3 4
-30
-20
-10
0
10
20
30
40
r=0.12, P=0.44
CD34+ cells (x106)
LV
EF
(%
po
ints
)
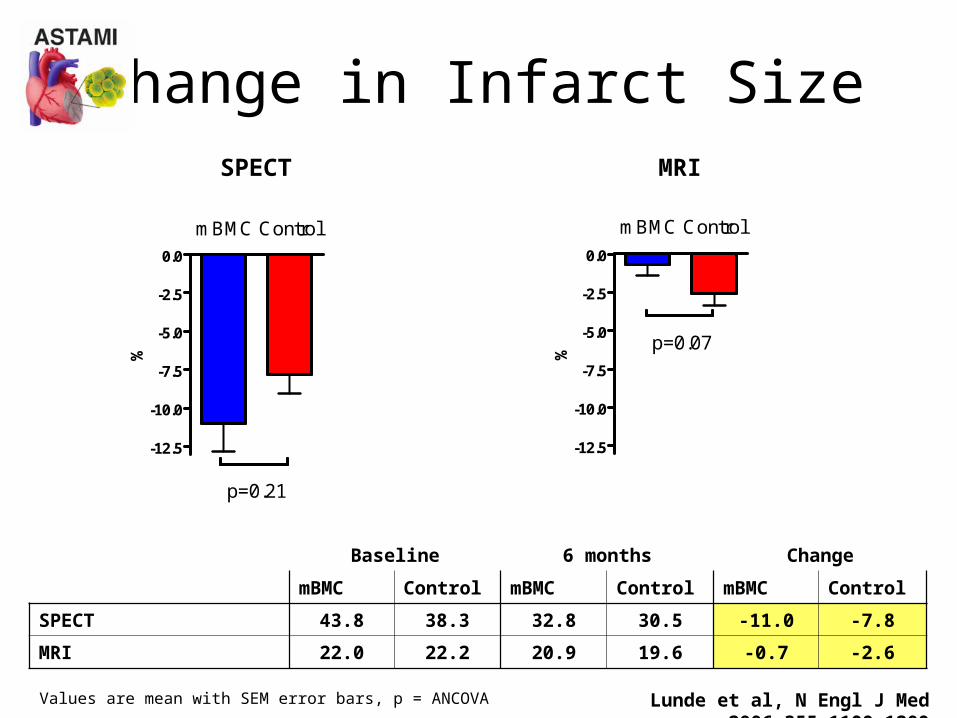
Change in Infarct Size
Baseline 6 months Change
mBMC Control mBMC Control mBMC Control
SPECT 43.8 38.3 32.8 30.5 -11.0 -7.8
MRI 22.0 22.2 20.9 19.6 -0.7 -2.6
Values are mean with SEM error bars, p = ANCOVA Lunde et al, N Engl J Med 2006;355:1199-1209
SPECT MRI
-12.5
-10.0
-7.5
-5.0
-2.5
0.0
p=0.21
mBMC Control
%
-12.5
-10.0
-7.5
-5.0
-2.5
0.0
p=0.07
mBMC Control
%
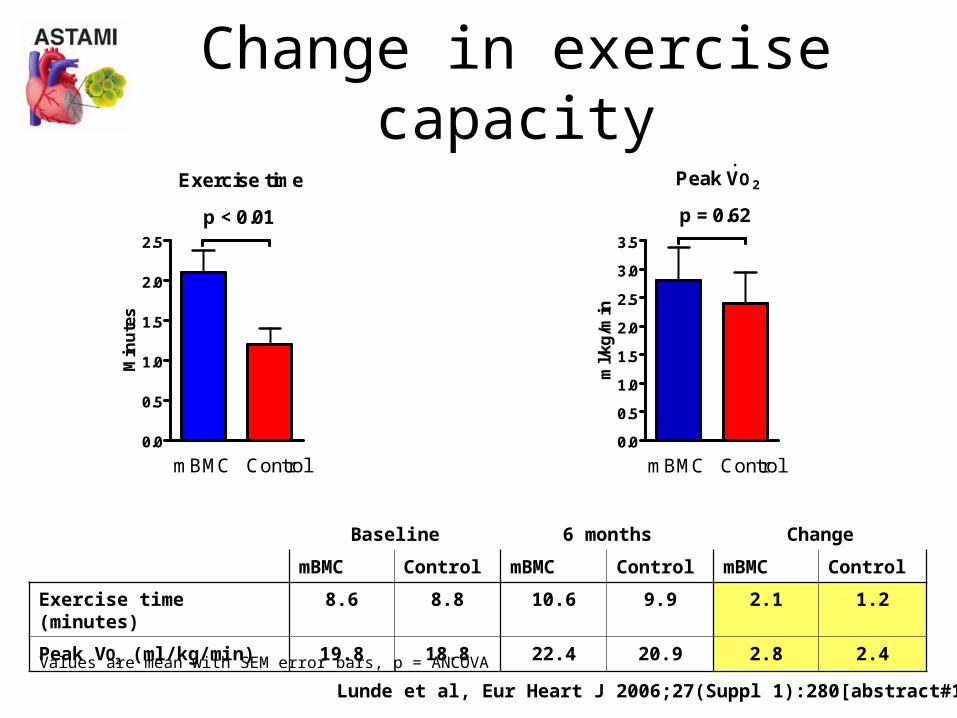
Change in exercise capacity
Baseline 6 months Change
mBMC Control mBMC Control mBMC Control
Exercise time (minutes) 8.6 8.8 10.6 9.9 2.1 1.2
Peak VO2 (ml/kg/min) 19.8 18.8 22.4 20.9 2.8 2.4
Values are mean with SEM error bars, p = ANCOVA
0.0
0.5
1.0
1.5
2.0
2.5
p < 0.01
mBMC Control
Exercise time
Min
ute
s
0.0
0.5
1.0
1.5
2.0
2.5
3.0
3.5
p = 0.62
Peak VO2
mBMC Control
.
ml/
kg/m
in
Lunde et al, Eur Heart J 2006;27(Suppl 1):280[abstract#1680)
mBMCControl
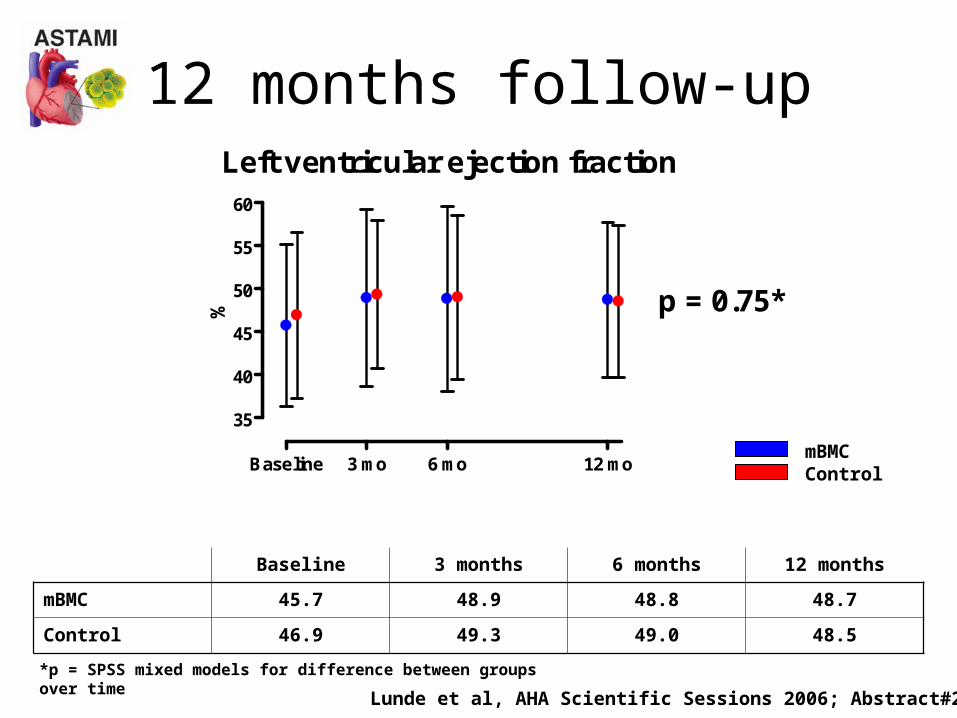
12 months follow-up
*p = SPSS mixed models for difference between groups over time
Baseline 3 months 6 months 12 months
mBMC 45.7 48.9 48.8 48.7
Control 46.9 49.3 49.0 48.5
Left ventricular ejection fraction
Baseline 3 mo 6 mo 12 mo
35
40
45
50
55
60
p = 0.75*%
Lunde et al, AHA Scientific Sessions 2006; Abstract#2717
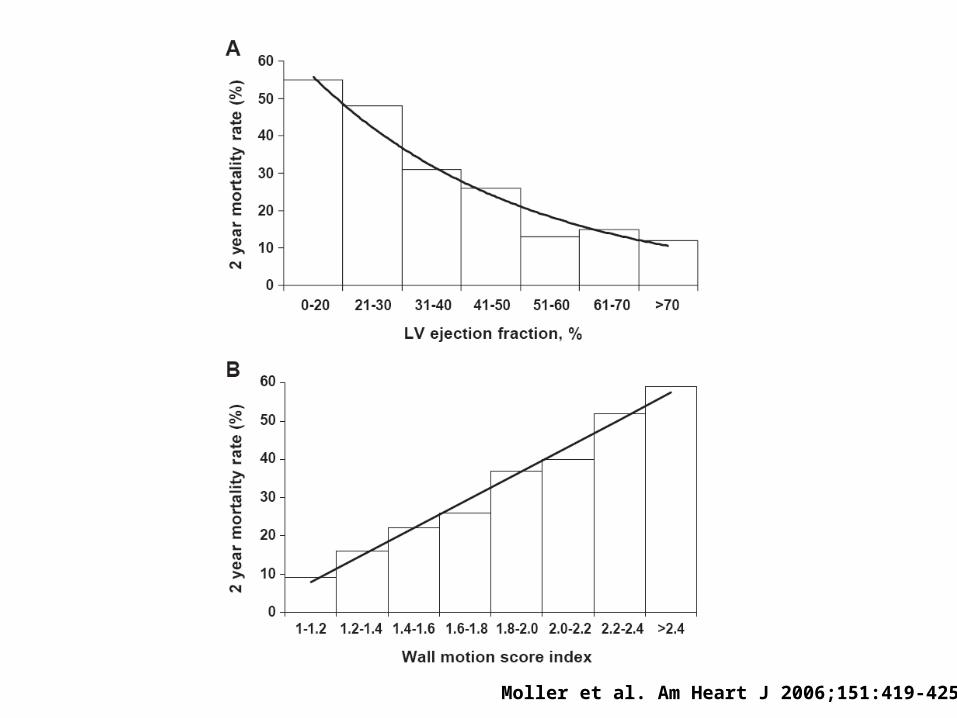
Moller et al. Am Heart J 2006;151:419-425
mBMCControl
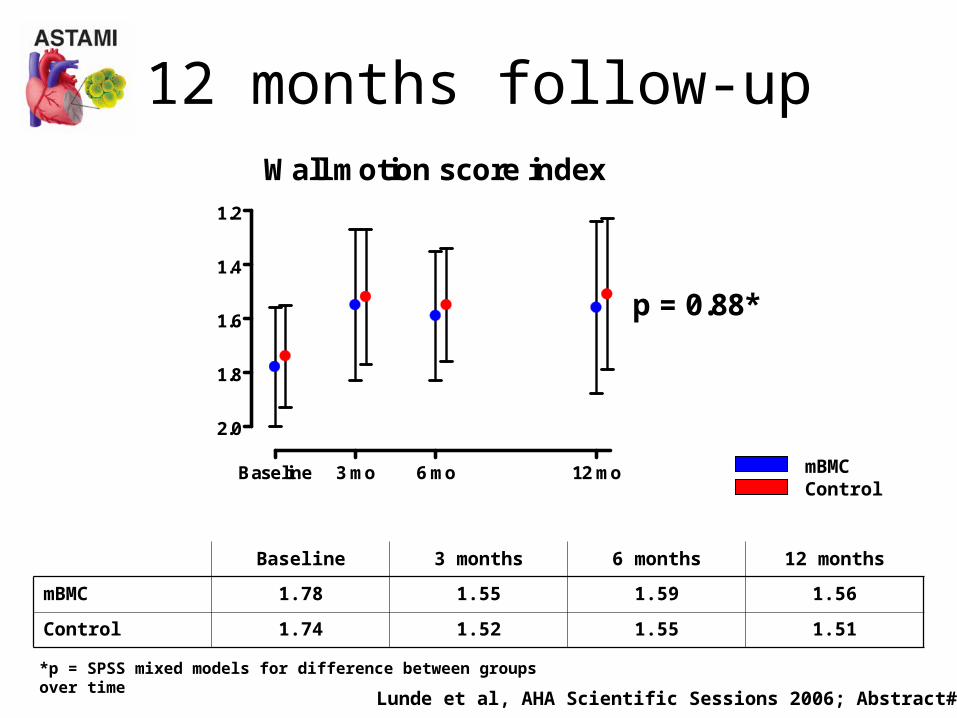
12 months follow-up
*p = SPSS mixed models for difference between groups over time
Wall motion score index
Baseline 3 mo 6 mo 12 mo
1.2
1.4
1.6
1.8
2.0
p = 0.88*
Baseline 3 months 6 months 12 months
mBMC 1.78 1.55 1.59 1.56
Control 1.74 1.52 1.55 1.51
Lunde et al, AHA Scientific Sessions 2006; Abstract#2717
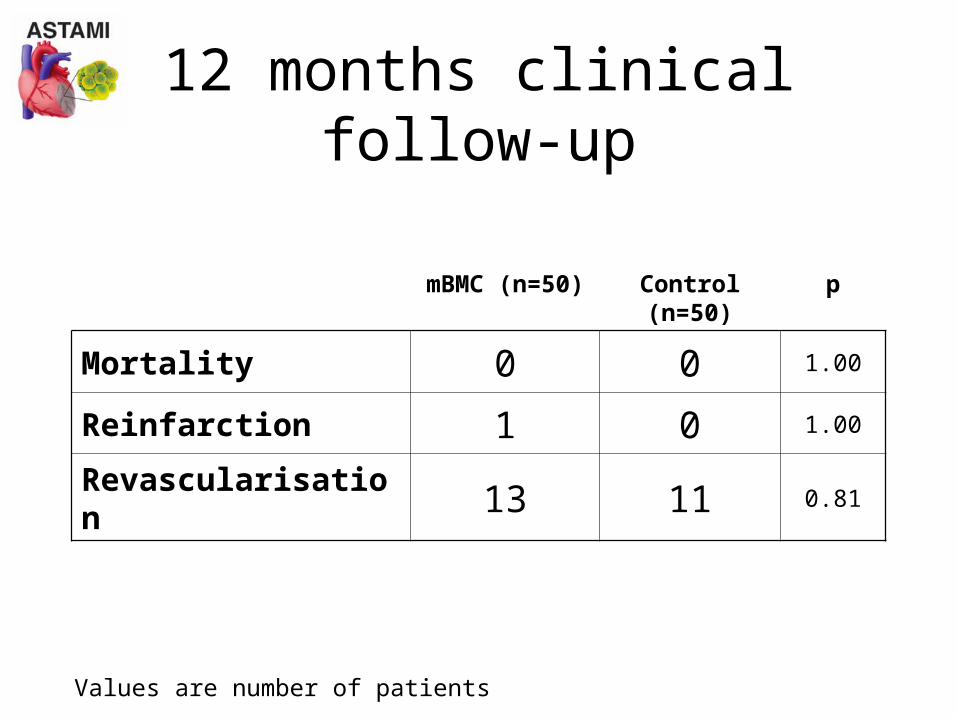
12 months clinical follow-up
Values are number of patients
mBMC (n=50) Control (n=50) p
Mortality 0 0 1.00
Reinfarction 1 0 1.00
Revascularisation 13 11 0.81
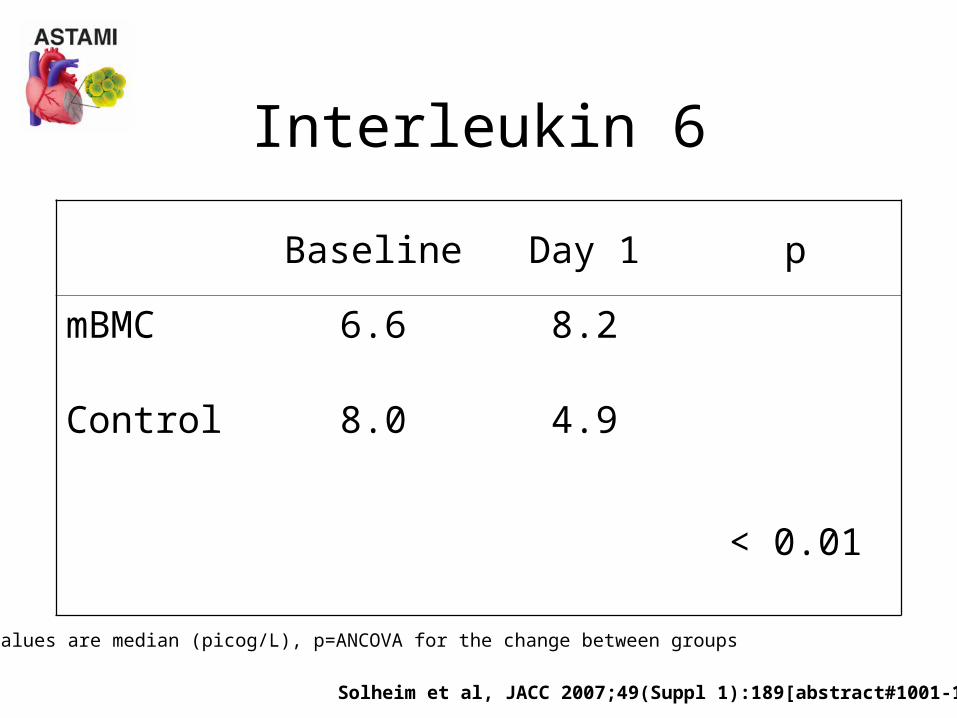
Baseline Day 1 p
mBMC 6.6 8.2
Control 8.0 4.9
< 0.01
Interleukin 6
Values are median (picog/L), p=ANCOVA for the change between groups
Solheim et al, JACC 2007;49(Suppl 1):189[abstract#1001-132]
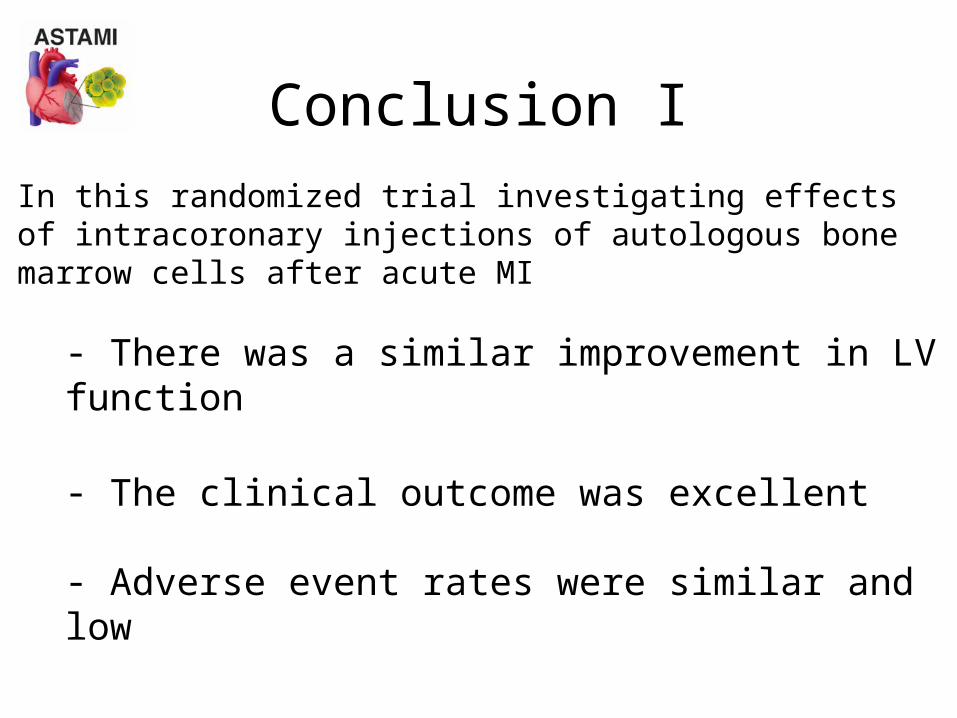
Conclusion I
In this randomized trial investigating effects of intracoronary injections of autologous bone marrow cells after acute MI
- There was a similar improvement in LV function
- The clinical outcome was excellent
- Adverse event rates were similar and low
In both groups during 12 months follow-up
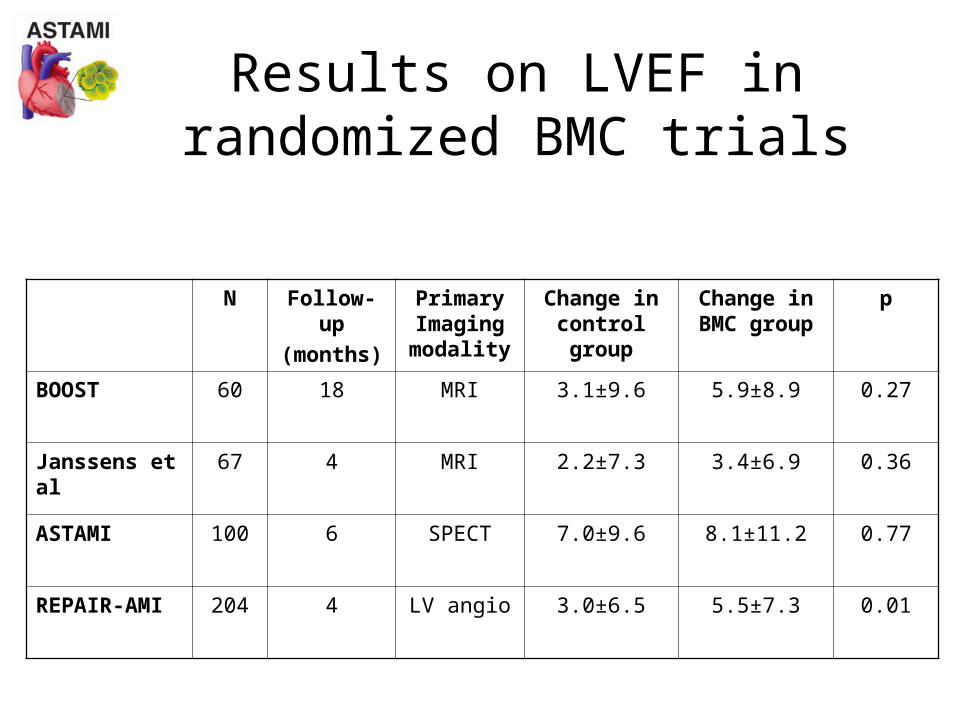
Results on LVEF in randomized BMC trials
N Follow-up
(months)
Primary Imaging modality
Change in control group
Change in BMC group
p
BOOST 60 18 MRI 3.1±9.6 5.9±8.9 0.27
Janssens et al 67 4 MRI 2.2±7.3 3.4±6.9 0.36
ASTAMI 100 6 SPECT 7.0±9.6 8.1±11.2 0.77
REPAIR-AMI 204 4 LV angio 3.0±6.5 5.5±7.3 0.01
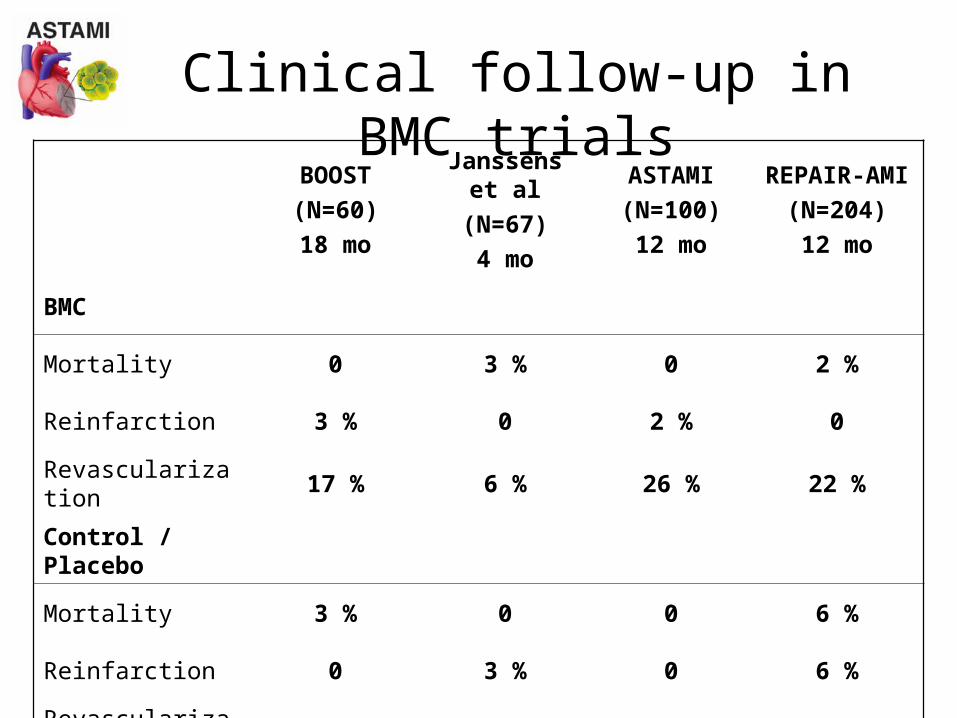
Clinical follow-up in BMC trialsBOOST
(N=60)
18 mo
Janssens et al
(N=67)
4 mo
ASTAMI
(N=100)
12 mo
REPAIR-AMI
(N=204)
12 mo
BMC
Mortality 0 3 % 0 2 %
Reinfarction 3 % 0 2 % 0
Revascularization 17 % 6 % 26 % 22 %
Control / Placebo
Mortality 3 % 0 0 6 %
Reinfarction 0 3 % 0 6 %
Revascularization 13 % 3 % 22 % 36 %
Conclusion II
• Intracoronary administration of BMC after AMI seems to be safe
• Efficacy is not established
• Results of ongoing adequately powered studies with accurate assessment of LV function are awaited

ASTAMI investigatorsSteering committeeK Forfang (chair), S Aakhus, H Arnesen, T Egeland, K Endresen, A Ilebekk,A Mangschau
Study investigatorsS Aakhus, M Abdelnoor, H Arnesen, P Aukrust, R Bjørnerheim, M Brekke,L Brinch, JE Brinchmann, T Egeland, K Endresen, JG Fjeld, K Forfang,HK Grøgaard, E Hopp, A Ilebekk, TO Kjellevand, NE Kløw, K Lunde, A Mangschau, C Mϋller, A Ragnarsson, I Seljeflot, HJ Smith, S Solheim, E Taraldsrud
Data and safety monitoring boardK Rasmussen, L Wallentin, R Wiseth
AcknowledgementsK Lunde and S Solheim are recipients of research fellowships from the Norwegian Council on Cardiovascular diseases


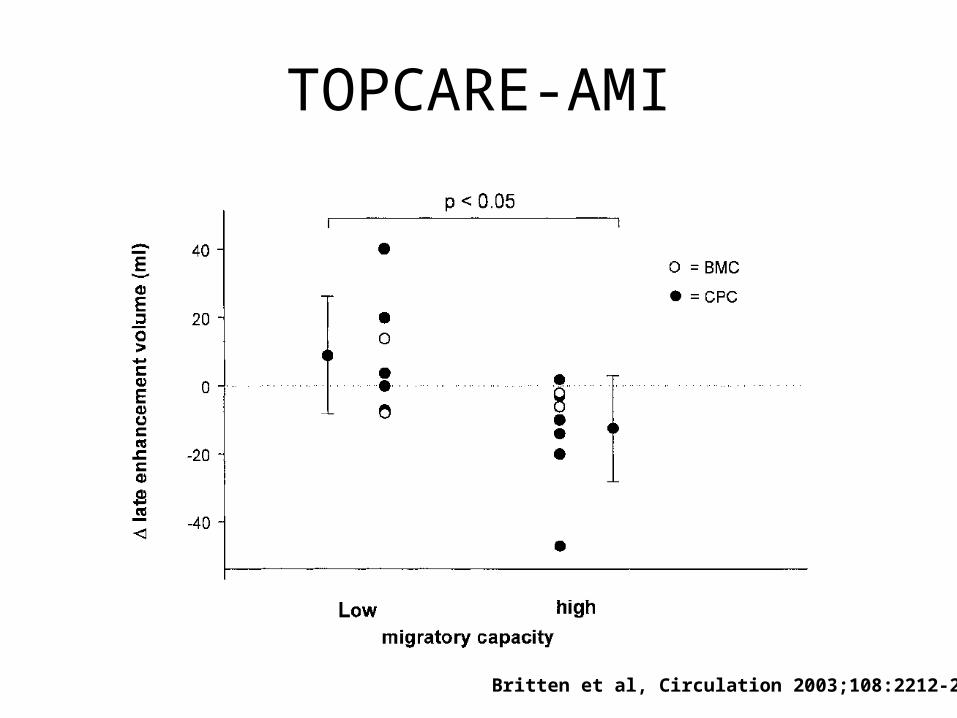
TOPCARE-AMI
Britten et al, Circulation 2003;108:2212-2218