Embed Size (px)
Citation preview
Intrinsic Melanin and Hemoglobin Colour Componentsfor Skin Lesion Malignancy Detection
Ali Madooei, Mark S. Drew, Maryam Sadeghi, and M. Stella Atkins
School of Computing ScienceSimon Fraser [email protected]
http://www.cs.sfu.ca/∼amadooei
Abstract. In this paper we propose a new log-chromaticity 2-D colour space,an extension of previous approaches, which succeeds in removing confoundingfactors from dermoscopic images: (i) the effects of the particular camera char-acteristics for the camera system used in forming RGB images; (ii) the colourof the light used in the dermoscope; (iii) shading induced by imaging non-flatskin surfaces; (iv) and light intensity, removing the effect of light-intensity fallofftoward the edges of the dermoscopic image. In the context of a blind source sep-aration of the underlying colour, we arrive at intrinsic melanin and hemoglobinimages, whose properties are then used in supervised learning to achieve excel-lent malignant vs. benign skin lesion classification. In addition, we propose usingthe geometric-mean of colour for skin lesion segmentation based on simple grey-level thresholding, with results outperforming the state of the art.
1 Introduction
The three most common malignant skin cancers are basal cell carcinoma (BCC), squa-mous cell carcinoma (SCC), and melanoma, among which melanoma is the most deadlywith a high increasing rate in most parts of the world. Melanoma is often treatable ifdetected in the early stage, particularly before the metastasis phase. Therefore, there isan increasing demand for computer-aided diagnostic systems to catch early melanomas.
Colour has played a crucial role in the diagnosis of skin lesions by experts in mostclinical methods (see e.g. [1]). For instance, the presence of multiple colours with anirregular distribution can signal malignancy.
Few studies have investigated the use of colour features representing biological prop-erties of skin lesions. In particular, the work of Claridge et al. has figured prominently,with emphasis on the use of intermediate multispectral modelling to generate imagesdisambiguating dermal and epidermal melanin, thickness of collagen, and blood [2].At the same time, another stream of work has focused on using Independent Compo-nent Analysis (ICA) [3] in the context of 3-channel RGB images with no intermediatespectral-space model, aimed both at non-medical images and dermoscopic images ofskin [4].
Here we concentrate on the latter, simpler, approach to utilizing colour and consideronly RGB, not multispectral image modelling. We show that, combined with texturefeatures, one can successfully carry out classification, disambiguating Malignant vs.Benign; Melanoma vs. Benign; and Melanoma vs. Spitz Nevus.
N. Ayache et al. (Eds.): MICCAI 2012, Part I, LNCS 7510, pp. 315–322, 2012.c© Springer-Verlag Berlin Heidelberg 2012
316 A. Madooei et al.
2 Method
We first adopt the ICA-based idea [4] in spirit and show that, in a particular novelcolour space, pixel triples live on a plane, with (non-orthogonal) basis vectors assumedattributable to melanin and hemoglobin only.
Here, in an innovative step, we introduce a new colour 2-D chromaticity which re-moves (i) the effects of the particular camera characteristics for the camera system usedin forming RGB images; (ii) the colour of the light used in the dermoscope; (iii) shadinginduced by imaging non-flat skin surfaces; (iv) and also light intensity, removing the ef-fect of light-intensity falloff toward the edges of the image. The output from this colourprocessing is a set of two 1-D-colour chromaticity images, one for melanin content andone for hemoglobin content.
Together with the above colour space features, we also employ greyscale and texturefeatures, including all features in a final 25-D feature-space vector. Such vectors arethen amenable to machine learning techniques for effective skin lesion classification. Inthis paper we achieve comparable to state of the art results for distinguishing malignantfrom benign lesions.
2.1 Colour Space Image Formulation
Tsumura et al. first suggested using a simple Lambert-Beer type of law for radiancefrom a multilayer skin surface, resulting from illumination by polarized light [5]. Thatis, employing a model similar to a simple logarithm model based on optical densitiesfor accounting for light passing for example through multilayer slide film. The transmit-tance through each colour layer is proportional to the exponential of the negative opticaldensity for that layer. Such a simple model stands in contradistinction to a considerablymore complex model based on Kubelka-Monk (KM) theory such as used in [2]. In thelatter, full modelling of interreflection inside each layer is used to set up equations de-tailing light transport. This uses estimates of the absorptionK and scattering S in eachlayer to predict overall transmittance and reflection [6]. KM theory has been found tobe useful in tasks such as visualizing different components including surface and deepmelanin etc. [2]. Here, we are simply focused on the classification task, and make useof the simpler model.
In the simpler approach, then, we utilize the model developed by Hiraoka et al. [7],which formulates a generalization of the Lambert-Beer law. In [7], the spectral reflec-tion of skin (under polarized light) at pixel indexed by (x, y) is given by
S(x, y, λ) = exp{−ρm(x, y)αm(λ)lm(λ) − ρh(x, y)αh(λ)lh(λ) − ζ(λ)} (1)
where ρm,h are densities of melanin and hemoglobin respectively (cm−3), and are as-sumed to be independent of each other. The cross sectional areas for scattering ab-sorption of melanin and hemoglobin are denoted αm,h (cm2) and lm,h are the meanpathlength for photons in epidermis and dermis layers, which are used as the depth ofthe medium in this modified Lambert-Beer law. These quantities are used as well in [4].Finally, we also extend the model by including a term ζ standing for scattering loss andany other factors which contribute to skin appearance such as absorbency of other chro-mophores (e.g. β-carotene) and thickness of the subcutis. The reason we can extend themodel will become clear below, when we form logarithms of ratios in a novel step.

Intrinsic Melanin and Hemoglobin Colour Components 317
In keeping with [8] we adopt a standard model in computer vision for colour imageformation. Suppose the illuminant spectral power distribution is E(λ) and, in any re-flective case, the spectral reflectance function at pixel (x, y) is S(x, y, λ), e.g. as givenin eq. (1) above. Then measured RGB values are given by
Rk(x, y) = ω(x, y)
∫E(x, y, λk)S(x, y, λk)Qk(λ)dλ, k = 1..3 (2)
where ω denotes shading variation (e.g., Lambertian shading is surface normal dottedinto light direction, although we do not assume Lambertian surfaces here); and Qk(λ)is the camera sensor sensitivity functions in the R,G,B channels.
Following [8] we adopt a simple model for the illuminant: we assume the light canbe written as a Planckian radiator (in Wien’s approximation):
E(x, y, λ, T ) � I(x, y)k1λ−5exp (−k2/(Tλ)) (3)
where k1 and k2 are constants, T is the correlated colour temperature characterizingthe light spectrum, and I is the lighting intensity at pixel (x, y), allowing for a possiblerolloff in intensity towards the periphery of the dermoscopic image. We assume lighttemperature T is constant across the image (but is, in general, unknown).
Finally, with [8] we assume camera sensors are narrowband or can be made narrow-band via a spectral sharpening operation [9]. In this approximation. sensor curveQk(λ)is simply assumed to be a delta function: Qk(λ) = qkδ(λ − λk), where specific wave-lengths λk and sensor-curve heights qk are properties of the camera used. Simplifyingby taking logs (cf. [4]), we arrive at a model for pixel log-RGB as follows:
logRk(x, y) = −ρm(x, y)σm(λk)− ρh(x, y)σh(λk)− ζ(λk)+ log(k1I(x, y)ω(x, y)) +
[log(1/λ5k)− k2/(λkT )
] (4)
where we have lumped terms σm(λk) = αm(λk)lm(λk), σh(λk) = αh(λk)lh(λk). Fornotational convenience, denote uk = log(1/λ5k), ek = −k2/λk, mk = σm(λk), hk =σh(λk), ζk = ζ(λk).
Now let us move forward from [4] by making the novel observation that the sametype of chromaticity analysis as appears in [8] can be brought to bear here for theskin-reflectance model (4) [but N.B., [8] does not use the density model (1)]. Chro-maticity is colour without intensity, e.g. an L1-norm based chromaticity is {r, g, b} ={R,G,B}/(R + G + B). Here, suppose we instead form a band-ratio chromaticityby dividing by one colour-channel Rp, e.g. Green for p = 2. [In practice, we shall in-stead follow [8] and divide by the geometric-mean colour, μ = 3
√R ·G · B, so as not
to favour one particular colour-channel, but dividing by Rp is clearer in exposition.]Notice that dividing removes the effect of shading ω and light-intensity field I .
Defining a log-chromaticity χ(x, y) as the log of the ratio of colour component Rk
over Rp, we then have
χk(x, y) = log (Rk(x, y)/Rp(x, y))= −ρm(x, y)(mk −mp)− ρh(x, y)(hk − hp) + wk − (ek − ep)(1/T )
(5)
with wk ≡ (uk − up) − (ζk − ζp). The meaning of this equation is that, if we wereto vary the lighting (in this simplified model) then the chromaticity χ would follow a

318 A. Madooei et al.
straight line as temperature T changes. In fact, this linear behaviour is also obeyed bythe mean χ over the image of this new chromaticity quantity:
χk = −ρm(mk −mp)− ρh(hk − hp) + wk − (ek − ep)(1/T ) (6)
Now we notice that we can remove all terms in the camera-offset term wk and theilluminant-colour term T by subtracting the mean fromχ. Letχ0 be the mean-subtractedvector χ0
k(x, y) = χk(x, y) − χk. We then arrive at a feature which depends only onmelanin m and hemoglobin h:
χ0k(x, y) = −(ρm(x, y)− ρm)(mk −mp)− (ρh(x, y)− ρh)(hk − hp) (7)
If we apply the assumption that m and h terms can be disambiguated using ICA, thenfrom the new feature χ0 we can extract the melanin and hemoglobin content in dermo-scopic images, where we take vectors (mk − mp) and (hk − hp) as constant vectorsin each image. The log-subtraction step removes intensity and shading, and the mean-subtraction removes camera-offset and light colour, as opposed to [4] where one mustattempt to recover approximations of these quantities.
As an example, consider Fig. 1(a) showing a Melanoma lesion, and the ρm andρh components in Figs.(b,c). Below, we show how these two new image features,ρ0m(x, y) = (ρm(x, y) − ρm) and ρ0h(x, y) = (ρh(x, y) − ρh), can be used in lesionclassification. In computer vision, images with lighting removed are denoted “intrinsicimages”, and thus our two new features are indeed intrinsic.
Geometric Mean Chromaticity. To not rely on any particular colour channel, wedivide not by Rp but by the geometric mean μ at each pixel, for which the invarianceproperties above persist: ψk(x, y) ≡ log[Rk(x, y)/μ(x, y)]. Then ψ is a 3-vector; itis orthogonal to (1, 1, 1). Therefore instead of 3-vectors one can easily treat these as2-vector values, lying in the plane orthogonal to (1, 1, 1): if the 3×3 projector onto that2-D subspace is P , then the singular value decomposition of P = UUT , whereU is a3× 2 matrix. We project onto 2-D vectors φ in the plane coordinate system via UT :
ψk(x, y) = log[Rk(x, y)/μ(x, y)]; φ = UTψ (8)
where φ is 2-D. The mean-subtraction above still holds in projected colour, and wetherefore here propose carrying out ICA in the plane: feature = η = ICA(φ− φ).
2.2 Texture and Colour Feature Vectors
So far, we have discarded the luminance (intensity) part of the input image, focusing onintrinsic colour. However, we can go on to include the greyscale geometric-mean image(Fig. 1(d)) information μ as well. Thus, we extract features for each of {μ, η1, η2}.
As colour features, we generate mean; standard deviation; the ratio of these; andentropy of each channel, in addition to |var(η1)−var(η2)|, adding up to a 13-D colourfeature vector. Further, we add texture features to our colour feature-vectors, in a similarfashion as in [10]: four of the classical statistical texture measures of [11] (contrast,correlation, homogeneity and energy) are derived from the grey level co-occurrencematrix (GLCM) of each channel. This is an additional 12-D texture feature vector; thuswe arrive at a 25-D feature vector.

Intrinsic Melanin and Hemoglobin Colour Components 319
(a) (b) (c) (d)
(e) (f) (g) (h)
(i) (j) (k) (l)
Fig. 1. (a): Input image (Melanoma); (b): melanin component; (c): hemoglobin component; (d):greyscale geometric mean. Blue border: expert segmentation, Red border: our segmentation.(e-h): BCC. (i-l): Spitz Nevus.
3 Image Masks
Each of the features calculated above is applied only within a mask surrounding thelesion, normalized accordingly. For automatic segmentation of lesions, we found thatusing the geometric-mean μ is as good as or better than the state of the art [12] for thesedermoscopic images, in a much simpler algorithm. Here we simply apply Otsu’s method[13] for selecting a grey-level threshold. Note that Otsu’s method (and also most com-mercially available automated systems) fail in segmenting low contrast lesions. How-ever our approach achieved very high precision and recall, since we discovered thatgeometric-mean greyscale highlights the lesion from its surrounding.
We tested our method on a dataset of images used by Wighton et al. [12]. Theypresented a modified random walker (MRW) segmentation where seed points were setautomatically based on a lesion probability map (LPM). The LPM was created througha supervised learning procedure using colour/texture properties. Table 1 shows resultsfor our method compared to results in [12]. While our method for segmentation uses amuch simpler algorithm and does not require learning, it achieves competitive results.It is worth mentioning [12] also applied Otsu’s method on their lesion probability maps.Their result included in Table 1 under ‘Otsu on LPM’, with results not nearly as goodas ours. In another test on 944 test images, we achieved precision 0.86, recall 0.95,and f-measure 0.88 (with STD 0.19, 0.08 and 0.15 respectively) compared to expertsegmentations.
4 Experiments
We applied a Logistic classifier to a set of 500 images, with two classes consisting ofmalignant (melanoma and BCC) vs. all benign lesions (congenital, compound, dermal,

320 A. Madooei et al.
Table 1. Comparing our segmentation method to the modified random walker (MRW) algorithmand Otsu’s thresholding, on lesion probability map (LPM)[12]. The dataset is divided into a setof 20 easy-to-segment images, and another 100 images that pose a challenge to segmentationmethods. Note that our method consistently produces higher f-measures.
ImageSet n Method Precision Recall F-measure
simple 20MRW on LPM 0.96 0.95 0.95Otsu on LPM 0.99 0.86 0.91Our Method 0.94 0.97 0.95
(STD) (0.04) (0.04) (0.02)
challenging 100MRW on LPM 0.83 0.90 0.85Otsu on LPM 0.88 0.68 0.71Our Method 0.88 0.90 0.88
(STD) (0.15) (0.1) (0.09)
whole 120MRW on LPM 0.87 0.92 0.88Otsu on LPM 0.91 0.74 0.78Our Method 0.89 0.90 0.89
(STD) (0.13) (0.09) (0.09)
Table 2. Results of classifying the dataset using different colour spaces. MHG is our proposedcolour space; We win and improve the f-measure somewhat, but the AUC is substantially boosted.Since our dataset is unbalanced, a classifier trained on e.g. RGB achieved high score while as-signed benign label to most malignant instances. We on the other hand produced equally high andsteady results for both classes; improving e.g. recall for malignant cases up to 23%. Since samefeature-set & classifier is used, the improvement is the result of using our proposed colour-space.
Colour Space Class n Precision Recall F-measure AUC
MHGMalignant 135 0.806 0.8 0.803
0.953Benign 365 0.926 0.929 0.927Weighted Avr. 500 0.894 0.894 0.894
RGBMalignant 135 0.895 0.57 0.697
0.773Benign 365 0.86 0.975 0.914Weighted Avr. 500 0.869 0.866 0.855
HSVMalignant 135 0.807 0.652 0.721
0.797Benign 365 0.88 0.942 0.91Weighted Avr. 500 0.86 0.864 0.859
LABMalignant 135 0.837 0.57 0.678
0.765Benign 365 0.858 0.959 0.906Weighted Avr. 500 0.852 0.854 0.844
Clark, Spitz and blue nevus; dermatofibroma; and seborrheic keratosis). Table 2 resultsare averaged over 10-fold cross-validation. We achieve f-measure: 89.4% and AUC:0.953, an excellent performance. For comparison, we compare using our feature seton RGB, HSV, and CIELAB colour spaces. We see that our proposed colour space,{η1, η2, μ} (denoted MHG for melanin, hemoglobin and geometric-mean), improvesaccuracy (f-measure) as well as the performance (AUC) of classification, particularlyformative for malignant lesions, where the results show significantly higher precisionand recall for our method.
Intrinsic Melanin and Hemoglobin Colour Components 321
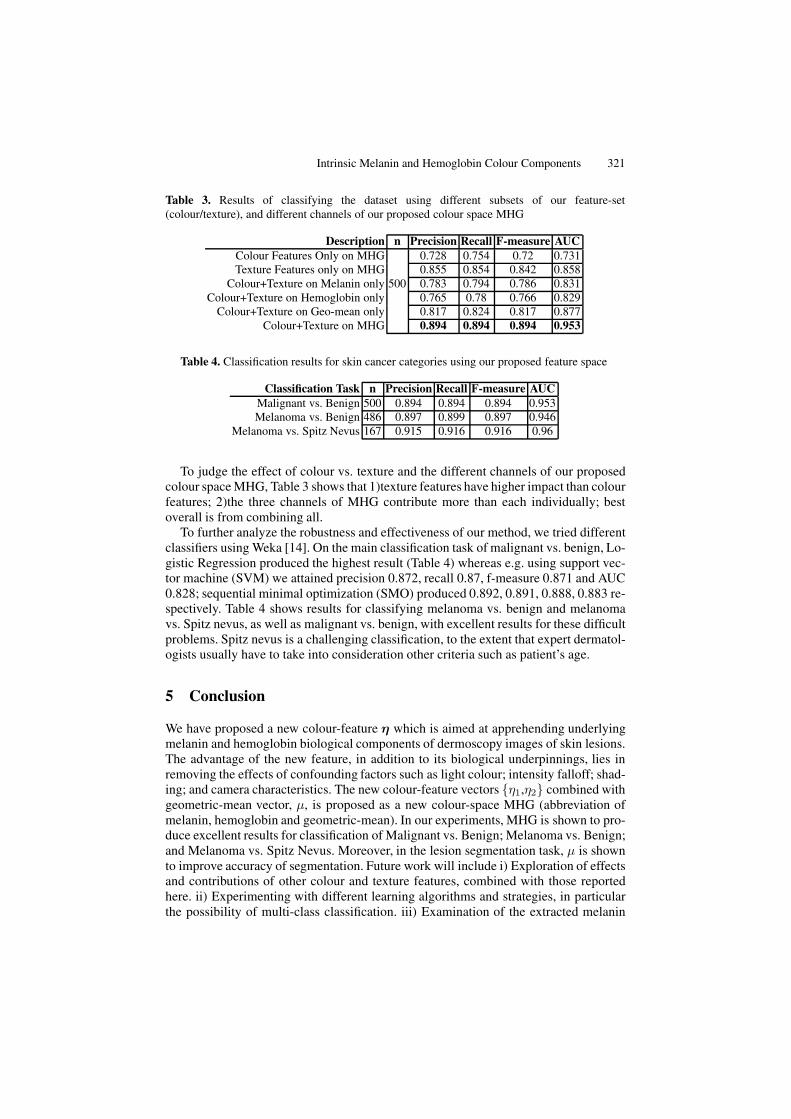
Table 3. Results of classifying the dataset using different subsets of our feature-set(colour/texture), and different channels of our proposed colour space MHG
Description n Precision Recall F-measure AUCColour Features Only on MHG
500
0.728 0.754 0.72 0.731Texture Features only on MHG 0.855 0.854 0.842 0.858
Colour+Texture on Melanin only 0.783 0.794 0.786 0.831Colour+Texture on Hemoglobin only 0.765 0.78 0.766 0.829
Colour+Texture on Geo-mean only 0.817 0.824 0.817 0.877Colour+Texture on MHG 0.894 0.894 0.894 0.953
Table 4. Classification results for skin cancer categories using our proposed feature space
Classification Task n Precision Recall F-measure AUCMalignant vs. Benign 500 0.894 0.894 0.894 0.953Melanoma vs. Benign 486 0.897 0.899 0.897 0.946
Melanoma vs. Spitz Nevus 167 0.915 0.916 0.916 0.96
To judge the effect of colour vs. texture and the different channels of our proposedcolour space MHG, Table 3 shows that 1)texture features have higher impact than colourfeatures; 2)the three channels of MHG contribute more than each individually; bestoverall is from combining all.
To further analyze the robustness and effectiveness of our method, we tried differentclassifiers using Weka [14]. On the main classification task of malignant vs. benign, Lo-gistic Regression produced the highest result (Table 4) whereas e.g. using support vec-tor machine (SVM) we attained precision 0.872, recall 0.87, f-measure 0.871 and AUC0.828; sequential minimal optimization (SMO) produced 0.892, 0.891, 0.888, 0.883 re-spectively. Table 4 shows results for classifying melanoma vs. benign and melanomavs. Spitz nevus, as well as malignant vs. benign, with excellent results for these difficultproblems. Spitz nevus is a challenging classification, to the extent that expert dermatol-ogists usually have to take into consideration other criteria such as patient’s age.
5 Conclusion
We have proposed a new colour-feature η which is aimed at apprehending underlyingmelanin and hemoglobin biological components of dermoscopy images of skin lesions.The advantage of the new feature, in addition to its biological underpinnings, lies inremoving the effects of confounding factors such as light colour; intensity falloff; shad-ing; and camera characteristics. The new colour-feature vectors {η1,η2} combined withgeometric-mean vector, μ, is proposed as a new colour-space MHG (abbreviation ofmelanin, hemoglobin and geometric-mean). In our experiments, MHG is shown to pro-duce excellent results for classification of Malignant vs. Benign; Melanoma vs. Benign;and Melanoma vs. Spitz Nevus. Moreover, in the lesion segmentation task, μ is shownto improve accuracy of segmentation. Future work will include i) Exploration of effectsand contributions of other colour and texture features, combined with those reportedhere. ii) Experimenting with different learning algorithms and strategies, in particularthe possibility of multi-class classification. iii) Examination of the extracted melanin
322 A. Madooei et al.
and hemoglobin colour components as a set of two full-colour images, since the equa-tions leading to (8) are in fact invertible for each component separately. As 3-D colourfeatures these will support descriptors such as colour histograms and correlograms,which may lead to even more improvement.
References
1. Henning, J.S., Dusza, S.W., Wang, S.Q., Marghoob, A.A., Rabinovitz, H.S., Polsky, D.,Kopf, A.W.: The CASH (color, architecture, symmetry, and homogeneity) algorithm for der-moscopy. J. of the Amer. Acad. of Dermatology 56, 45–52 (2007)
2. Claridge, E., Cotton, S., Hall, P., Moncrieff, M.: From colour to tissue histology: Physics-based interpretation of images of pigmented skin lesions. Med. Im. Anal. 7, 489–502 (2003)
3. Hyvarinen, A., Karhunen, J., Oja, E.: Independent Component Analysis. John Wiley andSons, Inc., New York (2001)
4. Tsumura, N., Ojima, N., Sato, K., Shiraishi, M., Shimizu, H., Nabeshima, H., Akazaki, S.,Hori, K., Miyake, Y.: Image-based skin color and texture analysis/synthesis by extractinghemoglobin and melanin information in the skin. ACM Trans. Graph. 22, 770–779 (2003)
5. Tsumura, N., Haneishi, H., Miyake, Y.: Independent-component analysis of skin color image.J. of the Optical Soc. of Amer. A 16, 2169–2176 (1999)
6. Kang, H.R.: Color technology for electronic imaging systems. SPIE Optical Eng. Press(1997)
7. Hiraoka, M., Firbank, M., Essenpreis, M., Cope, M., Arrige, S.R., Zee, P.V.D., Delpy, D.T.: AMonte Carlo investigation of optical pathlength in inhomogeneous tissue and its applicationto near-infrared spectroscopy. Phys. Med. Biol. 38, 1859–1876 (1993)
8. Finlayson, G.D., Drew, M.S., Lu, C.: Intrinsic Images by Entropy Minimization. In: Pajdla,T., Matas, J(G.) (eds.) ECCV 2004, Part III. LNCS, vol. 3023, pp. 582–595. Springer, Hei-delberg (2004)
9. Finlayson, G.D., Drew, M.S., Funt, B.V.: Spectral sharpening: sensor transformations forimproved color constancy. J. Opt. Soc. Am. A 11(5), 1553–1563 (1994)
10. Sadeghi, M., Razmara, M., Wighton, P., Lee, T., Atkins, M.: Modeling the DermoscopicStructure Pigment Network Using a Clinically Inspired Feature Set. In: Liao, H., Eddie Ed-wards, P.J., Pan, X., Fan, Y., Yang, G.-Z. (eds.) MIAR 2010. LNCS, vol. 6326, pp. 467–474.Springer, Heidelberg (2010)
11. Haralick, R.M., Shapiro, L.G.: Computer and Robot Vision, vol. 1, p. 459. Addison-Wesley,New York (1992)
12. Wighton, P., Sadeghi, M., Lee, T.K., Atkins, M.S.: A Fully Automatic Random Walker Seg-mentation for Skin Lesions in a Supervised Setting. In: Yang, G.-Z., Hawkes, D., Rueckert,D., Noble, A., Taylor, C. (eds.) MICCAI 2009, Part II. LNCS, vol. 5762, pp. 1108–1115.Springer, Heidelberg (2009)
13. Otsu, N.: A threshold selection method from gray-level histograms. IEEE Trans. on Systems,Man and Cybernetics 9(1), 62–66 (1979)
14. Hall, M., Frank, E., Holmes, G., Pfahringer, B., Reutemann, P., Witten, I.H.: WEKA datamining software (2001), http://www.cs.waikato.ac.nz/ml/weka/


![Melanin Translation[1]](https://img.pdfslide.net/doc/110x75/577d22411a28ab4e1e96f1ae/melanin-translation1.jpg)