Embed Size (px)
Citation preview

PFG 2013 1 0031ndash0041 ArticleStuttgart February 2013
copy 2013 E Schweizerbartsche Verlagsbuchhandlung Stuttgart Germany wwwschweizerbartdeDOI 1011271432-836420130156 1432-8364130156 $ 275
Introducing a Method for Spectral Enrichment of theHigh Spatial Resolution Images
FAKHEREH ALIDOOST MOHAMMAD R MOBASHERI amp ALI A ABKAR Tehran Iran
Keywords spatial resolution spectral resolution urban environments spectral mixtureanalysis image fusion
multiresolution technique (MMT) is a tech-nique that can be applied to unmix low spa-tial resolution images using information re-garding pixel composition extracted from co-registered high-resolution images This makesfusion of the low and high-resolution imagesfor synergetic interpretation possible (ZHUKOVet al 1999)High resolution remote sensing data are of
special interest for a variety of applicationsrelated to urban planning and managementHyperspectral data on the other hand pro-vide extensive spectral information that canhelp to discriminate materials (MOBASHERI ampGHAMARY ASL 2011) and (HEROLD et al 2002)
1 Introduction
There are several important un-answeredquestions regarding the spectral propertiesof urban surface materials For instance howdo these materials differ in their spectral re-sponses What are the most suitable spectralbands for mapping urban land cover Whatare spectral limitations of current high spatialresolution remote sensor systems in terms ofmapping urban land coverMerging the data collected by sensors with
different spatial and spectral resolutions mayin many cases be a valuable tool to the analyst(HAERTEL amp SHIMABUKURO 2005) Multisensor
Summary Almost all pixels located in the urbanregion imaged by highmedium spatial resolutionsensor systems are mixed To resolve this problemusually the unmixing techniques are deployed Oneof the useful unmixing methods is spectral mixtureanalysis It can be grouped into two parts of spec-tral unmixing and spatial unmixing In this studyspectral reflectance of important urban classes isdetermined using spatial unmixing method To thisend spatial information from IKONOS imageryand spectral information from Hyperion data areemployed The validity of the proposed method issubstantiated through comparison of an originalHyperion image with the reconstructed image Theexperimental results lead to a mean RMSE and amean NCC of 003 and 089 respectively In the nextstage using the extracted spectral reflectance animage with 4 m spatial resolution and 136 bands isproduced where variability of urban land covers istaken into account It is believed that this methodol-ogy will help researcher to monitor urban change aswell as urban pollution effectively
Zusammenfassung Neue Methode zur spektralenVerbesserung von raumlumlich hoch aufgeloumlsten Fern-erkundungsszenen In urbanen Gebieten besitzenFernerkundungsszenen fast ausschlieszliglich Misch-pixel Uumlblicherweise werden unmixing Methodenwie die spectral unmixing analysis verwendet Die-se laumlsst sich in die spektrale und die raumlumliche Ent-mischung gliedern Die vorliegende Untersuchunghat gezeigt dass mit Unterstuumltzung der raumlumlichenEntmischung die Identifizierung der spektralenKlassen staumldtischer Gebiete verbessert werdenkann Die Methode wurde mit IKONOS-Daten fuumlrdie raumlumliche und Hyperion-Daten fuumlr die spektra-le Information erprobt und ergab eine Genauigkeitfuumlr den RMSE von 003 und den NCC von 089Aus beiden Datensaumltzen wurde eine Bildkarte miteiner GSD von 4 m und einer spektralen Aufloumlsungvon 136 Kanaumllen hergestellt die sehr gut die Viel-falt der urbanen Landnutzung wiedergibt und dasMonitoring von Landnutzungswandel und Um-weltverschmutzung ermoumlglicht
32 Photogrammetrie bull Fernerkundung bull Geoinformation 12013
all fractions are nonnegative and sum of frac-tions equals 1In a standard application of SMA a fixed
number of sample endmembers are selectedand the entire image pixels are modeled by thespectra of the components of these samplesHowever this procedure is limited becausethe selected endmember spectra may not ef-fectively model all elements in the image or apixel may be modeled by endmembers that donot correspond to the materials located in itsfield of view (POWELL et al 2007) Multi end-member spectral mixture analysis (MESMA)allows the number and type of endmembers tovary pixel by pixel and as a result endmembervariability is taken into account
22 Determination of ClassReflectance Spectra
The determination of the radiance (or reflec-tance) spectra of the classes in each mixedpixel using spectral mixture analysis is the ob-jective of some urban research For determin-ing class reflectance spectra in one band and npixels (1) can be written as
1 11 12 1 1
2 21 22 2 2
1 2
n
n
m m m mn n
f f ff f f
f f f
λ
ρ ρρ ρ
ε
ρ ρ
⎡ ⎤ ⎡ ⎤ ⎡ ⎤⎢ ⎥ ⎢ ⎥ ⎢ ⎥⎢ ⎥ ⎢ ⎥ ⎢ ⎥⎢ ⎥ ⎢ ⎥ ⎢ ⎥⎢ ⎥ ⎢ ⎥ ⎢ ⎥⎢ ⎥ ⎢ ⎥ ⎢ ⎥⎣ ⎦ ⎣ ⎦ ⎣ ⎦
primeprime
= +
prime
(3)
where ρrsquo ƒ and ρ are n times 1 n times m and m times 1 arematrices n is the number of pixels ie num-ber of equations m is the number of classesand the number of column of the ƒ matrix andε is the model residual A constrained least-squares method is used to retrieve spectral in-formation (band-i reflectance) for each of theclass reflectance spectra (ρ) The use of a con-strained method is justified when one expectsthat the solution fulfils the following two con-ditions 1) the radiance (or reflectance) valuesmust be positive and 2) the radiance valuescannot be larger than the radiance saturationvalues of low resolution sensor (or reflectancecannot be larger than 1) In these approachesdetermination of class fractions for formingcoefficient matrix and selection of suitablepixels are of vital importance
In this work an approach that employs thelinear unmixing model is used The techniqueis expected to produce reflectance imageswith both high spectral and spatial resolutionThe data used are IKONOS multispectral andHyperion hyperspectral images in urban envi-ronments The concept of mixed pixels spec-tral mixture analysis (SMA) and MMT is dis-cussed in section 2 Section 3 illustrates theproposed method Study area and preprocess-ing steps are introduced in section 4 The ex-periments results and discussion are present-ed in section 5 Finally conclusions and rec-ommendations for MMT application in urbanenvironments are given in section 6
2 Background
21 Fraction Determination
Some approaches determine the endmem-bers in mixed pixels This is done by using theSMA technique The equations of the SMAtechnique can be given by
1
N
i iifλ λ λρ ρ ε
=
prime = +sum (1)
Where ρλprime is mixed pixel reflectance ƒi andρiλ are fraction and reflectance of ith endmem-ber in the pixel respectively and ελ is the mod-el residual taken as error involved due to theun-accounted materials as well as measure-ment errors Then for determining endmem-ber fractions (1) can be written in a matrixform as
1 11 12 1 1
2 21 22 2 2
1 2
n
n
m m m mn n
ff
f
λ
ρ ρ ρ ρρ ρ ρ ρ
ε
ρ ρ ρ ρ
⎡ ⎤ ⎡ ⎤ ⎡ ⎤⎢ ⎥ ⎢ ⎥ ⎢ ⎥⎢ ⎥ ⎢ ⎥ ⎢ ⎥⎢ ⎥ ⎢ ⎥ ⎢ ⎥⎢ ⎥ ⎢ ⎥ ⎢ ⎥⎢ ⎥ ⎢ ⎥ ⎢ ⎥⎣ ⎦ ⎣ ⎦ ⎣ ⎦
primeprime
= +
prime
(2)
where m is the number of bands ie numberof equations n is the number of endmembersie number of column of the ρ matrix Thefraction of each endmember in a pixel can becalculated using the least-squares method inwhich the residual ελ is minimized The least-squares method is subject to two constraints
Fakhereh Alidoost et al Method for Spectral Enrichment 33
extracted reflectance curves will be validatedand in the final step this information will befused to high spatial resolution image to pro-duce an image having both high spatial andspectral characteristics simultaneously Fromthis point of view the high-resolution imageis conventionally called the classifying instru-ment (CI) while the lower-resolution image iscalled the measuring instrument (MI) (ZHU-KOV et al 1999)(3) is used for the determination of the class
reflectance in one band and in n pixels TheSMA equation system and its constraints forthe determination of reflectance spectra ofeach of the classes are presented in (4)
1
( )
min0 1
T T
T
P F P VP F WF F WP
V WVP
minus
= +prime=
⎧ ⎫⎪ ⎪⎨ ⎬
le le⎪ ⎪⎩ ⎭
(4)
Where Prsquo is the mixed pixels reflectancematrix F and P are the fraction and the re-flectance matrices respectively V is the modelresidual matrix P is the estimated reflectanceandW is the weight matrixAs mentioned earlier the method consists
of the following operations1 Classification of high resolution image andextraction of the pixels class fractions
2 Window-based unmixing of the MI-pixelsfor the calculation of the reflectance spectrafor each class
3 Class reflectance spectra clustering for de-termination of class sample reflectancespectra
4 Validation5 Image fusion
31 Fraction Determination
The high spatial resolution image is used todetermine the fraction of the main class com-ponents present in the mixed pixels In manyresearches (section 2) the CI image is classi-fied using unsupervised classification tech-nique In this study in order to compare theresult of hard and soft classification in theMMT the CI image is classified into nc class-es using K-means as a hard clustering tech-
In recent years ZHUKOV et al (1999) ZURI-TA-MILLA et al (2008) ZURITA-MILLA et al(2009)MEZNEDamp ABDELJAOUED (2009) HAER-TELamp SHIMABUKURO (2005) ZENG et al (2007)BUSETTO et al (2008) AMOROS LOPEZ et al(2010) and AMOROS LOPEZ et al (2011) usedthis method for determining class reflectancespectra Subtle analysis of these works revealsthat there are a few of these researches thathave been focused on urban environments us-ing this method applied to very high spatialresolution images such as IKONOS Quick-Bird and GeoEye as well as hyperspectral im-ages such as Hyperion and AVIRISTo apply the aforementioned equations to
all bands and all pixels in the image thereare still two major problems Firstly the coef-ficient matrix (fractions matrix) may get toobig Secondly the variability of spectra withina class cannot be found ie only one spectrumcan be determined for each class To over-come these problems different solutions aresuggested A window with certain dimensionin low spatial resolution image can be used toconsider class spectra variability in the wholeimage where the central pixel will be unmixedusing characteristics of its neighbouring pix-els It is noteworthy that in this approach win-dow size and pixel size in low resolution imag-ery is important since it might produce largeerrors particularly for the case of urban areas
3 Methodology
It is believed that by using high spatial andhigh spectral resolution imagery of the samescene it is possible to extract spectral reflec-tance of sub-pixel themes However in thisprocess two assumptions are made 1) avail-ability of relatively high spatialspectral res-olution images for the scene 2) applicabilityof the linear mixing model The techniquepresented in this work is named spectral en-richment of the high-spatial resolution im-ages (SEHR) The method consists of fivesteps In the first step the high spatial resolu-tion data are used to compute the fractionalcoverage of different classes present in eachpixel In the second and third steps the frac-tions are used to look for per-pixel endmem-bers reflectance spectra In the fourth step the
34 Photogrammetrie bull Fernerkundung bull Geoinformation 12013
32 Calculation of Class Reflectance
To retrieve the class reflectance spectra theinverse linear spectral mixture analysis isused (4) The unmixing procedure for the MIpixels is performed According to ZHUKOV etal (1999) ldquothe unmixing of the MI pixels isperformed in the moving window moderdquo Inorder to unmix the central MI pixel in the win-dow contextual information of the surround-ing MI pixels is usedrdquo (Fig 1b) A n by n win-dow which is moving 1 MI pixel step at a timeis used in order to solve n2 equations to unmixthe central pixel The size of selected windowshould be kept as small as possible so that thefused image gets spectrally consistent withthe variability expected for the low spatial res-olution images (ZURITA-MILLA et al 2008) Onthe other hand the size of this window shouldbe sufficiently large to provide enough equa-tions for solving the equation system Sinceeach system of equations results in a uniquesolution the size of the selected windowsshould be appropriate to fulfil this task (ZURI-TA-MILLA et al 2008) In this study movingwindows of 3 by 3 and 5 by 5 pixels dimen-sions are used since high spectral variabilityof urban areas does not allow the use of win-dows of larger size A weighted constrainedleast-square method is deployed for derivingthe class reflectance spectra (Fig 1b) Weights
nique (MACQUEEN 1967) and Fuzzy C-meansas a soft clustering technique (BEZDEK 1981)Several nc values ranging from 3 to 20 aretested in this work In this paper a novel ap-proach is used for the determination of eachclass fraction in each mixed pixel Both CI andMI images are brought to the same coordinatesystem The fractions related to each MI pix-el are calculated using the area of each classin one mixed pixel in the map coordinate sys-tem through (5) It is important to note that inthe map coordinate system the intersection oflow and high spatial resolution pixels result inmany sub-pixel regions where they have beenconsidered in this equation (Fig 1a) There-fore these sub-pixels area that contributed tomixing reflectance spectra are considered in(5) In addition the sum-to-one and non-nega-tivity of fraction values are also satisfied
1( )
nCIj
ji MI
Af
A==
sum(5)
where ƒi is the fraction for ith class AjCI is thearea of jth polygon in ith class AMI is the areaof a mixed pixel and n is the number of poly-gons in ith class
Fig 1 (a) Fraction determination The fractions related to each MI pixel are calculated using thearea of each class (b) Weighted moving window
Fakhereh Alidoost et al Method for Spectral Enrichment 35
mixed pixels not being used in the calculationof the class reflectance spectra can be used forvalidation The validity of the proposed meth-od is substantiated through a comparison ofthe original mixed pixels with the reconstruct-ed ones As mentioned in section 3 each classhas many candidate reflectance spectra andeach mixed pixel contains several classes Forthe reconstruction of the mixed pixel differ-ent combinations of class reflectance spectraare mixed and tested with the original pixelreflectance spectra The best reconstructedmixed pixel compared to the relevant origi-nal mixed pixel is selected based on minimumroot-mean-square error (RMSE) values Thisapproach is based on MESMA technique of-fered by POWELL et al (2007)The quantitative assessment is conducted
by applying the RMSE relative error (R_Er-ror) and normalized cross correlation (NCC)(BIENIARZ et al 2011) for each reconstructedMI pixel (7 8 amp 9) Finally the mean RMSEmean R_Error and mean NCC for the wholereconstructed MI image are calculated
2
1( )
11
nC Oi i
ijRMSE j N
n
ρ ρ=
minus= =
minus
sum(7)
1
( )( )11
1
C C O Oni m i m
j C Oi
NCCn
j N
ρ ρ ρ ρσ σ=
minus minus=minus
=
sum(8)
_ 100 1O Cm m
j Om
R Error j Nρ ρρminus= times = (9)
whereN is the number of reconstructed pixelsn is the number of bands ρiC and ρiO stand for
can be calculated using spectral similarity andEuclidean distance in each window (BUSETTOet al 2008) For the spectral similarity thespectral information divergence (SID) meth-od (CHANG 1999) is used As a result largerweights are assigned to the pixels which arecloser and more similar to central pixel in eachwindow (6)
SimilarityWDistance
= (6)
33 Determination of the CandidateClass Reflectance Spectra
Having applied the aforementioned movingwindows to MI pixels a set of reflectancespectra for each class is derived (Fig 2a) It isworth noting that by averaging over this setone reflectance spectra will be assigned toeach class However this averaging proceduremisses the within-class variability Moreoverwith this averaging it becomes hard to iden-tify the noisy spectra if one is interested inTo avoid these difficulties as a novel approachthe K-means clustering technique is used inthis work Each set of reflectance spectra foreach class is clustered into ns candidate classreflectance spectra (Fig 2b)
34 Validation of the SEHRTechnique
If the class reflectance spectra and class frac-tions in the mixed pixels are accessible it ispossible to reconstruct the reflectance spectraof that mixed pixel using (1) However these
Fig 2 (a) A set of reflectance spectra for one class (b) Candidate class reflectance spectra forsame class
36 Photogrammetrie bull Fernerkundung bull Geoinformation 12013
42 Image Pre-processing
IKONOS Data
The IKONOS data consisted of one pan-chromatic image with 1 m spatial resolutionand one multi-spectral image with 4 spectralbands (bgrnir) and 4 m spatial resolution Itwas acquired on August 29 2004Geometric correction is carried out by the
supplier (National Cartographic Center ofIran) using 12000 topographic maps throughthe nearest neighbour re-sampling approach10 and 11 are used for converting IKONOS
DN data to reflectance (TAYLOR 2005) Thispreprocessing is needed for image fusion ap-proach mentioned in the previous sectionReflectance is defined as (TAYLOR 2005)
2
cos( )i
ii
L dE
πρθ
= (10)
where ρi is the unitless planetary reflectanceLi is the radiance for spectral band i at the sen-sorrsquos aperture (W(m2μmsr)) d is the Earth-sun distance Ei is the mean solar exoatmos-pheric irradiance at band i (W(m2μm)) andθ is the solar zenith angle Li can be obtainedwith the correct units from the IKONOSimage product by converting from DN to radi-ance using (12) (TAYLOR 2005)
410 ii
i i
DNLCalcoef bandwidth
times=times
(11)
reconstructed and original reflectance in ithband ρmC and ρmO are the mean of reconstructedand original reflectance in n bands (σC) and(σO) are the standard deviation of reconstruct-ed and original reflectance in n bands
35 Image Fusion
Finally a fused image is generated by replac-ing each of the CI pixels by its correspond-ing spectral signature This process results ina hyperspectralhigh spatial resolution imagewith spatialspectral variability in an urbanenvironment Spatial variability is addressedby allowing the type of reflectance spectra foreach class to vary throughout the image Spec-tral variability is addressed by allowing thenumber and type of spectra to vary from pixelto pixel as defined by POWELL et al (2007)
4 Datasets and Pre-processing
41 Study Area
The test area is located at Qods city in thesouth west of Tehran Iran An IKONOS MSand EO-1 Hyperion image with 4 m and 30 mspatial resolution respectively are supplied forthis area (Fig 3) This area is selected basedon heterogeneity of the landscape in urbanenvironment cloud free condition and smalldifference in the acquisition time of IKONOSand Hyperion images
Fig 3 Location of the study area in Qods city in the south west of Tehran Iran
Fakhereh Alidoost et al Method for Spectral Enrichment 37
high spatial resolution images it is necessaryto carry out precise registration and avoid mis-alignment errors In this paper the geocodingresults are adequate showing a RMSE of 02pixels An analysis of the MMT sensitivity tosensor errors showed that the co-registrationerrors should not exceed 10 to 20 percent ofthe low-resolution pixel size (ZHUKOV et al1999)Finally the corrected Hyperion data with
136 appropriate bands according to EO1HS-DATA (BARRY 2001) in the UTM Zone 39 NWGS-84 projection are used in this study
5 Results and Discussion
A sample subset (30 by 30 pixels) from Hy-perion image is selected as the study areaThis subset corresponds to a subset (219 by219 pixels) of the IKONOS image Both imagesubsets covering the study area are shown inFig 4 The sample site is predominantly cov-ered by urban structures ie buildings roadroofs parking lots etc The subset from Hy-perion image has no bad stripes The samplesubset is divided into two parts Part 1 is usedfor determination of class reflectance spectrausing inverse linear spectral mixture whereaspart 2 is used for validation Hereinafter part1 and 2 are called the unmixing image (UI)and validation image (VI) respectivelyFor an assessment purpose four different
schemes are deployed (Tab 1) The resultsof mean RMSE for these four schemes are
where Calcoefi is the radiometric calibra-tion coefficient (DN(mWcm2sr)) and band-widthi is the width of the spectral band i (nm)Both Calcoefi and bandwidthi for the IKONOSbands are given by TAYLOR (2005) The Earth-sun distance (d) can be obtained from any nau-tical handbook (TAYLOR 2005)
Hyperion data
An EO-1 Hyperion image acquired on August21 2004 around 1100 am local time is usedfor this study These data are available fromthe USGS website with 242 spectral bands at30 m spatial resolutionDue to the low signal-to-noise ratio for the
first few as well as the last few Hyperion spec-tral bands and also because of the heavy waterabsorption in several bands only 196 bandswere selected (bands 8 to 57 and 79 to 224) Ashift of one pixel in the line direction is cor-rected in the SWIR image data This shift oc-curs at column 128 (STAENZ et al 2002) In ad-dition an atmospheric correction is carriedout using FLAASH in ENVI 47 reg softwarewith the appropriate input data As a resultradiance is converted to reflectanceGeometric correction for Hyperion rela-
tive to geo-referenced IKONOS is done using18 ground control points (GCPs) and 7 checkpoints by the nearest neighbour re-samplingand second order of polynomial equations inPCI reg 91 software The geometric errors ob-tained for GCPs and check points are 595 mand 663 m respectively However using very
Fig 4 The sample site (a) Hyperion image (30 m) (30times30 pixels) and (b) IKONOS image (4 m)(219times219 pixels)
38 Photogrammetrie bull Fernerkundung bull Geoinformation 12013
performed with nc=3 to nc=20 where nc=10gives a minimum mean RMSE during theconstrained unmixing in six runs of the meth-od (Fig 6) For the number of classes greater
shown in Fig 5 It can be seen that the weight-ed unmixing performs better compared to un-weighted unmixing In addition image clas-sification by the Fuzzy C-means algorithmworks better compared to the K-means algo-rithm (Fig 5) So the best results are obtainedthrough the 4th schemeThe classification of CI into six and ten
classes has produced minimum mean RMSE(Fig 5 curve 4) However it should be notedthat this is not a decisive result for the bestnumber of classes in the proposed methodolo-gy because the unmixing results may vary fordifferent conditions like subset dimensionnumber of candidate reflectance spectra mov-ing window size and random rules in K-meansclustering Classification of IKONOS image is
Tab 1 The four different proposed schemes
Scheme Detail
1 IKONOS image classification using K-means algorithm and linear constrained least-squareunmixing
2 IKONOS image classification using K-means algorithm and linear weighted constrainedleast-square unmixing
3 IKONOS image classification using Fuzzy C-means algorithm and linear constrained least-square unmixing
4 IKONOS image classification using Fuzzy C-means algorithm and linear weightedconstrained least-square unmixing
Fig 5 The mean RMSE for four schemes
Tab 2 Mean errors (RMSE and R_error) andMean NCC values between reconstructed andoriginal Hyperion image
10 Number of Classes
4 Maximum number of subclasses
[0008 0183 0027] [min max mean] RMSE
[0002 3521 500] [min max mean]R_Error ()
089 Mean NCC
Fakhereh Alidoost et al Method for Spectral Enrichment 39
Fig 6 The mean RMSE for the 4th scheme
Fig 7 (a) Original Hyperion (30 m) (b) reconstructed Hyperion (30 m)
Fig 8 (a) IKONOS image (4 m) (b) fused image (4 m)
40 Photogrammetrie bull Fernerkundung bull Geoinformation 12013
(Hyperion data) with a 4 m resolution multi-spectral image (IKONOS data) The fusion ofthe Hyperion with IKONOS datasets can beconsidered as a powerful technique to differ-entiate land cover classes It was also foundthat regardless of characteristics of differentimages fusion can be carried out in featurelevel as well Although SEHR was designedfor IKONOS MS and Hyperion data it can beapplied to any two sets of image data Outputof this approach can be used to identify landcovers developing a spectral library of urbanmaterial urban air pollution monitoring ex-ploring the parameters affecting urban reflec-tance changes and energy flows
Acknowledgements
The authors wish to thank the Remote SensingDepartment of KN Toosi University of Tech-nology for their suggestions and support in thedevelopment of this study Also the authorswould like to thank the anonymous reviewersfor their comments on the manuscript We alsooffer our appreciation to the National Carto-graphic Center of Iran and the User ServicesUSGS for providing remotely sensed data
References
AMOROS-LOPEZ J GOMEZ-CHOVA L GUANTER LALONSO L amp MORENO J 2010 Multi-Resolu-tion Spatial Unmixing for MERIS and LAND-SAT Image Fusion ndash IGARSS 3672ndash3675
AMOROS-LOPEZ J GOMEZ-CHOVA L ALONSO L ampGUANTER L 2011 Regularized MultiresolutionSpatial Unmixing for ENVISATMERIS andLandsatTM Image Fusion ndash IEEE Geoscienceand Remote Sensing Letters 8 844ndash848
BARRY P 2001 EO-1 Hyperion Science Data Us-errsquos Guide
BEZDEK J 1981 Pattern Recognition With FuzzyObjective Function Algorithms ndash New YorkPlenum
BIENIARZ J CERRA D AVBELJ J REINARTZ P ampMULLER R 2011 Hyperspectral Image Resolu-tion Enhancement Based On Spectral UnmixingAnd Information Fusion ndash ISPRS XXXVIII-4W19
BUSETTO L MERONI M amp COLOMBO R 2008Combining medium and coarse spatial resolu-tion satellite data to improve the estimation of
than 9 an increase in the window size corre-sponds to an increase in the amount of error(Fig 6) all due to the fact that the larger win-dows may have more land cover variabilityAccording to section 34 the Hyperion im-
age is reconstructed for VI using defined can-didate reflectance spectra formUI (Fig 7) Therange and mean errors (RMSE and R_error)and mean NCC values between reconstructedand original Hyperion image are depicted inTab 2 The results indicate that the SEHR ap-proach is successful in retrieving urban classreflectance from the Hyperion imageThe fused image has the property of a hy-
perspectral image with 136 bands as well asa high spatial resolution image with 4 m pix-el size (Fig 8) It is important to notice thatthe accuracy of the results is influenced by thepreprocessing steps The Hyperspectral im-age was geo-referenced using a mathemati-cal polynomial model The geo-referencingresults were showing a RMSE near 02 pixelsize ie 6 m This error caused a misalloca-tion in the fused image of about 2 pixels con-sidering the spatial resolution of IKONOS im-age (4 m) and probably bad representation ofthe fused image due to this mis-registrationAlso the quality of the fused image is impact-ed by the quality of the reflectance values ofthe CI that is mentioned in section 35
6 Conclusions
In this paper a new approach (SEHR) forspectral enrichment of high spatial resolutionimages such as IKONOS was suggested Fourdifferent schemes were designed and testedto retrieve surface spectral reflectance basedon spatial unmixing processes The techniquewas performed using Hyperion and IKONOSimage dataThe estimated values for the spectral reflec-
tance were evaluated by comparing the orig-inal mixed pixels to the reconstructed onesThe results showed that the IKONOS classi-fication works better if Fuzzy C-means algo-rithm and linear weighted constrained leastsquare unmixing were deployed compared toother schemes Then the retrieved class re-flectance spectra were used to fuse a 30 m res-olution hyperspectral image with 136 bands
Fakhereh Alidoost et al Method for Spectral Enrichment 41
ZENG Y SCHAEPMAN ME WU B CLEVERS JGamp BREGT AK 2007 Using Linear Spectral Un-mixing Of High Spatial Resolution And Hyper-spectral Data For Geometric-Optical Modellingndash ISPRS XXXVI7-C50
ZHUKOV B OERTEL D LANZL F amp REINHACKELG 1999 Unmixing-Based Multisensor Mul-tiresolution Image Fusion ndash IEEE Transactionson Geoscience and Remote Sensing 1212ndash1226
ZHANG Y 2002 Problems in the fusion of com-mercial high-resolution satellite as well as Land-sat 7 images and initial solutions ndash ISPRSCommission IV WG VII7
ZURITA-MILLA R CLEVERS JG amp SCHAEPMANME 2008 Unmixing-Based Landsat TM andMERIS FR Data Fusion ndash IEEE Geoscience andRemote Sensing Letters 453ndash457
ZURITA-MILLA R KAISER G CLEVERS J ampSCHNEIDER W 2009 Downscaling time seriesof MERIS full resolution data to monitor vegeta-tion seasonal dynamics ndash Remote Sensing ofEnvironment 113 1874ndash1885
Address of the authors
FAKHEREH ALIDOOST MSc Remote Sensing Tel+98-91-98667532 e-mail falidoostsinakntuacir
MOHAMMAD R MOBASHERI PhD Associate Profes-sor Tel +98-91-21226630 e-mail mobasherikntuacir
ALI A ABKAR PhD Assistant Professor Tel +98-91-21403827 e-mail abkar kntuacir
Remote Sensing Department Faculty of Geodesyand Geomatics KN Toosi University of Technol-ogy Tehran PO Box 15875-4416 Iran Fax +98-21-88770213
Manuskript eingereicht Juni 2012Angenommen September 2012
sub-pixel NDVI time series ndash Remote Sensingof Environment 112 118ndash131
CHANG CI 1999 Spectral information divergencefor hyperspectral image analysis ndash Geoscienceand Remote Sensing Symposium IGARSS 99
HAERTEL VF amp SHIMABUKURO Y E 2005 Spec-tral Linear Mixing Model in Low Spatial Reso-lution Image Data ndash IEEE Transactions on Geo-science and Remote Sensing 2555ndash2562
HEROLD M GARDNER M HADLEY B amp ROBERTSD 2002 The Spectral Dimension in UrbanLand Cover Mapping from Highresolution Opti-cal Remote Sensing Data ndash 3rd Symposium onRemote Sensing of Urban Areas Istanbul Tur-key
MACQUEEN JB 1967 Some Methods for classifi-cation and Analysis of Multivariate Observa-tions ndash 5th Berkeley Symposium onMathemati-cal Statistics and Probability 281ndash297 Univer-sity of California Press
MEZNED N amp ABDELJAOUED S 2009 UnmixingBased Landsat ETM+ and ASTER Image FusionFor Hybrid Multispectral Image Analysis ndash Ad-vances in Geoscience and Remote Sensing 407ndash418
MOBASHERI MR amp GHAMARY ASL M 2011 Clas-sification by diagnosing all absorption features(CDAF) for the most abundant minerals in air-borne hyperspectral images ndash EURASIP Jour-nal on Advances in Signal Processing 102 1ndash7
POWELL RL ROBERTS DA DENNISON PE ampHESS LL 2007 Sub-pixel mapping of urbanland cover using multiple endmember spectralmixture analysis Manaus Brazil ndash RemoteSensing of Environment 106 253ndash267
STAENZ K NEVILLE RA amp CLAVETTE S 2002Retrieval of Surface Reflectance from HyperionRadiance Data ndash IEEE Geoscience and RemoteSensing Symposium IGARSS 3 1419ndash1421
TAYLOR M 2005 IKONOS Radiometric Calibra-tion and Performance after 5 Years on Orbit ndashCALCON 2005 Conference Logan Utah
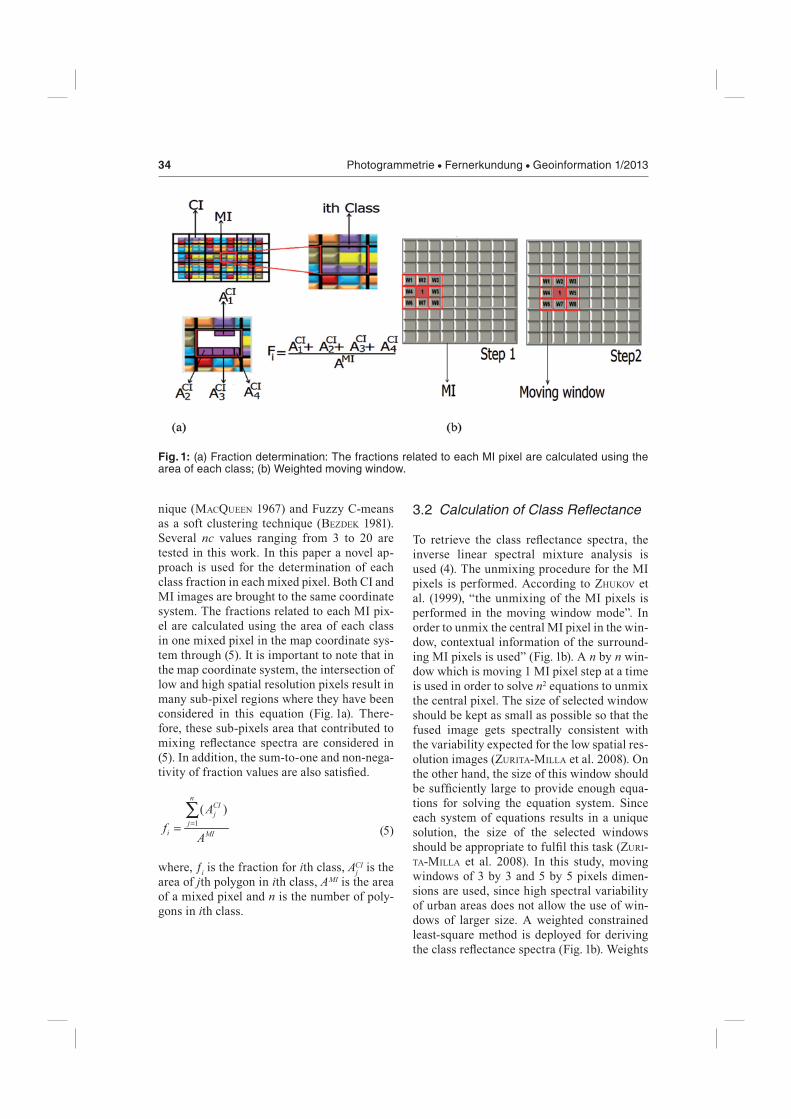
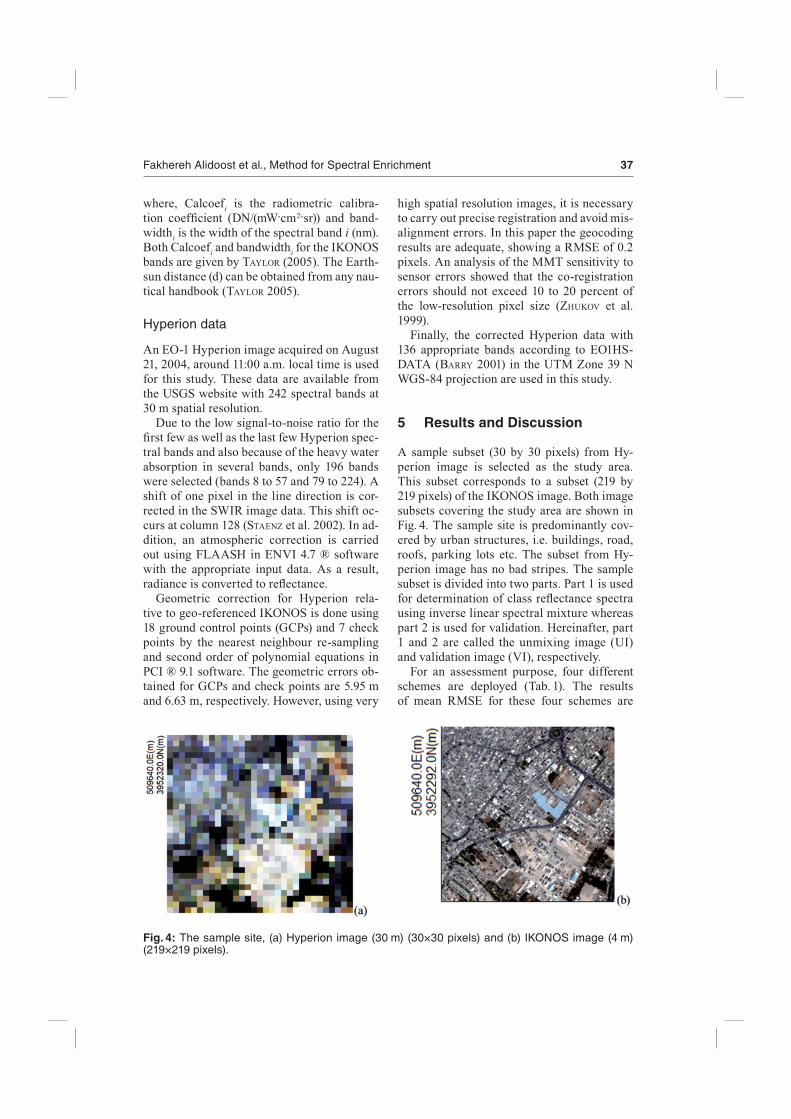
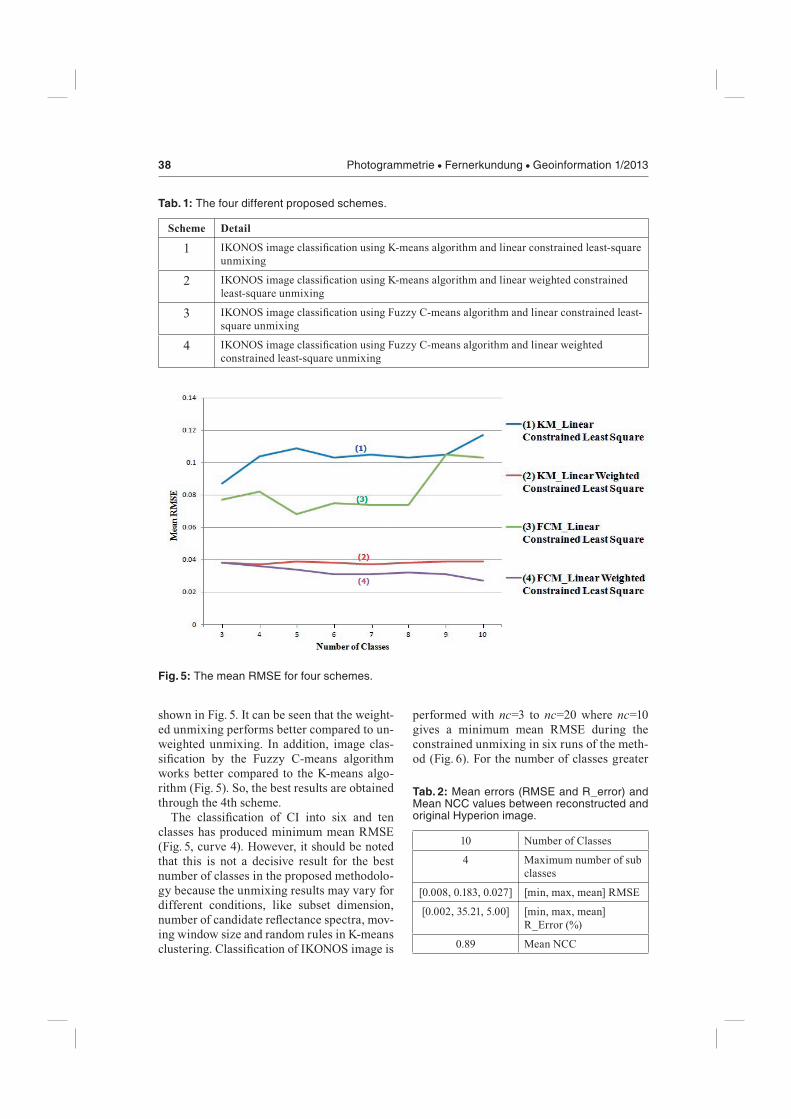
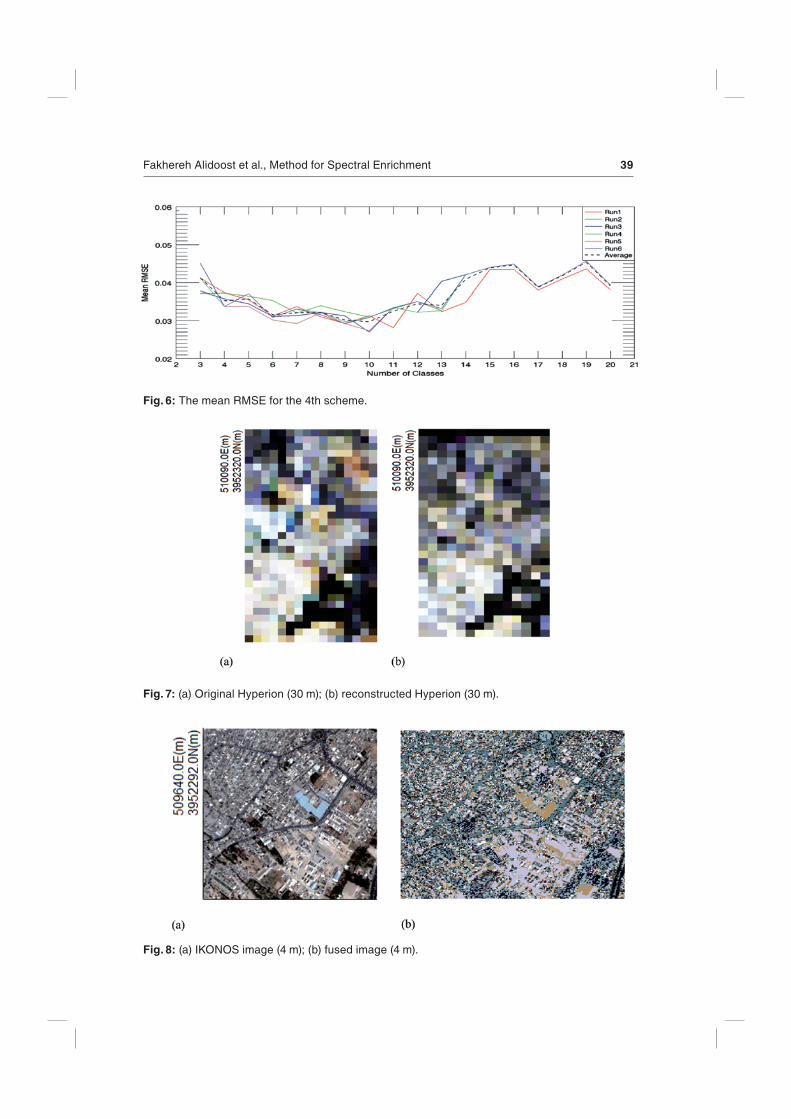


![Introducing Spectral Structure Activity Relationship (S ...mvputz.iqstorm.ro/upload/Spectral-SAR_Paper1.pdf · quantified since the derivation of the associated equation [4]. Figure](https://img.pdfslide.net/doc/110x75/5e74f9c9d5e87e133454fe36/introducing-spectral-structure-activity-relationship-s-quantified-since-the.jpg)