Embed Size (px)
Citation preview
Introduction and key messages1. Agricultural emissions: trends and drivers2. Progress against indicators3. Incentives to reduce agricultural emissions – the policy framework4. Land use, land use change and forestry

Chapter 6: Progress reducing emissions from agriculture 193
Chapter 6: Progress reducing emissions from agriculture
Introduction and key messagesIn this chapter we present the latest evidence on emissions in agriculture, which accounted for around 9% (51.2 MtCO2e) of UK greenhouse gas (GHG) emissions in 2011. We also consider the Land use, land use change and forestry (LULUCF) sector, which is a net carbon sink, absorbing 3.3 MtCO2e in 2011.
Our key messages are:
• In 2011 agriculture emissions remained unchanged from 2010 at 51.2 MtCO2e. This is the second year in a row that emissions did not follow the trend in recent years of declining agricultural emissions, which have fallen by 8% since 2003.
• Agricultural output increased by 2.5% in 2011 implying an improvement in carbon intensity. Within this, carbon intensity of livestock output improved due to increased milk yields and reduced use of fertiliser on pastureland. Crop output also increased but this was accompanied by a larger rise in nitrous oxide emissions from higher fertiliser use on arable land and soil incorporation of crop residues. This suggests the carbon intensity of crops worsened.
• Defra has now published an indicator framework to monitor progress in reducing emissions. It will be important to continue to monitor progress and develop the evidence base, and if the indicators suggest progress is not being achieved then a review should be implemented before the planned 2016 date.
• It is important to put in place measures to monitor the effectiveness of the industry-led GHG Action Plan in influencing the uptake of less carbon-intensive farming practices. In addition, the cereals and oilseeds roadmap should set targets as to how the sectors will contribute to emission reductions.
• Any review on progress towards reducing emissions from agriculture should also consider a range of policy options, including continuing with the current voluntary approach, and policies that would provide stronger incentives for farmers.
We set out the analysis that underpins these messages in four sections:
1. Agricultural emissions: trends and drivers
2. Progress against indicators
3. Incentives to reduce agricultural emissions – the policy framework
4. Land use, land-use change and forestry

194 Meeting Carbon Budgets | 2013 Progress Report to Parliament | Committee on Climate Change
1. Agricultural emissions: trends and driversEmissions data for agriculture lag that of other sectors due to the high proportion of non-CO2 emissions which take longer to collate. This chapter therefore reports on trends and drivers for 2011.
A complete assessment of progress in reducing emissions in the sector cannot currently be made due to the uncertainties over measuring emissions and current framing practices. Until these uncertainties are resolved we will continue to assess high-level progress in reducing emissions, as set out in section 2.
Emissions trends
At 51.2 MtCO2e in 2011, emissions in the agriculture sector accounted for 9.3% of total greenhouse gas emissions in the UK (Figure 6.1).
• Over half of agriculture emissions (53%) are due to agricultural soils, while enteric emissions – arising from the digestive process of cattle and sheep – account for another 30% of emissions. The remaining emissions are split between stationary and mobile combustion emissions (9%) and waste and manure management (8%) (Figure 6.2).
• Nitrous oxide (N2O) accounts for 57% of emissions in the sector, with a further 35% coming from methane and the remaining 8% from carbon dioxide (CO2).
Data in this year’s inventory has been revised upwards for the entire time series so 2010 emissions are now 1% higher than quoted in last year’s inventory (50.7 MtCO2e). One of the main reasons for the change was the upward revision in the land area of cultivated histosols (organic soils). Based on the revised series, overall agricultural emissions in 2011 remained unchanged from the previous year. However, there were marginal changes in emissions across the range of sources and gases:
• While emissions from enteric fermentation and waste and manure management declined slightly, emissions from agricultural soils and stationary and mobile combustion increased marginally.
• A breakdown by gas shows that while N2O and CO2 emissions increased, methane emissions declined. All of these changes were very small.
2011 is the second year in a row that overall emissions did not follow the longer-term trend of declining emissions (Figure 6.3):
• Since 1990, agricultural emissions have fallen by 20% from 63 MtCO2e, with reductions across all sources: agricultural soils (19%), enteric fermentation (18%), wastes and manure management (23%) and stationary and mobile combustion (19%).
• In the period since 2003, emissions for the sector have fallen by 8.5% (from 55.9 MtCO2e), with the reduction in soil emissions accounting for over half of the decline.
Due to reductions that occurred before 2010, emissions are on track to meet our emissions indicator for a 10% decline (compared to 2007) by the end of the first budget period in 2022.

Chapter 6: Progress reducing emissions from agriculture 195
Given the lack of progress in reducing emissions in the past two years, it is important to understand emissions drivers to assess whether any progress has been made in implementing measures to reduce emissions intensity.
Figure 6.1: GHG emissions from agriculture in the context of total UK emissions (2011)
Carbon dioxide0.8%
Total emissions551 MtCO2e
Methane3.2%
Nitrous oxide5.3%
Other sectors90.7%
Source: NAEI (2013).Notes: Emissions from other sectors excludes international aviation and shipping sectors.
Figure 6.2: Agriculture emissions by source (2011)
Entericfermantation
30%
Total emissions51.2 MtCO2e
Agricultural soils53%
Stationary andmobile combustion
9%
Wastes/manuremanagement
8%
Source: NAEI (2013).

196 Meeting Carbon Budgets | 2013 Progress Report to Parliament | Committee on Climate Change
Emission drivers – nitrous oxide
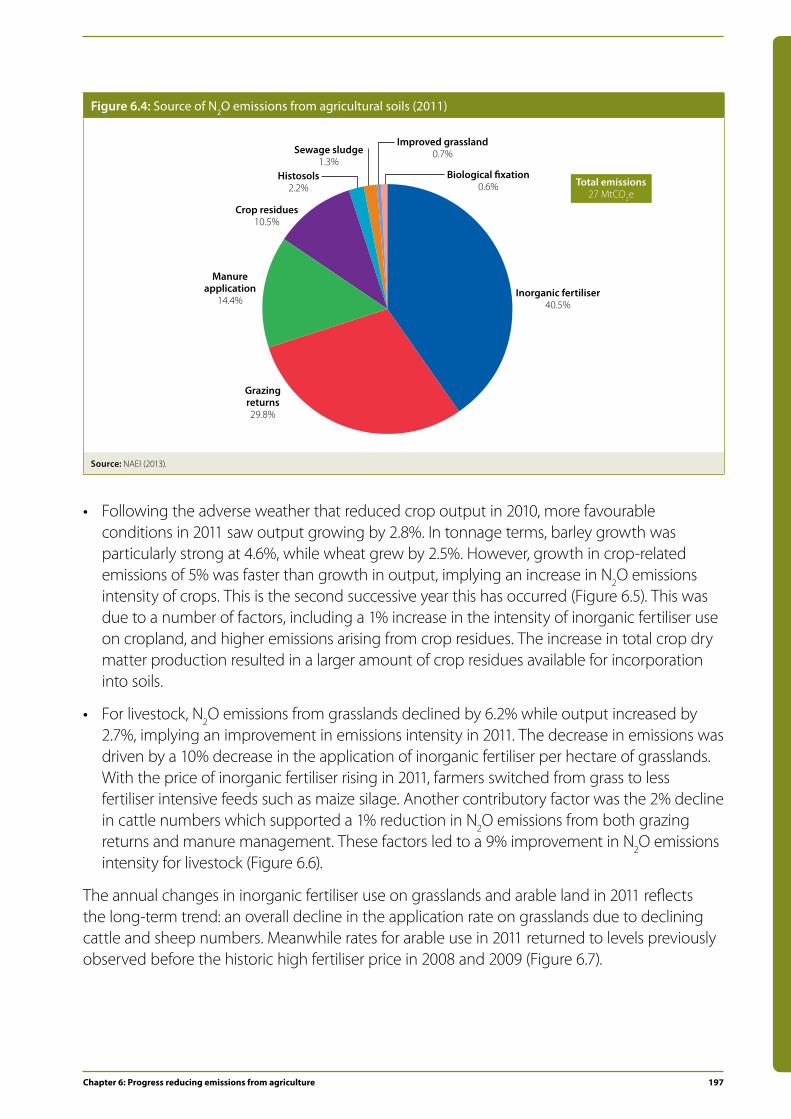
N2O emissions in agriculture occur from two main sources – soils and manure management, with the former accounting for over 90% of the emissions. N2O from agricultural soils comprise many sources, and within these, there have been year-on-year changes that help explain the overall marginal increase in N2O emissions in 2011 (Figure 6.4):
• The application of inorganic fertiliser on cropland and pastureland is the single largest source of N2O emissions from soils (40.5%) and fertiliser-related emissions declined by 1% in 2011.
• Manure deposited by grazing livestock on pastureland (i.e. grazing returns) accounted for over a quarter of N2O emissions. Emissions from this source declined 1% on the previous year.
• These reductions were offset by increased emissions from the ploughing in of crop residues (e.g. cereal straw and stubble) left over from arable harvests and the application of sewage sludge.
The impact of a slight increase in N2O emissions combined with a much higher growth (2.5%) of overall agricultural output implies a reduction in the N2O emissions intensity of agricultural output by 2.3%.
It is also useful to disaggregate the data between crops and livestock to assess whether improving emissions intensity was observed for both types of farming activities:
Figure 6.3: Agriculture CO2e emissions by source (1990-2011)M
tCO
2e
Agricultural soils
Enteric fermentation
Wastes/manureManagement
Stationary andmobile combustion
0
5
10
15
20
25
30
35
40
2010
2011
2009
2008
2007
2006
2005
2004
2003
2002
2001
2000
1999
1998
1997
1996
1995
1994
1993
1992
1991
1990
Source: NAEI (2013).
Chapter 6: Progress reducing emissions from agriculture 197
• Following the adverse weather that reduced crop output in 2010, more favourable conditions in 2011 saw output growing by 2.8%. In tonnage terms, barley growth was particularly strong at 4.6%, while wheat grew by 2.5%. However, growth in crop-related emissions of 5% was faster than growth in output, implying an increase in N2O emissions intensity of crops. This is the second successive year this has occurred (Figure 6.5). This was due to a number of factors, including a 1% increase in the intensity of inorganic fertiliser use on cropland, and higher emissions arising from crop residues. The increase in total crop dry matter production resulted in a larger amount of crop residues available for incorporation into soils.
• For livestock, N2O emissions from grasslands declined by 6.2% while output increased by 2.7%, implying an improvement in emissions intensity in 2011. The decrease in emissions was driven by a 10% decrease in the application of inorganic fertiliser per hectare of grasslands. With the price of inorganic fertiliser rising in 2011, farmers switched from grass to less fertiliser intensive feeds such as maize silage. Another contributory factor was the 2% decline in cattle numbers which supported a 1% reduction in N2O emissions from both grazing returns and manure management. These factors led to a 9% improvement in N2O emissions intensity for livestock (Figure 6.6).
The annual changes in inorganic fertiliser use on grasslands and arable land in 2011 reflects the long-term trend: an overall decline in the application rate on grasslands due to declining cattle and sheep numbers. Meanwhile rates for arable use in 2011 returned to levels previously observed before the historic high fertiliser price in 2008 and 2009 (Figure 6.7).
Figure 6.4: Source of N2O emissions from agricultural soils (2011)
Grazingreturns29.8%
Total emissions27 MtCO2e
Inorganic fertiliser40.5%
Histosols2.2%
Manureapplication
14.4%
Crop residues10.5%
Sewage sludge1.3%
Improved grassland0.7%
Biological �xation0.6%
Source: NAEI (2013).

198 Meeting Carbon Budgets | 2013 Progress Report to Parliament | Committee on Climate Change
Figure 6.5: Crop output, N2O emissions associated with crops and emissions intensity of crops (2003-2011)
2010
2011
2009
2008
2007
2006
2005
2004
2003
Inde
x 20
07=1
00
90
95
100
105
110
115
120
Crop output
Inde
x 20
07=1
00
90
95
100
105
110
115
N2O emissions intensity of crops
2010
2011
2009
2008
2007
2006
2005
2004
2003
Inde
x 20
07=1
0090
95
100
105
110
115
N2O emissions associated with crops
2010
2011
2009
2008
2007
2006
2005
2004
2003
Source: NAEI (2013), Agriculture in the UK (AUK) 2011, CCC calculations.Notes: Base Year (2007) = 100.
Figure 6.6: Livestock output, N2O emissions associated with livestock and emissions intensity of livestock (2003-2011)
Inde
x 20
07=1
00
84
88
92
96
100
104
108
Livestock output
Inde
x 20
07=1
00
84
88
92
96
100
104
108
N2O emissions intensity of livestock
2010
2011
2009
2008
2007
2006
2005
2004
2003
Inde
x 20
07=1
00
84
88
92
96
100
104
108
N2O emissions associated with livestock
2010
2011
2009
2008
2007
2006
2005
2004
2003
2010
2011
2009
2008
2007
2006
2005
2004
2003
Source: NAEI (2013), AUK 2011, CCC calculations.Notes: Base Year (2007) = 100.

Chapter 6: Progress reducing emissions from agriculture 199
Emission drivers – methane
Over 90% of methane emissions are accounted for by cattle and sheep with enteric fermentation being the main source. Pigs and poultry account for 5% of emissions, which mainly arise from waste and manure management (Figure 6.8).
Figure 6.7: Fertiliser use (2003-2011)kg
/ha
Arable
Grasslands
All
40
60
80
100
120
140
160
20102009200820072006200520042003 2011
Source: British Survey of Fertiliser Practice (2012).
Figure 6.8: Source of methane emissions by animal (2011)
Other cattle44%
Total emissions17.8 MtCO2e
Dairy cattle31%
Pigs4%
Sheep19%
Poultry1%
Other1%
Source: NAEI (2013).

200 Meeting Carbon Budgets | 2013 Progress Report to Parliament | Committee on Climate Change
In 2011, methane emissions declined by 0.5% driven by a 2% reduction in cattle numbers. Despite the reduction in the number of animals, livestock output increased in 2011 by 2.7%, with beef up 3.4%, milk up 1.7% and sheep and lamb meat up 6%. These two factors imply a reduction in methane intensity of 3.2% (Figure 6.9).
Improving methane emissions intensity can be partly explained by improving livestock productivity:
• Average milk yields increased by 3.5% in 2011, with the average dairy cow producing in excess of 7,500 litres for the year. The longer-term improvement is 14% since 2003 (Figure 6.10).
• Average dressed carcase weights for clean sheep and lamb increased by 0.5% in 2011 due to good grazing conditions. Although the average dressed carcase weight of beef and veal fell slightly (down 0.6%), high feed prices saw cattle sent to slaughter early which could indicate a fall in methane emissions per unit of output. Over the longer-term weights for beef and veal have increased by 8% since 2003 (Figure 6.11).
Figure 6.9: Total livestock output, methane emissions and methane emissions intensity of output (2003-2011)
Inde
x 20
07=1
00
90
94
98
102
106
110
Total livestock output
Inde
x 20
07=1
00
86
90
94
98
102
106
110
CH4 emissions intensity of livestock
Inde
x 20
07=1
00
86
90
94
98
102
106
110
CH4 emissions associated with livestock output
2010
2011
2009
2008
2007
2006
2005
2004
2003
2010
2011
2009
2008
2007
2006
2005
2004
2003
2010
2011
2009
2008
2007
2006
2005
2004
2003
Source: NAEI (2013), AUK 2011, CCC calculations.Notes: Base Year (2007) = 100.

Chapter 6: Progress reducing emissions from agriculture 201
However, yield alone is not a perfect indicator of changes in emissions intensity. It is important also to consider the feed conversion ratio (FCR)1, and, where applicable, other measures (e.g. fertility rates and on-farm mortality) for a more accurate assessment of emissions intensity:
1 FCR measures the amount of feed required to produce an extra kg of meat or litre of milk. An increase in the FCR could imply greater methane emissions if the increase in feed is lost as carbon via enteric emissions if not properly digested and used for growth.
Figure 6.10: Milk output per dairy cow (2003-2011)Li
tres
6,000
6,200
6,400
6,600
6,800
7,000
7,200
7,400
7,600
7,800
20102009200820072006200520042003 2011
Source: AUK (2011), NAEI (2013).
Figure 6.11: Index of average dressed carcase weight per animal (2003-2011)
Inde
x 20
07=1
00
Beef and veal
Clean sheep and lamb
90
92
94
96
98
100
102
104
20102009200820072006200520042003 2011
Source: AUK (2011).Notes: Base Year (2007) = 100.

202 Meeting Carbon Budgets | 2013 Progress Report to Parliament | Committee on Climate Change
• In the dairy sector, the ratio of dairy cow compound and blend feed to milk production has been on an upward trend since 2005 indicating that the rate of increase in feed has risen more than the rate of increase in average milk yields. This would imply reduced feed efficiency and increasing emission intensity. However in 2011, there was an improvement of 3% for dairy cattle. (Figure 6.12).
• Measuring the FCR for grazing livestock (beef cattle and sheep) is more complicated due to the difficulty in measuring the consumption of grass that make up a substantial volume of the diet. Therefore, alternative measures are required. The new indicator framework established by Defra to track progress in reducing emissions uses beef and sheep breeding regimes to assess changes in emissions intensity of grazing livestock (see Section 3).
We note, however, that given the current uncertainty attached to calculating non-CO2 emissions in the sector, it is unclear whether the required carbon intensity improvements are actually occurring. On-going work of the GHG R & D Platform (see Section 2) will eventually allow for an improved evidence base in which changes in emissions intensity can be calculated more accurately.
Emission drivers – CO2
Machinery used in agriculture makes up the bulk of CO2 emissions in agriculture and accounts for 8% of GHG emissions in this sector. In 2011 CO2 emissions rose for the second successive year:
• All of this increase comes from stationary and mobile machinery, which accounts for almost all of the CO2 emissions.
• Emissions from machinery are still 13% lower compared to 2003.
Figure 6.12: Ratio of compound and blend feed production to milk production per annum – GB (2003-2011)
Inde
x 20
07=1
00
80
85
90
95
100
105
20102009200820072006200520042003 2011
Source: AUK (2011).Notes: Base Year (2007) = 100.

Chapter 6: Progress reducing emissions from agriculture 203
In line with reductions elsewhere in the economy, there is a potential for further CO2 savings in agriculture by improving energy efficiency and more use of renewable fuel. From April this year, the Renewable Transport Fuels Obligation was extended to cover fuels used for non-road mobile machinery. Suppliers are now obliged to supply a proportion of sustainable biofuels for each litre of fuel used by tractors and other mobile farming machinery.
2. Progress against indicatorsIn our 2009 Progress Report we set out our preliminary indicators to track progress in reducing non-CO2 emissions in the agriculture sector, consistent with the Government’s ambition of 3 MtCO2e of savings by 2020 (scaled up to 4.5 MtCO2e for the UK) compared to 2007. The set of indicators comprise trajectories for reductions in emissions (by gas and source) and for changes in carbon intensity and productivity improvement:
• Average agricultural non-CO2 reductions of 10% by 2022 relative to 2007 levels.
• Average improvements in soil emissions intensity of 5% by 2022 relative to 2007 levels through improvements in fertiliser efficiency in arable and pasture.
• Average improvement in livestock emissions intensity of 18% by 2022 relative to 2007 levels, through improvements in productivity (e.g. meat yields).
Although overall emissions have been flat since 2009, emissions reductions achieved in previous years mean that the level of emissions is still consistent with our indicator trajectory (Figure 6.13). Going forward, a reduction of 0.7% is required each year to achieve the 4.5 MtCO2e of savings by 2022. Given the lack of progress in the past two years it is important that an effective monitoring framework is in place and appropriate action is taken to get back on track should this be required.
Figure 6.13: Progress against indicators for agriculture to end of the third budget period (2007-2022)
MtC
O2e
N2O indicator
Agricultural soils indicator
CH4 indicator
Enteric indicator
Wastes/manure indicator
N2O outturn
Agricultural soils outturn
CH4 outturn
Enteric outturn
Wastes/manure outturn
0
5
10
15
20
25
30
35
2021
2020
2019
2018
2017
2016
2015
2014
2013
2012
2011
2010
2009
2008
2007
2022
Source: NAEI (2013), CCC calculations based on LCTP ambition.

204 Meeting Carbon Budgets | 2013 Progress Report to Parliament | Committee on Climate Change
Since last year’s Progress Report, Defra published its own framework of indicators for monitoring progress in reducing emissions by 2022 (see Section 3). In light of this it remains to be seen whether our own indicators continue to be appropriate, especially with regard to measuring changes to the carbon intensity of livestock given that looking at meat yields alone may not be sufficient. We will return to this for next year’s progress report.
An accurate assessment of progress is not possible given the significant uncertainties in the way agricultural emissions are currently calculated. This is because the current inventory uses standard, rather than UK-specific, emissions factors that do not reflect regional differences in soil and climate, for example. The inventory also fails to take account fully of current farming practices that could already be reducing emissions. This means that both the current level of emissions and emissions reduction potential is highly uncertain.
On-going work funded by Defra and the devolved administration governments will establish an improved method for calculating the agriculture inventory that will be based on UK-specific emissions factors. The revised inventory will also reflect the adoption of mitigation practices by UK farmers. Roll-out of the new inventory is scheduled for 2015.
3. Incentives to reduce agricultural emissions – the policy frameworkIn November 2012, Defra published its review2 on progress towards reducing emissions from agriculture in England. The review represented the Government’s long standing commitment to assess the current voluntary approach to reduce agricultural emissions in England. The main points from the review relate to:
i. An assessment of the ambition to reduce emissions by 2022
ii. The establishment of an indicator framework to monitor progress
iii. Future review of progress
We now look at each of these in turn.
i. An assessment of the ambition to reduce emissions by 2022
Government analysis looked at the 3 MtCO2e level of ambition in England by 2022 and concluded that it continues to remain credible. Furthermore, in response to a CCC recommendation for an assessment of whether existing policies and incentives were sufficient to realise the level of ambition, Defra undertook a mapping exercise of seven policies and concluded that the existing policy landscape is encouraging the adoption of farming practices to deliver abatement (Box 6.1).
2 ‘2012 Review of Progress in Reducing Greenhouse Gas Emissions from English Agriculture’, (2012), Defra.

Chapter 6: Progress reducing emissions from agriculture 205
Box 6.1: New analysis and mapping of policies
Analysis of abatement potential in agriculture
In its analysis of the abatement potential in England, Defra found:
• A maximum technical abatement potential of 3.9 MtCO2e using measures that represent cost savings to farmers.
• Using survey data and expert judgement on implementation rates, the review found that of the 3.9 MtCO2e of potential abatement, 0.6-0.8 MtCO2e had already been saved by 2010.
• Using the Farmscoper3 tool and the Scottish Agricultural College (SAC) Marginal Abatement Cost Curve (MACC) an additional 3.1-3.3 MtCO2e of emissions savings were available at zero or negative cost in 2010.
• Defra noted that the maximum potential of 3.9 MtCO2e represents an overestimate of the actual potential due to a number of factors, including the failure of the Farmscoper model to consider overlaps between different methods and the assumption that all farmers implement all cost saving measures fully. Based on these uncertainties, Defra considered that 3 MtCO2e remained a more plausible level of ambition.
Mapping of policies against farm practices
The exercise mapped seven policies deemed to have most relevance to agricultural production, against farming practices able to deliver reductions in emissions:
• The strength of each policy in driving a particular mitigation method was assessed, and the analysis found that the strongest drivers overall were Catchment Sensitive Farming (CSF), Soils for Profits4, the environmental stewardship schemes under the Common Agricultural Policy and the Nitrate Vulnerable Zones (NVZs). The remaining policies were found to be less successful in incentivising the type of farming practices that would reduce emissions (e.g. Soil Protection Review, Silage, Slurry and Agricultural Fuel Oil (SSAFO) Regulations).
• Collectively, these policies were found to be important in supporting the adoption of farming practices and technologies that had delivered 0.6-0.8 MtCO2e worth of cost savings by 2010.
• Looking ahead, Defra also concluded that the existing policy landscape was well placed to support Industry in its efforts to deliver savings of 3 MtCO2e by 2022.
3 4
An assessment of the voluntary approach to deliver emissions savings by 2022
In its review of the voluntary approach (GHG Action Plan) to deliver 3 MtCO2e, Government reiterated its support for industry to take the lead, and for the progress it had achieved to date (Box 6.2). However, Government also stressed that there were certain areas in which Industry could do more:
• Seek more engagement from the rest of the supply chain (e.g. processors and supermarkets) to increase their support for on-farm reduction.
• ‘... set out the specific success criteria for how its novel approaches will encourage change and where appropriate, link the selected delivery approach to its key on farm actions’.
Industry has plans in place take on board these recommendations. They have already established good links with the Waste & Resources Action Programme’s (WRAP) supply chain Product Sustainability Forum, which will be used as a mechanism for sharing the messages of the GHG Action Plan to supply chain organisations. With regards to setting out success
3 The Farm Scale Optimisation of Pollutant Emission Reduction (Farmscoper) decision support tool evaluates the impact of specific mitigation methods on a wide range of environmental pollutants.
4 The Soils for Profit (S4P) project works with farmers to help them improve their management of soils, nutrients, and manures.

206 Meeting Carbon Budgets | 2013 Progress Report to Parliament | Committee on Climate Change
criteria, Industry plan to work with the Campaign for the Farmed Environment’s Evidence and Monitoring group and Defra to identify the most suitable indicators of on-farm practice. However, Industry and Defra5 have noted the difficulty of attributing changes in on-farm practices directly to the GHG Action Plan due to the wide variety of existing factors (both voluntary and regulatory) that exert influence on farmers. On this basis, while Industry considers the Plan will help support emissions reduction, it is less sure how it can gauge its performance. We consider, however, that it is important for Industry to put in place measures to monitor the effectiveness of the Plan in influencing the uptake of less carbon-intensive farming practices.
Further to the above recommendations, we recommend that consistent with the livestock road maps, targets should be set as to how the cereals and oilseeds sector will contribute to emissions reductions.
Box 6.2: The second phase (2012-15) of the GHG Action Plan
The main highlights from the first year of the second phase of the GHG Action Plan include:
• The GHG Action Plan joined other industry voluntary initiatives under the umbrella organisation of the Campaign for the Farmed Environment (CFE)6. This will enable the GHG Action Plan to benefit from the CFE’s extensive communications links and access to the technical expertise of the Evidence and Monitoring group, which will be used to support work to evaluate and agree key indicators of activity and progress for the GHG Action Plan.
• The move has also enabled the GHG Action Plan to secure the services of a part-time co-ordinator to take its work forward. This will include the testing of the Farm-Efficiency Hub with external advisors, which if all goes well, is expected to be launched within the year. The hub is intended to be main source of approved guidance and information for farmers and their advisors.
• The Home Grown Cereals Authority (HGCA) published an environmental road map that sets out how the cereals and oilseeds sector could contribute to the GHG Action Plan. The road map identified four main areas for reducing emissions through improving efficiency of nitrogen use, increasing crop yields, using alternative sources of nitrogen and reducing on-farm energy use and fossil fuel dependency. We recommend that the sector follows the approach of the livestock roadmaps by setting out how it intends to achieve emissions reductions with the setting of targets against each of the main areas identified.
• Industry’s ‘Tried and Tested’ nutrient management team launched a new guide and tool7 to support improved feed efficiency of cattle and sheep. In addition to supporting emissions reductions, improving the efficiency of feed can deliver additional benefits of improved animal health and profitability. In the first instance, it is planned to distribute the Tried and Tested feeding plan to around 10,000 farmers on request, and promote the plan through the supply chain for beef and lamb products.
• In the absence of any standard for advisors of animal feed nutrition, the Feed Adviser Register (FAR) was launched last month and will enable advisors to demonstrate professional competence. To be registered, advisors with less than a year of experience will have to undertake 12 months of supervised work, while continued membership will require verification of core competencies. FAR is the feed industry’s contribution to the GHG Action Plan and advice will deliver benefits in terms of production efficiencies and reduced emissions.
6 7
5 Defra (2013), ‘Review of Partnership Approaches for Farming and the Environment Policy Delivery’.6 The Campaign is supported by a wide partnership of organisations that recognise the importance of voluntarily managing the farmed environment.7 ‘Feed planning for cattle and sheep’ (2013).

Chapter 6: Progress reducing emissions from agriculture 207
ii. The establishment of an indicator framework to monitor progress
In our 2012 Progress Report, we noted that the evidence base for assessing progress in reducing emissions remained incomplete, and as such a framework of indicators and supporting data on farming practice should be established as a matter of urgency.
Defra has now established a framework that that will capture ten indicators, against which progress to reduce emissions will be measured. The indicators cover three broad themes: farmers’ attitudes, the adoption of mitigation measures and indicators to measure the GHG emission intensity of production (Table 6.1). According to Defra, the uptake of mitigation methods set out in the indicator framework had produced savings of 1.2 MtCO2e by early 2012. Progress will be monitored annually, and the first year of data will be published this July. We will look at the results for next year’s progress report.
Table 6.1: Defra Indicators to monitor progress in reducing agricultural emissions
Overarching Indicators Description
1. Attitudes and knowledge This indicator aims to measure awareness of the sources of emissions and intentions to change practice. Seven attitudinal questions were asked in this year’s Farm Practice Survey, which included the following:
• How important do you feel it is to consider GHGs when taking decisions about your farm?
• To what extent do you agree that reducing your farm’s GHG emissions will contribute to your overall profitability?
• Where on your farm do you think GHGs come from?
2. Uptake of mitigation measures Uptake of mitigation measures across five activity groups is being monitored:
• Nutrition management
• Livestock nutrition
• Livestock breeding
• Land and soil management
• Plants with improved nitrogen use efficiency
3. Soil nitrogen balance The soil nitrogen balance provides a measure of the total loading of nitrogen (inorganic and organic) on agricultural soils. A surplus implies pollutant losses to the environment.
Sector specific Indicators Description
4. Feed conversion ratio for pigs A reduction in the feed conversion ratio (FCR) implies improving carbon intensity through feed efficiency. In the last 10 years Defra note that the FCR has increased.
5. Beef and sheep breeding regimes This indicator will track the percentage of farms using bulls or rams with a high Estimated Breeding Value (EBV). The EBV is an estimate of the genetic merit an animal has for a measured trait or characteristic. A selection of useful traits can improve productivity and efficiency thereby implying improving carbon intensity.

208 Meeting Carbon Budgets | 2013 Progress Report to Parliament | Committee on Climate Change
Table 6.1: Defra Indicators to monitor progress in reducing agricultural emissions
6. Dairy cow feed production to milk production
Increasing milk yields by a larger rate than an increase in feed input (dry matter) implies an improvement in feed efficiency and therefore a reduction in carbon intensity. However, as Defra points out the indicator requires further improvement as the quantity of dry matter feed produced will be determined by changes in the availability of other feeds such as on-farm feed and forage grass.
7. Feed conversion ratio for poultry The quantity of poultry feed produced per kg of poultry meat (dressed carcase weight) is a proxy for carbon intensity. In the last ten years, the FCR has increased slightly implying a worsening of carbon intensity.
8. Cereals and other crops – manufactured fertiliser application
Increased use of nitrogen fertiliser (as measured here by the ratio of the weight of crops produced to the weight of the manufactured fertiliser applied) implies a reduction in carbon intensity. To avoid year-on-year fluctuations arising from random events (e.g. bad weather), the indicator will be based on a five-year moving average. The indicator will track five cereal crops (wheat, winter barley, spring barley, winter oil seed rape and sugar beet).
9. Slurry and manure This indicator will track up-take of five measures that can minimise emissions through improving the handling and storage of manure and slurry. These include the installation of covers to slurry stores and the use of liquid/solid manure separation techniques.
10. Organic fertiliser application This indicator will track up-take of five practices that can minimise emission from the use of organic fertiliser. These include the use of slurry injection application techniques and use of a manure spreader calibration.
Source: Defra.
iii. Future review of progress and new policy options
Defra has stated that it will not commit to a further review of progress until 2016 at the earliest, by which time it will be able to take stock of the new agricultural inventory and the completion of the second phase (2012-2015) of the GHG Action Plan. However, we support the intention to bring forward a review in the event that its indicators suggest that there is insufficient progress being made. On the basis of an improved evidence base, we also suggest that Defra widen the scope of any review to consider a range of policy options, including continuing with the current voluntary approach and policies which would provide stronger incentives for farmers. To date Defra has stated that it will not specify targets or trigger points for policy intervention.

Chapter 6: Progress reducing emissions from agriculture 209
4. Land use, land use change and forestry
Emissions trends
The Land use, land use change and forestry (LULUCF) sector continued to be a net carbon sink, absorbing 3.3 MtCO2e more than was emitted in 2011 (Figure 6.14). However, a 3% decline in the amount of carbon sequestrated meant that for the second successive year net emissions increased, up 10% in 2011:
• Forestry is the single largest source of sequestration, accounting for just under half of the carbon absorbed in 2011. Grasslands accounted for a further 39% of sequestration. For both land types, net carbon absorbed declined in 2011 compared to the previous year.
• Over 60% of LULUCF emissions arise from cropland, but in 2011 levels declined by 4.1% driven by the reduction in emissions from land converted to cropland. The other significant source of net emissions is settlements, which produced a 1% increase in emissions due to the conversion of more land to settlements.
The increase in net emissions is due to the declining ability of existing forestry to absorb carbon due to the sharp fall in tree planting rates at the beginning of the 1990s. This is reflected in the age distribution of the standing volume of conifers and broadleaves, with only around 2% of the total volume less than 20 years of age (Figure 6.15). According to projections by DECC and the Centre for Ecology and Hydrology, under the worst case scenario, the LULUCF sector could become a net carbon emitter as early as 2013.
Figure 6.14: LULUCF emissions/removals (1990-2011)
MtC
O2e
-30
-20
-10
0
10
20
30 Other
Settlements
Cropland
Forest land
Grassland
Net emissions
2009
2008
2007
2006
2005
2004
2003
2002
2001
2000
1999
1998
1997
1996
1995
1994
1993
1992
1991
1990
2010
2011
Source: NAEI ((2013).

210 Meeting Carbon Budgets | 2013 Progress Report to Parliament | Committee on Climate Change
Opportunities to reduce land use emissions
There is a range of options that can be employed to increase carbon sequestration and reduce the release of emissions in the LULUCF sector. This includes the expansion of woodland cover.
Forestry
Woodland accounts for only 13% of the total UK land area, well below the EU average of 44%. On this basis, we reiterated in last year’s progress report our recommendation first made in the Fourth Carbon Budget report, for an increase in UK tree-planting rates, equivalent to 10,000 hectares a year by 2030. Since then:
• In July 2012, the Independent Panel on Forestry, which was set up by Defra to look at the future direction of forestry and woodland policy in England, published its recommendations. With regards to expanding woodland area, the panel recommended Government commit to an ambition to increase woodland cover from 10% to 15% by 2060. This would entail a planting rate of 15,000 hectares a year.
• The panel’s recommendation was based on a limited economic assessment and was deemed unsustainable by Defra and the Forestry Commission. Defra subsequently set a lower level of ambition of 12% by 2060, which equates to an annual average of 5,000 hectares. The ambition is contingent on private investment taking the lead and Government assuming an enabling role (e.g. developing new ways of encouraging growth and removing barriers).
Figure 6.15: Age profile of GB woodland 00
0 m
3
Conifers
Broadleaf
0-20 21-40 41-60 61-80 81-100 100 plus0
20,000
40,000
60,000
80,000
100,000
120,000
140,000
160,000
Source: National Forest Inventory (Forestry Commission).Notes: As measured by the standing volume of conifer and broadleaf trees (000 m3).

Chapter 6: Progress reducing emissions from agriculture 211
• Forestry is a devolved matter, and elsewhere targets have also been set to increase woodland area, although results to date have been mixed:
– Scotland: a rural development scheme8 to fund the ambition for an additional 100,000 hectares between 2012 and 2022 has already delivered positive results with planting rates nearly doubling in 2011 compared to the previous year. This accounted for most of the 50% increase in UK planting in the same year (Figure 6.16).
– Wales: in our 2013 report on progress in reducing emissions in Wales9, we noted that Wales was still some way off from the 3,000 ha/year (2010-30) target, with levels reaching only 300 hectares in 2011.
– Northern Ireland: with a target to double woodland cover to 12% by 2056, planting rates will have to increase to 1,700 ha/year, which is well above current rates of around 300 hectares.
If all these targets are met, they would be close to meeting the CCC recommendation for 2030. Therefore England, Wales and Northern Ireland should look to mirror the achievements made in Scotland by progressing plans to meet their own targets. We will continue to monitor progress in next year’s progress report.
8 The Woodland Creation Grant.9 CCC (2013) ‘Progress on reducing emissions and preparing for climate change in Wales’.
Figure 6.16: New planting in the UK (1990-2011)00
0 he
ctar
es
Northern Ireland
Wales
England
Scotland
2009
2008
2007
2006
2005
2004
2003
2002
2001
2000
1999
1998
1997
1996
1995
1994
1993
1992
1991
1990
2010
2011
0
5
10
15
20
25
Source: Forestry Commission, Forest Service, grant schemes.Notes: 1. Non-FC/FS figures are based on areas for which grants were paid during the year. Estimate of areas planted without grant aid are also included (where possible), although non-grant aided planting may be under-represented in the figures. Figures for grant-aided planting under Rural Development Contracts in Scotland relate to calendar years. 2. The planting season lies both sides of 31 March, and the weather can cause planting to be advanced or delayed. 3. Includes natural colonisation.

212 Meeting Carbon Budgets | 2013 Progress Report to Parliament | Committee on Climate Change
Key findings
• Agriculture emissions remained unchanged from 2010 at 51.2 MtCO2e, but given reductions in previous years, agriculture remains on track to broadly meet its contribution to meeting the first carbon budget.
• While an increase in inorganic fertiliser use on arable land contributed to a worsening carbon intensity of crops, a reduction in fertiliser use on grasslands supported an improvement in the carbon intensity of livestock products.
• We welcome the publication of Defra’s indicator framework to monitor progress in reducing emissions. The indicators should be kept under review to ensure they remain comprehensive and relevant.
• Consistent with the livestock road maps, targets should be set as to how the cereals and oilseeds sector will contribute to emissions reductions.
• Industry should set out plans to assess the effectiveness of the Industry Action Plan to provide confidence that the voluntary approach is influencing farming practices and achieving emissions reductions.
• If needed, a review should be implemented before the planned 2016 date, and the Government should consider a range of policies that would provide stronger incentives for farmers.

213
Tabl
e 6.
1: T
he C
omm
ittee
’s ag
ricul
ture
indi
cato
rs
AG
RICU
LTU
REBu
dget
1Bu
dget
2Bu
dget
320
11 tr
ajec
tory
2011
out
turn
Hea
dlin
e in
dica
tors
Emis
sion
s (in
dica
tive
% c
hang
e fr
om 2
007
refle
ctin
g LC
TP a
mbi
tion
scal
ed to
UK)
CO2e
emis
sion
s -3
%-6
%-9
%-2
.5%
-2.2
%
GH
G e
mis
sion
s (%
cha
nge
in tC
O2e
agai
nst
2007
)
N2O
-1%
-3%
-4%
-1.1
%-1
.0%
CH4
-6%
-12%
-18%
-4.7
%-4
.1%
CO2*
n/a
n/a
n/a
n/a
n/a
Sour
ce e
mis
sion
s (%
cha
nge
in tC
O2e
agai
nst
2007
)
Soils
-1%
-3%
-4%
-1.2
%-0
.8%
Ente
ric fe
rmen
tatio
n-5
%-1
0%-1
5%-4
.0%
-4.2
%
Ani
mal
was
te-7
%-1
3%-2
0%-5
.4%
-5.5
%
Mac
hine
ry/f
uels
*n/
an/
an/
an/
an/
a
Dri
vers
**
tN2O
em
issi
ons
per t
hous
and
hect
ares
of
arab
le a
nd m
anag
ed p
astu
re20
07 =
2.2
32.
202.
172.
142.
212.
22
tCH
4 em
issi
ons
per t
onne
of c
attle
and
cal
f m
eat,
dres
sed
carc
ase
wei
ght
2007
= 9
.06
8.60
8.14
7.69
9.06
8.84
tCH
4 em
issi
ons
per t
hous
and
litre
s of
milk
2007
= 0
.41
0.40
0.39
0.36
0.34
0.40
tCH
4 em
issi
ons
per t
onne
of s
heep
and
lam
b m
eat,
dres
sed
carc
ase
wei
ght
2007
= 1
1.23
10.4
29.
628.
8110
.75
10.4
1
tCH
4 em
issi
ons
per t
onne
of p
ig m
eat,
dres
sed
carc
ase
wei
ght
2007
= 1
.12
1.06
1.00
0.95
1.08
0.92
tCH
4 em
issi
ons
per t
onne
of p
oultr
y, d
ress
ed
carc
ase
wei
ght
2007
= 0
.18
0.17
0.16
0.15
0.18
0.17

214 Meeting Carbon Budgets | 2013 Progress Report to Parliament | Committee on Climate Change
Tabl
e 6.
1: T
he C
omm
ittee
’s ag
ricul
ture
indi
cato
rs
AG
RICU
LTU
REBu
dget
1Bu
dget
2Bu
dget
320
11 tr
ajec
tory
2011
out
turn
Supp
ortin
g in
dica
tors
Farm
ing
Prac
tice
Mea
sure
s w
here
gre
ater
con
fiden
ce e
xist
s (e
.g. p
rove
n te
chno
logy
, con
side
red
best
pra
ctic
e, c
onsi
sten
t aba
tem
ent r
esul
ts) b
ut u
ncer
tain
ty a
bout
bas
elin
e us
e.
Nut
rient
man
agem
ent –
incl
udin
g im
prov
ed
min
eral
and
org
anic
N ti
min
g, s
epar
atin
g sl
urry
an
d m
iner
al N
, usi
ng c
ompo
sts,
and
mak
ing
full
allo
wan
ce fo
r man
ure
N
% o
f hec
tare
s w
here
m
easu
res
are
in p
lace
Bett
er e
vide
nce
abou
t cur
rent
farm
ing
prac
tice
is re
quire
d to
dev
elop
full
traj
ecto
ries.
Live
stoc
k m
anag
emen
t – in
clud
ing
bree
ding
fo
r fer
tilit
y an
d pr
oduc
tivit
y%
of l
ives
tock
of d
iffer
ent
prod
uctio
n/fe
rtili
ty e
ffici
ency
Bett
er e
vide
nce
abou
t cur
rent
farm
ing
prac
tice
is re
quire
d to
dev
elop
full
traj
ecto
ries.
Man
ure
man
agem
ent
% o
f man
ure/
slur
ry s
tore
d in
co
vere
d ta
nks
or la
goon
sBe
tter
evi
denc
e ab
out c
urre
nt fa
rmin
g pr
actic
e is
requ
ired
to d
evel
op fu
ll tr
ajec
torie
s.
Ana
erob
ic D
iges
tion
Inst
alle
d A
D c
apac
ity
usin
g m
anur
es (M
W)*
**31
6810
2Le
ss th
an 1
% o
f hol
ding
s ha
ve A
D (2
011)
Mea
sure
s th
at re
quir
e fu
rthe
r evi
denc
e to
est
ablis
h ap
prop
riat
enes
s an
d eff
ecti
vene
ss in
UK
and
in re
gion
al c
onte
xts
Soil
man
agem
ent (
redu
ced
tilla
ge/d
rain
age)
, ni
trifi
catio
n in
hibi
tors
, and
usi
ng m
ore
N-e
ffici
ent p
lant
s (sp
ecie
s int
rodu
ctio
n an
d im
prov
ed N
-use
pla
nts)
% o
f hec
tare
s w
here
m
easu
res
are
in p
lace
Not
sui
tabl
e fo
r all
hect
ares
.Re
quire
s de
velo
pmen
t of e
vide
nce
base
to re
solv
e po
ssib
le c
onfli
cts
with
oth
er g
oals
and
to d
eter
min
e ap
plic
abili
ty,
GH
G b
enefi
ts a
nd c
osts
und
er d
iffer
ent c
ondi
tions
.
Live
stoc
k m
anag
emen
t (in
clud
ing
mai
ze s
ilage
an
d di
etar
y ad
ditiv
es in
form
of p
ropi
onat
e pr
ecur
sors
or i
onop
hore
s)
% o
f liv
esto
ck c
onsu
min
g di
ffere
nt d
iets
and
fe
ed a
dditi
ves
Not
sui
tabl
e fo
r all
anim
als/
farm
s.W
e w
ill m
onito
r the
dev
elop
men
t of t
he e
vide
nce
base
aro
und
thes
e m
easu
res,
incl
udin
g ap
plic
abili
ty, n
et G
HG
ben
efits
an
d re
solu
tion
of p
ossi
ble
confl
icts
with
oth
er s
ecto
r goa
ls.
Polic
y M
ilest
ones
Phas
e 2
deliv
ery
of G
HG
AP:
• Ro
ll-ou
t of I
ndus
try
info
rmat
ion
hub
•
Esta
blis
h ba
selin
e fa
rmin
g pr
actic
e an
d fr
amew
ork
to m
onito
r pro
gres
s
2013
-14
Hub
to b
e te
sted
by
exte
rnal
adv
isor
s 20
13O
n-go
ing
Gov
ernm
ent p
olic
y re
view
on
volu
ntar
y ap
proa
ch (2
012)
:
• D
evel
opm
ent o
f pol
icy
optio
ns fo
r int
erve
ntio
n
• Se
t trig
gers
for i
nter
vent
ion
End
2012
End
2012
Revi
ew d
ecid
ed
not t
o se
t trig
gers
no
r con
side
r pol
icy
optio
ns
On-
goin
g m
onito
ring
of v
olun
tary
app
roac
h:
• Br
ing
forw
ard
2016
Rev
iew
if p
rogr
ess
off-t
rack
•
Revi
ew s
houl
d co
nsid
er p
olic
y op
tions
for i
nter
vent
ion
2013
-201
5O
n-go
ing

215
Tabl
e 6.
1: T
he C
omm
ittee
’s ag
ricul
ture
indi
cato
rs
AG
RICU
LTU
REBu
dget
1Bu
dget
2Bu
dget
320
11 tr
ajec
tory
2011
out
turn
Dev
elop
men
t of s
mar
t inv
ento
rySe
t mile
ston
es fo
r de
liver
y20
14 (1
st p
hase
)Pr
ojec
ts u
nder
way
Oth
er d
river
s
Crop
s/so
ils: C
rop
yiel
ds (e
.g. c
erea
ls),
crop
ping
are
as, N
2O e
mis
sion
s pe
r hec
tare
of c
ultiv
ated
land
, N2O
em
issi
ons
per u
nit o
f fer
tilis
er u
se, o
utpu
t of p
rodu
ct p
er u
nit o
f fer
tilis
er u
se.
Live
stoc
k: tC
H4/t
onne
dre
ssed
car
case
wei
ght (
catt
le &
cal
ves)
, wei
ght o
f car
case
pro
duce
d pe
r day
of a
ge, c
alve
s pr
oduc
ed p
er c
ow p
er y
ear.
Gen
eral
: We
will
mon
itor d
evel
opm
ent o
f the
evi
denc
e ba
se a
nd R
&D
sup
port
for t
he v
ario
us m
itiga
tion
mea
sure
s. W
e w
ill a
lso
trac
k up
com
ing
CAP
refo
rm n
egot
iatio
ns (t
o be
com
plet
e by
201
4) a
nd
impl
icat
ions
for f
arm
ing
prac
tice
and
emis
sion
s.
LAN
D U
SE, L
AN
D U
SE C
HA
NG
E A
ND
FO
REST
RYBy
203
0
Hea
dlin
e in
dica
tor
Emis
sion
s (a
nnua
l sav
ings
from
car
bon
sequ
estr
atio
n by
203
0)
CO2 s
eque
ster
ed1
MtC
O2e
Supp
ortin
g in
dica
tors
UK
woo
dlan
d pl
antin
gA
t lea
st 2
1,00
0 he
ctar
es/y
ear f
rom
201
5
Polic
y M
ilest
ones
Dev
elop
men
t and
impl
emen
tatio
n of
a w
oodl
and
crea
tion
prog
ram
me
Gov
ernm
ent h
as s
et a
mbi
tion
for E
ngla
nd o
f ave
rage
rate
of 5
,000
ha/y
ear b
y 20
60
*
CO2 a
bate
men
t pot
entia
l not
fact
ored
into
firs
t thr
ee b
udge
t per
iods
.
** B
road
ly c
onsi
sten
t with
LC
TP a
mbi
tion
and
indu
stry
road
map
s. U
K In
vent
ory
at p
rese
nt w
ill n
ot fu
lly c
aptu
re re
duct
ions
in e
mis
sion
s as
a re
sult
of u
ptak
e of
par
ticul
ar m
easu
res.
Inte
nsit
y in
dica
tors
for
budg
et p
erio
ds a
ssum
e co
nsta
nt o
utpu
t. Sh
ould
out
put e
xcee
d as
sum
ed le
vels
then
low
er in
tens
ities
wou
ld b
e ne
eded
to d
eliv
er a
bsol
ute
emis
sion
s re
duct
ion.
**
* H
andl
ing
beef
, dai
ry a
nd p
ig m
anur
es a
nd s
lurr
ies.
**
** 2
007
base
line
= 10
.7 th
ousa
nd h
ecta
res.
Sou
rce:
For
estr
y st
atis
tics
2010
, figu
re 1
.4.
Not
e: N
umbe
rs in
dica
te a
mou
nt in
last
yea
r of b
udge
t per
iod
i.e. 2
012,
201
7, 2
022.
Key:
■
Hea
dlin
e in
dica
tors
■
Impl
emen
tatio
n in
dica
tors
■
Mile
ston
es
■ O
ther
driv
ers