Embed Size (px)
Citation preview

INTRODUCTION TO ANALYTICALULTRACENTRIFUGATION

ii
INTRODUCTION TO ANALYTICAL
ULTRACENTRIFUGATIONGREG RALSTON
DEPARTMENT OF BIOCHEMISTRYTHE UNIVERSITY OF SYDNEY
SYDNEY, AUSTRALIA

iii
iv
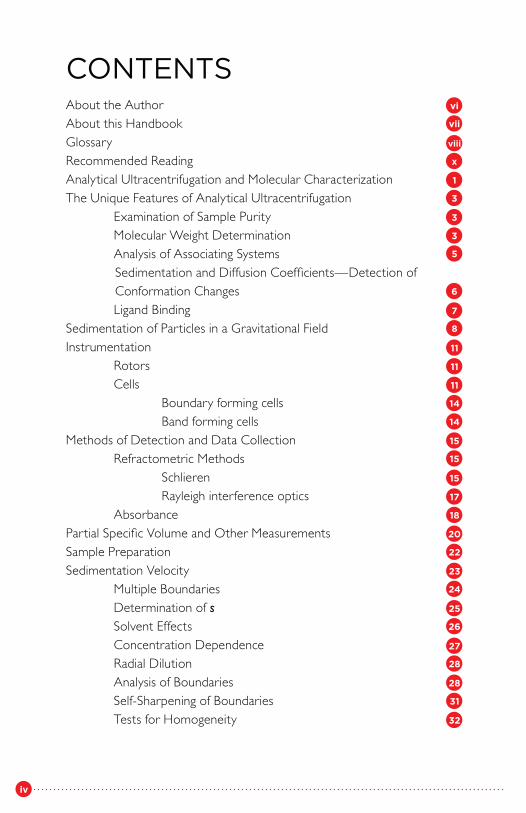
CONTENTSAbout the AuthorAbout this HandbookGlossaryRecommended ReadingAnalytical Ultracentrifugation and Molecular CharacterizationThe Unique Features of Analytical Ultracentrifugation Examination of Sample Purity Molecular Weight Determination Analysis of Associating Systems
Sedimentation and Diffusion Coefficients—Detection of Conformation Changes
Ligand Binding Sedimentation of Particles in a Gravitational FieldInstrumentation Rotors Cells Boundary forming cells Band forming cellsMethods of Detection and Data Collection Refractometric Methods Schlieren Rayleigh interference optics AbsorbancePartial Specific Volume and Other MeasurementsSample PreparationSedimentation Velocity Multiple Boundaries Determination of s Solvent Effects Concentration Dependence Radial Dilution Analysis of Boundaries Self-Sharpening of Boundaries Tests for Homogeneity
vi
vii
viii
x
1
3
3
3
5
6
7
8
11
11
11
14
14
15
15
15
17
18
20
22
23
24
25
26
27
28
28
31
32
v
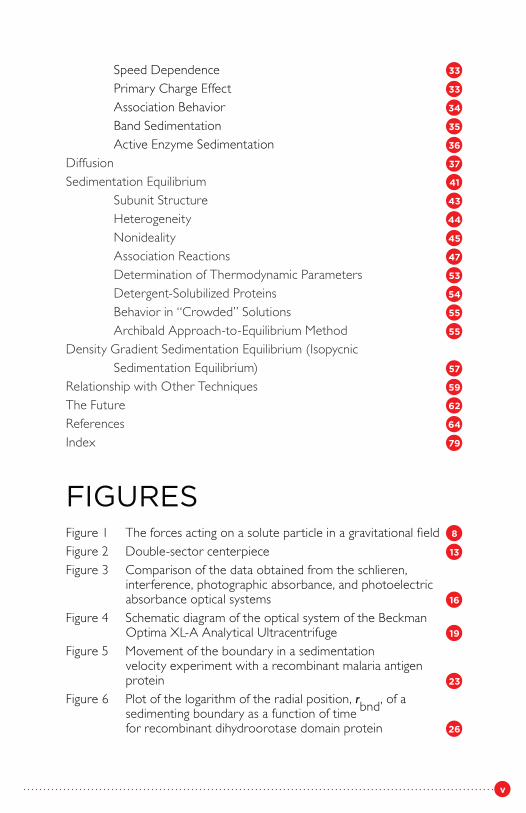
Speed Dependence Primary Charge Effect Association Behavior Band Sedimentation Active Enzyme Sedimentation Diffusion Sedimentation Equilibrium Subunit Structure Heterogeneity Nonideality Association Reactions Determination of Thermodynamic Parameters Detergent-Solubilized Proteins Behavior in “Crowded” Solutions Archibald Approach-to-Equilibrium Method Density Gradient Sedimentation Equilibrium (Isopycnic Sedimentation Equilibrium) Relationship with Other TechniquesThe Future References Index
FIGURESFigure 1 The forces acting on a solute particle in a gravitational fieldFigure 2 Double-sector centerpieceFigure 3 Comparison of the data obtained from the schlieren,
interference, photographic absorbance, and photoelectric absorbance optical systems
Figure 4 Schematic diagram of the optical system of the BeckmanOptima XL-A Analytical Ultracentrifuge
Figure 5 Movement of the boundary in a sedimentationvelocity experiment with a recombinant malaria antigenprotein
Figure 6 Plot of the logarithm of the radial position, rbnd, of asedimenting boundary as a function of time for recombinant dihydroorotase domain protein
33
33
34
35
36
37
41
43
44
45
47
53
54
55
55
57
59
62
64
79
8
13
16
19
23
26
vi
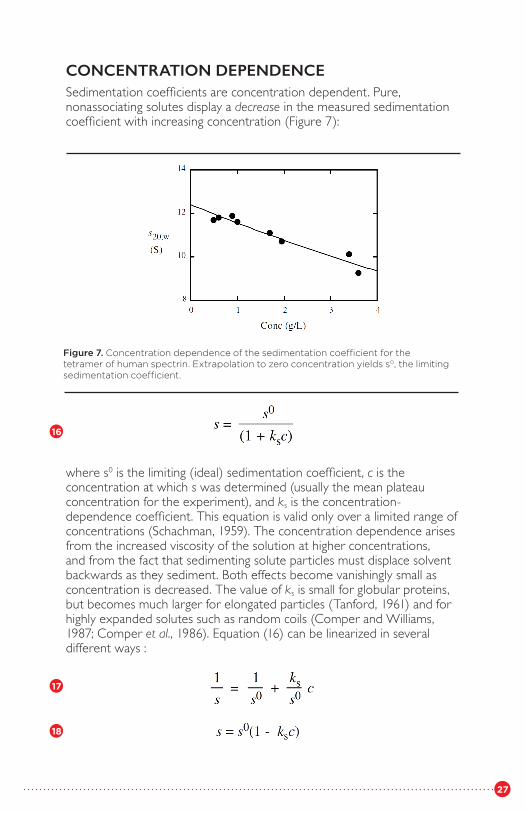
Figure 7 Concentration dependence of the sedimentationcoefficient for the tetramer of human spectrin
Figure 8 Distribution of sedimentation coefficients for calfthymus DNA fragments
Figure 9 The primary charge effectFigure 10 Concentration-dependent increase in weight average
sedimentation coefficientFigure 11 Schematic appearance of a bimodal boundary for a
hypothetical monomer-tetramer association reactionFigure 12 Spreading of the boundary with time in a diffusion
experiment with dextranFigure 13 Determination of the diffusion coefficientFigure 14 Schematic representation of sedimentation equilibriumFigure 15 Schematic representation of the meniscus in a
centrifuge cellFigure 16 Sedimentation equilibrium distribution of two
different solutesFigure 17 Decrease in apparent molecular weight with
concentration, reflecting nonidealityFigure 18 Sedimentation equilibrium analysis of the selfassociation
of a DNA-binding protein from B. subtilisFigure 19 Diagnostic plots for assessing the self-association of
β-lactoglobulin CFigure 20 Sedimentation equilibrium analysis of human spectrin
TABLETable 1 Approximate Values of Partial Specific Volumes
for Common Biological Macromolecules
27
30
33
34
35
38
38
41
43
44
46
46
49
52
21

vii
ABOUT THE AUTHORGreg Ralston is an Associate Professor in the Department of Biochemistry at the University of Sydney. His research interests center on understanding the interactions within and between proteins. He has a degree in Food Technology from the University of NSW, and a Ph.D. from the Australian National University, where he studied with Dr. H. A. McKenzie and Prof. A. G. Ogston. After a two-year period at the Carlsberg Laboratory in Denmark, he studied with Prof. J. W. Williams at the University of Wisconsin, where he began his research on the self-association of the protein spectrin from erythrocyte membranes. This research has continued at the University of Sydney, where he has built up a modern analytical ultracentrifuge facility.
viii
ABOUT THIS HANDBOOKThis handbook, the first of a series on modern analytical ultracentrifugation, is intended for scientists who are contemplating the use of this powerful group of techniques. The goals of this little book are: to introduce you to the sorts of problems that can be solved through the application of analytical ultracentrifugation; to describe the different types of experiments that can be performed in an analytical ultracentrifuge; to describe simply the principles behind the various types of experiments that can be performed; and to guide you in selecting a method and conditions for a particular type of problem.
ix
GLOSSARYABcc1c0cpcrCP DD0
D20,w
f f0Fg(s) G°H°jk
Kks
mMM1Mn, Mw, MzMr Mw,appnNRrr̄
rbnd
rbrFrms
AbsorbanceSecond virial coefficient (L mol g-2)Solute concentration (g/L)Concentration of monomer (g/L)Initial solute concentration (g/L)Solute concentration in the plateau regionSolute concentration at radial distance rMolar heat capacityTranslational diffusion coefficientLimiting diffusion coefficient; D extrapolated to zeroconcentrationDiffusion coefficient corrected for the density andviscosity of the solvent, relative to that of water at 20°CFrictional coefficientFrictional coefficient for a compact, spherical particleForceDistribution of sedimentation coefficientsStandard free energyStandard enthalpyFringe displacement (interference optics)Equilibrium constant in the molar scale, expressed inthe g/L scale: k = K/MEquilibrium constant in the molar scaleConcentration-dependence of sedimentation coefficientMass of a single particleMolar weight (g/mol)Monomer molar weightNumber, weight and z-average molar weightsRelative molecular weightApparent weight-average molar weight (g/mol)Number of moles of soluteAvogadro’s numberGas constant (8.314 J mol-1 K-1)Radial distance from center of rotationRadial position of the equivalent boundary determinedfrom the second momentRadial position of solute boundary determined fromthe point of inflectionRadial position of cell baseRadial position of an arbitrary reference pointRadial position of meniscusSedimentation coefficient
x
s0
s20,w
SSo
Ttuv̄yηη0ηsηT,w[η]λρΣωΩr
Limiting sedimentation coefficient; s extrapolated tozero concentrationSedimentation coefficient corrected for the viscosityand density of the solvent, relative to that of waterat 20°CSvedberg unit (10-13 seconds)Standard entropyTemperature in KelvinTimeVelocityPartial specific volumeActivity coefficient in the g/L scaleCoefficient of viscosityCoefficient of viscosity for the solventCoefficient of viscosity for the solutionCoefficient of viscosity for water at T°CLimiting viscosity number (intrinsic viscosity)Wavelength of lightSolution densitySummation symbolAngular velocity (radians/second)Omega function at radial distance r
xi
RECOMMENDED READINGThere are several excellent books and articles written on the theory andapplication of sedimentation analysis. Sadly, many of these are now out of print. It is to be hoped that with a resurgence in this field, some may be eprinted.
The following general books about sedimentation analysis are highly recommended.
Bowen, T. J. An Introduction to Ultracentrifugation. London, Wiley-Interscience, 1970. A useful introduction for the newcomer.
Schachman, H. K. Ultracentrifugation in Biochemistry. New York,Academic Press, 1959. A very useful and compact book that deals withboth theoretical and experimental aspects.
Svedberg, T., Pedersen, K. O. The Ultracentrifuge. Oxford, ClarendonPress, 1940. The classic in this field, and one that still has a wealth ofinformation to offer the modern scientist.
The following review articles are particularly helpful in describinghow to carry out experiments or how to analyze the results.
Coates, J. H. Ultracentrifugal analysis. Physical Principles and Techniquesof Protein Chemistry, Part B, pp. 1-98. Edited by S. J. Leach. NewYork, Academic Press, 1970.
Creeth, J. M., Pain, R. H. The determination of molecular weights ofbiological macromolecules by ultracentrifuge methods. Prog. Biophys.Mol. Biol. 17, 217-287 (1967)
Kim, H., Deonier, R. C., Williams, J. W. The investigation of selfassociationreactions by equilibrium ultracentrifugation. Chem. Rev. 77, 659-690 (1977). A detailed, though accessible, review of the study of association reactions by means of sedimentation equilibrium analysis.
Teller, D. C. Characterization of proteins by sedimentation equilibrium inthe analytical ultracentrifuge. Methods in Enzymology, Vol. 27, pp. 346-441. Edited by C. H. W. Hirs and S. N. Timasheff. New York, AcademicPress, 1973. A wealth of information on both experimental and computational aspects, especially relating to self-association.
Van Holde, K. E. Sedimentation analysis of proteins. The Proteins, Vol. I,pp. 225-291. Edited by H. Neurath and R. L. Hill. 3rd ed. New York,
xii
Academic Press, 1975. This article brought the field of protein sedimentation up to date for the nonspecialist in 1975.
Williams, J. W., Van Holde, K. E., Baldwin, R. L. Fujita, H. The theory ofsedimentation analysis. Chem. Rev. 58, 715-806 (1958). A comprehensivereview of the theory, but somewhat difficult for the newcomer.
1
ANALYTICAL ULTRACENTRIFUGATION AND MOLECULAR CHARACTERIZATIONOne of the earliest recognized properties of proteins was their largemolecular weight. This property was reflected in their ability to be retained by cellulose membranes and for their solutions to display visible light scattering, both features commonly encountered with colloidal dispersions of inorganic solutes.
With the recognition of the importance of large molecules such as proteins and nucleic acids in biology and technology came the need for the development of new tools for their study and analysis. One of the most influential developments in the study of macromolecules was that of the analytical ultracentrifuge by Svedberg and his colleagues in the 1920s(Svedberg and Pedersen, 1940). At this time the prevailing opinion wasthat macromolecules did not exist; proteins and organic high polymerswere envisioned as reversibly aggregated clusters of much smaller molecules, of undefined mass.
The pioneering studies of Svedberg led to the undeniable conclusion that proteins were truly macromolecules containing a huge number of atoms linked by covalent bonds. Later, substances such as rubber and polystyrene were shown to exist in solution as giant molecules whose molecular weight was independent of the particular solvent used. With the spectacular growth of molecular biology in recent years, it has even become possible to manipulate the structures of biological molecules such as DNA and proteins.
The sorts of questions for which answers are sought in understanding the behavior of macromolecules are:
1. Is the sample homogeneous? i.e., is it pure? or is there more than one type of molecule present?
2. If there is a single component, what is the molecular weight?3. If more than one type of molecule is present, can the molecular
weight distribution of the sample be obtained?4. Can an estimate be obtained of the size and shape of the
particles of the macromolecule? Are the molecules compact and spherical, like the globular proteins; long, thin and rod-like, like sections of DNA; or are they highly expanded and full of solvent, like many organic polymers in a good solvent?
2
5. Is it possible to distinguish between macromolecules on the basis of differences in their density?
6. Can interactions between solute molecules be detected? Aggregation between molecules will lead to a change in molecular weight, so that a detailed study of changes in molecular weight as a function of the concentrations of the components can illuminate the type of reaction (e.g., reversible or nonreversible?), the stoichiometry, and the strength of binding.
7. When macromolecules undergo changes in conformation, the shape of the particles will be slightly altered. Can these differences be measured?
8. Can one take into account the nonideality that arises from the fact that real molecules occupy space?
3
THE UNIQUE FEATURESOF ANALYTICAL ULTRACENTRIFUGATIONThe analytical ultracentrifuge is still the most versatile, rigorous and accurate means for determining the molecular weight and the hydrodynamic and thermodynamic properties of a protein or other macromolecule. No other technique is capable of providing the same range of information with a comparable level of precision and accuracy. The reason for this is that the method of sedimentation analysis is firmly based in thermodynamics. All terms in the equations describing sedimentation behavior are experimentally determinable.
Described below are some of the fundamental applications of the analytical centrifuge for which it is either the best or the only method of analysis available for answering some of the questions posed above.
EXAMINATION OF SAMPLE PURITYSedimentation analysis has a long history in examination of solution heterogeneity. The determination of average molecular weights by sedimentation equilibrium, coupled with a careful check on the total amount of mass measured compared to what was put into the cell, can provide sensitive and rigorous assessment of both large and small contaminants, as well as allowing the quantitation of the size distributions in polydisperse samples (Albright and Williams, 1967; Schachman, 1959; Soucek and Adams, 1976). Sedimentation velocity experiments also allow the rapid and rigorous quantitative assessment of sample heterogeneity (Stafford, 1992; Van Holde and Weischet, 1978). Because the sample is examined in free solution and in a defined solvent, sedimentation methods allow analysis of purity, integrity of native structure and degree of aggregation uncomplicated by interactions of the macromolecules with gel matrix or support.
MOLECULAR WEIGHT DETERMINATIONThe analytical ultracentrifuge is unsurpassed for the direct measurement of molecular weights of solutes in the native state and as they exist in solution, without having to rely on calibration and without having to make assumptions concerning shape. The method is applicable to molecules with molecular weights ranging from several hundreds (such as sucrose; Van Holde and Baldwin, 1958) up to many millions (for virus particles and organelles; Bancroft and Freifelder, 1970). No other method is capable ofencompassing such a wide range of molecular size. The method is applicable to proteins, nucleic acids, carbohydrates—indeed any
4
substance whose absorbance (or refractive index) differs from that of the solvent. Sedimentation equilibrium methods require only small sample sizes (20-120 μL) and low concentrations (0.01-1 g/L). On the other hand, it is also possible to explore the behavior of macromolecules in concentrated solutions, for example, in studies of very weak interactions (Murthy et al, 1988; Ward and Winzor, 1984).
While techniques such as light scattering, osmometry and X-ray diffraction can all provide molecular weight information (Jeffrey, 1981),none of these methods is capable of covering such a wide range of molecular weights in solution as simply, over such a wide range of concentration, or from such small sample volumes, as centrifugation.
Electrophoresis and chromatographic methods have become increasingly popular for rapid estimation of molecular weights of proteins and nucleic acids (Laue and Rhodes, 1990). However, such methods, though rapid and sensitive, have no rigorous theoretical base; they are empirical techniques that require calibration and rely on a series of assumptions that are frequently invalid. The limitation of electrophoresis as a criterion of homogeneity in macromolecular analysis was demonstrated by Ogston (1977): preparations of turnip yellow virus showed two species in sedimentation experiments, yet only one in electrophoresis. It was subsequently shown that the heavier particles were complete virus particles, while the lighter ones lacked the nucleic acid core. Both the nucleic acid and its counterions were packaged within the protein coat, and were thus transparent to the electric field. More commonly, electrophoretic analyses will be invalid if the standards used for calibration are inappropriate for the sample being analyzed; proteins that display unusual binding of SDS, and glycoproteins in general, show anomalous mobility in SDS acrylamide gels.
The molecular weights of the calibration standards for electrophoresis and chromatography must be determined originally by means such as sedimentation analyses, or, when appropriate, by means of sequencing. With macromolecules such as polysaccharides and synthetic polymers, sequencing is not an available option; analytical centrifugation is one of the best techniques available to provide that information.
5
ANALYSIS OF ASSOCIATING SYSTEMSSedimentation analysis is even more valuable in studies of the changes inmolecular weight when molecules associate to form more complex structures. Most biological functions depend on interactions between macromolecules. While electrophoresis in gels containing SDS can provide information on the components and their relative stoichiometry in a complex, sedimentation equilibrium provides the means of determining the molecular weight of the complex as it exists in solution, and independent of the shape of the particle. Frequently, a macromolecule may exist in several states of aggregation; this can be revealed clearly by sedimentation velocity and sedimentation equilibrium experiments (Attri et al., 1991; Correia et al., 1985; Durham, 1972; Herskovits et al., 1990; Mark et al., 1987; Ralston, 1975; Van Holde et al., 1991).
Sedimentation equilibrium experiments allow the study of a wide range of interactions, including the binding of small molecules and ions to macromolecules, the self-association of macromolecules (Teller, 1973), and heterogeneous macromolecular interactions (Minton, 1990). Because of the sedimentation process, within the sample cell there will be a range of concentrations from very low at the meniscus to much higher at the cell bottom. Also, the relative concentration of associated species will be higher at the cell bottom, and analysis of the average molecular weight as a function of radius can reveal information about the stoichiometry and strength of associations.
In principle, sedimentation equilibrium experiments can yield the size of the individual molecules taking part in complex formation, the size ofthe complex, the stoichiometry, the strength of the interactions between the subunits, and the thermodynamic nonideality of the solution (Adams et al., 1978; Jeffrey, 1981; Teller, 1973). Sedimentation equilibrium in the analytical ultracentrifuge is the only technique presently capable of analyzing such interactions over a wide range of solute concentrations, without perturbing the chemical equilibrium (Kim et al., 1977).
Unlike other methods for measuring binding, sedimentation equilibrium is particularly sensitive for the examination of relatively weakassociations with K values of the order of 10-100 M-1 (Laue and Rhodes,1990). Such weak (and often transient) associations are frequently important biologically, but cannot readily be studied with gel electrophoresis or methods involving the binding of radiolabelled probes. On the other hand, with sensitive detection methods such as are available with absorbance optics, sufficiently low concentrations of solute may be examined in the ultracentrifuge to study interactions with K values significantly greater than 107 M-1.
6
SEDIMENTATION AND DIFFUSION COEFFICIENTS— DETECTION OF CONFORMATION CHANGESX-ray diffraction and NMR techniques are currently the only techniquesavailable that are capable of providing structural details at atomic resolution. Nevertheless, the overall size and shape of a macromolecule or complex in solution can be obtained through measurement of the rate of movement of the particles through the solution. Sedimentation velocityexperiments in the analytical ultracentrifuge provide sedimentation anddiffusion coefficients that contain information concerning the size andshape of macromolecules and the interactions between them Sedimentation coefficients are particularly useful for monitoring changes in conformation in proteins (Kirschner and Schachman, 1971; Newell and Schachman, 1990; Richards and Schachman, 1959; Smith and Schachman,1973) and in nucleic acids (Crawford and Waring, 1967; Freifelder and Davison, 1963; Lohman et al., 1980). Bending in nucleic acids induced by protein binding may also be amenable to study by difference sedimentation.
Although early work in protein chemistry made considerable use of axial ratios and estimates of “hydration,” both of these parameters were ambiguous and sometimes were of dubious value. Through the combination of several different hydrodynamic or thermodynamic measurements, it is now possible to discriminate more clearly between different idealized shapes used to model the overall shape of a macromolecule in solution (Harding, 1987; Nichol et al., 1985; Nichol and Winzor, 1985). These hydrodynamic shapes—prolate or oblate ellipsoids of revolution—can be compared with electron microscope images to assess how applicable those images may be to the behavior of the particles in solution.
Some enzymes exist in several oligomeric states, not all of which are enzymatically active. Through the use of absorbance measurements and chromogenic substrates, it is possible to examine the sedimentationbehavior of the enzymatic activity and thus to ascribe the activity to aparticular oligomeric state (Hesterberg and Lee, 1985; Holleman, 1973).These types of experiments also allow investigation of the sedimentationbehavior of enzymes in very dilute (Seery and Farrell, 1989), and notparticularly pure, solutions.
7
LIGAND BINDINGAbsorbance optics are particularly well suited to studies of ligand binding,because of the ability to distinguish between ligand and acceptor (Minton,1990). Ligands and acceptors may have different intrinsic absorbance(Steinberg and Schachman, 1966) or one of the species may be labelledwith a chromophore, provided that the modification does not alter thebinding (Bubb et al., 1991; Lakatos and Minton, 1991; Mulzer et al.,1990). Analysis can be made simply with sedimentation velocity methodswhen the ligand and acceptor differ greatly in sedimentation coefficient,such as with small molecule-protein association (Schachman and Edelstein, 1973), with DNA-protein binding (Revzin and Woychik, 1981), or the binding of relatively large proteins to filaments such as F-actin (Margosian and Lowey, 1978). Provided there are significant changes in sedimentation coefficient on binding, sedimentation velocity may also be used to study interactions between molecules of similar size (Poon and Schumaker, 1991). Alternatively, thermodynamically rigorous analysis may be made by means of sedimentation equilibrium analysis (Lewis and Youle, 1986).
Ligand binding may also influence the state of association of a macromolecule (Cann and Goad, 1973); either enhancing or inhibiting selfassociation (Prakash and Timasheff, 1991), and these changes are amenable to characterization by sedimentation analysis (Smith et al., 1973).
8
1
2
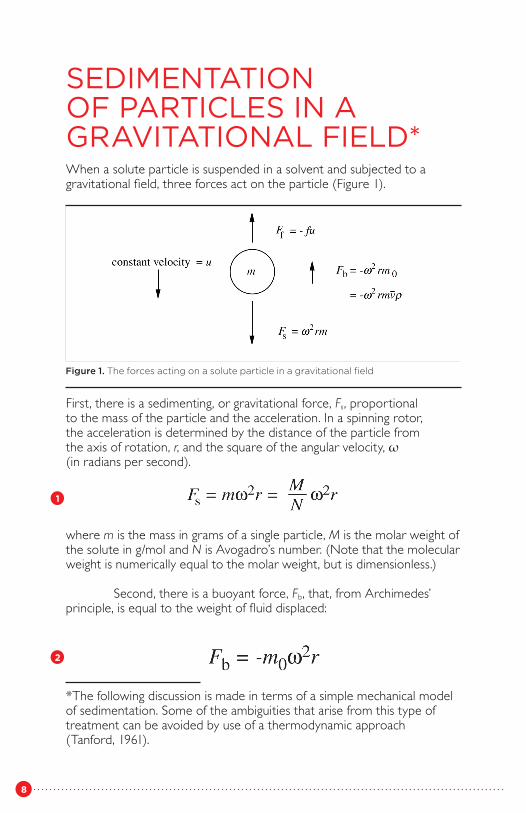
SEDIMENTATION OF PARTICLES IN A GRAVITATIONAL FIELD*When a solute particle is suspended in a solvent and subjected to a gravitational field, three forces act on the particle (Figure 1).
First, there is a sedimenting, or gravitational force, Fs, proportional to the mass of the particle and the acceleration. In a spinning rotor, the acceleration is determined by the distance of the particle from the axis of rotation, r, and the square of the angular velocity, ω (in radians per second).
where m is the mass in grams of a single particle, M is the molar weight ofthe solute in g/mol and N is Avogadro’s number. (Note that the molecularweight is numerically equal to the molar weight, but is dimensionless.)
Second, there is a buoyant force, Fb, that, from Archimedes’ principle, is equal to the weight of fluid displaced:
*The following discussion is made in terms of a simple mechanical model of sedimentation. Some of the ambiguities that arise from this type of treatment can be avoided by use of a thermodynamic approach (Tanford, 1961).
Figure 1. The forces acting on a solute particle in a gravitational field
9
3
4
5
6
7
8
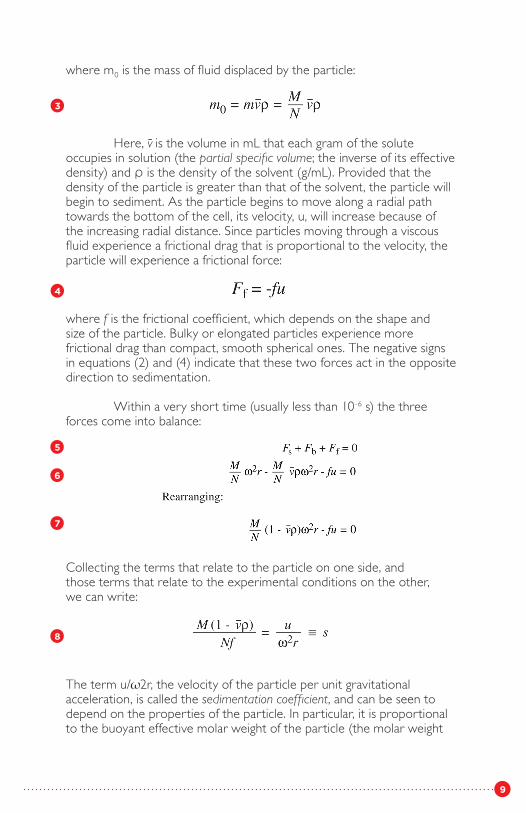
where m0 is the mass of fluid displaced by the particle:
Here, v̄ is the volume in mL that each gram of the solute occupies in solution (the partial specific volume; the inverse of its effective density) and ρ is the density of the solvent (g/mL). Provided that the density of the particle is greater than that of the solvent, the particle will begin to sediment. As the particle begins to move along a radial path towards the bottom of the cell, its velocity, u, will increase because of the increasing radial distance. Since particles moving through a viscous fluid experience a frictional drag that is proportional to the velocity, the particle will experience a frictional force:
where f is the frictional coefficient, which depends on the shape and size of the particle. Bulky or elongated particles experience more frictional drag than compact, smooth spherical ones. The negative signs in equations (2) and (4) indicate that these two forces act in the opposite direction to sedimentation.
Within a very short time (usually less than 10-6 s) the three forces come into balance:
Collecting the terms that relate to the particle on one side, and those terms that relate to the experimental conditions on the other,we can write:
The term u/ω2r, the velocity of the particle per unit gravitational acceleration, is called the sedimentation coefficient, and can be seen todepend on the properties of the particle. In particular, it is proportional to the buoyant effective molar weight of the particle (the molar weight
10
corrected for the effects of buoyancy) and it is inversely proportional to the frictional coefficient. It is independent of the operating conditions. Molecules with different molecular weights, or different shapes and sizes,will, in general, move with different velocities in a given centrifugal field;i.e., they will have different sedimentation coefficients.
The sedimentation coefficient has dimensions of seconds. For many substances, the value of s lies between 1 and 100 × 10-13 seconds. The Svedberg unit (abbreviation S) is defined as 10-13 seconds, in honor of Thé Svedberg. Serum albumin, then, has a sedimentation coefficient of4.5 × 10-13 seconds or 4.5 S.
As the process of sedimentation continues, the solute begins to pile up at the bottom of the centrifuge cell. As the concentration at the bottom begins to increase, the process of diffusion opposes that of sedimentation. After an appropriate period of time, the two opposing processes approach equilibrium in all parts of the solution column and, for a single, ideal solute component, the concentration of the solute increases exponentially towards the cell bottom. At sedimentation equilibrium, the processes of sedimentation and diffusion are balanced; the concentration distribution from the top of the cell to the bottom no longer changes with time, and is a function of molecular weight.
As indicated above, the process of sedimentation depends on the effective molar weight, corrected for the buoyancy: M(1 - v̄ ρ). If the density of the solute is greater than that of the solvent, the solute will sediment towards the cell bottom. However, if the density of the solute is less than that of the solvent, the solute will float towards the meniscus atthe top of the solution. This is the situation for many lipoproteins and lipids in aqueous solutions. The analysis of such situations is similar,except that the direction of movement is reversed.
When the densities of the solute and solvent are equal, (1 - v̄ ρ ) = 0, and there will be no tendency to move in either direction. Use can be made of this to determine the density of a macromolecule in density gradient sedimentation. A gradient of density can be made, for example by generating a gradient of concentration of an added solute such as sucrose or cesium chloride from high concentrations at the cell bottom to lower values at the top. The macromolecule will sediment if it is in a region of solution where the density is less than its own. But macromolecules that find themselves in a region of higher density will begin to float. Eventually, the macromolecules will form a layer at that region of the cell where the solvent density is equal to their own: the buoyant density.
11
INSTRUMENTATIONAn analytical ultracentrifuge must spin a rotor at an accurately controlledspeed and at an accurately controlled temperature, and must allow the recording of the concentration distribution of the sample at known times.This ability to measure the distribution of the sample while it is spinningsets the analytical ultracentrifuge apart from preparative centrifuges.
In order to achieve rapid sedimentation and to minimize diffusion, high angular velocities may be necessary. The rotor of an analytical ultracentrifuge is typically capable of rotating at speeds up to 60,000 rpm. In order to minimize frictional heating, and to minimize aerodynamic turbulence, the rotor is usually spun in an evacuated chamber. It is important that the spinning rotor be stable and free from wobble or precession.Instability can cause convection and stirring of the cell contents, particularly when the concentration and concentration gradient of the solute are low, and can lead to uncertainty in the concentration distribution in regions of high concentration gradient.
ROTORSRotors for analytical ultracentrifugation must be capable of withstandingenormous gravitational stresses. At 60,000 rpm, a typical ultracentrifugerotor generates a centrifugal field in the cell of about 250,000 × g. Under these conditions, a mass of 1 g experiences an apparent weight of 250 kg; i.e., 1⁄4 ton! The rotor must also allow the passage of light through the spinning sample, and some mechanism must be available for temperature measurement.
The Optima XL-A Analytical Ultracentrifuge is equipped with a four-hole rotor. One of the holes is required for the counterbalance, with its reference holes that provide calibration of radial distance, leaving three positions available for sample cells. Operation with multiple cells increases the number of samples that can be examined in a single experiment. This is particularly useful, for example, when several different concentrations of a self-associating material must be examined in order to check for attainment of chemical equilibrium.
CELLSUltracentrifuge cells must also withstand the stresses caused by theextremely high gravitational fields, must not leak or distort, and yet mustallow the passage of light through the sample so that the concentrationdistribution can be measured. To achieve these ends, the sample is usuallycontained within a sector-shaped cavity sandwiched between two thickwindows of optical-grade quartz or sapphire. The cavity is produced in acenterpiece of aluminum alloy, reinforced epoxy, or a polymer known as
12
Kel-F.* Double-sector centerpieces for the Optima XL-A are availablewith optical lengths of 3 and 12 mm.User-manufactured centerpieces have been reported with pathlengths asshort as 0.1 mm (Braswell et al., 1986; Brian et al., 1981; Minton andLewis, 1981; Murthy et al., 1988). The combination of various opticalpathlengths and selectable wavelengths allows examination of a wide range of sample concentrations.
Sector-shaped sample compartments are essential in velocity work since the sedimenting particles move along radial lines. If the samplecompartments were parallel-sided, sedimenting molecules at the periphery would collide with the walls and cause convective disturbances. Sectors that diverge more widely than the radii also cause convection. The development of appropriate sector-shaped sample compartments with smooth walls was a major factor in Svedberg’s successful design of the original velocity instrument.
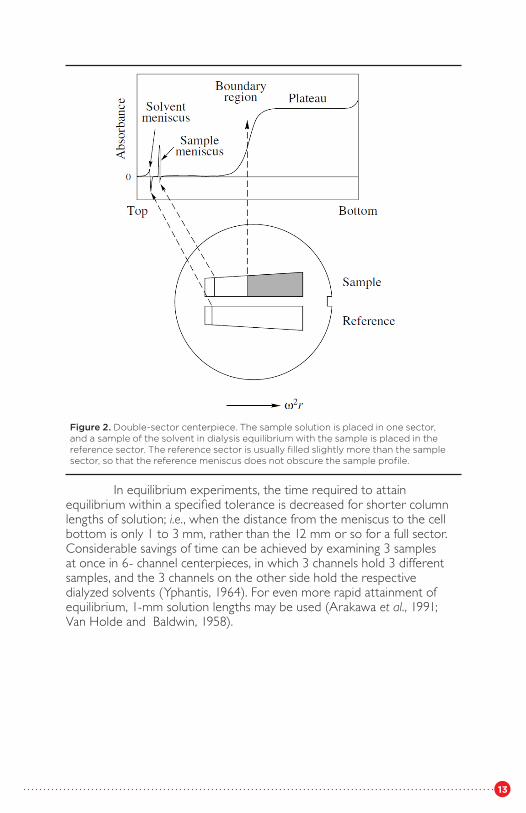
Double-sector cells allow the user to take account of absorbingcomponents in the solvent, and to correct for the redistribution of solvent components, particularly at high g values. A sample of the solution is placed in one sector, and a sample of the solvent in dialysis equilibriumwith the solution is placed in the second sector (Figure 2). The opticalsystem measures the difference in absorbance between the sample andreference sectors in a manner similar to the operation of a double-beamspectrophotometer. Double-sector cells also facilitate measurements ofdifferences in sedimentation coefficient, and of diffusion coefficients.
*A registered trademark of 3M.
13
In equilibrium experiments, the time required to attain equilibrium within a specified tolerance is decreased for shorter column lengths of solution; i.e., when the distance from the meniscus to the cell bottom is only 1 to 3 mm, rather than the 12 mm or so for a full sector. Considerable savings of time can be achieved by examining 3 samples at once in 6- channel centerpieces, in which 3 channels hold 3 different samples, and the 3 channels on the other side hold the respective dialyzed solvents (Yphantis, 1964). For even more rapid attainment of equilibrium, 1-mm solution lengths may be used (Arakawa et al., 1991; Van Holde and Baldwin, 1958).
Figure 2. Double-sector centerpiece. The sample solution is placed in one sector, and a sample of the solvent in dialysis equilibrium with the sample is placed in the reference sector. The reference sector is usually filled slightly more than the sample sector, so that the reference meniscus does not obscure the sample profile.
14
Boundary forming cellsA range of special cells is available that allow solvent to be layered over asample of a solution while the cell is spinning at moderately low speed.These cells are useful for preparing an artificial sharp boundary formeasuring boundary spreading in measurements of diffusion coefficients,and for examining sedimentation velocity of small molecules (of molecularweight below about 12,000) for which the rate of sedimentation is insufficient to produce a sharp boundary that clears the meniscus.
Band forming cellsThese cells are available for layering a small volume of solution on the topof a supporting density gradient in band sedimentation and active enzymesedimentation studies (Cohen and Mire, 1971; Kemper and Everse, 1973).
15
METHODS OF DETECTION AND DATA COLLECTIONThe essential data obtained from an experiment with the analytical ultracentrifuge is a record of the concentration distribution. The most direct means of data collection is a set of concentration measurements at different radial positions and at a given time. This is approached most closely by methods of detection that measure the absorbance of the sample at a given wavelength at fixed positions in the cell; for solutes obeying the Beer-Lambert law, the absorbance is proportional to concentration.
While photoelectric absorption measurements may seem the most direct method, practical difficulties impeded their development in early instruments. Furthermore, synthetic polymers such as polyethylene and polyethylene glycol have little absorbance in the accessible ultraviolet(above 190 nm), and other means are needed for their analysis.Nevertheless, absorption optics provide the greatest combination of sensitivity and selectivity for the study of biological macromolecules.
REFRACTOMETRIC METHODSEarly instruments relied upon refractometric methods for obtaining theconcentration distributions. The sample solution usually has a greater refractive index than the pure solvent, and use is made of this principle intwo different optical systems.
SchlierenIn the so-called schlieren optical system (named for the German word for“streaks”), light passing through a region in the cell where concentration(and hence refractive index) is changing will be deviated radially, as lightpassing through a prism is deviated towards the direction normal to thesurface. The schlieren optical system converts the radial deviation of lightinto a vertical displacement of an image at the camera. This displacementis proportional to the concentration gradient. Light passing through eitherpure solvent or a region of uniform concentration will not be deviatedradially, and the image will not be vertically displaced in those regions.Much of the existing literature on sedimentation, particularly sedimentation velocity, has been obtained with the use of this optical system.
16
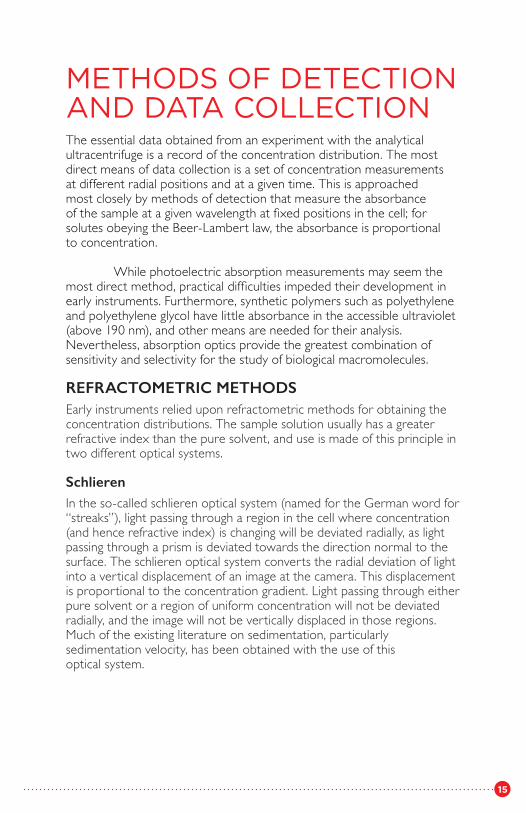
The schlieren image is thus a measure of the concentration gradient, dc/dr, as a function of radial distance, r (Figure 3a). The changein concentration relative to that at some specified point in the cell (e.g., the meniscus) can be determined at any other point by integration of the schlieren profile. However, only if the concentration at the reference point is known, may the absolute concentration at any other point be determined.
Figure 3. Comparison of the data obtained from the (a) schlieren, (b) interference, (c) photographic absorbance, and (d) photoelectric absorbance optical systems. ((a) (b) and (c) are taken from Schachman, 1959. Reprinted with the permission of Academic Press.)
17
Rayleigh interference opticsThis technique relies on the fact that the velocity of light passing through a region of higher refractive index is decreased. Monochromatic light passes through two fine parallel slits, one below each sector of a double-sector cell containing, respectively, a sample of solution and a sample of solvent in dialysis equilibrium. Light waves emerging from the entrance slits and passing through the two sectors undergo interference to yield a band of alternating light and dark “fringes.” When the refractive index in the sample compartment is higher than in the reference, the sample wave is retarded relative to the reference wave. This causes the positions of thefringes to shift vertically in proportion to the concentration differencerelative to that of some reference point (Figure 3b). If the concentration of the reference point, crF, is known, the concentration at any other point can be obtained:
where Δj is the vertical fringe shift, and a is a constant relating concentration to fringe shift. This situation is analogous to that of schlieren optics. If crF is not known, careful accounting and assumption of conservation of mass are needed to determine it. In principle, the information content from a schlieren record and from an interference record are the same: the interference information can be obtained from the schlieren data by numerical integration, and the schlieren information may be obtained from interference data by numerical differentiation.
Schlieren optics are less sensitive than interference optics. Schlieren optics may be used for proteins at concentrations between 1 and 50 g/L. Interference optics have outstanding accuracy, but are restricted to the concentration range 0.1-5 g/L (Schachman, 1959).
Both refractometric methods suffer from the fact that they determine concentration difference relative to the concentration at a reference point. However, they do have the advantage of being applicable to materials with little optical absorbance. Additionally, these methods are not compromised by the presence of low concentrations of components of the solvent that may have relatively high absorbance, such as might arise from the need to add a nucleotide such as ATP (with significant absorbance at 260 and 280 nm) to maintain stability of an enzyme.
9
18
ABSORBANCEWhile earlier absorption optical systems (Figure 3c) suffered from thedisadvantage of requiring photography and subsequent densitometry of the photograph, the photoelectric scanners of older instruments allowed more direct collection of data onto chart recorder paper. The primary data again had to be transcribed for calculations, a tedious and error-prone process.
With the advent of the Optima XL-A, however, many of these problems seem to have been solved. The instrument possesses increasedsensitivity and wide wavelength range; with its high reproducibility, baseline scans may be subtracted to remove the effects of oil droplets onlenses and windows, and of optical imperfections in the windows and lenses. With the absorption optics, too, the absolute concentration isavailable in principle at any point (Figure 3d); we are not restricted to concentration difference with respect to reference points, and accurate accounting is not a prerequisite for determining absolute concentrations.
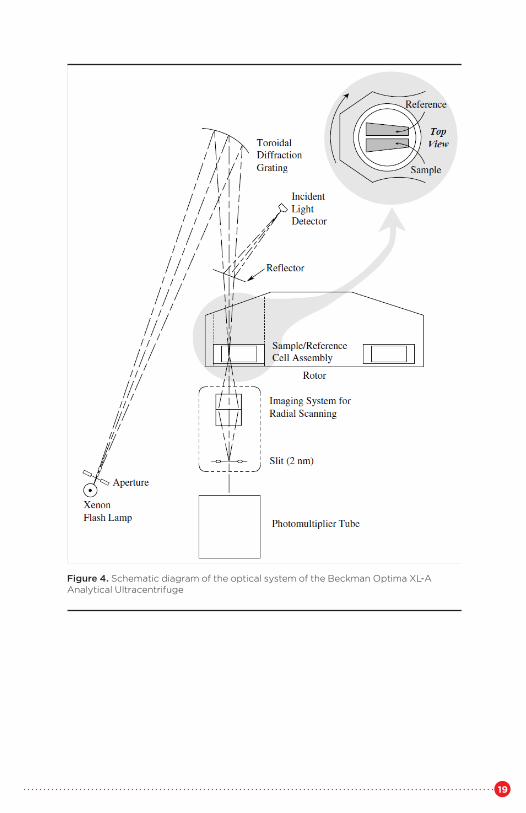
The absorbance optical system of the Optima XL-A is shown in Figure 4. A high-intensity xenon flash lamp allows the use of wavelengthsbetween 190 and 800 nm. The lamp is fired briefly as the selected sectorpasses the detector. Cells and individual sectors may be examined in turn,with the aid of timing information from a reference magnet in the base ofthe rotor. The measured light is normalized for variation in lamp output by sampling a reflected small fraction of the incident light.
A slit below the sample moves to allow sampling of different radial positions. To minimize noise, multiple readings at a single position may be collected and averaged. A new and as yet not fully explored capability of the absorbance optics is the wavelength scan. A wavelength scan may be taken at a specified radial position in the cell, resulting in an absorbance spectrum of the sample at that point, and allowing discrimination between different solutes.
The increased sensitivity of the absorbance optics means that samples may be examined in concentrations too dilute for schlieren or interference optics. With proteins, for example, measurement below 230 nm allows examination of concentrations 20 times more dilute than can be studied with interference optics (i.e., concentrations as low as several μg/mL are now accessible). Accessibility to lower concentrations means that examination of stronger interactions (K > 107 M-1) is now possible.
19
Figure 4. Schematic diagram of the optical system of the Beckman Optima XL-A Analytical Ultracentrifuge
20
PARTIAL SPECIFIC VOLUME AND OTHER MEASUREMENTSSeveral quantities are required in addition to the collection of the concentration distribution. The density of the solvent and the partial specific volume of the solute (or more strictly the specific density increment; Casassa and Eisenberg, 1964) are required for the determination of molecular weight. In order to take account of the effects of different solvents and temperatures on sedimentation behavior, we also require the viscosity of the solvent and its temperature dependence. These quantities are, in principle, measurable (with varying degrees of difficulty and inconvenience) and, for many commonly encountered solvents, may be available from published tables.
For most accurate results, this quantity should be measured. Measurement involves accurate and precise determination of the density of a number of solutions of known concentrations. Even with modern methods of densimetry (Kratky et al., 1973), this process requires relatively large amounts of solute, quantities that may not always be available.
The partial specific volumes of macromolecular solutes may becalculated, usually with satisfactory accuracy, from a knowledge of theircomposition and the partial specific volumes of component residues (Cohn and Edsall, 1943). Experience has shown that while this approach may neglect contributions to the partial specific volume arising from conformational effects (such as gaps within the structure, or exceptionally close packing), the values calculated for many proteins agree within 1% of the value measured. Since v̄ is approximately 0.73 mL/g for proteins, and for water, ρ = 1.0 g/mL, the term (1 - v̄ ρ) is near 0.27. An error of 1%in v̄ leads to an error of approximately 3% in (1 - v̄ ρ) and hence in M.
An alternative allows the estimation of both M and v̄ from data obtained from sedimentation equilibrium experiments in the analytical ultracentrifuge. With H2O as solvent, a set of data of c versus r is obtained. Then with a D2O/H2O mixture of known density as solvent, a second set of data is obtained. One then has two sets of data from which the two unknowns, M and v̄, may be determined (Edelstein and Schachman, 1973).
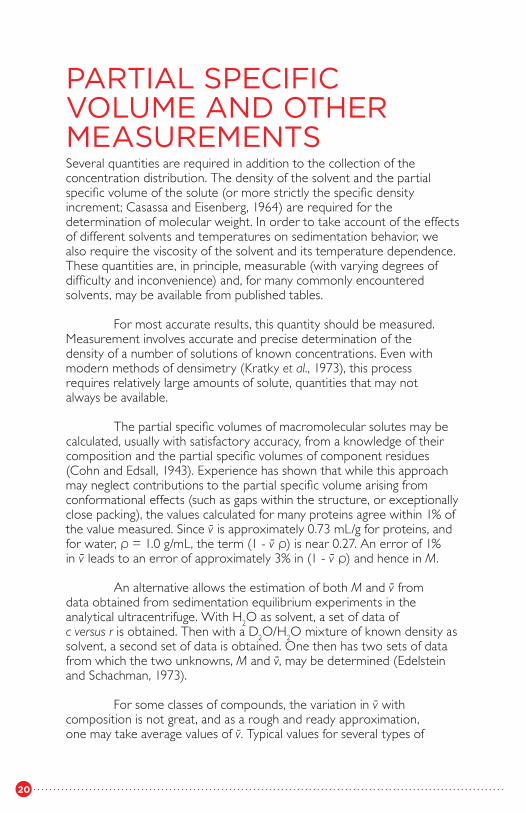
For some classes of compounds, the variation in v̄ with composition is not great, and as a rough and ready approximation, one may take average values of v̄. Typical values for several types of
21
macromolecules are listed in Table 1.
Table 1. Approximate Values of Partial Specific Volumesfor Common Biological Macromolecules
Substance v̄(mL/g)
UNSPSC 0.73 (0.70-0.75)
Polysaccharides 0.61 (0.59-0.65)
RNA 0.53 (0.47-0.55)
DNA 0.58 (0.55-0.59)
22
SAMPLE PREPARATIONWhen the sample is a pure, dry, nonionic material, it may be weighed,dissolved in an appropriate solvent and used directly. A sample of thesolvent should be used for the reference sector. This simple procedure also applies to charged species, such as proteins, that can be obtained in a pure, isoionic form.
However, with ionic species, such as protein molecules at pH values away from the isoionic point, difficulties arise from the charge and from the presence of bound ions. In order to maintain a constant pH, a buffer is normally used at concentrations between 10 and 50 mM. In addition, in order to suppress the nonideality due to the charge on the macromolecule, a supporting electrolyte is often added, usually 0.1 to 0.2 M KCl or NaCl. The presence of the extra salts makes the solution no longer a simple twocomponent system, for which most theoretical relationships have been derived, and taking the additional components into account can be a daunting task. Fortunately, Casassa and Eisenberg (1964) have shown that if the macromolecular solution is dialyzed against a large excess of the buffer/salt solution, it may be treated as a simple two-component solution. A sample of the dialyzate is required as a reference. If the apparent specific volume is determined for the solute in this solution and is referred to the concentration of the anhydrous, isoionic solute, then the molecular weight that is determined for the macromolecule in this solution is for the anhydrous, isoionic solute. This treatment results in a considerable simplification. When using solvents such as concentrated urea solutions, it is essential to adhere to the principles of Casassa and Eisenberg (1964) to avoid considerable errors.
In choosing a buffer, preference should be given to those whosedensities are near that of water, and for which the anions and cations are of comparable molecular weight, in order to avoid excessive redistribution of buffer components. Additionally, if measurement in the ultraviolet is contemplated, nonabsorbing buffers should be selected. Below 230 nm, carboxylate groups and chloride ions show appreciable absorbance. In the far ultraviolet, sodium fluoride may be required as a supporting electrolyte to avoid excessive optical absorbance.
23
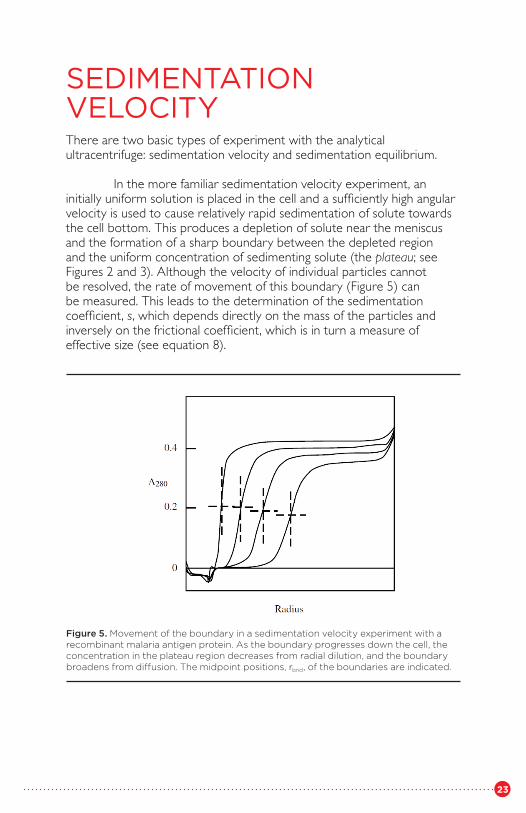
SEDIMENTATION VELOCITYThere are two basic types of experiment with the analytical ultracentrifuge: sedimentation velocity and sedimentation equilibrium.
In the more familiar sedimentation velocity experiment, an initially uniform solution is placed in the cell and a sufficiently high angularvelocity is used to cause relatively rapid sedimentation of solute towardsthe cell bottom. This produces a depletion of solute near the meniscus and the formation of a sharp boundary between the depleted region and the uniform concentration of sedimenting solute (the plateau; see Figures 2 and 3). Although the velocity of individual particles cannot be resolved, the rate of movement of this boundary (Figure 5) can be measured. This leads to the determination of the sedimentation coefficient, s, which depends directly on the mass of the particles and inversely on the frictional coefficient, which is in turn a measure of effective size (see equation 8).
Figure 5. Movement of the boundary in a sedimentation velocity experiment with a recombinant malaria antigen protein. As the boundary progresses down the cell, the concentration in the plateau region decreases from radial dilution, and the boundary broadens from diffusion. The midpoint positions, rbnd, of the boundaries are indicated.
24
Measurement of the rate of spreading of a boundary can lead to a determination of the diffusion coefficient, D, which depends on theeffective size of the particles:
where R is the gas constant and T the absolute temperature. The ratio of the sedimentation to diffusion coefficient gives the molecular weight:
where M is the molar weight of the solute, v̄ its partial specific volume, and ρ is the solvent density. The superscript zero indicates that the values of s and D, measured at several different concentrations, have been extrapolated to zero concentration to remove the effects of interactions between particles on their movement. Less accurately, for a particular class of macromolecule (e.g., globular proteins or DNA), empirical relationships between the sedimentation coefficient and molecular weight may allow estimation of approximate molecular weights from very small samples (Freifelder, 1970; Van Holde, 1975).
MULTIPLE BOUNDARIESEach solute species in solution in principle gives rise to a separatesedimenting boundary. Thus, the existence of a single sedimenting boundary (or a single, symmetrical bell-shaped “peak” of dc/dr as seen with schlieren optics) has often been taken as evidence for homogeneity.Conversely, the existence of multiple boundaries is evidence for multiplesedimenting species. Care must be taken, however, in making inferencesconcerning homogeneity. It may be possible for two separate species tohave sedimentation coefficients sufficiently similar that they cannot clearlybe resolved. Furthermore, the relatively broad range of molecular weightspresent in preparations of many synthetic polymers may lead to a singleboundary. This boundary, however, will show more spreading during theexperiment than expected from the size of the particles. It is possible totake account of this type of behavior as discussed in a later section.
Conversely, it is possible for a pure solute component to produce multiple sedimenting boundaries, for example, by the existence of several stable aggregation states. This type of effect depends on how rapidly the different states can interconvert. If the interconversion is rapid in the time scale of the experiment, the distribution of the different boundaries may be uniquely dependent on the solute concentration. On the other hand, if reequilibration is slow, the proportion of the different species may reflect the past history of the sample rather than the concentration in the cell.
10
11
25
DETERMINATION OF sProvided that the sedimenting boundary is relatively sharp and symmetrical, the rate of movement of solute molecules in the plateau region can be closely approximated by the rate of movement of the midpoint, rbnd. This point, in turn, is very close to the position of the point of inflection (which is the same as the maximum ordinate, or “peak,” of the dc/dr curve).
Since the sedimenting force is not constant, but increases with r, the velocity of the boundary will increase gradually with movement of theboundary outwards, so the velocity must be expressed as a differential:
where rm is the radial position of the meniscus.
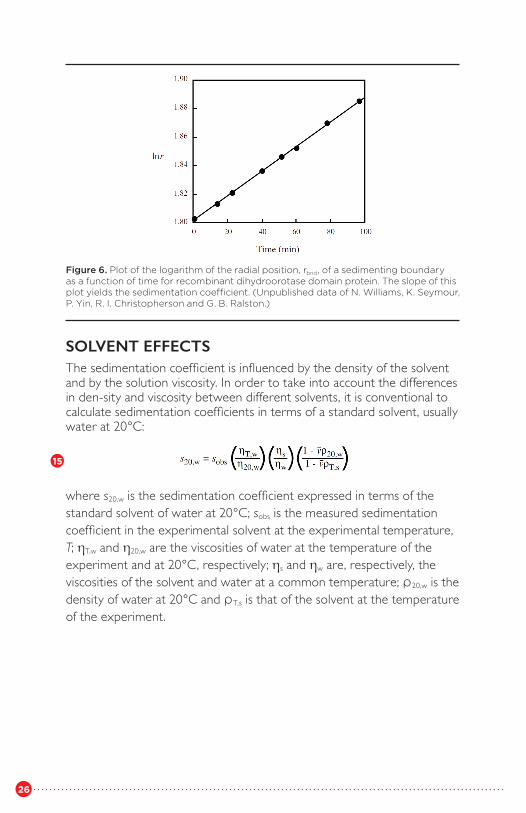
A plot of lnrbnd versus time in seconds yields a straight line of slope sω2 (Figure 6). When the boundary is asymmetric, or imperfectly resolved from the meniscus, it can be shown that the square root of the second moment of the concentration distribution, r̄ , is an accurate measure of the movement of particles in the plateau region (Goldberg, 1953; Schachman, 1959)
where r̄ is the equivalent boundary position, and rp is a position in theplateau region with concentration cp. This method also yields the weightaverage sedimentation coefficient of mixtures or interacting systems, and it is a simple matter to evaluate the integral numerically when the data are collected by a computer.
12
13
14
26
SOLVENT EFFECTSThe sedimentation coefficient is influenced by the density of the solventand by the solution viscosity. In order to take into account the differencesin den-sity and viscosity between different solvents, it is conventional tocalculate sedimentation coefficients in terms of a standard solvent, usuallywater at 20°C:
where s20,w is the sedimentation coefficient expressed in terms of thestandard solvent of water at 20°C; sobs is the measured sedimentationcoefficient in the experimental solvent at the experimental temperature, T; ηT,w and η20,w are the viscosities of water at the temperature of the experiment and at 20°C, respectively; ηs and ηw are, respectively, the viscosities of the solvent and water at a common temperature; ρ20,w is the density of water at 20°C and ρT,s is that of the solvent at the temperature of the experiment.
15
Figure 6. Plot of the logarithm of the radial position, rbnd, of a sedimenting boundary as a function of time for recombinant dihydroorotase domain protein. The slope of this plot yields the sedimentation coefficient. (Unpublished data of N. Williams, K. Seymour, P. Yin, R. I. Christopherson and G. B. Ralston.)
27
CONCENTRATION DEPENDENCESedimentation coefficients are concentration dependent. Pure, nonassociating solutes display a decrease in the measured sedimentationcoefficient with increasing concentration (Figure 7):
where s0 is the limiting (ideal) sedimentation coefficient, c is the concentration at which s was determined (usually the mean plateau concentration for the experiment), and ks is the concentration-dependence coefficient. This equation is valid only over a limited range of concentrations (Schachman, 1959). The concentration dependence arises from the increased viscosity of the solution at higher concentrations, and from the fact that sedimenting solute particles must displace solvent backwards as they sediment. Both effects become vanishingly small as concentration is decreased. The value of ks is small for globular proteins, but becomes much larger for elongated particles (Tanford, 1961) and for highly expanded solutes such as random coils (Comper and Williams, 1987; Comper et al., 1986). Equation (16) can be linearized in several different ways :
16
17
18
Figure 7. Concentration dependence of the sedimentation coefficient for the tetramer of human spectrin. Extrapolation to zero concentration yields s0, the limiting sedimentation coefficient.
28
Equation (18) is of even more limited validity, but is sometimes moreconvenient for the purposes of extrapolation to obtain s0 and ks.
The concentration-dependence coefficient, ks, is a very useful property, as it can be shown both theoretically and empirically for spherical particles (Creeth and Knight, 1965) that:
(where [η] is the intrinsic viscosity of the solute), and the value of ks/[η]tends towards zero for rod-like particles. This relationship is valid whetherthe particles are compact (as with globular proteins) or expanded (as withrandom coils, such as for unfolded proteins in guanidine hydrochloride),and thus gives an unambiguous measure of shape, independent of theparticle size (Creeth and Knight, 1965).
For globular proteins, [η] is about 3.5 mL/g (Tanford, 1961), and ks is therefore about 5 mL/g. From equation (16), it can be seen that at aconcentration of 10 g/L, globular proteins will show a decrease in s of about 5%; at 0.1 g/L (feasible with sensitive optics), the decrease is only0.05% and well within the precision of the measurement.
RADIAL DILUTIONBecause sector-shaped compartments are usually used, the solute particles enter a progressively increasing volume as they migrate outwards, and the sample becomes progressively diluted. This phenomenon is known as radial dilution. The concentration in the plateau region, cp, when the boundary is located at a point, rbnd, can be related to the initial concentration, c0, and the radial position of the meniscus, rm, from the relationship:
For molecules that display marked concentration dependence of s, the value of s estimated from the slope of the lnrbnd versus t plot may increase with time, reflecting this radial dilution.
ANALYSIS OF BOUNDARIESThere are two basic groups of problems that concern heterogeneity. In the first, the sample is fundamentally heterogeneous, or polydisperse. In the second group of problems, the sample of interest is predominantly a single species, but may be contaminated by one or more other materials; the problem here is to assess the degree of contamination, and to monitor purification procedures that aim to achieve homogeneity. The resolution of both classes of problems may be aided by a detailed
19
20
29
examination of the shapes of the sedimenting boundaries, and of the changes that occur in the shapes with time.
Some solutes, such as synthetic polymers, exist as a population of different sizes distributed about some mean size (Williams and Saunders, 1954), resulting in a single composite boundary in sedimentation velocity experiments. It may often be necessary to assess this size distribution. Sedimentation velocity is particularly suited to this type of analysis, and is capable of yielding the distribution of sedimentation coefficients in such a polydisperse mixture. With the use of auxiliary information, this distribution may be used to determine a distribution of molecular weights.
In a sedimentation velocity experiment, the shape of the boundary is subjected to several different influences (Schachman, 1959):
1. Heterogeneity will tend to spread out the boundary, because the different species move with different velocities.
2. Diffusion will also tend to spread out the boundary.3. The concentration dependence of the sedimentation coefficient
can lead to self-sharpening of boundaries. Molecules moving in the more dilute, trailing edge of the boundary will move more rapidly than those in the higher concentration of the plateau region, and will catch up with the slower molecules, to some extent negating the effects of diffusion (Schachman, 1959). The effect of self-sharpening may compensate for, and thereby mask, boundary spreading due to heterogeneity, giving a false appearance of homogeneity.
4. The Johnston-Ogston effect (1946) leads to distortion of the boundary, as the apparent concentrations of the slower moving species are enhanced, while those of the faster moving species, moving through a more concentrated solution, are correspondingly reduced. This effect is greatest for molecules that display large concentration dependence of s, and becomes vanishingly small as the concentration is lowered.
The resolution of these effects is a considerable problem with complicated solutions (Fujita, 1975). However, with the aid of testable simplifying assumptions the complexity of the problem may be reduced. If boundary spreading is due entirely to heterogeneity, and self-sharpening is minimized by working with extremely low concentrations, it is relatively simple to compute a distribution of sedimentation coefficients (Schachman, 1959) from the concentration distribution across the boundary:
21
30
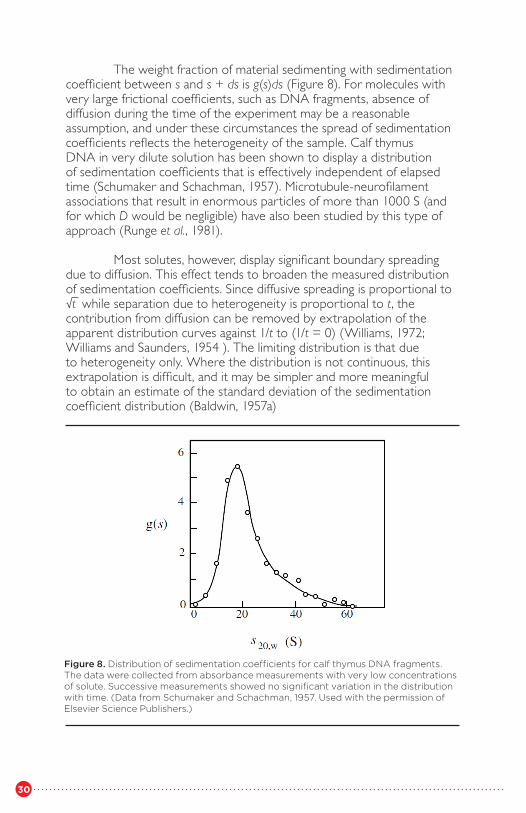
The weight fraction of material sedimenting with sedimentationcoefficient between s and s + ds is g(s)ds (Figure 8). For molecules withvery large frictional coefficients, such as DNA fragments, absence ofdiffusion during the time of the experiment may be a reasonable assumption, and under these circumstances the spread of sedimentation coefficients reflects the heterogeneity of the sample. Calf thymus DNA in very dilute solution has been shown to display a distribution of sedimentation coefficients that is effectively independent of elapsed time (Schumaker and Schachman, 1957). Microtubule-neurofilament associations that result in enormous particles of more than 1000 S (and for which D would be negligible) have also been studied by this type of approach (Runge et al., 1981).
Most solutes, however, display significant boundary spreading due to diffusion. This effect tends to broaden the measured distribution of sedimentation coefficients. Since diffusive spreading is proportional to�t̄ while separation due to heterogeneity is proportional to t, the contribution from diffusion can be removed by extrapolation of the apparent distribution curves against 1/t to (1/t = 0) (Williams, 1972; Williams and Saunders, 1954 ). The limiting distribution is that due to heterogeneity only. Where the distribution is not continuous, this extrapolation is difficult, and it may be simpler and more meaningful to obtain an estimate of the standard deviation of the sedimentation coefficient distribution (Baldwin, 1957a)
Figure 8. Distribution of sedimentation coefficients for calf thymus DNA fragments. The data were collected from absorbance measurements with very low concentrations of solute. Successive measurements showed no significant variation in the distribution with time. (Data from Schumaker and Schachman, 1957. Used with the permission of Elsevier Science Publishers.)
31
SELF-SHARPENING OF BOUNDARIESWhen the concentration dependence of sedimentation coefficient issufficiently large, such as with rod-shaped virus particles or DNA fragments, or when the concentration of the solute is sufficiently high, theboundary tends to sharpen itself, overcoming the spreading due to diffusion and making the analysis much more difficult. Molecules at the front of the boundary move in an environment of higher concentration and are retarded; those lagging behind move in more dilute solution and therefore move more rapidly. This effect was demonstrated (Schachman, 1951) with tobacco mosaic virus, in which a boundary, allowed to become diffuse by prolonged centrifugation at low speed, became very sharp when the angular velocity was increased.
Fujita (1956, 1959) extended the analysis of boundary spreading to systems that display a linear dependence of s on c. His analysis showedthat even moderate concentration dependence, such as found with 1%solutions of globular proteins, when not taken into account, leads to significant error in calculation of D from boundary spreading in a sedimentation experiment (Baldwin, 1957b).
In the presence of diffusion and concentration dependence, the function g(s) in equation (21) that is measured from an experiment is only an apparent distribution function (Williams, 1972). The effects of selfsharpening for polydisperse solutions may be taken into account by making a series of sedimentation velocity experiments at different loading concentrations of the sample. For each loading concentration, measurements of the boundary shape at different times allow the determination of the diffusion-corrected sedimentation coefficient distribution. These diffusioncorrected distributions can then be extrapolated to zero concentration to remove the effects of concentration dependence. This laborious procedure thus involves a double extrapolation: firstly, the extrapolation for each concentration to infinite time, and secondly, the extrapolation of the set of limiting distributions to zero concentrations (Williams and Saunders, 1954). While such calculations were often beyond the resources of many users in the past, with computer-controlled data collection and appropriate software, they should become almost routine for analysis of polydisperse systems.
In a study of antigen-antibody interactions, Stafford (1992) has shown that with absorption optics, a significant improvement in signal to noise ratio can be made by the use of the ∂c/∂t values at fixed radial positions in determining distributions of sedimentation coefficients. By this approach, the effects of baseline variation are minimized. Mächtle (1988) has described a method for determining the sizedistributions of very large particles. Again, the use of sensitive absorption optics will allow this type of study to be made at concentrations lower than was previously possible.
32
TESTS FOR HOMOGENEITYSeveral criteria have been devised for assessing the homogeneity of apreparation, although it must be borne in mind that homogeneity can only be presumed through the absence of detectable heterogeneity.
1. There must be a single, symmetrical boundary throughout the duration of the sedimentation velocity experiment (Fujita, 1956).
2. The measurable boundary must account for all the material put into the cell, after corrections for radial dilution, throughout the duration of the experiment. The availability of an accurate photometric system makes this criterion far easier to test than before. If the concentration in the plateau region, after correction for radial dilution, does not remain constant, then heterogeneity may be suspected; probably heavy material is being removed from the sample.
3. The concentration dependence of s and D should be ascertained. The spreading of a sedimenting boundary can then be examined rigorously for heterogeneity.
Baldwin (1957b) considered the effect of concentration dependence of both s and D to calculate the standard deviation of the sedimentation coefficient distribution from the shapes of sedimenting boundaries. β-Lactoglobulin displayed no heterogeneity of sedimentation coefficient, with only a single sedimentation coefficient required for its description. On the other hand, serum albumin showed some measurable heterogeneity.
Van Holde and Weischet (1978) described a method of testing for heterogeneity of sedimentation coefficient, which involves extrapolation of sedimentation coefficients calculated from sections of the boundary as a function of t-½ to the point where t-½ = 0. Homogeneity results in convergence of the data to a single s value. This approach has been used successfully by others (Geiselmann et al., 1992; Gill et al., 1991).
It must be noted that absence of heterogeneity in sedimentationanalysis is no guarantee that all of the molecules have, for example, thesame electrical charge, or the same biological activity. Partial deamidationof a protein sample, for instance, while having no significant effect on thesize, shape or molecular weight, will increase the negative charge on themolecule at neutral pH. Thus, such a sample will show multiple zones incapillary electrophoresis, but will show no heterogeneity in molecularweight or sedimentation coefficient.
33
SPEED DEPENDENCEOccasionally it is found that the measured sedimentation coefficientdepends on the angular velocity of the experiment. Sometimes, theobserved sedimentation coefficient is found to increase with increasingrotor speed (Schumaker and Zimm, 1973). This is believed to occurthrough aggregation of the solute caused by sedimenting solutes leaving a wake behind them depleted of buffer ions but enriched in macromolecular solute; a sort of “tailgating” effect. Sometimes, with highly asymmetric molecules such as DNA, high velocities of sedimentation lead to orientation of the particles (Zimm, 1974). These effects are best overcome by working at the lowest practical angular velocity.
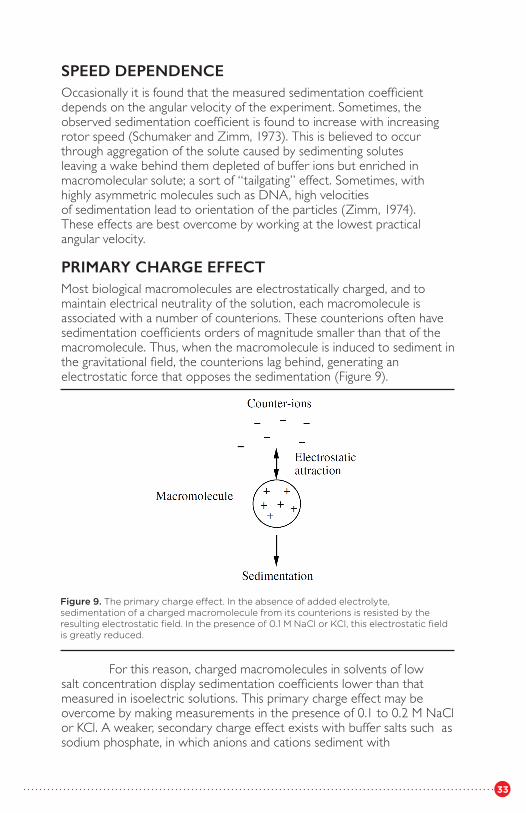
PRIMARY CHARGE EFFECTMost biological macromolecules are electrostatically charged, and tomaintain electrical neutrality of the solution, each macromolecule isassociated with a number of counterions. These counterions often havesedimentation coefficients orders of magnitude smaller than that of themacromolecule. Thus, when the macromolecule is induced to sediment inthe gravitational field, the counterions lag behind, generating an electrostatic force that opposes the sedimentation (Figure 9).
For this reason, charged macromolecules in solvents of low salt concentration display sedimentation coefficients lower than that measured in isoelectric solutions. This primary charge effect may be overcome by making measurements in the presence of 0.1 to 0.2 M NaCl or KCl. A weaker, secondary charge effect exists with buffer salts such as sodium phosphate, in which anions and cations sediment with
Figure 9. The primary charge effect. In the absence of added electrolyte, sedimentation of a charged macromolecule from its counterions is resisted by the resulting electrostatic field. In the presence of 0.1 M NaCl or KCl, this electrostatic field is greatly reduced.
34
different rates (Svedberg and Pedersen, 1940). This effect cannot be overcome by addition of NaCl, or by extrapolation to infinite dilution (Schachman, 1959)
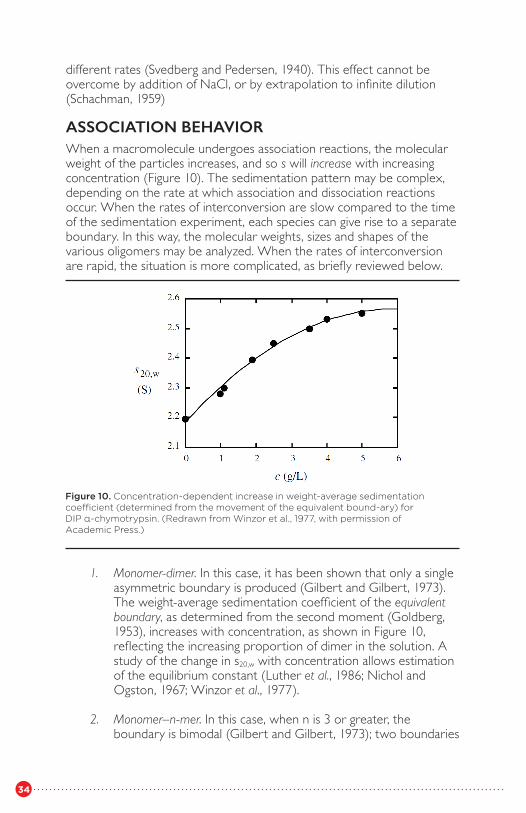
ASSOCIATION BEHAVIORWhen a macromolecule undergoes association reactions, the molecularweight of the particles increases, and so s will increase with increasingconcentration (Figure 10). The sedimentation pattern may be complex,depending on the rate at which association and dissociation reactionsoccur. When the rates of interconversion are slow compared to the time of the sedimentation experiment, each species can give rise to a separateboundary. In this way, the molecular weights, sizes and shapes of thevarious oligomers may be analyzed. When the rates of interconversion are rapid, the situation is more complicated, as briefly reviewed below.
1. Monomer-dimer. In this case, it has been shown that only a single asymmetric boundary is produced (Gilbert and Gilbert, 1973). The weight-average sedimentation coefficient of the equivalent boundary, as determined from the second moment (Goldberg, 1953), increases with concentration, as shown in Figure 10, reflecting the increasing proportion of dimer in the solution. A study of the change in s20,w with concentration allows estimation of the equilibrium constant (Luther et al., 1986; Nichol and Ogston, 1967; Winzor et al., 1977).
2. Monomer–n-mer. In this case, when n is 3 or greater, the boundary is bimodal (Gilbert and Gilbert, 1973); two boundaries
Figure 10. Concentration-dependent increase in weight-average sedimentation coefficient (determined from the movement of the equivalent bound-ary) forDIP α-chymotrypsin. (Redrawn from Winzor et al., 1977, with permission of Academic Press.)
35
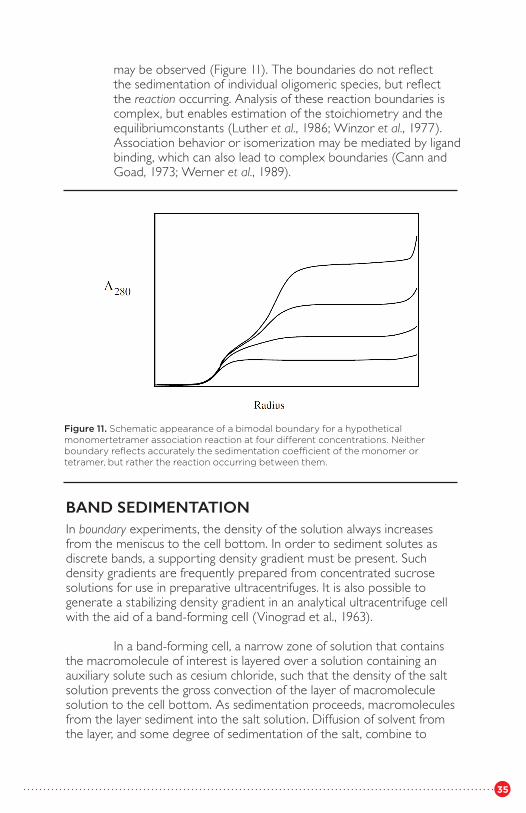
may be observed (Figure 11). The boundaries do not reflect the sedimentation of individual oligomeric species, but reflect the reaction occurring. Analysis of these reaction boundaries is complex, but enables estimation of the stoichiometry and the equilibriumconstants (Luther et al., 1986; Winzor et al., 1977). Association behavior or isomerization may be mediated by ligand binding, which can also lead to complex boundaries (Cann and Goad, 1973; Werner et al., 1989).
BAND SEDIMENTATIONIn boundary experiments, the density of the solution always increases from the meniscus to the cell bottom. In order to sediment solutes as discrete bands, a supporting density gradient must be present. Such density gradients are frequently prepared from concentrated sucrose solutions for use in preparative ultracentrifuges. It is also possible to generate a stabilizing density gradient in an analytical ultracentrifuge cell with the aid of a band-forming cell (Vinograd et al., 1963).
In a band-forming cell, a narrow zone of solution that contains the macromolecule of interest is layered over a solution containing an auxiliary solute such as cesium chloride, such that the density of the salt solution prevents the gross convection of the layer of macromolecule solution to the cell bottom. As sedimentation proceeds, macromolecules from the layer sediment into the salt solution. Diffusion of solvent from the layer, and some degree of sedimentation of the salt, combine to
Figure 11. Schematic appearance of a bimodal boundary for a hypothetical monomertetramer association reaction at four different concentrations. Neither boundary reflects accurately the sedimentation coefficient of the monomer or tetramer, but rather the reaction occurring between them.
36
maintain a selfgenerating density gradient that stabilizes the sedimenting zones. Each zone can then be distinguished as a sedimenting bell-shaped profile of absorbance. This method is particularly well suited to study of DNA because of its high absorbance coefficient. Since the density and viscosity of the supporting density gradient change slowly as the density-generating solute redistributes in the gravitational field, it is difficult to obtain absolute sedimentation coefficients by this method (Stafford et al., 1990) but it is a convenient method for detecting changes in conformation or molecular weight, and for estimating the sedimentation coefficients of highly absorbing solute molecules, particularly if they are in short supply and not very pure.
ACTIVE ENZYME SEDIMENTATIONBand sedimentation is well suited for a study of the sedimentation behavior of enzyme activity, in which a zone of enzyme solution is centrifuged through a supporting solution containing chromogenic substrate. Enzyme activity results in the migration of a moving boundary of product generated as the enzyme band migrates down the cell (Kemper and Everse, 1973; Seery and Farrell, 1989). It is also possible to perform a moving boundary study in which association equilibria can be more rigorously analyzed (Llewellyn and Smith, 1978).
The underlying theory is difficult and the method is prone to artifacts.Several authors have described in some detail the design of experiments and methods for calculation, and have discussed potential problems and how to avoid them (Cohen and Mire, 1971; Kemper and Everse, 1973; Llewellyn and Smith, 1978). Studies such as this are facilitated with sensitive optics and a computer interface (Seery and Farrell, 1989). Together with a measure of the frictional coefficient, e.g., from gel filtration, it is in principle possible to determine a reasonably accurate molecular weight for the active enzyme, even with tiny amounts of enzyme in a crude mixture.
37
DIFFUSIONAn accurate estimate of the diffusion coefficient is needed for the determination of molecular weight from the sedimentation coefficient. In addition, the diffusion coefficient by itself gives information about the size and shape of the solute particles (Tanford, 1961).
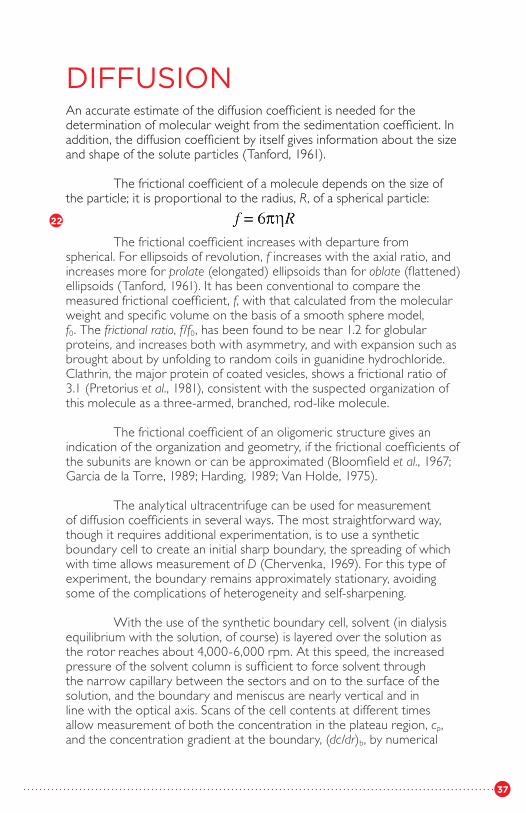
The frictional coefficient of a molecule depends on the size of the particle; it is proportional to the radius, R, of a spherical particle:
The frictional coefficient increases with departure from spherical. For ellipsoids of revolution, f increases with the axial ratio, and increases more for prolate (elongated) ellipsoids than for oblate (flattened) ellipsoids (Tanford, 1961). It has been conventional to compare the measured frictional coefficient, f, with that calculated from the molecular weight and specific volume on the basis of a smooth sphere model, f0. The frictional ratio, f/f0, has been found to be near 1.2 for globular proteins, and increases both with asymmetry, and with expansion such as brought about by unfolding to random coils in guanidine hydrochloride. Clathrin, the major protein of coated vesicles, shows a frictional ratio of 3.1 (Pretorius et al., 1981), consistent with the suspected organization of this molecule as a three-armed, branched, rod-like molecule.
The frictional coefficient of an oligomeric structure gives an indication of the organization and geometry, if the frictional coefficients of the subunits are known or can be approximated (Bloomfield et al., 1967;Garcia de la Torre, 1989; Harding, 1989; Van Holde, 1975).
The analytical ultracentrifuge can be used for measurement of diffusion coefficients in several ways. The most straightforward way, though it requires additional experimentation, is to use a synthetic boundary cell to create an initial sharp boundary, the spreading of which with time allows measurement of D (Chervenka, 1969). For this type of experiment, the boundary remains approximately stationary, avoiding some of the complications of heterogeneity and self-sharpening. With the use of the synthetic boundary cell, solvent (in dialysis equilibrium with the solution, of course) is layered over the solution as the rotor reaches about 4,000-6,000 rpm. At this speed, the increased pressure of the solvent column is sufficient to force solvent through the narrow capillary between the sectors and on to the surface of the solution, and the boundary and meniscus are nearly vertical and in line with the optical axis. Scans of the cell contents at different times allow measurement of both the concentration in the plateau region, cp, and the concentration gradient at the boundary, (dc/dr)b, by numerical
22
38
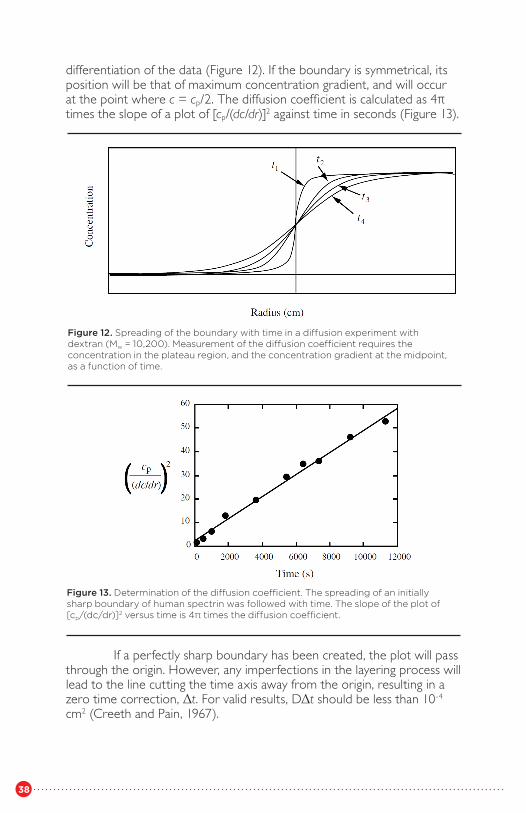
differentiation of the data (Figure 12). If the boundary is symmetrical, its position will be that of maximum concentration gradient, and will occur at the point where c = cp/2. The diffusion coefficient is calculated as 4� times the slope of a plot of [cp/(dc/dr)]2 against time in seconds (Figure 13).
If a perfectly sharp boundary has been created, the plot will passthrough the origin. However, any imperfections in the layering process willlead to the line cutting the time axis away from the origin, resulting in azero time correction, Δt. For valid results, DΔt should be less than 10-4
cm2 (Creeth and Pain, 1967).
Figure 12. Spreading of the boundary with time in a diffusion experiment with dextran (Mw = 10,200). Measurement of the diffusion coefficient requires the concentration in the plateau region, and the concentration gradient at the midpoint, as a function of time.
Figure 13. Determination of the diffusion coefficient. The spreading of an initially sharp boundary of human spectrin was followed with time. The slope of the plot of [cp/(dc/dr)]2 versus time is 4π times the diffusion coefficient.
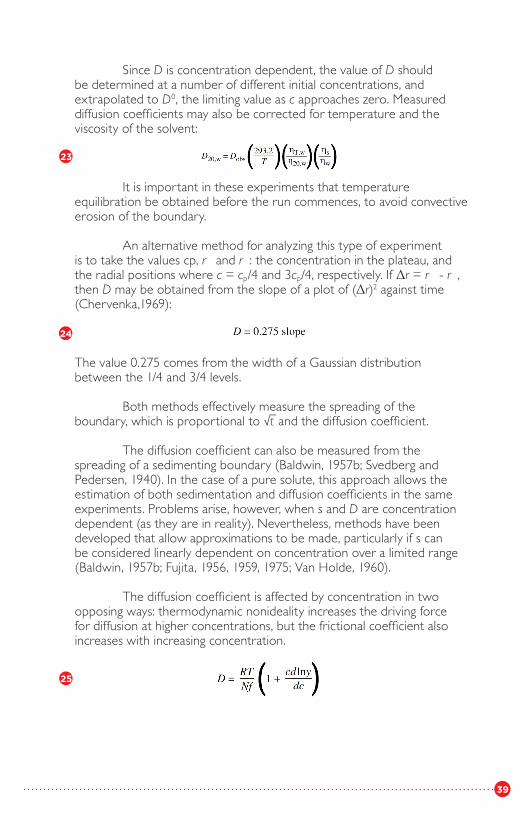
39
Since D is concentration dependent, the value of D should be determined at a number of different initial concentrations, and extrapolated to D0, the limiting value as c approaches zero. Measured diffusion coefficients may also be corrected for temperature and the viscosity of the solvent:
It is important in these experiments that temperature equilibration be obtained before the run commences, to avoid convective erosion of the boundary.
An alternative method for analyzing this type of experiment is to take the values cp, r¼ and r¾: the concentration in the plateau, and the radial positions where c = cp/4 and 3cp/4, respectively. If Δr = r¾ - r¼, then D may be obtained from the slope of a plot of (Δr)2 against time (Chervenka,1969):
The value 0.275 comes from the width of a Gaussian distribution between the 1/4 and 3/4 levels.
Both methods effectively measure the spreading of the boundary, which is proportional to �t̄ and the diffusion coefficient.
The diffusion coefficient can also be measured from the spreading of a sedimenting boundary (Baldwin, 1957b; Svedberg and Pedersen, 1940). In the case of a pure solute, this approach allows the estimation of both sedimentation and diffusion coefficients in the same experiments. Problems arise, however, when s and D are concentration dependent (as they are in reality). Nevertheless, methods have been developed that allow approximations to be made, particularly if s can be considered linearly dependent on concentration over a limited range (Baldwin, 1957b; Fujita, 1956, 1959, 1975; Van Holde, 1960).
The diffusion coefficient is affected by concentration in two opposing ways: thermodynamic nonideality increases the driving force for diffusion at higher concentrations, but the frictional coefficient also increases with increasing concentration.
23
24
25
40
where y is the activity coefficient of the solute in the g/L scale: both y and f increase with concentration. As a result, D is less sensitive to concentration than is s.
Use of s and D for molecular weight determination is only recommended for pure solutes. For mixtures, the measured values of both s and D will be average quantities, but the type of average of each is somewhat different, leading to uncertainty in the molecular weight.
The diffusion coefficient is sensitive to heterogeneity Polydispersity can be detected by comparison of the diffusion coefficient estimated from the spreading of a sedimenting boundary with the value obtained from a stationary boundary. Heterogeneity increases the apparent diffusion coefficient estimated from a sedimenting boundary compared to that measured from a stationary boundary (Schachman, 1959).
The advent of quasi-elastic laser light scattering now allows the diffusion coefficients of even very large particles to be measured in a matter of minutes (Bloomfield and Lim, 1978). For particles such as DNAand viruses, boundary spreading is so slow that measurement of diffusioncoefficients by classical methods takes days to months. Nevertheless, thevery sharp sedimenting boundaries and high absorbance coefficients alloweasy determination of s at low concentrations. Combination of sedimentation velocity data with translational diffusion coefficients from laser light scattering allows maximum use of available data (Dubin et al., 1970; Tang et al., 1989).
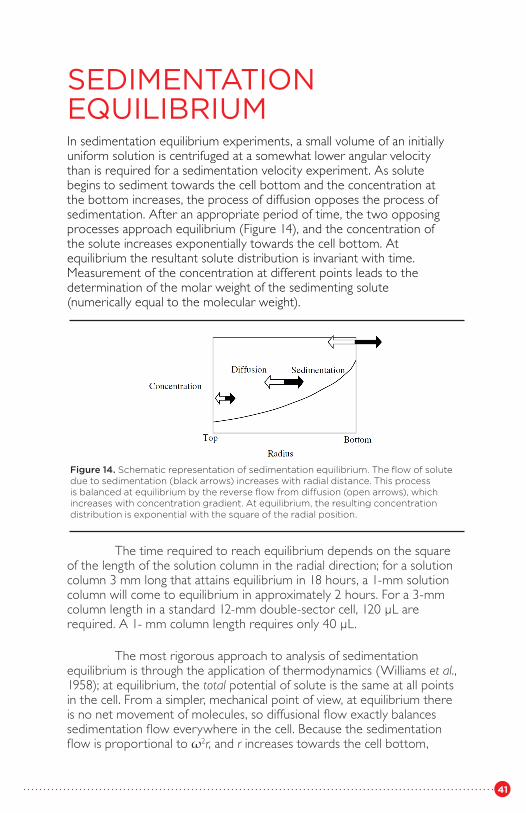
41
SEDIMENTATION EQUILIBRIUMIn sedimentation equilibrium experiments, a small volume of an initiallyuniform solution is centrifuged at a somewhat lower angular velocity than is required for a sedimentation velocity experiment. As solute begins to sediment towards the cell bottom and the concentration at the bottom increases, the process of diffusion opposes the process of sedimentation. After an appropriate period of time, the two opposing processes approach equilibrium (Figure 14), and the concentration of the solute increases exponentially towards the cell bottom. At equilibrium the resultant solute distribution is invariant with time. Measurement of the concentration at different points leads to the determination of the molar weight of the sedimenting solute (numerically equal to the molecular weight).
The time required to reach equilibrium depends on the square of the length of the solution column in the radial direction; for a solution column 3 mm long that attains equilibrium in 18 hours, a 1-mm solution column will come to equilibrium in approximately 2 hours. For a 3-mm column length in a standard 12-mm double-sector cell, 120 μL are required. A 1- mm column length requires only 40 μL.
The most rigorous approach to analysis of sedimentation equilibrium is through the application of thermodynamics (Williams et al., 1958); at equilibrium, the total potential of solute is the same at all points in the cell. From a simpler, mechanical point of view, at equilibrium there is no net movement of molecules, so diffusional flow exactly balances sedimentation flow everywhere in the cell. Because the sedimentation flow is proportional to ω2r, and r increases towards the cell bottom,
Figure 14. Schematic representation of sedimentation equilibrium. The flow of solute due to sedimentation (black arrows) increases with radial distance. This process is balanced at equilibrium by the reverse flow from diffusion (open arrows), which increases with concentration gradient. At equilibrium, the resulting concentration distribution is exponential with the square of the radial position.
42
there must be a greater sedimenting tendency at the bottom of the cell. Consequently, there must be a greater balancing tendency for diffusion in the opposite direction. Because diffusion is driven by the gradient of chemical potential (which is dependent on the concentration gradient), it follows that the concentration gradient increases towards the cell bottom. It can be shown that, for a single, ideal, nonassociating solute:
where M is the solute molar weight (in g/mol), ω the angular velocity ofthe rotor, and c the concentration of the solute (in g/L) at a radial distance r from the axis of rotation.
This means that a plot of log (concentration) versus (radius)2 for a single, ideal solute at sedimentation equilibrium yields a slope proportional to the molar weight. Alternatively, one can fit the data of c versus r2 to find the least squares best estimate of M(1 - v̄ ρ).
The sedimentation equilibrium experiment is still the best way for determining the molecular weights of macromolecules. It is applicable to a wide range of molecular sizes, from sucrose (Mr = 360; Van Holde and Baldwin, 1958) to viruses (Mr = many millions; Bancroft and Freifelder, 1970). For low molecular weight solutes, high angular velocities are required; the lower limit of molecular weight measurable depends on the maximum speed capable with the rotor or centrifuge. The upper limit of molecular weight depends on the stability of the rotor at low speeds, and the width of the meniscus. The high stability of the drive system of the Optima XL-A enables lower speeds (as low as 1,000 rpm) to be used with some confidence, and hence raises the upper limit of measurable molecular weight. At very low speeds, however, the solution meniscus is no longer nearly vertical, but displays more marked curvature as the centrifugal gravitational field decreases to become comparable with the earth’s gravitational field (Figure 15).
26
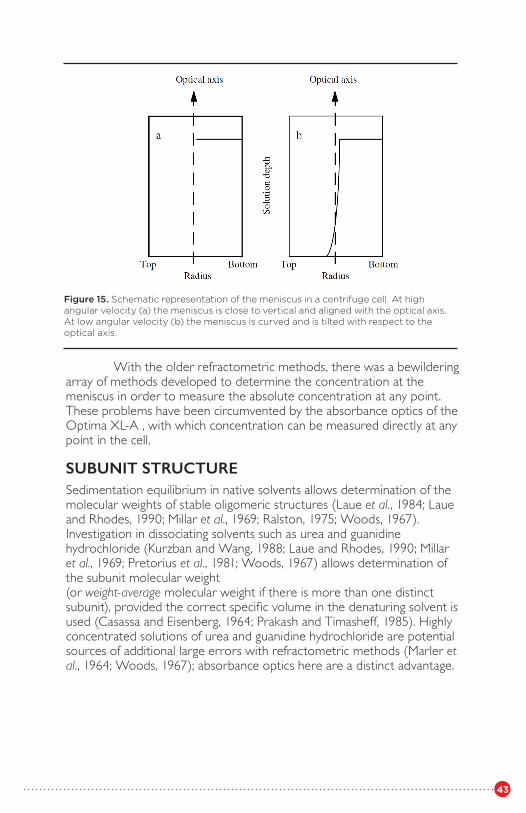
43
With the older refractometric methods, there was a bewildering array of methods developed to determine the concentration at the meniscus in order to measure the absolute concentration at any point.These problems have been circumvented by the absorbance optics of the Optima XL-A , with which concentration can be measured directly at any point in the cell.
SUBUNIT STRUCTURESedimentation equilibrium in native solvents allows determination of themolecular weights of stable oligomeric structures (Laue et al., 1984; Laueand Rhodes, 1990; Millar et al., 1969; Ralston, 1975; Woods, 1967).Investigation in dissociating solvents such as urea and guanidine hydrochloride (Kurzban and Wang, 1988; Laue and Rhodes, 1990; Millar et al., 1969; Pretorius et al., 1981; Woods, 1967) allows determination of the subunit molecular weight(or weight-average molecular weight if there is more than one distinct subunit), provided the correct specific volume in the denaturing solvent is used (Casassa and Eisenberg, 1964; Prakash and Timasheff, 1985). Highlyconcentrated solutions of urea and guanidine hydrochloride are potentialsources of additional large errors with refractometric methods (Marler etal., 1964; Woods, 1967); absorbance optics here are a distinct advantage.
Figure 15. Schematic representation of the meniscus in a centrifuge cell. At high angular velocity (a) the meniscus is close to vertical and aligned with the optical axis. At low angular velocity (b) the meniscus is curved and is tilted with respect to the optical axis.
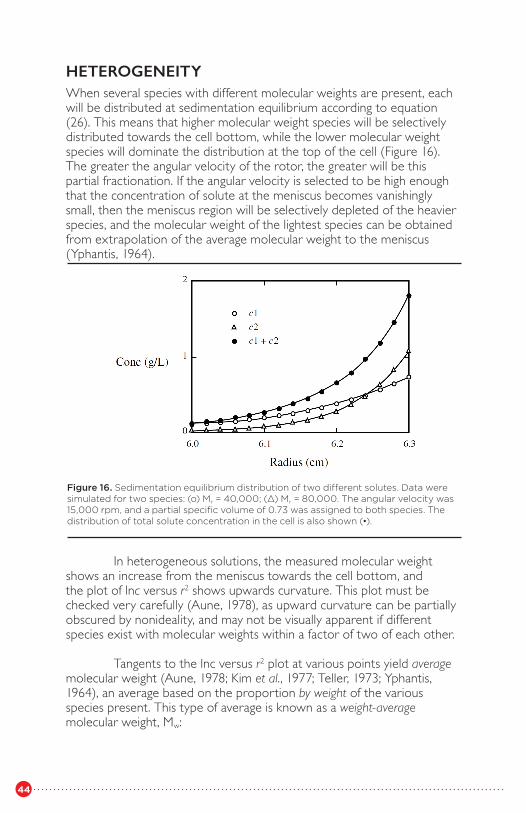
44
HETEROGENEITYWhen several species with different molecular weights are present, eachwill be distributed at sedimentation equilibrium according to equation (26). This means that higher molecular weight species will be selectivelydistributed towards the cell bottom, while the lower molecular weightspecies will dominate the distribution at the top of the cell (Figure 16). The greater the angular velocity of the rotor, the greater will be this partial fractionation. If the angular velocity is selected to be high enough that the concentration of solute at the meniscus becomes vanishingly small, then the meniscus region will be selectively depleted of the heavier species, and the molecular weight of the lightest species can be obtained from extrapolation of the average molecular weight to the meniscus (Yphantis, 1964).
In heterogeneous solutions, the measured molecular weight shows an increase from the meniscus towards the cell bottom, and the plot of lnc versus r2 shows upwards curvature. This plot must be checked very carefully (Aune, 1978), as upward curvature can be partially obscured by nonideality, and may not be visually apparent if different species exist with molecular weights within a factor of two of each other.
Tangents to the lnc versus r2 plot at various points yield averagemolecular weight (Aune, 1978; Kim et al., 1977; Teller, 1973; Yphantis, 1964), an average based on the proportion by weight of the various species present. This type of average is known as a weight-average molecular weight, Mw:
Figure 16. Sedimentation equilibrium distribution of two different solutes. Data were simulated for two species: (o) Mr = 40,000; (Δ) Mr = 80,000. The angular velocity was 15,000 rpm, and a partial specific volume of 0.73 was assigned to both species. The distribution of total solute concentration in the cell is also shown (•).
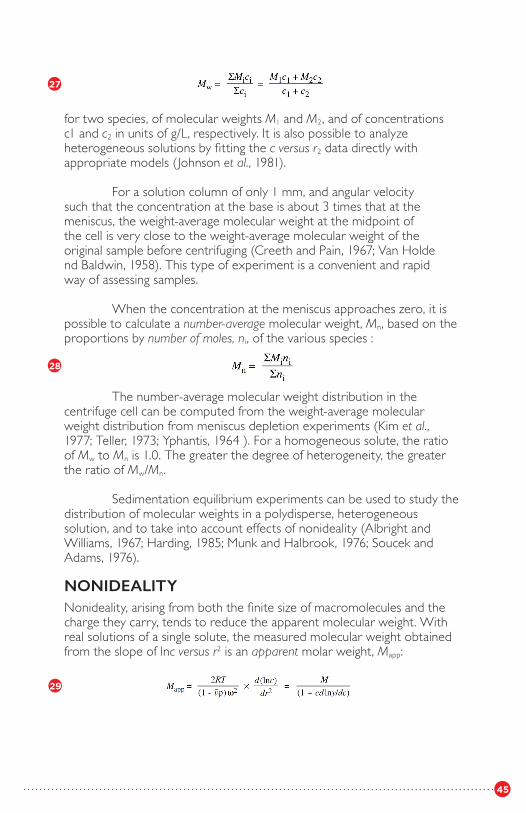
45
for two species, of molecular weights M1 and M2, and of concentrations c1 and c2 in units of g/L, respectively. It is also possible to analyze heterogeneous solutions by fitting the c versus r2 data directly with appropriate models (Johnson et al., 1981).
For a solution column of only 1 mm, and angular velocity such that the concentration at the base is about 3 times that at the meniscus, the weight-average molecular weight at the midpoint of the cell is very close to the weight-average molecular weight of the original sample before centrifuging (Creeth and Pain, 1967; Van Holde nd Baldwin, 1958). This type of experiment is a convenient and rapid way of assessing samples.
When the concentration at the meniscus approaches zero, it is possible to calculate a number-average molecular weight, Mn, based on the proportions by number of moles, ni, of the various species :
The number-average molecular weight distribution in the centrifuge cell can be computed from the weight-average molecular weight distribution from meniscus depletion experiments (Kim et al., 1977; Teller, 1973; Yphantis, 1964 ). For a homogeneous solute, the ratio of Mw to Mn is 1.0. The greater the degree of heterogeneity, the greater the ratio of Mw/Mn.
Sedimentation equilibrium experiments can be used to study thedistribution of molecular weights in a polydisperse, heterogeneous solution, and to take into account effects of nonideality (Albright and Williams, 1967; Harding, 1985; Munk and Halbrook, 1976; Soucek and Adams, 1976).
NONIDEALITYNonideality, arising from both the finite size of macromolecules and thecharge they carry, tends to reduce the apparent molecular weight. With real solutions of a single solute, the measured molecular weight obtained from the slope of lnc versus r2 is an apparent molar weight, Mapp:
27
28
29
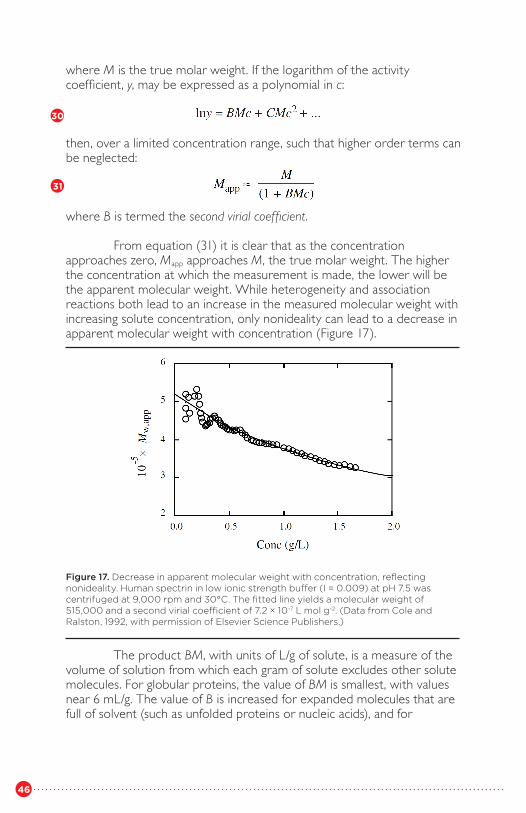
46
where M is the true molar weight. If the logarithm of the activity coefficient, y, may be expressed as a polynomial in c:
then, over a limited concentration range, such that higher order terms canbe neglected:
where B is termed the second virial coefficient.
From equation (31) it is clear that as the concentration approaches zero, Mapp approaches M, the true molar weight. The higher the concentration at which the measurement is made, the lower will be the apparent molecular weight. While heterogeneity and association reactions both lead to an increase in the measured molecular weight with increasing solute concentration, only nonideality can lead to a decrease in apparent molecular weight with concentration (Figure 17).
The product BM, with units of L/g of solute, is a measure of thevolume of solution from which each gram of solute excludes other solutemolecules. For globular proteins, the value of BM is smallest, with valuesnear 6 mL/g. The value of B is increased for expanded molecules that arefull of solvent (such as unfolded proteins or nucleic acids), and for
30
31
Figure 17. Decrease in apparent molecular weight with concentration, reflecting nonideality. Human spectrin in low ionic strength buffer (I = 0.009) at pH 7.5 was centrifuged at 9,000 rpm and 30°C. The fitted line yields a molecular weight of 515,000 and a second virial coefficient of 7.2 × 10⁻⁷ L mol g-2. (Data from Cole and Ralston, 1992, with permission of Elsevier Science Publishers.)
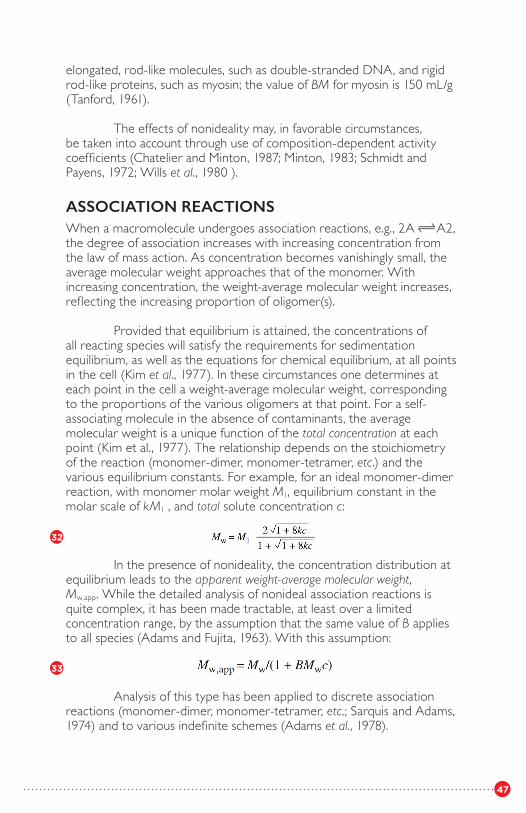
47
elongated, rod-like molecules, such as double-stranded DNA, and rigid rod-like proteins, such as myosin; the value of BM for myosin is 150 mL/g(Tanford, 1961).
The effects of nonideality may, in favorable circumstances, be taken into account through use of composition-dependent activity coefficients (Chatelier and Minton, 1987; Minton, 1983; Schmidt and Payens, 1972; Wills et al., 1980 ).
ASSOCIATION REACTIONSWhen a macromolecule undergoes association reactions, e.g., 2A A2,the degree of association increases with increasing concentration from the law of mass action. As concentration becomes vanishingly small, theaverage molecular weight approaches that of the monomer. With increasing concentration, the weight-average molecular weight increases, reflecting the increasing proportion of oligomer(s).
Provided that equilibrium is attained, the concentrations of all reacting species will satisfy the requirements for sedimentation equilibrium, as well as the equations for chemical equilibrium, at all points in the cell (Kim et al., 1977). In these circumstances one determines at each point in the cell a weight-average molecular weight, corresponding to the proportions of the various oligomers at that point. For a self-associating molecule in the absence of contaminants, the average molecular weight is a unique function of the total concentration at each point (Kim et al., 1977). The relationship depends on the stoichiometry of the reaction (monomer-dimer, monomer-tetramer, etc.) and the various equilibrium constants. For example, for an ideal monomer-dimer reaction, with monomer molar weight M1, equilibrium constant in the molar scale of kM1 , and total solute concentration c:
In the presence of nonideality, the concentration distribution atequilibrium leads to the apparent weight-average molecular weight,Mw,app. While the detailed analysis of nonideal association reactions isquite complex, it has been made tractable, at least over a limited concentration range, by the assumption that the same value of B applies to all species (Adams and Fujita, 1963). With this assumption:
Analysis of this type has been applied to discrete association reactions (monomer-dimer, monomer-tetramer, etc.; Sarquis and Adams, 1974) and to various indefinite schemes (Adams et al., 1978).
32
33
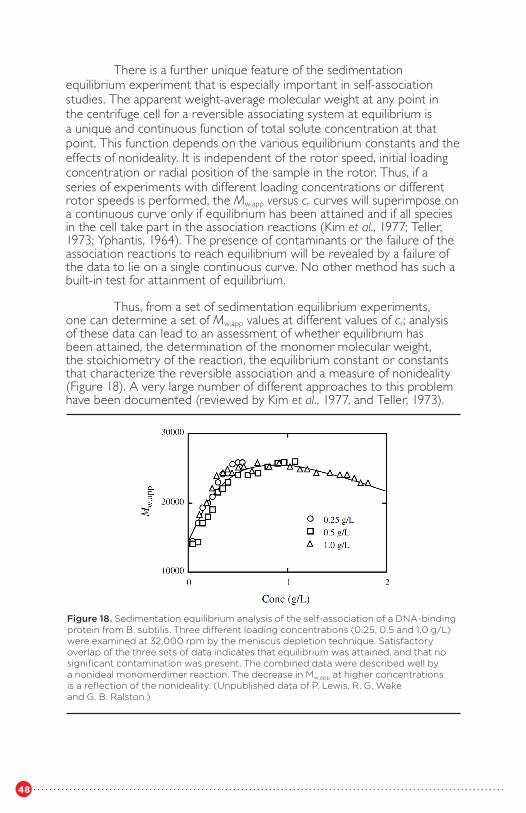
48
There is a further unique feature of the sedimentation equilibrium experiment that is especially important in self-association studies. The apparent weight-average molecular weight at any point in the centrifuge cell for a reversible associating system at equilibrium is a unique and continuous function of total solute concentration at that point. This function depends on the various equilibrium constants and the effects of nonideality. It is independent of the rotor speed, initial loading concentration or radial position of the sample in the rotor. Thus, if a series of experiments with different loading concentrations or different rotor speeds is performed, the Mw,app versus cr curves will superimpose on a continuous curve only if equilibrium has been attained and if all species in the cell take part in the association reactions (Kim et al., 1977; Teller, 1973; Yphantis, 1964). The presence of contaminants or the failure of the association reactions to reach equilibrium will be revealed by a failure of the data to lie on a single continuous curve. No other method has such a built-in test for attainment of equilibrium.
Thus, from a set of sedimentation equilibrium experiments, one can determine a set of Mw,app values at different values of cr; analysis of these data can lead to an assessment of whether equilibrium has been attained, the determination of the monomer molecular weight, the stoichiometry of the reaction, the equilibrium constant or constants that characterize the reversible association and a measure of nonideality (Figure 18). A very large number of different approaches to this problem have been documented (reviewed by Kim et al., 1977, and Teller, 1973).
Figure 18. Sedimentation equilibrium analysis of the self-association of a DNA-binding protein from B. subtilis. Three different loading concentrations (0.25, 0.5 and 1.0 g/L) were examined at 32,000 rpm by the meniscus depletion technique. Satisfactory overlap of the three sets of data indicates that equilibrium was attained, and that no significant contamination was present. The combined data were described well by a nonideal monomerdimer reaction. The decrease in Mw,app at higher concentrations is a reflection of the nonideality. (Unpublished data of P. Lewis, R. G. Wake and G. B. Ralston.)
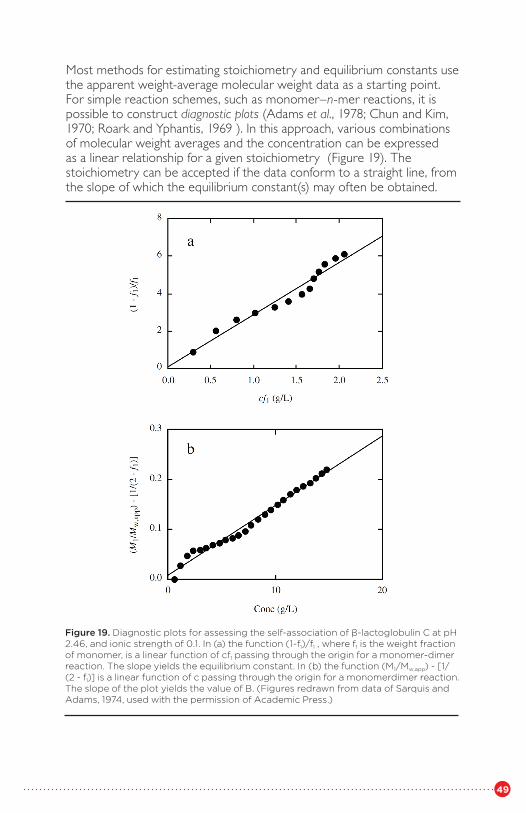
49
Most methods for estimating stoichiometry and equilibrium constants use the apparent weight-average molecular weight data as a starting point. For simple reaction schemes, such as monomer–n-mer reactions, it is possible to construct diagnostic plots (Adams et al., 1978; Chun and Kim, 1970; Roark and Yphantis, 1969 ). In this approach, various combinations of molecular weight averages and the concentration can be expressed as a linear relationship for a given stoichiometry (Figure 19). The stoichiometry can be accepted if the data conform to a straight line, from the slope of which the equilibrium constant(s) may often be obtained.
Figure 19. Diagnostic plots for assessing the self-association of β-lactoglobulin C at pH 2.46, and ionic strength of 0.1. In (a) the function (1-f1)/f1 , where f1 is the weight fraction of monomer, is a linear function of cf1 passing through the origin for a monomer-dimer reaction. The slope yields the equilibrium constant. In (b) the function (M1/Mw,app) - [1/(2 - f1)] is a linear function of c passing through the origin for a monomerdimer reaction. The slope of the plot yields the value of B. (Figures redrawn from data of Sarquis and Adams, 1974, used with the permission of Academic Press.)
50
Similar diagnostic plots have been developed for the isodesmic reaction model (Chun and Kim, 1970), in which a monomer may add to any pre-existing oligomer with equal change in free-energy:
Although in their simplest form, such expressions are based on the assumption of ideal behavior, it is possible to take nonideality into account (at least as a first approximation) through the use of the Adams and Fujita (1963) assumption of a single value of B for all species. With this assumption, the nonideal terms may be eliminated by appropriate combinations of the various molecular weight averages; the resulting “ideal moments” may then be analyzed as for an ideal reaction (Adams et al., 1978; Roark and Yphantis, 1969; Sarquis and Adams, 1974).
For a given simple stoichiometry (e.g., monomer–n-mer), it is often possible to express the equilibrium constant as an explicit (but nonlinear) function of Mw,app, c, B, and the stoichiometry. This equation can be solved for K given selected values of B on the basis of trial-and-error (Deonier and Williams, 1970; Van Holde and Rossetti, 1967). If the stoichiometry is appropriate, and the correct value of B is chosen, the calculated values of K will be constant. However, if the stoichiometry is inappropriate, a constant value of K cannot be obtained for any value of B.
One of the most frequently used methods of analysis is one that was originally used by Steiner in 1952 for light scattering data (for a morecomplete description of the method and its many variants see Teller, 1973). For an ideal self-association reaction, the total concentration of solute can be expressed as a simple polynomial in the concentration of monomer, in which the relevant association constants appear in the coefficients. Integration of a plot of [(M1/Mw) - 1]/c versus c allows the determination of the quantity c/c1. Successive differentiation of the (c/c1) versus c1 data allows the evaluation of successive equilibrium constants. This approach can also be adapted to the nonideal case (Adams and Fujita, 1963). In this approach, however, uncertainties in the calculations accumulate at each step.
A variety of curve-fitting approaches allow assessment of the most appropriate stoichiometry, the monomer molecular weight, the relevant equilibrium constants, and the second virial coefficient from data of apparent weight-average molecular weight versus concentration (Cole and Ralston, 1992; Ralston, 1991; Teller, 1973; Visser et al., 1972). Iterativeprocedures are needed for nonideal cases and when M1 is not known, butwith the availability of computers and nonlinear regression software, suchprocedures are now relatively accessible.
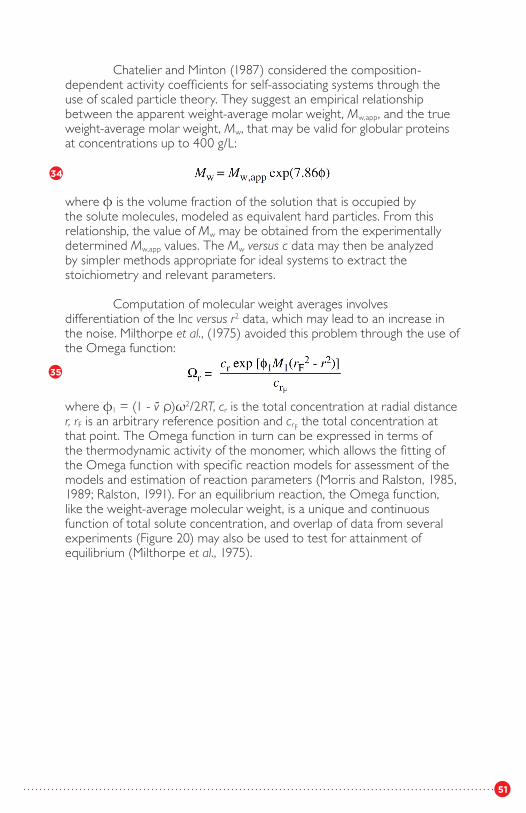
51
Chatelier and Minton (1987) considered the composition-dependent activity coefficients for self-associating systems through the use of scaled particle theory. They suggest an empirical relationship between the apparent weight-average molar weight, Mw,app, and the true weight-average molar weight, Mw, that may be valid for globular proteins at concentrations up to 400 g/L:
where ϕ is the volume fraction of the solution that is occupied by the solute molecules, modeled as equivalent hard particles. From this relationship, the value of Mw may be obtained from the experimentally determined Mw,app values. The Mw versus c data may then be analyzed by simpler methods appropriate for ideal systems to extract the stoichiometry and relevant parameters.
Computation of molecular weight averages involves differentiation of the lnc versus r2 data, which may lead to an increase in the noise. Milthorpe et al., (1975) avoided this problem through the use of the Omega function:
where ϕ1 = (1 - v̄ ρ)ω2/2RT, cr is the total concentration at radial distance r, rF is an arbitrary reference position and crF the total concentration at that point. The Omega function in turn can be expressed in terms of the thermodynamic activity of the monomer, which allows the fitting of the Omega function with specific reaction models for assessment of the models and estimation of reaction parameters (Morris and Ralston, 1985, 1989; Ralston, 1991). For an equilibrium reaction, the Omega function, like the weight-average molecular weight, is a unique and continuous function of total solute concentration, and overlap of data from several experiments (Figure 20) may also be used to test for attainment of equilibrium (Milthorpe et al., 1975).
34
35
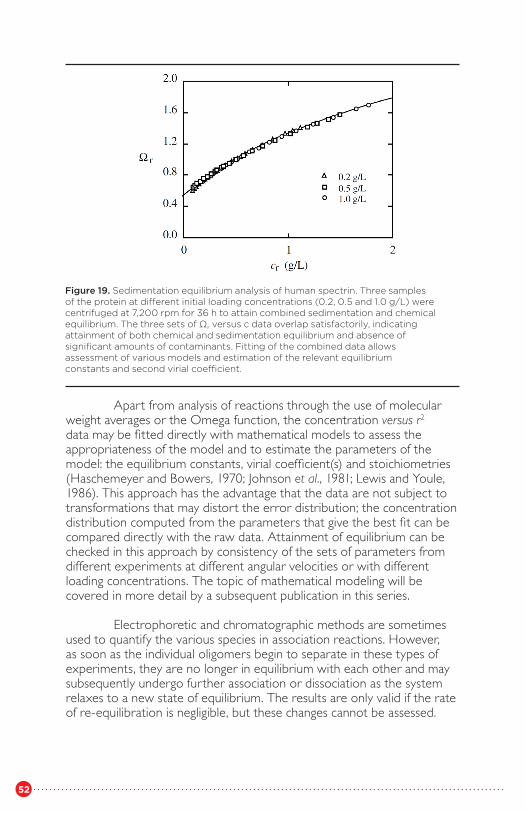
52
Apart from analysis of reactions through the use of molecular weight averages or the Omega function, the concentration versus r2 data may be fitted directly with mathematical models to assess the appropriateness of the model and to estimate the parameters of the model: the equilibrium constants, virial coefficient(s) and stoichiometries (Haschemeyer and Bowers, 1970; Johnson et al., 1981; Lewis and Youle, 1986). This approach has the advantage that the data are not subject to transformations that may distort the error distribution; the concentration distribution computed from the parameters that give the best fit can be compared directly with the raw data. Attainment of equilibrium can be checked in this approach by consistency of the sets of parameters from different experiments at different angular velocities or with different loading concentrations. The topic of mathematical modeling will be covered in more detail by a subsequent publication in this series.
Electrophoretic and chromatographic methods are sometimes used to quantify the various species in association reactions. However, as soon as the individual oligomers begin to separate in these types of experiments, they are no longer in equilibrium with each other and may subsequently undergo further association or dissociation as the system relaxes to a new state of equilibrium. The results are only valid if the rate of re-equilibration is negligible, but these changes cannot be assessed.
Figure 19. Sedimentation equilibrium analysis of human spectrin. Three samples of the protein at different initial loading concentrations (0.2, 0.5 and 1.0 g/L) were centrifuged at 7,200 rpm for 36 h to attain combined sedimentation and chemical equilibrium. The three sets of Ωr versus c data overlap satisfactorily, indicating attainment of both chemical and sedimentation equilibrium and absence of significant amounts of contaminants. Fitting of the combined data allows assessment of various models and estimation of the relevant equilibrium constants and second virial coefficient.
53
The assumption of a single parameter, B, to take account of all nonideal interactions may be valid for some proteins over a limited concentration range; at higher concentrations, more complex expressions are required (Chatelier and Minton, 1987; Minton, 1983; Schmidt and Payens, 1972; Wills et al., 1980).
Sedimentation equilibrium experiments in the analytical ultracentrifuge are uniquely suited to this type of analysis because a range of concentrations is provided in each experiment, from low values at the meniscus to higher values at the cell bottom, and because the association reaction is studied at chemical equilibrium. Sedimentation equilibrium can be used to study association reactions in solutes with monomer molecular weights as small as that of N-methyl acetamide (Mr = 73; Howlett et al., 1973) and purine (Mr = 120; Van Holde and Rossetti, 1967) up to half a million (Morris and Ralston, 1989).
DETERMINATION OF THERMODYNAMIC PARAMETERSAn understanding of the interactions between protein molecules requiresanswers to the following questions: which substances take part in thereactions? how many molecules of each are involved? what is the biological function of the interactions? what is the strength of interaction? which parts of the molecules are involved in the interaction?
The stoichiometry is a foundation on which additional knowledge (such as the hydrodynamic properties) may be built up to elucidate the overall configuration of the oligomer. The equilibrium constants hold information about the nature of the association reaction. The partitioning of the binding energy can be achieved from careful studies of the effects of environmental variables on the equilibrium constant(s) in order to determine the types of groups involved in the interaction. The temperature dependence of the equilibrium constant yields the enthalpy change for the reaction:
If the enthalpy and entropy of association are constant over thetemperature range of the experiments, ΔH° and ΔS° may be obtained from the slope and intercept, respectively, of a plot of lnK versus 1/T (Sackett and Lippoldt, 1991). However, if such a plot is not linear, ΔH° may be obtained for specified temperatures from the local slope, and ΔS°
36
37
54
may be obtained from ΔG° and ΔH° by difference. In these latter cases, the association reaction is accompanied by a significant change in the molar heat capacity, ΔCP:
Examination of the relative magnitudes of these thermodynamicparameters allows assessment of the types of interaction involved in theassociation. Hydrogen bonding and van der Waals interactions are characterized by negative standard enthalpies and entropies of association; electrostatic interactions are characterized by small changes in standard enthalpy and a positive ΔS°; hydrophobic interactions are characterized by positive changes in the standard entropy and enthalpy and by a negative heat capacity (Ross and Subramanian, 1981).
Additional information on the roles of ionic interactions comes from the ionic strength- and pH-dependence of the equilibrium constants (Aune and Timasheff, 1971; Aune et al., 1971; Cole and Ralston, 1992; Kim et al., 1977; Ralston, 1991). Under favorable circumstances, study of the pH-dependence allows estimation of the pKa values of the ionizable groups involved in association (Aune and Timasheff, 1971).
DETERGENT-SOLUBILIZED PROTEINSProteins in membranes may often be isolated in apparently functional form by the use of appropriate nonionic detergents. The determination ofmolecular weight in these solutions (Mulzer et al., 1990; Schubert et al.,1983) formally requires a knowledge of the amount of detergent bound, or determination of the apparent specific volume of the complex, a luxury that comes at a heavy price in terms of amounts of protein required. Reynolds and colleagues have shown that knowledge of detergent binding becomes unnecessary, if sedimentation equilibrium experiments are performed in solutions where the density is the same as that of the bound detergent; under these conditions, the detergent becomes effectively transparent to the gravitational field (Reynolds and McCaslin, 1985; Winnard et al., 1989). Density adjustment is best done with D2O; use of sucrose or salts to raise the density introduces the complication of preferential solvation. It is also imperative that the detergent be free of peroxide contaminants to avoid the possibility of artifacts (Schubert et al., 1983). Sedimentation velocity experiments, on the other hand, cannot be so easily corrected, as the bound detergent affects the size of the particle. Molecular weights of the subunits may be determined in a similar manner, but with the use of dodecyl sulfate (Tanford and Reynolds, 1976).
38
55
BEHAVIOR IN “CROWDED” SOLUTIONSThe environment within cells and biological fluids is often vastly different from the very dilute solutions studied in laboratories. It is becoming increasingly apparent that the crowded molecular conditions encountered in vivo can have dramatic effects on macromolecular interactions (Minton, 1983; Ralston, 1990).
Nonideal effects in concentrated solutions of macromolecules favor compact conformations and associated states (Minton, 1983). Reactions can occur in crowded solutions that are undetectable in dilute solution.
The pyruvate dehydrogenase complex of Azotobacter vinelandii exists in dilute solution as particles of sedimentation coefficient 17-20 S; in the presence of 3% polyethylene glycol, an inert space-filling molecule, these particles aggregate to form 50-60 S clusters (Bosma et al., 1980; Nichol and Ogston, 1981). Complexes between macromolecules may exist within the crowded cytosol that are not detectable in dilute solution (Minton, 1983; Ralston, 1990).
The analytical ultracentrifuge is amenable to the study of crowding effects. Crowding effects may be studied in model systems in which the macromolecule of interest is in the presence of a relatively high concentration of inert solute such as sucrose, dextran or polyethylene glycol (Murthy et al., 1988). The absorbance optical system of the Optima XL-A is well suited to this type of experiment, since the concentration distribution of protein or nucleic acid can be measured, largely unaffected by the presence of the nonabsorbing inert solute.
Sedimentation equilibrium measurements allow the investigation of both the self-interactions of macromolecules at high concentrations (Brian et al., 1981; Minton and Lewis, 1981) and the crowding effects of solutes like sucrose or dextran on association and conformation equilibria as a model of crowding processes in vivo (Shearwin and Winzor, 1988). When thermodynamic information is lacking, sedimentation velocity experiments can also provide an approximate measure of the effective radius of macromolecules.
ARCHIBALD APPROACH-TO-EQUILIBRIUM METHODThis method uses information of the concentration gradients, at the meniscus and base during the early stages of an equilibrium experiment, in order to calculate molecular weights. It is based on the fact that, as no solute can cross the meniscus and base, there can be no net flow of solute there, and the conditions of equilibrium apply (Archibald, 1947;
56
Schachman, 1959). The advantages of this method, that it was well suited to schlieren optics, and that times of centrifugation were relatively brief, are no longer as important as they were; high speed experiments and short solution columns have considerably decreased the times required for equilibrium experiments (Sackett and Lippoldt, 1991), and this method is rarely used now. However, there is potential for its revival for use with absorbance optics and appropriate software (Holleman, 1973).
Holladay (1979) has described a method whereby both the sedimentation coefficient and the molecular weight may be obtained from the early stages of a sedimentation equilibrium experiment, on the assumption that s is independent of c. The method yielded satisfactory estimates of the molecular weights of several proteins, but was less accurate for the determination of s. Application of more rigorous criteria, while involving intensive calculation, should be possible now with the ability to collect large amounts of data, and with a computer dedicated to the experiment.
57
DENSITY GRADIENT SEDIMENTATIONEQUILIBRIUM (ISOPYCNIC SEDIMENTATIONEQUILIBRIUM)This approach relies on the banding of a macromolecule within a gradient of density at a point where (1 - v̄ ρ) = 0. It has been termed equilibrium banding or isopycnic sedimentation equilibrium. With this method it is possible to measure the buoyant density of a particle, and to make analytical separations based on differences in this buoyant density (Meselson et al., 1957; Szybalski et al., 1971). In a preparative ultracentrifuge, it is also possible to isolate preparative quantities of the separated species.
In this type of experiment, a solution of the macromolecule in an appropriate concentration of the density gradient solute is centrifuged until equilibrium is attained. Redistribution of the density gradient solute, usually cesium chloride or cesium sulfate, leads to a density gradient from the meniscus to the base, and the macromolecules migrate to the position in this gradient where the density of the solvated particles equals that of the solution. Knowledge of the initial concentration of the gradient material, its molecular weight and partial specific volume, and its activity coefficient as a function of concentration allows the calculation of the equilibrium density gradient (Hearst and Schmid, 1973; Minton, 1992), and hence determination of the buoyant density of the macromolecule. The density gradient may also be calibrated with markers to determine the effective local gradient in the vicinity of the macromolecular solute (Hearst and Schmid, 1973).
Historically, this technique has been used primarily for the analysis of nucleic acids. The great sensitivity of the method to small density differences, such as that brought about by replacement of 14N with 15N, has led to significant advances in our understanding of the mechanism of nucleic acid replication (Meselson and Stahl, 1958).
Differences in buoyant density can arise from differences in composition, for example in base composition of nucleic acids (Sueoka et al., 1959), and can be manipulated by the incorporation of compounds such as bromouracil (Szybalski et al., 1971). Changes in buoyant density also arise from differences in solvation and ion-binding (Ifft and Vinograd, 1966; Pedersen et al., 1978a). The buoyant density of a macromolecule depends on the local composition of the solution, and may be different
58
in different gradient materials, or at different pH values (Ifft, 1973; Szybalski et al., 1971).
The buoyant densities of proteins are a function of pH; deprotonation of carboxyl groups, for example, leads to increased binding of cesium ions, with an increase in buoyant density, while deprotonation of lysine residues leads to the loss of binding of the less dense chloride ions, also leading to an increase in buoyant density (Ifft, 1973; Pedersen et al., 1978a).
The width of the band of macromolecules is a function of the molecular weight, as well as of the steepness of the local density gradient (Hearst and Schmid, 1973) and the heterogeneity of the samples. For highmolecular weight materials, like DNA, the bands may be very narrow.Because of the high absorbance of nucleic acids, these materials are wellsuited to study by means of absorbance optics; only a few micrograms arerequired. With proteins, on the other hand, the width of the band mayoccupy a large part of the cell (Ifft, 1973). It is also possible to examinethe buoyant densities of crystalline materials, which form extremely sharpbands (Pedersen et al., 1978b).
It should be noted that in density gradient work, the molecular weight and specific volume of the macromolecule as determined from theposition of the band are not those of the anhydrous species because ofsubstantial interaction with the gradient-forming solute (Ifft and Vinograd, 1966). Because the buoyant density is determined in a solvent that is very different from dilute aqueous solutions, its inverse should not be used to approximate the partial specific volume that is appropriate for dilute aqueous solutions.
Equilibrium density gradient sedimentation is especially useful in the examination of the assembly of complex macromolecular structures and for the study of hetero-molecular associations; e.g., protein-nucleic acid interactions and protein-lipid interactions (Adams and Schumaker, 1970). Because of the very different partial specific volumes of nucleic acids and proteins in such systems, changes in molecular weight may be small, yet accompanied by useful changes in density, permitting the collection of information that cannot be obtained by any other method.
Preparative centrifuges are often used for preparative isolation of specific materials in density gradient sedimentation. Nevertheless, analytical instruments allow both analysis of experiments in progress, and the rapid development of protocols for density gradient work.
59
RELATIONSHIP WITH OTHER TECHNIQUESAny physical measurement is sensitive to a particular property (or group of properties) of the system under study. It is clear that a single techniquecannot provide all the answers that a researcher wishes to know. Only byjudicious application of a number of different techniques, sensitive todifferent properties, can a clear and unambiguous picture emerge.
There has been a tendency in recent years to apply methods that are quick, sample efficient and cheap. The routine use of sedimentation velocity and sedimentation equilibrium experiments for examining sample purity have been replaced largely by simpler, more sensitive, less expensive and more rapid electrophoretic and chromatographic methods. Gel electrophoresis allows extremely high resolution separation of many species in a mixture, with many samples being run at the same time. For semiquantitative exploratory work, that is obviously attractive and efficient. However, while gel electrophoretic methods are undoubtedly sensitive and convenient for the detection of contaminants, there are several ways in which these methods may fail: (1) very large aggregates may not enter the gels; (2) very small contaminants may be eluted from the gel during fixing and staining; and (3) some components may not stain.
For more quantitative work, methods with a more rigorous base are needed. Estimates of molecular weight from gel filtration and gel electrophoresis are about as precise and reliable as estimates made from sedimentation coefficient alone (Van Holde, 1975). Both are based on assumptions of shape for the particles. However, combination of both data allows (as a reasonable approximation) the elimination of the gross assumption. The chromatographic behavior reflects more clearly the frictional coefficient rather than molecular weight; by comparing with suitable standards of known frictional coefficient (or diffusion coefficient) these methods give reasonable estimates of D, which, together with s from analytical ultracentrifugation, can give a more accurate, less ambiguous estimate of M (Siegel and Monty, 1966).
On the other hand, mass spectrometry is capable of extraordinary accuracy and precision for the determination of molecular weight of pure proteins (Jardine, 1990). The method is less applicable to polydisperse samples, nor can it be applied to studies of reversible association or nonideality. Methods with a thermodynamic foundation, such as osmotic pressure and light scattering, are well suited to this latter function, especially in high concentrations (Minton and Edelhoch, 1982). These methods do not offer the enormous advantage of sedimentation
60
equilibrium of covering a wide range of concentrations in a single experiment, nor the built-in test for attainment of equilibrium, and considerable practical difficulties make them difficult to apply.
The molecular weights of very large molecules, such as RNA andDNA, are difficult to measure accurately by means of sedimentation.Viscometry and viscoelasticity may be a more convenient method; combination of such molecular weight data with sedimentation coefficients (which are simpler to determine than are molecular weights) leads to information about conformation (Freerksen et al., 1990). Empirical relationships between sedimentation coefficients and molecular weights for particular classes of compounds (such as DNA) can also be useful for estimation of approximate molecular weights (Freifelder, 1970).
Hydrodynamic properties reflecting the sizes and shapes of macromolecules may be studied by means of electrophoretic and chromatographic methods. The greatest advantage of electrophoresis at present seems to be its superior resolution, particularly in the technique of capillary electrophoresis. For assessment of homogeneity such resolution is an obvious benefit, particularly as electrophoretic methods are sensitive to charge, a property that only indirectly affects sedimentation. High performance liquid chromatography (HPLC) in all its various flavors, also offers quantitation and excellent resolution, based on a number of different chromatographic principles. If one is investigating heterogeneity, then the use of at least one of these methods is almost mandatory.
Both gel filtration (Winzor, 1981) and affinity chromatography(Bergman and Winzor, 1986) also offer the promise of quantitativeanalysis of interactions. Ligand binding is amenable to analysis by meansof radiolabel methods in a variety of forms, and to fluorescence andabsorbance spectroscopy.
Conformation changes, reflected in small changes in hydrodynamic properties (Kirschner and Schachman, 1971), or accompanying association reactions (Shire et al., 1991; Smith et al., 1973) may also lead to substantial changes in fluorescence, absorbance, optical rotation and circular dichroism. Detailed study of the 3-D arrangement of the atoms in suitable macromolecules may be achieved through X-ray crystallography and multidimensional NMR.
The area in which analytical ultracentrifugation is unsurpassed is the study of association reactions at equilibrium. However, even here, ambiguities may require the recruitment of other techniques. It may often be difficult to distinguish between several models that describe the experimental data equally well. In such cases, electrophoretic or
61
chromatographic methods, though not thermodynamically rigorous, may provide the resolving power to discriminate between the competing models. Forb example, the self-association of the protein spectrin, from red blood cell membranes, may be described equally well by a model involving an indefinite series of species: dimer, tetramer, hexamer, etc., or models that are limited to three or four species (Morris and Ralston, 1989). Acrylamide gradient electrophoresis, however, allows the resolution of species at least up to the dodecamer. On these grounds, we would reject the limited models.
Electron microscopy allows the visualization of macromolecules in vacuo, and after treatment by some means to enhance contrast. Therelevance of these images to the structures that exist in solution may beassessed by comparison of measured molecular weight with that calculated from the dimensions of the images (Laue and Rhodes, 1990; Peters et al., 1992; Van Holde et al., 1991) and by comparison of the measured sedimentation coefficient with that computed from the geometry of the images (Garcia de la Torre, 1989; Van Holde, 1975).
Radiation inactivation allows estimation of the size of large protein complexes in membranes, as they exist in the membrane, and without the need for solubilization. However, the possibility of artifacts is always present, and such methods should be complemented by others to develop a consistent model.
62
THE FUTURECareful, quantitative studies of self-association of proteins have led to anincreased understanding of the forces involved in association, and byextension, those forces also involved in protein folding. However, therelative contributions of the different types of force have been difficult toseparate and evaluate in the past. Traditionally, one could exploit theeffects of changes in solution conditions: temperature, pH and ionicstrength (Aune and Timasheff, 1971; Aune et al., 1971; Cole and Ralston,1992; Luther et al., 1986; Ralston, 1991; Sackett and Lippoldt, 1991;Tindall and Aune, 1982). Additionally, some perturbation could be studiedthrough the use of specific chemical modification or the availability ofgenetic variants (McKenzie, 1967).
With the power of site-directed mutagenesis to generate specifically modified proteins almost at will, the ability exists now to explore the effects of specific amino acid replacements on the thermodynamics of association reactions and protein folding (Newell and Schachman, 1990). At the very least, analytical ultracentrifugation will be a useful adjunct for monitoring possible changes in conformation and quaternary structure.
Also, the use of recombinant technologies to generate reasonable quantities of proteins that exist in vivo in tiny amounts, but which may have profound biological activities, now allows the physical characterization of these important proteins (Arakawa et al., 1991; Gill et al., 1991; Yphantis and Arakawa, 1987), as part of the overall understanding of their functioning. No longer is the protein chemist restricted to physical characterization of albumin, chymotrypsin and milk proteins; although thorough study of these readily available proteins undoubtedly laid the foundations for current understanding of protein structure in general.
The recent availability of biologically interesting proteins hasprompted a surge of activity in the determination of tertiary structure bymeans of crystallography and multidimensional NMR, particularly withthose proteins that are involved in regulation of gene expression. Thesetypes of studies are compromised by the presence of contaminants or byassociation reactions; NMR signals are broadened with increasing molecular weight. Careful assessment and control of the self-association of such proteins under the conditions of the NMR experiments are prerequisites for meaningful analysis of their tertiary structures.
There is growing interest in the study of complex, high molecular weight structures that may exist within the cell, stabilized by the presence of high concentrations of space-filling molecules in the
63
cytosol. To understand fully structures such as multi-enzyme complexes, protein-nucleic acid complexes, and cytoskeletal assemblies will require a combination of techniques including gel electrophoresis, electron microscopy, and sedimentation analysis. Sedimentation methods provide access to the study of such systems that cannot be provided by any other analytical method.
Self-association of proteins has yielded to quantitative analysis by means of sedimentation equilibrium methods. The problem of heterogeneous association is more difficult, but is not intractable. Success has been achieved with interactions that can be studied under conditions that approximate ideality (Lakatos and Minton, 1991; Lollar, 1987; Mulzer et al., 1990; Nichol and Winzor, 1964; Poon and Schumaker, 1991; Tindall and Aune, 1982). The effects of nonideality in heterogeneous associations are also under scrutiny (Nichol and Winzor, 1976; Nichol et al., 1976; Ogston and Winzor, 1975).
Progress is expected in more complex systems: the organization of the crystallins of the mammalian lens (Augusteyn et al., 1988); assembly of supramolecular structures such as virus coats (Correia et al., 1985), actin filaments (Attri et al., 1991), and tubulin (Sackett and Lippoldt, 1991);competition between inter- and intra-molecular interactions in DNA (Ross et al., 1991); and protein-DNA interaction (Hansen et al., 1989).
Much of the fundamental theoretical work on sedimentation analysis was done by Svedberg and his colleagues before 1940. In the two decades following, a great deal of refinement was made to the theory. Sadly, much of this has since been neglected. The Model E analytical ultracentrifuge, although beloved by those who knew it, was frightening to the newcomer. The theory was often difficult, and the amount of manual calculation required for some of the more sophisticated analyses was daunting. With the use of computers, things were not much better; each specialist had his or her own program that ran on a particular computer, and the data still largely had to be transcribed by hand.
With the advent of the Optima XL-A, there is now the possibility of some uniformity and portability in computer programs. The data are collected automatically by the controlling computer, and whereas the collection of 100 points would have been a herculean task in the past, it is now possible to collect many times this number of points. With massive amounts of good quality data available, and built-in computer power, it is now possible to perform routinely, with a minimum effort on the part of the operator, analyses that once would have been unthinkable.
64
REFERENCESAdams, E. T., Jr., Fujita, H. Sedimentation equilibrium in reacting systems.Ultracentrifugal Analysis in Theory and Experiment, pp. 119-129. Edited byJ. W. Williams. New York, Academic Press, 1963.
Adams, E. T., Jr., Tang, L. H., Sarquis, J. L., Barlow, G. H., Norman, W. M.Self-association in protein solutions. Physical Aspects of Protein Interactions, pp. 1-55. Edited by N. Catsimpoolas. Amsterdam, Elsevier, 1978.
Adams, G. H., Schumaker, V. N. Equilibrium banding of low-densitylipoproteins. II. Analysis of banding patterns. Biochim. Biophys. Acta 202,315-324 (1970)
Albright, D. A., Williams, J. W. Sedimentation equilibria in polydispersenonideal solutions. J. Phys. Chem. 71, 2780-2786 (1967)
Arakawa, T., Yphantis, D. A., Lary, J. W., Narhi, L. O., Lu, H. S., Prestrelski,S. J., Clogston, C. L., Zsebo, K. M., Mendiaz, E. A., Wypych, J., Langley,K. E. Glycosylated and unglycosylated recombinant-derived human stem cell factors are dimeric and have extensive regular secondary structure. J. Biol. Chem. 266, 18942-18948 (1991)
Archibald, W. J. A demonstration of some new methods of determiningmolecular weights from the data of the ultracentrifuge. J. Phys. ColloidChem. 51, 1204-1214 (1947)
Attri, A. K., Lewis, M. S., Korn, E. D. The formation of actin oligomers studied by analytical ultracentrifugation. J. Biol. Chem 266, 6815-6824 (1991)
Augusteyn, R. C., Ellerton, D., Putilina, T., Stevens, A. Specific dissociationof αB subunits from α-crystallin. Biochim. Biophys. Acta 957, 192-201 (1988)
Aune, K. C. Molecular weight measurements by sedimentation equilibrium:some common pitfalls and how to avoid them. Methods in Enzymology,Vol. 48, pp. 163-185. Edited by C. H. W. Hirs and S. N. Timasheff. NewYork, Academic Press, 1978.
Aune, K. C., Timasheff, S. N. Dimerization of α-chymotrypsin. I.pH dependence in the acid region. Biochemistry 10, 1609-1617 (1971)
65
Aune, K. C., Goldsmith, L. C., Timasheff, S. N. Dimerization of α-chymotrypsin. II. Ionic strength and temperature dependence. Biochemistry 10, 1617-1622 (1971)
Baldwin, R. L. Boundary spreading in sedimentation-velocity experiments.4. Measurement of the standard deviation of a sedimentation coefficientdistribution: application to bovine albumin and β-lactoglobulin. Biochem. J. 65, 490-502 (1957a)
Baldwin R. L. Boundary spreading in sedimentation-velocity experiments.5. Measurement of the diffusion coefficient of bovine albumin by Fujita’sequation. Biochem. J. 65, 503-512 (1957b)
Bancroft, F. C., Freifelder, D. Molecular weights of coliphages and coliphageDNA. I. Measurement of the molecular weight of bacteriophage T7 by highspeed equilibrium centrifugation. J. Mol. Biol. 54, 537-546 (1970)
Bergman, D. A.,Winzor, D. J. Quantitative affinity chromatography:increased versatility of the technique for studies of ligand binding. Anal. Biochem. 153, 380-386 (1986)
Bloomfield, V. A., Lim, T. K. Quasi-elastic laser light scattering.Methods in Enzymology, Vol. 48, pp. 415-494. Edited by C. H. W. Hirs andS. N. Timasheff. New York, Academic Press, 1978.
Bloomfield V., Van Holde, K. E., Dalton, W. O. Frictional coefficients ofmultisubunit structures. II. Application to proteins and viruses. Biopolymers 5, 149-159 (1967)
Bosma, H. J., Voordouw, G., De Kok, A., Veeger, C. Self-association of thepyruvate dehydrogenase complex from Azotobacter vinelandii in the presence of polyethylene glycol. FEBS Lett. 120, 179-182 (1980)
Braswell, E. H., Knox, J. R., Frere, J.-M. The association behaviour ofβ-lactamases. Sedimentation equilibrium studies in ammonium sulphatesolutions. Biochem. J. 237, 511-517 (1986)
Brian, A. A., Frisch, H. L., Lerman, L. S. Thermodynamics and equilibriumsedimentation analysis of the close approach of DNA molecules and amolecular ordering transition. Biopolymers 20, 1305-1328 (1981)
Bubb, M. R., Lewis, M. S., Korn, E. D. The interaction of monomeric actinwith two binding sites on Acanthamoeba actobindin. J. Biol. Chem. 266,3820-3826 (1991)
66
Cann, J. R., Goad, W. B. Measurement of protein interactions mediatedby small molecules using sedimentation velocity. Methods in Enzymology,Vol. 27, pp. 296-306. Edited by C. H. W. Hirs and S. N. Timasheff. NewYork, Academic Press, 1973.
Casassa, E. F., Eisenberg, H. Thermodynamic analysis of multicomponentsystems. Adv. Protein Chem. 19, 287-395 (1964)
Chatelier, R. C., Minton, A. P. Sedimentation equilibrium in macromolecular solutions of arbitrary concentration. I. Self-associating proteins. Biopolymers 26, 507-524 (1987)
Chervenka, C. H. A Manual of Methods for the Analytical Ultracentrifuge.Spinco Division, Beckman Instruments, Palo Alto, 1969.
Chun, P. W., Kim, S. J. Determination of equilibrium constants of associating protein systems. Graphical analysis for discrete and indefinite associations. Biochemistry 9, 1957-1961 (1970)
Cohen, R., Mire, M. Analytical-band centrifugation of an activeenzyme·substrate complex. 1. Principle and practice of the centrifugation.Eur. J. Biochem. 23, 267-275 (1971).
Cohn, E. J., Edsall, J. T. Density and apparent specific volume of proteins.Proteins, Amino Acids and Peptides as Ions and Dipolar Ions. pp. 370-381,New York, Reinhold, 1943.
Cole, N., Ralston, G. B. The effects of ionic strength on the self-associationof human spectrin. Biochim. Biophys. Acta 1121, 23-30 (1992)
Comper, W. D., Williams, R. P. W. Hydrodynamics of concentratedproteoglycan solutions. J. Biol. Chem. 262, 13464-13471 (1987)
Comper, W. D., Preston, B. N., Daivis, P. The approach of mutual diffusioncoefficients to molecular weight independence in semidilute solutions ofpolydisperse dextran fractions. J. Phys. Chem. 90, 128-132 (1986)
Correia, J. J., Shire, S., Yphantis, D. A., Schuster, T. M. Sedimentationequilibrium measurements of the intermediate-size tobacco mosaic virusprotein polymers. Biochemistry 24, 3292-3297 (1985)
Crawford, L. V., Waring, M. J. Supercoiling of polyoma virus DNA measured by its interaction with ethidium bromide. J. Mol. Biol. 25, 23-30 (1967)
67
Creeth, J. M., Knight, C. G. On the estimation of the shape of macromolecules from sedimentation and viscosity measurements. Biochim. Biophys. Acta 102, 549-558 (1965)
Creeth, J. M., Pain, R. H. The determination of molecular weights ofbiological macromolecules by ultracentrifuge methods. Prog. Biophys. Mol.Biol. 17, 217-287 (1967)
Deonier, R. C., Williams, J. W. Self-association of muramidase (lysozyme)in solution at 25°C, pH 7.0 and I = 0.20. Biochemistry 9, 4260-4267 (1970)
Dubin, S. B., Benedek, G. B., Bancroft, F. C., Freifelder, D. Molecularweights of coliphages and coliphage DNA. II. Measurement of diffusioncoefficients using optical mixing spectroscopy, and measurement of sedimentation coefficients. J. Mol. Biol. 54, 547-556 (1970)
Durham, A. C. H. Structures and roles of the polymorphic forms of tobacco mosaic virus protein. I. Sedimentation studies. J. Mol. Biol. 67, 289-305 (1972) Edelstein, S. J., Schachman, H. K. Measurement of partial specific volume by sedimentation equilibrium in H2O-D2O solutions. Methods in Enzymology, Vol. 27, pp. 82-98. Edited by C. H.W. Hirs and S. N. Timasheff. New York, Academic Press, 1973.
Freerksen, D. L., Shih, P. C.-F., Vasta-Russell, J. F., Horlick, R. A., Yau,W. W. Single-stranded RNA molecular weight and shape determination bydifferential pressure capillary viscometry, sedimentation velocity, and gelelectrophoresis. Anal. Biochem. 189, 163-168 (1990)
Freifelder, D. Molecular weights of coliphages and coliphage DNA. IV.Molecular weights of DNA from bacteriophages T4, T5, and T7 and thegeneral problem of determination of M. J. Mol. Biol. 54, 567-577 (1970)
Freifelder, D., Davison, P. F. Physicochemical studies on the reactionbetween formaldehyde and DNA. Biophys. J. 3, 49-63 (1963)
Fujita, H. Effects of a concentration dependence of the sedimentationcoefficient in velocity ultracentrifugation. J. Chem. Phys. 24, 1084-1090(1956)
Fujita, H. Evaluation of diffusion coefficients from sedimentation velocitymeasurements. J. Phys. Chem. 63, 1092-1095 (1959)
Fujita, H. Foundations of Ultracentrifugal Analysis. New York, Wiley, 1975.
68
Garcia de la Torre, J. Hydrodynamic properties of macromolecular assemblies. Dynamic Properties of Biomolecular Assemblies, pp. 3-31.Edited by S. E. Harding and A. J. Rowe. Cambridge, The Royal Society of Chemistry, 1989.
Geiselmann, J., Yager, T. D., Gill, S. C., Camettes, P., von Hippel, P. H.Physical properties of the Escherichia coli transcription factor rho. 1. Associationstates and geometry of the rho hexamer. Biochemistry 31, 111-121(1992)
Gilbert, L. M., Gilbert, G. A. Sedimentation velocity measurement ofprotein association. Methods in Enzymology, Vol. 27, pp. 273-296. Editedby C. H. W. Hirs and S. N. Timasheff. New York, Academic Press, 1973.
Gill, S. C., Yager, T. D., von Hippel, P. H. Escherichia coli sigma 70 andNusA proteins. II. Physical properties and self-association states. J. Mol.Biol. 220, 325-333 (1991)
Goldberg, R. J. Sedimentation in the ultracentrifuge. J. Phys. Chem. 57,194-202 (1953)
Hansen, J. C., Ausio, J., Stanik, V. H., Van Holde, K. E. Homogeneousreconstituted oligonucleosomes, evidence for salt-dependent folding in theabsence of histone H1. Biochemistry 28, 9129-9136 (1989)
Harding, S. E. The representation of equilibrium solute distributions fornonideal polydisperse systems in the analytical ultracentrifuge. Biophys. J.47, 247-250 (1985)
Harding, S. E. A general method for modeling macromolecular shape insolution. A graphical (II-G) intersection procedure for triaxial ellipsoids.Biophys. J. 51, 673-680 (1987)
Harding, S. E. Modelling the gross conformation of assemblies usinghydrodynamics: the whole body approach. Dynamic Properties ofBiomolecular Assemblies, pp. 32-56. Edited by S. E. Harding and A. J. Rowe. Cambridge, The Royal Society of Chemistry, 1989.
Haschemeyer, R. H., Bowers, W. F. Exponential analysis of concentrationor concentration difference data for discrete molecular weight distributions in sedimentation equilibrium. Biochemistry 9, 435-445 (1970)
Hearst, J. E., Schmid, C. W. Density gradient sedimentation equilibrium.Methods in Enzymology, Vol. 27, pp. 111-127. Edited by C. H. W. Hirs andS. N. Timasheff. New York, Academic Press, 1973.
Herskovits, T. T., Otero, R. M., Hamilton, M. G. The hemocyanin of theramshorn snail, Marisa cornuarietis (Linne). Comp. Biochem. Physiol. 97B,623-629 (1990)
69
Hesterberg, L. K., Lee, J. C. Measurement of hydrodynamic properties ofactive enzyme by sedimentation. Methods in Enzymology, Vol. 117, pp.97-115. Edited by C. H. W. Hirs and S. N. Timasheff. New York, AcademicPress, 1985.
Holladay, L. A. Molecular weights from approach-to-sedimentation equilibrium data using nonlinear regression analysis. Biophys. Chem. 10, 183-185 (1979)Holleman, W. H. The use of absorption optics to measure dissociation ofyeast enolase into enzymatically active monomers. Biochim. Biophys. Acta327, 176-185 (1973)
Howlett, G. J., Nichol, L. W., Andrews, P. R. Sedimentation equilibriumstudies on indefinitely self-associating systems. N-Methylacetamide in carbon tetrachloride. J. Phys. Chem. 77, 2907-2912 (1973)
Ifft, J. B. Proteins in density gradients at sedimentation equilibrium.Methods in Enzymology, Vol. 27, pp. 128-140. Edited by C. H. W. Hirs andS. N. Timasheff. New York, Academic Press, 1973.
Ifft, J. B., Vinograd, J. The buoyant behavior of bovine serum mercaptalbumin in salt solutions at equilibrium in the ultracentrifuge. II. Net hydration, ion binding, and solvated molecular weight in various salt solutions. J. Phys. Chem. 70, 2814-2822 (1966)
Jardine, I. Molecular weight analysis of proteins. Methods in Enzymology,Vol. 193, pp. 441-455. Edited by J. A. McCloskey. San Diego, AcademicPress, 1990.
Jeffrey, P. D. Equilibrium methods. Protein-Protein Interactions, pp.213-256. Edited by C. Frieden and L. W. Nichol. New York, Wiley, 1981.
Johnson, M. L., Correia, J. J., Yphantis, D. A., Halvorson, H. R. Analysis ofdata from the analytical ultracentrifuge by non-linear least-squares techniques. Biophys. J. 36, 575-588 (1981)
Johnston, J. P., Ogston, A. G. A boundary anomaly found in the ultracentrifugal sedimentation of mixtures. Trans. Faraday Soc. 42, 789-799 (1946)
Kemper, D. L., Everse, J. Active enzyme centrifugation. Methods inEnzymology, Vol. 27, pp. 67-83. Edited by C. H. W. Hirs and S. N.Timasheff. New York, Academic Press, 1973.
Kim, H., Deonier, R. C., Williams, J. W. The investigation of self-associationreactions by equilibrium ultracentrifugation. Chem. Rev. 77, 659-690 (1977)
70
Kirschner, M. W., Schachman, H. K. Conformational changes in proteins asmeasured by difference sedimentation studies. II. Effect of stereospecificligands on the catalytic subunit of aspartate transcarbamylase. Biochemistry 10, 1919-1926 (1971)
Kratky, O., Leopold, H., Stabinger, H. The determination of the partialspecific volumes of proteins by the mechanical oscillator technique.Methods in Enzymology, Vol. 27, pp. 98-110. Edited by C. H. W. Hirs andS. N. Timasheff. New York, Academic Press, 1973.Kurzban, G. P., Wang, K. Giant polypeptides of skeletal muscle titin:sedimentation equilibrium in guanidine hydrochloride. Biochem. Biophys.Res. Commun. 150, 1155-1161 (1988)
Lakatos, S., Minton, A. P. Interactions between globular proteins and F-actin in isotonic saline solution. J. Biol. Chem. 266, 18707-18713 (1991)
Laue, T. M., Rhodes, D. G. Determination of size, molecular weight andpresence of subunits. Methods in Enzymology, Vol. 182, pp. 566-587.Edited by M. P. Deutscher. San Diego, Academic Press, 1990.
Laue, T. M., Johnson, A. E., Esmon, C. T., Yphantis, D. A. Structure ofbovine blood coagulation factor Va. Determination of the subunitassociations, molecular weights, and asymmetries by analyticalultracentrifugation. Biochemistry 23, 1339-1348 (1984)
Lewis, M. S., Youle, R. J. Ricin subunit association. Thermodynamics and the role of the disulfide bond in toxicity. J. Biol. Chem. 261, 11571-11577 (1986)
Llewellyn, D.J., Smith, G. D. An evaluation of active enzyme centrifugationas a zonal and boundary technique by the analysis of simulated data. Arch.Biochem. Biophys. 190, 483-494 (1978)
Lohman, T. M., Wensley, C. G., Cina, J., Burgess, R. R., Record, M. T., Jr.Use of difference boundary sedimentation velocity to investigate nonspecific protein-nucleic acid interactions. Biochemistry 19, 3516-3522 (1980)
Lollar, P. Heterogeneous ideal associations at sedimentation equilibrium.Biophys. Chem. 28, 245-251 (1987)
Luther, M. A., Cai, G.-Z., Lee, J. C. Thermodynamics of dimer and tetramer formations in rabbit muscle phosphofructokinase. Biochemistry 25, 7931-7937 (1986)
McKenzie, H. A. Milk proteins. Adv. Protein Chem. 22, 55-234 (1967)
71
Mächtle, W. Coupling particle size distribution technique. Angew.Makromol. Chem. 162, 35-52 (1988)
Margossian, S. S., Lowey, S. Interaction of myosin subfragments withF-actin. Biochemistry 17, 5431-5439 (1978)
Mark, A. E., Nichol, L. W., Jeffrey, P. D. The self-association of zinc-freebovine insulin. A single model based on interactions in the crystal thatdescribes the association pattern in solution at pH 2, 7 and 10. Biophys.Chem. 27, 103-117 (1987)Marler, E., Nelson, C. A., Tanford, C. The polypeptide chains of rabbit γ-globulin and its papain-cleaved fragments. Biochemistry 3, 279-284 (1964)
Meselson, M., Stahl, F. W. The replication of DNA in E. coli. Proc. Natl.Acad. Sci. 44, 671-682 (1958)
Meselson, M., Stahl, F. W., Vinograd, J. Equilibrium sedimentation of macromolecules in density gradients. Proc. Natl. Acad. Sci. 43, 581-588 (1957)
Millar, D. B., Frattali, V., Willick, G. E. The quaternary structure of lactatedehydrogenase. I. The subunit molecular weight and the reversible association at acid pH. Biochemistry 8, 2416-2421 (1969)
Milthorpe, B. K., Jeffrey, P. D., Nichol, L. W. The direct analysis of sedimentation equilibrium results obtained with polymerizing systems. Biophys. Chem. 3, 169-176 (1975)
Minton, A. P. The effect of volume occupancy upon the thermodynamicactivity of proteins: some biochemical consequences. Mol. Cell. Biochem. 55, 119-140 (1983)
Minton, A. P. Quantitative characterization of reversible molecular associations via analytical centrifugation. Anal. Biochem. 190, 1-6 (1990)
Minton, A. P. Simulation of the time-course of macromolecular separationsin an ultracentrifuge. I. Formation of a cesium chloride density gradient at25°C. Biophys. Chem. 42, 13-21 (1992)
Minton, A. P., Edelhoch, H. Light scattering of bovine serum albuminsolutions: extensions of the hard particle model to allow for electrostaticrepulsion. Biopolymers 21, 451-458 (1982)
Minton, A. P., Lewis, M. S. Self-association in highly concentrated solutionsof myoglobin: a novel analysis of sedimentation equilibrium of highlynonideal solutions. Biophys. Chem. 14, 317-324 (1981)
72
Morris, M., Ralston, G. B. Determination of the parameters of self-association by direct fitting of the omega function. Biophys. Chem. 23, 49-61 (1985)
Morris, M., Ralston, G. B. A thermodynamic model for the self-associationof human spectrin. Biochemistry 28, 8561-8567 (1989)
Mulzer, K., Kampmann, L., Petrasch, P., Schubert, D. Complex associationsbetween membrane proteins analyzed by analytical ultracentrifugation:studies on the erythrocyte membrane proteins band 3 and ankyrin. Colloid Polym. Sci. 268, 60-64 (1990)Munk, P., Halbrook, M. E. Sedimentation equilibrium of polymers in goodsolvents. Macromolecules 9, 568-574 (1976)
Murthy, N. S., Braswell, E. H., Knox, J. R. The association behavior ofβ-lactamases in polyethylene glycol solution. Biopolymers 27, 865-881(1988)
Newell, J. O., Schachman, H. K. Amino acid substitutions which stabilizeaspartate transcarbamoylase in the R state disrupt both homotropic andheterotropic effects. Biophys. Chem 37, 183-196 (1990)
Nichol, L. W., Ogston, A. G. The use of constituent concepts in thedescription of interaction boundaries in migrating systems of the typeA + B C + D. Proc. Roy. Soc. (London) B167, 164-183 (1967)
Nichol, L. W., Winzor, D. J. The determination of equilibrium constantsfrom transport data on rapidly reacting systems of the type A + B C.J. Phys. Chem. 68, 2455-2463 (1964)
Nichol, L. W., Winzor, D. J. Allowance for composition dependence ofactivity coefficients in the analysis of sedimentation equilibrium resultsobtained with heterogeneously associating systems. J. Phys. Chem. 80,1980-1983 (1976)
Nichol, L. W., Winzor, D. J. The use of covolume in the estimation ofprotein axial ratios. Methods in Enzymology, Vol. 117, pp. 182-198. Editedby C. H. W. Hirs and S. N. Timasheff. Orlando, Academic Press, 1985.
Nichol, L. W., Jeffrey, P. D., Milthorpe, B. K. The sedimentation equilibriumof heterogeneously associating systems and mixtures of non-interactingsolutes: analysis without determination of molecular weight averages.Biophys. Chem. 4, 259-267 (1976)
Nichol, L. W., Ogston, A. G., Wills, P. R. Effect of inert polymers on protein self-association. FEBS Lett. 126, 18-20 (1981)
73
Nichol, L. W., Owen, E. A., Winzor, D. J. A macromolecular shape functionbased on sedimentation velocity parameters. Arch. Biochem. Biophys. 236, 338-341 (1985)
Ogston, A. G. Life with a Svedberg ultracentrifuge. Trends Biochem. Sci. 2,N219-N220 (1977)
Ogston, A. G., Winzor, D. J. Treatment of thermodynamic nonideality in equilibrium studies on associating systems. J. Phys. Chem. 79, 2496-2500 (1975)Pedersen, T. G., Tucksen, E., Svedsen, I., Ottesen, M. Buoyant densities ofsubtilisin Carlsberg in dissolved and crystalline states. Carlsberg Res.Commun. 43, 219-225 (1978a)
Pedersen, T. G., Bayne, S., Ifft, J. B., Ottesen, M. O. Buoyant densities ofdissolved and crystalline lactate dehydrogenase from pig heart and pigmuscle. Carlsberg Res. Commun. 43, 491-495 (1978b)
Peters, J.-M., Harris, J. R., Lustig, A., Muller, S., Engel, A., Volker, S.,Franke, W. W. The ubiquitous soluble Mg2+-ATPase complex. A structural study. J. Mol. Biol. 223, 557-572 (1992)
Poon, P. H., Schumaker, V. N. Measurement of macromolecular interactions between complement subcomponents C1q, C1r̄ , C1s̄ and immunoglobulin IgM by sedimentation analysis using the analytical ultracentrifuge. J. Biol. Chem. 266, 5723-5727 (1991)
Prakash, V., Timasheff, S. N. Calculation of partial specific volumes ofproteins in 8 M urea solutions. Methods in Enzymology, Vol. 117, pp. 53-60. Edited by C. H. W. Hirs and S. N. Timasheff. Orlando, Academic Press, 1985.
Prakash, V., Timasheff, S. N. Mechanism of interaction of vinca alkaloidswith tubulin: cantharanthine and vindoline. Biochemistry 30, 873-880 (1991)
Pretorius, H. T., Nandi, P. K., Lippoldt, R. E., Johnson, M. L., Keen, J. H.,Pastan, I., Edelhoch, H. Molecular characterisation of human clathrin.Biochemistry 20, 2777-2782 (1981)
Ralston, G. B. The isolation of aggregates of spectrin from bovine erythrocyte membranes. Aust. J. Biol. Sci. 28, 259-266 (1975)
Ralston, G. B. Effects of “crowding” in protein solutions. J. Chem. Ed. 67,857-860 (1990)
74
Ralston, G. B. Temperature and pH-dependence of the self-association ofhuman spectrin. Biochemistry 30, 4179-4186 (1991)
Revzin, A., Woychik, R. P. Quantitation of the interaction of Escherichia coli RNA polymerase holoenzyme with double-helical DNA using a thermodynamically rigorous centrifugation method. Biochemistry 20, 250-256 (1981)
Reynolds, J. A., McCaslin, D. R. Determination of protein molecularweight in complexes with detergent without knowledge of binding.Methods in Enzymology, Vol. 117, pp. 41-53. Edited by C. H. W. Hirs andS. N. Timasheff. Orlando, Academic Press, 1985.Richards, E. G., Schachman, H. K. Ultracentrifuge studies with Rayleigh interference optics. I. General applications. J. Phys. Chem. 63, 1578-1591 (1959)
Roark, D. E., Yphantis, D. A. Studies of self-associating systems by equilibrium ultracentrifugation. Ann. N.Y. Acad. Sci. 164, 245-278 (1969)
Ross, P. D., Subramanian, S. Thermodynamics of protein association reactions: forces contributing to stability. Biochemistry 20, 3096-3102 (1981)
Ross, P. D., Howard, F. B., Lewis, M. S. Thermodynamics of antiparallelhairpin-double helix equilibria in DNA oligonucleotides from equilibriumultracentrifugation. Biochemistry 30, 6269-6275 (1991)
Runge, M. S., Laue, T. M., Yphantis, D. A., Lifsics, M. R., Saito, A.,Altin, M., Reinke, K., Williams, R. C., Jr. ATP-induced formation of anassociated complex between microtubules and neurofilaments. Proc. Natl.Acad. Sci. 78, 1431-1435 (1981)
Sackett, D. L., Lippoldt, R. E. Thermodynamics of reversible monomerdimer association of tubulin. Biochemistry 30, 3511-3517 (1991)
Sarquis, J. L., Adams, E. T., Jr. The temperature-dependent self-associationof β-lactoglobulin C in glycine buffers. Arch. Biochem. Biophys. 163, 442-452 (1974)
Schachman, H. K. Ultracentrifuge studies on tobacco mosaic virus. J. Amer.Chem. Soc. 73, 4808-4811 (1951)
Schachman, H. K. Ultracentrifugation in Biochemistry. New York, Academic Press, 1959.
Schachman, H. K., Edelstein, S. J. Ultracentrifugal studies with absorptionoptics and a split-beam photoelectric scanner. Methods in Enzymology,
75
Vol. 27, pp. 3-59. Edited by C. H. W. Hirs and S. N. Timasheff. New York,Academic Press, 1973.
Schmidt, D. G., Payens, T. A. J. The evaluation of positive and negativecontributions to the second virial coefficient of some milk proteins. J.Colloid. Interface. Sci. 39, 655-662 (1972)
Schubert, D., Boss, K., Dorst, H.-J., Flossdorf, J., Pappert, G. The nature ofthe stable noncovalent dimers of band 3 protein from erythrocyte membranes in solutions of Triton X-100. FEBS Lett. 163, 81-84 (1983)
Schumaker V. N., Schachman, H. K. Ultracentrifugal analysis of dilutesolutions. Biochim. Biophys. Acta 23, 628-639 (1957)
Schumaker, V., Zimm, B. H. Anomalies in sedimentation. 3. A model forthe inherent instability of solutions of very large particles in high centrifugalfields. Biopolymers 12, 877-894 (1973)
Seery, V. L., Farrell, H. M., Jr. Physicochemical properties of isocitratedehydrogenase from lactating bovine mammary gland: effect of substratesand cofactors. Arch. Biochem. Biophys. 274, 453-462 (1989)
Shearwin K. E., Winzor, D. J. Effect of sucrose on the dimerization ofα-chymotrypsin. Allowance for thermodynamic nonideality arising fromthe presence of a small inert solute. Biophys. Chem. 31, 287-294 (1988)
Shire, S. J., Holladay, L. A., Rinderknecht, E. Self-association of humanand porcine relaxin as assessed by analytical ultracentrifugation and circular dichroism. Biochemistry 30, 7703-7711 (1991)
Siegel, L. M., Monty, K. J. Determination of molecular weights and frictionalratios of proteins in impure systems by use of gel filtration and densitygradient centrifugation. Application to crude preparations of sulfite andhydroxylamine reductase. Biochim. Biophys. Acta 112, 346-362 (1966)
Smith, G. D., Schachman, H. K. Effect of D2O and nicotinamide adenine dinucleotide on the sedimentation properties and structure of glyceraldehyde phosphate dehydrogenase. Biochemistry 12,3789-3801 (1973)
Smith, G. D., Kirschner, M. W., Schachman, H. K. Analysis of associationdissociation equilibria in proteins by difference and differential sedimentation. Biochemistry 12, 3801-3811 (1973)
Soucek, D. A., Adams, E. T. Molecular weight distributions from sedimentation equilibrium of nonideal solutions. J. Colloid. Interface Sci. 55, 571-582 (1976)
76
Stafford, W. F., III. Boundary analysis in sedimentation transport experiments: a procedure for obtaining sedimentation coefficient distributions using the time derivative of the concentration profile. Anal. Biochem. 203, 295-301 (1992)
Stafford, W. F., Jansco, A., Graceffa, P. Caldesmon from rabbit liver:molecular weight and length by analytical ultracentrifugation. Arch.Biochem. Biophys. 281, 66-69 (1990)
Steinberg, I. Z., Schachman, H. K. Ultracentrifuge studies with absorptionoptics. V. Analysis of interacting systems involving macromolecules andsmall molecules. Biochemistry 5, 3728-3747 (1966)
Sueoka, N., Marmur, J., Doty, P. Heterogeneity in deoxyribonucleic acids. II. Dependence of the density of deoxyribonucleic acids on guanine-cytosine content. Nature 183, 1429-1431 (1959)
Svedberg, T., Pedersen, K. O. The Ultracentrifuge. Edited by R. H. Fowlerand P. Kapitza. Oxford, Clarendon Press, 1940.
Szybalski, W., Kubinski, H., Hradecna, Z., Summers, W. C. Analytical andpreparative separation of complementary DNA strands. Methods in Enzymology, Vol. 21, pp. 383-413. Edited by L. Grossman and K. Moldave. New York, Academic Press, 1971.
Tanford, C. Physical Chemistry of Macromolecules. New York, Wiley, 1961.
Tanford, C., Reynolds, J. A. Characterization of membrane proteins in detergent solution. Biochim. Biophys. Acta 457, 133-170 (1976)
Tang, L.-H., Rosenberg, L. C., Reihanian, H., Jamieson, A. M., Blackwell, J.Proteoglycans from bovine epiphyseal cartilage. Sedimentation velocity and light scattering studies of the effect of link protein on proteoglycan aggregate size and stability. Connect. Tissue Res. 19, 177-193 (1989)
Teller, D. C. Characterization of proteins by sedimentation equilibrium in the analytical ultracentrifuge. Methods in Enzymology, Vol. 27, pp. 346-441.Edited by C. H. W. Hirs and S. N. Timasheff. New York, Academic Press,1973.
Tindall, S. H., Aune, K. C. The effect of temperature on the self-associationof S5 and on the association of S5 with S8 as determined by sedimentation equilibrium. Arch. Biochem. Biophys. 214, 516-521 (1982)
Van Holde, K. E. A modification of Fujita’s method for the calculation ofdiffusion coefficients from boundary spreading in the ultracentrifuge. J. Phys. Chem. 64, 1582-1583 (1960)
77
Van Holde, K. E. Sedimentation analysis of proteins. The Proteins, Vol. I,pp. 225-291. Edited by H. Neurath and R. L. Hill. 3rd ed. New York, Academic Press, 1975.
Van Holde, K. E., Baldwin, R. L. Rapid attainment of sedimentation equilibrium. J. Phys. Chem. 62, 734-743 (1958)
Van Holde, K. E., Rossetti, G. P. A sedimentation equilibrium study of theassociation of purine in aqueous solution. Biochemistry 6, 2189-2194 (1967)Van Holde, K. E., Weischet, W. O. Boundary analysis of sedimentationvelocity experiments with monodisperse and paucidisperse solutes. Biopolymers 17, 1387-1403 (1978)
Van Holde, K. E., Miller, K., Schabtach, E., Libertini, L. Assembly ofOctopus dofleini hemocyanin. A study of the kinetics by sedimentation, lightscattering and electron microscopy. J. Mol. Biol. 217, 307-321 (1991)
Vinograd, J., Bruner, R., Kent, R., Weigle, J. Band-centrifugation of macromolecules and viruses in self-generating density gradients. Proc. Natl. Acad. Sci. 49, 902-910 (1963)
Visser, J., Deonier, R. C., Adams, E. T., Williams, J. W. Self-association ofβ-lactoglobulin B in acid solution and its variation with temperature.Biochemistry 11, 2634-2643 (1972)
Ward, L. D., Winzor, D. J. Self-association of sperm whale metmyoglobin.Arch. Biochem. Biophys. 234, 125-128 (1984)
Werner, W. E., Cann, J. R., Schachman, H. K. Boundary spreading insedimentation velocity experiments on partially liganded aspartatetranscarbamoylase. A ligand-mediated isomerization. J. Mol. Biol. 206,231-237 (1989)
Williams, J. W. Ultracentrifugation of Macromolecules. New York, Academic Press, 1972.
Williams, J. W., Saunders, W. M. Size distribution analysis in plasma extender systems. II. Dextran. J. Phys. Chem. 58, 854-859 (1954)
Williams, J. W., Van Holde, K. E., Baldwin, R. L., Fujita, H. The theoryof sedimentation analysis. Chem. Rev. 58, 715-806 (1958)
Wills, P. R., Nichol, L. W., Siezen, R. J. The indefinite self-association oflysozyme: consideration of composition-dependent activity coefficients.Biophys. Chem. 11, 71-82 (1980)
78
Winnard, P. T., Esmon, C. T., Laue, T. M. The molecular weight andoligomerization of rabbit thrombomodulin as assessed by sedimentationequilibrium. Arch. Biochem. Biophys. 269, 339-344 (1989)
Winzor, D. J. Mass migration methods. Protein-Protein Interactions, pp.129-172. Edited by C. Frieden and L. W. Nichol. New York, Wiley, 1981.
Winzor, D. J. Tellam, R., Nichol, L. W. Determination of the asymptoticshapes of sedimentation velocity patterns for reversibly polymerizing solutes. Arch. Biochem. Biophys. 178, 327-332 (1977)Woods, E. F. Molecular weight and subunit structure of tropomyosin B.J. Biol. Chem. 242, 2859-2871 (1967)
Yphantis, D. A. Equilibrium ultracentrifugation in dilute solutions. Biochemistry 3, 297-317 (1964)
Yphantis, D. A., Arakawa, T. Sedimentation equilibrium measurements ofrecombinant DNA derived human interferon γ. Biochemistry 26, 5422-5427 (1987)
Zimm, B. H. Anomalies in sedimentation. IV. Decrease in sedimentationcoefficients of chains at high fields. Biophys. Chem. 1, 279-291 (1974)
79
INDEXAAbsorbance 15, 17Absorbance optics 18Acrylamide gradient electrophoresis 65Actin 7, 67Active enzyme sedimentation 14,37Activity coefficient 41, 48, 49, 54,61Affinity chromatography 64Aggregation 5, 24Angular velocity 8, 33Antigen-antibody interactions 32Apparent molecular weight 48Apparent specific volume 22, 59Apparent weight-average molecularweight 50, 52, 54Approach-to-equilibrium 60Archibald Approach-to-EquilibriumMethod 60Association 5, 7, 35, 48, 50, 51, 57,60, 62, 64Asymmetric boundary 35ATP 17Attainment of equilibrium 55, 56Axial ratios 6
BBand sedimentation 14, 37Band-forming cell 36Beer-Lambert law 15Binding of small molecules 5Boundary 23, 24, 25, 29, 31, 36,38, 41Boundary spreading 29, 30, 31, 32,42Bromouracil 61Buoyant density 10, 61, 62Buoyant effective molar weight 9
CCapillary electrophoresis 33, 64Carbohydrates 4Cells 12Centerpiece 12, 13Cesium salts 37, 61Charged macromolecules 34Chemical equilibrium 5Clathrin 38Column-lengths 13Complex formation 5Concentrated solutions 59Concentration 18Concentration dependence 27, 28,29, 31, 32, 33Concentration distribution 15, 30,56Concentration gradient 16Conformation changes 6, 37Contaminants 3, 29Convection 11Counterbalance 11Counterions 34Crowding 59, 60Crystallins 67Curve-fitting 54Capillary electrophoresis 33, 64Carbohydrates 4Cells 12
DDensity 20, 26, 59Density gradient 10, 14, 36, 37, 61,62Detergent 4, 58, 59Deuterium oxide 20, 59Dextran 59, 60Diagnostic plots 52Diffusion 10, 29, 30, 31, 32, 38Diffusion coefficient 6, 14, 24, 38,
80
39, 41, 42, 63Diffusive spreading 30Dilute samples 18Distribution of molecular weights47Distribution of sedimentationcoefficients 29, 30, 32DNA 30, 31, 33, 37, 42, 49, 62, 64DNA-protein binding 7Dodecyl sulfate 59
EElectron microscopy 65Electrophoresis 4, 63, 64Ellipsoids of revolution 6, 38Enthalpy 58Entropy 58Enzymes 6, 37Equilibrium constant 50, 51, 52,54, 58Equivalent boundary 25, 35Expanded solutes 27Extrapolation 24, 28
FFlotation 10Frictional coefficient 9, 23, 38, 41,63Frictional ratio 38
GGel filtration 37, 63, 64Globular proteins 27, 28, 31, 38,49, 55Glycoproteins 4Guanidine hydrochloride 38, 45, 46
HGel filtration 37, 63, 64Heat capacity 58Heterogeneity 3, 29, 30, 33, 41, 47,48, 62Heterogeneous associations 67
Homogeneity 24, 29, 32, 64HPLC 64Hydration 6Hydrogen bonding 58Hydrophobic interactions 58
IInstrumentation 11Interference optics 17, 18Intrinsic viscosity 28Ion-binding 61Ionic interactions 58Ionic species 22Isopycnic sedimentation equilibrium61
JJohnston-Ogston effect 29
LLactoglobulin 33Ligand binding 7, 36, 64Light scattering 4, 42, 63
MMass-spectrometry 63Mathematical models 56Meniscus 28, 46Meniscus depletion 47N-Methyl acetamide 57Microtubules 30Model E 67Molecular weight 3, 5, 24, 35, 38,41, 43, 44, 46, 58, 60, 62, 63Molecular weight from s/D 41Monomer molecular weight 54Multiple boundaries 24Multiple cells 11Myosin 49
81
NNMR 64, 66Nonideality 5, 41, 47, 49, 50, 51, 54Nonlinear regression 54Nucleic acids 4, 6, 61, 62Number-average molecularweight 47OOligomers 38, 50Omega function 55, 56Optical pathlength 12Optical system 15Optima XL-A 11, 12, 18, 44, 45,59, 67Osmometry 4Osmotic pressure 63
PPartial specific volume 20, 21, 61pH-dependence 58Plateau 23, 25, 28, 29, 33Point of inflection 25Polydispersity 3, 29, 32, 47Polyethylene 15Polyethylene glycol 15, 59Polysaccharides 4Polystyrene 1Precession 11Primary charge effect 34Protein-lipid interactions 62Protein-nucleic acid interactions 62Proteins 4, 62Purine 57Pyruvate dehydrogenase 59
RRadial dilution 28, 32Radiation inactivation 65Random coils 27, 28, 38Reaction boundaries 36Reference holes 11Refractometric optics 15, 17RNA 64Rod-like molecules 28, 49Rotor 11
Ss20,w 26Sample sizes 4Schlieren 15, 16, 17, 18Second moment 25, 35Second virial coefficient 48, 54, 57Sedimentation 10Sedimentation coefficient 6, 9, 23,26, 27, 28, 30, 33, 38, 63, 65Sedimentation coefficient distribution 30, 33Sedimentation equilibrium 3, 5, 23,43, 44, 46, 47, 50, 57Sedimentation velocity 3, 5, 23, 29Self-sharpening 29, 30, 32, 38Serum albumin 10Shape 6, 9, 27Short solution columns 60Site-directed mutagenesis 66Size 6, 9Solvation 61Spectrin 65Speed dependence 33Spherical particles 28, 38Standard solvent 26Stoichiometry 5, 50, 51, 52, 54, 55Subunit molecular weight 45Subunits 59Sucrose 44, 59Supporting electrolyte 22Svedberg unit 10Symmetrical boundary 32Synthetic boundary cell 38Synthetic polymers 4, 15, 24, 29
TThermodynamic parameters 57Time required to attain equilibrium13Tobacco mosaic virus 31Tubulin 67Turnip yellow virus 4
UUltraviolet 22Urea 45, 46
VVan der Waals interactions 58Viruses 31, 42, 44Viscosity 20, 26, 27, 40, 64
WWavelength scan 18Weak associations 5Weight-average molecular weight47, 50, 55Weight-average sedimentationcoefficient 25, 35
XX-ray diffraction 4
For Beckman Coulter’s worldwide office locations and phone numbers, please visit “Contact Us” at beckmancoulter.com
CENT-1069TCH9.15-A
Beckman Coulter, the stylized logo, and the Beckman Coulter product and service used herein are trademarks or registered trademarks of Beckman Coulter, Inc. in the United States and other countries.