Embed Size (px)
Citation preview
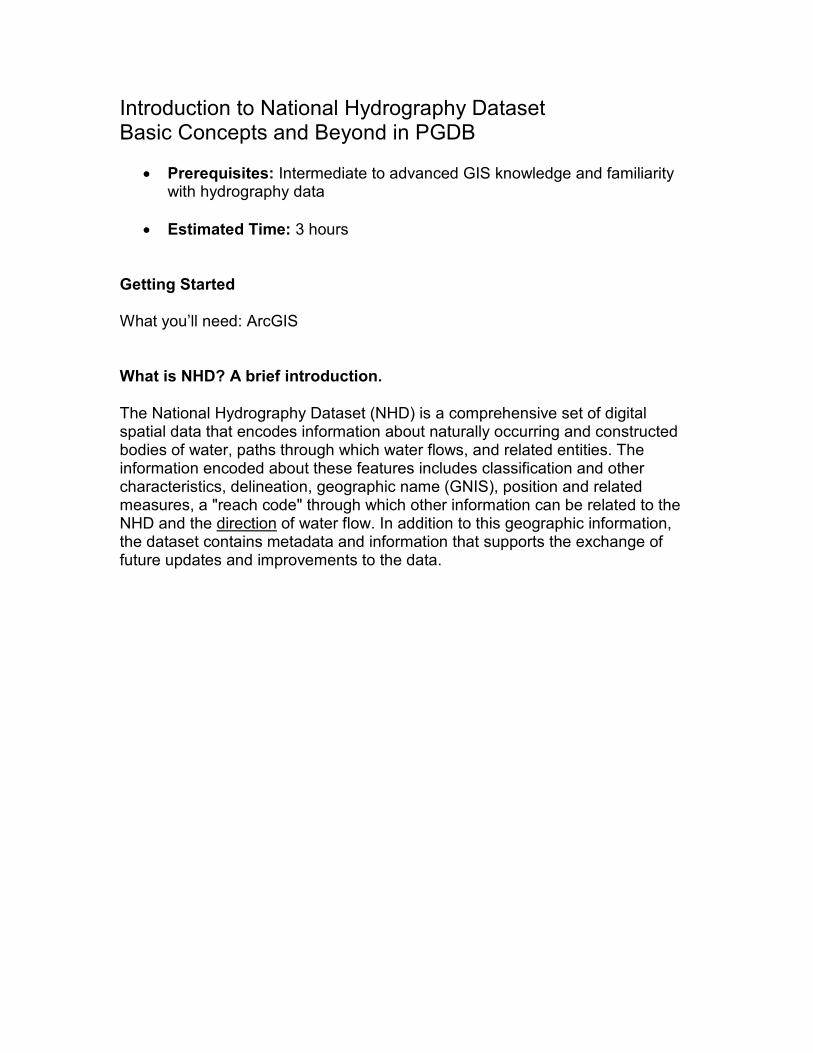
Introduction to National Hydrography Dataset Basic Concepts and Beyond in PGDB
• Prerequisites: Intermediate to advanced GIS knowledge and familiarity with hydrography data
• Estimated Time: 3 hours Getting Started What you’ll need: ArcGIS What is NHD? A brief introduction.
The National Hydrography Dataset (NHD) is a comprehensive set of digital spatial data that encodes information about naturally occurring and constructed bodies of water, paths through which water flows, and related entities. The information encoded about these features includes classification and other characteristics, delineation, geographic name (GNIS), position and related measures, a "reach code" through which other information can be related to the NHD and the direction of water flow. In addition to this geographic information, the dataset contains metadata and information that supports the exchange of future updates and improvements to the data.
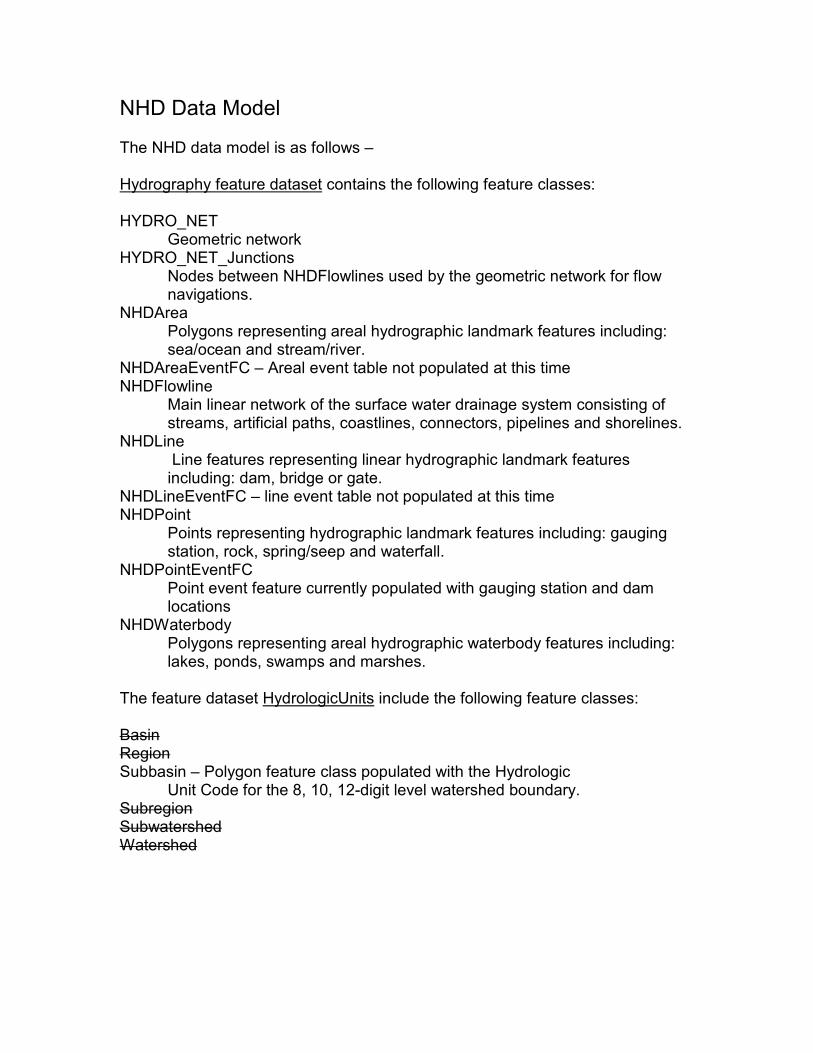
NHD Data Model The NHD data model is as follows – Hydrography feature dataset contains the following feature classes: HYDRO_NET Geometric network HYDRO_NET_Junctions
Nodes between NHDFlowlines used by the geometric network for flow navigations.
NHDArea Polygons representing areal hydrographic landmark features including: sea/ocean and stream/river.
NHDAreaEventFC – Areal event table not populated at this time NHDFlowline
Main linear network of the surface water drainage system consisting of streams, artificial paths, coastlines, connectors, pipelines and shorelines.
NHDLine Line features representing linear hydrographic landmark features including: dam, bridge or gate.
NHDLineEventFC – line event table not populated at this time NHDPoint
Points representing hydrographic landmark features including: gauging station, rock, spring/seep and waterfall.
NHDPointEventFC Point event feature currently populated with gauging station and dam locations
NHDWaterbody Polygons representing areal hydrographic waterbody features including: lakes, ponds, swamps and marshes.
The feature dataset HydrologicUnits include the following feature classes: Basin Region Subbasin – Polygon feature class populated with the Hydrologic
Unit Code for the 8, 10, 12-digit level watershed boundary. Subregion Subwatershed Watershed
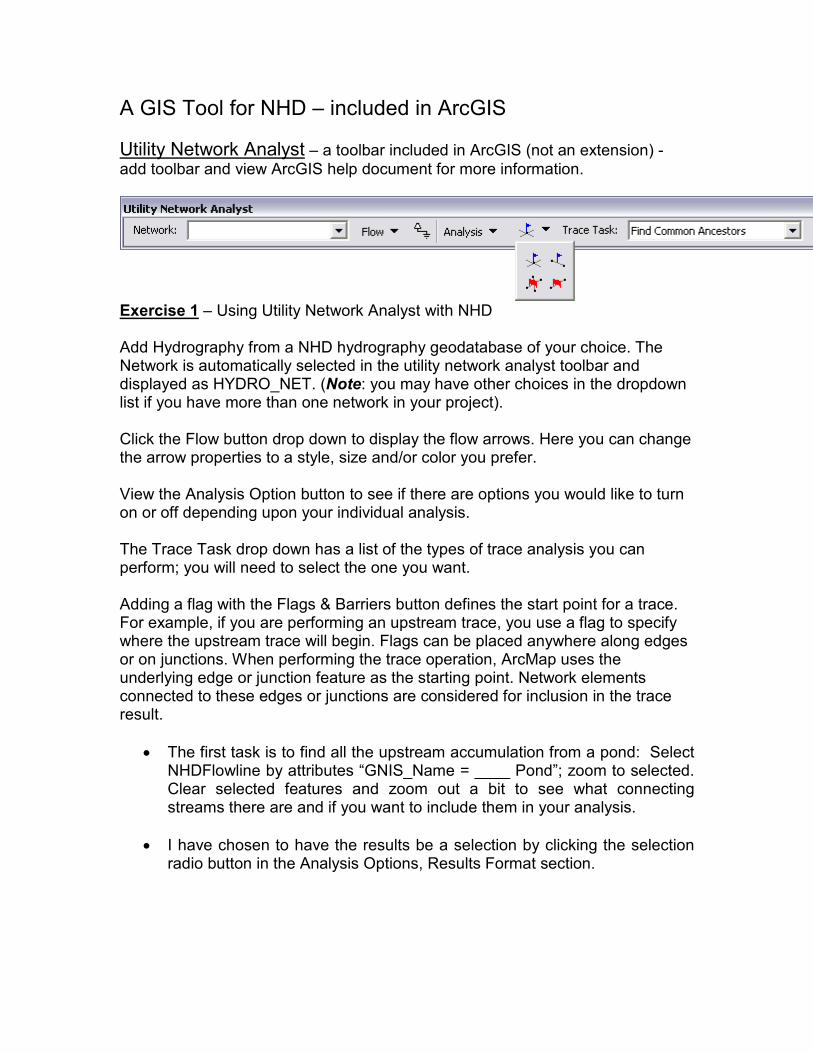
A GIS Tool for NHD – included in ArcGIS
Utility Network Analyst – a toolbar included in ArcGIS (not an extension) - add toolbar and view ArcGIS help document for more information.
Exercise 1 – Using Utility Network Analyst with NHD Add Hydrography from a NHD hydrography geodatabase of your choice. The Network is automatically selected in the utility network analyst toolbar and displayed as HYDRO_NET. (Note: you may have other choices in the dropdown list if you have more than one network in your project). Click the Flow button drop down to display the flow arrows. Here you can change the arrow properties to a style, size and/or color you prefer. View the Analysis Option button to see if there are options you would like to turn on or off depending upon your individual analysis. The Trace Task drop down has a list of the types of trace analysis you can perform; you will need to select the one you want. Adding a flag with the Flags & Barriers button defines the start point for a trace. For example, if you are performing an upstream trace, you use a flag to specify where the upstream trace will begin. Flags can be placed anywhere along edges or on junctions. When performing the trace operation, ArcMap uses the underlying edge or junction feature as the starting point. Network elements connected to these edges or junctions are considered for inclusion in the trace result.
• The first task is to find all the upstream accumulation from a pond: Select NHDFlowline by attributes “GNIS_Name = ____ Pond”; zoom to selected. Clear selected features and zoom out a bit to see what connecting streams there are and if you want to include them in your analysis.
• I have chosen to have the results be a selection by clicking the selection radio button in the Analysis Options, Results Format section.
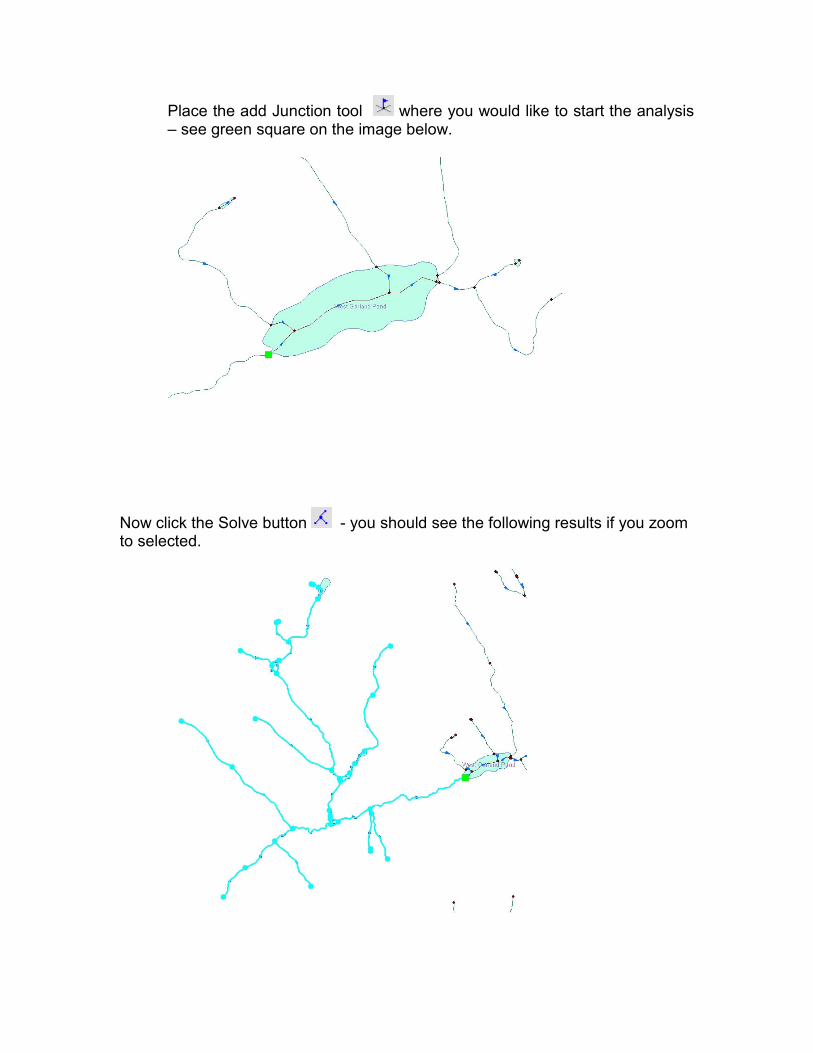
Place the add Junction tool where you would like to start the analysis – see green square on the image below.
Now click the Solve button - you should see the following results if you zoom to selected.

Because the junction flag was placed on the inlet junction to the pond, the tool only selected the stream from that point on upward. If you had placed the junction flag at the outlet junction for the pond you would obtain the following results:
Because the results of the analysis are a selection, this selected set can be exported to a separate shapefile or made a layer.
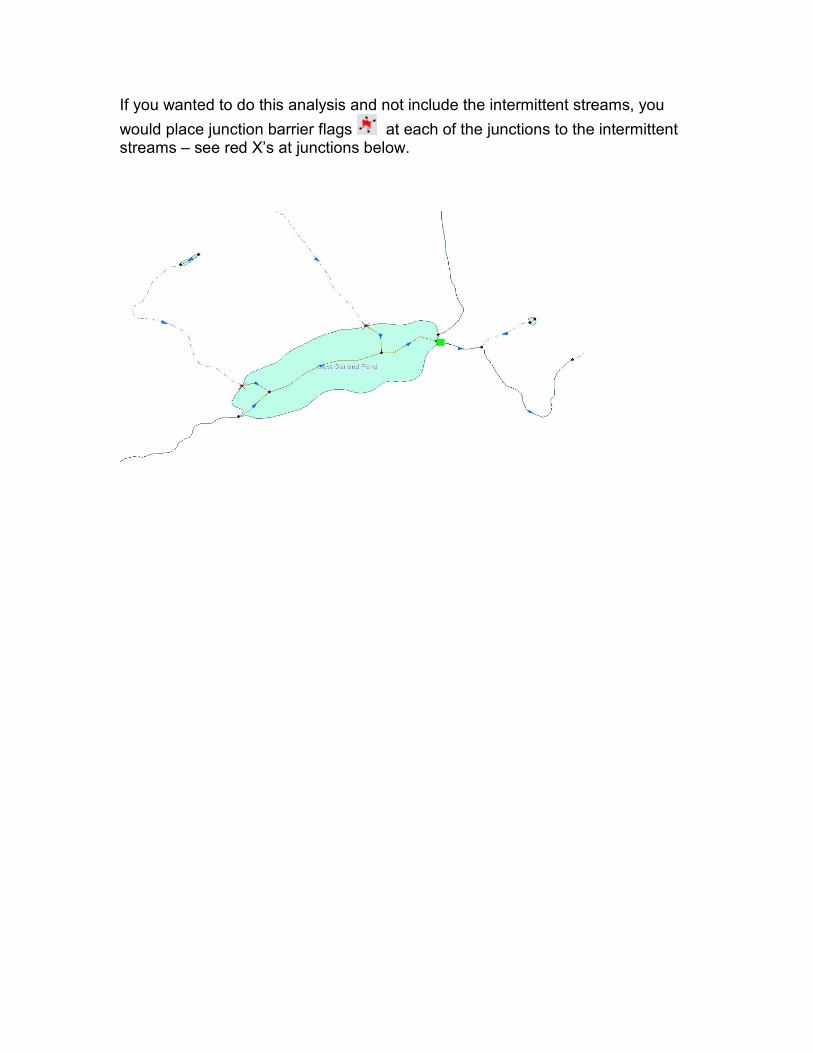
If you wanted to do this analysis and not include the intermittent streams, you
would place junction barrier flags at each of the junctions to the intermittent streams – see red X’s at junctions below.
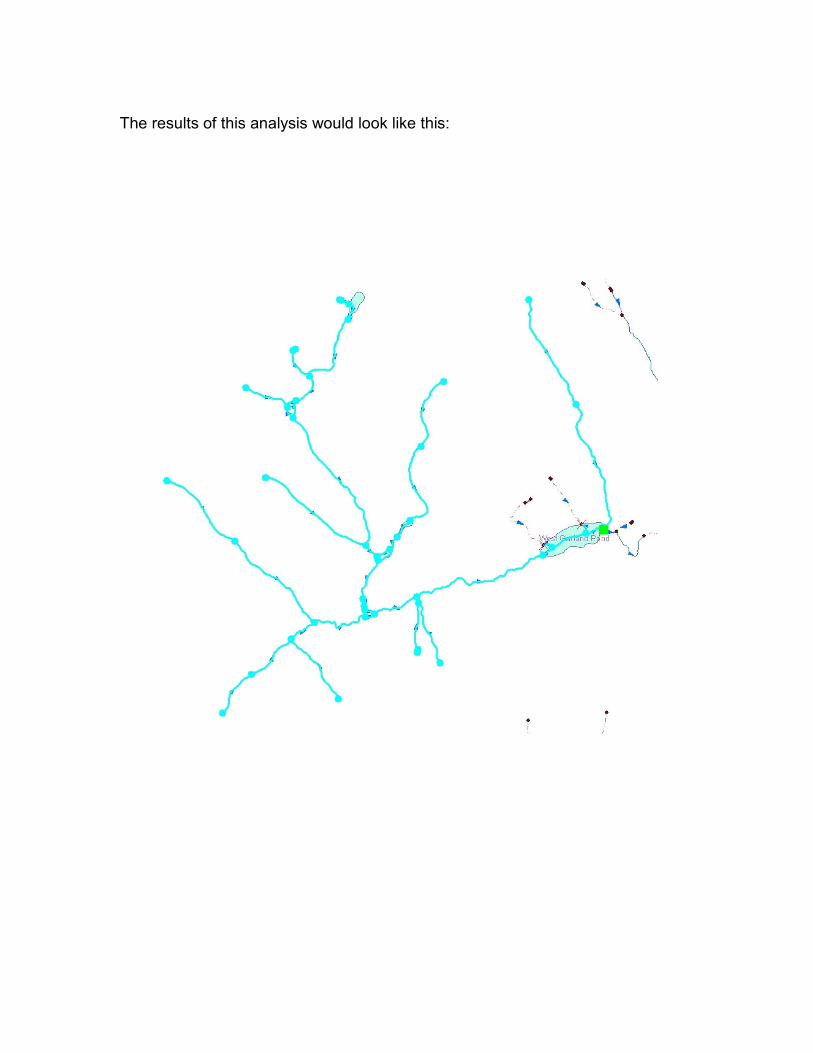
The results of this analysis would look like this:
Utilizing attribution and versatile functionality of NHD
REACHCODE
Within the NHD, surface water features are combined to form "reaches," which provide the framework for linking water-related data to the NHD surface water drainage network. A reach is the portion of a stream between two points of confluence. These linkages enable the analysis and display of these water-related data in upstream and downstream order.
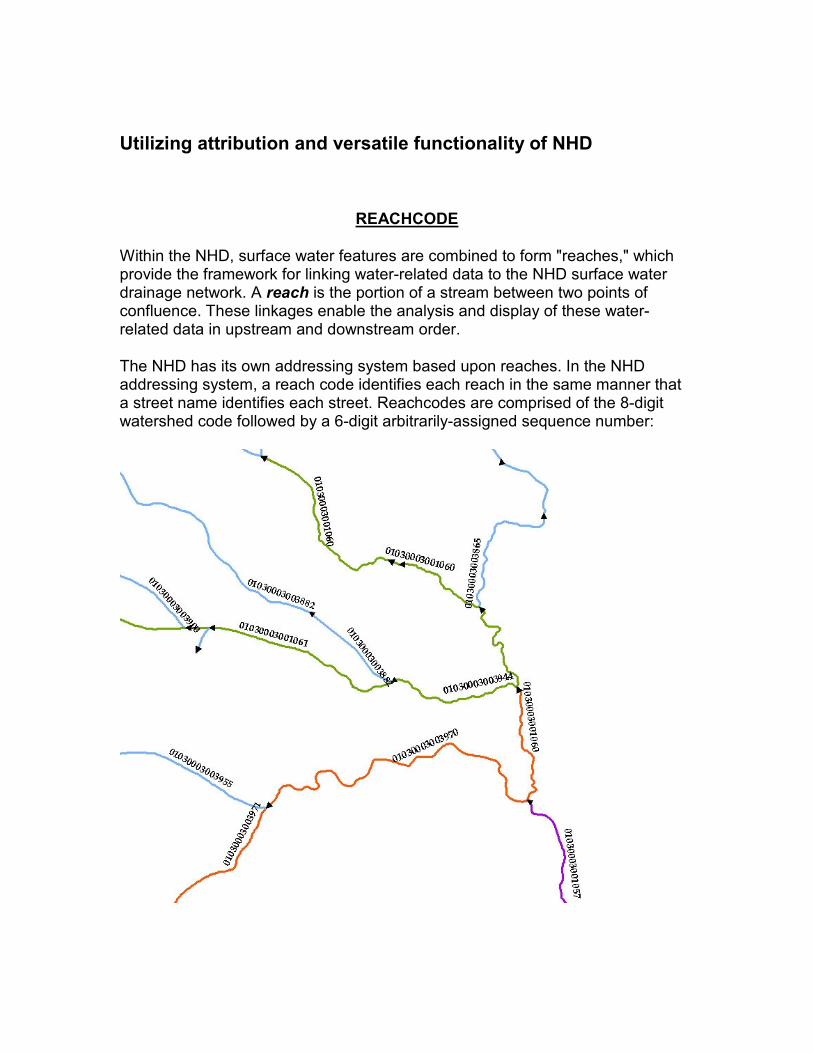
The NHD has its own addressing system based upon reaches. In the NHD addressing system, a reach code identifies each reach in the same manner that a street name identifies each street. Reachcodes are comprised of the 8-digit watershed code followed by a 6-digit arbitrarily-assigned sequence number:
Reach addresses establish the locations of these entities relative to one another within the NHD surface water drainage network in a manner similar to street addresses. Once linked to the NHD by their reach addresses, the upstream/downstream relationships of these water-related entities and any associated information about them can be analyzed using software tools ranging from spreadsheets to Geographic Information Systems (GIS). GIS can also be used to combine NHD-based network analysis with other data layers, such as soils, land use, and population, to help better understand and display their respective effects upon one another. Furthermore, because the NHD provides a nationally consistent framework for addresses and analysis, water-related information linked to reach addresses by one organization (national, state, local) can be shared with other organizations and easily integrated into many different types of applications to the benefit of all.
Position along a reach is determined relative to the reach extent. The downstream end of a reach as 0% and the upstream end is 100%. If a Water Program feature lies halfway along a reach, its position is 50%.
Linear Water Program features are described using both a 'Begin Position' and an 'End Position'. The extent of a linear Water Program feature may span more than one reach.
To link EPA Water Program data to the NHD, EPA, states and tribes record and store the reach address of each Water Program feature in an EPA database called the Reach Address Database (RAD). Within the RAD, an individual Water Program feature and its associated reach address are recorded in a row in a table. Once the reach addresses have been stored in the RAD, the Water Program databases are logically connected through the NHD, enabling the sharing of information across Water Programs.
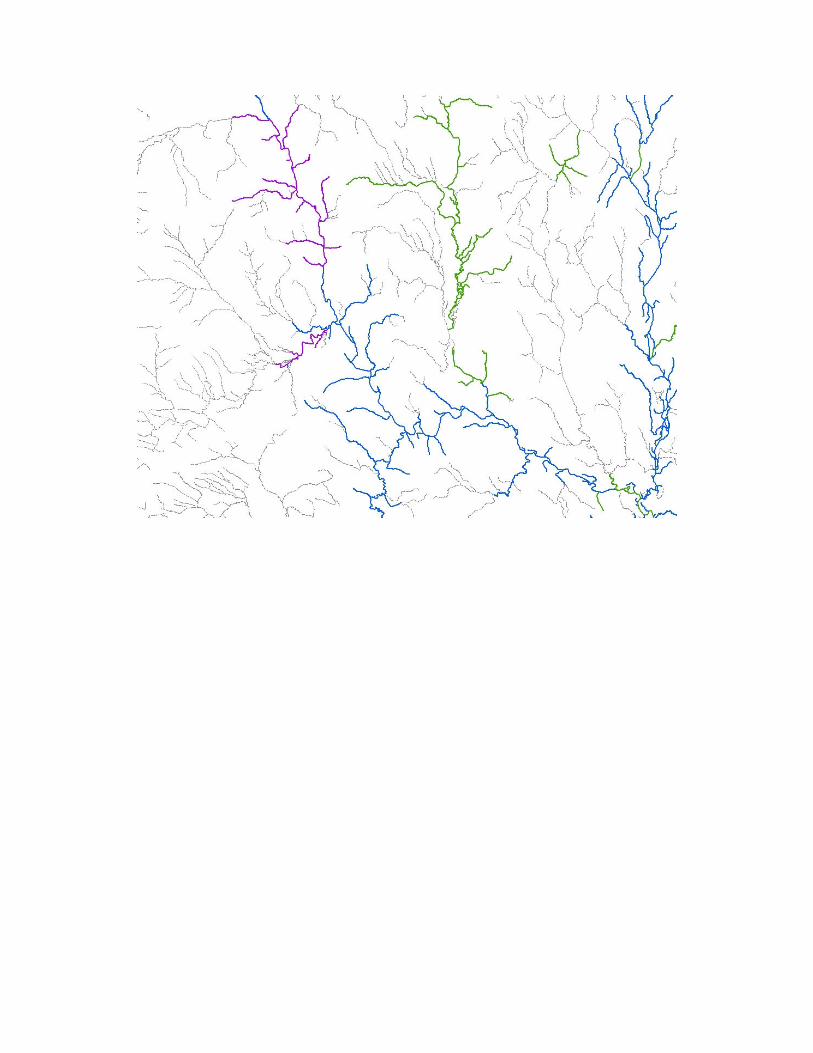
Linking event table data to NHD Exercise #2 Linear Referencing Tools are included in ArcGIS toolbox to create event tables; these tables can be linked to the NHD data using the attribute Reachcode. Start a new ArcMap .mxd Add Hydrography. Turn off all layers except NHDFlowline Add WQRIVER_EVENT_TABLE event table – or event table of your choice Select by attributes NHDFlowline.GNIS_NAME = ‘’. Zoom to selected. Do a join on the NHDFlowline to the WQ table using the Reachcode as the linked field. Now go to NHDFlowline - properties – symbology - catagories and in the value field, use the field name wq_river.RIVCLASS. Add all values and symbolize the values.
Using the NHDFLOWLINEVAA table The NHD Value Added Attributes are a set of 20 attributes that are computed from the NHDFlow table and assigned to each drainage feature in the stream network. The VAAs are designed to enhance the capabilities of NHD in three areas: 1) Navigation and Traversal, 2) Analysis, 3) Display. The VAA's are a component of NHDPlus, an integrated suite of application-ready geospatial data sets that incorporate many of the best features of the National Hydrography Dataset (NHD), and National Elevation Dataset (NED). The NHDPlus includes a stream network, improved networking, naming, and “value-added attributes” (VAA’s). The VAA table for Maine will only have the Stream Order attribute populated for a portion of the state at this time. Stream Order is currently being populated through maintenance of the dataset; the rest of the attribute values will follow. Exercise #3 Open ArcMap
Add MEGIS.HydrographyNHD Add MEGIS.NHDFLOWLINEVAA table Zoom to an area in Western Maine (not all of Maine has been populated for this table). Join the MEGIS.NHDFlowline feature class to the VAA table using the ComID atrribute (a unique common identifier) from both datasets
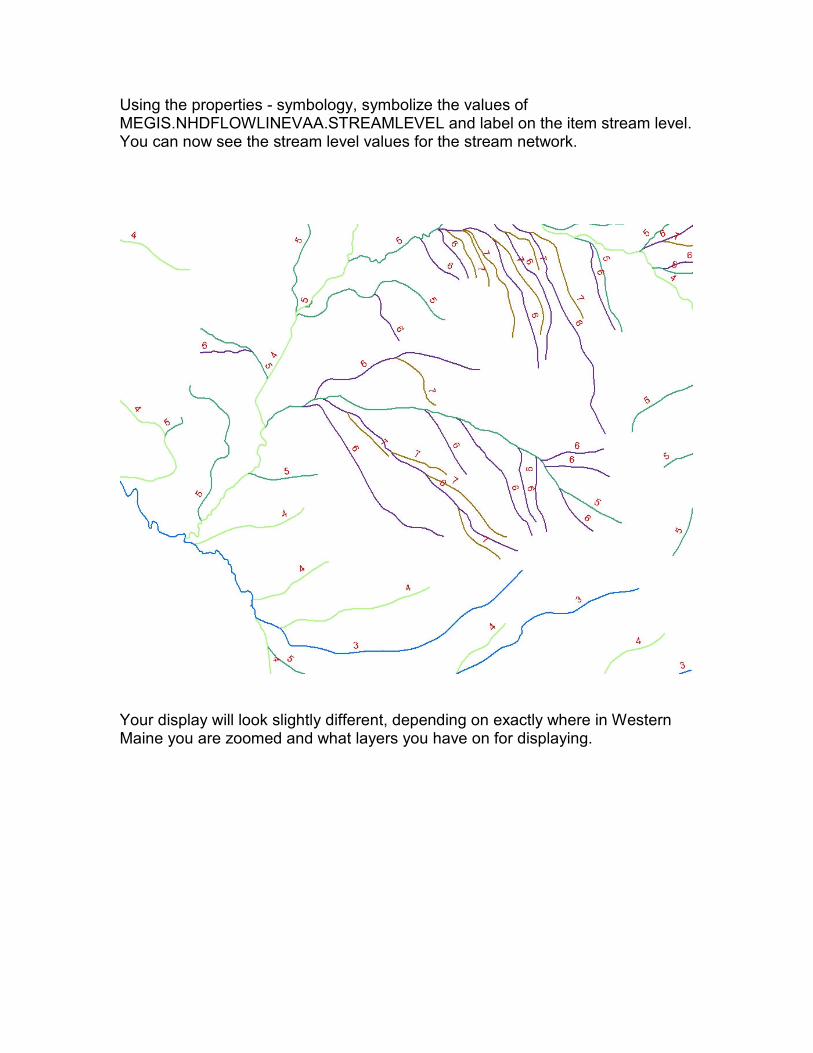
Using the properties - symbology, symbolize the values of MEGIS.NHDFLOWLINEVAA.STREAMLEVEL and label on the item stream level. You can now see the stream level values for the stream network.
Your display will look slightly different, depending on exactly where in Western Maine you are zoomed and what layers you have on for displaying.