Embed Size (px)
Citation preview
Generalization for Generalization for The National Map The National Map with emphasis onwith emphasis on
the National Hydrography Datasetthe National Hydrography Dataset
Lawrence Stanislawski, Science Applications International Corporation (SAIC)Lawrence Stanislawski, Science Applications International Corporation (SAIC)Michael Starbuck, U.S. Geological SurveyMichael Starbuck, U.S. Geological SurveyMichael Finn, U.S. Geological SurveyMichael Finn, U.S. Geological SurveyE. Lynn Usery, U.S. Geological SurveyE. Lynn Usery, U.S. Geological SurveyPat Turley, U.S. Geological SurveyPat Turley, U.S. Geological SurveyJosh Wilkerson, U.S. Geological SurveyJosh Wilkerson, U.S. Geological Survey
2005 ESRI International User Conference, July 25-29. San Diego, CA.
Overview of The National MapOverview of The National Map
Project objectivesProject objectives
Generalization StrategyGeneralization Strategy
National Hydrography Dataset – Flowline networkNational Hydrography Dataset – Flowline network
Geometric characteristics of hydrographic networkGeometric characteristics of hydrographic network
Test DataTest Data
ResultsResults
2005 ESRI International User Conference, July 25-29. San Diego, CA.
The National MapThe National Map
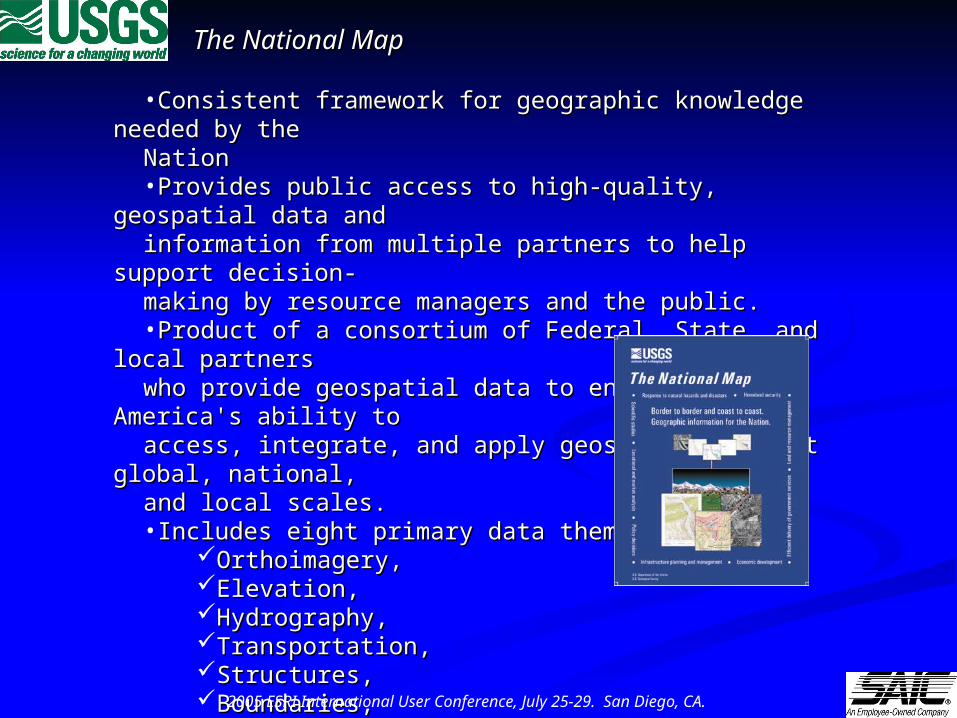
•Consistent framework for geographic knowledge needed by the Consistent framework for geographic knowledge needed by the Nation Nation •Provides public access to high-quality, geospatial data andProvides public access to high-quality, geospatial data andinformation from multiple partners to help support decision-information from multiple partners to help support decision-making by resource managers and the public. making by resource managers and the public. •Product of a consortium of Federal, State, and local partnersProduct of a consortium of Federal, State, and local partnerswho provide geospatial data to enhance America's ability towho provide geospatial data to enhance America's ability toaccess, integrate, and apply geospatial data at global, national,access, integrate, and apply geospatial data at global, national,and local scales. and local scales. •Includes eight primary data themes:Includes eight primary data themes:
Orthoimagery,Orthoimagery,Elevation,Elevation,Hydrography,Hydrography,Transportation,Transportation,Structures,Structures,Boundaries, Boundaries, Geographic names, Geographic names, Land use/land cover, Land use/land cover,
•Most themes are populated, and content will continue to beMost themes are populated, and content will continue to beadded and updatedadded and updated
2005 ESRI International User Conference, July 25-29. San Diego, CA.
The National MapThe National Map
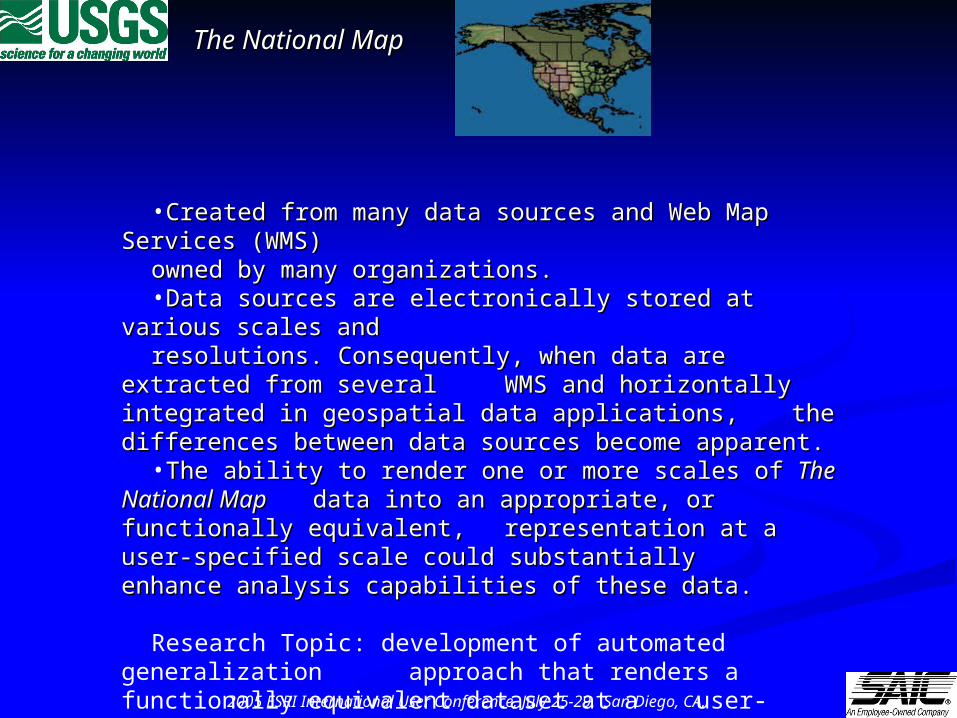
•Created from many data sources and Web Map Services Created from many data sources and Web Map Services (WMS) (WMS)
owned by many organizations.owned by many organizations.•Data sources are electronically stored at various scales and Data sources are electronically stored at various scales and resolutions. Consequently, when data are extracted from several resolutions. Consequently, when data are extracted from several WMS and horizontally integrated in geospatial data applications, WMS and horizontally integrated in geospatial data applications, the differences between data sources become apparent. the differences between data sources become apparent. •The ability to render one or more scales of The ability to render one or more scales of The National MapThe National Map data into an appropriate, or functionally equivalent, data into an appropriate, or functionally equivalent,
representation at a user-specified scale could substantially representation at a user-specified scale could substantially enhance analysis capabilities of these data.enhance analysis capabilities of these data.
Research Topic: development of automated generalization approach that renders a functionally equivalent dataset at a user-specified scale, focusing on the National Hydrography Dataset (NHD) layer of The National Map.
2005 ESRI International User Conference, July 25-29. San Diego, CA.
The National MapThe National MapNational Hydrography Dataset (NHD)National Hydrography Dataset (NHD)
2005 ESRI International User Conference, July 25-29. San Diego, CA.
National Hydrography Dataset
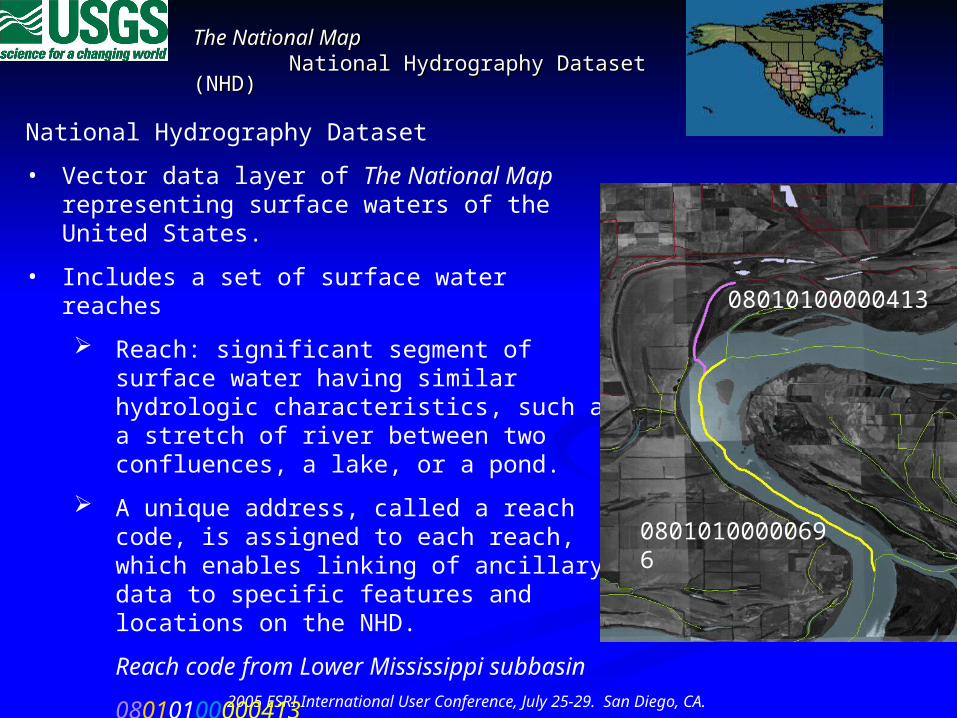
• Vector data layer of The National Map representing surface waters of the United States.
• Includes a set of surface water reaches
Reach: significant segment of surface water having similar hydrologic characteristics, such as a stretch of river between two confluences, a lake, or a pond.
A unique address, called a reach code, is assigned to each reach, which enables linking of ancillary data to specific features and locations on the NHD.
Reach code from Lower Mississippi subbasin
08010100000413
region-subregion-accounting unit-subbasin-reach number
08010100000696
08010100000413
The National MapThe National MapNational Hydrography Dataset (NHD)National Hydrography Dataset (NHD)
2005 ESRI International User Conference, July 25-29. San Diego, CA.
National Hydrography Dataset
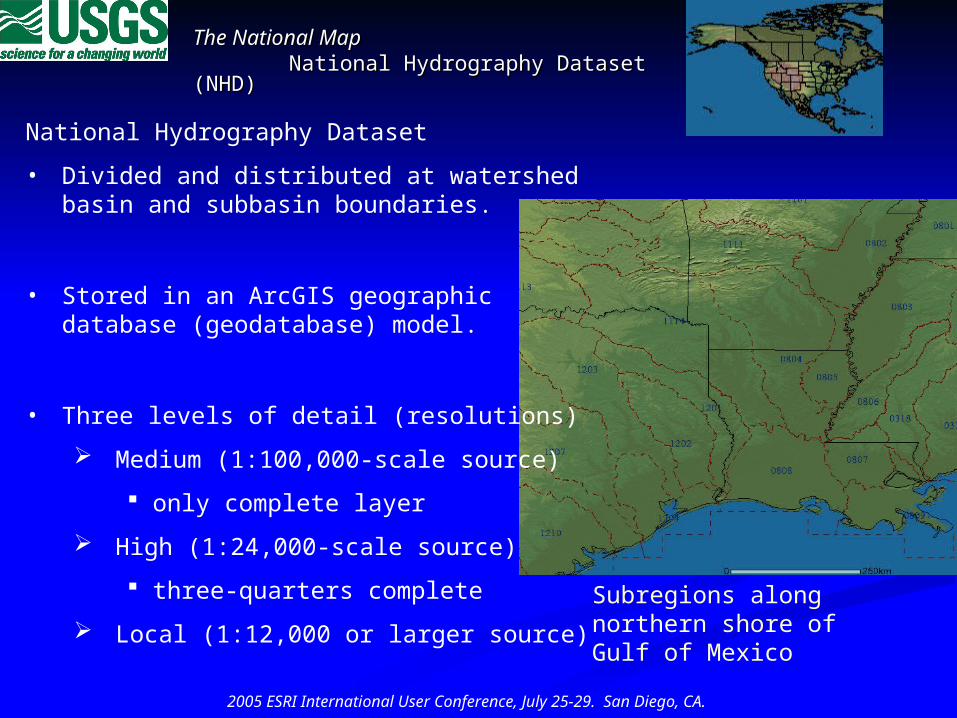
• Divided and distributed at watershed basin and subbasin boundaries.
• Stored in an ArcGIS geographic database (geodatabase) model.
• Three levels of detail (resolutions)
Medium (1:100,000-scale source)
only complete layer
High (1:24,000-scale source)
three-quarters complete
Local (1:12,000 or larger source)Subregions along northern shore of Gulf of Mexico
ObjectivesObjectives
2005 ESRI International User Conference, July 25-29. San Diego, CA.
Develop a generalization strategy that can be implemented on subsets of the NHD.
Strategy should produce a dataset in the NHD model format that maintains:• feature definitions, • reach delineations, • feature relationships, and • flow connections between remaining generalized features.
Extracted dataset should function with NHD applications • less detail • faster processing speed
Extracted level of detail:• user-specified, or • defined by display scale
Generalization ApproachGeneralization Approach
2005 ESRI International User Conference, July 25-29. San Diego, CA.
Base data: user specified, or highest resolution that covers desired area.
Feature pruning – removal of feature that are too small for desired output scale.• select a subset of network features• select a subset of area features• remove point features associated with pruned line or area features
Feature simplification• removal of vertices• aggregation, amalgamation, merging, etc.
Focus so far has been on network pruning
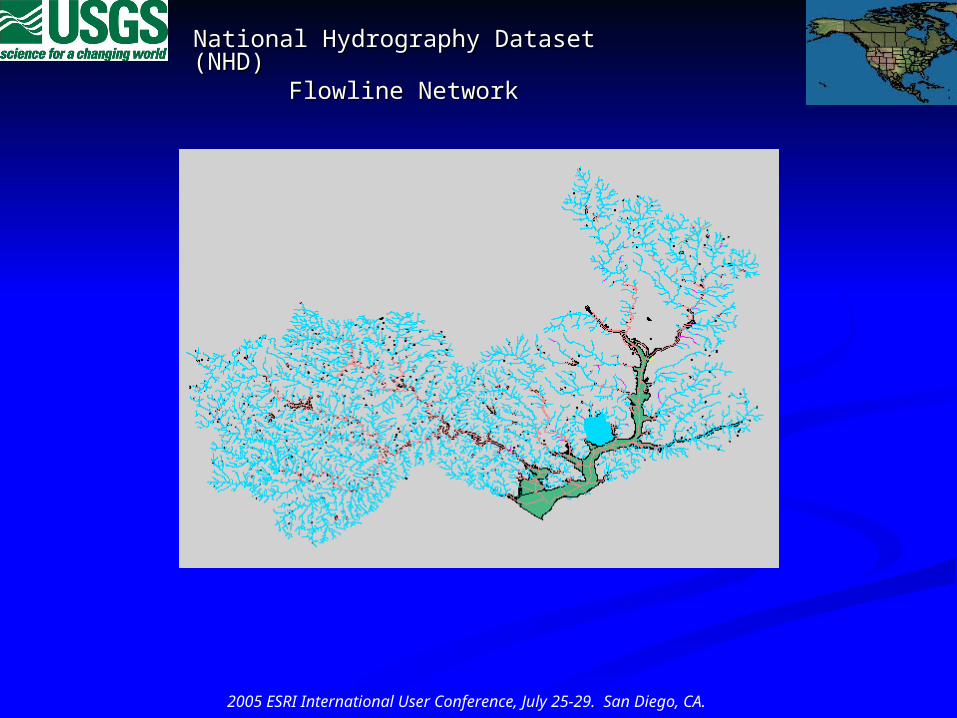
National Hydrography Dataset (NHD)National Hydrography Dataset (NHD)Flowline NetworkFlowline Network
2005 ESRI International User Conference, July 25-29. San Diego, CA.
Drainage network: flow-oriented digital lines that represent the connectivity and flow between surface water features.
Network features types:• Stream/river• Canal/ditch• Pipeline• Connector• Artificial path
Connector represents a path where surface flow is known to exist but was not included in the source material.
Artificial path represents a flow path through an areal water feature that is connected to the drainage network. Areal features that may include artificial paths are:
area of complex channel, canal/ditch, estuary, ice mass, lake/pond, playa, reservoir, stream/river, swamp/marsh, and wash
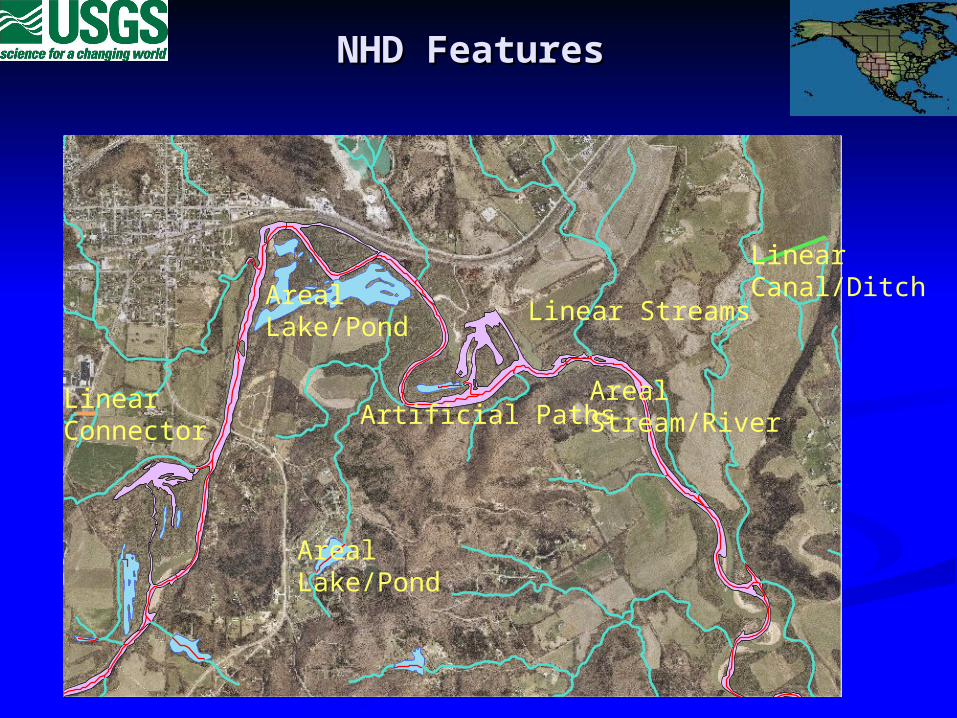
NHD FeaturesNHD Features
Areal Stream/River
Areal Lake/Pond
Areal Lake/Pond
Linear Streams
Linear Canal/Ditch
Linear Connector
Artificial Paths
National Hydrography Dataset (NHD)National Hydrography Dataset (NHD)Flowline NetworkFlowline Network
2005 ESRI International User Conference, July 25-29. San Diego, CA.
MethodsMethodsDrainage network characteristicsDrainage network characteristics
2005 ESRI International User Conference, July 25-29. San Diego, CA.
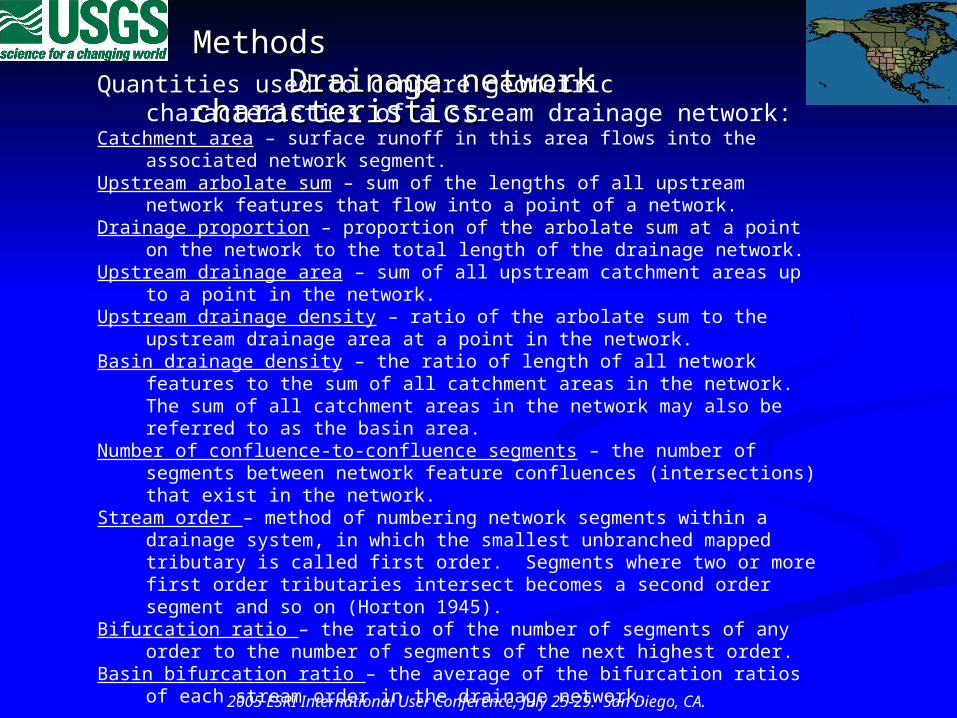
Quantities used to compare geometric characteristics of a stream drainage network:
Catchment area – surface runoff in this area flows into the associated network segment.Upstream arbolate sum – sum of the lengths of all upstream network features that flow
into a point of a network.Drainage proportion – proportion of the arbolate sum at a point on the network to the
total length of the drainage network.Upstream drainage area – sum of all upstream catchment areas up to a point in the
network.Upstream drainage density – ratio of the arbolate sum to the upstream drainage area at
a point in the network.Basin drainage density – the ratio of length of all network features to the sum of all
catchment areas in the network. The sum of all catchment areas in the network may also be referred to as the basin area.
Number of confluence-to-confluence segments – the number of segments between network feature confluences (intersections) that exist in the network.
Stream order – method of numbering network segments within a drainage system, in which the smallest unbranched mapped tributary is called first order. Segments where two or more first order tributaries intersect becomes a second order segment and so on (Horton 1945).
Bifurcation ratio – the ratio of the number of segments of any order to the number of segments of the next highest order.
Basin bifurcation ratio – the average of the bifurcation ratios of each stream order in the drainage network.
MethodsMethods
2005 ESRI International User Conference, July 25-29. San Diego, CA.
Network drainage characteristics summarized by NHD subbasin
Arc Macro Language Programs
Python geoprocessing scripts
Rapid method that uses Thiessen polygons to the estimate catchment area for each network drainage feature was developed for these computations
MethodsMethods
2005 ESRI International User Conference, July 25-29. San Diego, CA.
Flowline Network Pruning
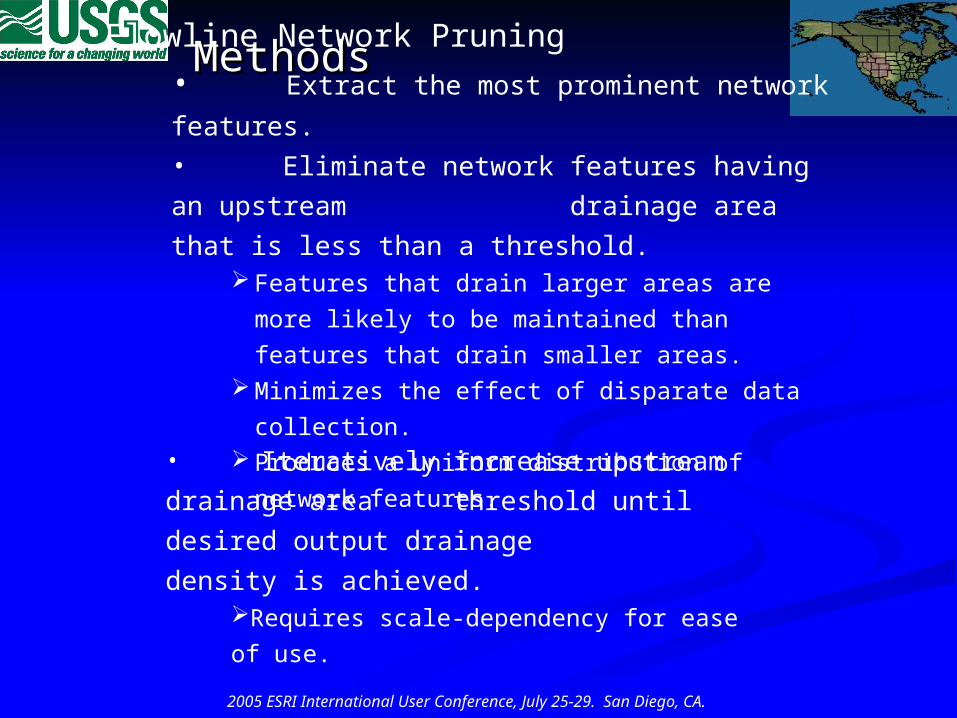
• Extract the most prominent network features.
• Eliminate network features having an upstream
drainage area that is less than a
threshold. Features that drain larger areas are more likely to be
maintained than features that drain smaller areas. Minimizes the effect of disparate data collection. Produces a uniform distribution of network features.
• Iteratively increase upstream drainage
area threshold until desired output drainage
density is achieved.Requires scale-dependency for ease of use.
MethodsMethodsFlowline Network Pruning
2005 ESRI International User Conference, July 25-29. San Diego, CA.
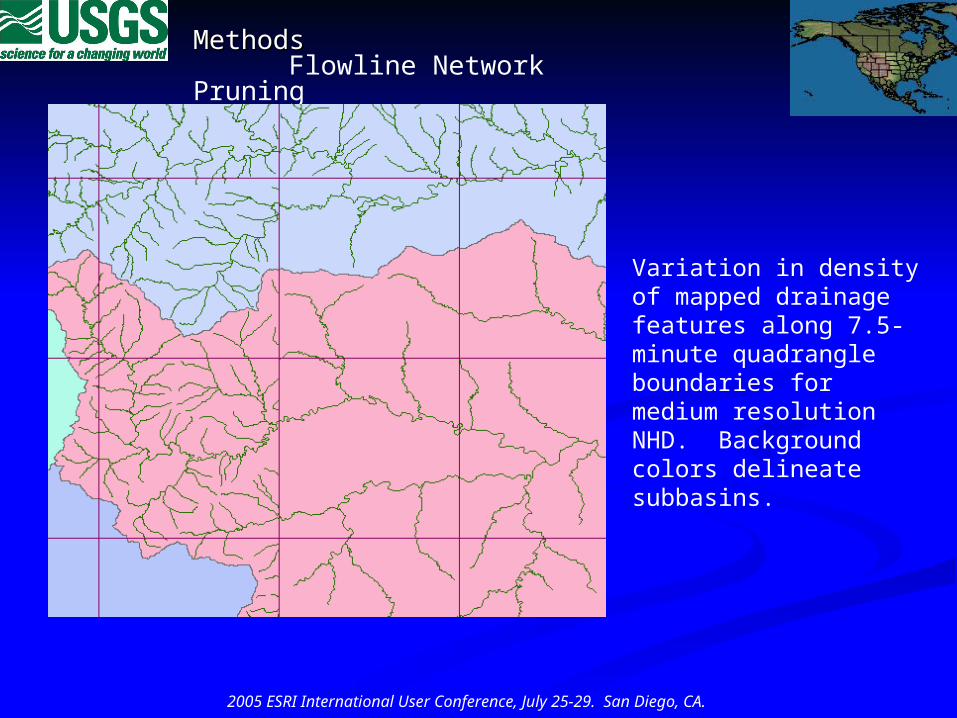
Variation in density of mapped drainage features along 7.5-minute quadrangle boundaries for medium resolution NHD. Background colors delineate subbasins.
MethodsMethodsFlowline Network PruningFlowline Network Pruning
2005 ESRI International User Conference, July 25-29. San Diego, CA.
Modeled relationship between • Elevation-derived drainage density• Minimum drainage area for stream formation
Elevation data extracted from the National Elevation Dataset (NED, USGS 2005) and resampled to a 30 meter cell size.
Approximate stream channels were derived from the elevation data through commonly used methods.
Varied minimum drainage area for stream formation on the flow accumulation grid between 0.135 km2 (150 cells) to 90 km2
(100,000 cells)
Completed for two study areas.
MethodsMethods
2005 ESRI International User Conference, July 25-29. San Diego, CA.
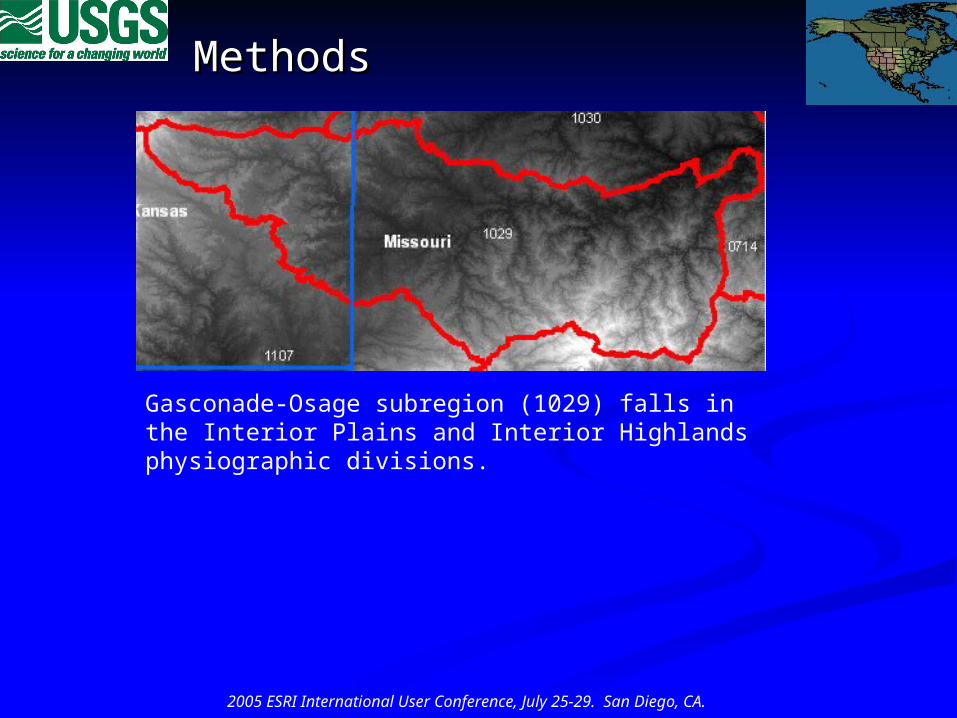
Gasconade-Osage subregion (1029) falls in the Interior Plains and Interior Highlands physiographic divisions.
MethodsMethods
2005 ESRI International User Conference, July 25-29. San Diego, CA.
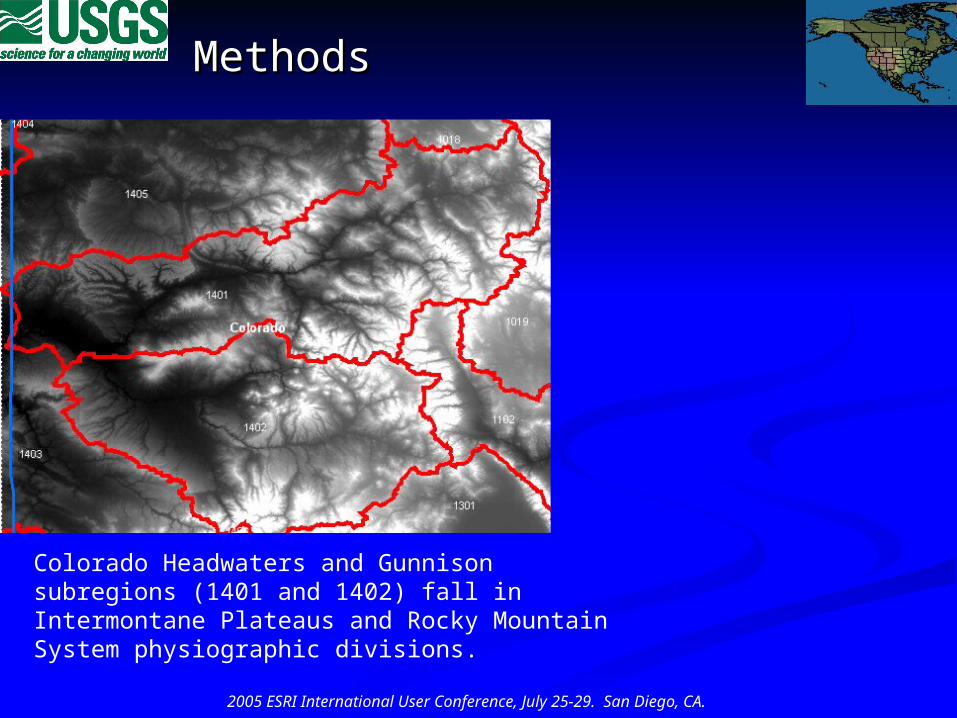
Colorado Headwaters and Gunnison subregions (1401 and 1402) fall in Intermontane Plateaus and Rocky Mountain System physiographic divisions.
MethodsMethods
2005 ESRI International User Conference, July 25-29. San Diego, CA.
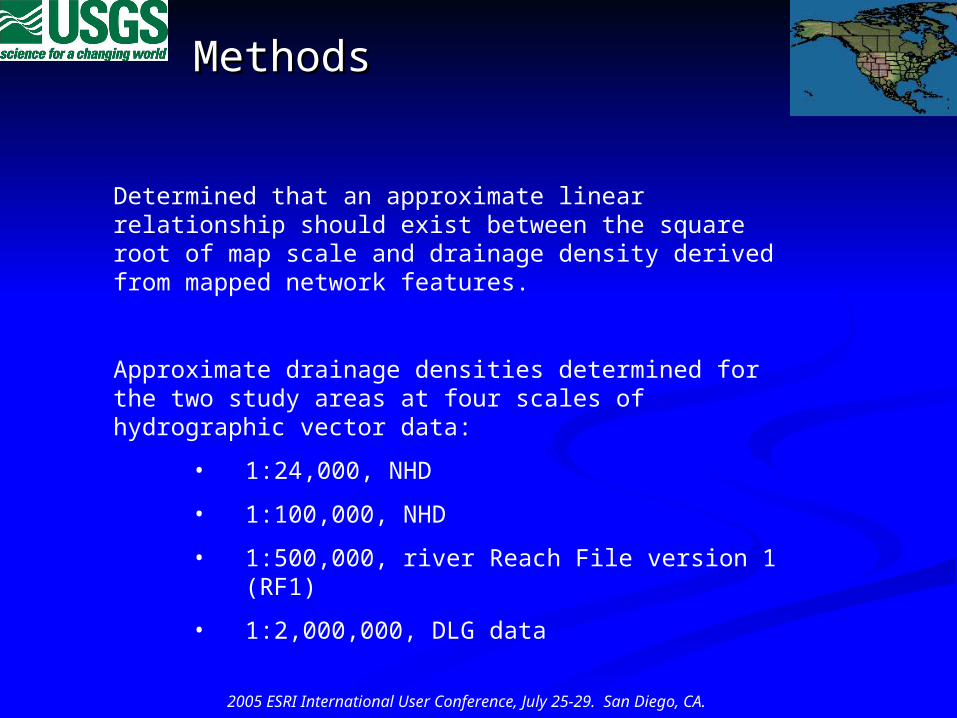
Determined that an approximate linear relationship should exist between the square root of map scale and drainage density derived from mapped network features.
Approximate drainage densities determined for the two study areas at four scales of hydrographic vector data:
• 1:24,000, NHD
• 1:100,000, NHD
• 1:500,000, river Reach File version 1 (RF1)
• 1:2,000,000, DLG data
ResultsResultsDrainage Network CharacteristicsDrainage Network Characteristics
2005 ESRI International User Conference, July 25-29. San Diego, CA.
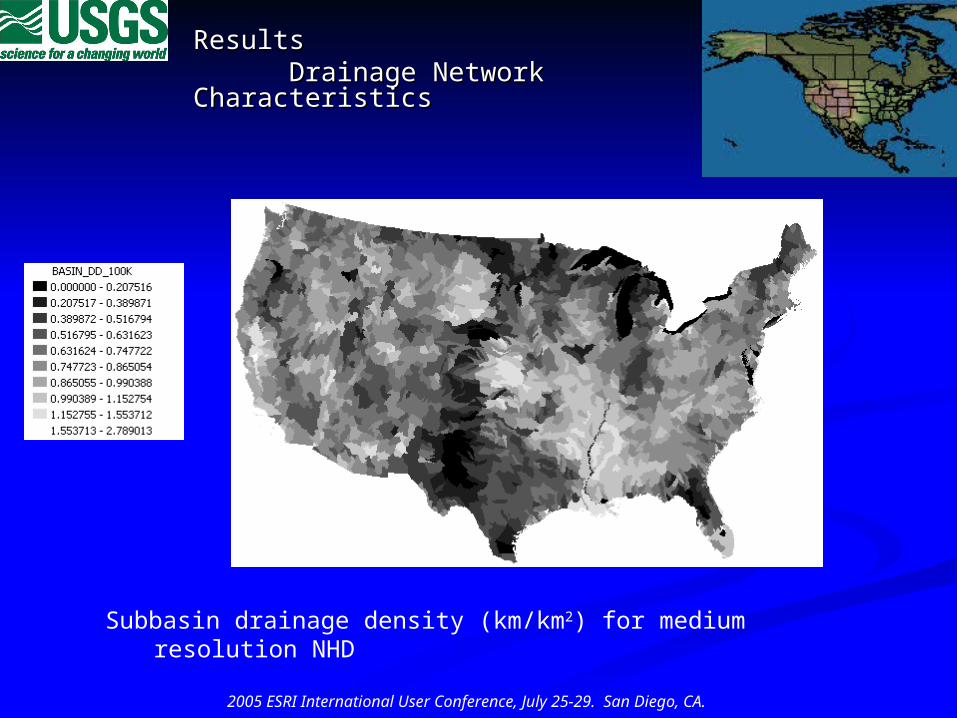
Subbasin drainage density (km/km2) for medium resolution NHD
ResultsResultsDrainage Network CharacteristicsDrainage Network Characteristics
2005 ESRI International User Conference, July 25-29. San Diego, CA.
Sample Dataset from Gasconade-Osage subregion:•Pomme De Terre (PDT) subbasin (NHD 10290107).•Medium level of drainage density difference between the high and medium resolution NHD subbasins for the PDT (difference about 0.6421 km/km2).
Relative magnitude of drainage density differences between the high resolution layer and the medium resolution layer of the region. Darker red indicates a higher difference in density.
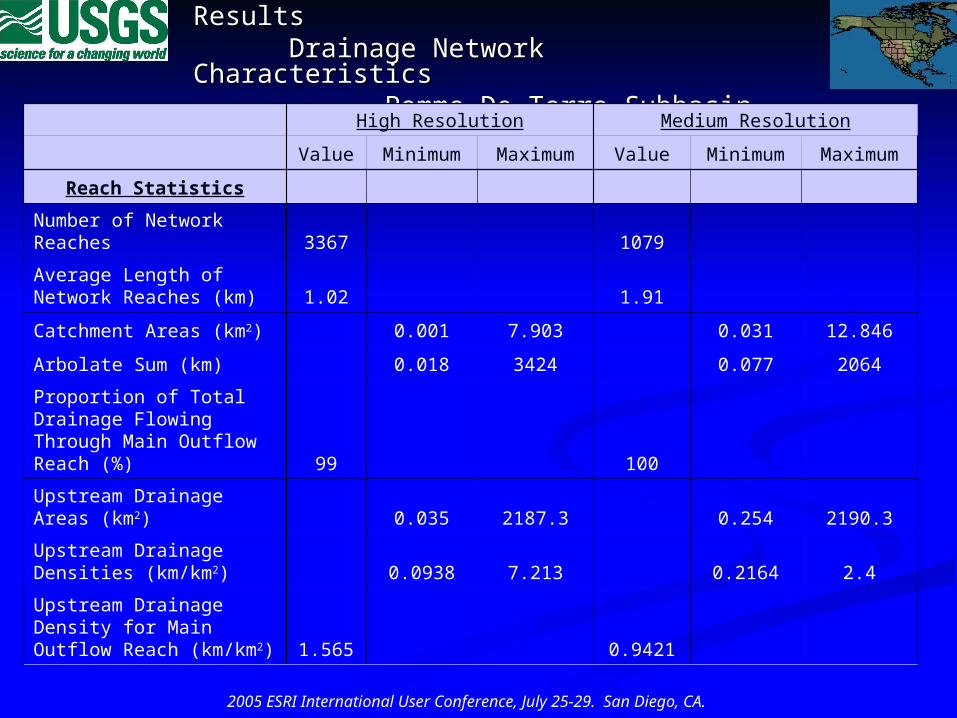
ResultsResultsDrainage Network CharacteristicsDrainage Network Characteristics
Pomme De Terre SubbasinPomme De Terre Subbasin
2005 ESRI International User Conference, July 25-29. San Diego, CA.
High Resolution Medium Resolution
Value Minimum Maximum Value Minimum Maximum
Reach Statistics
Number of Network Reaches 3367 1079
Average Length of Network Reaches (km) 1.02 1.91
Catchment Areas (km2) 0.001 7.903 0.031 12.846
Arbolate Sum (km) 0.018 3424 0.077 2064
Proportion of Total Drainage Flowing Through Main Outflow Reach (%) 99 100
Upstream Drainage Areas (km2) 0.035 2187.3 0.254 2190.3
Upstream Drainage Densities (km/km2) 0.0938 7.213 0.2164 2.4
Upstream Drainage Density for Main Outflow Reach (km/km2) 1.565 0.9421
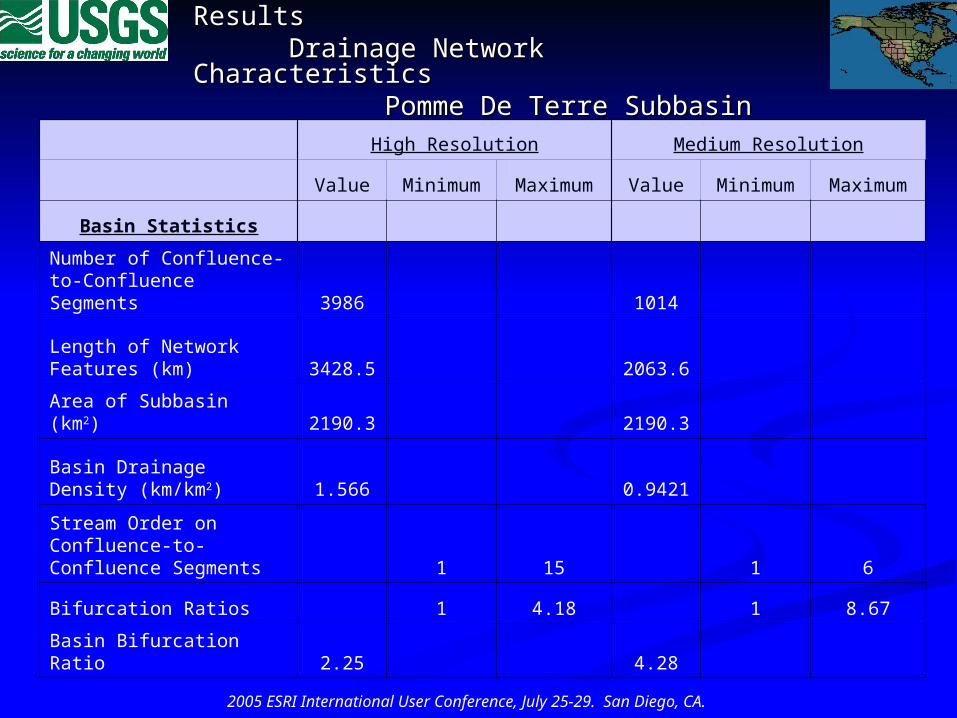
ResultsResultsDrainage Network CharacteristicsDrainage Network Characteristics
Pomme De Terre SubbasinPomme De Terre Subbasin
2005 ESRI International User Conference, July 25-29. San Diego, CA.
High Resolution Medium Resolution
Value Minimum Maximum Value Minimum Maximum
Basin Statistics
Number of Confluence-to-Confluence Segments 3986 1014
Length of Network Features (km) 3428.5 2063.6
Area of Subbasin (km2) 2190.3 2190.3
Basin Drainage Density (km/km2) 1.566 0.9421
Stream Order on Confluence-to-Confluence Segments 1 15 1 6
Bifurcation Ratios 1 4.18 1 8.67
Basin Bifurcation Ratio 2.25 4.28
ResultsResultsDrainage Network CharacteristicsDrainage Network Characteristics
Pomme De Terre SubbasinPomme De Terre Subbasin
2005 ESRI International User Conference, July 25-29. San Diego, CA.
Divergent to convergent network segments increment stream order when one or both segments receive additional flow.
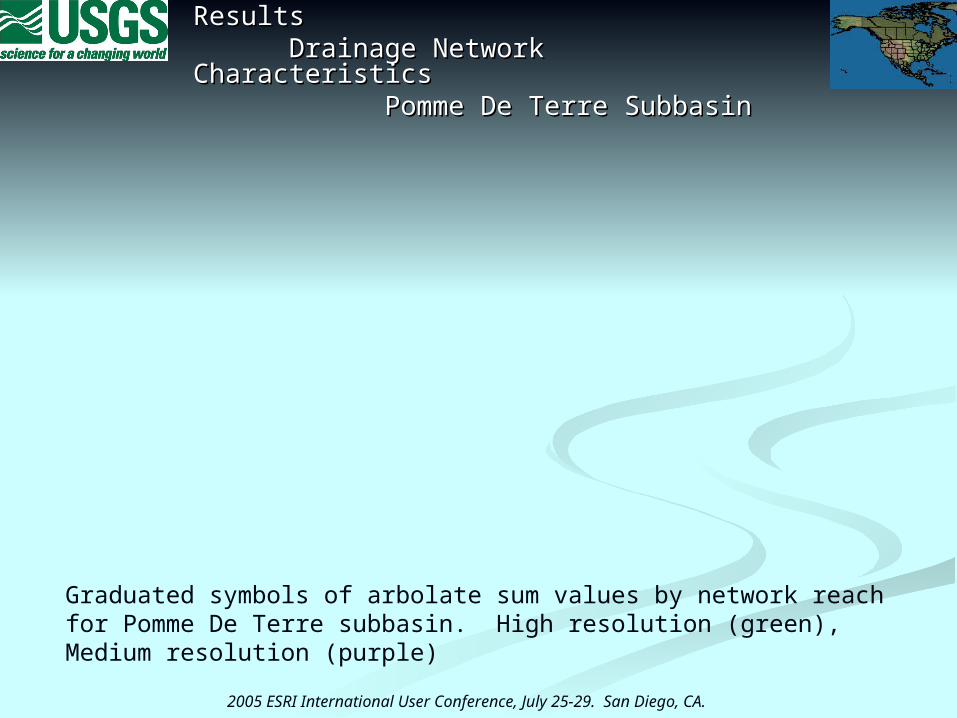
ResultsResultsDrainage Network CharacteristicsDrainage Network Characteristics
Pomme De Terre SubbasinPomme De Terre Subbasin
2005 ESRI International User Conference, July 25-29. San Diego, CA.
Graduated symbols of arbolate sum values by network reach for Pomme De Terre subbasin. High resolution (green), Medium resolution (purple)
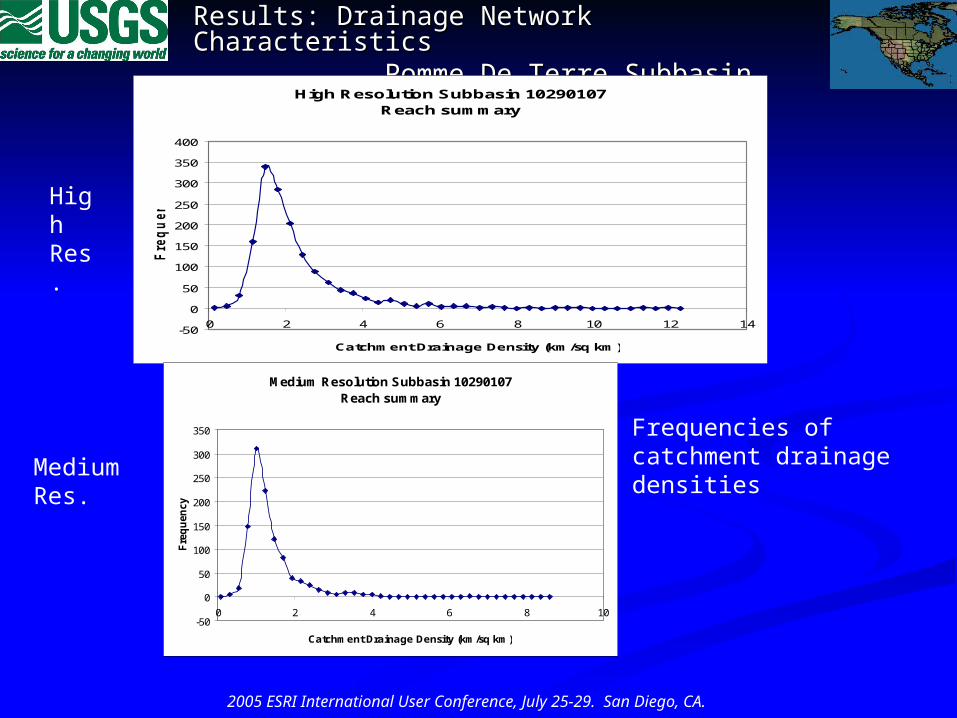
Results: Drainage Network CharacteristicsResults: Drainage Network CharacteristicsPomme De Terre SubbasinPomme De Terre Subbasin
2005 ESRI International User Conference, July 25-29. San Diego, CA.
High Resolution Subbasin 10290107Reach summary
-50
0
50
100
150
200
250
300
350
400
0 2 4 6 8 10 12 14
Catchment Drainage Density (km/sq km)
Freq
uen
cy
Medium Resolution Subbasin 10290107Reach summary
-50
0
50
100
150
200
250
300
350
0 2 4 6 8 10
Catchment Drainage Density (km/sq km)
Fre
qu
en
cy
Frequencies of catchment drainage densities
High Res.
Medium Res.
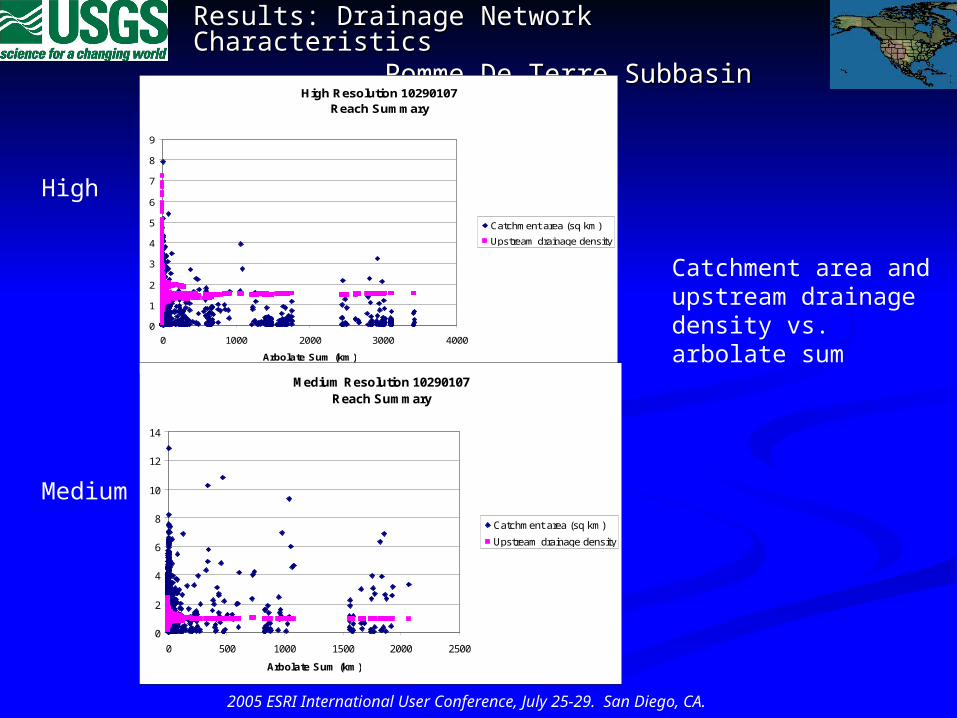
Results: Drainage Network CharacteristicsResults: Drainage Network CharacteristicsPomme De Terre SubbasinPomme De Terre Subbasin
2005 ESRI International User Conference, July 25-29. San Diego, CA.
High Resolution 10290107Reach Summary
0
1
2
3
4
5
6
7
8
9
0 1000 2000 3000 4000
Arbolate Sum (km)
Catchment area (sq km)
Upstream drainage density
Medium Resolution 10290107Reach Summary
0
2
4
6
8
10
12
14
0 500 1000 1500 2000 2500
Arbolate Sum (km)
Catchment area (sq km)
Upstream drainage density
Catchment area and upstream drainage density vs. arbolate sum
High
Medium
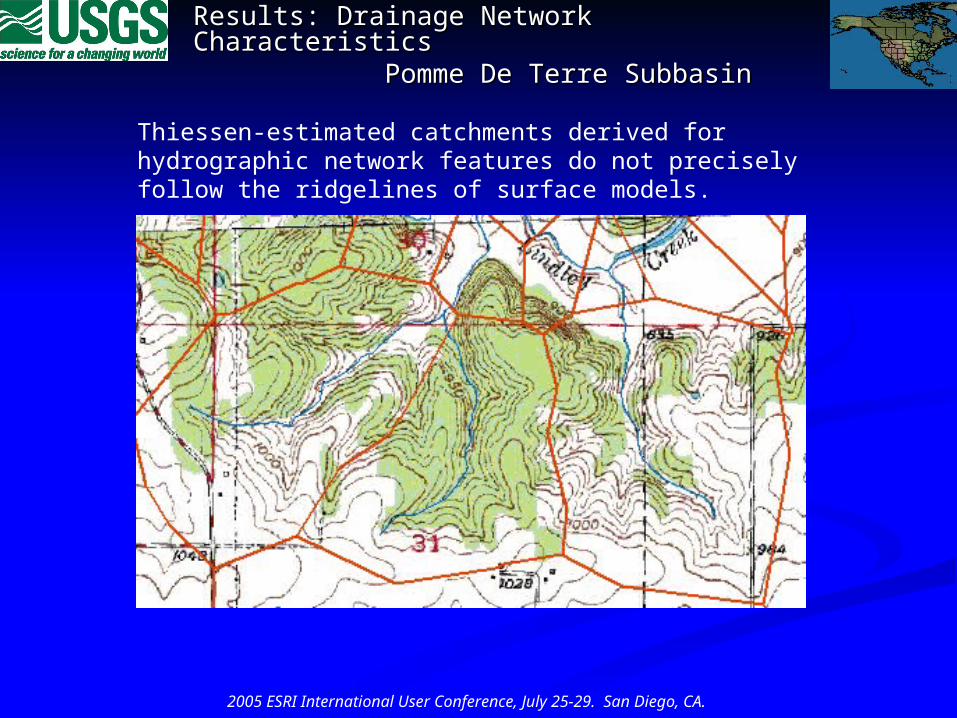
Results: Drainage Network CharacteristicsResults: Drainage Network CharacteristicsPomme De Terre SubbasinPomme De Terre Subbasin
2005 ESRI International User Conference, July 25-29. San Diego, CA.
Thiessen-estimated catchments derived for hydrographic network features do not precisely follow the ridgelines of surface models.
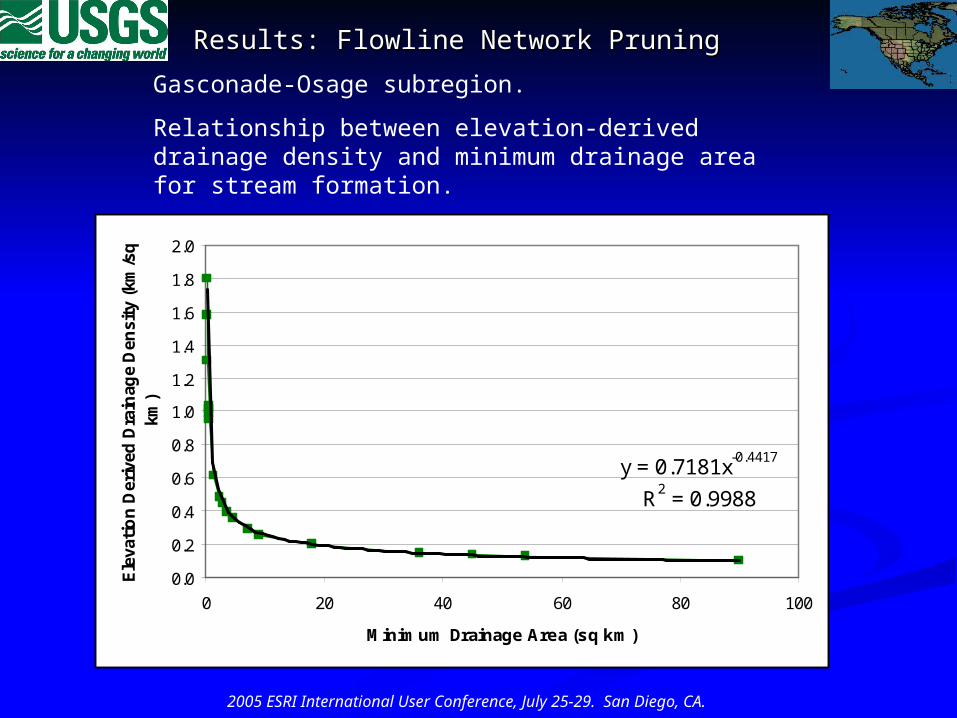
Results: Flowline Network PruningResults: Flowline Network Pruning
2005 ESRI International User Conference, July 25-29. San Diego, CA.
Gasconade-Osage subregion.
Relationship between elevation-derived drainage density and minimum drainage area for stream formation.
y = 0.7181x-0.4417
R2 = 0.9988
0.0
0.2
0.4
0.6
0.8
1.0
1.2
1.4
1.6
1.8
2.0
0 20 40 60 80 100
Minimum Drainage Area (sq km)
Ele
vati
on
Der
ived
Dra
inag
e D
ensi
ty (
km/s
q
km)
Results: Flowline Network PruningResults: Flowline Network Pruning
2005 ESRI International User Conference, July 25-29. San Diego, CA.
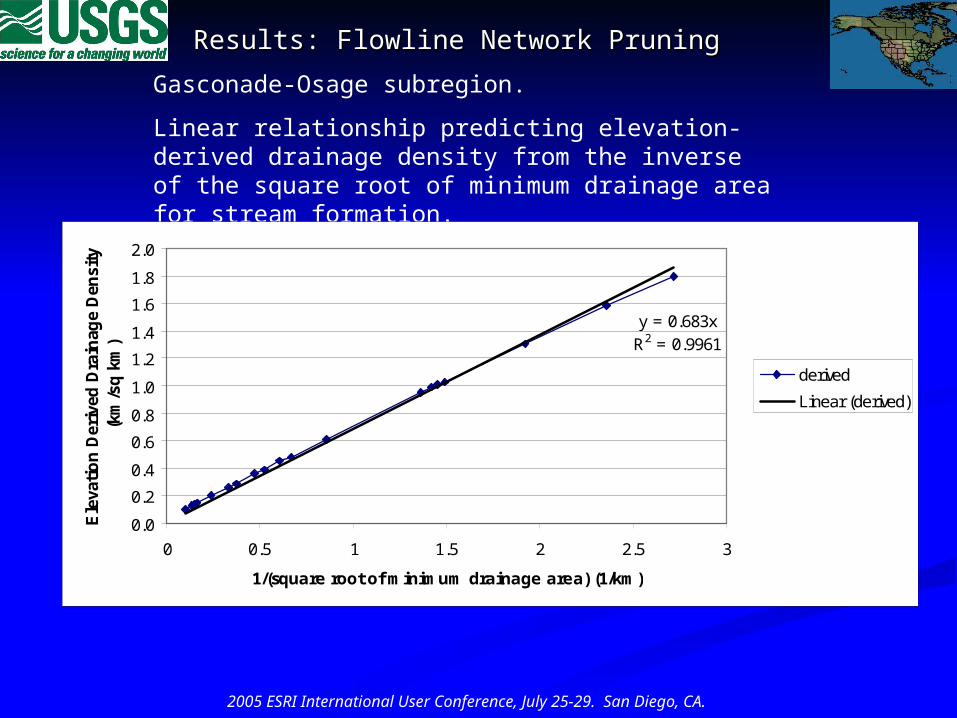
Gasconade-Osage subregion.
Linear relationship predicting elevation-derived drainage density from the inverse of the square root of minimum drainage area for stream formation.
y = 0.683xR2 = 0.9961
0.0
0.2
0.4
0.6
0.8
1.0
1.2
1.4
1.6
1.8
2.0
0 0.5 1 1.5 2 2.5 3
1/(square root of minimum drainage area) (1/km)
Ele
vati
on
Der
ived
Dra
inag
e D
ensi
ty
(km
/sq
km
)
derived
Linear (derived)
Results: Flowline Network PruningResults: Flowline Network Pruning
2005 ESRI International User Conference, July 25-29. San Diego, CA.
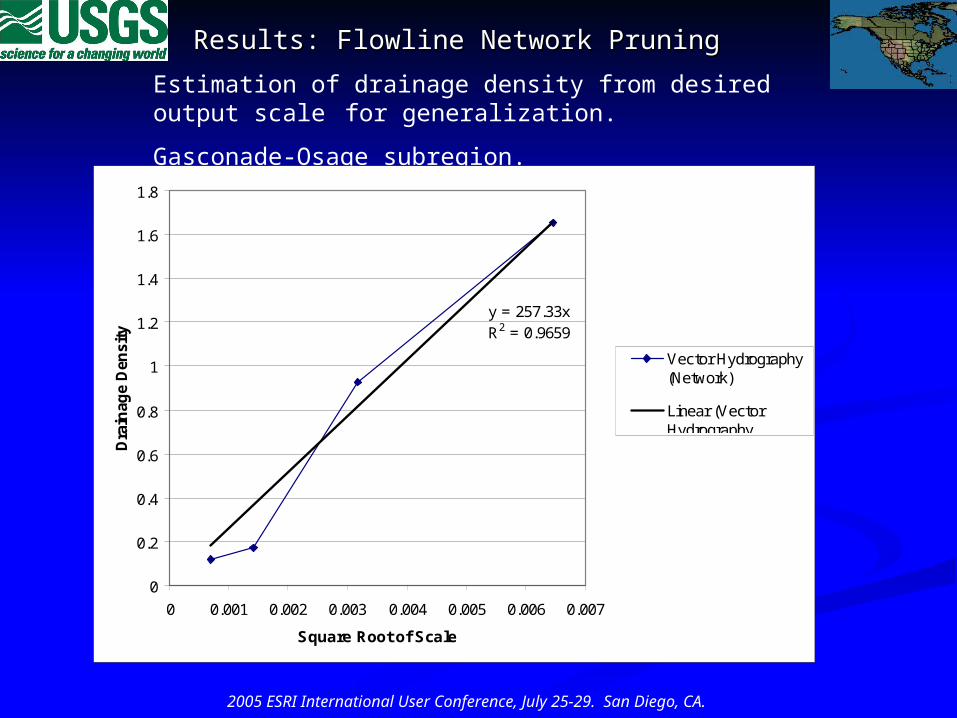
Estimation of drainage density from desired output scale for generalization.
Gasconade-Osage subregion.
y = 257.33xR2 = 0.9659
0
0.2
0.4
0.6
0.8
1
1.2
1.4
1.6
1.8
0 0.001 0.002 0.003 0.004 0.005 0.006 0.007
Square Root of Scale
Dra
inag
e D
ensi
ty
Vector Hydrography(Network)
Linear (VectorHydrography(Network))
Results: Flowline Network PruningResults: Flowline Network Pruning
2005 ESRI International User Conference, July 25-29. San Diego, CA.
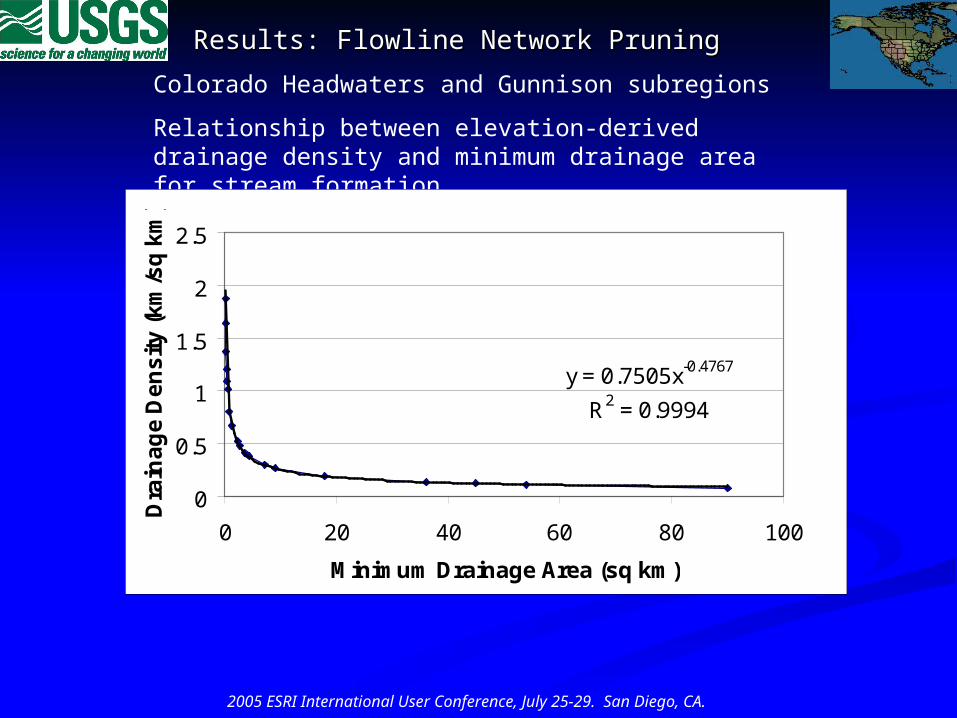
Colorado Headwaters and Gunnison subregions
Relationship between elevation-derived drainage density and minimum drainage area for stream formation.
y = 0.7505x-0.4767
R2 = 0.9994
0
0.5
1
1.5
2
2.5
0 20 40 60 80 100
Minimum Drainage Area (sq km)
Dra
ina
ge
De
ns
ity
(k
m/s
q k
m)
Results: Flowline Network PruningResults: Flowline Network Pruning
2005 ESRI International User Conference, July 25-29. San Diego, CA.
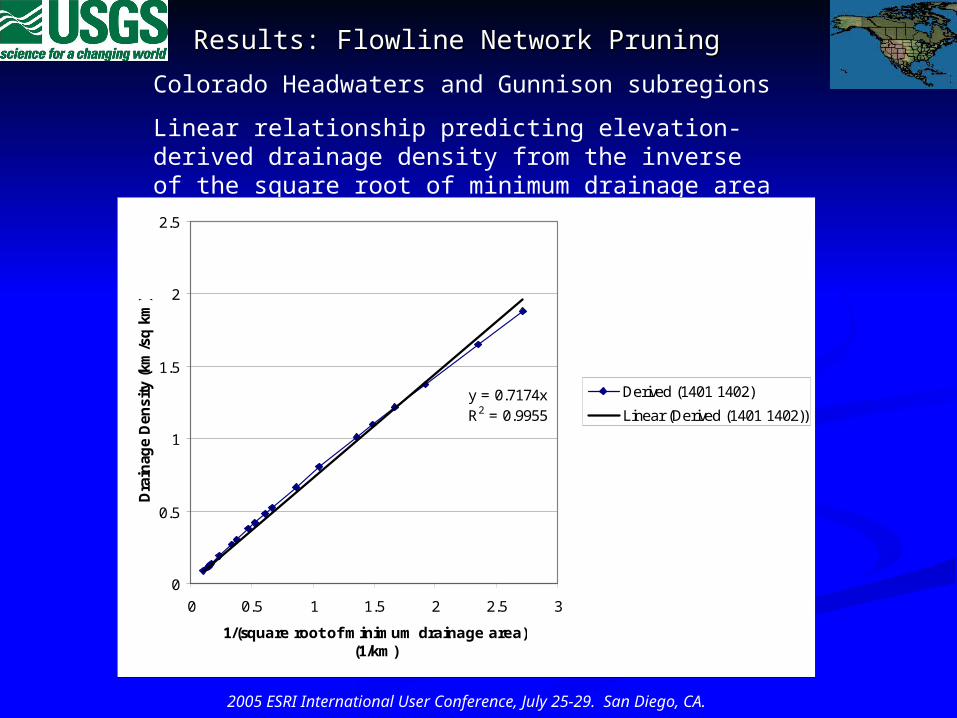
Colorado Headwaters and Gunnison subregions
Linear relationship predicting elevation-derived drainage density from the inverse of the square root of minimum drainage area for stream formation.
y = 0.7174xR2 = 0.9955
0
0.5
1
1.5
2
2.5
0 0.5 1 1.5 2 2.5 3
1/(square root of minimum drainage area) (1/km)
Dra
inag
e D
ensi
ty (
km/s
q k
m)
Derived (1401 1402)
Linear (Derived (1401 1402))
Results: Flowline Network PruningResults: Flowline Network Pruning
2005 ESRI International User Conference, July 25-29. San Diego, CA.
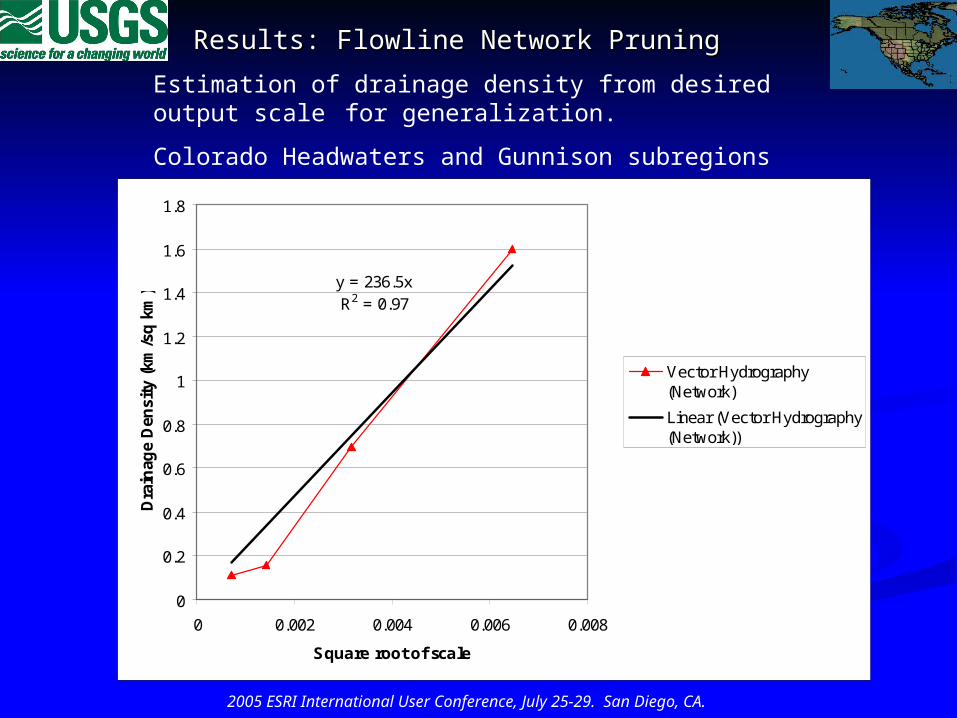
Estimation of drainage density from desired output scale for generalization.
Colorado Headwaters and Gunnison subregions
y = 236.5xR2 = 0.97
0
0.2
0.4
0.6
0.8
1
1.2
1.4
1.6
1.8
0 0.002 0.004 0.006 0.008
Square root of scale
Dra
inag
e D
ensi
ty (
km/s
q k
m)
Vector Hydrography(Network)
Linear (Vector Hydrography(Network))
Results: Flowline Network PruningResults: Flowline Network Pruning
2005 ESRI International User Conference, July 25-29. San Diego, CA.
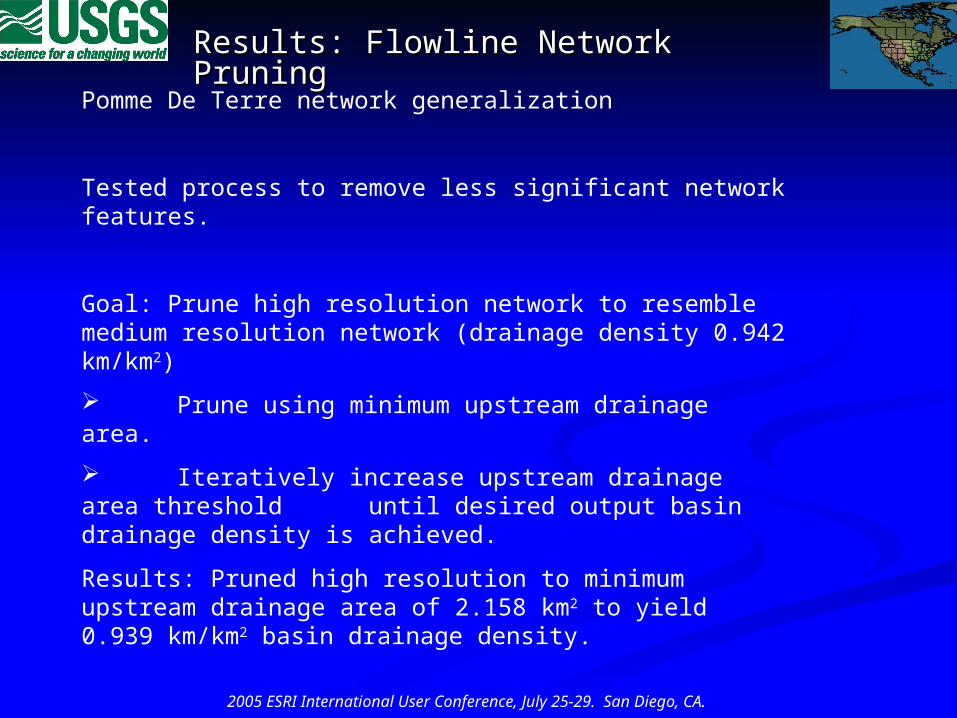
Pomme De Terre network generalization
Tested process to remove less significant network features.
Goal: Prune high resolution network to resemble medium resolution network (drainage density 0.942 km/km2)
Prune using minimum upstream drainage area.
Iteratively increase upstream drainage area threshold until desired output basin drainage density is achieved.
Results: Pruned high resolution to minimum upstream drainage area of 2.158 km2 to yield 0.939 km/km2 basin drainage density.
Results: Flowline Network PruningResults: Flowline Network Pruning
2005 ESRI International User Conference, July 25-29. San Diego, CA.
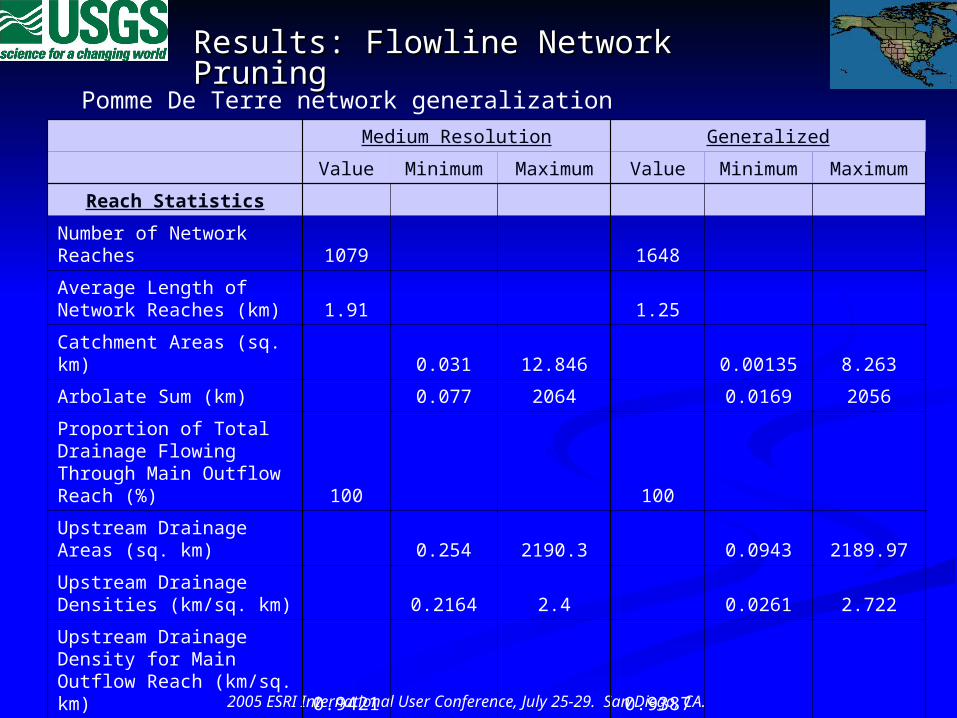
Pomme De Terre network generalization
Medium Resolution Generalized
Value Minimum Maximum Value Minimum Maximum
Reach Statistics
Number of Network Reaches 1079 1648
Average Length of Network Reaches (km) 1.91 1.25
Catchment Areas (sq. km) 0.031 12.846 0.00135 8.263
Arbolate Sum (km) 0.077 2064 0.0169 2056
Proportion of Total Drainage Flowing Through Main Outflow Reach (%) 100 100
Upstream Drainage Areas (sq. km) 0.254 2190.3 0.0943 2189.97
Upstream Drainage Densities (km/sq. km) 0.2164 2.4 0.0261 2.722
Upstream Drainage Density for Main Outflow Reach (km/sq. km) 0.9421 0.9387
Results: Flowline Network PruningResults: Flowline Network Pruning
2005 ESRI International User Conference, July 25-29. San Diego, CA.
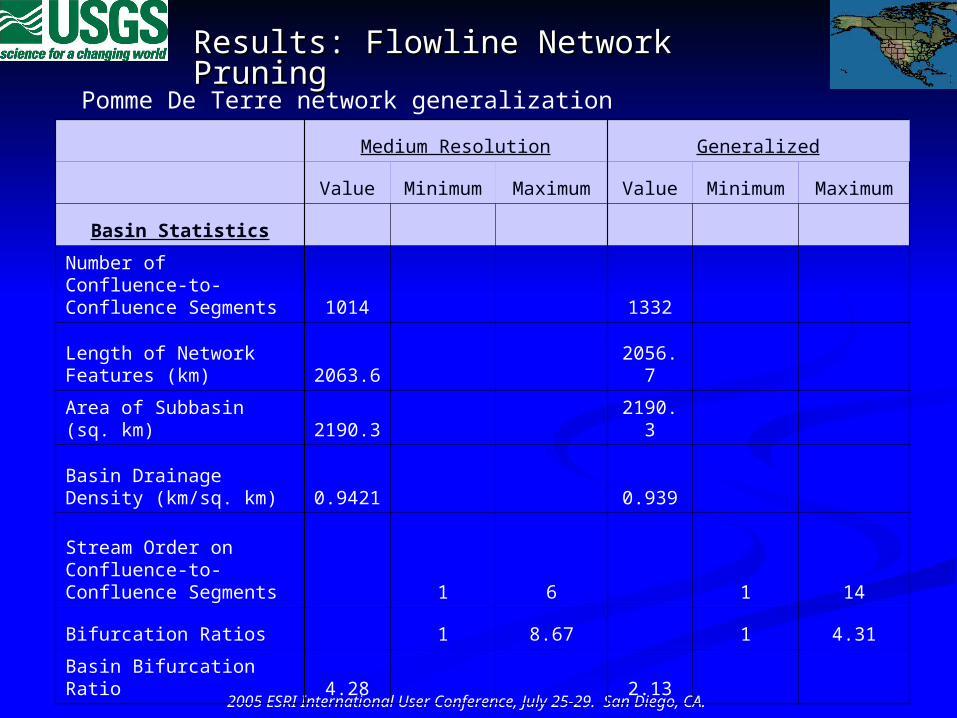
Pomme De Terre network generalization
Medium Resolution Generalized
Value Minimum Maximum Value Minimum Maximum
Basin Statistics
Number of Confluence-to-Confluence Segments 1014 1332
Length of Network Features (km) 2063.6 2056.7
Area of Subbasin (sq. km) 2190.3 2190.3
Basin Drainage Density (km/sq. km) 0.9421 0.939
Stream Order on Confluence-to-Confluence Segments 1 6 1 14
Bifurcation Ratios 1 8.67 1 4.31
Basin Bifurcation Ratio 4.28 2.13
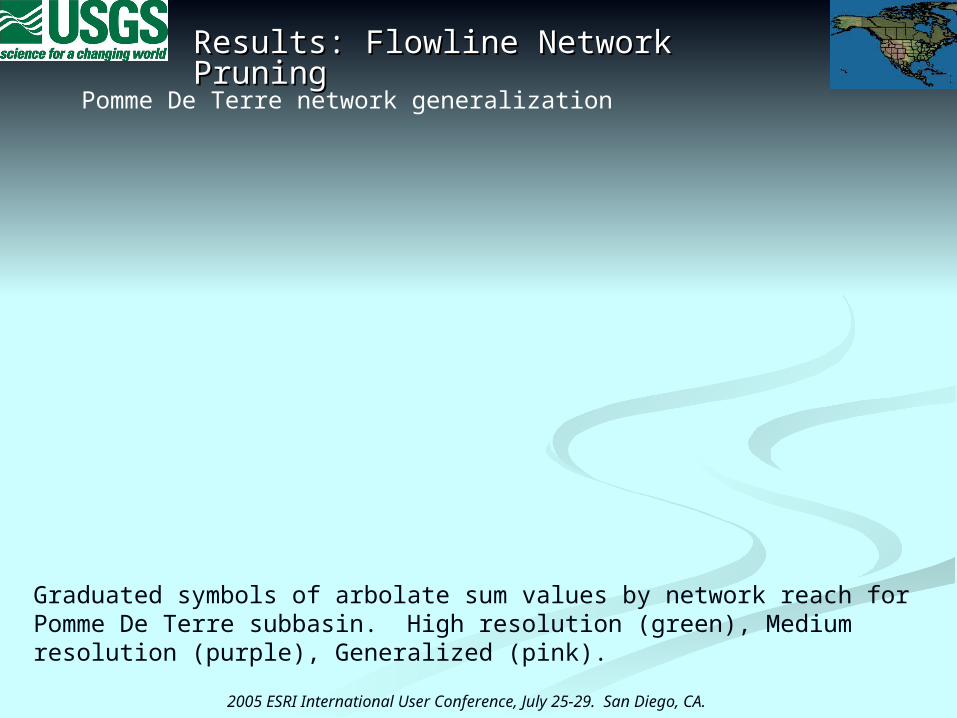
Results: Flowline Network PruningResults: Flowline Network Pruning
2005 ESRI International User Conference, July 25-29. San Diego, CA.
Pomme De Terre network generalization
Graduated symbols of arbolate sum values by network reach for Pomme De Terre subbasin. High resolution (green), Medium resolution (purple), Generalized (pink).
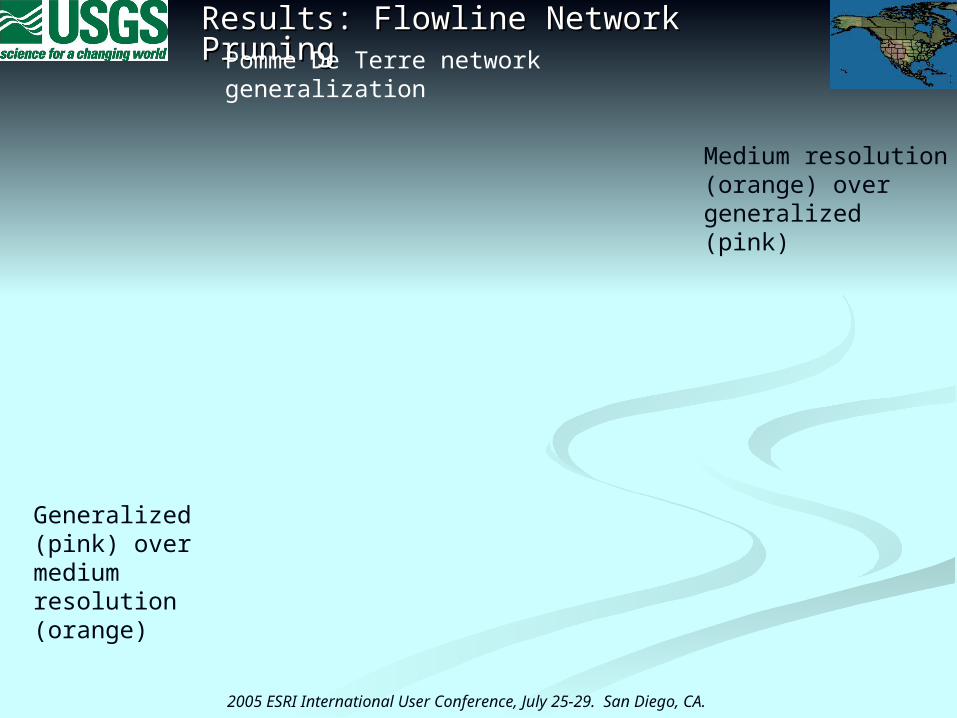
Results: Flowline Network PruningResults: Flowline Network Pruning
2005 ESRI International User Conference, July 25-29. San Diego, CA.
Pomme De Terre network generalization
Medium resolution (orange) over generalized (pink)
Generalized (pink) over medium resolution (orange)
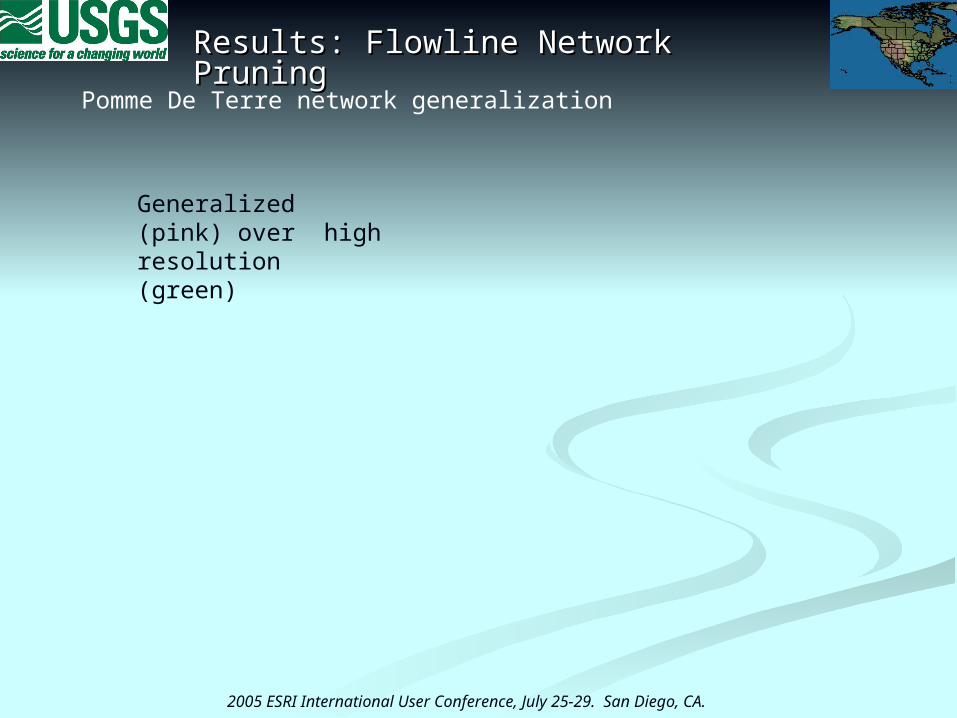
Results: Flowline Network PruningResults: Flowline Network Pruning
2005 ESRI International User Conference, July 25-29. San Diego, CA.
Pomme De Terre network generalization
Generalized (pink) over high resolution (green)
To summary
Results: Flowline Network PruningResults: Flowline Network Pruning
2005 ESRI International User Conference, July 25-29. San Diego, CA.
Pomme De Terre network generalization
0
50
100
150
200
250
300
350
400
450
500
0 5 10 15 20
Catchment Drainage Density (km/sq km)
Fre
qu
en
cy
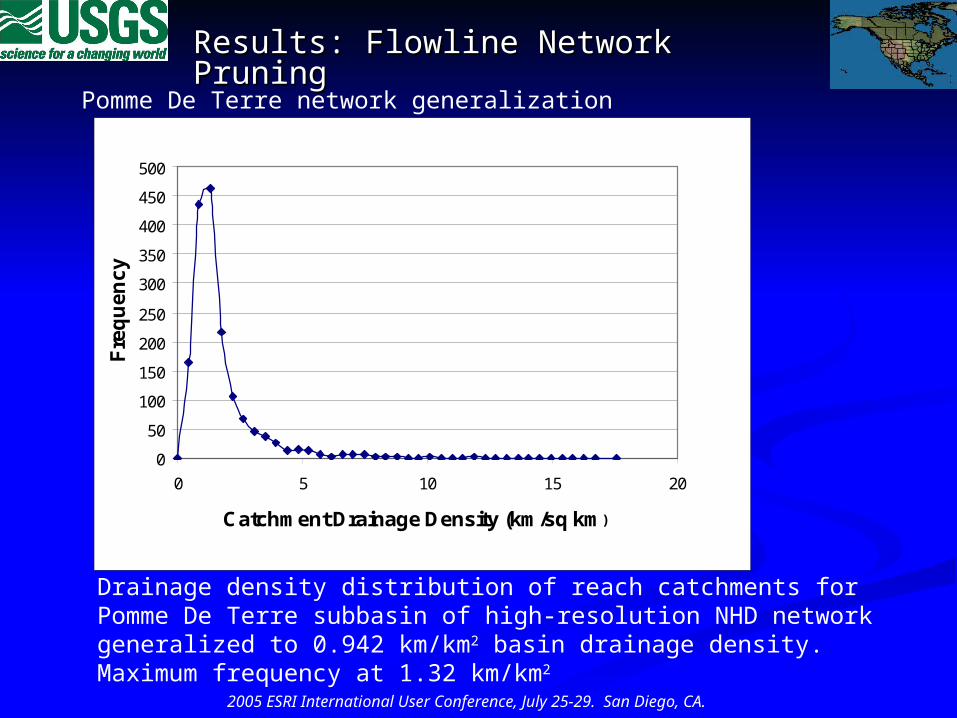
Drainage density distribution of reach catchments for Pomme De Terre subbasin of high-resolution NHD network generalized to 0.942 km/km2 basin drainage density. Maximum frequency at 1.32 km/km2
Results: Flowline Network PruningResults: Flowline Network Pruning
2005 ESRI International User Conference, July 25-29. San Diego, CA.
Pomme De Terre network generalization
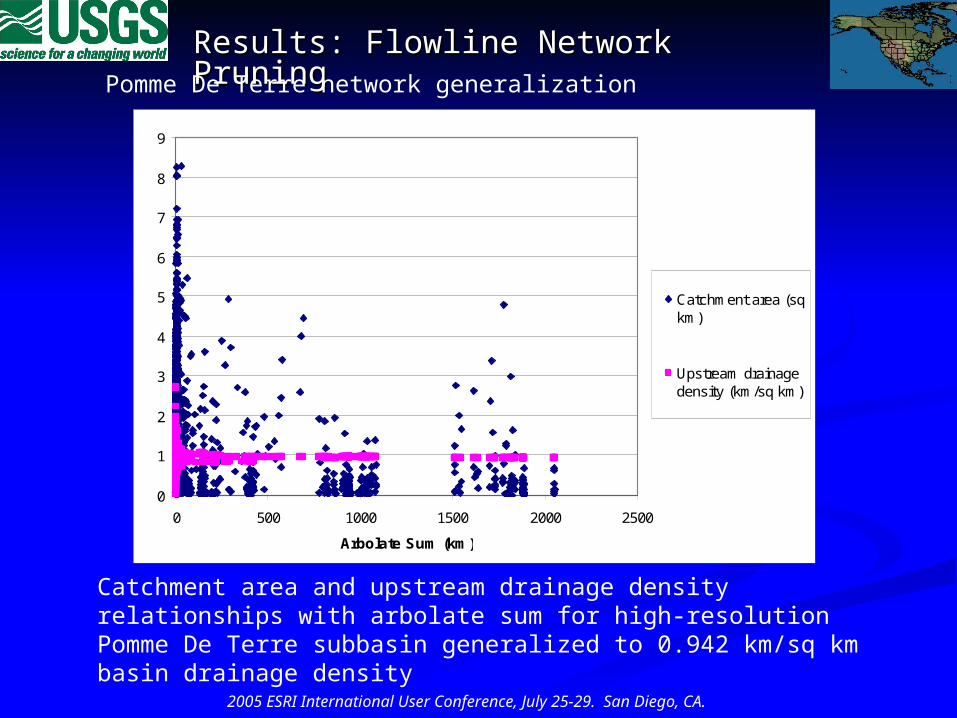
Catchment area and upstream drainage density relationships with arbolate sum for high-resolution Pomme De Terre subbasin generalized to 0.942 km/sq km basin drainage density
0
1
2
3
4
5
6
7
8
9
0 500 1000 1500 2000 2500
Arbolate Sum (km)
Catchment area (sqkm)
Upstream drainagedensity (km/sq km)
Results: Flowline Network PruningResults: Flowline Network Pruning
2005 ESRI International User Conference, July 25-29. San Diego, CA.
Pomme De Terre network generalization
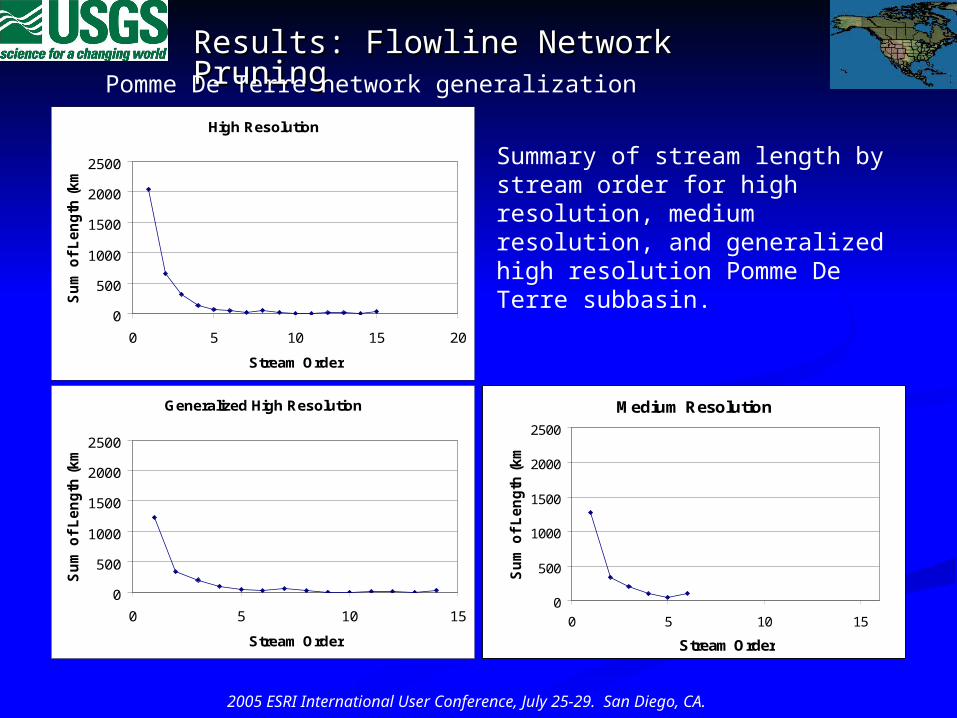
Summary of stream length by stream order for high resolution, medium resolution, and generalized high resolution Pomme De Terre subbasin.
Medium Resolution
0
500
1000
1500
2000
2500
0 5 10 15
Stream Order
Su
m o
f L
en
gth
(k
m)
Generalized High Resolution
0
500
1000
1500
2000
2500
0 5 10 15
Stream Order
Su
m o
f L
en
gth
(k
m)
High Resolution
0
500
1000
1500
2000
2500
0 5 10 15 20
Stream Order
Su
m o
f L
en
gth
(k
m)
Results: Flowline Network PruningResults: Flowline Network Pruning
2005 ESRI International User Conference, July 25-29. San Diego, CA.
Pomme De Terre network generalization
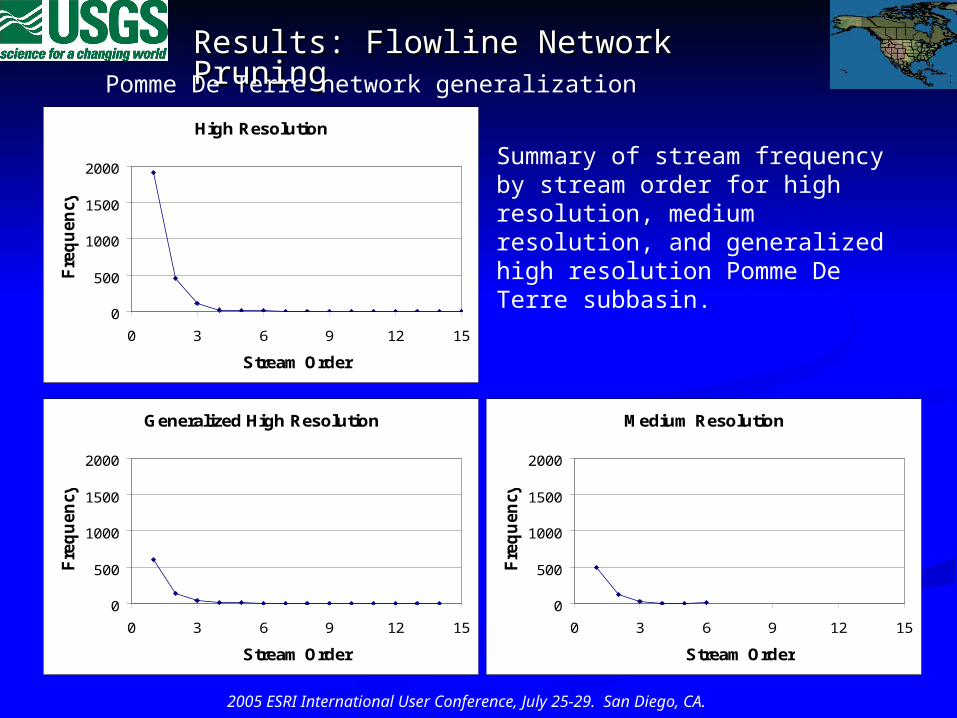
Summary of stream frequency by stream order for high resolution, medium resolution, and generalized high resolution Pomme De Terre subbasin.
High Resolution
0
500
1000
1500
2000
0 3 6 9 12 15
Stream Order
Fre
qu
en
cy
Generalized High Resolution
0
500
1000
1500
2000
0 3 6 9 12 15
Stream Order
Fre
qu
en
cy
Medium Resolution
0
500
1000
1500
2000
0 3 6 9 12 15
Stream Order
Fre
qu
en
cy
SummarySummary
2005 ESRI International User Conference, July 25-29. San Diego, CA.
Identified and automated computations for quantities that characterize an NHD flowline network.
Reach and basin statistics, along with visual inspections assist analysis and comparison of the network drainage.
Identified a linear relationship to estimate watershed drainage density of elevation-derived streams from the minimum upstream drainage area for stream formation.
Identifed a linear relationship to estimate drainage density appropriate for a user-specified map scales, to be used for network pruning.
Developed and tested a network pruning strategy that provides a user-specified network drainage density based on upstream drainage area, which also maintains reaches and network connectivity.
Network pruning process furnishes a network that is structurally similar to a target dataset. However, when compared to the target dataset, a larger number of shorter, confluence-to-confluence segments and reaches were maintained in the generalized network because that was a pre-existing condition of the source dataset.
SummarySummary
2005 ESRI International User Conference, July 25-29. San Diego, CA.
Upstream drainage area quickly rises to overwhelming sizes. We may need to implement a numeric scaling technique to the pruning strategy.
Additional work is required to tailor the pruning strategy to be affected by terrain or topographic variations.
Next steps in developing an automated generalization include defining a pruning strategy for area features and rules for feature simplification, and also implementing a line simplification process.
Aside from enhancing our understanding of the relationship between terrain and surface hydrography, it is possible that similar automated pruning strategies can be developed for other vector layers of The National Map.
ReferencesReferences
2005 ESRI International User Conference, July 25-29. San Diego, CA.
Gold, C. M. and D. Thibault. 2001. Map Generalization by Skeleton Retraction, In Proceedings, International Cartographic Association, Beijing,China, pp.2072-2081.
Horn, R.C., L. McKay, and, S.A. Hanson. 1994. " History of the U.S. EPA's River Reach File: A National Hydrographic Database Available for ArcInfo Applications ," in Proceedings of the Fourteenth Annual ESRI User Conference, Environmental Systems Research Institute, Redlands, CA.
Horton, R.E. 1945. Erosional development of streams and their drainage basins: Hydrophysical approach to quantitative morphology. Geological Society of America Bulletin, 56, 275-370.
Maidment, D. R. 1996. GIS and hydrologic modeling – an assessment of progress. Third International Conference on GIS and Environmental Modeling. January 22-26, 1996. Sante Fe, New Mexico.
Northcott, W. 2002. Lecture notes to Biosystems Engineering 481: Agricultural and Small Watershed Hydrology. College of Engineering, Michigan State University.
Pidwirny, M. 2004. Stream Morphometry. Accessed June 9, 2005, at URL: http://www.physicalgeography.net/fundamentals/10ab.html
Sanchez, R.R. 2002. GIS-Based Upland Erosion Modeling, Geovisualization, and Grid Size Effects on Erosion Simulations with CASC2D-SED. Ph.D. Dissertation, Civil Engineering Dept., Colorado State University.
ReferencesReferences
2005 ESRI International User Conference, July 25-29. San Diego, CA.
Smith, P.N.H, and D.R. Maidment. 1995. Hydrologic Data Development System. Report 95-1 Center for Research in Water Resources. University of Texas at Austin.
Tarbotom, D. G. and D.P. Ames. 2001. Advances in the mapping of flow networks from digital elevation data. World Water and Environmental Resources Congress, May 20-24,2001, Orlando, Florida.
U.S. Geological Survey. 2005. National Elevation Dataset. Accessed June 7, 2005, at URL: http://ned.usgs.gov/.
U.S. Geological Survey. 2004. Physiographic divisions of conterminous U.S. Accessed June 14, 2005, at URL: http://aa179.cr.usgs.gov/metadata/wrdmeta/physio.htm.
U.S. Geological Survey. 2003. Streams and Waterbodies of the United States. Accessed June 14, 2005, at URL: http://nationalatlas.gov/atlasftp.html.
U.S. Geological Survey. 2000. The National Hydrography Dataset: Concepts and Contents. Accessed June 8, 2005, at URL http://nhd.usgs.gov/chapter1/index.html.
U.S. Geological Survey. 1955. Map Publication Scales. Book 1, Part B, Chapter 1 of the Geological Survey Topographic Instructions. March 1955. 13pp.
Verdin, K. L. 1997. A system for topologically coding global drainage basins and stream networks. 1997 ESRI International GIS User Conference Proceedings.
Questions?Questions?
Generalization for Generalization for The National Map The National Map wwith emphasis onith emphasis onthe National Hydrography Datasetthe National Hydrography Dataset
Lawrence Stanislawski, Lawrence Stanislawski, [email protected]@usgs.govMichael Starbuck, U.S. Geological SurveyMichael Starbuck, U.S. Geological SurveyMichael Finn, U.S. Geological SurveyMichael Finn, U.S. Geological SurveyE. Lynn Usery, U.S. Geological SurveyE. Lynn Usery, U.S. Geological SurveyPat Turley, U.S. Geological SurveyPat Turley, U.S. Geological SurveyJosh Wilkerson, U.S. Geological SurveyJosh Wilkerson, U.S. Geological Survey
2005 ESRI International User Conference, July 25-29. San Diego, CA.
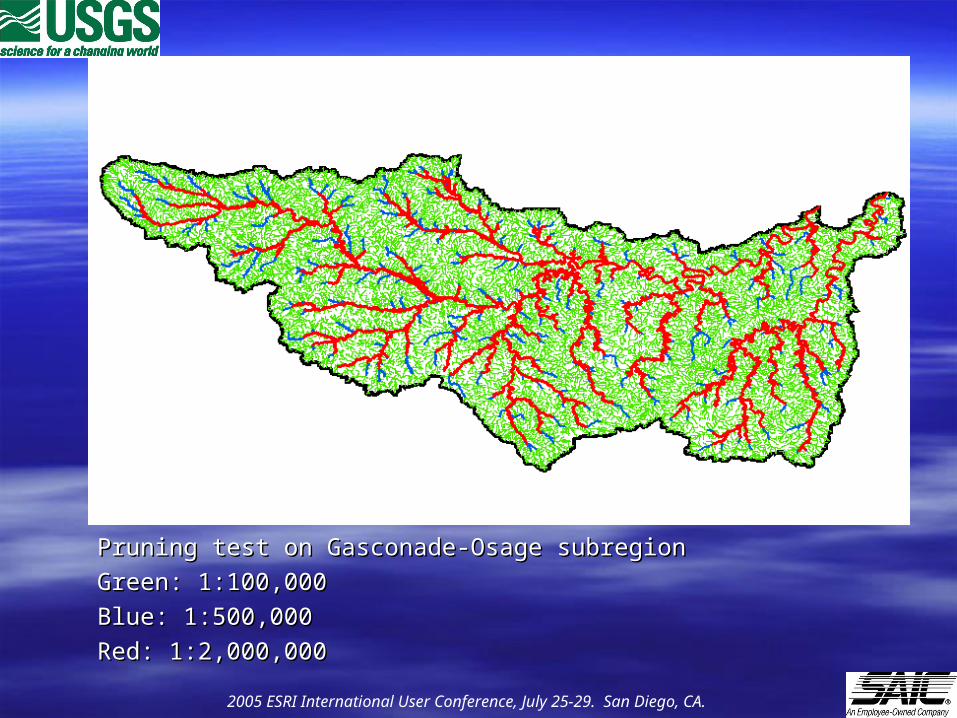
Pruning test on Gasconade-Osage subregionPruning test on Gasconade-Osage subregion
Green: 1:100,000Green: 1:100,000
Blue: 1:500,000Blue: 1:500,000
Red: 1:2,000,000Red: 1:2,000,000
2005 ESRI International User Conference, July 25-29. San Diego, CA.
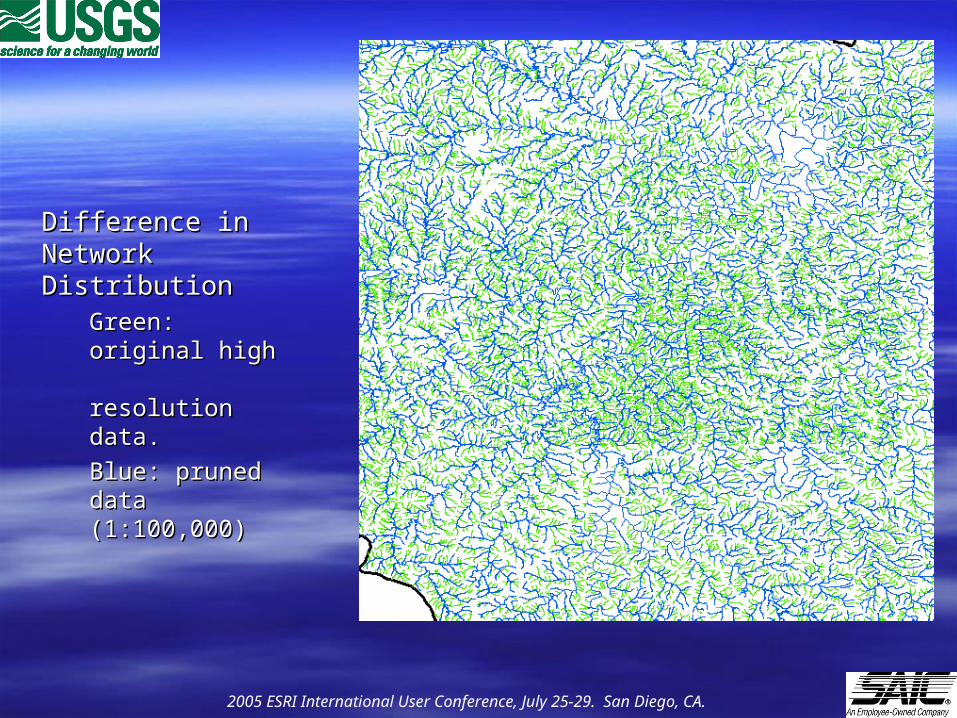
Difference in Network Difference in Network DistributionDistribution
Green: original high Green: original high resolution resolution
data.data.
Blue: pruned data Blue: pruned data
(1:100,000)(1:100,000)
2005 ESRI International User Conference, July 25-29. San Diego, CA.
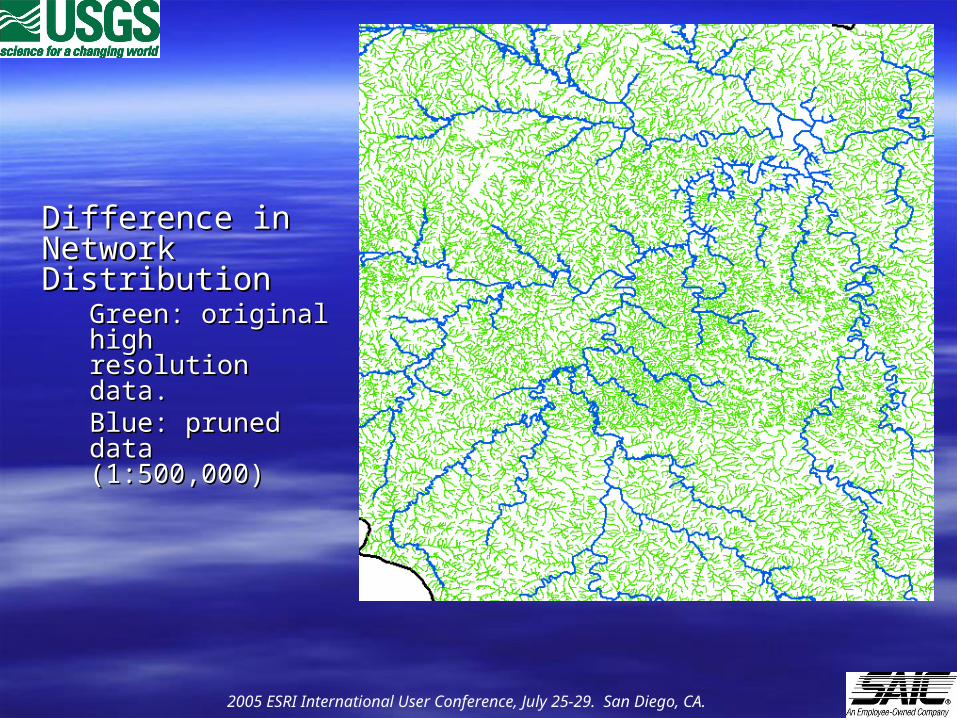
Difference in Difference in Network DistributionNetwork Distribution
Green: original high Green: original high resolution resolution
data.data.Blue: pruned data Blue: pruned data
(1:500,000) (1:500,000)
2005 ESRI International User Conference, July 25-29. San Diego, CA.
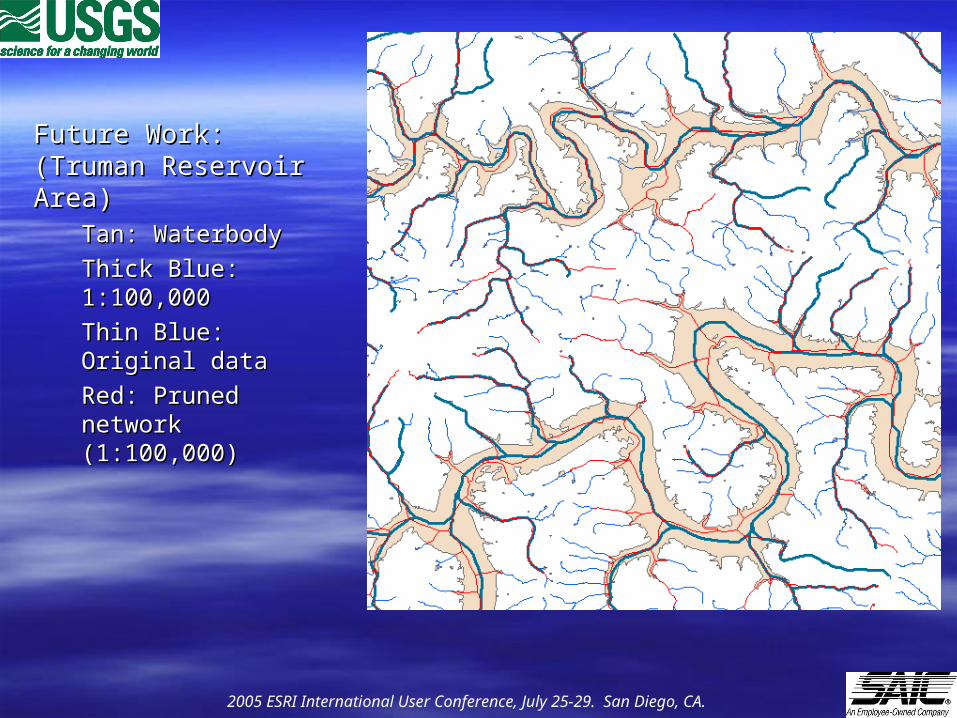
Future Work: (Truman Future Work: (Truman Reservoir Area)Reservoir Area)
Tan: WaterbodyTan: Waterbody
Thick Blue: 1:100,000Thick Blue: 1:100,000
Thin Blue: Original dataThin Blue: Original data
Red: Pruned network Red: Pruned network (1:100,000)(1:100,000)
2005 ESRI International User Conference, July 25-29. San Diego, CA.