Embed Size (px)
Citation preview
VOLUME I
INTRODUCTION TO THE EMISSIONINVENTORY IMPROVEMENTPROGRAM
July 1997
Prepared by:Eastern Research Group, Inc.Post Office Box 2010Morrisville, North Carolina 27560
Prepared for:Steering CommitteeEmission Inventory Improvement Program
DISCLAIMER
As the Environmental Protection Agency has indicated in Emission Inventory ImprovementProgram (EIIP) documents, the choice of methods to be used to estimate emissions depends onhow the estimates will be used and the degree of accuracy required. Methods using site-specificdata are preferred over other methods. These documents are non-binding guidance and not rules. EPA, the States, and others retain the discretion to employ or to require other approaches thatmeet the requirements of the applicable statutory or regulatory requirements in individualcircumstances.

iiiEIIP Volume I
ACKNOWLEDGEMENT
This document was prepared by Joe Mangino of Eastern Research Group, Inc., for the Steering Committee, Emission Inventory Improvement Program, and for Steve Bromberg of the EmissionFactor and Inventory Group, U.S. Environmental Protection Agency.

INTRODUCTION TO EIIP 6/27/97
iv EIIP Volume I
This page is intentionally left blank.

vEIIP Volume I
CONTENTSSection Page
1 Introduction to the Emission Inventory Improvement Program . . . . . . . . . . . . . . . . 1.1-1
1.1 Importance of Emission Inventories . . . . . . . . . . . . . . . . . . . . . . . . . . . . . . 1.1-3
1.2 EIIP Committees . . . . . . . . . . . . . . . . . . . . . . . . . . . . . . . . . . . . . . . . . . . . 1.1-51.2.1 Point Sources Committee . . . . . . . . . . . . . . . . . . . . . . . . . . . . . . . . . 1.1-51.2.2 Area Sources Committee . . . . . . . . . . . . . . . . . . . . . . . . . . . . . . . . . 1.1-61.2.3 Mobile Sources Committee . . . . . . . . . . . . . . . . . . . . . . . . . . . . . . . . 1.1-71.2.4 Biogenic Sources Committee . . . . . . . . . . . . . . . . . . . . . . . . . . . . . . 1.1-71.2.5 Quality Assurance Committee . . . . . . . . . . . . . . . . . . . . . . . . . . . . . . 1.1-81.2.6 Data Management Committee . . . . . . . . . . . . . . . . . . . . . . . . . . . . . . 1.1-81.2.7 Governmental Interactions Committee . . . . . . . . . . . . . . . . . . . . . . . . 1.1-9
1.3 EIIP Committee Products . . . . . . . . . . . . . . . . . . . . . . . . . . . . . . . . . . . . . . 1.1-9
1.4 Organization of Volume I . . . . . . . . . . . . . . . . . . . . . . . . . . . . . . . . . . . . . 1.1-11
2 Implementation of EIIP Guidance . . . . . . . . . . . . . . . . . . . . . . . . . . . . . . . . . . . . . 1.2-1
2.1 Purpose of EIIP Guidance . . . . . . . . . . . . . . . . . . . . . . . . . . . . . . . . . . . . . 1.2-1
2.2 Scope and General Content of Documents . . . . . . . . . . . . . . . . . . . . . . . . . 1.2-4
2.3 Approach for Selecting Methods . . . . . . . . . . . . . . . . . . . . . . . . . . . . . . . . 1.2-62.3.1 Rationale for EIIP’s Selection of Methods . . . . . . . . . . . . . . . . . . . . 1.2-62.3.2 Rationale for User’s Selection of Methods . . . . . . . . . . . . . . . . . . . . 1.2-6
3 Training of Inventory Staff . . . . . . . . . . . . . . . . . . . . . . . . . . . . . . . . . . . . . . . . . . 1.3-1
3.1 Topics for Training . . . . . . . . . . . . . . . . . . . . . . . . . . . . . . . . . . . . . . . . . . . 1.3-1
3.2 Training Resources . . . . . . . . . . . . . . . . . . . . . . . . . . . . . . . . . . . . . . . . . . . 1.3-2
4 Inventory Planning . . . . . . . . . . . . . . . . . . . . . . . . . . . . . . . . . . . . . . . . . . . . . . . . . 1.4-1
4.1 Identification of Inventory Uses . . . . . . . . . . . . . . . . . . . . . . . . . . . . . . . . . 1.4-1
4.2 Preliminary Planning Activities . . . . . . . . . . . . . . . . . . . . . . . . . . . . . . . . . 1.4-6
CONTENTS (CONTINUED) Section Page
vi EIIP Volume I
4.2.1 Scope of Inventory . . . . . . . . . . . . . . . . . . . . . . . . . . . . . . . . . . . . . . 1.4-64.2.2 Staff and Resource Considerations . . . . . . . . . . . . . . . . . . . . . . . . . . 1.4-74.2.3 Interagency Communication . . . . . . . . . . . . . . . . . . . . . . . . . . . . . . . 1.4-7
4.3 Inventory Work Plan . . . . . . . . . . . . . . . . . . . . . . . . . . . . . . . . . . . . . . . . . 1.4-94.3.1 Source Category Coverage . . . . . . . . . . . . . . . . . . . . . . . . . . . . . . . . 1.4-114.3.2 Selection of Emission Estimation Methods . . . . . . . . . . . . . . . . . . . . 1.4-124.3.3 Data Management and Reporting . . . . . . . . . . . . . . . . . . . . . . . . . . . 1.4-14
4.4 Quality Assurance Plan . . . . . . . . . . . . . . . . . . . . . . . . . . . . . . . . . . . . . . . . 1.4-15
5 Inventory Development . . . . . . . . . . . . . . . . . . . . . . . . . . . . . . . . . . . . . . . . . . . . . 1.5-1
5.1 Data Collection . . . . . . . . . . . . . . . . . . . . . . . . . . . . . . . . . . . . . . . . . . . . . 1.5-1
5.2 Data Handling . . . . . . . . . . . . . . . . . . . . . . . . . . . . . . . . . . . . . . . . . . . . . . 1.5-3
5.3 Emission Calculations . . . . . . . . . . . . . . . . . . . . . . . . . . . . . . . . . . . . . . . . . 1.5-45.3.1 Source Test Data . . . . . . . . . . . . . . . . . . . . . . . . . . . . . . . . . . . . . . . 1.5-55.3.2 Material Balance . . . . . . . . . . . . . . . . . . . . . . . . . . . . . . . . . . . . . . . . 1.5-55.3.3 Emission Factors . . . . . . . . . . . . . . . . . . . . . . . . . . . . . . . . . . . . . . . 1.5-6
5.4 Emissions Calculation Tools . . . . . . . . . . . . . . . . . . . . . . . . . . . . . . . . . . . . 1.5-75.4.1 Factor Information Retrieval System . . . . . . . . . . . . . . . . . . . . . . . . . 1.5-75.4.2 CHEMDAT8 . . . . . . . . . . . . . . . . . . . . . . . . . . . . . . . . . . . . . . . . . . 1.5-85.4.3 WATER8 . . . . . . . . . . . . . . . . . . . . . . . . . . . . . . . . . . . . . . . . . . . . . 1.5-95.4.4 Landfill Air Emissions Estimation Model . . . . . . . . . . . . . . . . . . . . . 1.5-95.4.5 TANKS . . . . . . . . . . . . . . . . . . . . . . . . . . . . . . . . . . . . . . . . . . . . . . 1.5-95.4-6 MOBILE5a . . . . . . . . . . . . . . . . . . . . . . . . . . . . . . . . . . . . . . . . . . 1.5-10
6 Documentation and Reporting . . . . . . . . . . . . . . . . . . . . . . . . . . . . . . . . . . . . . . . . 1.6-1
6.1 Documentation . . . . . . . . . . . . . . . . . . . . . . . . . . . . . . . . . . . . . . . . . . . . . . 1.6-1
6.2 Examples of Standardized Reporting Format . . . . . . . . . . . . . . . . . . . . . . . 1.6-3
6.3 Electronic Reporting of Data . . . . . . . . . . . . . . . . . . . . . . . . . . . . . . . . . . . 1.6-8
CONTENTS (CONTINUED) Section Page
viiEIIP Volume I
7 References . . . . . . . . . . . . . . . . . . . . . . . . . . . . . . . . . . . . . . . . . . . . . . . . . . . . . . . 1.7-1
8 Glossary . . . . . . . . . . . . . . . . . . . . . . . . . . . . . . . . . . . . . . . . . . . . . . . . . . . . . . . . . 1.8-1
8.1 Point Sources . . . . . . . . . . . . . . . . . . . . . . . . . . . . . . . . . . . . . . . . . . . . . . . 1.8-1
8.2 Area Sources . . . . . . . . . . . . . . . . . . . . . . . . . . . . . . . . . . . . . . . . . . . . . . . 1.8-9
8.3 Mobile Sources . . . . . . . . . . . . . . . . . . . . . . . . . . . . . . . . . . . . . . . . . . . . 1.8-12
8.4 Biogenic Sources . . . . . . . . . . . . . . . . . . . . . . . . . . . . . . . . . . . . . . . . . . . 1.8-14
8.5 Quality Assurance . . . . . . . . . . . . . . . . . . . . . . . . . . . . . . . . . . . . . . . . . . . 1.8-16
Appendix A: EIIP Committee Member List

viii EIIP Volume I
FIGURES AND TABLESFigures Page
1.1-1 Steps for Implementing the EIIP . . . . . . . . . . . . . . . . . . . . . . . . . . . . . . . . . . . . . . 1.1-2
1.1-2 EIIP Documents . . . . . . . . . . . . . . . . . . . . . . . . . . . . . . . . . . . . . . . . . . . . . . . . . . 1.1-4
1.1-3 Data Transfer Using the EIIP Data Model . . . . . . . . . . . . . . . . . . . . . . . . . . . . . . 1.1-10
1.2-1 Emission Inventory Process . . . . . . . . . . . . . . . . . . . . . . . . . . . . . . . . . . . . . . . . . . 1.2-3
1.4-1 Overview of Inventory Planning and Preparation . . . . . . . . . . . . . . . . . . . . . . . . . . 1.4-2
1.4-2 Interactions in Inventory Development . . . . . . . . . . . . . . . . . . . . . . . . . . . . . . . . . . 1.4-8
1.4-3 Process for Selecting Emission Estimation Methods . . . . . . . . . . . . . . . . . . . . . . . 1.4-13
1.5-1 Example of Inventory Development . . . . . . . . . . . . . . . . . . . . . . . . . . . . . . . . . . . . 1.5-2
Tables Page
1.3-1 Examples of Air Pollution Training Institute Courses . . . . . . . . . . . . . . . . . . . . . . . 1.3-3
1.3-2 Examples of A&WMA Training Courses . . . . . . . . . . . . . . . . . . . . . . . . . . . . . . . . 1.3-3
1.4-1 Examples of Inventory Levels . . . . . . . . . . . . . . . . . . . . . . . . . . . . . . . . . . . . . . . . 1.4-4
1.6-1 IPCC Summary Report for National Greenhouse Gas Inventories . . . . . . . . . . . . . . 1.6-4
1.6-2 IPCC Overview Table for National Greenhouse Gas Inventories . . . . . . . . . . . . . . 1.6-5
1.6-3 Tier 1 and Tier 2 Source Categories . . . . . . . . . . . . . . . . . . . . . . . . . . . . . . . . . . . . 1.6-6

6/27/97 INTRODUCTION TO EIIP
ixEIIP Volume I
This page is intentionally left blank.
1.1-1EIIP Volume I
1
INTRODUCTION TO THE EMISSIONINVENTORY IMPROVEMENT PROGRAMThe Emission Inventory Improvement Program (EIIP) was established in 1993 to promote thedevelopment and use of standard procedures for collecting, calculating, storing, reporting, andsharing air emissions data. The EIIP is designed to promote the development of emissioninventories that have targeted quality objectives, are cost-effective, and contain reliable andaccessible data for end users. To this end, the EIIP is developing inventory guidance andmaterials which will be available to states and local agencies, the regulated community, the public,and the EPA. The materials prepared under EIIP will:
Establish standardized procedures for the preparation of emission inventories bypresenting preferred and alternative methods for emissions estimation;
Promote consistency within inventories among reporting agencies/groups;
Document consistent quality assurance (QA)/quality control (QC) methodsapplicable to all inventory programs;
Provide guidance to improve the current system of data collection and reporting;and
Specify a standard data model and data transfer format to facilitate sharing of dataamong agencies.
These guidance materials are being developed for point, area, mobile, and biogenic sourcestypically included in air emissions inventories.
The EIIP is a joint program of the State and Territorial Air Pollution Program Administrators andthe Association of Local Air Pollution Control Officials (STAPPA/ALAPCO) and the U.S.Environmental Protection Agency (EPA). Both of these organizations are represented in theStanding Air Emissions Work Group (SAEWG), which endorsed the original EIIP plan. Figure 1.1-1 shows the steps in the implementation of the EIIP. While the EPA coordinates theEIIP efforts, all of the tasks are performed by working committees made up of state and local

SAEWG ApprovesEIIP
EIIP Presented ToSTAPPA/ALAPCO
STAPPA/ALAPCOApproves EIIP
Steering Committeeis Formed
EPA & State/Local AgenciesCommit Resources
EIIP Committees are Formed
EPA/State/LocalInteractionsQA/QC Data
Management
CompileEmission InventoryGuidance Manuals
Pilot Test Program
Protocol Revisions
Agency Training
User Feedback
BiogenicAreaPoint Mobile
INTRODUCTION TO EIIP 6/27/97
1.1-2 EIIP Volume I
FIGURE 1.1-1. STEPS FOR IMPLEMENTING THE EIIP
6/27/97 INTRODUCTION TO EIIP
1.1-3EIIP Volume I
agency personnel, EPA and industry. The following working committees have been formed:
Steering Committee;
Point Sources Committee;
Area Sources Committee:
Mobile Sources Committee;
Biogenics Sources Committee;
Quality Assurance Committee;
Data Management Committee; and
Governmental Interactions Committee.
The committees oversee and direct the development of procedural manuals, pilot studies, and allother activities associated with their particular facet of the inventory. The specific roles andactivities of each of the committees are described in detail in Section 1.2 of this volume.
A significant portion of the guidance material produced thus far appears in a series of EIIPdocuments that are specific to each of the working committees. Figure 1.1-2 shows the volumetitles in the initial series of EIIP documents. The methods used in developing the guidance, theapproach taken, and the work products (in addition to the core guidance) have evolved with slightvariations as each committee addresses the issues unique to their particular segment of theinventory. The scope and content of the EIIP guidance documents are summarized in Section 2.2of this volume.
1.1 IMPORTANCE OF EMISSION INVENTORIES
An air emissions inventory can range from a simple summary of estimated emissions compiledfrom previously-published emissions data to a comprehensive inventory of a facility using specificsource test data that will be used to support compliance activities. Just as there are different typesof emissions inventories, their usage is varied and continually expanding. Because of this wideuse of inventory data, the EIIP will benefit not only state and local air pollution agencies, butindustry and EPA as well.

INTRODUCTION TO EIIP 6/27/97
1.1-4 EIIP Volume I
FIGURE 1.1-2. EIIP DOCUMENTS
6/27/97 INTRODUCTION TO EIIP
1.1-5EIIP Volume I
The applications for emissions inventory data include use of the data in annual trends reports,State Implementation Plans (SIPs), compliance demonstrations, emissions trading, emissions feesprograms, and in modeling activities designed to evaluate ambient air concentrations encounteredby the general public. For the SIP program, the air emission inventory is a fundamental buildingblock in developing an air quality control and maintenance strategy. Section 172, Part C, of theClean Air Act (CAA) as amended in 1990, which addresses SIP requirements, states that “. . .plan provisions shall include a comprehensive, accurate, current inventory of actual emissionsfrom all sources or the relevant pollutants or pollutants in such area . . .” Regulatory agencies andindustrial facilities rely on emission inventories on an ongoing basis as indicators of air qualitychanges and for setting permit requirements.
Air emission inventories may also be developed for research purposes. For example, concernover the prospect of global warming has prompted the development of regional, national, andglobal inventories of greenhouse gases. At a smaller scale, pilot studies or field tests of newcontrol techniques or devices may require preparation of emission estimates from a single sourceto measure effectiveness of the technique.
The importance placed on emission inventories requires that they be of the highest qualityobtainable considering their end use. Since they are the foundation of many air quality decisions,inventory quality is critical to defining realistic regulations and attainment strategies. Deficienciesand inconsistencies in existing compilation processes accentuate the need for developing andimplementing more uniform and systematic approaches to collecting and reporting data. One ofthe primary goals of the EIIP is to improve the quality of inventory data so that it is a reliablesource of information for sound decision making.
1.2 EIIP COMMITTEES
Following is a brief description of each of the EIIP committees’ goals, and current and plannedactivities. While sharing the same overall goals of the EIIP to improve the quality of emissioninventories, each committee is unique in the issues affecting its particular sources and theapproaches used to address those issues. Each committee is chaired by one state/local agencyrepresentative and an EPA representative and is composed of state/local agency, industry, andEPA representatives.
1.2.1 POINT SOURCES COMMITTEE
The Point Sources Committee (PSC) was formed to develop a series of guidance documentsintended to familiarize the private and government sectors with the basic concepts and proceduresinvolved in estimating air pollutant emissions from industrial processes as well as to provideinstructional guidance on preferred methods for developing emission inventories. Cumulatively,
INTRODUCTION TO EIIP 6/27/97
1.1-6 EIIP Volume I
the series of documents will provide a comprehensive set of manuals which will serve the user ingenerating a point source emissions inventory.
The PSC seeks participation from several different arenas. The committee works closely with theEIIP Area Sources Committee to develop guidance manuals on processes common to both typesof inventories, such as surface coating operations. Through information gathering efforts, stateagency workers have been introduced to the EIIP and have joined the working committee, servingin various roles (some as technical reviewers, some as authors, some as technical advisors). ThePSC has also worked closely with industry and trade associations on document developmentefforts. Specifically, the National Asphalt Pavement Association and the National Paint andCoatings Association (NPCA) have actively participated in document development. PSCmembers have toured facility sites with members of these industry groups to better understandtheir overall activities.
PSC members have attended meetings of the NPCA and the American Electronics Association torequest their assistance through “partnering” in developing guidance documents for the industries. During national meetings of the Air and Waste Management Association (A&WMA), the PSChas surveyed attendees for suggestions and rationale for selecting source categories for guidancedocument development. A database with results of these two surveys is maintained by thecommittee.
PSC members also spoke with personnel at state air pollution control agencies across the UnitedStates and acquired emissions estimation guidance information pertinent to the industries withintheir states. The information was reviewed and, where applicable, emission estimation approacheswere standardized for presentation in the guidance documents. The committee is also activelyinvolved in the development of the EIIP data transfer model (see Section 1.2.6 for moreinformation), which will be used as a mechanism for transferring inventory data to other userformats.
1.2.2 AREA SOURCES COMMITTEE
The primary goal of the Area Sources Committee (ASC) has been to develop improved methodsguidance for area source inventories. Other objectives include:
• Achieve consistency among inventories;
• Provide flexibility in inventory development at the preparing agency level;
• Identify new and innovative methods;
• Support planning and QA/QC in inventory development.

6/27/97 INTRODUCTION TO EIIP
1.1-7EIIP Volume I
To achieve this goal, the committee surveyed the inventory community to find out which sourcecategories were seen as high priority for methods improvement chapters in the ASC EIIPguidance document. Each chapter in Volume III is written to discuss the unique aspects of thesource category. One of the main issues encountered by the ASC in developing their documentwas the selection of preferred methods versus alternative methods for presentation in each of thechapters (see Section 2.3.1 for further discussion on the selection of “preferred” vs. “alternative”methods).
1.2.3 MOBILE SOURCES COMMITTEE
The main focus of the Mobile Sources Committee (MSC) is to provide specific guidance on howstate and local agencies could better take advantage of potential locality-specific data sources and,at the same time, retain a known level of quality and completeness in their inventory. Currently,the committee has concentrated its efforts on onroad mobile sources, specifically on providinglocality-specific inputs for the EPA’s MOBILE and California’s EMFAC emission factor models. Also included in the mobile sources document is the development of locality-specific inputs fromtransportation demand models and the use of local data for making vehicle miles traveled (VMT)projections. The specific guidance developed by the MSC is to be used in conjunction withEPA’s existing guidance on procedures for estimating emissions from mobile sources (EPA,1992a) . Future efforts of the MSC include a top-down evaluation of the MOBILE model andattention to nonroad mobile source issues.
1.2.4 BIOGENIC SOURCES COMMITTEE
The Biogenic Sources Committee (BSC) is composed of members from the EPA, states/localagencies, and academic institutions. The specific objective of the work of the BSC has been todevelop consistent emission inventory preparation guidance for emissions of volatile organiccompounds (VOC) and nitrogen oxides (NO ) from biogenic sources such as forests, agriculturalx
crops and soils, lightning, and natural gas and oil seeps.
The BSC’s primary work product is a final document of preferred and alternative methods, muchlike the point and area source volumes. However, the bulk of Volume V focuses on the use ofBiogenic Emission Inventory System (BEIS)-2 (and similar computer models) for estimatingemissions from vegetation, and addresses the needs of inventory preparers and modelers whowant to develop biogenic emission estimates using these models.
1.2.5 QUALITY ASSURANCE COMMITTEE
The Quality Assurance Committee (QAC) was formed to develop: (1) a plan for the EIIP’s QAprogram; (2) a comprehensive QA source document of methodologies and tools to use in

INTRODUCTION TO EIIP 6/27/97
1.1-8 EIIP Volume I
developing emission inventories; and (3) an emission inventory quality rating system. The QAC’sobjectives have been achieved though a variety of activities including the development of theEIIP’s Quality Assurance Procedures document (Volume VI), the adaptation of the DataAttribute Rating System (DARS) for state inventories, and by providing review and assistance onQA/QC to the other committees.
The QAC reviewed existing EPA guidance (EPA, 1986; EPA, 1988; EPA, 1989; EPA, 1992b;EPA, 1994a), and felt that while it adequately addressed fundamental QA principles, inventorypreparers needed more concrete guidance that included tools and methods that could be used toimplement QA programs. Furthermore, the issue of uncertainty has become an increasinglyimportant topic for inventory developers and users; therefore, the QAC expanded the purpose ofemission inventory QA to include measures to document (qualitatively and quantitatively)uncertainty. The QA volume relies heavily on examples from actual inventories to demonstratethe use of alternative QA methods.
In addition to the QA volume, the EIIP QAC sponsored training in the use of DARS to evaluateemission inventories. Workshops were held in which states and local agency personalparticipated. The results were used to standardize the DARS, and to develop guidance materialsto assist state and local agencies in evaluating their inventories. The training materials developedfor those workshops are included in the QA volume. The QAC is currently sponsoring thedevelopment of the DARS software system.
1.2.6 DATA MANAGEMENT COMMITTEE
The primary goal of the Data Management Committee (DMC) is to develop and facilitate a dataexchange mechanism for the emission inventory community. The DMC is not producing adatabase system but, rather, a standard data transfer format and transfer procedure that isindependent of the databases from which the inventory data originates. Because of the manydifferent emission inventory data management systems that are used by preparing agencies,standardization of the inventory data elements, their meaning, and their relationships is necessaryto prepare the transfer/exchange protocol.
The DMC has developed a EIIP Phase I data model (hereafter referred to as the “Data Model”)with its initial effort focussed on the electronic exchange of data for baseline SIP inventories,attainment demonstration modeling, and air quality strategy development.

6/27/97 INTRODUCTION TO EIIP
NTIS, U.S. Department of Commerce, Springfield, VA 22161, telephone (800) 553-6847.a
For information on the different options available to retrieve documents from the TTNb
BBS, contact the TTN 2000 helpline at (919) 541-5384.
1.1-9EIIP Volume I
Figure 1.1-3 shows the flow of data using the Data Model. The data transfer format used in theData Model is based on the Electronic Data Interchange (EDI) X-12 Standard, which is anexisting and fully functional standard that is accepted by the EPA, other government sectors, andindustry. The DMC envisions future development of the Data Model so that it can be used forother purposes such as permitting, emission reduction credits, and emission cap and tradingprograms.
1.2.7 GOVERNMENTAL INTERACTIONS COMMITTEE
The Governmental Interactions Committee (GIC) examines the relationship between variousagencies and government bodies involved in the emission inventory process. The GIC prepared areport entitled Roles and Responsibilities of Government Agencies in the Development ofEmission Inventories (EPA, 1995). This report contains guidelines and flow charts which explainthe inventory process and generally define the roles and responsibilities of each participatinggroup. The discussion focuses primarily on the development of city/county scale inventories thatrequire some level of EPA review, such as ozone or carbon monoxide nonattainment area SIPinventories.
1.3 EIIP COMMITTEE PRODUCTS
The initial work products of the EIIP committees include this set of manuals (Volumes I throughVII), a version of the EIIP Data Model, and pilot studies and training using the EIIP version ofthe DARS. Hard copies of the manuals are available from the National Technical InformationService. Electronic copies of the EIIP documents can also be retrieved from the CHIEF Interneta
World Wide Web site (www.epa.gov/ttn/chief/).

UserA
UserB
DataTranslator
DataTranslator
DataTranslator
UserC
EIIPStandard
ExtractFile
ExtractFile
ExtractFile
INTRODUCTION TO EIIP 6/27/97
1.1-10 EIIP Volume I
FIGURE 1.1-3. DATA TRANSFER USING THE EIIP DATA MODEL

6/27/97 INTRODUCTION TO EIIP
1.1-11EIIP Volume I
1.4 ORGANIZATION OF VOLUME I
Section 2 of this document provides details on how to use the EIIP documents, particularly theusage of “preferred” and “alternative” emission estimation methods.
Section 3 of this volume discusses training considerations for staff who will be preparingemissions inventories, conducting QA checks, or working with the Data Model. Training is a keyinventory preparation exercise which directly affects the quality of the resulting emissionsinventory.
Inventory planning procedures are covered in Section 4. Planning is another critical step in theemissions inventory process which cannot be overlooked or trivialized. Careful planning isneeded to assure that inventory end-uses are identified and met, and that time schedules andresources (personnel and budget allocations) are established that will not compromise the qualityor comprehensiveness of the inventory.
Section 5 discusses inventory development steps in general terms so that inexperienced inventorypreparers can visualize the numerous steps that must be taken in preparing an emissionsinventory.
Reporting and documentation is discussed in Section 6 of this volume. Elements of a writtendocument, examples of standardized reporting formats, and the increasingly important need forthe electronic transfer of inventory data are covered in this section.
References cited in this volume are presented in Section 7. A glossary of terms commonly usedthroughout all the volumes in the EIIP series is presented in Section 8, with the terms grouped bythe subject of each volume (e.g., point sources, area sources). The exception is data management;because of the technical nature of the terms and symbols used in the data management volume,the reader is referred to Chapter 1, Appendix B, Data Element Dictionary, of Volume VII.
Appendix A contains a list of EIIP committee members with addresses and phone numbers forthose needing further information on a particular committee.

INTRODUCTION TO EIIP 6/27/97
1.1-12 EIIP Volume I
This page is intentionally left blank.

1.2-1EIIP Volume I
2
IMPLEMENTATION OF EIIP GUIDANCE2.1 PURPOSE OF EIIP GUIDANCE
The goal of the EIIP is to provide guidance on the development of cost-effective, reliableinventories by improving the quality of emissions data collected and providing for uniformdocumentation and reporting of this information. The EIIP has adopted a philosophy that the useof standardized emission estimation procedures will produce data of increased precision,accuracy, and consistency. Using standardized approaches enables industry, federal, state, andlocal agencies to generate data of known quality at acceptable costs.
In order to achieve its goal, the EIIP has implemented a system for presenting preferred andalternative methods for estimating air emissions so that agencies will use this guidance in thedevelopment of their inventories. Emission estimation methods have been delineated for manypoint, area, mobile, and biogenic source categories. For example, EPA’s widely used AP-42document (EPA, 1995-1996) contains many emission factors and source category data that can beused to estimate emissions. The EIIP guidance does not replace the AP-42 document, but insteadsupplements and complements it.
The EIIP’s system of preferred and alternative methods selection for estimating emissions allowsusers to match the end-uses of their inventory to the inventory development efforts. Inventorypreparers, for example, can select a preferred or alternative estimation method for an individualsource category based on the significance they assign to that source category . By referring backto the EIIP guidance, subsequent data users can decide whether the quality is adequate to meettheir needs; if it is not, the inventory preparer then has the option of collecting higher quality dataif improved methodologies are available or using an alternative method, if for example, availableresources will not allow the use of a preferred method. The EIIP’s emissions inventory preparation guidance has been developed to ensure that consistentand unambiguous procedures are used to do the following:
Identify all emission sources in a defined area. The EIIP provides guidance onhow to identify sources that should be included in an emissions inventory.

INTRODUCTION TO EIIP 6/27/97
1.2-2 EIIP Volume I
Select methods to estimate emissions from each source. Guidance is providedto estimate emissions and choose between preferred and alternative emissionestimation methods based on accuracy.
Identify and select data sources for activity levels and other parametersrequired by an emission estimation method. The EIIP documents specify theminimum data elements required to estimate emissions for each method andprovides guidelines for obtaining data efficiently.
Perform QA/QC checks on the inventory. The EIIP QA volume presentstechniques, tools, and methods used for assuring the quality of inventory data.
Document emission estimation methods, data sources and QA/QCprocedures. Proper documentation is stressed throughout all volumes of the EIIPdocuments to ensure reliability and accuracy of results, reproducibility of emissionsestimates, and instill confidence in the inventory.
Collect and transfer data. Guidance on data collection, storage, and handling isprovided in the guidance documents. The EIIP’s Data Model was designed tostandardize data transfer efforts by state and local agencies, industry, and federalagencies.
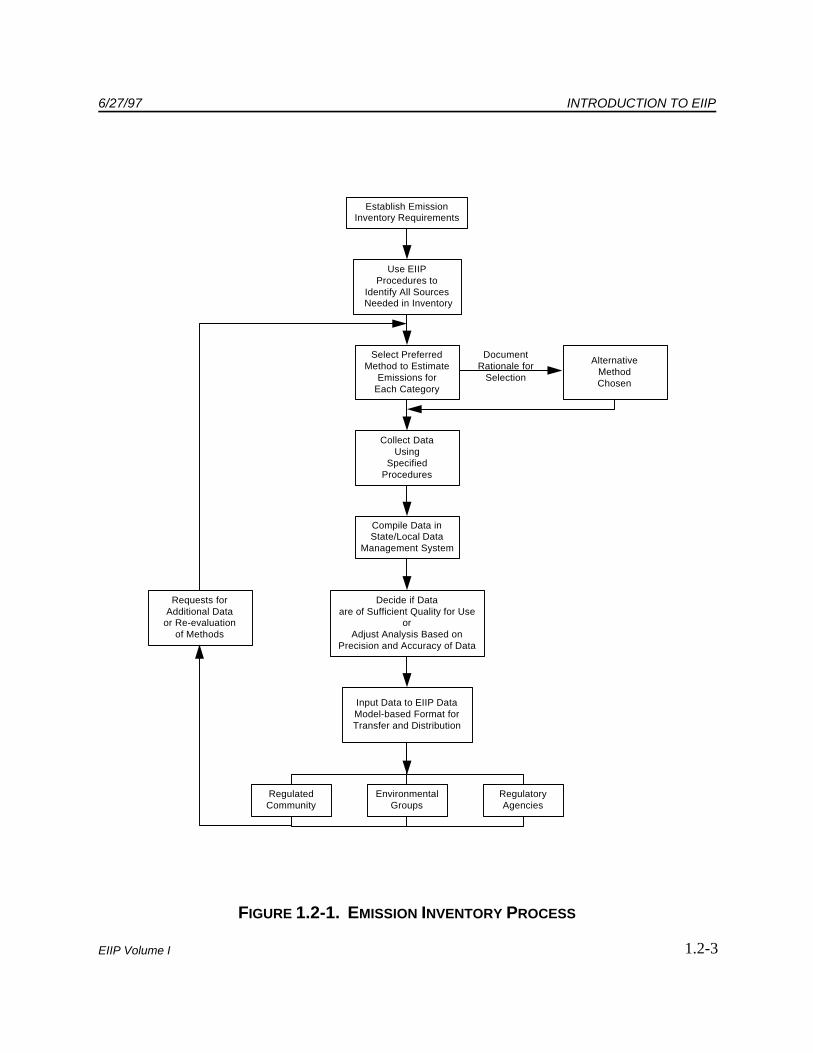
Figure 1.2-1 depicts the major processes involved in preparing an emission inventory. Thediagram highlights significant decision points and steps in the implementation of EIIP guidance.
The EIIP guidance allows industry, state, and local agencies to choose the inventory developmentmethod that matches their needs, priorities, and budgets. However, the burden of properly usinginventory data falls on the end-users of the inventory. In the past, many data requestors did notknow the quality of information required to meet their needs, but wanted the “best” data theycould get. The EIIP approach places the responsibility on users to realize that the data may beinadequate even though it may be the best available. The inventory preparer is stronglyencouraged to document the data quality, evaluate the impact on emissions estimates, and toprioritize inventory-development efforts to focus resources where they have the most impact. This will allow end-users to make an informed decision on the use of the data. A discussion ofsources of uncertainty is provided for each source type in Volumes II through V of the EIIPdocument series, and methods for assessing uncertainty (quantitatively and qualitatively) arediscussed in Volume VI.
Establish EmissionInventory Requirements
Use EIIPProcedures to
Identify All Sources Needed in Inventory
Select PreferredMethod to Estimate
Emissions forEach Category
Collect DataUsing
SpecifiedProcedures
Compile Data inState/Local Data
Management System
Input Data to EIIP DataModel-based Format forTransfer and Distribution
Requests forAdditional Data
or Re-evaluationof Methods
Decide if Dataare of Sufficient Quality for Use
orAdjust Analysis Based on
Precision and Accuracy of Data
EnvironmentalGroups
RegulatoryAgencies
RegulatedCommunity
AlternativeMethodChosen
DocumentRationale for
Selection
6/27/97 INTRODUCTION TO EIIP
1.2-3EIIP Volume I
FIGURE 1.2-1. EMISSION INVENTORY PROCESS

INTRODUCTION TO EIIP 6/27/97
1.2-4 EIIP Volume I
2.2 SCOPE AND GENERAL CONTENT OF DOCUMENTS
The following is a summary of the information contained in each of the seven EIIP volumes.
Volume I: Introduction to the EIIP. This introductory volume describes the concept,implementation, and goals of the EIIP. The EIIP’s focus on standardized inventory developmentapproaches through the selection of preferred or alternative emission estimation methods isdiscussed. Also, general emission inventory concepts are explained.
Volume II: Point Sources. The overall goal of Volume II is to familiarize the private sectorwith the basic concepts and procedures involved in estimating air pollutant emissions fromindustrial processes, and provide instructional guidance to state and local agency personnel onpreferred methods for developing emission inventories. The emission inventory procedurespresented in Volume II are specific to point sources. Practical, detailed calculations andprocedures applicable to specific categories are provided within each chapter. These chapterspresent several different estimation scenarios and provide example calculations to aid in actualemission estimation. A brief discussion is presented on the source category, available controltechniques, and QA/QC. The source classification codes (SCCs) needed for entry of the data intoa database management system are presented. Data collection forms are included as well.
Volume III: Area Sources. Volume III addresses the process of planning and developing anarea source inventory. Fundamental emission estimation approaches are presented, and inventorymanagement, QA/QC, and documentation procedures are discussed. Each chapter contains ageneral description of the source category, an overview of available control technologies, and theEIIP’s preferred and alternative emission estimation methods, including new and innovativeestimation methods where available. A “how-to” approach is provided for each estimationmethod. The various methods’ uncertainty and data coding procedures are also discussed.
Volume IV: Mobile Sources. Volume IV presents guidance for state and local agencies to usein developing motor vehicle emission inventories using Highway Performance Monitoring System(HPMS) and Travel Demand Model (TDM) data. Specifically, Volume IV guides the users in: (1) the conversion of HPMS vehicle miles traveled (VMT) data to EPA’s MOBILE emissionfactor model vehicle classes; (2) the use of TDM data for modeling; and (3) the development ofVMT projection data. Preferred methods are presented for each of these three items.
Volume V: Biogenic Sources. Volume V of the EIIP manual series presents preferred andalternative methods for developing VOC and NO emission estimates from biogenic sources (e.g.,x
forests, crops, and soils), NO emissions from lightning, and VOC emissions from oil and naturalx
gas seeps. The assumptions and uncertainty inherent to each of these methods are described, inaddition to the data that must be supplied by the user to estimate emissions. Guidance is provided

6/27/97 INTRODUCTION TO EIIP
1.2-5EIIP Volume I
for the three computer models that can be used to estimate biogenic emissions, as well as anotheralternative method that involves collecting local information to substitute for defaults in the threemodels. Biogenic emission estimation models typically provide emission information in a formatspecific to an air quality model. The input needs of the air quality model therefore typicallydetermine the choice of the biogenic emission estimation model.
Volume VI: Quality Assurance. The purpose of Volume VI is to identify, improve,consolidate, and document QA/QC practices and procedures in all steps of the inventorydevelopment and review process. The goal of an emission inventory QA/QC program is todevelop and implement techniques for improving inventory consistency and to reduce anddocument data uncertainty. Within the context of the EIIP, the emission estimation proceduresand the inventory QA/QC program are complementary. Volume VI presents tools, procedures,and methods useful for inventory QA/QC. A series of standardized procedures and auditingsteps to be used in implementing the QA/QC program have been developed. The standardizedQA/QC procedures provide guidance for each step of the emission inventory preparation andreporting process. Also provided are procedures for those using an alternative rather than apreferred method. The QAC worked with the Point, Area, and Mobile Source Committees toensure that inherent uncertainties in emission estimation methods are discussed as fully aspossible.
Volume VII: Data Management. The primary focus of this volume is to provide a unifiedstandard for defining and sharing emissions inventory data, specifically through defining the useand implementation of the EIIP Data Model and the EIIP data transfer standard. The EIIP DMCdeveloped the Data Model to facilitate an improved data exchange mechanism for state and localagencies, EPA, and industry. The EIIP Point, Area, Mobile, and Biogenic Sources Committeesidentified the data elements needed in the Data Model, and were asked to demonstrate how thedata elements related to one another. The resulting organization of the Data Model is similar tothat found in many point source inventory systems. However, in order to accommodate area,mobile, and biogenic source types for this application, a greater level of abstraction was needed interminology as well as in organization. This volume should be used to guide the development ofdatabase translation software programs to convert from an agency's current database to standardEIIP format (and vice versa). It also provides a common format for industry to use to submittheir data to state/local or federal agencies.
2.3 APPROACH FOR SELECTING METHODS
2.3.1 RATIONALE FOR EIIP'S SELECTION OF METHODS
The EIIP consists of several committees whose mandate is to develop concise, accurate, andinnovative inventory development guidance. Emission estimation methods were identified by

INTRODUCTION TO EIIP 6/27/97
1.2-6 EIIP Volume I
reviewing procedures used or recommended in the past by EPA, state and local agencies, tradeorganizations, and research groups. New and innovative emission estimation procedures wereparticularly of interest to the EIIP committees. Research and development or source test activitiesfor developing new emission factors or activity data, for example, are not within the scope of theEIIP’s functions. To select the methods included in the EIIP documents, input was solicited fromcommittee members and a consensus was reached on identifying which methods to include in thedocuments. An important aspect of the EIIP’s selection of methods was the identification of “preferred” and“alternative” approaches. Selection of a method as preferred or alternative considered severalissues. First, the availability of data needed to use a particular method was considered. Bothpreferred and alternative methods had to be practical for each specific source category; the datahad to be available and obtainable with a reasonable amount of effort. Second, the data had to beof suitable quality for developing an emissions estimate. In general, the preferred method is themost accurate and precise of the available estimation methodologies. Alternative methods wereidentified, however, in the event it was not feasible for the preparing agency to use the preferredapproach. In a few cases, a method was found that was very accurate, but required data thatwould either be very difficult or very costly to obtain (or both). A method of this type would notbe selected as the preferred method, but may be included as an alternative.
It is important to emphasize that preferred methods were identified on a source category-specificbasis; this means that a method type identified as preferred for one source category (e.g., AP-42emission factors) may not be the preferred approach for another source category. This isconsistent with the EIIP’s goal of improving the quality of emission estimates for all point, area,mobile, and biogenic source categories.
2.3.2 RATIONALE FOR USER’S SELECTION OF METHODS
The user of EIIP documents will need to select methodologies that reflect the planned end uses ofthe inventory and the priority and importance that the user assigns to a certain source category. In practice, different procedures will require different commitments of time and resources. Theuser should develop realistic selection criteria for inventory methodologies based on staffing,resource availability, and the time allowed for inventory development.
The end use of the inventory is an extremely important consideration in the selection of methods. Data of high quality is the goal in all inventories; however, for certain inventory uses, such asemission limitations and standards, it is imperative that high-quality emission estimates arepursued. Emission limitations and standards must be legally defensible, and therefore the usermay have to demonstrate that the best available approach was used to prepare the emissionestimates on which they are based.

6/27/97 INTRODUCTION TO EIIP
1.2-7EIIP Volume I
The inventory preparer must remember that, in some cases, the quality of emission assessments isdirectly affected by the quality of the variables used in the estimation process. Just because apreferred approach is selected does not mean that a high quality estimate is guaranteed. Thepreferred approach, in this example, may require previously collected data to calculate emissions; the precision and accuracy of these emissions will be based, in part, on the quality of the originaldata. It is important for the user to select their methods and approaches prior to the inventorypreparation. This selection should be done for each source category. It is also important forusers to be flexible about the method selected if the original method selected can not beperformed. For example, a preferred approach may have been selected for an area sourcecategory because it would lead to a higher quality emission estimate. However, upon initiation ofwork, the user realizes that appropriate activity level data can not be readily obtained within thetime frame and resources that are allocated. The user may decide that, since this source category is of relatively low priority, an alternative approach is more suitable to complete theinventory. The effects of these decisions on the original quality objectives for the inventory,however, must be considered before proceeding.

INTRODUCTION TO EIIP 6/27/97
1.2-8 EIIP Volume I
This page is intentionally left blank.

1.3-1EIIP Volume I
3
TRAINING OF INVENTORY STAFF Training of staff members can be a key component of the inventory development process. Depending on the experience level of the personnel preparing the inventory and the intended enduse of the inventory, training may be a necessary part of the planning process. Appropriate levelof staff training is needed to convey information on basic inventory concepts, types of inventories,pollutant sources, and inventory development methods. Training is even more important when anemission inventory is viewed as the fundamental building block in developing an air qualitycontrol and maintenance strategy, or when it will be used to demonstrate compliance with existingregulations.
3.1 TOPICS FOR TRAINING
The EIIP series of documents identifies some possible topics for training. The discussions onplanning, emission estimation methods, QA/QC, documentation, and database managementhighlight key points that should be covered in formal or informal training sessions. The decisionon what type of training is necessary should be based on an evaluation of the experience of thestaff, the technical skills that will be required to prepare the inventory, and the end-use of theinventory.
Training is an on-going process; training requirements for staff preparing the inventory should beregularly reviewed so that the latest skills and guidance are made available to them. The type oftraining that should be provided depends on the staff’s current and future roles andresponsibilities in the inventory program. Some staff require training only on point sources,others only on area sources or database management. Training of entry-level staff is particularlyimportant if their long-term goals remain linked to emission inventories and their uses. Sincemany of the basic concepts of inventory preparation are repeated in different inventory types,particularly those that build on previous efforts such as projection and modeling inventories,consistency among staff is an important issue. Training should be accounted for in the inventory planning process so that a proper time frameand mechanism can be established for accomplishing it. This includes budgetary commitmentsand the identification of any specialized training resource needs (e.g., computer software andhardware). There will be some methodologies and tools that are completely new to all staff, andit will be necessary to identify the appropriate personnel for training. 3.2 TRAINING RESOURCES

INTRODUCTION TO EIIP 6/27/97
For more information, contact the Training Coordinator at (919) 541-3724. a
1.3-2 EIIP Volume I
The EIIP document series can serve as a training tool for inventory development personnel, butthe documents are most effective if the user has some basic knowledge of inventories and canunderstand the concepts discussed. Depending on the level of experience, there are a variety ofsources for basic and specialized training in inventory development.
Training of inventory development personnel can be conducted on-site with staff members oroff-site through courses offered by agencies such as the EPA. In-house training may consist ofreviewing previously-developed inventories, formal or informal discussions with co-workers andsupervisors on the importance of planning, documentation, and QA/QC. Regular staff meetingsare also necessary to discuss proposed methods, review progress, inform staff of newmethodologies or developments, and allow for in-depth question and answer sessions.
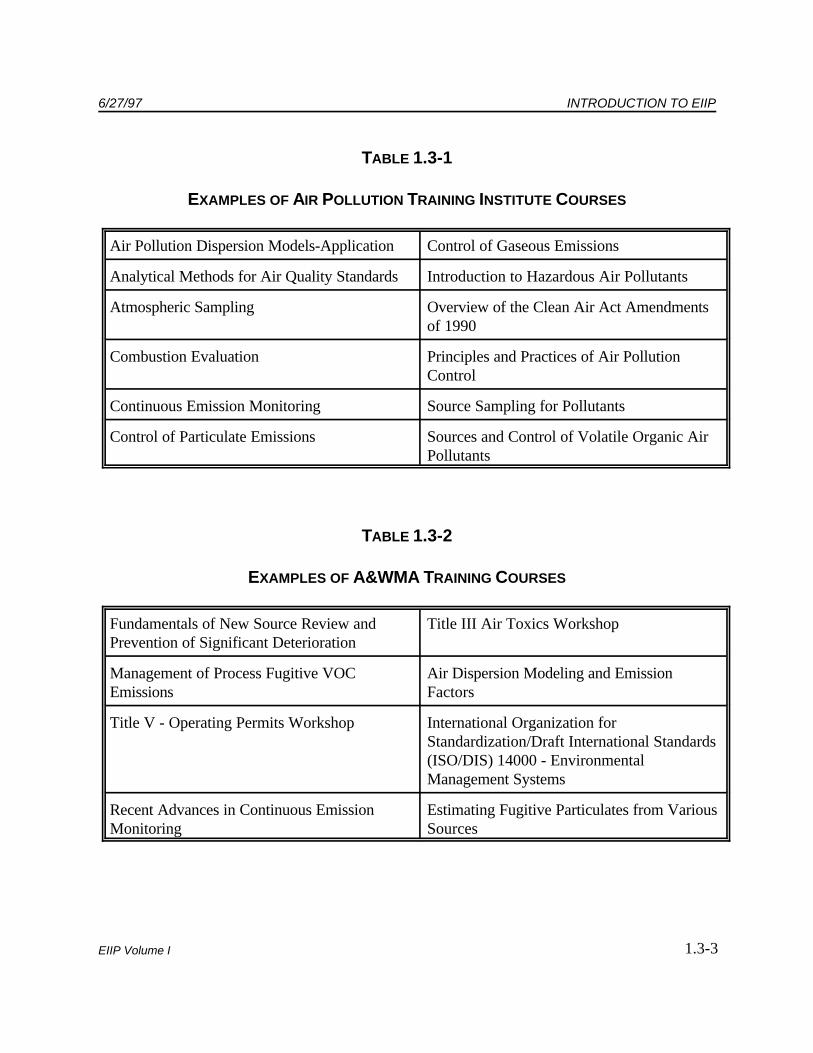
In-house training of inventory staff may not be feasible if experienced personnel do not have timeto provide guidance on a day-to-day basis. Courses offered by the EPA, private consultants, ortrade associations may be a more realistic way for inexperienced staff members to learn the basicsof inventory development, and may be held on- or off-site. The EPA sponsors numerous training courses through their Air Pollution Training Institute(APTI). Table 1.3-1 lists some of the classes routinely offered by APTI. Courses are available ona
inventory planning, inventory management, point source emissions, emissions calculations,projection techniques, and data reporting. The A&WMA, in conjunction with EPA, sponsors anannual conference specifically devoted to emissions inventories. The A&WMA also offersnumerous continuing education courses and workshops throughout the year on air pollution andsolid waste permitting, estimation, control technology evaluation, and waste management issues. Examples of some of the A&WMA training courses that are offered are shown in Table 1.3-2.
The TTN 2000 Internet web site (www.epa.gov/ttn/chief/) is an excellent on-line resource forinformation on training guidance, including documents, memoranda, regulatory news, contact listsof EPA personnel, and databases. Staff members should regularly review the EIIP and theClearinghouse for Inventories/Emission Factors (CHIEF) sections of this web site in order to keepabreast of the latest information from EPA sources.
6/27/97 INTRODUCTION TO EIIP
1.3-3EIIP Volume I
TABLE 1.3-1
EXAMPLES OF AIR POLLUTION TRAINING INSTITUTE COURSES
Air Pollution Dispersion Models-Application Control of Gaseous Emissions
Analytical Methods for Air Quality Standards Introduction to Hazardous Air Pollutants
Atmospheric Sampling Overview of the Clean Air Act Amendmentsof 1990
Combustion Evaluation Principles and Practices of Air PollutionControl
Continuous Emission Monitoring Source Sampling for Pollutants
Control of Particulate Emissions Sources and Control of Volatile Organic AirPollutants
TABLE 1.3-2
EXAMPLES OF A&WMA TRAINING COURSES
Fundamentals of New Source Review and Title III Air Toxics WorkshopPrevention of Significant Deterioration
Management of Process Fugitive VOC Air Dispersion Modeling and EmissionEmissions Factors
Title V - Operating Permits Workshop International Organization forStandardization/Draft International Standards(ISO/DIS) 14000 - EnvironmentalManagement Systems
Recent Advances in Continuous Emission Estimating Fugitive Particulates from VariousMonitoring Sources

INTRODUCTION TO EIIP 6/27/97
1.3-4 EIIP Volume I
As discussed throughout the EIIP manuals, the EPA maintains and makes available emissionsinventory development tools for those preparing emissions inventories. The CHIEF portion of theTTN 2000 contains the entire AP-42 document, each document in the Locating and EstimatingAir Emissions series, the VOC/Particulate Matter (PM) Speciation Database Management System(SPECIATE), a number of air quality dispersion models, the Factor Information Retrieval (FIRE)Data System, and emissions models such as TANKS and the Landfill Air Emissions EstimationModel (LAEEM). The EPA's RACT/BACT/LAER Clearinghouse is also available on the TTN2000 and contains control technology and permit information for criteria pollutants.
1.4-1EIIP Volume I
4
INVENTORY PLANNINGThe reasons for developing an air emissions inventory are often--but not necessarily--regulatory. Emission regulations or statutes specifically require air emission inventories to determine theamount of pollutants released to the atmosphere. For example, the Clean Air Act as amended in1990 sets forth requirements for specific inventories such as SIP base year inventories; in addition,the development of regulations often necessitates a nationwide inventory of emissions from aparticular industry or type of emission source. On a smaller scale, inventories from a facility areused as the basis for construction and operating permits, determining compliance with existingpermit conditions or emission regulations, conducting environmental impact assessments forproposed new sources, and for input to human health risk assessment studies under a variety of airquality management programs.
Each of these different types of inventories requires advanced planning. Figure 1.4-1 provides anoverview of inventory planning and preparation steps. In general, the data quality needs of theprogram will dictate the level of effort required for planning, executing, and quality assuring theresults. The EIIP guidance is focused on the emission inventory development process for astate/local agency and an individual facility. However, the guidance should also be useful forplanning any level or type of inventory.
This section provides guidance on planning a typical regional inventory of point, area, mobile, andbiogenic sources. Information of general interest or that pertains to all sources is covered. Othervolumes provide details in planning that pertain to specific types of sources. The subject ofplanning is divided into four general topics: identification of inventory uses, preliminary planningactivities, inventory work plan, and QA plan.
4.1 IDENTIFICATION OF INVENTORY USES The end uses of the inventory will dictate the level of effort required for an inventory, thestructure of the inventory, the data quality objectives (DQOs), the required staffing and resourceallocation, and the type of source categories that need to be included. The first step in inventoryplanning should be to clearly define the end use, and identify who will be the potential users of thefinal product.

Define Purposeof Inventory:
this DeterminesLevel of Detail
Needed
Determine DataQuality Objectives
(DQOs)
Develop InventoryWork Plan and
QA plan
AssessData/Resources
Available: arethey Adequate
to AchieveDQOs?
Prepare/ReviseInventory
(Include QA/QCActivities)
SystemAudits:
ProblemsFound?
InventoryCompleted
Yes
PrepareCorrective
ActionPlan
CanPlan be
Modified and Still AchieveDQOs?
CanInventory Needs
be Satisfied with LowerQuality Data?
RenegotiateBudget, Schedule,and/or Objectives
Yes
Yes
No
No
Yes
No
No
INTRODUCTION TO EIIP 6/27/97
1.4-2 EIIP Volume I
FIGURE 1.4-1. OVERVIEW OF INVENTORY PLANNING AND PREPARATION

6/27/97 INTRODUCTION TO EIIP
1.4-3EIIP Volume I
The most common end uses of air emissions inventories include air quality studies, controlstrategy development, progress tracking, dispersion modeling, and permitting of facilities. Basedon their different uses, emissions inventories can be categorized into the four general levels asshown in Table 1.4-1. By assigning an inventory to a category level, the inventory preparer canfollow general staffing, method selection, QA/QC, and documentation requirements as describedthroughout the EIIP manuals. A Level I inventory requires the highest degree of defensibility, andis based on site-specific data. Level I inventories must be sufficient in scope so that their resultscan be used directly in compliance or litigation support.
Level II inventories are used to directly support decisionmaking or standard setting, as in the caseof a SIP inventory or a national inventory developed to support a National Emissions Standardsfor Hazardous Air Pollutants (NESHAP), New Source Performance Standards (NSPS), orMaximum Achievable Control Technology (MACT) standard. Site- or region-specificinformation are generally required.
In developing a Level III inventory, site-specific data may be gathered, however these inventoriesdo not directly support rulemaking activities. The results of a Level III inventory may guidefuture research efforts. Examples include Superfund Amendments and Reauthorization Act(SARA) 313 inventories.
Overall inventory preparation and documentation requirements are the least stringent for Level IVinventories. Level IV inventories are usually compiled from previously- published emissions data,and are not intended to directly support rulemaking or compliance activities. Level IV inventoriesinclude pure research and development projects, greenhouse gas inventories, and voluntaryinternal compliance audits.
There are other inventory uses as well, including:
Input data for regional air quality modeling;
Emission trading proposals; and
Impacts assessments.
These specialized inventory uses will require up-front planning to ensure that all required dataelements are produced and that DQOs are met. Communication with intended users early in thedevelopment process will help to clarify expectations and to begin the planning process.

INTR
OD
UC
TION
TO E
IIP6/27/97
1.4-4E
IIP V
olume I
TABLE 1.4-1
EXAMPLES OF INVENTORY LEVELS
InventoryCategory Description of Example Inventory Reason(s) for Classification
Level I Point source data collected by CEM for compliancepurposes.
Operating permits data required under Title V of theCAA.
Title IV allowance trading program emissions data.
Assessment of emissions required under theComprehensive Environmental Recovery andComprehensive Liability Act (CERCLA).
Data directly tied to permit fee program, serves as the basis foremissions limitations and standards, must be legally defensible. Statutory requirements for CEMs include detailed performanceaudits and QA plan.
Data directly tied to permit fee program, used to demonstratecompliance.
High-quality estimates needed to demonstrate overall reductionin acid rain emissions, economic incentives.
Used to access the potential toxics exposure at NationalPriority List sites, could be related to liability issues.
Level II CAA-mandated SIP inventories.
National inventories developed in support ofNESHAP, NSPS, and MACT standards.
Site-specific information gathered for point sources, stringentQA/QC requirements, results may be used to support strategicdecision making or standard setting or to evaluate effectivenessof regulations.
Data used to develop and evaluate emission reduction/controlstrategies. Site-specific data generally required, but notnecessarily direct source sampling.

6/27/97IN
TRO
DU
CTIO
N TO
EIIP
1.4-5E
IIP V
olume I
TABLE 1.4-1
(CONTINUED)
InventoryCategory Description of Example Inventory Reason(s) for Classification
Level III Inventories required under the Superfund Amendmentsand Reauthorization Act of 1986 (SARA 313).
Recordkeeping as part of an integrated plantmaintenance and management program.
May be based on facility-specific information, butresulting emissions estimates do not directly driveregulatory development efforts or permit fee programs. Only penalties are for nonreporting, no QArequirements specified.
Documentation of maintenance inspections, equipmentcleaning, and damage/repair procedures used topromote emissions reductions. Need for program is notdirectly driven by regulatory program.
Level IV Inventories of greenhouse gas emissions.
Internal environmental audits.
EPA is required to prepare for Congress a series ofreports on methane emissions form anthropogenic andnatural sources; compiled from previously publisheddata.
Operations and practices are reviewed to determine ifthe facility is meeting its environmental requirements,and to plan for environmental activities in the future,need for program not directly driven by regulatory orpermit fee program.

INTRODUCTION TO EIIP 6/27/97
1.4-6 EIIP Volume I
4.2 PRELIMINARY PLANNING ACTIVITIES
4.2.1 SCOPE OF INVENTORY
The first step of the planning process is to define the scope of the proposed inventory. Thepollutants, emission sources, source categories, and geographical boundaries of the inventory allneed to be identified before data collection begins. All of these factors will help to determine thescope of the inventory in terms of resources and data needs.
For most inventories, the geographic area covered is typically defined by political boundaries(county lines, township boundaries, and state boundaries). Inventory areas are collections ofjurisdictions representing air basins or experiencing common air pollution problems. Theinventory purpose determines the exact geographic area covered. For examples, inventoriesprepared as part of SIP requirements cover classified ozone or carbon monoxide (CO)nonattainment areas. A legal listing of these areas and their boundaries is contained in Title 40,Code of Federal Regulations, Part 81 (40 CFR Part 81). The nonattainment area is designated bythe EPA in conjunction with the states and may change depending on the area’s progress inreaching attainment goals.
Inventories developed for modeling purposes are based on a “modeling region.” The modelingregion is defined in terms of the grid boundary that outlines the region and accounts for the size ofthe individual grid cells which will be used to subdivide the region. An ozone modeling regionwill be larger than an ozone nonattainment area in order to include all major emission sources thatmay affect ozone formation in the nonattainment area and to encompass ozone and precursorpollutant monitoring stations and any additional areas that may have an effect on the modelingmeteorology.
The next step is to specify the pollutants to be inventoried. This must be done before the relevantsource categories can be identified and prioritized. The pollutants of interest for ozone precursorinventories are VOC, NO , and CO. Pollutants such as sulfur oxides (SO ), particulate matterx x
(PM) and CO may be inventoried separately, while a hazardous air pollutant (HAP) inventoryshould consider the emission sources of all of the 188 listed HAPs per Section 112(b) of the1990 CAA or subsequent revisions. Some HAPs may be determined to be insignificant in aparticular inventory area. A greenhouse gas inventory should include emissions of carbon dioxide(CO ), methane (CH ), nitrous oxide (N O), and also chlorofluorocarbons (CFCs),2 4 2
hydrofluorocarbons (HFCs) and perfluorinated compounds (PFCs), and ozone precursors if theycould be significant contributors in the study area.
After the relevant pollutants are delineated, general types or categories of sources to be includedare identified. A SIP inventory has extensive and specific reporting requirements. Point, area,
6/27/97 INTRODUCTION TO EIIP
1.4-7EIIP Volume I
mobile, and biogenic sources are typically required and a very thorough accounting of sourceswithin each of these groups is expected. The extent of the sources to be included is generallyspecified where regulations drive the need for the inventory. When this is not the case, it isimportant that the inventory planners specify clearly which sources are to be included.
Finally, the inventory scope must specify the spatial and temporal scales at which results will bepresented. More than one scale may be required. A SIP ozone precursor inventory will requirethat emissions be calculated on an annual and an ozone season day basis. A point sourceinventory may include emissions from individual stacks, plants, or counties, depending on thespatial disaggregation required by the end user.
4.2.2 STAFF AND RESOURCE CONSIDERATIONS
There must an appropriate commitment of staff and resources to match the level of inventory thatis being prepared. Staff considerations should account for the time needed to complete definedtasks in the inventory, and the level of experience needed to accomplish those tasks. If there are ahigh number of inexperienced staff members, then training will need to be included in theinventory planning phase. Many of the inventories mandated by regulations will require asignificant time allocation for staff to prepare the initial inventory, make modifications if necessarybased on review of the inventory, and to use the inventory data for specific applications (e.g.,modeling purposes or projection inventories). Planning must account for the time frame overwhich staff will be needed to complete all phases of the inventory.
Resource requirements (e.g., funding, equipment, and training tools) must be established early inthe planning phase. In some cases, not all resource requirements will be met to match the level ofinventory that is desired. In these cases, it will be necessary to prioritize tasks based on availableresources. Estimated budget allocations must be known early in order to plan resource and staffneeds. For example, if a new data management system relies on computer software upgrades thatcan not be purchased in the time frame of the inventory preparation, then alternative approachesmuch be planned. A useful tool is to develop an integrated time-line that shows budget/resourceallocations next to inventory milestones. This way the preparer can anticipate shortfalls andpossibly reprioritize tasks.
4.2.3 INTERAGENCY COMMUNICATION
In the course of developing an inventory, communications and interactions take place among theinventory team members, and between the inventory team and other agencies or departments. Figure 1.4-2 illustrates some of the potential interactions required to develop a SIP (or otherrequired) inventory within the framework of the EIIP guidance structure. Specific entities thatwould be contacted are identified in each of the pertinent EIIP guidance volumes. All types of

INTRODUCTION TO EIIP 6/27/97
1.4-8 EIIP Volume I
FIGURE 1.4-2. INTERACTIONS IN INVENTORY DEVELOPMENT
6/27/97 INTRODUCTION TO EIIP
1.4-9EIIP Volume I
interaction should be considered in inventory planning and should be planned as part of thedefinition of responsibilities in the inventory work plan. Key points are:
Start early, defining necessary interactions and responsibilities while the inventorywork plan is being written;
Set up schedules and goals;
Identify contact people for the important inventory tasks and give them plenty ofadvance notice of what will be needed from them;
Schedule routine meetings; and
Advise management of the schedule and resource needs of the effort, securing theircommitment to the process.
To facilitate communication and information sharing, standardized procedures for collecting andrecording information from telephone contacts and written correspondence are often necessary. Many examples are provided throughout the EIIP guidance volumes that can be used as a startingpoint for developing templates, forms, and other standardized procedures. In particular, seeVolume VI, Quality Assurance Procedures.
4.3 INVENTORY WORK PLAN
The inventory work plan is a concise, prescriptive document that declares how an agency intendsto develop and present its inventory. It should include inventory objectives and generalprocedures. The inventory work plan should clearly describe how an inventory preparer plans topresent and document the inventory for submission to the EPA or to other users. The inventorywork plan establishes a line of communication between the preparing agency and the otherdepartments and agencies that are involved to ensure that the inventory is conducted effectively;within the preparing agency, it ensures good communication and direction amongst the staff forthe development of the inventory. The EIIP encourages the incorporation of the QA plan as partof the inventory work plan. The QA plan is discussed separately in Section 4.4 to highlight itsimportance in the EIIP planning guidance.
The inventory work plan should clearly describe how an agency plans to present and documentthe inventory for submission to the EPA or to other users. The documentation proceduresdescribed in the inventory work plan can facilitate the inventory review process. The inventorywork plan should specify the written and computerized methods that will be used to compile andreport data.

INTRODUCTION TO EIIP 6/27/97
1.4-10 EIIP Volume I
The inventory work plan will generally:
Define the geographic area for the inventory;
Define pollutants to be inventoried;
Define source categories;
Define the time interval of the inventory (e.g., annual, seasonal, hourly);
Provide the background/basis for the inventory (i.e., previous efforts that areviable and related);
Identify control strategy programs that will affect the baseline inventory;
Specify who is responsible for the inventory, with a detailed organization chart ofkey personnel/consultants;
Establish resource requirements, budget allocations, and schedule;
Specify the QA coordinator (who should be different than the inventorymanagement or technical staff);
Set data quality objectives DQOs;
Define QA/QC procedures for the entire inventory process (i.e., QA plan);
Define all procedures to be used to determine emissions, including data collectionsteps; and
Specify how the data will be stored, managed, and documented.
In developing the schedule, it is critical to set the major project milestones during planning toavoid setbacks in achieving the goals identified for the inventory uses. The inventory work planshould include a timeline that shows when key tasks are expected to be completed so that theprogress of the overall inventory effort can be tracked. This procedure will allow the preparingagency to more efficiently accommodate changes in labor commitments when priorities change orproblems are encountered.

6/27/97 INTRODUCTION TO EIIP
1.4-11EIIP Volume I
Following is a description of some of the key issues in developing the inventory work plan,including source category coverage, selection of emission estimation methods, and datamanagement and reporting. 4.3.1 SOURCE CATEGORY COVERAGE
The source categories that are to be addressed in an inventory should be explicitly listed in theinventory work plan. Typically, source categories fall into one of the following five major sourcetypes: (1) point sources; (2) stationary area sources; (3) onroad mobile sources; (4) nonroadmobile sources; and (5) biogenic sources. Under ideal conditions all stationary sources would beconsidered point sources with emissions determined using detailed site-specific data such asprocess throughputs, process parameters, and operating schedules. In practical applications,however, an emission reporting threshold is usually established to separate point and stationaryarea sources.
The EPA has identified numerous source categories for point, area, mobile, and biogenic sourcesthrough its SIP inventory guidance and the series of Locating and Estimating Air Emissionsdocuments. These references are good starting points for developing a list of source categories inan inventory area; however, the preparing agency must realize that not all the sources listed inthese documents may be operating in the particular inventory area, and that there also may beunique sources that are not listed. Since the source category coverage is driven by the pollutantsof interest, it is useful to research possible sources for the particular pollutants and determine ifany are operating in the inventory area. This research should include a review of all of thedocuments and tools made available by EPA, the historical and current knowledge of the area,and current research publications.
All possible source categories for the given pollutant and inventory type should be investigated;however, due to certain constraints (time, budget, etc.) it may be necessary to prioritize sourcecategories for inclusion in the inventory. This prioritization should be clearly documented in thework plan, with the rationale for how the ranking was established. The prioritization may alsohelp define the level of effort that will be dedicated for each source category that is included. When source categories are excluded from an inventory, the source categories and the reasons fortheir exclusion should be provided in the inventory work plan. Additional emphasis should begiven to categories in which an agency plans to use an approach not specified by previousguidance. Any major assumptions for emissions estimates development for a category should beclearly stated.
INTRODUCTION TO EIIP 6/27/97
1.4-12 EIIP Volume I
The preparing agency may find that subcategorizing a source category will allow for moredetailed and higher quality emission estimates. For example the area source category of “drycleaners” can be broken down into coin-operated, self-service machines and commerciallyoperated businesses. These can be further broken down into units that use perchloroethylene andthose that use petroleum solvents. These different combinations of processes and solvent useresult in different levels of emissions. By breaking down a general source category into specifictypes of processes and procedures it may be possible to calculate emissions at a more detailedlevel, which will improve the quality of the emission estimate for the overall source category.
4.3.2 SELECTION OF EMISSION ESTIMATION METHODS
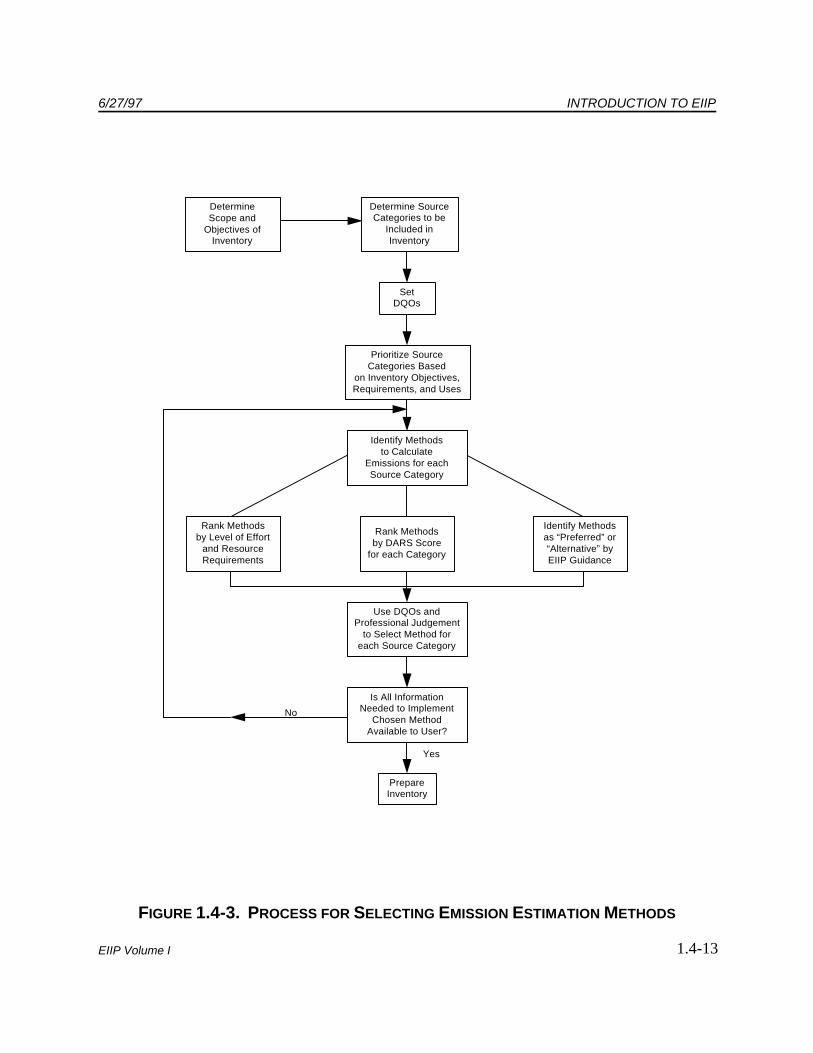
Emission estimation methodologies should be determined for each source category during theplanning phase. The choice of methodologies will be based on a number of factors, includingagency resources, source category priority, DQOs, the inventory level (I through IV as describedin Section 4.1 of this document), and the intended uses of the inventory. Figure 1.4-3 shows theprocess for selecting emission estimation methods.
The EIIP guidance documents refer to “preferred” and “alternative” methods for each sourcecategory. Selection of a preferred or alternative emission estimation procedure by the user takesplace in the planning stage of the inventory development process, and should be documented inthe work plan. Preferred methods will yield a higher quality estimate of emissions, yet not exceeda typical state or local agency’s capability in terms of resources and staff expertise. Thesemethods should be used when anticipating a control regulation for the source category, when acategory is ranked as a high priority category, or when a specific local characteristic would skewthe results obtained from an alternative method. In contrast, alternative methods will yield lowerquality estimates of emissions, but are well within any state’s capability to perform. Thesemethods are best used for source categories that are not highly prioritized and for which controlsare not anticipated. Decisions on the methods to use for individual source categories are affected by the availableresources, source priorities, availability of data, and time schedules. If the available methods varyin the amount of resources that they require, rank them according to their resource needs and seehow that ranking compares to the prioritized source category list. An increase in resourceallocation may be justified by an increase of accuracy or detail level in the emission estimate. Forexample, if the risks of adverse environmental or regulatory effects are high, more sophisticatedand costly emission determination methods may be necessary, such as using continuous emissionsmonitors (CEMs) or conducting source tests (for point sources). Conversely, if the risks are low,less expensive estimation methods may be acceptable.
Identify Methodsto Calculate
Emissions for eachSource Category
Determine SourceCategories to be
Included inInventory
Prioritize SourceCategories Based
on Inventory Objectives,Requirements, and Uses
Rank Methodsby DARS Score
for each Category
Rank Methodsby Level of Effort
and ResourceRequirements
Identify Methodsas “Preferred” or“Alternative” byEIIP Guidance
Use DQOs andProfessional Judgement
to Select Method foreach Source Category
Is All InformationNeeded to Implement
Chosen MethodAvailable to User?
PrepareInventory
SetDQOs
DetermineScope and
Objectives ofInventory
Yes
No
6/27/97 INTRODUCTION TO EIIP
1.4-13EIIP Volume I
FIGURE 1.4-3. PROCESS FOR SELECTING EMISSION ESTIMATION METHODS

INTRODUCTION TO EIIP 6/27/97
1.4-14 EIIP Volume I
The DARS is another tool that can be used to help select emission estimation methods. TheDARS rating scores are based on the perceived quality of the emission factor and activity data. Scores are assigned to four data attributes: measurement/method; source specificity; spatialcongruity; and temporal congruity. Using the DARS scores, an inventory preparer can rate theemission factor and activity data for the methods that are under consideration. Methods couldthen be ranked according to their DARS scores and the rankings could be added to a matrixcontaining the prioritization and resource allocation rankings.
Another consideration in selecting methods is to compare the needs of the inventory with theinformation that the available methods produce. For example, does the method calculate thepollutant at the required level of detail in terms of speciation, and temporal or spatial allocation? Does the method reflect economical or regional differences that would affect emissions? Theseconsiderations represent unique conditions in an inventory area and should be considered inselecting methods.
In some cases the selection of methods is limited. For example, for an onroad mobile sourceinventory being prepared to meet SIP requirements, preparing agencies are directed to use theEPA’s MOBILE emission factor model (or EMFAC model in California). Because of theimportance and complexity of these inventories, these emission factor models provide a knownlevel of quality in terms of the data source and final products that can be used by EPA, states, andlocal authorities in setting attainment strategies.
4.3.3 DATA MANAGEMENT AND REPORTING
The inventory work plan should specify the written and computerized methods that will be usedto compile and report data. Planning for the required level of documentation will: (1) ensure thatimportant supporting information is properly developed and maintained; (2) allow extraneousinformation to be identified and discarded, thereby reducing the paperwork burden; (3) helpdetermine data storage requirements; and (4) aid in identifying aspects of the inventory on whichto concentrate the QA efforts.
One of the biggest challenges in the inventory planning phase, especially for large scale inventoryefforts, is deciding on an efficient strategy to manage and report all of the data that is produced. The inventory preparer should anticipate the volume and types of data-handling needed in theinventory effort. If the inventory preparer must deal with large amounts of data, maximizing theuse of computerized inventory data-handling systems will allow them to spend more timegathering, analyzing, and verifying the inventory data, as opposed to manipulating the data.Computerized data management also has the advantage of forcing organization, consistency, andaccuracy.

6/27/97 INTRODUCTION TO EIIP
1.4-15EIIP Volume I
The selection of the database should be matched to the planned uses of the inventory data. Theformat for reporting data can range from a fully documented written report to computer-generated files for input to other estimation models. Selection of the data management systemshould facilitate the reporting format and will depend on several factors:
Type of computer system;
Size of the inventory database;
Complexity of the emissions calculations;
Number of calculations to be made;
Variety of tabular summaries to be generated;
Graphic presentation of data;
Availability and expertise of clerical and data-handling personnel; and
Time constraints.
Considerations must also be given to the end-use of the inventory and the required formats fortransferring, sharing and storing data. For example, the EIIP Data Model development programwill require the preparing agency to map certain data elements from its own computerized dataformat to the EIIP Data Model transfer protocol. Another example is the transfer of data tophotochemical modelers, who will require certain data elements in order to prepare their models. In both these examples, the preparing agency must identify the requirements of the receivingagency in the planning process to ensure that all required data elements and formats are availablefor use in the eventual transfer of the inventory data. Upfront planning is critical in developingmost of the computer-based data management programs due to the size of the operations, set-uptime required, training of staff, and the cost involved.
4.4 QUALITY ASSURANCE PLAN
The involvement of QA personnel during the planning stage of the work promotes goodcommunication between the QA coordinator and inventory development personnel, and enhancesthe effectiveness of both the QA and QC programs. It also inherently decreases the number ofquality concerns found during the audits because the expectations are clearly outlined in the QAPlan and discussed with the inventory development personnel prior to starting the work.
INTRODUCTION TO EIIP 6/27/97
1.4-16 EIIP Volume I
Listed below are the elements that should be covered in the planning process to ensurepreparation of a quality inventory:
Identify a QA coordinator;
Identify DQOs;
Determine manpower and budget allocations, organizational structure, anddistribution of authority and responsibilities; and
Develop an inventory work plan that specifically incorporates the QA programelements (i.e., the QA plan).
The QA plan describes the specific QA/QC procedures and responsibilities of the agency for thepreparation of the emissions inventory. Using a QA plan encourages the development of acomplete, consistent, accurate, and reasonable inventory by implementing specific procedures forcollecting, reporting, and documenting emissions data. Volume VI of the EIIP guidancedocument series provides a detailed breakdown of what the QA plan should include and examplesof its applications. A model QA plan is also presented.
QC procedures defined in the plan encompass a system of activities that are designed to ensurethe quality of the inventory in terms of the data collected, emission calculations, and the transferand storage of data. QC is typically carried out by members of the project team as the inventoryis being prepared. It is crucial that QC activities are part of an ongoing process in inventorypreparation so as to detect errors prior to the release of a final product. This eliminates the highcost and time that would be necessary to correct a final product that has a high level of datauncertainty.
QA is a planned system of activities designed to insure that the QC program is effective and it ispreferable that it involves oversight by individuals who are external and independent of the team. Systems audits are QA activities that need to be scheduled in the QA plan. Systems auditsevaluate the documentation and procedures associated with the inventory development activities. Through the use of QA/QC procedures, the inventory and accompanying data will meet aspecified level of quality that minimizes data uncertainty.
The purpose and intended use of the inventory determine the DQOs for the inventory, and drivethe selection of methods. A DQO statement is included in the QA plan to delineate the level ofuncertainty that a decision maker or other user of the inventory is willing to accept. DQOstatements ensure that the final data will be sufficient for its intended use. DQOs are methodspecific, are based on the quality of the available data for a given methodology, and are oftenbased on a review of past inventory efforts and problems.

6/27/97 INTRODUCTION TO EIIP
1.4-17EIIP Volume I
The process of developing an acceptable plan is an iterative one. The QA coordinator andinventory manager(s) must work together to balance the quality objectives with the resourcesavailable. It is important to acknowledge the constraints that limit the ultimate quality of theinventory, especially if the achievable DQOs fall far short of the desired DQOs.

INTRODUCTION TO EIIP 6/27/97
1.4-18 EIIP Volume I
This page is intentionally left blank.
1.5-1EIIP Volume I
5
INVENTORY DEVELOPMENTThe data needed to develop emission estimates is drawn from a wide range of sources. Theagency may collect some of the data specifically for the inventory effort. Information to supportinventory activities also may be drawn from other agency operations such as permitting,compliance, and source inspections. For effective use of resources, an agency or facility shouldplan to fulfill specific emissions inventory requirements by building upon and improving thequality of regularly collected data. The following sections describe some of the key steps ininventory development, including data collection, data handling, and emission calculations. It isimportant that QA/QC activities be implemented in all stages of the inventory developmentprocess. Figure 1.5-1 shows an example of the key steps in the development of an inventory andwhere QA/QC activities would be necessary.
5.1 DATA COLLECTION
An important step in the planning process is to assess data needs and data collection plans forpoint, area, mobile, and biogenic inventories, and to look for possible overlaps. Whiledevelopment of each type of inventory may be carried out by different staff, data collection andmanagement should be under central control or oversight. A master file for all records,memoranda, documents, reports and other references used in the inventory should be establishedand maintained.
A major inventory planning consideration is whether, and to what extent, information contained inexisting emissions inventories can be used. Existing inventories should be examined to determinewhether the appropriate sources have been included and that the emissions data represent currentconditions. Existing inventories can serve as a starting point for developing extensive data andsupport information, such as documentation of procedures, but often it will be necessary to collectnew data and information to calculate emissions and represent current conditions.
For point source inventories, information may be obtained from contacts with individual facilities. The two most common types of plant contacts are the mail survey and direct plant inspections. Atype of indirect plant contact also commonly employed is the use of permit applications orcompliance files. Point source emissions must be calculated and reported at the process level(within a point source) and related to a specific source classification code (SCC). That is,emissions are to be reported for each SCC rather than at the "point" level within a plant.

Determine Scopeand Objectives of
Inventory
SetDQOs
PrepareInventory
Work and QAPlans
CollectData to
EstimateEmissions
DevelopEmissionsEstimates
DARS Ratingsand QA
System Audit
Documentationand
Reporting
QA/QCChecks
QA/QCChecks
QA/QCChecks
Revise DQOs
INTRODUCTION TO EIIP 6/27/97
1.5-2 EIIP Volume I
FIGURE 1.5-1. EXAMPLE OF INVENTORY DEVELOPMENT

6/27/97 INTRODUCTION TO EIIP
1.5-3EIIP Volume I
Often, time or resources for advanced planning will not be available for a pre-inventory contact offacilities or a sample of facilities. In such cases, general estimates of process schedules, materialsusage, and other information may be used from the recollections of plant operators and theavailable plant records (bills of lading, receipts of raw materials, etc.).
Combinations of these approaches may also be undertaken. For example, a sample of facilities(either randomly selected or those deemed representative) are contacted before the study periodof the inventory. Information collected for each process should include schedule for the period,type of materials used, quantity of materials used, and the amount of end product produced. Emission factors based on the amount of product for each surveyed process could then be used toestimate emissions from the facilities outside the pre-inventory sample. For example, the amountof each product shipped from a facility could be collected through facility records and then beused with an emission factor to determine an emission rate. It should be noted that theseapproaches are general in nature. Gaining an accurate picture of the emissions from batch orintermittent processes may be time consuming and costly.
Surveys used for area and mobile sources will, for practical means, not achieve the same level ofcoverage as those used for the larger point sources. This reflects the fact that the area and mobilesources are individually small, but much more numerous than point sources. Emissions areestimated for area and mobile sources by selecting representative subsets of individual sourcesfrom which emission calculation parameters can be derived and then scaled up to reflect the entirepopulation of these sources. When planning to collect survey data for area and mobile sources itis critical that the subset of individual sources be carefully selected so that they are representativeof the population as a whole. For example, the emission factors presented forconsumer/commercial solvent use and architectural coatings in Volume III of the EIIP series weredeveloped from surveys of manufacturers. Those surveys attempted to cover as many sources aspossible, and where manufacturers could not be included, the uncovered contribution wasquantified to make the emission factors more representative of the industry as a whole. . 5.2 DATA HANDLING
Data handling will rely to some extent on the selection and use of a computer database system. Because many inventories produce a large quantity of data, it is essential to choose acomputerized data management system that meets all the required function and storagerequirements of the inventory effort. After a system is selected, a plan for data flow should beimplemented to ensure that the data are handled properly in the different stages of inventorydevelopment, and that QC checks are in place.
INTRODUCTION TO EIIP 6/27/97
1.5-4 EIIP Volume I
Some activities that can be performed efficiently and rapidly by computers:
Printing mailing lists and labels;
Maintaining status reports and logs;
Calculating and summarizing emissions;
Performing error checks and other audit functions;
Storing source, emissions, and other data;
Sorting and selectively accessing data; and
Generating output reports and graphical presentations.
Where data are not stored on electronic files, the inventory preparer must document all manuallycalculated emissions on worksheets. These worksheets should become part of the finaldocumentation of the inventory when completed. In all cases, whether emissions are calculatedby hand or with computer spreadsheets, all assumptions should be clearly stated and all data usedin the emissions calculation should be referenced.
An important QA/QC aspect to data handling is the transcription of data during the inventorypreparation. There must be checks built into the process for handling data that comes from theraw calculations sheets and is reported, summarized, or otherwise manipulated in some otherform. It may be possible to build these checks into the computer database that is handling thedata. For example, for electronic data entries it may be possible to reject an entry if it exceeds areasonable or expected value. Otherwise, sample QC checks tracking the data manually from itsgeneration to its final use may suffice.
5.3 EMISSION CALCULATIONS
The steps involved in calculating emissions will depend on the particular estimation technique thatis selected in the planning phase for each source category. Most emission calculations are basedon one of the following types of data or procedures: (1) source test data; (2) material balance;and (3) emission factors. The following sections briefly describe the basic concepts of each; fordetailed procedural guidance, the reader is directed to Volumes II through V.

6/27/97 INTRODUCTION TO EIIP
1.5-5EIIP Volume I
5.3.1 SOURCE TEST DATA
The best method of estimating a source’s emissions can be the use of test data obtained by thepreparing agency or supplied by the plant itself. The use of source test data reduces the numberof assumptions regarding the applicability of emissions data to a source (a common considerationwhen emission factors are used), as well as the control device efficiency, equipment variations,and fuel characteristics. Of course, the testing must be properly conducted over a sufficientlylong period of time to produce results representative of conditions that would prevail during thetime period inventoried. The most complete type of source testing is continuous emissionsmonitoring (CEM). CEM measures and records actual emissions during the time period themonitor is operating and the data produced can be used to estimate emissions for differentoperating periods.
Two items should be noted when using source test data to calculate emissions. First, becausemost source tests are generally only conducted over several hours or days at most, adjustmentsmay need to be made when using these data to estimate emissions over longer time intervals or forconditions different from those under which the tests were performed. Second, a source testsupplied by a plant may not adequately describe a given facility’s annual or seasonal operatingpattern. The amount of time that a control device actually operates at peak efficiency will alsogreatly impact the accuracy of the emissions estimate. In those cases where such data are notincluded in the test reports, the range of operation on an annual basis should be researched so thatreliable annual or seasonal emissions estimates can be made. The information can be obtained bycontacting the plant. Although the information could be obtained from questionnaire data, it maynot be as accurate as that obtained from a direct query.
5.3.2 MATERIAL BALANCE
An agency can in some cases use material balance considerations to estimate emission factors or,better yet, total emissions for an inventory period. For some sources, a material balance can be apractical method of estimating certain emissions, such as VOC, and can be the most accurate,especially when the balance covers the entire inventory period and the nonair losses are small oreasily measured. Emissions from solvent evaporation sources are most commonly determined bythe use of material balances.
Use of material balances involves the examination of a process to determine whether emissionscan be estimated solely on knowledge of operating parameters, material compositions, and totalmaterial usage. The simplest material balance assumes that all solvent used in a process willevaporate to become air emissions somewhere at the facility. For instance, for many surfacecoating operations, it can be assumed that all of the solvent in the coating evaporates to the

INTRODUCTION TO EIIP 6/27/97
1.5-6 EIIP Volume I
atmosphere during the application and drying processes. In such cases, emissions equal theamount of solvent contained in the surface coating plus any added thinners.
Material balances are greatly simplified and very accurate in cases where all of the consumedsolvent is emitted to the atmosphere. But many situations exist where a portion of the evaporatedsolvent is captured and routed to a control device such as an afterburner (incinerator) orcondenser. In these cases, the captured portion must be measured or estimated by other meansand the disposition of any recovered material must be accounted for. As a second example, indegreasing operations, emissions will not equal solvent consumption if waste solvent is removedfrom the unit for recycling or incineration. A third example is where some fraction of the diluent(which is used to liquify cutback asphalt, for example) is believed to be retained in the substrate(pavement) rather than evaporated after application. In these examples, a method of accountingfor the non-emitted solvent is required to avoid an overestimation of emissions.
Material balances cannot be accurately employed at a reasonable cost for some evaporationprocesses because the amount of material lost is too small to be determined accurately. As anexample, applying material balances to petroleum product storage tanks is not generally feasiblebecause the losses are too small relative to the uncertainty of any metering devices. In thesecases, AP-42 emission factors or equations can be used.
5.3.3 EMISSION FACTORS
One of the most useful tools available for estimating emissions from point, area, and mobilesources is the emission factor. An emission factor is an estimate of the quantity of pollutantreleased to the atmosphere as a result of some activity such as combustion or industrialproduction, divided by the level of that activity. In most cases, emission factors are expressedsimply as a single number, with the underlying assumption that a linear relationship exists betweenemissions and the specified activity level over the probable range of application.
Because such factors are typically averages obtained from data with a wide range ofrepresentation and varying degrees of accuracy, emissions calculated this way for a given facilityare likely to differ from that facility's actual emissions. Because they are averages, factors willindicate higher-than-actual emissions for some sources and lower-than-actual emissions forothers. Only specific source measurement can determine the actual pollutant contribution from asource, under conditions existing at the time of the test. For the most accurate emissionsestimate, it is recommended that source-specific data be obtained whenever possible.
Emission factors are more appropriately used to estimate the collective emissions of a number ofsources, such as is typically done in emissions inventory efforts for area sources in a particulargeographic boundary. If factors are used to predict emissions from new or proposed sources, an

6/27/97 INTRODUCTION TO EIIP
1.5-7EIIP Volume I
agency should review the latest literature and technology to determine whether such sourceswould likely exhibit emissions characteristics different from those of typical existing sources.
5.4 EMISSIONS CALCULATION TOOLS
This section gives a brief overview of emission factor databases, models, and other availableinformation that may be useful for inventory preparation. Specific emissions measurement aregenerally the best and most accurate method to quantify emissions; however, source data are notalways available. As an alternative, documents and databases containing emission factors andmodels can be used as tools to estimate air pollutant emissions for inventory purposes. Thecalculation of area source emissions relies to a great extent on the use of emission factors since itis usually the most efficient approach to estimating emissions from these sources. Models oftenuse computers, so that a large number of equations and interactions can be easily manipulated andthe effect of many different parameters can be accounted for. EIIP guidance can be incorporatedinto the use of many of these tools, and some (e.g., the EIIP mobile source guidance) relyspecifically on the use of these tools (e.g., the MOBILE emission factor model for estimatingmobile source emissions).
5.4.1 FACTOR INFORMATION RETRIEVAL SYSTEM
The EPA’s Factor Information Retrieval System (FIRE) is a consolidation of emission factors forcriteria pollutants and HAPs that includes emission factors from EPA documents such as AP-42and the Locating and Estimating Air Emissions series, factors derived from state- reported testdata, and factors taken from literature searches . These references are the basic sources ofemission factors that have been used in the preparation of inventories, as well as economicanalyses, permit preparation for prevention of significant deterioration and New Source Reviewapplications, and other federal, state, and local agency assessments of air pollution sources.
Each emission factor in FIRE also includes information about the pollutant (Chemical AbstractService [CAS] numbers and chemical synonyms) and about the source (Standard IndustrialClassification [SIC] codes and descriptions, and SCCs and descriptions). Each emission factorentry includes comments about its development, in terms of the calculation methods and/or sourceconditions, as well as the references where the data were obtained. The emission factor entry alsoincludes a data quality rating.
The FIRE database has been designed to be very “user friendly.” Data can be searched in manydifferent ways and can be downloaded to data files, or can be printed in a report format that isdesigned by the user. The FIRE database can be accessed from the EPA’s CHIEF Internet web
INTRODUCTION TO EIIP 6/27/97
1.5-8 EIIP Volume I
site on the TTN 2000. FIRE is also available on the Air CHIEF CD-ROM as a compact discread-only memory (CD-ROM) form and can be obtained by calling the Info CHIEF Help Desk at (919) 541-1000.
5.4.2 CHEMDAT8
CHEMDAT8 is a Lotus 1-2-3 spreadsheet prepared by the EPA’s Emissions Standard Division®
that includes analytical models for estimating VOCs from treatment, storage and disposal facility(TSDF) processes. The original models include disposal impoundments, closed landfills, landtreatment facilities, and aeration and nonaeration impoundment processes. Predicted emissionscan be viewed on the screen or printed. A graphical presentation of the relationships betweenemission prediction and vapor pressure and between emission prediction and the partitioncoefficient is also available. The resulting scatter diagrams can be printed via PrintGraph ,®
another Lotus program.®
The models in CHEMDAT8 can be applied to other types of TSDF processes besides thosecontained in the original design. The nonaerated impoundment model in CHEMDAT8 canestimate emissions from storage surface impoundments and open-top wastewater treatment tanks. The CHEMDAT8 model for predicting emissions from surface treatment impoundments andaerated wastewater treatment tanks is the aerated impoundment model. The land treatment modelin CHEMDAT8 can estimate emissions from land treatment soil, open landfills, and waste piles. Emissions from an oil film surface in a land treatment facility or an oil film on surfaceimpoundments can be predicted via the oil film model in CHEMDAT8. When a CHEMDAT8model is not available to predict emissions, the equations shown in the reports that provide thebackground to the model can be used to perform hand calculations of emissions.
Default input parameters in the CHEMDAT8 diskette demonstrate example calculations. However, the input parameters can be changed to reflect different TSDF characteristics and thenrecalculate emissions under these modified conditions. The list of 60 compounds currently inCHEMDAT8 can be augmented by an additional 700 chemicals. Procedures for introducing datafor additional compounds into CHEMDAT8 are described in the supporting documentationreport.
For more information about CHEMDAT8, contact the EPA’s Emissions Standards Division at(919) 541-5499. Executable code and documentation for CHEMDAT8 can be downloaded fromthe TTN 2000 Internet web site.
6/27/97 INTRODUCTION TO EIIP
1.5-9EIIP Volume I
5.4.3 WATER8
WATER8 is a menu-driven computer program that is intended for estimating emissions fromwastewater treatment systems only. WATER8 uses some of the same models found inCHEMDAT8, but has data for over 950 compounds. Recent updates to this model have addedroutines to estimate emissions from collection system elements such as trenches, conduits,junction boxes and manholes. For more information about WATER8, contact the EPA’sEmission Standards Division at (919) 541-5499. The executable code and documentation forWATER8 can also be downloaded from the TTN 2000 Internet web site .
5.4.4 LANDFILL AIR EMISSIONS ESTIMATION MODEL
The Landfill Air Emissions Estimation Model (LAEEM) is a computer program specificallydesigned for use by state and local regulatory agencies to monitor the air emissions from landfills. The system allows the user to enter specific information regarding the characteristics and capacityof an individual landfill and to project the emissions of methane, CO, nonmethane organiccompounds, and individual HAPs over time using the Scholl Canyon decay model for landfill gasproduction estimation. The Scholl Canyon Model is a first-order decay equation that uses site-specific characteristics for estimating the gas generation rate. In the absence of site-specific data,the program provides default values for regulatory uses of the model, and default values drawnfrom AP-42 for inventory uses. The user also may tailor decay rate characteristics on anindividual basis. An integrated decay rate constant calculator is provided for landfills that may beoperating a gas recovery system to allow more accurate assessments of decay attributes. Outputsmay be reviewed in either tabular or graphical forms. A help system is also provided withinformation on the model operation as well as details on assumptions and defaults used by thesystem.
The LAEEM is available on the Control Technology Center (CTC) portion of the TTN 2000Internet web site. The model is IBM PC-compatible, requires at least 512 kilobytes of memory,and can be used with a monochrome or color graphics adaptor. For additional informationcontact the EPA’s Air Pollution Prevention and Control Division, Office of Research andDevelopment, Research Triangle Park, North Carolina, at (919) 541-2709.
5.4.5 TANKS
The TANKS program is designed to estimate emissions of organic chemicals from storage tanks. The calculations are performed according to AP-42 equations. The user provides specificinformation concerning the storage tank and its contents; the TANKS program then estimates theannual or seasonal emissions and produces a report. The emissions can be separated intobreathing and working losses.
INTRODUCTION TO EIIP 6/27/97
1.5-10 EIIP Volume I
The TANKS program has a chemical database of over 100 organic liquids and meteorology datafrom over 250 cities in the United States. The user may add new chemicals and cities to theirversion of the database. The tank styles addressed in the program include vertical and horizontalfixed roof tanks, and internal and external floating roof tanks. The tank contents can consist ofsingle or multiple liquid components.
TANKS version 3.0 is currently available. The emission estimating equations that form the basisof the TANKS 3.0 software program were developed by the American Petroleum Institute (API). The API retains the copyright to these equations but has granted permission for the nonexclusive,noncommercial distribution of this material to governmental and regulatory agencies. The API,however, reserves the rights regarding all commercial duplication and distribution of its material. Therefore, the TANKS program is available for public use, but the program cannot be soldwithout written permission from the API, the U. S. EPA, Midwest Research Institute, and PerrinQuarles Associates, Inc. The TANKS 3.0 program is written in FoxPro2.5,™ and is distributedby the EPA through the TTN 2000 Internet web site or through the mail on diskette.
5.4.6 MOBILE5a
At the time of this writing, MOBILE5a is the EPA’s current version of the emission factor modelfor use in preparing onroad mobile source emission inventories (there is a MOBILE5b versionthat can be used for certain modeling scenarios only). Since this model is regularly updated andrevised, the user is directed to the EPA’s Office of Mobile Sources (OMS) Internet web sitelocated on the TTN 2000 to obtain the latest information on this model.
The major function of MOBILE5a is to calculate emission factors for gasoline- and diesel-fueledlight-duty vehicles, light-duty trucks, heavy-duty vehicles, and motorcycles. These motor vehicletypes are also grouped by low- and high-altitude areas of the United States. Specifications on therequired use of variables, such as temperature, speed, and other factors, are also provided. MOBILE5a is capable of calculating emission factors for any calendar year between 1960 and2020 and it includes provisions for modeling the effects of oxygenated fuels on exhaust COemissions.
1.6-1EIIP Volume I
6
DOCUMENTATION AND REPORTINGThe goal of inventory documentation is to ensure that the final written report or compilation ofdata accurately reflects the inventory effort. At a minimum, documentation should be sufficientto determine quality of emissions estimates, identify the data references, and allow reproducibilityof emissions estimates. A successful inventory report also addresses the original goals forpreparing the inventory and provides summary data and documentation that allow the quality ofthe inventory effort to be effectively judged. It also facilitates quality review of the inventory,executive decision-making based on the data, and updates and modifications to the inventory.
The following sections discuss typical documentation requirements for preparing an inventoryreport and options for the electronic reporting of data. Refer to each of the pertinent volumes onpoint, area, mobile, and biogenic sources for detailed reporting procedures for those source types.
6.1 DOCUMENTATION
The specific documentation required for an inventory will vary based on the end use of theinventory. The definitions of the Level I through IV inventories, provided previously inSection 4.1, give an indication as to the amount of documentation that may be required. In somecases, documentation and reporting requirements are specified by the requestor or statutoryrequirement for the inventory. Most inventories will require some form of an inventory report todocument and convey the results of the inventory effort.
An emissions inventory report should include an introduction explaining the background andpurpose for the inventory development, and usually some form of an executive summary to showsummary data and conclusions up-front. The summary of the emissions data should be by somematrix of pollutant, source type (point, area, mobile, biogenics), and geographic area. Graphicsare useful to illustrate different contributions of source categories to the inventory, and can beused to clarify various interpretations of the data. Separate discussions to describe the inventorydevelopment procedures and results for all sources should follow.
The following information is typically documented in most inventories:
Base year (or other applicable time frame) of the inventory;
The geographic area covered by the inventory;
INTRODUCTION TO EIIP 6/27/97
1.6-2 EIIP Volume I
Pollutants and source categories addressed in the inventory;
Record of all methods used in the inventory preparation;
Record of all data used in emissions calculations;
Explanation of all assumptions used;
Example calculations for each type of methodology used;
Any demographic data (e.g., population, employment, economic) that was used tocalculate or spatially allocate emissions;
A listing of all data references;
Copies of questionnaires or surveys;
Results of surveys or questionnaires;
QA/QC checklists;
QA audit reports; and
Any other letters, memorandum, or supporting documentation used in theinventory preparation.
An emissions inventory that is documented according to standardized guidelines enables thereceiving agency to review the inventory in a consistent manner, although it is recognized thatsome variability is needed to meet the specific needs of each inventory region. Therefore,standardization is required for the types of data reported (e.g., many of the items listed above),but not necessarily for the format in which they are reported. For example, states were givenconsiderable latitude in the formats for their SIP inventory reports, but minimum informationrequirements were identified (EPA, 1991a; EPA, 1991b).
For more information on documenting point and area sources, refer to the EIIP Volumes II andIII respectively. These volumes contain discussions on inventory reporting and documentation

6/27/97 INTRODUCTION TO EIIP
1.6-3EIIP Volume I
recommendations from the SIP inventory perspective. In addition, Chapter 2 of Volume VI discusses the need for comprehensive documentation and reporting from a QA programstandpoint and provides example documentation.
6.2 EXAMPLES OF STANDARDIZED REPORTING FORMAT
One example of standardized reporting procedures are those recommended by theIntergovernmental Panel on Climate Change (IPCC). The IPCC provides detailed reportinginstructions which consist of step-by-step directions for assembling, documenting, andtransmitting national greenhouse gas inventory data, regardless of the method used to produce theestimates. The reporting instructions were developed to ensure consistency and comparabilitybetween reports.
Part of the IPCC reporting system is a standard table format (IPCC, 1994) that shows the sourcecategories included in the inventory and an overview of quality of the estimates (Tables 1.6-1 and1.6-2), respectively. Emission inventory results and all main assumptions (in summary form) aretransmitted to IPCC. The standard data tables also allow the user to report the inventory at thelevel of detail that the data permit. As shown in Table 1.6-2, the IPCC also asks those preparinggreenhouse gas emissions estimates to indicate the completeness, quality, and inclusion ofbackground information for each emissions estimate. Another example of standardized reporting format is contained in the EPA’s annual report onemission trends in the United States. Since 1973, EPA has prepared estimates of annual nationalemissions in order to assess historic trends in criteria pollutant emissions. These trends arereported annually in a report entitled National Air Pollutant Emission Trends 1900-(currentyear). The standardized emissions reporting structure in the Trends report consists of a “tier”categorization of source categories. Table 1.6-3 shows the Tier 1 and Tier 2 category levels usedin the report. These tiers represent the highest level of reporting; there are more detailed levels(Tier 3 and Tier 4) which provide a further breakdown of sources that are more specific to eachpollutant type and emission process.
The examples provided for the IPCC reporting system and for the EPA’s Trends report are forsummary and overview purposes and are relatively simple in their presentation. Other inventoriesrequire more abundant and complex reporting formats. The EPA document ExampleDocumentation Report for 1990 Base Year Ozone and Carbon Monoxide SIP EmissionsInventories (EPA, 1992c) provides numerous example summary tables and formats for reportinginventory data collected as part of SIP requirements. The goal of the EPA in providing thisexample documentation was to have preparing agencies submit inventory reports that could beefficiently reviewed that would also facilitate comparison of inventory data. Similar types ofwritten reporting procedures can be adapted to most other inventory efforts.

INTR
OD
UC
TION
TO E
IIP6/27/97
1.6-4E
IIP V
olume I
TABLE 1.6-1
IPCC SUMMARY REPORT FOR NATIONAL GREENHOUSE GAS INVENTORIESa
Summary Report for National Greenhouse Gas Inventories (Log)
Greenhouse Gas Source and SinkCategories
CO2
EmissionsCO2
Removals CH4 N O2 NOx CO NMVOC HFCs PFCs
Total National Emissions and Removals
1. All Energy (Fuel Combustion +Fugitive)
A. Fuel Combustion
1. Energy & TransformationIndustries
2. Industry (ISIC)
3. Transport
4. Small Combustion
5. Other
6. Traditional Biomass Burnedfor Energy
B. Fugitive Emissions from Fuels
1. Solid Fuels
2. Oil and Natural Gas
2. Industrial Processes
3. Solvent and Other Products Use
Adapted from IPCC (1994).a

6/27/97IN
TRO
DU
CTIO
N TO
EIIP
1.6-5E
IIP V
olume I
TABLE 1.6-2
IPCC OVERVIEW TABLE FOR NATIONAL GREENHOUSE GAS INVENTORIESa
Overview Table Greenhouse Gas Source and Sink
Categories CO 2CH4 N O2 NOx CO NMVOC Documentation FootnotesEstimate Quality Estimate Quality Estimate Quality Estimate Quality Estimate Quality Estimate Quality
Total National Emissions and Removals
1. All Energy (Fuel Combustion + Fugitive)
A. Fuel Combustion
1. Energy & TransformationIndustries
2. Industry (ISIC)
3. Transport
B. Fugitive Emissions from Fuels
1. Solid Fuels
2. Oil and Natural Gas
2. Industrial Processes
3. Solvent and Other Products Use
Notation Key for Overview TableEstimates Quality Documentationcode Partly estimated code Meaning code MeaningPART Partly estimated H High Confidence in Estimation H High (all background information
included)ALL Full estimate of all possible sources M Medium Confidence in Estimation M Medium (some background
information included)NE Not estimated L Low Confidence in Estimation L Low (only emission estimates
included)IE Estimated but included elsewhereNO Not occurringNA Not applicableAdapted from IPCC (1994).a

INTRODUCTION TO EIIP 6/27/97
1.6-6 EIIP Volume I
TABLE 1.6-3
TIER 1 AND TIER 2 SOURCE CATEGORIESa
Tier 1 Tier 2
FUEL COMBUSTION-ELECTRIC UTILITIES CoalOilGasOther Internal Combustion
FUEL COMBUSTION-INDUSTRIAL CoalOilGas OtherInternal Combustion
FUEL COMBUSTION-OTHER Commercial/Industrial CoalCommercial/Industrial OilCommercial/Industrial Gas Misc. Fuel Combustion (except residential)Residential WoodResidential Other
CHEMICAL & ALLIED PRODUCT MFG. Organic Chemical Mfg.Inorganic Chemical Mfg.Polymer & Resin Mfg.Agricultural Chemical Mfg.Paint, Varnish, Lacquer, Enamel Mfg.Pharmaceutical Mfg.Other Chemical Mfg.
METALS PROCESSING NonferrousFerrousNot elsewhere classified (NEC)
PETROLEUM & RELATED INDUSTRIES Oil & Gas ProductionPetroleum Refineries & Related IndustriesAsphalt Manufacturing
OTHER INDUSTRIAL PROCESSES Agriculture, Food, & Kindred ProductsTextiles, Leather, & Apparel ProductsWood, Pulp & Paper, & Publishing ProductsRubber & Miscellaneous Plastic ProductsMineral ProductsMachinery ProductsElectronic EquipmentTransportation EquipmentConstructionMiscellaneous Industrial Processes

6/27/97 INTRODUCTION TO EIIP
1.6-7EIIP Volume I
TABLE 1.6.3(CONTINUED)
Tier 1 Tier 2
SOLVENT UTILIZATION DegreasingGraphic ArtsDry CleaningSurface CoatingOther IndustrialNonindustrialSolvent Utilization (NEC)
STORAGE & TRANSPORT Bulk Terminals & PlantsPetroleum & Petroleum Product StoragePetroleum & Petroleum Product TransportService Stations: Stage IService Stations: Stage IIService Stations: Breathing & EmptyingOrganic Chemical StorageOrganic Chemical TransportInorganic Chemical StorageInorganic Chemical TransportBulk Materials StorageBulk Materials Transport
WASTE DISPOSAL & RECYCLING IncinerationOpen BurningPublicly Owned Treatment WorksIndustrial Waste WaterTreatment Storage and Disposal FacilityLandfillsOther
HIGHWAY VEHICLES Light-Duty Gas Vehicles & MotorcyclesLight-Duty Gas TrucksHeavy-Duty Gas VehiclesDiesels
OFF-HIGHWAY Off-highway GasolineOff-highway DieselAircraftMarine VesselsRailroads
NATURAL SOURCES BiogenicGeogenicMiscellaneous (lightning, freshwater, saltwater)
MISCELLANEOUS Agriculture & ForestryOther Combustion (Forest Fires)Catastrophic/accidental ReleasesRepair ShopsHealth ServicesCooling TowersFugitive Dust
Adapted from EPA (1994b).a
INTRODUCTION TO EIIP 6/27/97
1.6-8 EIIP Volume I
6.3 ELECTRONIC REPORTING OF DATA
Sharing of emissions data is essential for urban and regional air quality modeling exercises thatcross state boundaries, for regional and national regulatory impact and other policy analyses, forscientific research efforts, and for informing the public. In order to facilitate this process, the EIIPDMC is currently working on the completion of the Data Model to allow transfer of electronicdata from the inventory preparer to multiple end users.
The EIIP Data Model is currently focused on the emission inventory data needed to support airquality modeling. While the initial scope covers the inventory data compiled for the SIPattainment demonstrations (as well as base year inventories, annual point source reporting, andtrends analysis), the Data Model does not yet address some of the more detailed facility-levelinformation needed, for example, for permit processing. Additional phases of development willneed to be conducted by the EIIP to address these related data areas.
Examples of the application of electronic reporting techniques is evident in the different optionsavailable to states to report emissions data as part of their annual and periodic reportingrequirements as prescribed under Sections 110(a)(2)(F) and 182(a)(3)(A) of the CAA as amendedin 1990, respectively. Annual reporting requirements under Section 110(a)(2)(F) requirereporting of criteria air pollutants for all areas under the general SIP requirements of Section 110. Section 182(a)(3)(A) requires that States with ozone nonattainment areas submit periodicinventories of VOC, NO , and CO emissions for point sources, area sources, mobile sources, andx
biogenic sources. Electronic reporting facilitates access by the inventory community to thewealth of emissions data created by these efforts.
Four basic options currently exist for electronic data reporting for the examples listed above.
EIIP Data Model transfer format;
EPA National Emissions Trends (NET) Database format;
Aerometric Information Retrieval System (AIRS) AFS (Facility Subsystem)format; and
State-specific format.
Two of the data reporting options discussed here, the EIIP/EDI format and the NET Databaseformat, use the data element relationships defined in the EIIP Data Model. The EIIP hasdeveloped a data transfer format using existing EDI standards. The EDI data exchange standardis a nonproprietary standard created and maintained by the American National Standards Institute
6/27/97 INTRODUCTION TO EIIP
1.6-9EIIP Volume I
(ANSI). The EIIP/EDI format can provide a common data exchange format for federal, state andlocal government agencies, and eventually industry, to exchange emissions inventory informationelectronically using a single data transfer format.
Another data transfer option for the annual reporting requirements is to use the EPA NETDatabase Format. The NET database will be compatible with the EIIP Data Model, and includethe data elements and data relationships as they are defined in the EIIP Data Model. The newNET database will also be used in the EIIP EDI data transfer demonstration described above.
The AIRS format has been used for electronic reporting for previous state-submitted inventoriesand is still the primary inventory data storage vehicle for several states. Although using the AIRSformat is a feasible and valid way to make an electronic inventory submittal, this method ofreporting has some limitations. The chief constraint is that only point source information can besubmitted in the AIRS format. Information about AIRS can be found on the OAQPS CHIEFBBS, or through the TTN 2000 Internet web site, described earlier in this chapter.
Other reporting formats for inventory data include electronic files in a state-specified format andmay consist of database, spreadsheet, or flat ASCII files. If a state intends to submit inventorydata in this form as part of their reporting requirements for annual or periodic inventories, theEPA’s EFIG should be contacted ahead of time to confirm these procedures.

INTRODUCTION TO EIIP 6/27/97
1.6-10 EIIP Volume I
This page is intentionally left blank.

1.7-1EIIP Volume I
7
REFERENCESEPA. 1986. Quality Assurance and Quality Control Plan for the NAPAP 1985 EmissionInventory. U.S. Environmental Protection Agency, Air and Energy Engineering ResearchLaboratory, EPA-600/8-86-025, Research Triangle Park, North Carolina.
EPA. 1988. Guidance for the Preparation of Quality Assurance Plans for O /CO SIP Emission3
Inventories. U.S. Environmental Protection Agency, Office of Air Quality Planning andStandards, EPA-450/4-88-023. Research Triangle Park, North Carolina.
EPA. 1989. Quality Assurance Program for Post-1987 Ozone and Carbon Monoxide StateImplementation Plan Emission Inventories. U.S. Environmental Protection Agency, Office of AirQuality Planning and Standards, EPA-450/4-89-004. Research Triangle Park, North Carolina.
EPA. 1991a. Emission Inventory Requirements for Ozone State Implementation Plans. U.S.Environmental Protection Agency, Office of Air Quality Planning and Standards,EPA-450/4-91-010. Research Triangle Park, North Carolina.
EPA. 1991b. Emission Inventory Requirements for Carbon Monoxide State ImplementationPlans. U.S. Environmental Protection Agency, Office of Air Quality Planning and Standards,EPA-450/4-91-011. Research Triangle Park, North Carolina.
EPA. 1992a. Procedures for Emission Inventory Preparation. Volume IV: Mobile Sources. U.S. Environmental Protection Agency, Office of Air and Radiation, Office of Mobile Sourcesand Office of Air Quality Planning and Standards, Emission Planning and Strategies Division andTechnical Support Division, EPA-450/4-81-026d (Revised). Ann Arbor, Michigan, andResearch Triangle Park, North Carolina.
EPA. 1992b. Example Documentation Report for 1990 Base Year Ozone and Carbon MonoxideState Implementation Plan Emission Inventories. U.S. Environmental Protection Agency, Officeof Air Quality Planning and Standards, EPA-450/4-92-007. Research Triangle Park, NorthCarolina.
INTRODUCTION TO EIIP 6/27/97
1.7-2 EIIP Volume I
EPA. 1992c. Example Documentation Report for 1990 Base Year Ozone and Carbon MonoxideState Implementation Plan Emission Inventories, U.S. Environmental Protection Agency, Officeof Air Quality Planning and Standards, EPA-450/4-92-007. Research Triangle Park, NorthCarolina.
EPA. 1994a. AEERL Quality Assurance Procedures Manual for Contractors and FinancialAssistance Recipients. U.S. Environmental Protection Agency, Air and Energy EngineeringResearch Laboratory. Research Triangle Park, North Carolina.
EPA. 1994b. National Air Pollutant Emission Trends, 1900-1993. U.S. EnvironmentalProtection Agency, Office of Air Quality Planning and Standards. Research Triangle Park, NorthCarolina.
EPA. 1995. Roles and Responsibilities of Government Agencies in the Development ofEmission Inventories. Report prepared by Wiley Barbour, Radian Corporation, for J. DavidMobley, Emission Inventory Improvement Program, Government Interactions Committee.
EPA. 1995-1996. Compilation of Air Pollutant Emission Factors, Volume I: Stationary Pointand Area Sources, Fifth Edition and Supplements, AP-42. U.S. Environmental ProtectionAgency, Office of Air Quality Planning and Standards. Research Triangle Park, North Carolina.
IPCC (1994). Greenhouse Gas Inventory Reporting Instructions. IPCC Draft Guidelines forNational Greenhouse Gas Inventories, Volume !.
1.8-1EIIP Volume I
8
GLOSSARY8.1 POINT SOURCES
Actual Emissions are the actual rate of emissions of a pollutant from an emissions unit calculatedusing the unit's actual operating hours, production rates, and types of materials processed, stored,or combusted during the selected time period.
Allowable Emissions are the emissions rate that represents a limit on the emissions that can occurfrom an emissions unit. This limit may be based on a federal, state, or local regulatory emissionlimit determined from state or local regulations and/or 40 Code of Federal Regulations (CFR)Parts 60, 61, and 63.
Ambient Standards limit the concentration of a given pollutant in the ambient air. Ambientstandards are not emissions limitations on sources, but usually result in such limits being placed onsource operation as part of a control strategy to achieve or maintain an ambient standard.
Area Sources are smaller sources that do not qualify as point sources under the relevant emissionscutoffs. Area sources encompass more widespread sources that may be abundant, but that,individually, release small amounts of a given pollutant. These are sources for which emissionsare estimated as a group rather than individually. Examples typically include dry cleaners,residential wood heating, auto body painting, and consumer solvent use. Area sources generallyare not required to submit individual emissions estimates.
Carbon Monoxide (CO) is a colorless, odorless gas that depletes the oxygen-carrying capacity ofblood. Major sources of CO emissions include industrial boilers, incinerators, and motor vehicles.
Class I Substances as defined in Title VI of the Clean Air Act Amendments (CAAA) includechlorofluorocarbons (CFCs), halons, carbon tetrachloride, and methyl chloroform. According tothe CAAA, all of these compounds must be phased out of production by the year 2000 with theexception of methyl chloroform, which must be phased out of production by the year 2002. Provisions are also made that allow for acceleration of this phaseout.
Class II Substances as defined in Title VI of the Clean Air Act Amendments (CAAA) includehydrochlorofluorocarbons (HCFCs). These substances must be phased out of production by theyear 2015.
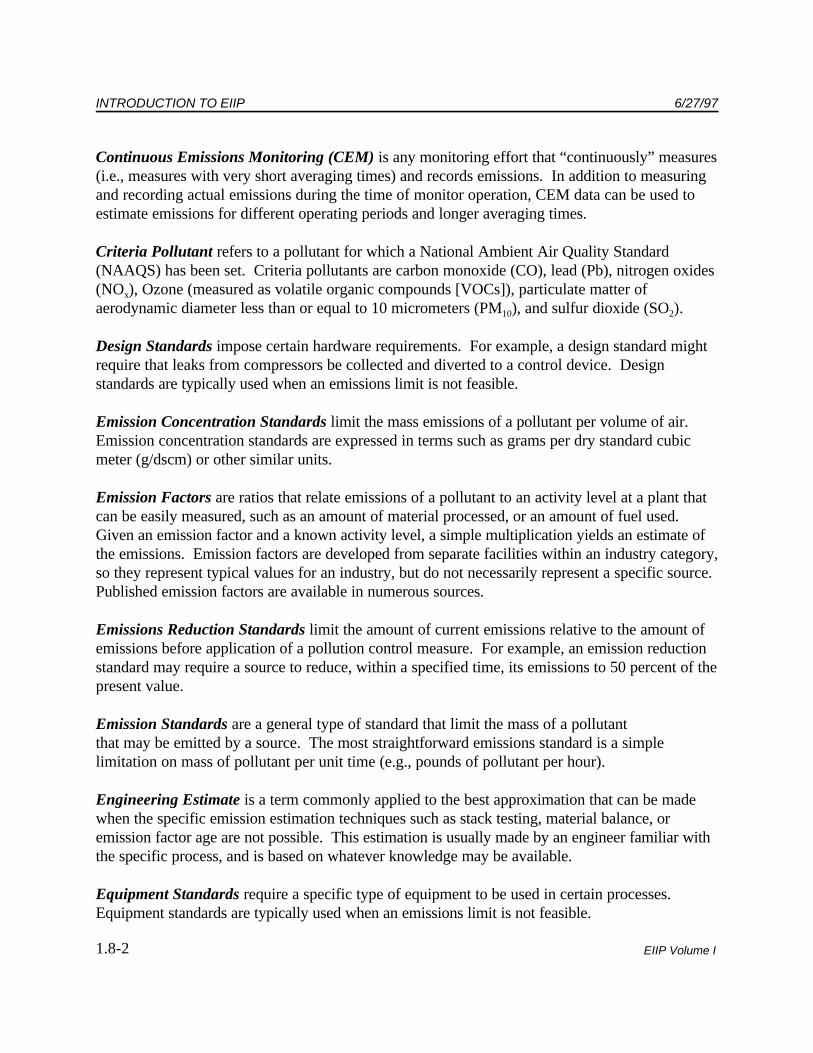
INTRODUCTION TO EIIP 6/27/97
1.8-2 EIIP Volume I
Continuous Emissions Monitoring (CEM) is any monitoring effort that “continuously” measures(i.e., measures with very short averaging times) and records emissions. In addition to measuringand recording actual emissions during the time of monitor operation, CEM data can be used toestimate emissions for different operating periods and longer averaging times.
Criteria Pollutant refers to a pollutant for which a National Ambient Air Quality Standard(NAAQS) has been set. Criteria pollutants are carbon monoxide (CO), lead (Pb), nitrogen oxides(NO ), Ozone (measured as volatile organic compounds [VOCs]), particulate matter ofx
aerodynamic diameter less than or equal to 10 micrometers (PM ), and sulfur dioxide (SO ).10 2
Design Standards impose certain hardware requirements. For example, a design standard mightrequire that leaks from compressors be collected and diverted to a control device. Designstandards are typically used when an emissions limit is not feasible.
Emission Concentration Standards limit the mass emissions of a pollutant per volume of air. Emission concentration standards are expressed in terms such as grams per dry standard cubicmeter (g/dscm) or other similar units.
Emission Factors are ratios that relate emissions of a pollutant to an activity level at a plant thatcan be easily measured, such as an amount of material processed, or an amount of fuel used. Given an emission factor and a known activity level, a simple multiplication yields an estimate ofthe emissions. Emission factors are developed from separate facilities within an industry category,so they represent typical values for an industry, but do not necessarily represent a specific source. Published emission factors are available in numerous sources.
Emissions Reduction Standards limit the amount of current emissions relative to the amount ofemissions before application of a pollution control measure. For example, an emission reductionstandard may require a source to reduce, within a specified time, its emissions to 50 percent of thepresent value.
Emission Standards are a general type of standard that limit the mass of a pollutant that may be emitted by a source. The most straightforward emissions standard is a simplelimitation on mass of pollutant per unit time (e.g., pounds of pollutant per hour).
Engineering Estimate is a term commonly applied to the best approximation that can be madewhen the specific emission estimation techniques such as stack testing, material balance, oremission factor age are not possible. This estimation is usually made by an engineer familiar withthe specific process, and is based on whatever knowledge may be available.
Equipment Standards require a specific type of equipment to be used in certain processes. Equipment standards are typically used when an emissions limit is not feasible.
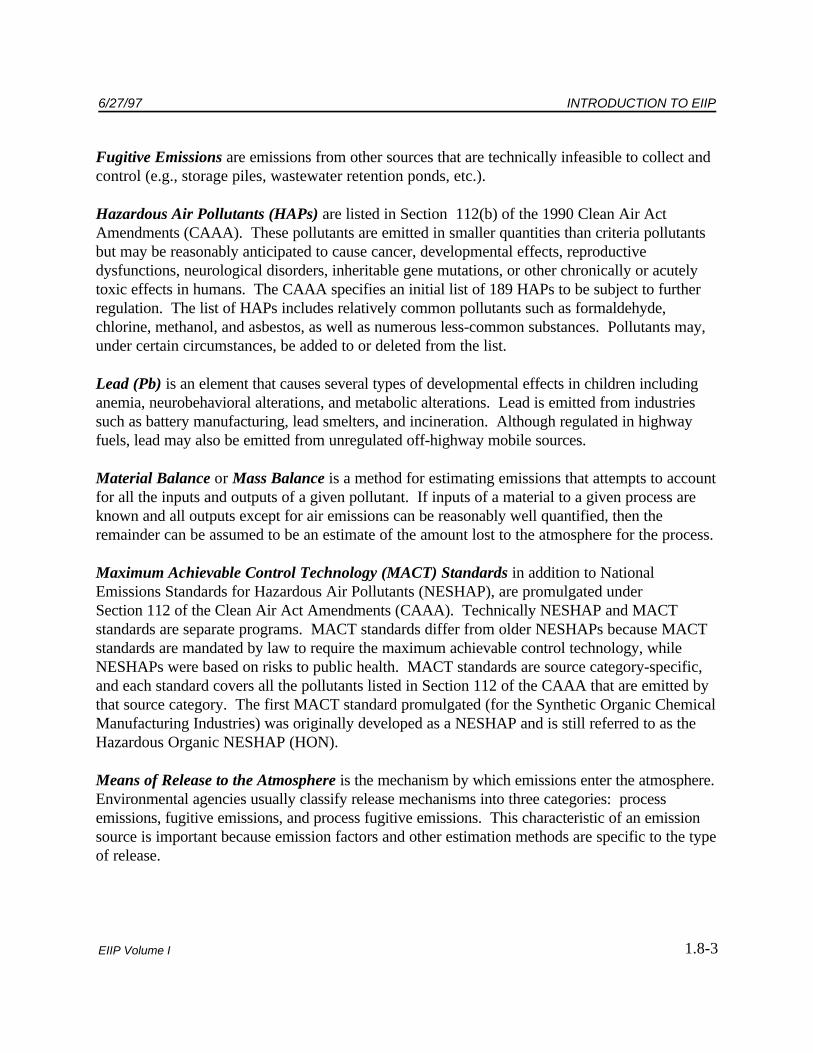
6/27/97 INTRODUCTION TO EIIP
1.8-3EIIP Volume I
Fugitive Emissions are emissions from other sources that are technically infeasible to collect andcontrol (e.g., storage piles, wastewater retention ponds, etc.).
Hazardous Air Pollutants (HAPs) are listed in Section 112(b) of the 1990 Clean Air ActAmendments (CAAA). These pollutants are emitted in smaller quantities than criteria pollutantsbut may be reasonably anticipated to cause cancer, developmental effects, reproductivedysfunctions, neurological disorders, inheritable gene mutations, or other chronically or acutelytoxic effects in humans. The CAAA specifies an initial list of 189 HAPs to be subject to furtherregulation. The list of HAPs includes relatively common pollutants such as formaldehyde,chlorine, methanol, and asbestos, as well as numerous less-common substances. Pollutants may,under certain circumstances, be added to or deleted from the list.
Lead (Pb) is an element that causes several types of developmental effects in children includinganemia, neurobehavioral alterations, and metabolic alterations. Lead is emitted from industriessuch as battery manufacturing, lead smelters, and incineration. Although regulated in highwayfuels, lead may also be emitted from unregulated off-highway mobile sources.
Material Balance or Mass Balance is a method for estimating emissions that attempts to accountfor all the inputs and outputs of a given pollutant. If inputs of a material to a given process areknown and all outputs except for air emissions can be reasonably well quantified, then theremainder can be assumed to be an estimate of the amount lost to the atmosphere for the process.
Maximum Achievable Control Technology (MACT) Standards in addition to NationalEmissions Standards for Hazardous Air Pollutants (NESHAP), are promulgated underSection 112 of the Clean Air Act Amendments (CAAA). Technically NESHAP and MACTstandards are separate programs. MACT standards differ from older NESHAPs because MACTstandards are mandated by law to require the maximum achievable control technology, whileNESHAPs were based on risks to public health. MACT standards are source category-specific,and each standard covers all the pollutants listed in Section 112 of the CAAA that are emitted bythat source category. The first MACT standard promulgated (for the Synthetic Organic ChemicalManufacturing Industries) was originally developed as a NESHAP and is still referred to as theHazardous Organic NESHAP (HON).
Means of Release to the Atmosphere is the mechanism by which emissions enter the atmosphere. Environmental agencies usually classify release mechanisms into three categories: processemissions, fugitive emissions, and process fugitive emissions. This characteristic of an emissionsource is important because emission factors and other estimation methods are specific to the typeof release.
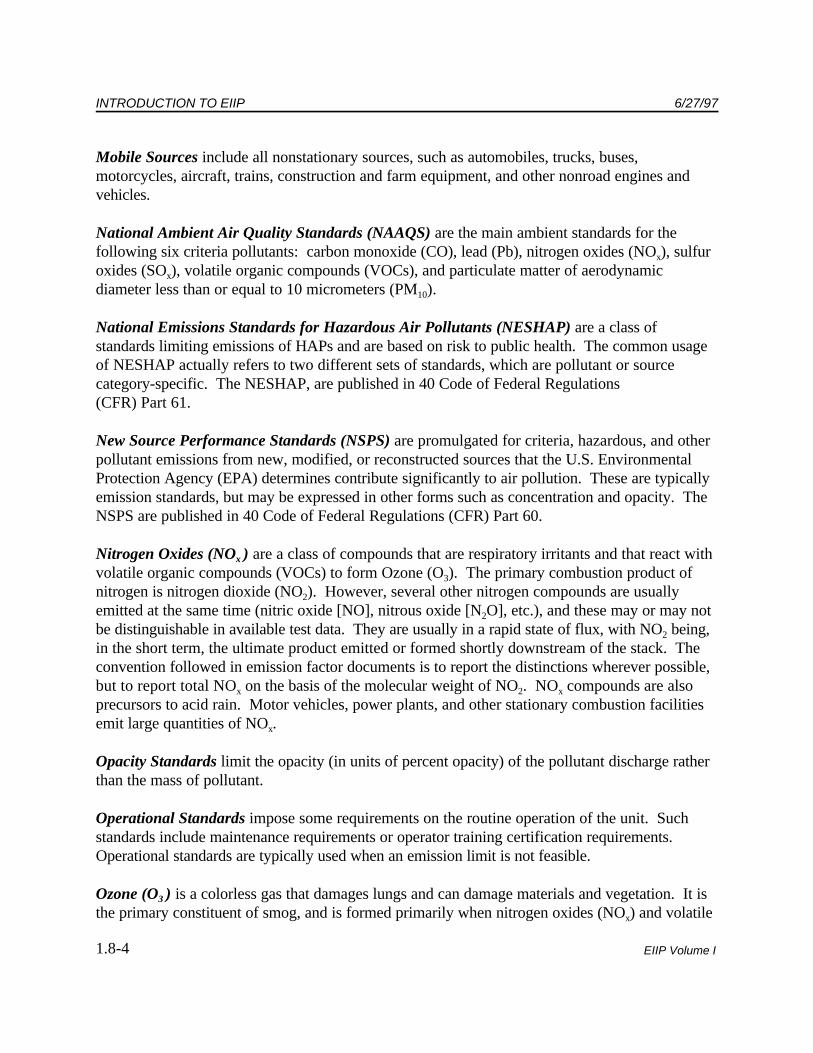
INTRODUCTION TO EIIP 6/27/97
1.8-4 EIIP Volume I
Mobile Sources include all nonstationary sources, such as automobiles, trucks, buses,motorcycles, aircraft, trains, construction and farm equipment, and other nonroad engines andvehicles.
National Ambient Air Quality Standards (NAAQS) are the main ambient standards for thefollowing six criteria pollutants: carbon monoxide (CO), lead (Pb), nitrogen oxides (NO ), sulfurx
oxides (SO ), volatile organic compounds (VOCs), and particulate matter of aerodynamicx
diameter less than or equal to 10 micrometers (PM ).10
National Emissions Standards for Hazardous Air Pollutants (NESHAP) are a class ofstandards limiting emissions of HAPs and are based on risk to public health. The common usageof NESHAP actually refers to two different sets of standards, which are pollutant or sourcecategory-specific. The NESHAP, are published in 40 Code of Federal Regulations(CFR) Part 61. New Source Performance Standards (NSPS) are promulgated for criteria, hazardous, and otherpollutant emissions from new, modified, or reconstructed sources that the U.S. EnvironmentalProtection Agency (EPA) determines contribute significantly to air pollution. These are typicallyemission standards, but may be expressed in other forms such as concentration and opacity. TheNSPS are published in 40 Code of Federal Regulations (CFR) Part 60.
Nitrogen Oxides (NO ) are a class of compounds that are respiratory irritants and that react withx
volatile organic compounds (VOCs) to form Ozone (O ). The primary combustion product of3
nitrogen is nitrogen dioxide (NO ). However, several other nitrogen compounds are usually2
emitted at the same time (nitric oxide [NO], nitrous oxide [N O], etc.), and these may or may not2
be distinguishable in available test data. They are usually in a rapid state of flux, with NO being,2
in the short term, the ultimate product emitted or formed shortly downstream of the stack. Theconvention followed in emission factor documents is to report the distinctions wherever possible,but to report total NO on the basis of the molecular weight of NO . NO compounds are alsox 2 x
precursors to acid rain. Motor vehicles, power plants, and other stationary combustion facilitiesemit large quantities of NO .x
Opacity Standards limit the opacity (in units of percent opacity) of the pollutant discharge ratherthan the mass of pollutant.
Operational Standards impose some requirements on the routine operation of the unit. Suchstandards include maintenance requirements or operator training certification requirements. Operational standards are typically used when an emission limit is not feasible.
Ozone (O ) is a colorless gas that damages lungs and can damage materials and vegetation. It is3
the primary constituent of smog, and is formed primarily when nitrogen oxides (NO ) and volatilex

6/27/97 INTRODUCTION TO EIIP
1.8-5EIIP Volume I
organic compounds (VOCs) react in the presence of sunlight. It is also emitted in insignificantquantities from motor vehicles, industrial boilers, and other minor sources.
Particulate Matter of aerodynamic diameter less than or equal to 10 micrometers (PM ) is a10
measure of small solid matter suspended in the atmosphere. Small particles can penetrate deeplyinto the lung where they can cause respiratory problems. Emissions of PM are significant from10
fugitive dust, power plants, commercial boilers, metallurgical industries, mineral industries, forestand residential fires, and motor vehicles.
Particulate Matter of aerodynamic diameter less than or equal to 2.5 micrometers (PM ) is a2.5
measure of fine particles of particulate matter that come from fuel combustion, agriculturalburning, woodstoves, etc. On November 27, 1996 the U.S. Environmental Protection Agencyproposed to revise the current primary (health-based) PM standards by adding a new annual PM2.5
standard.
Plant Level Emissions are consolidated for an entire plant or facility. A plant may contain one ormany pollutant-emitting sources.
Plant Level Reporting is generally required if total emissions from a plant (which may becomposed of numerous individual emission points) meet the point source cutoff. These data canbe used by the state to conduct a detailed estimate of emissions from that plant. The plant levelreporting used by most air pollution control agencies generally requires that the facility providedata that apply to the facility as a whole. Such data include number of employees and theStandard Industrial Classification (SIC) code designation for the plant. A plant usually has onlyone SIC code denoting the principal economic activity of the facility. For the purpose of clearlyidentifying and tracking emissions data, each plant is generally assigned a plant (alternatively,“facility”) name and number. The plant is also identified by geographic or jurisdictionaldescriptors such as air quality control region, county, address, and Universal Transverse Mercator(UTM) grid coordinates (or latitude/longitude) that identify a coterminous location. An owner oroperator engaged in one or more related activities is also identified. In some cases, plantwideemissions may be reported at the plant level.
Point Level Emissions typically represent single stacks or vents individually large enough to beconsidered point sources.
Point Level Reporting includes specific data for individual emission points (typically stacks). These data are more detailed than that submitted in Plant Level Reporting and may includeemission-related and modeling information such as stack height of the release point, diameter ofthe stack, emission rate, method of determination, fugitive emissions, gas exit velocity from astack, gas temperature, and operating schedule. Source identification information, as previouslydescribed under Plant Level Reporting, is usually also required at the point level to ensure that

INTRODUCTION TO EIIP 6/27/97
1.8-6 EIIP Volume I
emission data for a single plant remain clearly identified. Regulatory agencies generally maintainindividual emission-related records at the point level.
Point Sources are large, stationary, identifiable sources of emissions that release pollutants intothe atmosphere. Sources are often defined by state or local air regulatory agencies as pointsources when they annually emit more than a specified amount of a given pollutant, and how stateand local agencies define point sources can vary. Point sources are typically large manufacturingor production plants. They typically include both confined “stack” emission points as well asindividual unconfined “fugitive” emission sources.
Within a given point source, there may be several emission points that make up the point source. Emissions point refers to a specific stack, vent, or other discrete point of pollution release. Thisterm should not be confused with point source, which is a regulatory distinction from area andmobile sources. The characterization of point sources into multiple emissions points is useful forallowing more detailed reporting of emissions information.
For point sources, the emission estimate reporting system used by most state and local airregulatory agencies groups emission sources into one of three categories and maintains emission-related data in a different format for each. The three categories are plant level, point level, andprocess or segment level.
Potential Emissions are the potential rate of emissions of a pollutant from an emissions unitcalculated using the unit's maximum design capacity. Potential emissions are a function of theunit's physical size and operational capabilities.
It is important to note that annual potential emissions from a unit are not necessarily the productof 8760 hours per year times the hourly potential emissions. For most processes, the operation ofone piece of equipment is limited in some way by the operation of another piece of equipmentupstream or downstream. For example, consider a batch process involving vessels X, Y, and Z inseries (i.e., the output from Vessel X is the feed to Vessel Y, and the output from Vessel Y is thefeed to Vessel Z) where the residence time for each vessel is different. In this process, Vessel Ymay not operate 8760 hours per year because either the output from Vessel X is not feedingVessel Y at all times or Vessel Z may not always be available to accept the output from Vessel Y.
It is also possible for the emission rate to vary over time. For instance, if a reaction requires6 hours to reach completion, the emissions from the reaction vessel during the first hour will bedifferent than those during the last hour. Thus, the highest hourly emission rate is not sustainedduring the entire cycle or for the entire year.
Process-based Emission Standards limit the mass emissions per unit of production. Thesestandards may limit mass emissions per unit of material processed or mass emissions per unit of

6/27/97 INTRODUCTION TO EIIP
1.8-7EIIP Volume I
energy used. As process rate increases (e.g., an increase in tons of ore processed per hour), theallowable emissions increase (e.g., an increase in pounds of pollutant per hour).
Process Emissions are emissions from sources where an enclosure, collection system, ductingsystem, and/or stack (with or without an emission control device) is in place for a process. Process emissions represent emissions from process equipment (other than leaks) where theemissions can be captured and directed through a controlled or uncontrolled stack for release intothe atmosphere.
Process Fugitive Emissions occur as leaks from process equipment including compressors, pumpseals, valves, flanges, product sampling systems, pressure relief devices, and open-ended lines. Emissions from the process that are not caught by the capture system are also classified as processfugitive emissions.
Process or Segment Level Emissions usually represent a single process or unit of operation.
Process or Segment Level Reporting involves each process within a plant being identified by aU.S. Environmental Protection Agency (EPA) source classification code (SCC). For pointsources, reporting guidelines may require that a plant identify, for each process or operation(designated by SCC), the periods of process operation (daily, weekly, monthly, annually);operating rate data including actual, maximum, and design operating rate or capacity; fuel use andfuel property data (ash, sulfur, trace elements, heat content, etc.); identification of all pollutioncontrol equipment and their associated control efficiencies (measured or design); and emissionsrates. Source identification information, as previously described under Plant Level Reporting, isusually also required at the process level to ensure that emissions data for a single plant are clearlyidentified.
Process-specific Empirical Relationships are similar to emission factors in that they relateemissions to easily identifiable process parameters. However, these relationships are representedby more detailed equations that relate emissions to several variables at once, rather than a simpleratio. An example is the estimate for volatile organic compound (VOC) emissions from storagetanks that is based on tank size, air temperature, and vapor pressure.
Reported Emissions are those emission estimates that are submitted to a regulatory agency. Emissions inventories can be used for a variety of purposes such as State Implementation Plan(SIP) base year inventories, environmental compliance audits, air quality rule applicability, andreporting information in an air quality permit application. Emissions can be reported on an actual,potential, or maximum basis. Many state and local air pollution control agencies have rules andregulations that define an allowable emission value for a particular piece of equipment. Becauseof this, a facility should first define the purpose of the inventory and then choose the appropriatemeans of reporting emissions to the regulatory agency. For example, SIP base year inventories

INTRODUCTION TO EIIP 6/27/97
1.8-8 EIIP Volume I
for point sources would contain actual emissions. However, regulatory applicability and airquality permit applications can require that actual, allowable, and potential emissions be reported.
Source Tests are short-term tests used to collect emissions data that can then be extrapolated toestimate long-term emissions from the same or similar sources. Uncertainties arise when sourcetest results are used to estimate emissions under process conditions that differ from those underwhich the test was performed.
Stratospheric Ozone-depleting Compounds are chlorofluorocarbons (CFCs), halons, carbontetrachloride, methyl chloroform, and hydrochlorofluorocarbons (HCFCs). These pollutants areregulated by Title VI of the Clean Air Act Amendments (CAAA) because they may destroystratospheric Ozone. Title VI is primarily designed to limit the manufacture of these materials,not their use. The pollutants are divided into two classes (Class I and Class II) based on the datesby which their manufacture must be discontinued. Methods to estimate emissions of Ozone-depleting compounds are not discussed in Emission Inventory Improvement Program (EIIP)documents. Information on emissions of Ozone-depleting compounds can be obtained from theU.S. Environmental Protection Agency (EPA), Office of Atmospheric and Indoor Air Programs,Global Climate Change Division, located at EPA Headquarters in Washington, D.C.
Sulfur Oxides (SO ) are a class of colorless, pungent gases that are respiratory irritants andx
precursors to acid rain. Sulfur oxides are emitted from various combustion or incinerationsources, particularly from coal combustion.
Volatile Organic Compounds (VOCs) react with nitrogen oxides (NO ) in the atmosphere tox
form Ozone (O ). Although not criteria pollutants, VOC emissions are regulated under criteria3
pollutant programs because they are Ozone precursors. Large amounts of VOCs are emittedfrom fuel distribution, chemical manufacturing, motor vehicles, and a wide variety of industrial,commercial, and consumer solvent uses.
The use of certain photochemical models requires estimation of methane, ethane, and severalother less photochemically reactive compounds and particulates. While not regulated as VOCs,these compounds may need to be estimated for certain modeling inventories or to meet certainstate inventory requirements. For this reason, the term total organic compounds (TOCs) is usedto refer to this broader class of chemicals.
Work Practice Standards require some action during the routine operation of the unit. Forexample, volatile organic compound (VOC) monitoring of a compressor might be required on aquarterly basis to ensure no leaks are occurring. Work practice standards are typically used whenan emission limit is not feasible.

6/27/97 INTRODUCTION TO EIIP
1.8-9EIIP Volume I
8.2 AREA SOURCES
Activity Level/Factor is a measurable factor that is directly or indirectly related to the emissionsof a process. An emission estimate is calculated by multiplying an activity level by an emissionfactor. The activity level is either directly related to the amount of emissions (as in the case of theamount of fuel used in a combustion process), or is a more easily measured surrogate, such aspopulation for consumer product usage.
Area Sources are smaller sources that do not qualify as point sources under the relevant emissionscutoffs. Area sources encompass more widespread sources that may be abundant, but that,individually, release small amounts of a given pollutant. These are sources for which emissionsare estimated as a group rather than individually. Examples typically include dry cleaners,residential wood heating, auto body painting, and consumer solvent use. Area sources generallyare not required to submit individual emissions estimates.
Biogenic Sources are biological sources of emissions such as trees, agricultural crops, ormicrobial activity in soils or water. This term is sometimes used to describe any natural emissionsource.
Carbon Monoxide (CO) is a colorless, odorless gas that depletes the oxygen-carrying capacity ofblood. Major sources of CO emissions include industrial boilers, incinerators, and motor vehicles.
Control Efficiency (CE) is the emission reduction efficiency, and is a percentage valuerepresenting the amount of a source category’s emissions that are controlled by a control device,process change, or reformulation.
Double Counting means estimation and counting of estimated emissions twice in an inventory. Area source inventories are at risk of double counting emissions from two sources because ofpoint and area source overlap and overlap between two area sources.
Emission Factor is a ratio between the amount of pollution produced and an activity level. Givenan emission factor and a known activity level, a simple multiplication yields an estimate of theemissions. See Activity Level/Factor, and the Point Source definition of Emission Factor.
Emission Inventory is a listing, by source, of the amount of air pollutants discharged into theatmosphere of a community; used to establish emission standards.
Growth Factors are surrogate indicators that predict the proportional change in the activity levelor emissions for a particular emissions source.

INTRODUCTION TO EIIP 6/27/97
1.8-10 EIIP Volume I
Inventory Area is generally defined by political boundaries such as county and state boundaries,where the jurisdictions that are included in an inventory area make up an air basin or experiencecommon air problems. The pollutant or the type of air pollution inventory will determine theexact geographic area that will be covered.
Material Balance or Mass Balance is a method for estimating emissions that attempts to accountfor all the inputs and outputs of a given pollutant. If inputs of a material to a given process areknown and all outputs except for air emissions can be reasonably well quantified, then theremainder can be assumed to be an estimate of the amount lost to the atmosphere for the process.
Mathematical Emission Model is an emission estimation technique that uses a mathematicalmodel to estimate emissions. A very simple mathematical model is an emission factor and anactivity level. A more complex model may involve multiple parameters and iterations in thecalculation process. A mathematical model may be used by inventory preparers as an equation oras a computer program.
Mobile Sources include all nonstationary sources, such as automobiles, trucks, buses,motorcycles, aircraft, trains, construction and farm equipment, and other nonroad engines andvehicles.
Nitrogen Oxides (NO ) are a class of compounds that are respiratory irritants and that react withx
volatile organic compounds (VOCs) to form Ozone (O ). The primary combustion product of3
nitrogen is nitrogen dioxide (NO ). However, several other nitrogen compounds are usually2
emitted at the same time (nitric oxide [NO], nitrous oxide [N O], etc.), and these may or may not2
be distinguishable in available test data. They are usually in a rapid state of flux, with NO being,2
in the short term, the ultimate product emitted or formed shortly downstream of the stack. Theconvention followed in emission factor documents is to report the distinctions wherever possible,but to report total NO on the basis of the molecular weight of NO . NO compounds are alsox 2 x
precursors to acid rain. Motor vehicles, power plants, and other stationary combustion facilitiesemit large quantities of NO .x
Nonmethane Hydrocarbons (NMHCs) are a class of compounds that includes a wide range ofspecific organic chemical substances including reactive volatile organic compounds (VOCs),which form Ozone, a greenhouse gas, in the troposphere. A major local and regional airpollutant, they cause significant health and environmental damage.
Ozone (O ) is a colorless gas that damages lungs and can damage materials and vegetation. It is3
the primary constituent of smog, and is formed primarily when nitrogen oxides (NO ) and volatilex
organic compounds (VOCs) react in the presence of sunlight. It is also emitted in insignificantquantities from motor vehicles, industrial boilers, and other minor sources.

6/27/97 INTRODUCTION TO EIIP
1.8-11EIIP Volume I
Point Sources are emission units that are inventoried individually, and in much greater detail, incomparison to area sources. The distinction between point and area sources is usually defined bya cutoff level, typically based on emissions. See the following terms in the Point SourcesGlossary: Plant Level Emissions, Plant Level Reporting, Point Level Emissions, and Point LevelReporting.
Projection Inventory is an inventory that is prepared to predict future emissions levels using baseyear emissions, growth factors, and current and future controls.
Quality Assurance (QA) is a process that involves both the inventory team and external reviewersto insure the overall quality of the inventory.
Quality Control (QC) comprises the activities undertaken by all members of the inventory teamduring the inventory preparation that will result in the correction of specific problems such asmistaken assumptions, lost or uncollected data, and calculation and data entry errors.
Rule Effectiveness (RE) is the measure of the ability of the regulatory program to achieve allemission reductions possible, which reflects the assumption that regulations are typically not100 percent effective. RE is used as an adjustment to the control efficiency. See ControlEfficiency and Rule Penetration.
Rule Penetration (RP) is the percentage of an area source category that is covered by anapplicable regulation.
Standard Industrial Classification (SIC) Codes are codes defined by the U.S. Department ofCommerce that classify businesses by products or services. SICs are the Federal standard forclassifying establishment-based statistics..
Spatial Allocation entails assignment of activity levels or emission estimates to a smaller or largergeographic area than the area for which the activity level or emission estimate was prepared. Allocation usually requires the identification of a surrogate indicator that can be used for scaling.
State Implementation Plan (SIP) Inventories are inventories prepared to meet the requirementsof a state plan approved by the U.S. Environmental Protection Agency for the establishment,regulation, and enforcement of air pollution standards.
Surveys are a method to collect inventory data using telephone or written questionnaires that areanswered by manufacturers or suppliers of products, or by representatives at the facilities or siteswhere the emitting processes take place. An area source survey may also include review and datacollection from existing air pollution permits within an agency. Surveys for area sourceinventories usually survey a subset of the population of sources.

INTRODUCTION TO EIIP 6/27/97
1.8-12 EIIP Volume I
Temporal Adjustments are adjustments to an emission estimate to reflect the time period desiredfor the inventory. Adjustments may need to be made to reflect differences in the usage level for aseason, a certain day of the week, or time of day. Adjustments may also need to be made toreflect differences in temperature or other climatological variations that affect emissions.
Volatile Organic Compounds (VOCs) react with nitrogen oxides (NO ) in the atmosphere tox
form Ozone (O ). Although not criteria pollutants, VOC emissions are regulated under criteria3
pollutant programs because they are Ozone precursors. Large amounts of VOCs are emittedfrom fuel distribution, chemical manufacturing, motor vehicles, and a wide variety of industrial,commercial, and consumer solvent uses.
The use of certain photochemical models requires estimation of methane, ethane, and severalother less photochemically reactive compounds and particulates. While not regulated as VOCs,these compounds may need to be estimated for certain modeling inventories or to meet certainstate inventory requirements. For this reason, the term total organic compounds (TOCs) is usedto refer to this broader class of chemicals.
8.3 MOBILE SOURCES
Highway Performance Monitoring System (HPMS) is a program developed by the U.S.Department of Transportation Federal Highway Administration in the mid-1970s to collect andreport information on the nation’s highways.
MOBILEX.X is the U.S. Environmental Protection Agency’s emission factor model that helpsanalysts in estimating motor vehicle contributions to the local emissions inventory and is designedto account for the effect of numerous vehicle parameters on the volume of pollutants emitted. Latest versions are MOBILE5a and MOBILE5b.
Vehicle Miles Traveled (VMT) is an expression of vehicle activity that is used with emissionfactors, typically in units of grams per mile of travel. Because VMT does not directly correlate toemissions that occur while the vehicle is not moving, these nonmoving emissions are incorporatedinto the U.S. Environmental Protection Agency’s MOBILE model emission factors.
Travel Demand Model (TDM) is a mathematical model used to assess the effects of growth on ahighway network and allows transportation analysts to evaluate the improvements that areneeded. From the perspective of air quality, important products of these models are estimates ofvehicle miles traveled and speed on each of the roadway links coded in the highway network.
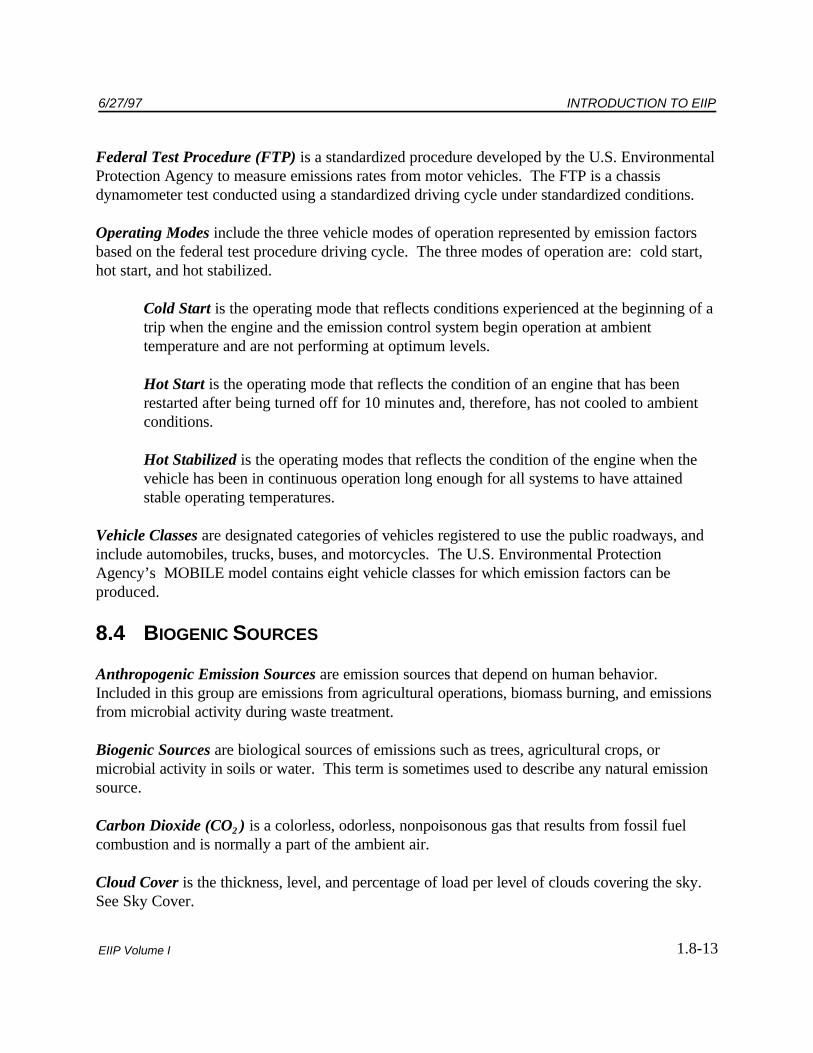
6/27/97 INTRODUCTION TO EIIP
1.8-13EIIP Volume I
Federal Test Procedure (FTP) is a standardized procedure developed by the U.S. EnvironmentalProtection Agency to measure emissions rates from motor vehicles. The FTP is a chassisdynamometer test conducted using a standardized driving cycle under standardized conditions.
Operating Modes include the three vehicle modes of operation represented by emission factorsbased on the federal test procedure driving cycle. The three modes of operation are: cold start,hot start, and hot stabilized.
Cold Start is the operating mode that reflects conditions experienced at the beginning of atrip when the engine and the emission control system begin operation at ambienttemperature and are not performing at optimum levels.
Hot Start is the operating mode that reflects the condition of an engine that has beenrestarted after being turned off for 10 minutes and, therefore, has not cooled to ambientconditions.
Hot Stabilized is the operating modes that reflects the condition of the engine when thevehicle has been in continuous operation long enough for all systems to have attainedstable operating temperatures.
Vehicle Classes are designated categories of vehicles registered to use the public roadways, andinclude automobiles, trucks, buses, and motorcycles. The U.S. Environmental ProtectionAgency’s MOBILE model contains eight vehicle classes for which emission factors can beproduced.
8.4 BIOGENIC SOURCES
Anthropogenic Emission Sources are emission sources that depend on human behavior. Included in this group are emissions from agricultural operations, biomass burning, and emissionsfrom microbial activity during waste treatment.
Biogenic Sources are biological sources of emissions such as trees, agricultural crops, ormicrobial activity in soils or water. This term is sometimes used to describe any natural emissionsource.
Carbon Dioxide (CO ) is a colorless, odorless, nonpoisonous gas that results from fossil fuel2
combustion and is normally a part of the ambient air.
Cloud Cover is the thickness, level, and percentage of load per level of clouds covering the sky. See Sky Cover.
INTRODUCTION TO EIIP 6/27/97
1.8-14 EIIP Volume I
Emission Factor is a ratio of the emissions per unit of activity per unit of time. When estimatingbiogenic volatile organic compound (VOC) emissions, the emission factor will be based on theamount of vegetation biomass. See Emission Rate.
Emission Flux is the emissions per unit of area per unit of time for a particular vegetation type(in the case of biogenic volatile organic compound [VOC] emissions) or land use type (in the caseof biogenic nitric oxide [NO] emissions).
Emission Rate is the emissions per unit of time for a particular source type, such as a vegetationtype, and for a particular chemical species. When calculating biogenic emissions, the emissionrate is dependant on the vegetation type emission factor, the amount of biomass, andenvironmental factors accounting for solar radiation and leaf temperature.
Geogenic Emission Sources result from geological activity. Sources include volcanoes,fumaroles, and natural seeps of oil or natural gas.
Geographic Information System (GIS) is a computer-based information system that allows forstorage and manipulation of spatially related data.
Greenhouse Gases that occur naturally include water vapor, carbon dioxide (CO ), methane2
(CH ), nitrous oxide (N O), and Ozone (O ). Chlorofluorocarbons (CFCs) (a family of human-4 2 3
made compounds), its substitute hydrofluorocarbons (HFCs), and other compounds such asperfluorinated carbons (PFCs) are also greenhouse gases.
Land Use Data describe the predominant vegetative cover, type of water body, or anthropogenicuse (buildings, parking lots, etc.) of land for areas of a defined scale.
Methane (CH ) is a colorless, nonpoisonous flammable gas created by anaerobic decomposition4
of organic compounds; considered a greenhouse gas pollutant.
Natural Emission Sources are nonanthropogenic sources of emissions that include biogenic andgeogenic emission sources.
Nitric Oxide (NO) is a colorless gas formed by combustion under high temperature and highpressure in an internal combustion engine. It changes into nitrogen dioxide (NO ) in the ambient2
air and contributes to photochemical smog. It is the most thermally stable of the oxides ofnitrogen.
Nitrogen Oxides (NO ) are a class of compounds that are respiratory irritants and that react withx
volatile organic compounds (VOCs) to form Ozone (O ). The primary combustion product of3
nitrogen is nitrogen dioxide (NO ). However, several other nitrogen compounds are usually2
6/27/97 INTRODUCTION TO EIIP
1.8-15EIIP Volume I
emitted at the same time (nitric oxide [NO], nitrous oxide [N O], etc.), and these may or may not2
be distinguishable in available test data. They are usually in a rapid state of flux, with NO being,2
in the short term, the ultimate product emitted or formed shortly downstream of the stack. Theconvention followed in emission factor documents is to report the distinctions wherever possible,but to report total NO on the basis of the molecular weight of NO . NO compounds are alsox 2 x
precursors to acid rain. Motor vehicles, power plants, and other stationary combustion facilitiesemit large quantities of NO .x
Nitrous Oxide (N O) is a colorless gas with a mild, pleasing odor and sweet taste. Its behavior2
resembles that of oxygen as an oxidizing agent with combustible substances. It is considered anaturally occurring greenhouse gas.
Nonmethane Hydrocarbons (NMHCs) are a class of compounds that includes a wide range ofspecific organic chemical substances, including reactive volatile organic compounds (VOCs),which form Ozone, a greenhouse gas, in the troposphere. A major local and regional airpollutant, they cause significant health and environmental damage.
Ozone (O ) is a colorless gas that damages lungs and can damage materials and vegetation. It is3
the primary constituent of smog, and is formed primarily when nitrogen oxides (NO ) and volatilex
organic compounds (VOCs) react in the presence of sunlight. It is also emitted in insignificantquantities from motor vehicles, industrial boilers, and other minor sources.
Ozone Day is the time period (one day) that Ozone (O ) emissions are estimated for a daily Ozone3
inventory. When modeling biogenic emissions, an Ozone day is selected from days with thehighest actual recorded Ozone, and the meteorology from that day is used in the model.
Photosynthetically Active Radiation (PAR) is the photon flux density in the visible (orphotosynthetic) portion of the spectrum (0.4 - 0.7 µm), expressed as the energy per square meterper second.
Sky Cover is the amount of sky completely hidden by clouds or other obscuring phenomenon. Sky cover is reported in tenths, so that 0.0 sky cover indicates a clear sky and 1.0 sky coverindicates a completely covered sky.
Volatile Organic Compounds (VOCs) react with nitrogen oxides (NO ) in the atmosphere tox
form Ozone (O ). Although not criteria pollutants, VOC emissions are regulated under criteria3
pollutant programs because they are Ozone precursors. Large amounts of VOCs are emittedfrom fuel distribution, chemical manufacturing, motor vehicles, and a wide variety of industrial,commercial, and consumer solvent uses.

INTRODUCTION TO EIIP 6/27/97
1.8-16 EIIP Volume I
The use of certain photochemical models requires estimation of methane, ethane, and severalother less photochemically reactive compounds and particulates. While not regulated as VOCs,these compounds may need to be estimated for certain modeling inventories or to meet certainstate inventory requirements. For this reason, the term total organic compounds (TOCs) is usedto refer to this broader class of chemicals.
8.5 QUALITY ASSURANCE
100(1- ) Percent Confidence Interval of a Population Parameter means that if the process ofdrawing n samples from the population is repeated many times and the 100(1- ) percentconfidence interval is computed each time, 100(1- ) percent of those intervals will include thepopulation parameter value.
Accuracy is (1) the closeness of a measurement to its true value, or (2) the degree of agreementbetween an observed value and an accepted reference value. Accuracy includes a combination oferror (precision) and systematic error (bias) components that are due to sampling and analyticaloperations; a data quality indicator.
Area Sources are smaller sources that do not qualify as point sources under the relevant emissionscutoffs. Area sources encompass more widespread sources that may be abundant, but that,individually, release small amounts of a given pollutant. These are sources for which emissionsare estimated as a group rather than individually. Examples typically include dry cleaners,residential wood heating, auto body painting, and consumer solvent use. Area sources generallyare not required to submit individual emissions estimates.
Arithmetic Mean is the sum of all the values of a set of measurements divided by the number ofvalues in the set, usually denoted by x; also a measure of central tendency.-
Attainment Area is an area considered to have air quality as good as or better than the NationalAmbient Air Quality Standards (NAAQS) as defined in the Clean Air Act. Note that an area maybe in attainment for one or more pollutants but be a nonattainment area for one or more otherpollutants.
Audit of Data Quality means a qualitative and quantitative audit in which data and data handlingare reviewed and data quality is assessed.
Audits are systematic evaluations to determine the quality of a function or activity.
Average means the sum of all the items or observations in a sample divided by the number ofitems in the sample. Synonymous with “sample mean.”

6/27/97 INTRODUCTION TO EIIP
1.8-17EIIP Volume I
Bias is the systematic or persistent distortion of a measurement process or estimation method.
Biogenic Sources are biological sources of emissions such as trees, agricultural crops, ormicrobial activity in soils or water. This term is sometimes used to describe any natural emissionsource.
Chain of Custody is a trail of accountability that documents the physical security of samples,data, and records.
Coefficient of Variation (CV) is the standard deviation expressed as a percentage of the mean. Also see Relative Standard Deviation.
Comparability is the degree to which different methods, data sets, and/or decisions agree or canbe represented as similar; a data quality indicator.
Completeness is the amount of valid data obtained compared to the planned amount, usuallyexpressed as a percentage; a data quality indicator.
Confidence Interval is a range that has a designated probability (i.e., confidence level) ofincluding a specific population parameter.
Correction is an action taken to determine causes of quality defects and to restore properfunctioning of a system or procedure.
Criteria Pollutant refers to a pollutant for which a National Ambient Air Quality Standard(NAAQS) has been set. Criteria pollutants are carbon monoxide (CO), lead (Pb), nitrogen oxides(NO ), Ozone (measured as volatile organic compounds [VOCs]), particulate matter ofx
aerodynamic diameter less than or equal to 10 micrometers (PM ), and sulfur dioxide (SO ).10 2
Data are facts or figures from which conclusions can be inferred; information.
Data Attribute Rating System (DARS) is a system developed by the U.S. EnvironmentalProtection Agency (EPA) to evaluate emissions uncertainty by assigning numerical values to theperceived quality of the emission factors and activity data.
Data Management Plan is a written document prepared prior to inventory development that maybe a part of the quality assurance (QA) plan. It describes the required inventory-developmentrecords, the steps required to produce them, how the records are to be stored, the retentionperiod, the procedures for retrieving them, and the circumstances for their destruction.

INTRODUCTION TO EIIP 6/27/97
1.8-18 EIIP Volume I
Data Quality Indicators are qualitative and quantitative descriptors used to interpret the degreeof acceptability or utility of data to the user. The principal data quality indicators are accuracy,comparability, completeness, and representativeness.
Data Quality Objectives are qualitative and quantitative statements of the level of uncertainty thata decision maker is willing to accept in the estimates and/or decisions made with emissionsinventory data.
Data Reduction is the process of transforming raw data by arithmetic or statistical calculations,standard curves, concentration factors, etc., and collation into a more useful form.
Data Set refers to all observed values in a test or study; data collected under similar conditionsthat can be analyzed as a whole.
Defensible means the ability to withstand reasonable challenge related to the veracity or integrityof documents and derived data.
Emission means pollution discharged into the atmosphere from smokestacks, other vents, andsurface areas of commercial or industrial facilities; from residential chimneys; and from motorvehicle, locomotive, aircraft or other nonroad engines.
Emission Factors are ratios that relate emissions of a pollutant to an activity level at a plant thatcan be easily measured, such as an amount of material processed, or an amount of fuel used. Given an emission factor and a known activity level, a simple multiplication yields an estimate ofthe emissions. Emission factors are developed from separate facilities within an industry category,so they represent typical values for an industry, but do not necessarily represent a specific source. Published emission factors are available in numerous sources.
Emission Inventory is a listing, by source, of the amount of air pollutants discharged into theatmosphere of a community; used to establish emission standards.
Emission Standards are a general type of standard that limit the mass of a pollutant that may be emitted by a source. The most straightforward emissions standard is a simplelimitation on mass of pollutant per unit time (e.g., pounds of pollutant per hour).
Equivalent Method means any method of sampling and analyzing for air pollution that has beendemonstrated to the U.S. Environmental Protection Agency (EPA) Administrator's satisfaction tobe, under specific conditions, an acceptable alternative to normally used reference methods.
Fugitive Emissions are emissions not caught by a capture system.
6/27/97 INTRODUCTION TO EIIP
1.8-19EIIP Volume I
Hazardous Air Pollutants (HAPs) are listed in Section 112(b) of the 1990 Clean Air ActAmendments (CAAA). These pollutants are emitted in smaller quantities than criteria pollutantsbut may be reasonably anticipated to cause cancer, developmental effects, reproductivedysfunctions, neurological disorders, inheritable gene mutations, or other chronically or acutelytoxic effects in humans. The CAAA specifies an initial list of 189 HAPs to be subject to furtherregulation. The list of HAPs includes relatively common pollutants such as formaldehyde,chlorine, methanol, and asbestos, as well as numerous less-common substances. Pollutants may,under certain circumstances, be added to or deleted from the list.
Inventory Work Plan is a document that discusses staff assignments and responsibilities,establishes a commitment to the inventory development and quality assurance/quality control(QA/QC) processes, and establishes a commitment to personnel training and projectdocumentation requirements. It may either be integrated with the quality assurance plan (QAP)or a separate document.
Level I, II, III, and IV Inventories refer to categories delineated by the Emission InventoryImprovement Program (EIIP) Quality Assurance (QA) Committee based on the intended use ofthe inventory. Level I inventories are used to support enforcement, compliance, or litigationactivities. Level II inventories provide supportive data for strategic decision making or standardsetting. Level III inventories are developed for general assessments or research that will not beused in direct support of decision making. Level IV inventories are compiled entirely frompreviously published data or other inventories, and no original data are gathered.
Mean is synonymous with “average.” Also called “arithmetic mean.”
Measurement/Method Attribute is one of the four Data Attribute Rating System (DARS) dataattributes. It explicitly addresses the quality of the factor, not how it is applied.
Median is that value above which and below which half the sample population lies, in otherwords, the value of the variable in an ordered array that has an equal number of observations oneach side of it.
Mobile Source means any nonstationary source of air pollution such as cars, trucks, motorcycles,buses, airplanes, ships and boats, locomotives, and equipment with internal combustion engines.
Mode is the value represented by the greatest number of observations in a sample population.
Nonparametric Technique is one that does not depend upon data being drawn from a specificdistribution, such as the normal or log-normal, for its validity; a distribution-free technique.

INTRODUCTION TO EIIP 6/27/97
1.8-20 EIIP Volume I
Nonroad Emissions are pollutants emitted by internal combustion engines on farm andconstruction equipment, gasoline-powered lawn and garden equipment, and power boats andoutboard motors. Also includes pollutants emitted by airplanes, ships, and locomotives.
Normal Distribution is a probability density function that approximates the distribution of manyrandom variables associated with measurements of natural phenomena and takes the form of asymmetric “bell-shaped curve.”
Observation refers to a fact or occurrence that is recognized and recorded.
Onroad Emissions are pollutants emitted by nonstationary sources of air pollution such as cars,trucks, motorcycles, and buses.
Outlier is an observation that does not conform to the pattern established by other observations ina data set.
Parameter is a variable, measurable property whose value is a determinant of the characteristicsof a system (e.g., temperature, pressure, and density are parameters of the atmosphere).
Performance Audit is a quantitative appraisal of quality that includes the use of an objectivestandard or set of data to evaluate the effectiveness or accuracy of a system or procedure.
Point Sources are large, stationary, identifiable sources of emissions that release pollutants intothe atmosphere. Sources are often defined by state or local air regulatory agencies as pointsources when they annually emit more than a specified amount of a given pollutant, and how stateand local agencies define point sources can vary. Point sources are typically large manufacturingor production plants. They typically include both confined “stack” emission points as well asindividual unconfined “fugitive” emission sources.
Within a given point source, there may be several emission points that make up the point source. Emissions point refers to a specific stack, vent, or other discrete point of pollution release. Thisterm should not be confused with point source, which is a regulatory distinction from area andmobile sources. The characterization of point sources into multiple emissions points is useful forallowing more detailed reporting of emissions information.
For point sources, the emission estimate reporting system used by most state and local airregulatory agencies groups emission sources into one of three categories and maintains emission-related data in a different format for each. The three categories are plant level, point level, andprocess or segment level.

6/27/97 INTRODUCTION TO EIIP
1.8-21EIIP Volume I
Population means all possible items or units that possess a variable of interest and from whichsamples may be drawn.
Precision is (1) a measure of the closeness of agreement among individual measurements, and(2) the closeness of repeated measurements of the same quantity.
Prevention is an orderly program of planning and positive actions taken before or during theconduct of procedures to ensure that the procedures are effectively meeting the requirements forwhich they are intended.
Probability Sampling is the use of a specific method of random selection of population units formeasurement.
Procedural Audit is an objective assessment of compliance to procedural requirements.
Quality is the sum of features and properties/characteristics of a product or service that bear onits ability to satisfy stated needs.
Quality Assurance (QA) is a planned system of activities designed to provide assurance that thequality control program is actually effective.
Quality Assurance Manual is a written document that identifies the policies, organization,objectives, functional activities, and specific quality assurance activities designed to achieve thequality goal desired.
Quality Assurance Objectives are project goals for accuracy, precision, completeness,representativeness, and comparability of data gathered during testing.
Quality Assurance Plan (QAP) is a formal document describing the management policies,objectives, principles, organizational authority, responsibilities, accountability, and implementationplan of an agency or company for ensuring quality in its products and usefulness to its users.
Quality Control (QC) is a planned system of activities whose purpose is to provide qualityservices or products.
Quality Trilogy refers to planning, control, and improvement.
Random Measurement Uncertainty refers to unpredictable deviation from the true value of aparameter being measured.

INTRODUCTION TO EIIP 6/27/97
1.8-22 EIIP Volume I
Random Sampling Error is the variation in an estimated quantity due to the random selection ofparameters for measurement.
Reference Method is a sampling and/or measurement method that has been officially specified byan organization as meeting its data quality requirements.
Relative Standard Deviation is the standard deviation expressed as a percentage of the meanrecovery (i.e., the coefficient of variation multiplied by 100).
Representativeness means that an inventory is representative of the region and sources it is meantto cover; a data quality indicator.
Representative Sample refers to a sample that reflects the variable of interest in the population asaccurately and precisely as possible. To ensure representativeness, the sample may be eithercompletely random or stratified depending upon the conceptualized population and the samplingobjective.
Representative Unit means one selected from the target population that in combination with otherrepresentative units will give an accurate picture of the phenomenon being studied.
Sample refers to a representative part of a large whole or a single item of a group; a finite part orsubset of a statistical population. A sample serves to provide data or information from which areinferred the properties of the whole group or population.
Sample Mean. See Average.
Sample Variance (Statistical) means a measure of the dispersion of a set of values. The sum ofthe squares of the difference between the individual values of a set and the arithmetic mean of theset divided by one less than the number of values in the set. (This is equal to the square of thesample standard deviation.)
Sampled Population is a set of population units available for measurement.
Sampling Error refers to that portion of the difference between a population value and anestimate thereof that is due to only a limited number of all possible values being observed. This isdistinguished from errors due to imperfect selection, bias in response, or errors of observation,measurement, or recording, etc.

6/27/97 INTRODUCTION TO EIIP
1.8-23EIIP Volume I
Source Specificity Attribute is one of the four Data Attribute Rating System (DARS) dataattributes. It refers to how specific the original factor or activity surrogate is to the source beingestimated.
Spatial Congruity Attribute is one of the four Data Attribute Rating System (DARS) dataattributes. It addresses the spatial scaling of factors and activity data that is common toinventories.
Standard Deviation (s.d.) is the most common measure of the dispersion or imprecision ofobserved values expressed as the positive square root of the variance. See Sample Variance.
Standard Error is the standard deviation of a statistic, usually used to designate the standarddeviation of a sample mean.
Standard Method is an assemblage of techniques and procedures based on consensus or othercriteria, often evaluated for its reliability by collaborative testing and receiving organizationalapproval.
Standard Operating Procedures (SOPs) refer to a written document that details the method ofan operation, analysis, or action whose techniques and procedures are thoroughly prescribed andthat is accepted as the method for performing certain routine or repetitive tasks.
State Implementation Plan (SIP) is a state plan approved by the U.S. Environmental ProtectionAgency for the establishment, regulation, and enforcement of air pollution standards.
Stationary Source is a fixed-site producer of pollution, including power plants and other majorsources such as industrial manufacturing facilities as well as area sources.
Statistic is an estimate of a population characteristic calculated from a data set (observed orcorrected values) (e.g., the mean or standard deviation).
Statistical Bias refers to a discrepancy between the expected value of an estimator and thepopulation parameter being estimated.
Statistical Checks mean a miscellaneous set of tools/procedures that are part of quality assurance. Also referred to as “statistical quality control.”
Stratification means the division of a target population into subsets or strata that are moreinternally homogeneous with respect to the characteristic to be studied than with the populationas a whole.
INTRODUCTION TO EIIP 6/27/97
1.8-24 EIIP Volume I
Stratified Sampling is the sampling of a population that has been stratified, with part of thesample coming from each stratum. See Stratification.
Systems Audit is an on-site evaluation or assessment of the quality control program developed fora project or laboratory. The audit is conducted by a trained auditor who is not directly involvedin the conduct of the work.
Systematic Error is a consistent deviation in the result from the expected or known value. Sucherror is caused by human and methodological bias.
Target Population refers to the set of N population units for which inferences will be made.
Technical Systems Audit is an on-site audit of a company's quality assurance system, physicalfacilities, and implementation of approved procedures.
Temporal Congruity Attribute is one of the four Data Attribute Rating System (DARS) dataattributes. It describes the relationship between emission factor, activity, and temporal scale ofthe inventory.
Total Quality Management is a system of activities designed to provide continuous improvementat every level and in all areas of responsibility.
Trimmed Mean is the arithmetic mean of the data remaining after a specified percentage of the ndata in both tails of the distribution curve are discarded.
Uncertainty comprises two types of errors in estimation: bias and imprecision.
Uncertainty Analysis is conducted to identify and quantify the various sources of variability andinaccuracies in data used to estimate emissions. It includes an assessment of bias and imprecision.
Validated Method is a method that has been determined to meet certain performance criteria forsampling and/or measurement operations.
Variable is an entity subject to variation or change.
Variance is a fundamental statistical measure of dispersion, calculated by summing the standarddeviation of each sample from the mean and dividing that sum by the number of observations inthe sample.

6/27/97 INTRODUCTION TO EIIP
1.8-25EIIP Volume I
This page is intentionally left blank.

INTRODUCTION TO EIIP 6/27/97
EIIP Volume I
APPENDIX A
EMISSION INVENTORY IMPROVEMENT PROGRAMCOMMITTEE MEMBER LIST

6/27/97 INTRODUCTION TO EIIP
EIIP Volume I
This page is intentionally left blank.

6/27/97 INTRODUCTION TO EIIP
A-1EIIP Volume I
EIIP COMMITTEE MEMBERS
STEERING COMMITTEE
Steve BrombergEmission Factor and Inventory Group (MD-14)Environmental Protection AgencyResearch Triangle Park, NC 27711Phone: (919) 541-1000Fax: (919) 541-0684
Cyril DurrenbergerAir Quality Planning DivisionTexas Natural Resource Conservation Commission12100 Park 35 CirclePost Office Box 13087Austin, TX 78753-3087Phone: (512) 239-1482Fax: (512) 239-1500
Linda MurchisonCalifornia Air Resources BoardPost Office Box 2815Sacramento, CA 95812Phone: (916) 322-6021Fax: (916) 323-1075
Roger WestmanAllegheny County Health Department301 39th StreetPittsburgh, PA 15201Phone: (412) 578-8103Fax: (412) 578-8144

INTRODUCTION TO EIIP 6/27/97
A-2 EIIP Volume I
STEERING COMMITTEE (Continued)
Donald ArkellLane Regional Air Pollution Authority225 North 5thSuite 501Springfield, OR 97477Phone: (541) 726-2514Fax: (541) 726-1205
Darryl TylerDivision of Air and Waste ManagementState of Delaware89 Kings HighwayPost Office Box 1401Dover, DE 19903Phone: (302) 739-4791Fax: (302) 739-3106
Herb SherrowEnvironmental Protection Agency, Region 6First International Bank Tower at Fountain PlaceMail Code 6PD-L1445 Ross AvenueDallas, TX 75202-2733Phone: (214) 665-7237Fax: (214) 665-7263
6/27/97 INTRODUCTION TO EIIP
A-3EIIP Volume I
POINT SOURCES COMMITTEE
Co-chairs
Dennis Beauregard Emission Factor and Inventory Group (MD-14)Environmental Protection AgencyResearch Triangle Park, NC 27711E-Mail: [email protected]: (919) 541-5512Fax: (919) 541-0684
Bill Gill Emissions Inventory Section Texas Natural Resource Conservation Commission12100 Park 35 CirclePost Office Box 13087Austin, TX 78711-3087(Federal Express ZIP Code 78753)E-Mail: [email protected]: (512) 239-5750Fax: (512) 239-1515
Members
Denise Alston-GuidenGalson Consulting6601 Kirkville RoadSyracuse, NY 13057E-Mail: [email protected]: (800) 724-0669 or (315) 432-0506 (ext. 119)Fax: (315) 437-0509
Bob BettertonSouth Carolina Department of Health and Environmental ControlBureau of Air Quality2600 Bull StreetColumbia, SC 29201 E-Mail: [email protected]: (803) 734-4549Fax: (803) 734-4556

INTRODUCTION TO EIIP 6/27/97
A-4 EIIP Volume I
POINT SOURCES COMMITTEE (Continued)
Paul BrochiEmissions Inventory SectionTexas Natural Resource Conservation Commission12100 Park 35 CirclePost Office Box 13087 Austin, TX 78711-3087(Federal Express Zip Code 78753)E-Mail: [email protected]: (512) 239-1942Fax: (512) 239-1515
Alice FredlundLouisiana Department of Environmental QualityAir Quality/Technical Services Post Office Box 82135Baton Rouge, LA 70884-2135E-Mail: [email protected]: (504) 763-3955Fax: (504) 765-0222
Gary HelmAir Quality Management, Inc.Post Office Box 8Macungie, PA 18062E-Mail: [email protected]: (610) 967-1688Fax: (610) 967-0308
Paul KimAir Quality DivisionCompliance Determination UnitMinnesota Pollution Control Agency520 Lafayette RoadSt. Paul, MN 55155E-Mail: [email protected]: (612) 296-7320 Fax: (612) 297-7709

6/27/97 INTRODUCTION TO EIIP
A-5EIIP Volume I
POINT SOURCES COMMITTEE (Continued)
Toch MangatBay Area Air Quality Management DistrictPlanning Department939 Ellis StreetSan Francisco, CA 94109E-Mail: [email protected]: (415) 749-4651Fax: (415) 749-4741
Ralph PattersonWisconsin Department of Natural Resources101 South Webster Street7th FloorPost Office Box 7921Madison, WI 53707E-Mail: [email protected]: (608) 267-7546 Fax: (608) 267-0560
Eitan TsabariCity of OmahaAir Quality Control Division5600 South 10th StreetOmaha, NE 68107E-Mail: [email protected]: (402) 444-6015Fax: (402) 444-6016

INTRODUCTION TO EIIP 6/27/97
A-6 EIIP Volume I
POINT SOURCES COMMITTEE (Continued)
Jim SoutherlandNorth Carolina Department of Environment, Health and Natural ResourcesAir Quality DivisionPost Office Box 29580Raleigh, NC 27626-0580Federal Express Address:2728 Capital BoulevardParker Lincoln BuildingRaleigh, NC 27604E-Mail: [email protected]: (919) 715-7566Fax: (919) 715-7476
Robert WootenNorth Carolina Department of Environment, Health and Natural ResourcesAir Quality SectionPost Office Box 29580Raleigh, NC 27626-0580E-Mail: [email protected] Express Address:2728 Capital Blvd.Parker Lincoln BuildingRaleigh, NC 27604Phone: (919) 733-1815Fax: (919) 715-7476

6/27/97 INTRODUCTION TO EIIP
A-7EIIP Volume I
AREA SOURCES COMMITTEE
Co-chairs
Carolyn LozoCalifornia Air Resources BoardTechnical SupportPost Office Box 28152020 L StreetSacramento, CA 95814-4219Email: [email protected]: (916) 323-8372Fax: (916) 323-1075
Charles MannOffice of Research and DevelopmentAir Pollution Prevention and Control Division (MD-61)Environmental Protection Agency Research Triangle Park, NC 27711Email: [email protected] or [email protected]: (919) 541-4593Fax: (919) 541-7891
Members
Linda MurchisonCalifornia Air Resources Board2020 L StreetPost Office Box 2815Sacramento, CA 95812Phone: (916) 322-6021Fax: (916) 323-1075
Kwame AgyeiPuget Sound Air Pollution Control Agency110 Union Street, Suite 500Seattle, WA 98101-2038Phone: (206) 689-4054Fax: (206) 343-7522

INTRODUCTION TO EIIP 6/27/97
A-8 EIIP Volume I
AREA SOURCES COMMITTEE (Continued)
Mike FishburnTexas Natural Resource Conservation CommissionEmissions Inventory (MC-164)Post Office Box 13087Austin, TX 78711-3087Email: [email protected]: (512) 239-1934Fax: (512) 239-1515
Gwen JudsonWisconsin Department of Natural ResourceAir Management101 South Webster StreetPost Office Box 7921Madison, WI 53707-7921Email: [email protected]: (608) 266-1595Fax: (608) 267-0560
Sally OttersonWashington Department of EcologyPost Office Box 47600Olympia, WA 98504-7600Email: [email protected]: (360) 407-6806Fax: (360) 407-6802
Lee ToolyEmission Factor and Inventory Group, OAQPS (MD-14)Environmental Protection Agency Research Triangle Park, NC 27711Email: [email protected]: (919) 541-5292Fax: (919) 541-0684

6/27/97 INTRODUCTION TO EIIP
A-9EIIP Volume I
AREA SOURCES COMMITTEE (Continued)
Jim WilkinsonMaryland Department of the EnvironmentAir Management Administration2500 Broening HighwayBaltimore, MD 21224Phone: (410) 631-3245Fax: (410) 631-3202
George LeneyAllegheny County Health Department301 39th StreetPittsburgh, PA 15201Phone: (412) 578-8131Fax: (412) 578-8144
Charles MasserOffice of Research and DevelopmentAir Pollution Prevention and Control Division (MD-61)Environmental Protection AgencyResearch Triangle Park, NC 27711Email: [email protected]: (919) 541-7586Fax: (919) 541-7891
Richard BodeCalifornia Air Resources BoardTechnical SupportPost Office Box 28152020 L StreetSacramento, CA 95814-4219Email: [email protected]: (916) 322-3807Fax: (916) 323-1075
INTRODUCTION TO EIIP 6/27/97
A-10 EIIP Volume I
MOBILE SOURCES COMMITTEE
Co-chairs
Rob AltenburgDepartment of Environmental ProtectionBureau of Air QualityPost Office Box 8468Market Street State Office Building, 12th Floor400 Market StreetHarrisburg, PA 17105-8468Email: [email protected]: (717) 787-4310Fax: (717) 772-2303
Greg JanssenOffice of Mobile SourcesEnvironmental Protection Agency 2565 Plymouth Road/AATSBAnn Arbor, MI 48105Email: [email protected]: (313) 668-4285Fax: (313) 668-4368
Members
Kwame AgyeiPuget Sound Air Pollution Control110 Union StreetSuite 500Seattle, WA 98101Phone: (206) 689-4054Fax: (206) 343-7522
Mark JanssenLake Michigan Air Directors Consortium (LADCO)2350 East Devon AvenueSuite 242Des Plains, IL 60018Email: [email protected]: (847) 296-2181Fax: (847) 296-2958

6/27/97 INTRODUCTION TO EIIP
A-11EIIP Volume I
MOBILE SOURCES COMMITTEE (Continued)
Tom KearneyNew York Department of TransportationBuilding 4, Room 1041220 Washington AvenueAlbany, NY 12232Phone: (518) 457-7203Fax: (518) 457-8317
Wienke TaxEnvironmental Protection Agency, Region 975 Hawthorne Street (A-2-1)San Francisco, CA 94105Email: [email protected]: (415) 744-1232Fax: (415) 744-1076
Kim FisherFHWA400 7th Street, SouthwestWashington, DC 20590Phone: (202) 366-5843Fax: (202) 366-4054
Lynne HamlinTexas Natural Resource Conservation CommissionPost Office Box 13087Austin, TX 78711-3087E-Mail: [email protected]: (512) 239-1951Fax: (512) 239-1500
David H. LaxSenior Environmental ScientistAmerican Petroleum Institute1220 L. Street, NorthwestWashington, DC 20005Phone: (202) 682-8479Fax: (202) 682-8270
INTRODUCTION TO EIIP 6/27/97
A-12 EIIP Volume I
BIOGENIC SOURCES COMMITTEE
Co-chair
Tom PierceModeling Systems Analysis Branch (MSAB)Environmental Protection AgencyResearch Triangle Park, NC 27711Phone: (919) 541-1375Fax: (919) 541-1379
Members
Janet AreyState Wide Air Pollution Research CenterUniversity of California-RiversideRiverside, CA 92521
Marianne CausleySystems Applications International101 Lucas Valley RoadSan Rafael, CA 94903
Alex GuentherAtmospheric Chemistry DivisionNational Center for Atmospheric ResearchPost Office Box 3000Boulder, CO 80307
Gordon HutchinsonU.S. Department of Agriculture - ARSNPA Federal Building301 South HowesRoom 435 POBEFort Collins, CO 80522
6/27/97 INTRODUCTION TO EIIP
A-13EIIP Volume I
BIOGENIC SOURCES COMMITTEE (Continued)
Richard McNiderEarth System Science LaboratoryUniversity of Alabama-HuntsvilleHuntsville, AL 35899
Michael RogersEarth and Atmospheric SciencesGeorgia TechAtlanta, GA 30332
Thomas SharkeyDepartment of Botany132 Birge Hall430 Lincoln DriveUniversity of WisconsinMadison, WI 53706-1381
Ralph ValenteAtmospheric Science DepartmentTennessee Valley AuthorityChemical Engineering Building 2AMussel Shoals, AL 35660
Eric WilliamsNational Oceanic and Atmospheric AdministrationAeronomyR/E/AL7325 BroadwayBoulder, CO 80303
Patricia ValescoCalifornia Air Resources BoardPost Office Box 2815Sacramento, CA 95812Phone: (916) 327-8170Fax: (916) 327-8524
INTRODUCTION TO EIIP 6/27/97
A-14 EIIP Volume I
BIOGENIC SOURCES COMMITTEE (Continued)
Chris GeronAir Pollution Prevention and Control Division (MD-61)Environmental Protection AgencyResearch Triangle Park, NC 27711Phone: (919) 541-4639Fax: (919) 541-5227
Cari FurinessNorth Carolina State UniversityBox 8002Raleigh, NC 27695-8002

6/27/97 INTRODUCTION TO EIIP
A-15EIIP Volume I
QUALITY ASSURANCE COMMITTEE
Co-chairs
Tom BallouVirginia Department of Environmental Quality629 East Main StreetEighth FloorRichmond, VA 23219E-Mail: [email protected]: (804) 698-4406Fax: (804) 698-4510
William B. KuykendalEmission Factor and Inventory Group, TSD, OAQPS (MD-14)Environmental Protection AgencyResearch Triangle Park, NC 27711E-Mail: [email protected]: (919) 541-5372Fax: (919) 541-0684
Members
Lee BeckAir Pollution Prevention and Control Division (MD-63)Environmental Protection Agency Research Triangle Park, NC 27711E-Mail: [email protected]: (919) 541-0617Fax: (919) 541-7885

INTRODUCTION TO EIIP 6/27/97
A-16 EIIP Volume I
QUALITY ASSURANCE COMMITTEE (Continued)
Victoria ChandlerNorth Carolina Department of Environment, Health and Natural ResourcesAir Quality SectionPost Office Box 29580Raleigh, NC 27626-0580Federal Express Address:2728 Capital Blvd.Parker Lincoln BuildingRaleigh, NC 27604E-Mail: [email protected]: (919) 715-0972Fax: (919) 715-7476
Dale ShimpCalifornia Air Resources BoardTechnical Support DivisionPost Office Box 2815Sacramento, CA 95812E-Mail: [email protected]: (916) 324-7156Fax: (916) 323-1075, if no answer (916) 327-8524
Mena ShahCalifornia Air Resources BoardTechnical Support DivisionPost Office Box 2815Sacramento, CA 95812E-Mail: [email protected]: Fax: 916-327-8524
Jim TomichBay Area Air Quality Management District939 Ellis StreetSan Francisco, CA 94109E-Mail: [email protected]: (415) 749-4682Fax: (415) 749-4949

6/27/97 INTRODUCTION TO EIIP
A-17EIIP Volume I
QUALITY ASSURANCE COMMITTEE (Continued)
Sheila HolmanNorth Carolina Department of Environment, Health and Natural ResourcesAir Quality SectionPost Office Box 29580Raleigh, NC 27626-0580Federal Express Address:2728 Capital Blvd.Parker Lincoln BuildingRaleigh, NC 27604E-Mail: [email protected]: (919) 715-0971Fax: (919) 733-1812
Denise BienOhio Department of Environmental Services1632 Central ParkwayCincinnati, OH 45210E-Mail: [email protected]: (513) 333-4706Fax: (513) 651-9528

INTRODUCTION TO EIIP 6/27/97
A-18 EIIP Volume I
DATA MANAGEMENT COMMITTEE
Co-chairs
John SladePennsylvania Department of Environmental ResourcesBureau of Air QualityPost Office Box 8468400 Market Street, 12th FloorHarrisburg, PA 17105-8468E-Mail: [email protected]: (717) 783-9476Fax: (717) 772-2303
Lee ToolyEmission Factor and Inventory Group, (MD-14)Environmental Protection AgencyResearch Triangle Park, NC 27711E-Mail: [email protected]: (919) 541-5292Fax: (919) 541-0684
Members
Cheryl TaylorCalifornia Air Resources BoardPost Office Box 2815Sacramento, CA 95812Phone: (916) 324-7168Fax: (916) 323-1075

6/27/97 INTRODUCTION TO EIIP
A-19EIIP Volume I
DATA MANAGEMENT COMMITTEE (Continued)
Geoff Malone Merck1 Merck DrivePost Office Box 100Mail Drop WS1E-12Whitehouse Station, NJ 08889-0100E-Mail: [email protected]: (908) 423-5061Fax: (908) 735-1151
Trace TerrinMaricopa County Air Pollution Control2406 South 24th StreetSuite E 214Phoenix, AZ 85034E-Mail: [email protected]: (602) 506-6883Fax: (602) 506-6179
Carrie EastmanPennsylvania Department of Environmental ResourcesBureau of Air QualityPost Office Box 8468400 Market Street, 12th FloorHarrisburg, PA 17105-8468E-Mail: [email protected]:Fax:
Chuck IsbellITPID/Information Management GroupOAQPS (MD-12)Environmental Protection AgencyResearch Triangle Park, NC 27711Phone: (919) 541-5448Fax: (919) 541-0684

INTRODUCTION TO EIIP 6/27/97
A-20 EIIP Volume I
DATA MANAGEMENT COMMITTEE (Continued)
Mike FishburnTexas Natural Resource Conservation CommissionEmissions Inventory (MC-164)Post Office Box 13087Austin, TX 78711-3087Email: [email protected]: (512) 239-1934Fax: (512) 239-1515
Leo ForetichLouisiana Department of Environmental Quality7290 BluebonnetBaton Rouge, LA 70884-2135Phone: (504) 765-0899Fax: (504) 765-0222

6/27/97 INTRODUCTION TO EIIP
A-21EIIP Volume I
GOVERNMENTAL INTERACTIONS COMMITTEE
Co-chair
Dave MobleyEmission Factor and Inventory Group (MD-14)Environmental Protection Agency Research Triangle Park, NC 27711Phone: (919) 541-4676Fax: (919) 541-0684
Members
Dale KrygielskiCity of ToledoDivision of Air Pollution Control26 Main StreetToledo, OH 43605Phone: (419) 697-5105Fax: (419) 693-2512
Greg JanssenOffice of Mobile SourcesEnvironmental Protection Agency 2565 Plymouth Road/AATSBAnn Arbor, MI 48105Phone: (313) 668-4285Fax: (313) 668-4368
Sterlin WoodardChief, Air ComplianceAir ProgramEnvironmental Protection Commission1410 North 21st StreetTampa, FL 33605Phone: (813) 272-5530Fax: (813) 272-7144
INTRODUCTION TO EIIP 6/27/97
A-22 EIIP Volume I
Herb SherrowEnvironmental Protection Agency, Region VIMail Code 6T-AP1445 Ross Avenue, Suite 1300Dallas, TX 75202-2733Phone: (214) 665-7237Fax: (214) 665-2164