Embed Size (px)
Citation preview
Inventory and monitoring of terrestrial biodiversity:
imperatives, national initiatives and their relevance and opportunities
for sanctuaries
Peter Bellingham and Matt McGlone
Landcare Research, Lincoln
Why monitor? Record how things are changing so we can:
• Know
• Reassure
• Choose
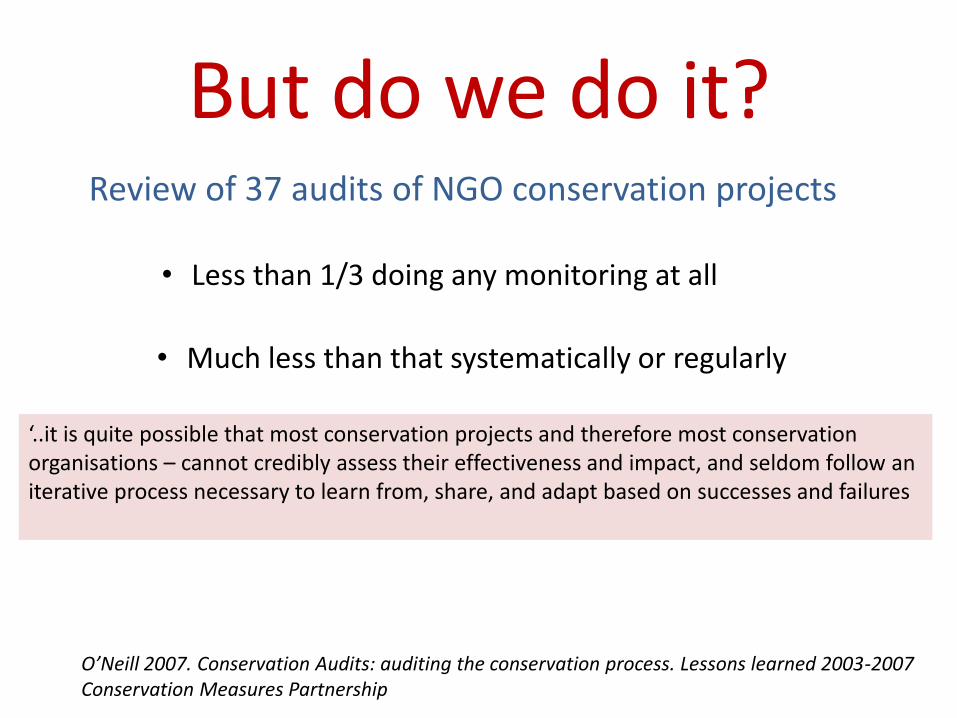
But do we do it?
‘..it is quite possible that most conservation projects and therefore most conservation organisations – cannot credibly assess their effectiveness and impact, and seldom follow an iterative process necessary to learn from, share, and adapt based on successes and failures
Review of 37 audits of NGO conservation projects
• Less than 1/3 doing any monitoring at all
• Much less than that systematically or regularly
O’Neill 2007. Conservation Audits: auditing the conservation process. Lessons learned 2003-2007 Conservation Measures Partnership
Most monitoring is done poorly, fails
or is not even started
Why?
It is expensive
The plural of anecdote is not data
Acquisition, archiving & analysis
of reliable data is never cheap
Costs: Underestimated
Results: Over-anticipated
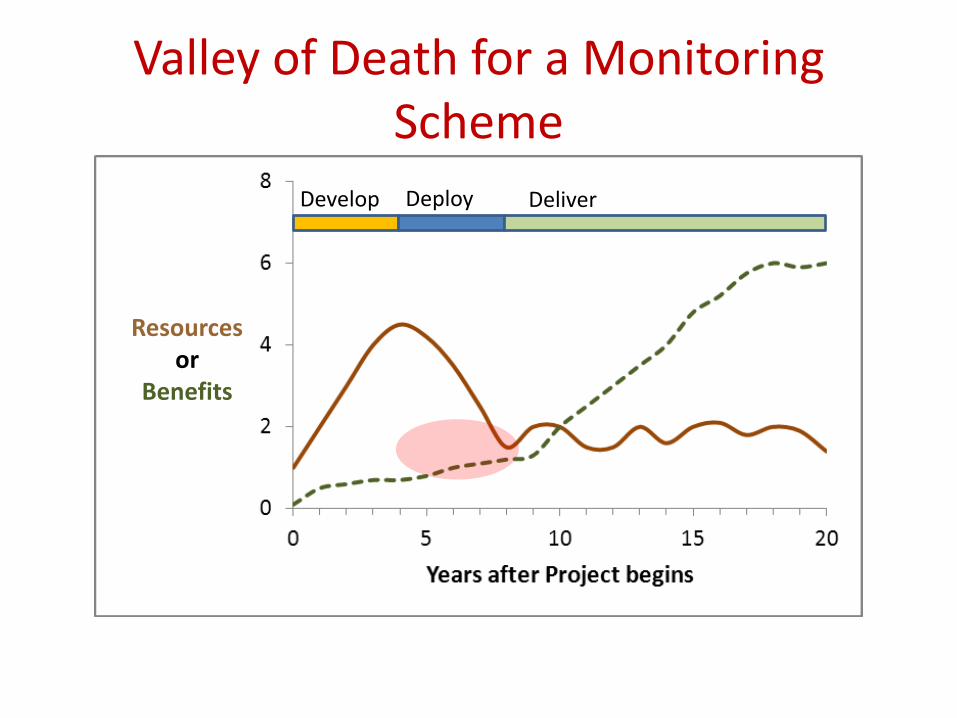
Valley of Death for a Monitoring Scheme
Develop Deploy Deliver
Resources or
Benefits
Normal people hate monitoring
• Takes funding from things they like doing
• Makes them do stuff they don’t like doing
• Reduces autonomy
• Passes judgement
• May conflict with their insights
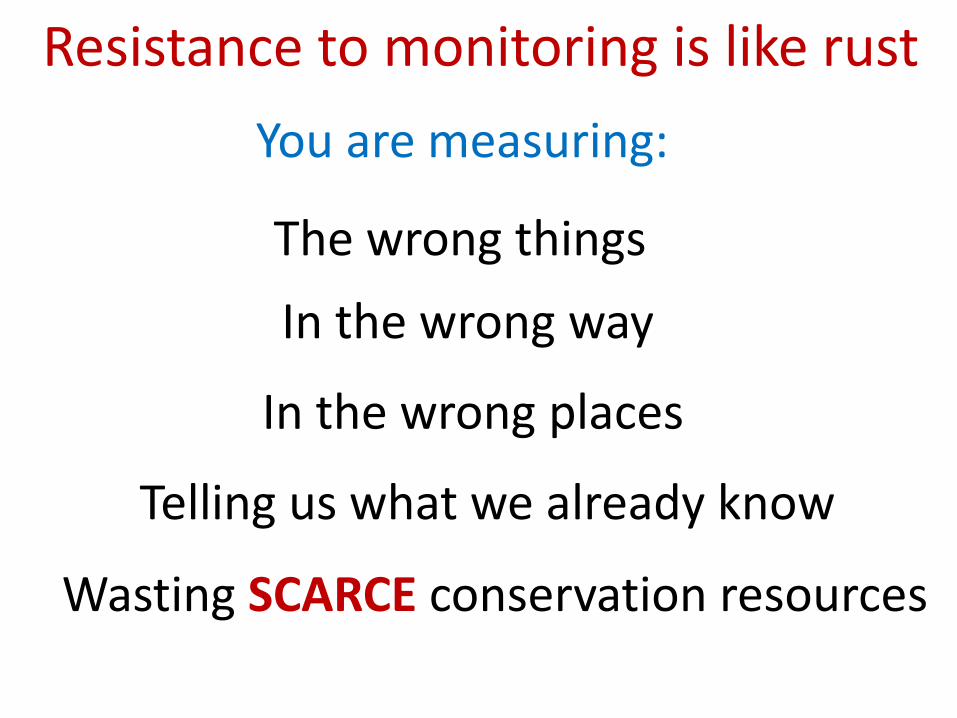
Resistance to monitoring is like rust
You are measuring:
In the wrong places
Telling us what we already know
Wasting SCARCE conservation resources
In the wrong way
The wrong things
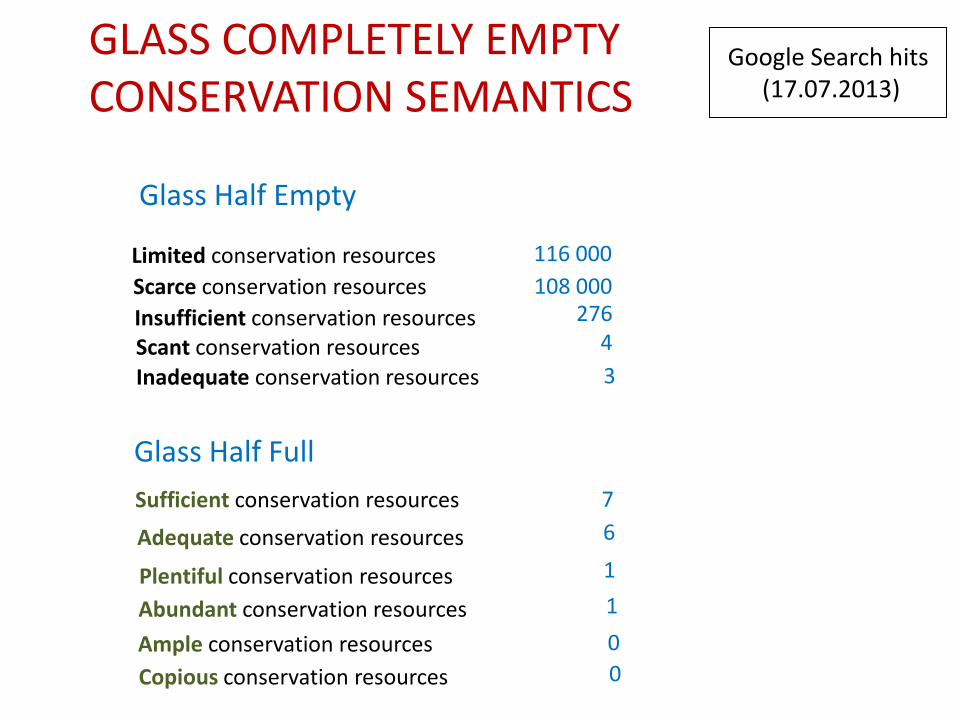
Google Search hits (17.07.2013)
Limited conservation resources
Scarce conservation resources
Insufficient conservation resources Scant conservation resources Inadequate conservation resources
Glass Half Empty
Sufficient conservation resources
Adequate conservation resources
Plentiful conservation resources
Abundant conservation resources
Ample conservation resources
Copious conservation resources
Glass Half Full
116 000
108 000 276
4
3
0
0
1
1
6
7
GLASS COMPLETELY EMPTY CONSERVATION SEMANTICS
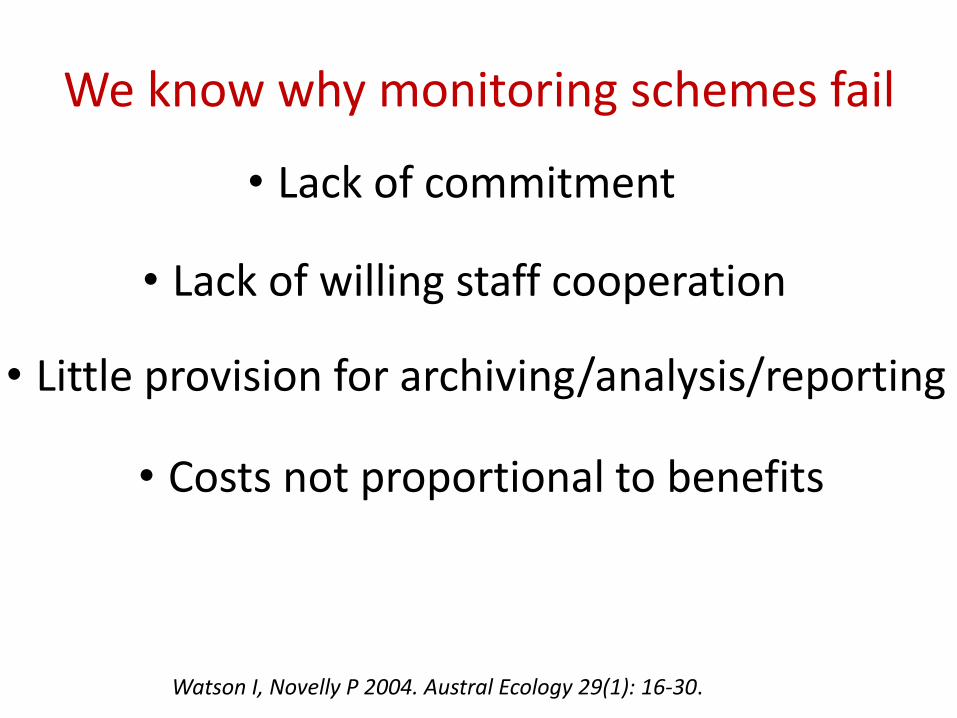
We know why monitoring schemes fail
• Lack of commitment
• Lack of willing staff cooperation
• Costs not proportional to benefits
• Little provision for archiving/analysis/reporting
Watson I, Novelly P 2004. Austral Ecology 29(1): 16-30.
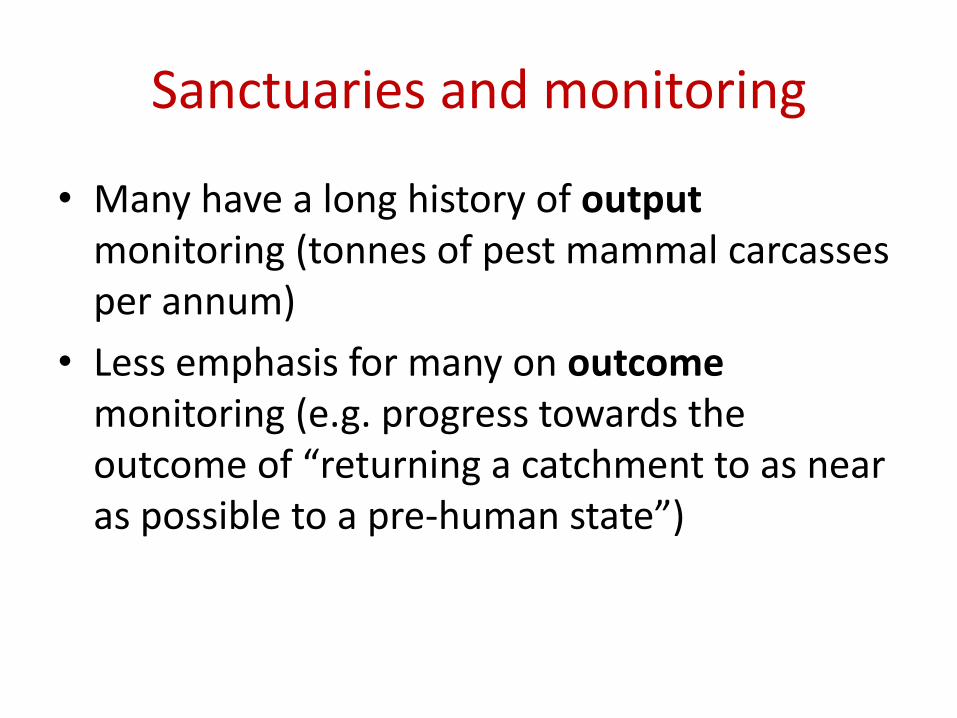
Sanctuaries and monitoring
• Many have a long history of output monitoring (tonnes of pest mammal carcasses per annum)
• Less emphasis for many on outcome monitoring (e.g. progress towards the outcome of “returning a catchment to as near as possible to a pre-human state”)
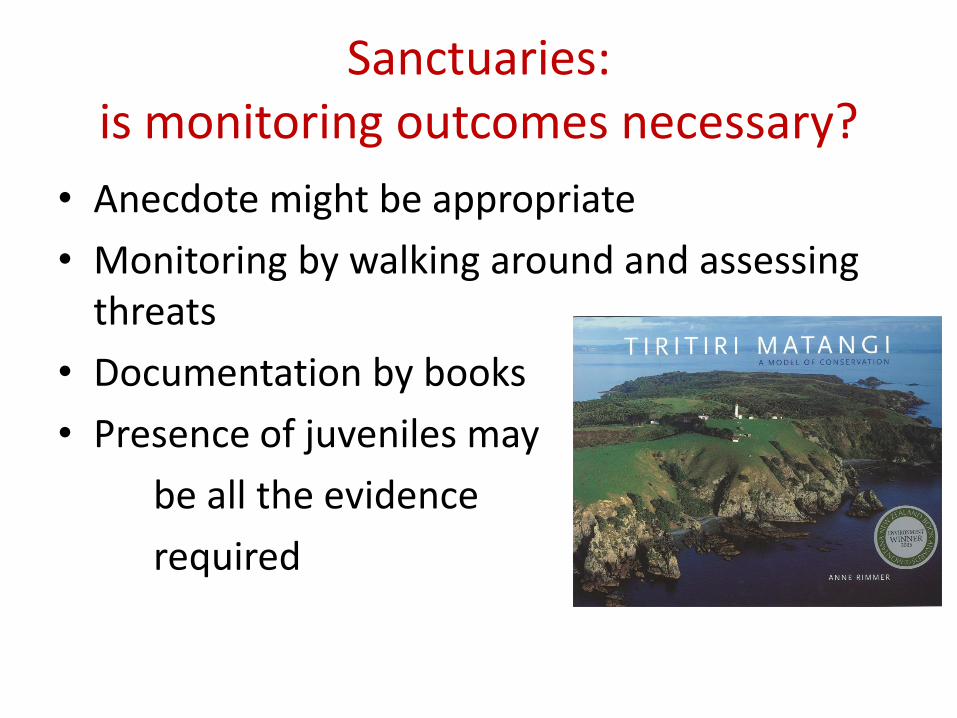
Sanctuaries: is monitoring outcomes necessary?
• Anecdote might be appropriate
• Monitoring by walking around and assessing threats
• Documentation by books
• Presence of juveniles may
be all the evidence
required
Sanctuaries: when might monitoring be necessary?
• When you’re spending public money (central Government, local Government)
• There’s an increasing culture of auditing against claimed outcomes
• When you want to know when to intervene
• When you want to know whether your intervention worked
What is an audit?
Systematic and independent examination
of data, statements, records, operations and
performances
Political/stakeholder demand for:
‘Value for money’ controls
Accountability & transparency
Quality assurance & regulation
Ensuring monitoring is successful
Ensure management support
Ensure audit agency approval
Professionalize monitoring
Separate operational & monitoring budgets
Communicate well & often
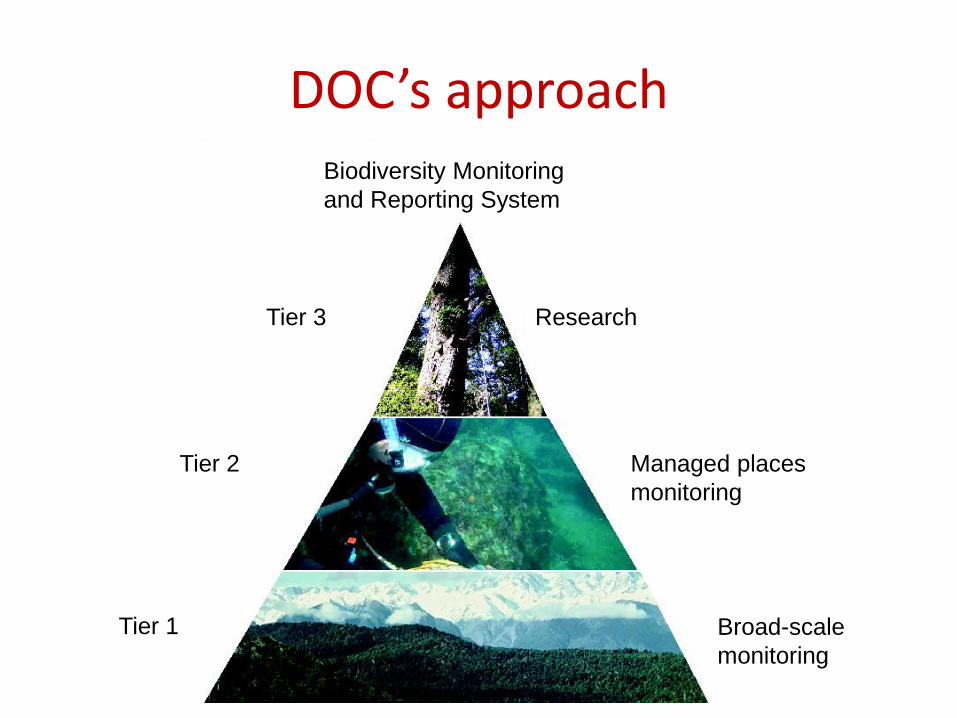
Biodiversity Monitoring
and Reporting System
Research Tier 3
Tier 2
Tier 1
Managed places
monitoring
Broad-scale
monitoring
DOC’s approach
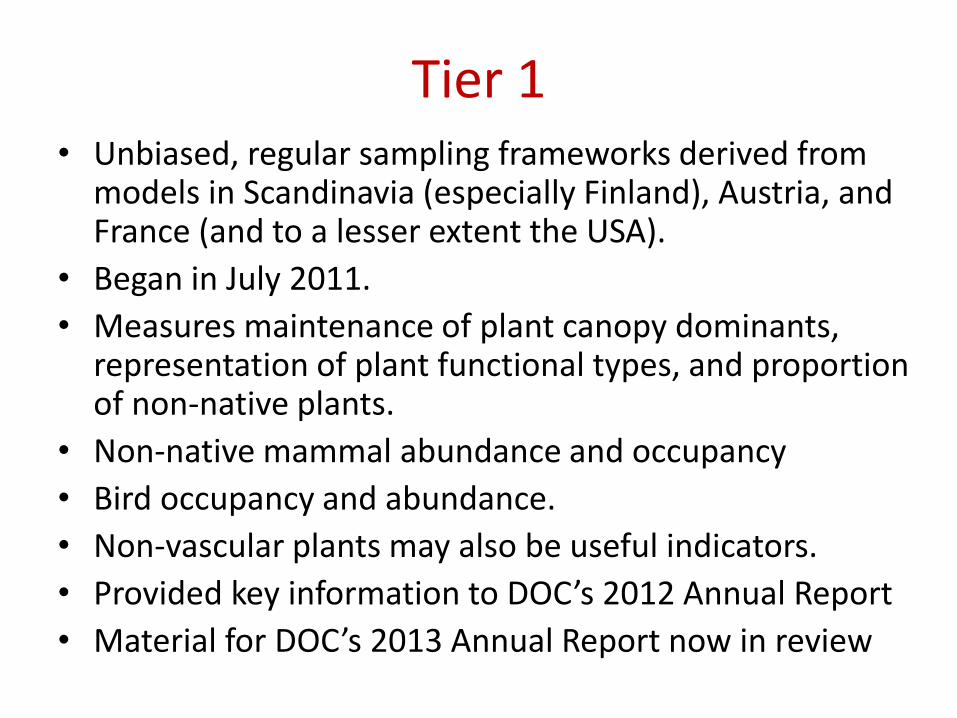
Tier 1 • Unbiased, regular sampling frameworks derived from
models in Scandinavia (especially Finland), Austria, and France (and to a lesser extent the USA).
• Began in July 2011.
• Measures maintenance of plant canopy dominants, representation of plant functional types, and proportion of non-native plants.
• Non-native mammal abundance and occupancy
• Bird occupancy and abundance.
• Non-vascular plants may also be useful indicators.
• Provided key information to DOC’s 2012 Annual Report
• Material for DOC’s 2013 Annual Report now in review
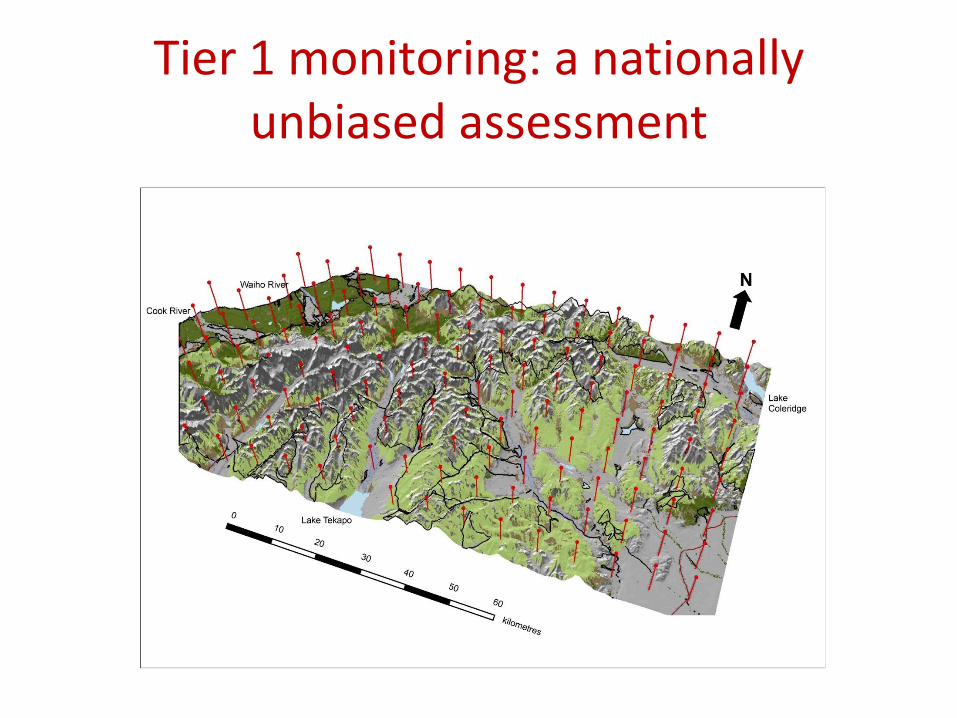
Tier 1 monitoring: a nationally unbiased assessment
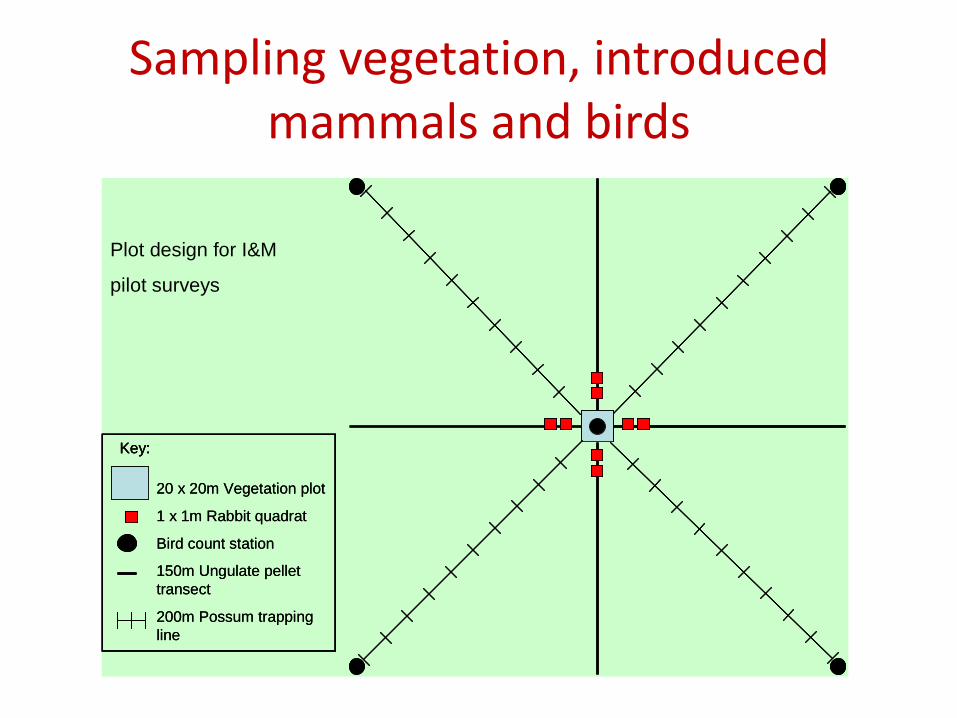
20 x 20m Vegetation plot
1 x 1m Rabbit quadrat
Bird count station
150m Ungulate pellet
transect
200m Possum trapping
line
Key:
20 x 20m Vegetation plot
1 x 1m Rabbit quadrat
Bird count station
150m Ungulate pellet
transect
200m Possum trapping
line
Key:Key:
Plot design for I&M
pilot surveys
Sampling vegetation, introduced mammals and birds
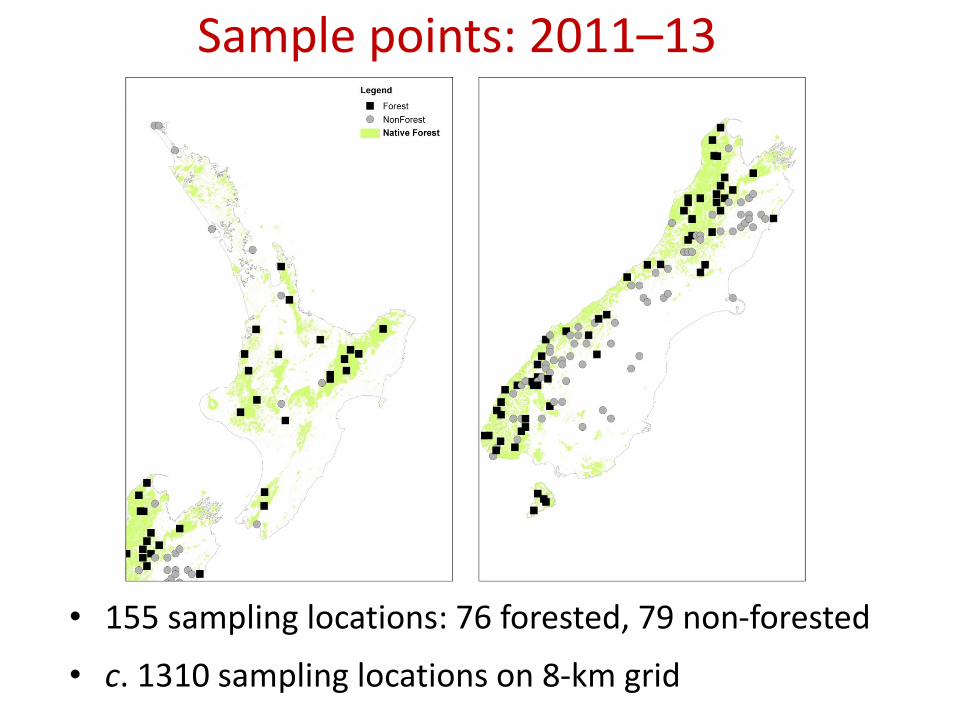
Sample points: 2011–13
• 155 sampling locations: 76 forested, 79 non-forested
• c. 1310 sampling locations on 8-km grid
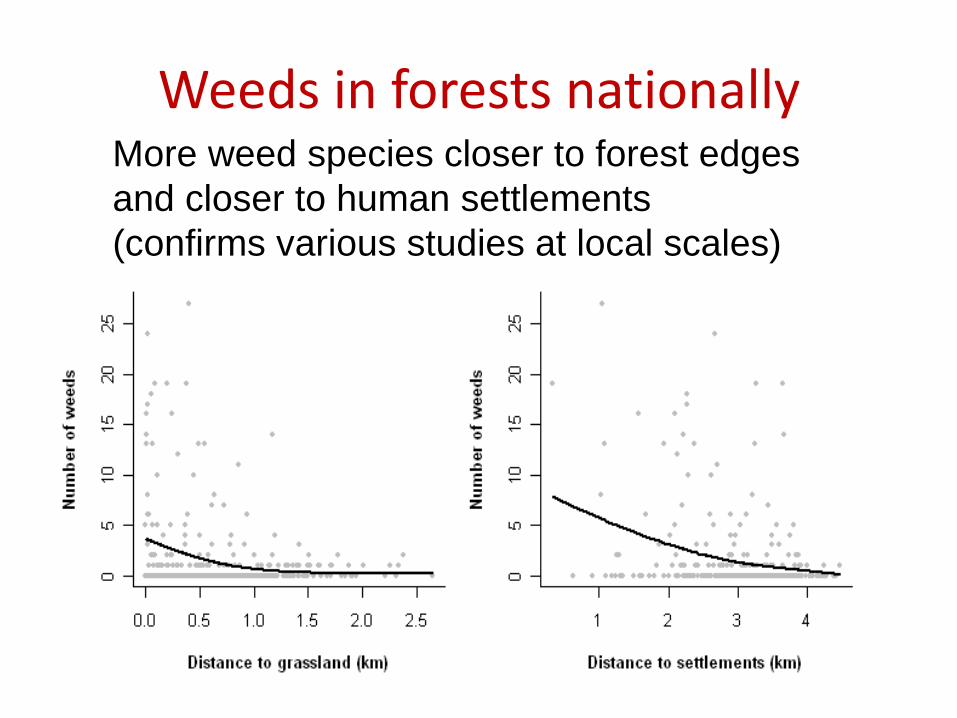
Weeds in forests nationally More weed species closer to forest edges
and closer to human settlements
(confirms various studies at local scales)
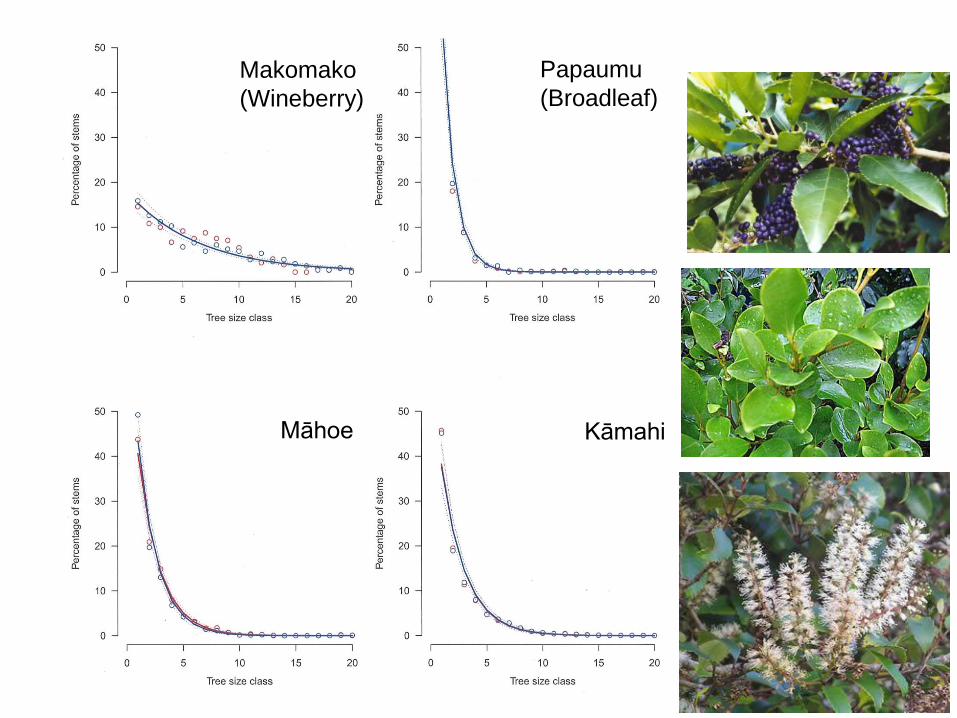
Makomako
(Wineberry)
Papaumu
(Broadleaf)
Māhoe Kāmahi
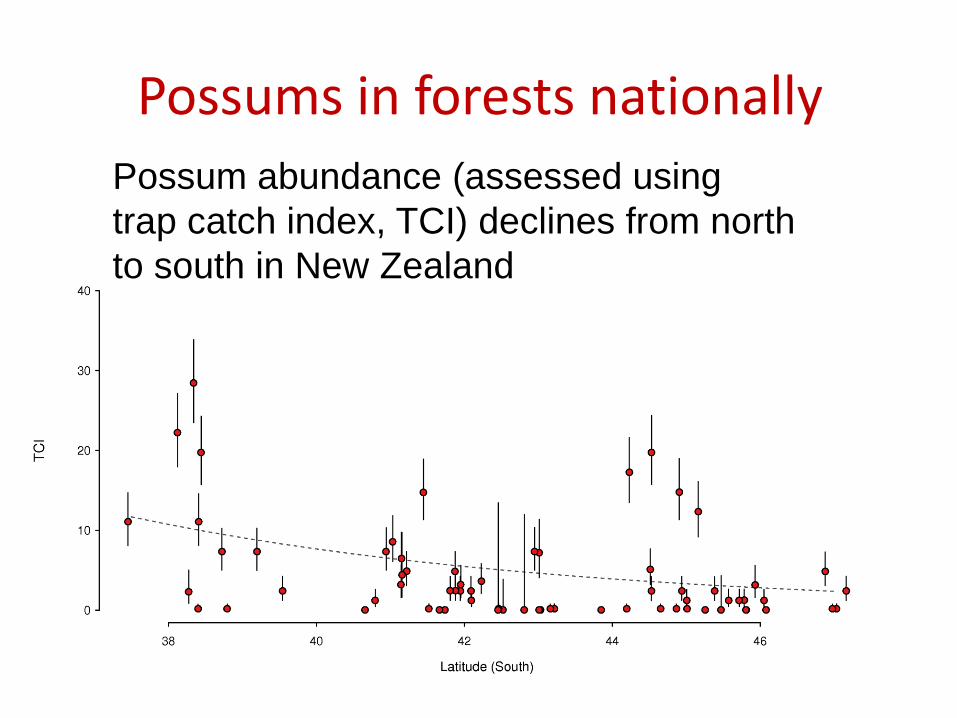
Possums in forests nationally
Possum abundance (assessed using
trap catch index, TCI) declines from north
to south in New Zealand
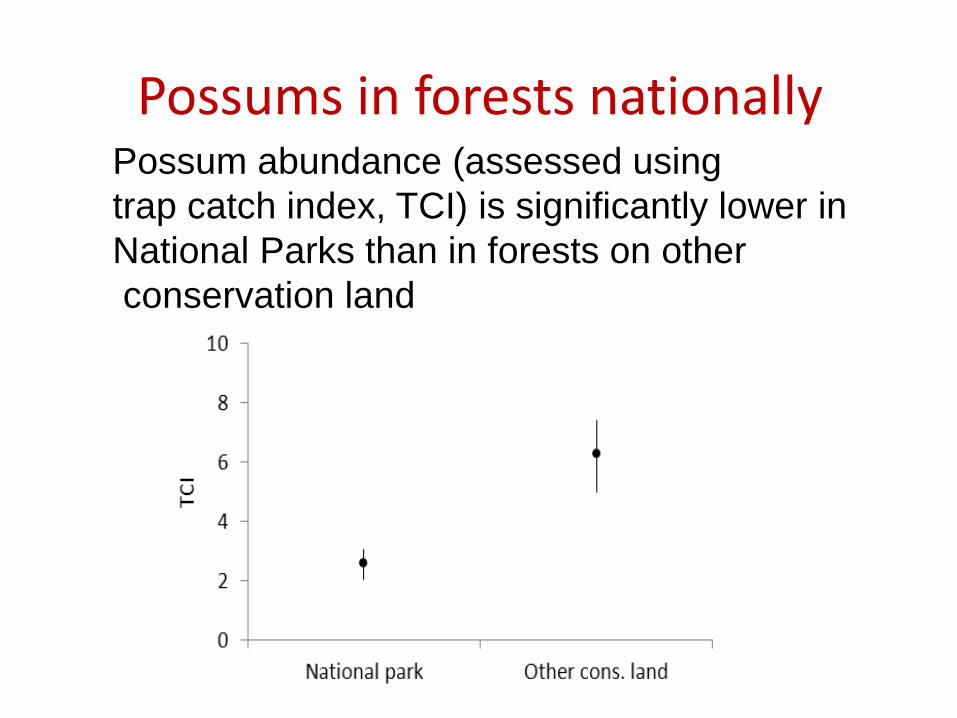
Possums in forests nationally Possum abundance (assessed using
trap catch index, TCI) is significantly lower in
National Parks than in forests on other
conservation land
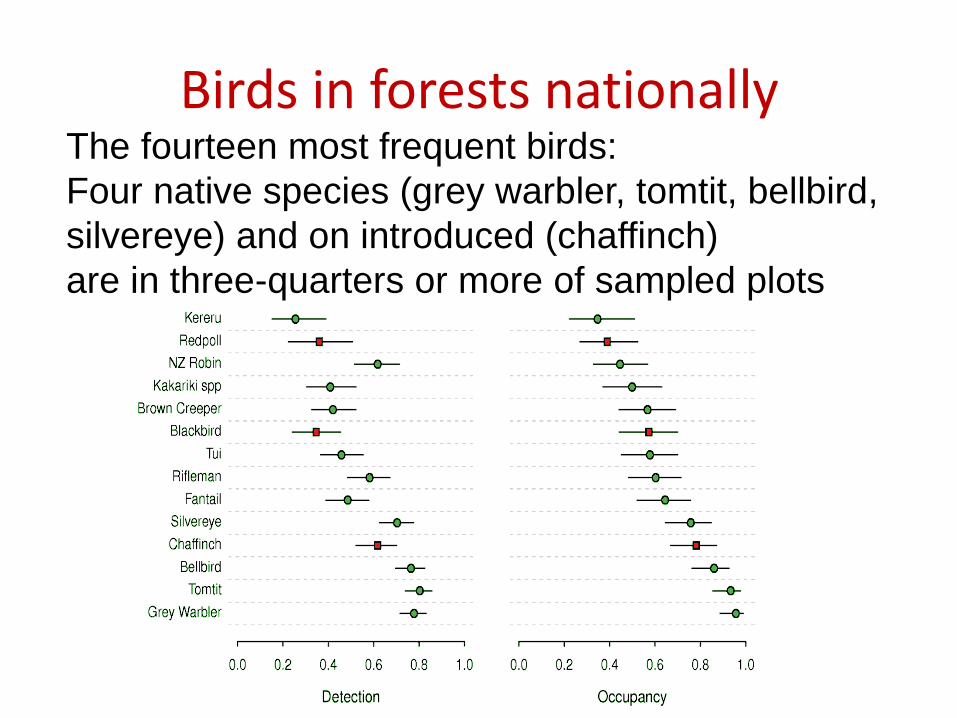
Birds in forests nationally The fourteen most frequent birds:
Four native species (grey warbler, tomtit, bellbird,
silvereye) and on introduced (chaffinch)
are in three-quarters or more of sampled plots
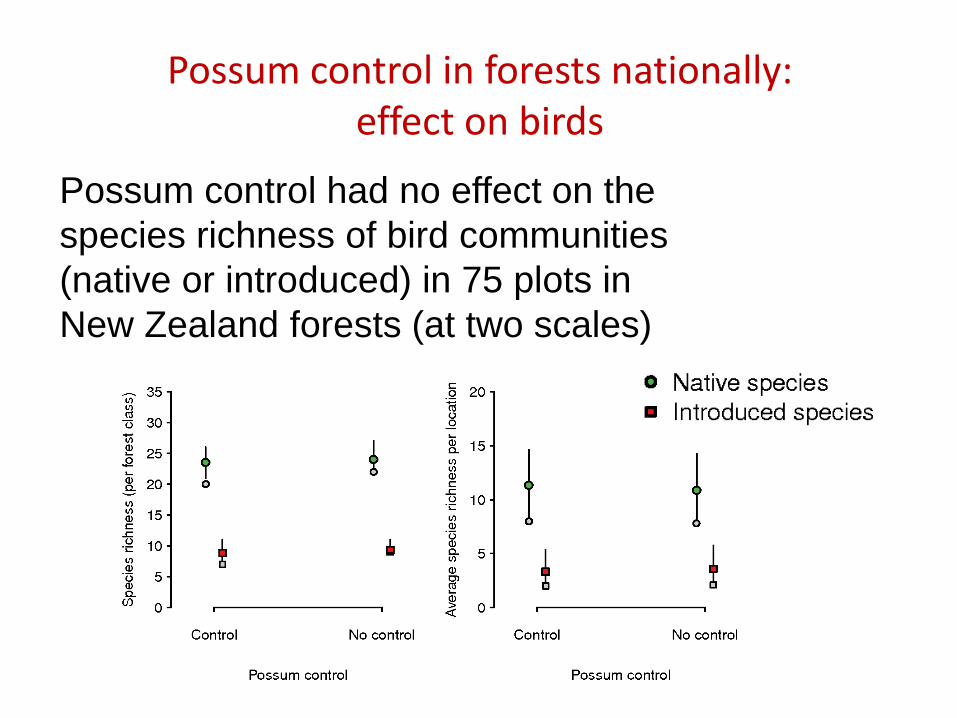
Possum control in forests nationally: effect on birds
Possum control had no effect on the
species richness of bird communities
(native or introduced) in 75 plots in
New Zealand forests (at two scales)
Tier 2 - Regional
• Studies are context-devoid. Without an unbiased national evaluation we don’t know whether these are typical or whether the trends they show are ‘generalisable’.
• Tier 2 does have the local history and replication ability that Tier 1 cannot to show whether an unusually high or low value is typical.
• Tier 3 (detailed local networks) have experimental focuses and multi-disciplinary studies. Expensive but will enable correlative analysis rather than mechanistic interpretations of status and trend. Limited studies so far (Craigieburn, Orongorongo)
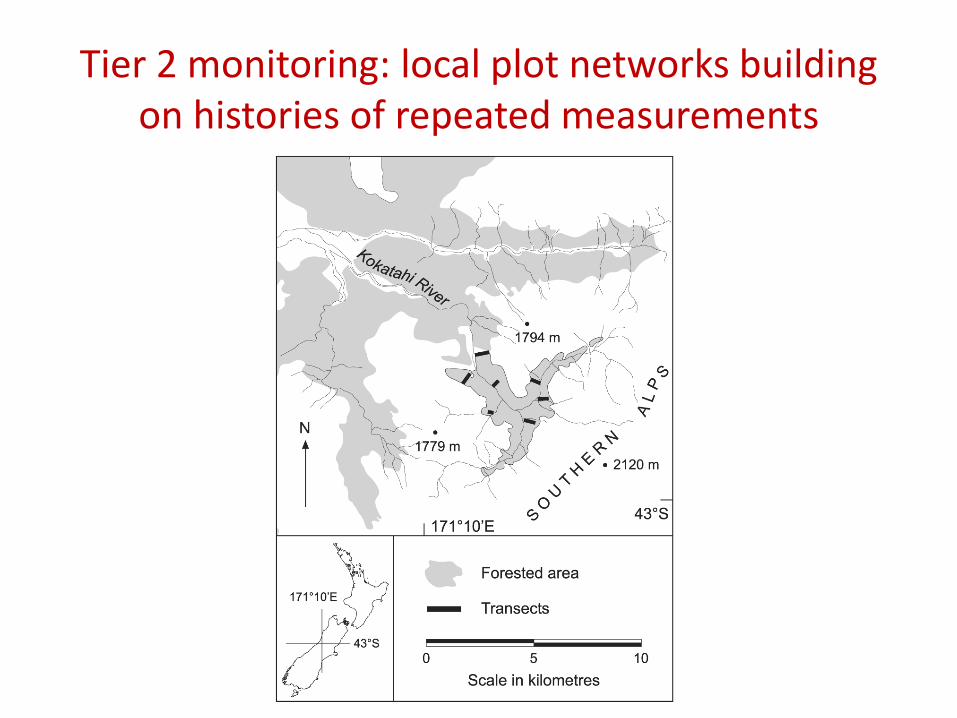
Tier 2 monitoring: local plot networks building on histories of repeated measurements
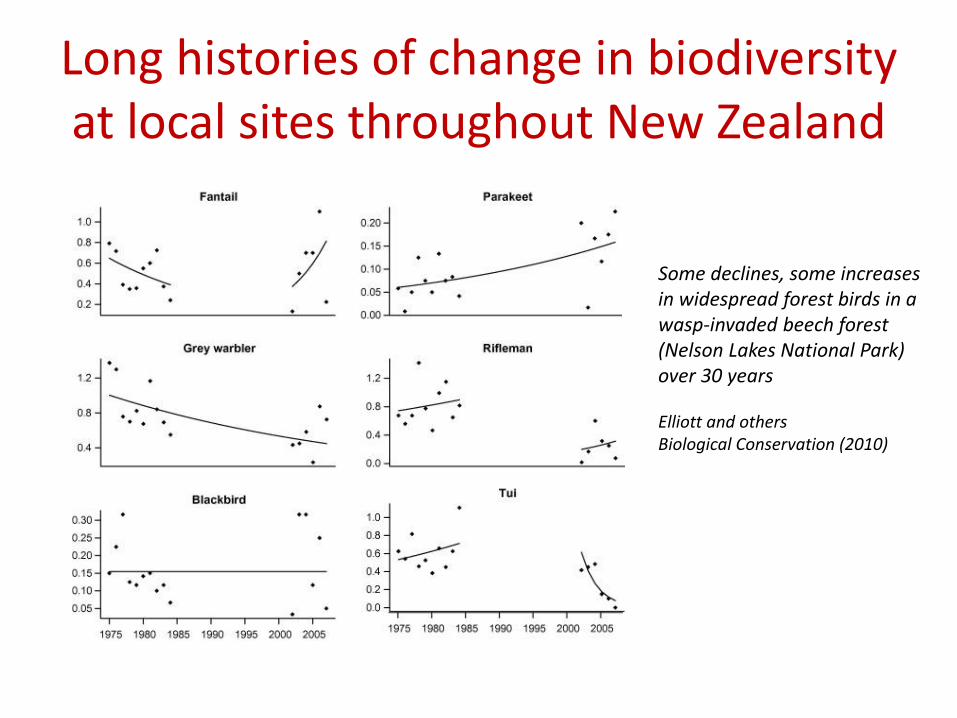
Long histories of change in biodiversity at local sites throughout New Zealand
Some declines, some increases in widespread forest birds in a wasp-invaded beech forest (Nelson Lakes National Park) over 30 years Elliott and others Biological Conservation (2010)
Tier 2 - Regional
• For rare species (especially birds, frogs, some reptiles) and some plants, these are amongst DOC’s outstanding data
• If rare species are on different trajectories from the less rare species, we can ask what are the features of their biology that cause this
Regional Councils
• Chief executives signed up to development of 18 biodiversity indicators
Indicators and measures to evaluate:
• State and condition
• Threats and pressures
• Effectiveness of policy and management
• Community engagement
Maximising overlap in process and measures with DOC
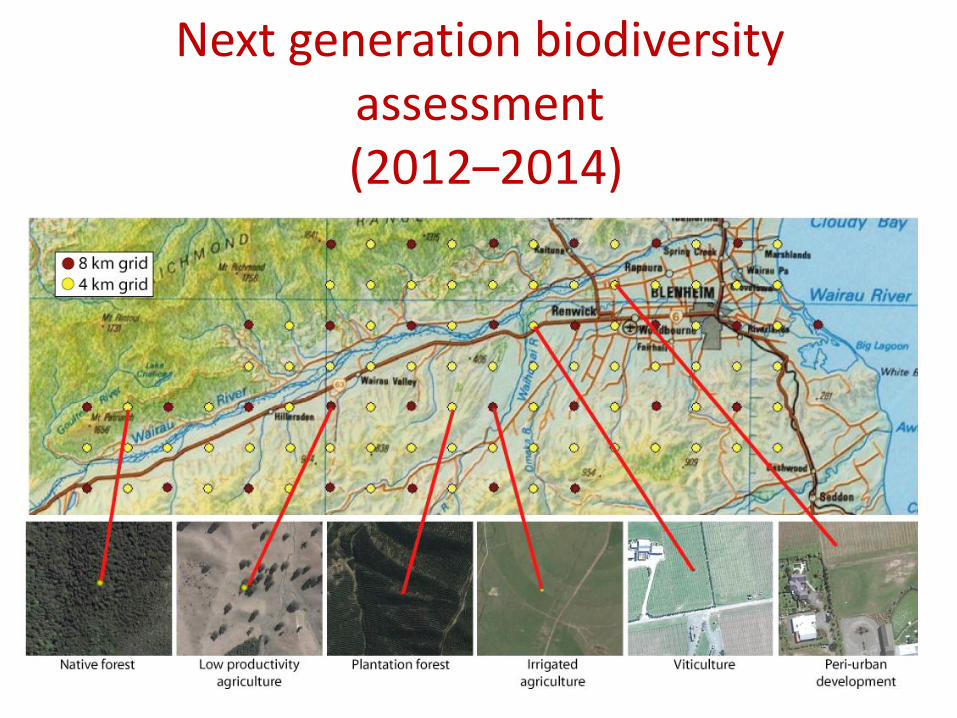
Next generation biodiversity assessment
(2012–2014)
Sanctuaries: how formalised monitoring could add value
• Most sanctuaries are interested in birds
• Standardised measures, that are the same as used by DOC and by regional councils, could be used within some sanctuaries and across sanctuaries
• An outcome of a greater richness and abundance within sanctuaries could be a common goal
Sanctuaries: how formalised monitoring could add value
Monitoring for birds
Use within sanctuaries
• Multiple sample points within sanctuaries can reveal trends in bird communities
• Comparison with trends at national scales (DOC’s Tier 1) and some local scales (e.g. DOC’s Tier 2) can give a context to interpret data
• For example, climatic trends (fantails), links to changing forest structure, etc.
Sanctuaries: how formalised monitoring could add value
Monitoring for birds Use across sanctuaries • A story would emerge bigger than any single
sanctuary • The single datum (or handful) within a given
sanctuary would gain statistical power as part of a whole
• Generalities are likely to emerge that are defensible
• An opportunity to learn from others’ experiences in a formal way
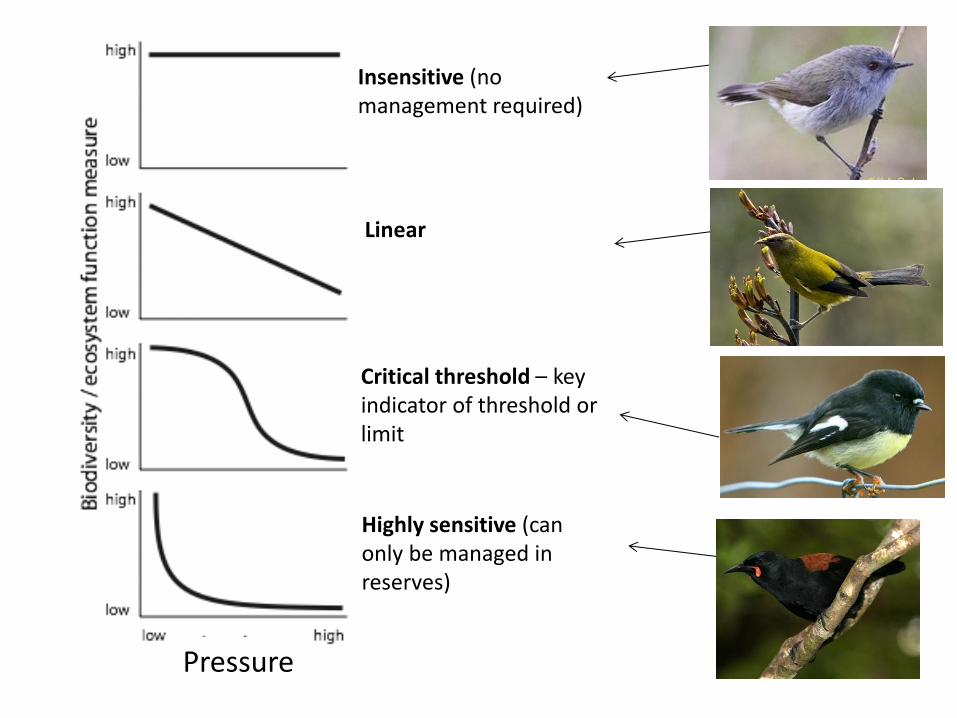
Insensitive (no management required)
Pressure
Linear
Critical threshold – key indicator of threshold or limit
Highly sensitive (can only be managed in reserves)
Sanctuaries: how formalised monitoring could add value
Monitoring for birds Use across sanctuaries • Comparisons could be drawn among sanctuaries
that employ different management techniques (e.g. fences vs. no fences)
• Quantifying bird communities could reveal interactions among species as reintroductions take place
• Assembly history might reveal the best order in which introductions should occur
Sanctuaries: how formalised monitoring could add value
Monitoring for birds
Use across sanctuaries
• For this to work, there’d be a need for a formal, centralised repository for the data
• Associated data will add value for any site (climate, soils, vegetation structure, composition)
• Research institutes, universities, students will be eager to analyse the data for you
Sanctuaries: how formalised monitoring could add value
Monitoring for birds
• Comparisons could be drawn among sanctuaries that employ different management techniques (e.g. fences vs. no fences)
• Quantifying bird communities could reveal interactions among species as reintroductions take place
• Assembly history might reveal the best order in which introductions should occur
Sanctuaries: how less formalised monitoring could add value
Monitoring for birds
• The role of citizen science – e.g. eBird, Nature Space (recording bird presence, dated, at point, on the web)
• Adding value inside sanctuaries
• Adding value beyond the sanctuaries (demonstrating spill-over benefits), in real time, and over time
• Building the base of public engagement
Thanks
• Elaine Wright, Meredith McKay, Benno Kappers, Richard Earle, Dave Forsyth and others (DOC)
• Sarah Richardson, Andrew Gormley, Catriona MacLeod (Landcare Research)
• Regional Councils’ Biodiversity Working Group
Questions?