Embed Size (px)
Citation preview
INVENTORY REPORTING
MaddenCo Inc. Revised March 2017
Copyright © 2017 by MaddenCo, Inc
All rights reserved.

2
Please understand that MaddenCo has expended substantial sums in developing and maintaining its
software, systems and related materials, and as a result, it has and will continue to have substantial
proprietary interest and valuable trade secrets therein. Also understand that MaddenCo's software, systems,
related materials and the "ideas" represented by software, as well as the physical materials, are valuable
trade secrets and are strictly confidential material, and important, and that its confidentiality gravely affects
the successful conduct of the business of MaddenCo.

3
Table of Contents
INVENTORY REPORT BASICS ............................................................................. 5
INVENTORY STATUS REPORT ................................................................................. 5 Store Selection ........................................................................................... 6 Message Input............................................................................................ 7 Sort Sequence ............................................................................................ 8 Select Field Values ...................................................................................... 9
Find Product Class .................................................................................... 9 Find Vendor .......................................................................................... 10
Period Comparison .................................................................................... 12 Inventory Quantity Selection ...................................................................... 13 Information Print Choice ............................................................................ 14 Printer Selection ....................................................................................... 16 Emailing the Report .................................................................................. 17
REPORT – INVENTORY STATUS REPORT .................................................................. 18 Report Analysis ........................................................................................ 19
OTHER INVENTORY REPORTS ............................................................................... 20 Price Lists ................................................................................................ 21 Cost/Value Report..................................................................................... 23 One Line Inventory Report ......................................................................... 25 Inventory Flow Report ............................................................................... 25 No Movement Report ................................................................................ 26 Product History Report .............................................................................. 27 Negative Inventory Report ......................................................................... 28 Inventory Zero Cost Report ........................................................................ 28 Slow Movement Report .............................................................................. 29 7/30/60 Day Report .................................................................................. 30 Product Where Allocated Report ................................................................. 30 10 Column Product Report ......................................................................... 31 More Inventory Reports ............................................................................. 32
Cost Error Report ................................................................................... 33 Product List ........................................................................................... 33 One Line Product List.............................................................................. 34 Package Differences Report ..................................................................... 35 Outside Purchases Analysis Report ........................................................... 35 Inter-Company Transfer Report ............................................................... 36 Product Barcode List............................................................................... 36 Zero Inventory Report ............................................................................ 37 Product X-Ref By Vnd/Cst ....................................................................... 37 One-Line Inventory Report + ................................................................... 38 Qty Order Use By Store + ....................................................................... 38 Unit Sales By Store + ............................................................................. 38 Price List With Profit ............................................................................... 39 Inventory in Transit Report ..................................................................... 39
CONCLUSION ................................................................................................ 42

4

5
Inventory Report Basics In this document, we will explain how to process inventory reports by reviewing the procedures to process an Inventory Status Report.
Inventory Status Report
From the Inventory Reports menu, select to run the Inventory Status Report.

6
Store Selection The first screen allows input of the store or region number for which we want to run the report.
In this example, we are running the report for all stores, so we input 000. You may just press enter when this screen is first presented for the same ‘all stores’ selection. NOTE: YOU MUST HAVE STORE ACCESS TO THE REQUESTED STORE OR REGION TO BE ABLE TO RUN A REPORT FOR THAT STORE OR REGION. If you want to run reports for all stores, you must have access to store 000.

7
Message Input The next screen is the Message Screen. On the Report Message line, you can type a message that will print at the top of every page of your report. For this report, we have typed in a brief description of the purpose of the report.
The Report Date also prints at the top of the report. The report defaults to the current date. Also, note Report Spacing. Reports are normally single-spaced. However, if you need more space to write notes, you can specify multiple-line spacing (2-9) to print the report with more white space.

8
Sort Sequence Next, we will choose our sort sequence. For the inventory status report, there are several sort sequences available. This gives you the opportunity to arrange your data in the most convenient order. For our report, Vendor and Product Number are what we need, so we will enter 01.

9
Select Field Values The next screen allows you to limit the scope of the report by selecting only data that matches your selection. If no selections are made, all data will be included.
Find Product Class On our report, we want to see passenger tires for Goodday. Let’s take a look at how this is done.

10
We positioned the cursor on the Product Class field and used the Prompt function. This function is available throughout the MaddenCo Tire Dealer System. We can choose passenger tires by using the Select option for product class 01 – Passenger Tire.
Find Vendor Next, we want to select the vendor for this report, which is Goodday. Once again, we have positioned our cursor on the Product Vendor field and selected the Prompt function.
By using the Select option for vendor 006 – Goodday, we are selecting this vendor only. Note: If you enter the vendor instead of selecting the vendor, you must enter the leading zero’s (006).

11
The results of our selections appear on the screen:
There is also an additional screen with product user fields. These fields are defined in the product file and can be used in report selections.

12
Period Comparison Next, we’ll specify the periods we’re interested in.
The inventory status report displays unit movement for each period specified. The top line allows you to accumulate the unit movement for multiple periods in a single column. Here we have selected 200704 for the Year/Period Low entry and 200707 for the Year/Period High entry. You can specify up to three non-consecutive ranges of periods for single period units. In the Year/Period 1 thru 12 fields, we have chosen to display unit movement for April through July for the years 2005, 2006 and 2007. Note the Increment and Decrement functions. These options make quick work of entering a consecutive list of periods. Just enter the first period use the function to increase period numbers by one for the following 11 periods. Use decrease to decrease the period numbers by one period. It is not necessary to fill in all 12 periods.

13
Inventory Quantity Selection The next screen allows you to choose which inventory quantity to display on the report. We can choose inventory as of Last Update – U; Inventory as of Now (Memo) – M; or Available quantity (Memo – Allocated) – A. We have chosen to run this inventory status report using the inventory levels as of the last update.

14
Information Print Choice Now you can select the status of the products that will appear on the report. To include All Items enter A; Over Stocked Items Only enter O; Under Stocked Items Only enter U; Both Under Stocked and Over Stocked Items enter B; Items with Sales or Inventory on Hand enter S; Items with Outstanding Purchase Orders Or Sales OR Inventory on Hand enter T.
Overstocks are calculated using product maximum order quantity instead of minimum order quantity if control key INVSTATX is set with the value of Y.

15
You may choose to exclude inter company sales from these report totals. Normally, including inter-company sales would overstate sales because the product is sold twice – once to another other store and again to a customer. The control record INVSTAT identifies the customer classes whose sales are to be included on this report. The value of this record contains a combination of Y's and N's, corresponding to each customer class. If you wish to exclude these sales, answer INVSTAT with the value N for inter company customer class and Y for all other customer classes. We can also indicate by store if we want to exclude/include inter company sales. This feature will be very helpful if you want to run this report to determine which products need to be restocked for a particular store (warehouse) that distributes its products to other stores thru inter-company invoices. Answer control record INVSTATM with Y to indicate inter company sales should be accumulated for specific stores. Identify those stores by adding control record INVST by store. The value of this record contains a combination of Y's and N's, corresponding to each customer class. For example, inter company customers are assigned to class 7. If you want to use this feature for store 003, you would create control records: INVSTATM - value Y INVST for store 003 – (to accumulate sales for all customer classes). An additional control record COSTCOP, answered Y, indicates if product’s weighted average costs from all locations should be used on the Inventory Status report. Otherwise, the report prints the cost from the first store encountered for each product.

16
Printer Selection You may enter a printer id, if you want to send this report to a printer other than your default report printer. The default printer is highlighted above the printer input. If a printer is not enetered, this is where the report will print. The default printer for reports will come from the printer control key 1411 or 8x11, depending on which report is being printed. Printer control keys can be assigned by user, workstation or store. Enter the number of copies to print, or leave as the default of one copy. If Place report on Hold is answered Y, the report will be spooled to the printer id but put on hold where it can be displayed or released.
If you are not making any of these changes, just press enter.
Control record RPTPRCP must be answered Y to see this screen.

17
Emailing the Report You may Email this report if control record EMREPORT is answered with Y. This control key can be set by user/workstation.
Use the Find function to locate the Email Address to receive a copy of this report.
Select the recipient or if the Email address you need is not on the list, use the Add Email Recipient function to add an Email address to the public list. You must have loaded the Data Exchange Module to use the Email feature. See the Data Exchange document for other control records that enable the Email function.

18
Report – Inventory Status Report Now, let’s look at the report we generated. Each product is presented with its description, class, size, commission %, FET and weight. Details for the selected store(s) appear on the lines below the product’s description. The store data includes: minimum, maximum, on hand, on order, last received date, the period comparisons, and the over / under stocked quantities.
Note the Last Rcvd column. This column reflects the last date receiving was processed for this product. Instead of printing this date, you may print a price level. Answer control record INVSTATP with a value 1 thru 6 to indicate one of the six selling price levels to print. Answer the record with 7 for replacement cost or 8 for actual cost.
19
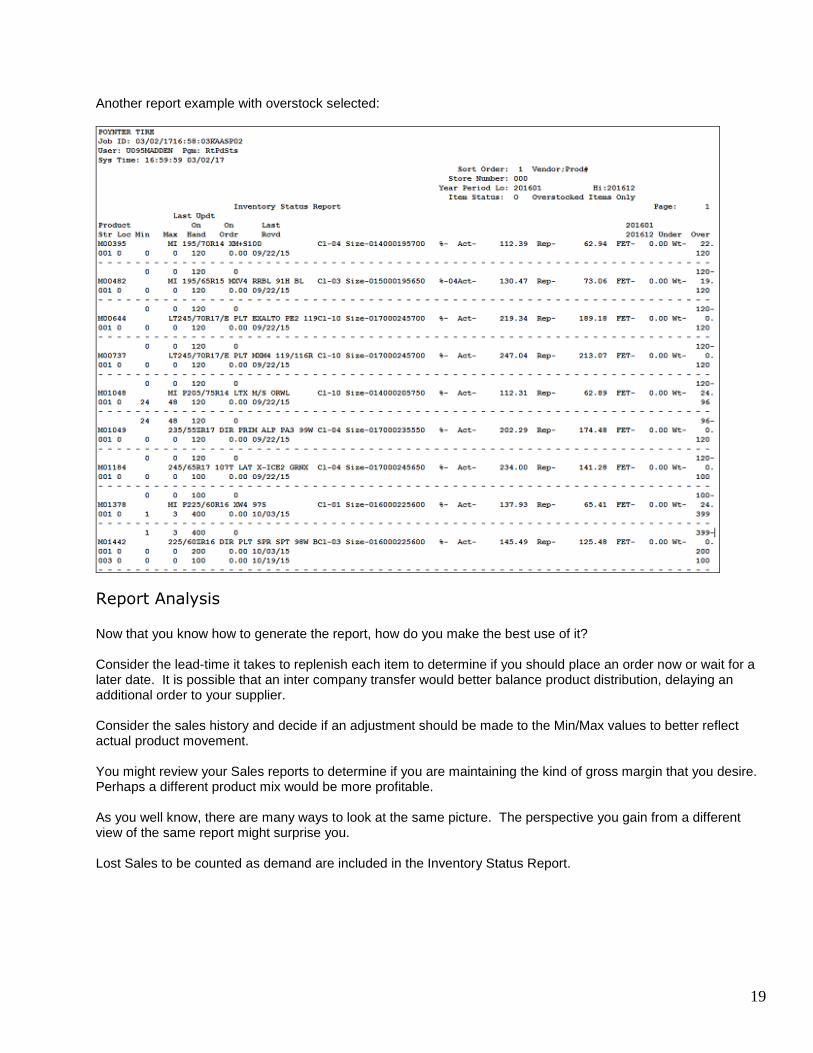
Another report example with overstock selected:
Report Analysis Now that you know how to generate the report, how do you make the best use of it? Consider the lead-time it takes to replenish each item to determine if you should place an order now or wait for a later date. It is possible that an inter company transfer would better balance product distribution, delaying an additional order to your supplier. Consider the sales history and decide if an adjustment should be made to the Min/Max values to better reflect actual product movement. You might review your Sales reports to determine if you are maintaining the kind of gross margin that you desire. Perhaps a different product mix would be more profitable. As you well know, there are many ways to look at the same picture. The perspective you gain from a different view of the same report might surprise you. Lost Sales to be counted as demand are included in the Inventory Status Report.
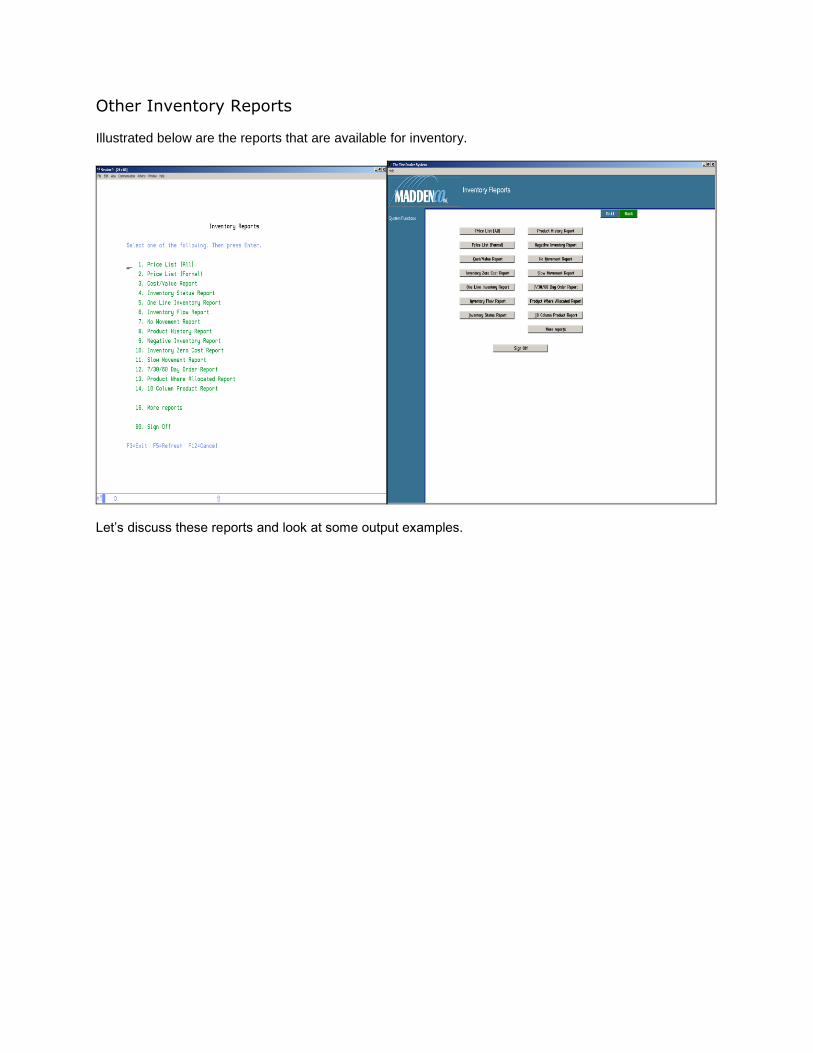
Other Inventory Reports Illustrated below are the reports that are available for inventory.
Let’s discuss these reports and look at some output examples.
21
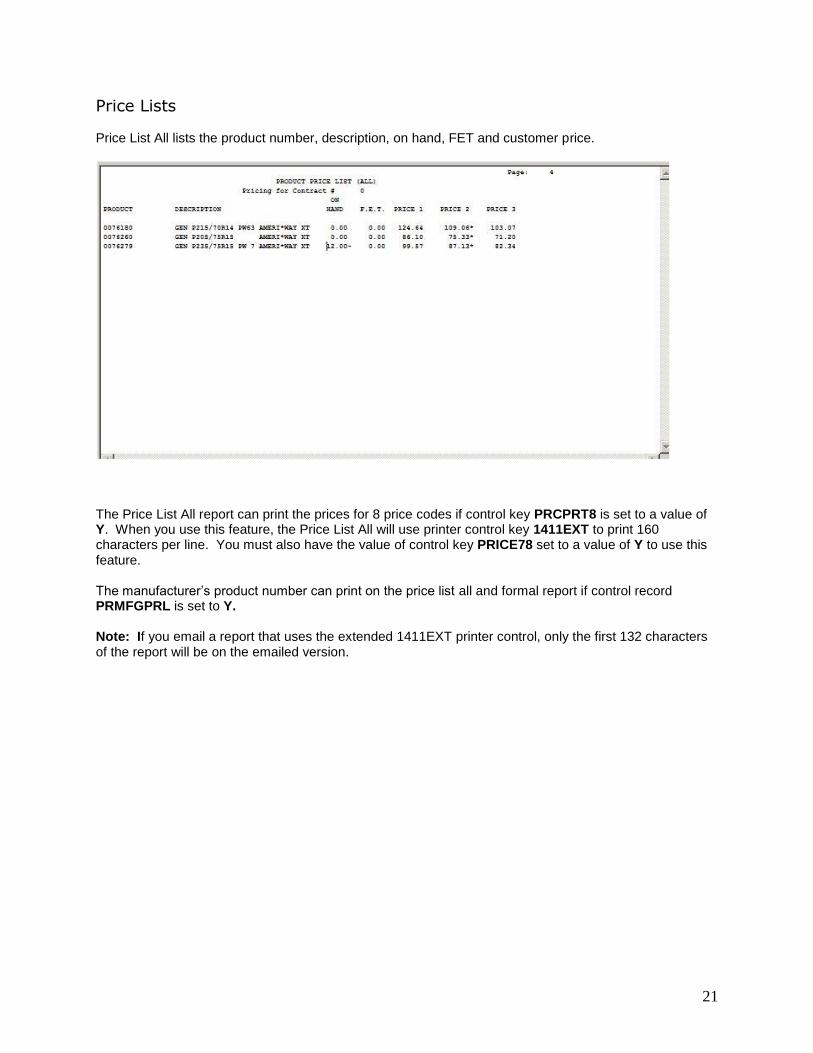
Price Lists Price List All lists the product number, description, on hand, FET and customer price.
The Price List All report can print the prices for 8 price codes if control key PRCPRT8 is set to a value of Y. When you use this feature, the Price List All will use printer control key 1411EXT to print 160 characters per line. You must also have the value of control key PRICE78 set to a value of Y to use this feature. The manufacturer’s product number can print on the price list all and formal report if control record PRMFGPRL is set to Y. Note: If you email a report that uses the extended 1411EXT printer control, only the first 132 characters of the report will be on the emailed version.

22
In contrast, Price List Formal does not include the current on hand inventory.
The formal price list has the ability to only include products that have been sold to the customer. If control record PRCLCKSL is set to Y, an additional front end screen will come up asking for the year/period range to use for checking the customer’s sales.

23
If control key PRCLCKSL is set to Y, you can enter a year period for the report. Non-inventory products can be included on the formal price list if control record PRCLNONI is set to Y.
Set control key PRCLHOTS to Y if you want to show Hot Sheet pricing on the report. An asterisk will print in the H column for hot sheet products and the Hot Sheet price will print. The customer must Allow Hot Sheet pricing in their customer record.
Cost/Value Report The Cost/Value Report computes the extended value of inventory on hand.
The report shows FET, replacement and actual costs and extended value. A grand total for each category and on hand inventory is provided at the end of the report.

24
Based on control keys, several special features are available. If control key PGBYVND contains a value of Y, this will cause the report to page break whenever the vendor number changes and the report is sorting and subtotaling by vendor. If control key PRTQTY0 contains a value of Y, the report will print all products, even those with an inventory value of zero. If control key RCOSTCL contains a value of Y, the report will print both the replacement cost and the replacement cost extended value. If control key CVEXCONS contains a value of Y, consigned inventory is excluded from the totals. Consigned inventory is usually determined by assigning a product location other than 0 in the product file. If control key CVSUBPCS is answered Y, subtotals by product class within store are printed when store and product class sorting is selected. A new sort option was added to the sort selections for Inventory Reports. Along with the sort option, the following options are available: If control key CVSUBPCV is answered Y, subtotals by product class and vendor within store are printed when store, vendor and product class sorting is selected. Print subtotals for one line items if control key CV1LNTOT is set to Y. Also, a grand total page can be printed at the end of the report if you are printing for more than one store and control key CVGRNTOT is set to Y. If you are only running the report for one store you will not get the grand total page.
Set the value of control key CVPRTPCL to Y to print the product class in place of the location on the report as shown in the example above.

25
One Line Inventory Report The One Line Inventory Report provides a quick look at the quantity of on hand inventory by store. Inventory on Hand can be expressed three different ways: U = Last Update (Inventory as of last night); M = Inventory as of Now (Memo): and A = Available quantity (Memo - Allocated).
If control key PRTQTY0 is answered Y, a line will be printed for a product if all stores have zero inventory for that product.
Inventory Flow Report The Inventory Flow Report lists by store, the movement of items during the month.
Beginning inventory for the month, inter company sales and returns, sales and returns, receipts and adjustments, and other activity and present inventory are listed. From this report, you can get a quick snapshot of the month’s activity.

26
No Movement Report The No Movement Report is just that, a report to show products with no movement within the time period that you specify.
This report shows the last customer to purchase each product listed. The Invoice History file is checked first; then, if no sale is found, the Sales file is checked. Invoice History is by date and the Sales file is by year/period; therefore, Invoice History will provide the most accurate date and is checked first. You can specify a period of inactivity up to 999 days. In this example, 60 days were used. Data includes the date last received and sold as well as quantities on order and on hand. An extended total is provided by item and a grand total is calculated at the end of the report. This is a quick and easy way to see what product is not moving and how much that inventory costs.

27
Product History Report The Product History Report is a representation similar to the old Cardex system. Every transaction can be detailed for an item by store.
You can now select an A/P Vendor when running this report. In the example above, we see two separate sales of an item, listing the invoice number, quantity, price, cost, customer and vendor. Had there been a receiving transaction, the PO number would have been listed. This report can be particularly useful when looking for inventory discrepancies. Of course, this report is only available if you are posting to the Product History File. To do this, control record PRHSTYN must be set to Y. Also, non-inventory products will only post to this file if PRHSNON is set to Y. If control key PRHCOST is answered with Y, cost will be printed on the report. To print cost percent on the report answer control key PRHSTC% with Y. The cost carried in the product history file will be used for the current inventory value calculation. This cost is determined by the value of control record PRHAORR. The value A is for actual (average) cost or the value R is for replacement cost. To include inactive products on the Product History Report set the value of new control key PRHSTPDL to Y. The default is N. Subtotals can also be printed by product class and store if control key PHSTPCST is set to Y.

28
Negative Inventory Report The Negative Inventory Report provides a list of items in inventory with a negative quantity on hand by store.
Inventory Zero Cost Report The Inventory Zero Cost Report provides a listing of items in inventory that have a zero cost. This list should be reviewed for items that should have a cost but for some reason cost has been omitted.
If control key PDNCRCKI is set to N, products with inventory greater than zero are checked. If the product's actual or replacement cost is zero, the product will print on the report.

29
Slow Movement Report The Slow Movement Report allows you to determine what products are not selling at a given turnover rate.
The report lists the Last Sold date, the customer last sold to and the customer’s name. In this example, we have set 4.0 as the turnover ratio that is considered slow movement. So any product with a turnover rate less than 4.0 is considered slow. Please keep in mind the turnover rate for each item is calculated during End of Month. If you don’t run End of Month, this data will not be available. Inventory turnover is a rolling three month average, calculated by units, not dollars. It is calculated during the end of month procedure. For each product at each store, unit sales for the last three months are divided by the average on hand inventory for the last three months. This is multiplied by four to annualize the amount. This report should help identify potential markdown items. We recommend that this report be run after running end of month to keep you aware of items that are not moving well.

30
7/30/60 Day Report The 7/30/60 Day Report is very useful in spotting trends in inventory movement. The report started out as a fixed 7/30/60 day report but now you can input any three dates that you wish, so this could be a 15, 30, 90 day report.
For this report to be effective, control key KEEPDSAL must be set to a value that supports the number of days of sales that you want to include in this report. KEEPDSAL can be set to as high as 999. Just remember that it takes disk space to retain the sales data. Lost Sales to be counted as demand are now included in 7/30/60 Day Order Report. You are also allowed to include or exclude inter company sales in the report by answering the screen prompt.
Product Where Allocated Report The Product Where Allocated Report provides a list of the work orders to which product is allocated. This report is typically used to locate work orders on which specific products have been allocated.

31
10 Column Product Report The 10 Column Product Report is a report that could become one of your favorites. This is a ‘create your own’ report that is formatted in the manner you choose.
The select screen illustrates the flexibility and comprehensiveness of this report. As you see, you choose the sequence of the columns. Use the Find function to get the full list of data available. Lost Sales, Warehouse Locations, Search Key, Auto Bill code, and Product Class, Type and Vendor can be listed in the columns now. Three new product columns are available on the 10 Column Product Report. The new columns are: OS = Other Stores On hand inventory as of last update (like the OH column), OT = Other Stores On hand inventory as of now (like the OM column), and OU = Other Stores Net available (On Hand - allocated + on order) (like the NA column). The other stores are the active stores in the system store maintenance that are not on the report. There are several control records unique to the 10 Column Report. If P10CPNON is answered Y, non-inventory products are printed. If control record P10CPRT0 is answered Y, products with zero inventory print on the report. Ten Column Product Report control record P10CPRT0 has been modified so that a value of Y will print all products, a value of N will print any product with a non-zero column, a value of Q will print only product with a non-zero quantity column, and a value of O will print only products with a non-zero suggested order column. To print larger dollar amounts without truncating them, set control key P10CLPND to Y to print dollar amounts without decimals. For order quantities, answer control record POGEN0MI with Y and products with a zero in their minimum order quantity will also be included. This report also uses the INVSTAT and INVSTATM control records detailed in the Inventory Status report discussion. On the 10 column product report, subtotals can print when the report is sorted by class, size and vendor. Control keys have been added to stop the printing of the subtotals. If you answer control record

32
P10TOTCL with a value of N, the subtotals by class will not print when sorted by class. If you answer control record P10TOTSZ with a value of N, the subtotals by size will not print when sorted by size. If you answer control record P10TOTVN with a value of N, the subtotals by vendor will not print when sorted by vendor. Otherwise the subtotals will print. You may down load this report to a file for use in a spreadsheet if control record DWNLODPC is set to Y. A screen is presented asking for the file name and description of the file.
More Inventory Reports The More Reports selection shows an additional list of inventory reports.

33
Cost Error Report The Cost Error Report is designed to make you aware of changes to costs beyond a set percentage. When the new actual cost of a product, calculated during receiving, differs from the old actual cost by a percentage (determined by control record INVCEV%), the product’s cost error flag is set to Y. Products whose cost error flags equal Y appear on this report. This can help you find receiving errors. For example: if you want to flag products that exceed 5% of the last cost set INVCEV% to 0005. If the old cost was 100.00 & the new cost calculation is more than 5.00 variance either way the product is flagged and printed on the report.
Product List The Product List is a list of all products included in the selection process. This report is a reduced product maintenance listing.

34
One Line Product List The One Line Product List is a consolidation of the Product List into one line per item per store.

35
Package Differences Report The Package Differences Report is a report showing the differences in the details of a package between the base store and the other stores.
Outside Purchases Analysis Report The Outside Purchases Analysis Report provides a recap of your outside purchase activity based upon selection criteria that you specify. We hope that you are using the outside purchase function in Point of Sale. By running this report, you will be able to analyze the items that are purchased outside normal operations. Hopefully, this analysis will improve buying decisions.

36
Inter-Company Transfer Report The Inter-company Transfer Report is a recap of differences in what was shipped and what was received via inter company sales. This report can highlight problems with intercompany receiving resulting from products that were not physically delivered, incomplete receiving transactions or receivers that were modified at the receiving store.
Product Barcode List The Product Barcode List is a listing of the barcodes assigned by product. An option is available to list only duplicated barcodes within the product master file.

37
Zero Inventory Report The Zero Inventory Report is a report of all items selected that have a zero on-hand, on-order, and allocated and lists the last date sold and received by item.
Product X-Ref By Vnd/Cst The Product X-ref by Vnd/Cst Report is a report of all items that have a cross reference from the product number that is used in MaddenCo to the product number that is used by either a Vendor or a Customer.

38
One-Line Inventory Report + The One-Line Inventory Report + is a report that lists up to twenty stores instead of the twelve stores available on the other One-Line Inventory Report. This is accomplished by printing only three digits of On Hand Inventory. Stores with over one thousand units will print as 999 units. The totals will be correct.
Qty Order Use By Store + The Quantity Order Use by Store + is a report that lists up to twenty stores and showing the Quantity Order Use value in the product master file for each product. This report may be useful to quickly review your order quantity values.
Unit Sales By Store + The Unit Sales by Store + is a report that lists up to ten stores and showing the Unit Sales for the period defined for each product. This report may be useful to quickly review your unit sales for a region by product and/or vendor.

39
Price List With Profit The Price List with Profit prints actual and replacement cost and the profit based on a selected selling price level. Both the dollar amount of profit and the percent of profit are printed. FET is also printed. This report may be useful to quickly review of your profitability with a customer.
Inventory in Transit Report The Inventory in Transit Report is located on the More Inventory Reports menu from the Inventory Reports Menu.

40
This report prints a list consisting of FET, replacement and actual costs and extended value and is based on Inter-Company Open Receivers. Any receiver that is in Ready status is not included in the report as these will process in the Daily Update. This report is intended for receivers where the product has not been received yet. These are receivers with an On Hold Status. Control key RCVIATSR determines an inter-company invoice status when it is initially created. When answered N, inter-company receivers are created with On Hold status. For retread intercompany receivers answer control key @RCVIATR with N to set to On Hold Status. You will need Inventory Reports ACCESS to print this report.
Report Selections Enter a store number for the report or enter 000 for all stores. The user must have access to all stores to select for all stores. Standard Inventory Report sort options are available to print the products in a selected order. The Product Selection screen allows the scope of the report to be limited by selecting only data that matches the selections. If no selections are made, all data will be included. There is an additional screen with product User Flags/Fields to select products to include in the report.
The report prints 196 characters and uses printer control key 1411EXT. The report can also be emailed with all 196 characters.

41
Columns and Totals Based on control keys, several special features are available: Set control key RCOSTCL to N to exclude Replacement Cost and Extended Replacement Cost on the report. The report will still be 196 characters but the replacement cost columns will be blank. If control key CVEXCONS contains a value of Y, consigned inventory is excluded from the totals. Consigned inventory is usually determined by assigning a product location other than 0 in the product file.
Page Break:
If control key PGBYVND contains a value of Y, this will cause the report to page break whenever the vendor number changes and the report is sorting and sub totaling by vendor. If control key PGBYSTR contains a value of Y, this will cause the report to page break whenever the store number changes and the report is sorting and sub totaling by store.
Subtotals/Totals:
If control key CVSUBPCS is answered Y, subtotals by Product Class within Store are printed when store and product class sorting is selected. If control key CVSUBPCV is answered Y, subtotals by Product Class and Vendor within Store are printed when store, vendor and product class sorting is selected. If control key CV1LNTOT is set to Y, the subtotal will only print on one line with a heading for each value. Also, a grand total page is printed at the end of the report if printing for more than one store and control key CVGRNTOT is set to Y. If only store is selected, the grand total page is not printed.

42
CONCLUSION We encourage you to be creative and curious. Run a few reports that you haven’t run before. Run some of your current reports from a different perspective. You just may find some new opportunities.