Embed Size (px)
Citation preview
St. John Fisher College St. John Fisher College
Fisher Digital Publications Fisher Digital Publications
Psychology Faculty/Staff Publications Psychology
2001
Investigating business casual dress policies: Questionnaire Investigating business casual dress policies: Questionnaire
development and exploratory research development and exploratory research
Timothy Franz St. John Fisher College, [email protected]
Norton Steven D. Indiana University - South Bend
Follow this and additional works at: https://fisherpub.sjfc.edu/psychology_facpub
Part of the Human Resources Management Commons, and the Industrial and Organizational
Psychology Commons
How has open access to Fisher Digital Publications benefited you?
Publication Information Publication Information Franz, Timothy and D., Norton Steven (2001). "Investigating business casual dress policies: Questionnaire development and exploratory research." Applied HRM Research 6.2, 79-94. Please note that the Publication Information provides general citation information and may not be appropriate for your discipline. To receive help in creating a citation based on your discipline, please visit http://libguides.sjfc.edu/citations.
This document is posted at https://fisherpub.sjfc.edu/psychology_facpub/5 and is brought to you for free and open access by Fisher Digital Publications at St. John Fisher College. For more information, please contact [email protected].
Investigating business casual dress policies: Questionnaire development and Investigating business casual dress policies: Questionnaire development and exploratory research exploratory research
Abstract Abstract This study had two primary goals: to develop a questionnaire that can be used to determine what types and categories of attire are acceptable in today’s work environment for men and women and to provide a preliminary test of whether these policies impact work attitudes and behavior. Because of the lack of past theory and research to guide the project, human resource professionals were interviewed to help generate ideas for questionnaire design. Once developed, this questionnaire was completed by 95 students, most of whom worked full- or part-time. Analyses revealed that there are clear trends and categories that can be identified in determining acceptable attire for dress policies, and that these may differ for men and women. Further, the results suggest that business casual dress policies may have no impact on employee behavior and only minor impact on attitudes. Implications for dress code policies are discussed.
Disciplines Disciplines Human Resources Management | Industrial and Organizational Psychology | Psychology
This article is available at Fisher Digital Publications: https://fisherpub.sjfc.edu/psychology_facpub/5
___________________________________________________________________
Applied HRM Research, 2001, Volume 6, Number 2, 79-94 ____________________________________________________________________
Investigating Business Casual Dress Policies:
Questionnaire Development and Exploratory Research
Timothy M. Franz St. John Fisher College
Steven D. Norton
Indiana University South Bend
This study had two primary goals: to develop a questionnaire that can be used to determine what types and categories of attire are acceptable in today’s work environment for men and women and to provide a preliminary test of whether these policies impact work attitudes and behavior. Because of the lack of past theory and research to guide the project, human resource professionals were interviewed to help generate ideas for questionnaire design. Once developed, this questionnaire was completed by 95 students, most of whom worked full- or part-time. Analyses revealed that there are clear trends and categories that can be identified in determining acceptable attire for dress policies, and that these may differ for men and women. Further, the results suggest that business casual dress policies may have no impact on employee behavior and only minor impact on attitudes. Implications for dress code policies are discussed. A complete PDF version of this article can be obtained at www.radford.edu/~applyhrm. ____________________________________________________________________ Implementing business casual programs is a current trend in U.S. organizations. Although many of these programs started out as “casual Fridays,” many organizations now allow more casual dress during the entire week. For example, a recent poll by the Society for Human Resource Management found that as many as 90% of U.S. office workers may work in casual clothes at least once per week. A 1995 survey conducted by HR Magazine showed that 33% of companies allow business casual every day, up 20% from three years before (Walter, 1996). These practitioner surveys and similar popular press articles overwhelmingly portray casual dress policies as positive. For example, an article by the New York Times suggests that, when compared to traditional business attire, dressing casually eases tensions, improves communication between management and employees, and instills a sense of togetherness in organizations (Bragg, 1994). Additionally, HR managers who work in organizations that have implemented these programs claim that business casual is an effective management tool (Walter, 1996). Further, many employees view a casual dress policy as a benefit to working in their organization because it helps to save money on business clothing and dry cleaning expenses (Walter, 1996). Finally, casual dress policies are seen as a move towards eliminating the natural communication barriers between managers and employees (Kazakoff,
79

1996). With these perceived benefits, it is not surprising that a large percentage of corporations have started implementing casual dress policies. Given the number of corporations implementing these policies, there is a surprising lack of empirical research examining them. Only one study has examined the effect of these polices on workplace behavior, demonstrating that business casual policies may reduce absenteeism (Yates & Jones, 1998). At the time this article was written, we found no research published in academic journals that systematically investigated the details about these policies or how they affect individual employee's own attitudes and work behaviors. The objective of this exploratory project is to investigate the details about the types of casual dress policies that are being implemented and then examine their effects on employee work behavior and attitudes. Details about policies Our primary goal was to develop a questionnaire to examine typical dress policies. Because of the lack of previous research and theory to guide us, we developed three broad research questions, including: 1) What attire is allowed or preferred? 2) What are the categories of attire? 3) Are there any gender differences? The first research question was designed to operationally define dress policies, including the meaning of business casual. Thus, our first question was descriptive; it focused on clothing types that are allowed or accepted in the workplace. Research Question 1: What attire is typically allowed and/or accepted in the workplace?
The second research question was designed to better understand the categories of clothing employees wear. We speculated that there would be at least three different categories: Traditional, business casual, and casual. Traditional dress is based on historical business attire such as suits and ties for men. Business casual dress is based on current trends, which includes clothing such as slacks and a blouse. Casual dress is typical weekend or informal attire, such as jeans and athletic shoes. Thus, our second research question was as follows: Research Question 2: How can different types of attire be categorized?
The third research question focused on determining whether there are any differences in dress policies or preferences that exist between men and women. We expected that there would be some policy differences, and other perceptual differences. Thus, our third question was as follows: Research Question 3: Are there gender differences in acceptable attire?
Impact on Performance and Attitudes
Unlike the markedly positive view of business casual portrayed by the popular press, the empirical literature suggests two possible, but opposing, outcomes resulting from how business casual dress policies affect individual attitudes and behavior. This paper is designed to provide a preliminary, exploratory examination
80
of whether there are any positive and/or negative effects of business casual policies on perceptions of performance and employee attitudes. For the purposes of this study, we have specifically focused on how policies affect self-perceptions. Although perceptions of others, such as customers, are important, they are not the focus of this study. Positive Effect of Business Casual Dress Policies
Rewards, incentives, and benefits are provided to improve workplace attitudes, increase worker performance, and help to retain employees (McGee, 1988). A business casual dress policy can be perceived as one such program. As described previously, survey results indicate that employees overwhelmingly view these programs as positive (Walter, 1996). Because employees view these programs positively, they should improve workplace attitudes, subsequent performance (Adams, 1988; Jin, 1993), and organizational citizenship behaviors (VanDyne, Graham, & Dienesch, 1994).
Another potential benefit of casual dress policies is the work environment these policies can create. In a more casual environment, employees report that they feel more like an integral part of an organization (Yates & Jones, 1998) rather than simply a small part of an organizational hierarchy. This should help to eliminate communication barriers between employees and managers, and subsequently improve attitudes and performance. In conclusion, the limited survey evidence suggests that casual dress policies will lead to improvements in workplace attitudes and improvements in performance.
Negative Effect of Business Casual Policies on Work Performance
On the down side, business casual policies may potentially have a negative effect on performance. Research about the relationship between clothing and self-perceptions finds that clothing clearly affects the way people perceive themselves. People base their self-perceptions, in part, on how they dress (Liskey-Fitzwater et al., 1993), define their roles based on how they dress (Rafaeli, Dutton, Harquail, & Mackie-Lewis, 1997), express their characteristics and emotions based on their choice of clothing (Kwon, 1994a; Miller, 1997; Pratt & Rafaeli, 1997), and perceive the attributes of their occupation based on the way they dress (Kwon, 1994b). In total, this is clear evidence that choices about clothing affect personal self-perceptions. Though casual dress has a positive effect on attitudes, it may instead result in a negative effect on workplace performance. If employees are dressed casually, they may perceive themselves as being in a casual, relaxed, and “laid-back” atmosphere rather than in an atmosphere that requires work, effort, and diligence. Unlike the conclusions presented in the previous section, this means that business casual dress policies will cause employees to have positive attitudes about the workplace but will at the same time diminish work performance.
81
Hypotheses to be Tested
Previous research suggests a positive relationship between business casual policies and workplace attitudes. Hypothesis 1: Employees who work in organizations with business casual dress policies will have more positive attitudes than those who work in organizations with more traditional policies. Unlike the first hypothesis, however, previous research suggests two contradictory hypotheses for the relationship between business casual dress policies and work performance. As described previously, popular press surveys and other anecdotal evidence suggest that casual dress policies and work performance should be positively related. Hypothesis 2a: There will be a positive relationship between business-casual dress policies and ratings of work performance. The research examining clothing and self-perceptions previously described suggests an alternative, and contradictory, hypothesis. This means that casual dress policies and workplace performance should be negatively related, leading to an alternative hypothesis. Hypothesis 2b: There will be a negative relationship between business-casual dress policies and work performance. The results of this project have considerable importance for businesses and human resources practitioners. First, this is the first research study that attempts to define the types of clothing that are allowed in traditional, business casual, and casual environments. Second, there are, unfortunately, few systematic evaluations of human resources programs and policies (see Goldstein & Ford, 2001 for a review). If business casual dress policies increase performance and improve attitudes, then organizations should be encouraged to implement them. If on the other hand business casual dress policies decrease performance, then companies should instead be encouraged to avoid them.
Methods
Study Overview
The research project was conducted in two phases. The first phase involved interviews of human resource professionals. The second phase included the administration of the questionnaire that was designed during the first phase. Questionnaire Design
Qualitative assessments, interviews, and/or focus groups are often recommended as the first step in a research study that is exploring a theoretical area that has not yet received any empirical research (e.g., Fink, 1995). Because there is no empirical
82
research examining the effect of business casual dress policies, the first step was a qualitative assessment (Symon & Cassell, 1998) of business casual dress policies and perceptions of the success of these policies. To design the questionnaire, three semi-structured interviews (two face-to-face and one phone) were conducted with human resource professionals. Because these interviews were used only to design questionnaire items rather than to make generalizations to the population, these professionals were identified through convenience rather than random sampling. These professionals included a Director of Human Resources working in an engineering facility with approximately 500 employees which was a part of a larger multi-national manufacturing company, an HR supervisor working in the main office and plant of a 1,000 employee manufacturing company, and a Principal in a 1,200 employee Human Resources consulting firm. All three organizations had recently changed to a business casual dress policy. Seventeen questions were developed to focus the interviews on dress code policy issues, gather impressions about how they relate to work behavior, and better understand any other issues that have arisen as a result of the change to a business casual policy. Each interview lasted between 30-40 minutes. All interviews were taped (with participants’ written consent). The results of these interviews were used to help to create the questionnaire. The questionnaire included sections designed to assess impressions about workplace behavior, opinions about the company, opinions about business attire, typical clothing allowed or accepted by the policy, and demographic information. The first section, which assessed impressions about workplace behaviors, included a single item designed to measure perceptions of performance (modified from Wright & Cropanzano, 1998). This item asked subjects to rate their own level of performance compared to others in the organization and was measured on a 5-point response scale on which subjects rated their performance from Poor, in the lowest 30% to Excellent, in the top 5%. The second section, which assessed opinions about the organization, included a single item designed to measure intentions to leave (Ferris & Rowland, 1987), five items designed to measure job satisfaction (Price & Mueller, 1986; α = .67), and ten items designed to measure perceptions of job effort (Brown & Leigh, 1996; α = .88). Intentions to leave was measured on a five-point scale from I intend to stay in my job until I retire to I intend to leave my job as soon as possible. Job satisfaction was measured on a five-point scale from very unsatisfied to very satisfied. Perceptions of job effort were measured on a five-point Likert-type scale. The distribution of each of these variables is provided in Table 1. The third section, which assessed opinions about business attire, included six items designed specifically for this study. The items were designed to determine overall impressions about the types of policies that exist in companies where subjects worked and also what types of policies employees prefer. Sample items include “the dress code (the formal corporate or division policy) in my company is” and “I would like the dress code in my office to be” (a complete list of the items is included in Tables 6 and 7). Responses were measured on a five-point scale from very casual to very formal. The frequency distribution of first item, which measured dress code policy, is detailed in Table 1. Surprisingly, a factor analysis revealed that five of the six items, including the first item that asked about policy information, loaded on one
83

factor. The only item that failed to load on the factor was the item about business casual policies. For certain analyses, these five items were averaged, including relevant reverse coding, to create a scale measuring opinions about dress policy information (α = .84). Table 1: Frequency distribution representing the percent of responses for one predictor and five criterion measures. __________________________________________________________________________________
Rating
______________________________________
M SD 0 1 2 3 4 5 _____________________________________________________ Dress Policy 2.32 1.35 10.5 17.9 25.3 27.4 13.7 5.3 Turnover intentions 3.22 1.04 n/a 7.4 10.5 47.4 22.1 12.6 Self-rating of performance 3.73 0.84 n/a 0.0 8.7 26.1 48.9 16.3 Job satisfaction 3.29 0.76 n/a 1.1 14.7 38.9 41.1 4.2 Perceptions of job effort 3.38 0.66 n/a 34.7 10.5 49.5 0.0 5.3 Recent salary increase 1.19 1.15 n/a 36.3 26.3 23.8 10.0 3.8 __________________________________________________________________________________ n/a: not applicable.
The dress policy measure ranged from 1=Very Casual (All types of clothes are acceptable) to 5=Very Formal (People wear suits regardless of policy). A rating of 0 indicated no policy. Self-rated performance ranged from 1=Poor, in the lowest 30% to 5=Excellent, in the top 5%. Intentions to leave ranged from 1 =I intend to stay in my job until I retire to 5=I intend to leave my job as soon as possible. Job Satisfaction was measured using five items on a scale which ranged from 1=very unsatisfied to 5=very satisfied The frequency distribution represents cases where: 1 represents a mean scale score <= 1.50, 2=1.51-2.50, 3=2.51-3.50, 4=3.51-4.50, and 5=4.51-5.00. Perceptions of job effort were measured using ten items on a five-point Likert scale. The frequency distribution represents cases where: 1 represents a mean scale score <= 1.50, 2=1.51-2.50, 3=2.51-3.50, 4=3.51-4.50, and 5=4.51-5.00. Recent Salary Increases were measured using the following response scale: 1=less than 1.0%, 2=1.0% to 2.9%, 3=3.0% to 5.9%, 4=6.0% to 9.9%, and 5=10.0% or more. The fourth section, which was also designed for this study, included questions about specific policy information. This section included two lists of specific articles of clothing, such as khaki slacks, or tennis/athletic shoes. For each article listed, subjects rated that article as not acceptable, allowed but not preferred, preferred but not expected, and expected. Two different lists were provided; one for males and one for females (although many items appeared on both lists). The list for males to complete included 26 different articles of clothing, and the list for females included 42 different articles of clothing. Design and Subjects
Ninety-five students (92 from Introductory Psychology and 3 from Introduction to Management) at a mid-sized Midwestern college participated as subjects in the questionnaire study in exchange for extra credit. Eighty-two percent of subjects rated their primary racial category as Caucasian, and 67% were female. Forty-four percent were under 21 years old and 29% were between 21 and 25. Approximately 20
84
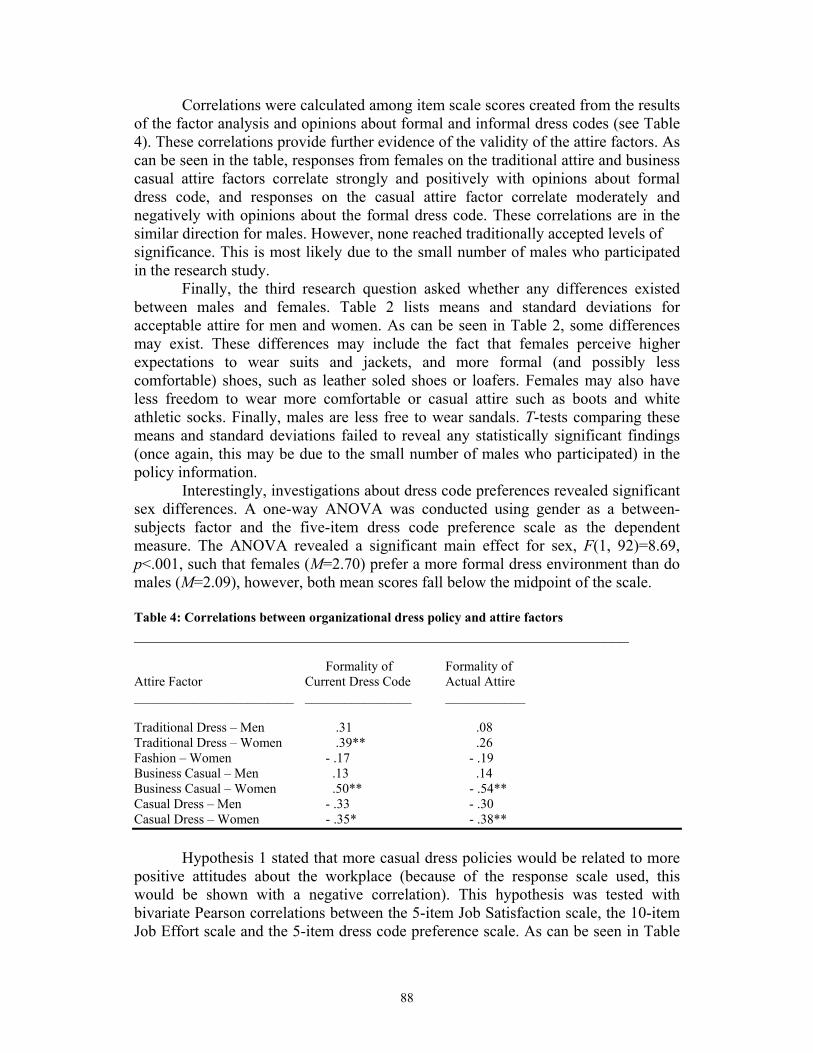
percent worked in clerical roles, approximately 20% in non-managerial professional roles, and approximately 20% in management or executive positions. Ninety-one percent of subjects worked either full- (43%) or part-time (48%), and of those who worked full time, they had worked between zero (N=3) and 21 years in their current career (M=4.2). Procedure
One of the authors distributed questionnaires during class. Students who returned questionnaires during the allotted time period received extra course credit (Response rate=37.5%). These questionnaires were completed on personal time. The remaining questionnaires were distributed by a research assistant to Introductory Psychology students during three research participation sessions; subjects signed up to participate in these sessions ahead of time. All students who attended sessions completed the questionnaire during the session, and all received extra course credit. Subjects received a brief verbal overview about the nature of the project and then gave their consent to participate. Following the brief overview, subjects completed questionnaires at their own pace because the questionnaire contained a complete set of self-explanatory instructions. Subjects were debriefed following participation.
Results
The first research question was a descriptive analysis designed to better understand typical dress policies in the workplace. Table 2 details the mean item scores for acceptable and preferred business attire, separated by male and female responses. As can be seen in Table 2, the typical attire preferred for men is dress slacks or khaki slacks, long-sleeved dress shirts or short-sleeved knit shirts with a collar, and loafers. The typical attire preferred for females is similar to that of males: dress pants or skirts without a jacket, khakis, long-sleeve blouses, short-sleeve blouses, or short-sleeved knit shirts with a collar, and leather flats or other low-heeled dress shoes. However, females also indicated that their organizations preferred suits, hose, sweaters, and turtlenecks. The second research question asked about whether typical attire categories exist in the workplace. Two principal-components exploratory factor analyses with a varimax rotation were conducted on the attire items; one for the items completed by males (number of items=26) and another for those completed by females (number of items=44)1. Table 3 provides a summary of these analyses. As predicted, three attire factors were found for males: traditional business attire, business casual attire, and casual dress attire. Similarly, the factor analysis for females revealed these same three factors. However, the analysis also revealed a fourth factor, termed Fashion Attire. This factor includes attire such as open-toed shoes, skirts that are above the knee or mid-thigh, and platform shoes.
1 Because of small sample size in this exploratory study, we violated some assumptions of factor analysis but the results of the two factor analyses were consistent with our expectations and each other, providing a form of cross-validation.
85
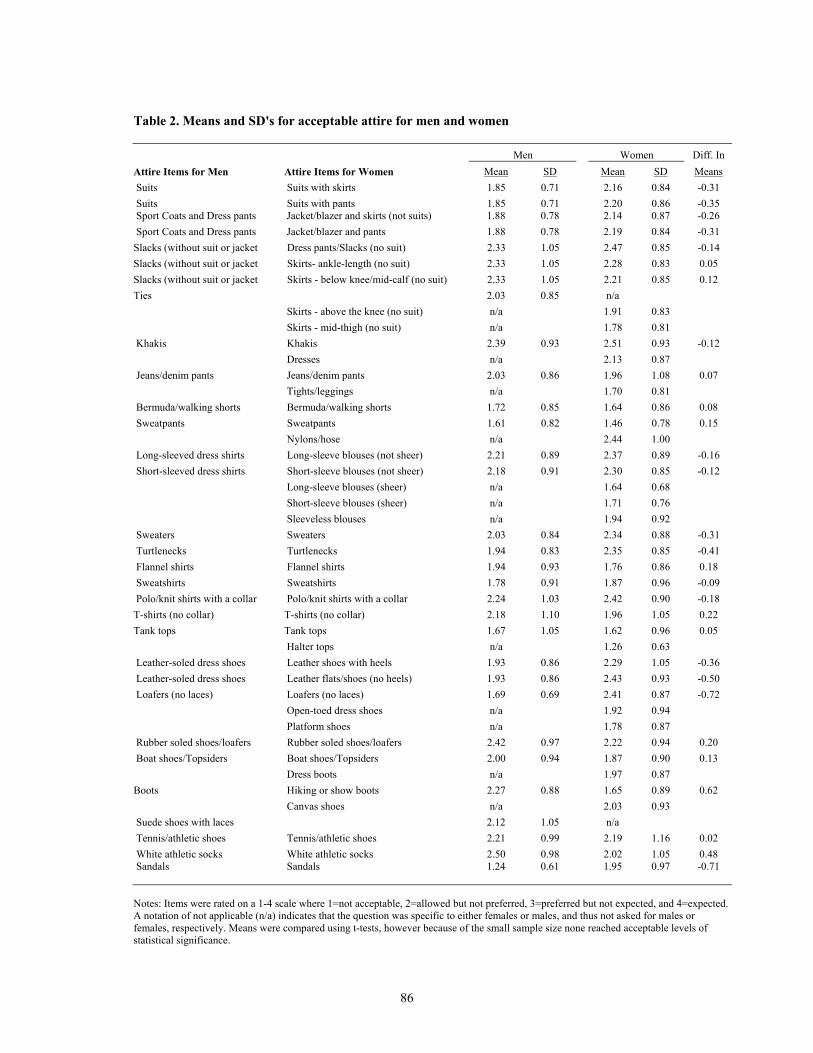
Table 2. Means and SD's for acceptable attire for men and women
Men Women Diff. In Attire Items for Men Attire Items for Women Mean SD Mean SD Means Suits Suits with skirts 1.85 0.71 2.16 0.84 -0.31 Suits Suits with pants 1.85 0.71 2.20 0.86 -0.35 Sport Coats and Dress pants Jacket/blazer and skirts (not suits) 1.88 0.78 2.14 0.87 -0.26 Sport Coats and Dress pants Jacket/blazer and pants 1.88 0.78 2.19 0.84 -0.31 Slacks (without suit or jacket Dress pants/Slacks (no suit) 2.33 1.05 2.47 0.85 -0.14 Slacks (without suit or jacket Skirts- ankle-length (no suit) 2.33 1.05 2.28 0.83 0.05 Slacks (without suit or jacket Skirts - below knee/mid-calf (no suit) 2.33 1.05 2.21 0.85 0.12 Ties 2.03 0.85 n/a Skirts - above the knee (no suit) n/a 1.91 0.83 Skirts - mid-thigh (no suit) n/a 1.78 0.81 Khakis Khakis 2.39 0.93 2.51 0.93 -0.12 Dresses n/a 2.13 0.87 Jeans/denim pants Jeans/denim pants 2.03 0.86 1.96 1.08 0.07 Tights/leggings n/a 1.70 0.81 Bermuda/walking shorts Bermuda/walking shorts 1.72 0.85 1.64 0.86 0.08 Sweatpants Sweatpants 1.61 0.82 1.46 0.78 0.15 Nylons/hose n/a 2.44 1.00 Long-sleeved dress shirts Long-sleeve blouses (not sheer) 2.21 0.89 2.37 0.89 -0.16 Short-sleeved dress shirts Short-sleeve blouses (not sheer) 2.18 0.91 2.30 0.85 -0.12 Long-sleeve blouses (sheer) n/a 1.64 0.68 Short-sleeve blouses (sheer) n/a 1.71 0.76 Sleeveless blouses n/a 1.94 0.92 Sweaters Sweaters 2.03 0.84 2.34 0.88 -0.31 Turtlenecks Turtlenecks 1.94 0.83 2.35 0.85 -0.41 Flannel shirts Flannel shirts 1.94 0.93 1.76 0.86 0.18 Sweatshirts Sweatshirts 1.78 0.91 1.87 0.96 -0.09 Polo/knit shirts with a collar Polo/knit shirts with a collar 2.24 1.03 2.42 0.90 -0.18 T-shirts (no collar) T-shirts (no collar) 2.18 1.10 1.96 1.05 0.22 Tank tops Tank tops 1.67 1.05 1.62 0.96 0.05 Halter tops n/a 1.26 0.63 Leather-soled dress shoes Leather shoes with heels 1.93 0.86 2.29 1.05 -0.36 Leather-soled dress shoes Leather flats/shoes (no heels) 1.93 0.86 2.43 0.93 -0.50 Loafers (no laces) Loafers (no laces) 1.69 0.69 2.41 0.87 -0.72 Open-toed dress shoes n/a 1.92 0.94 Platform shoes n/a 1.78 0.87 Rubber soled shoes/loafers Rubber soled shoes/loafers 2.42 0.97 2.22 0.94 0.20 Boat shoes/Topsiders Boat shoes/Topsiders 2.00 0.94 1.87 0.90 0.13 Dress boots n/a 1.97 0.87 Boots Hiking or show boots 2.27 0.88 1.65 0.89 0.62 Canvas shoes n/a 2.03 0.93 Suede shoes with laces 2.12 1.05 n/a Tennis/athletic shoes Tennis/athletic shoes 2.21 0.99 2.19 1.16 0.02 White athletic socks White athletic socks 2.50 0.98 2.02 1.05 0.48 Sandals
Sandals
1.24
0.61
1.95
0.97
-0.71
Notes: Items were rated on a 1-4 scale where 1=not acceptable, 2=allowed but not preferred, 3=preferred but not expected, and 4=expected. A notation of not applicable (n/a) indicates that the question was specific to either females or males, and thus not asked for males or females, respectively. Means were compared using t-tests, however because of the small sample size none reached acceptable levels of statistical significance.
86
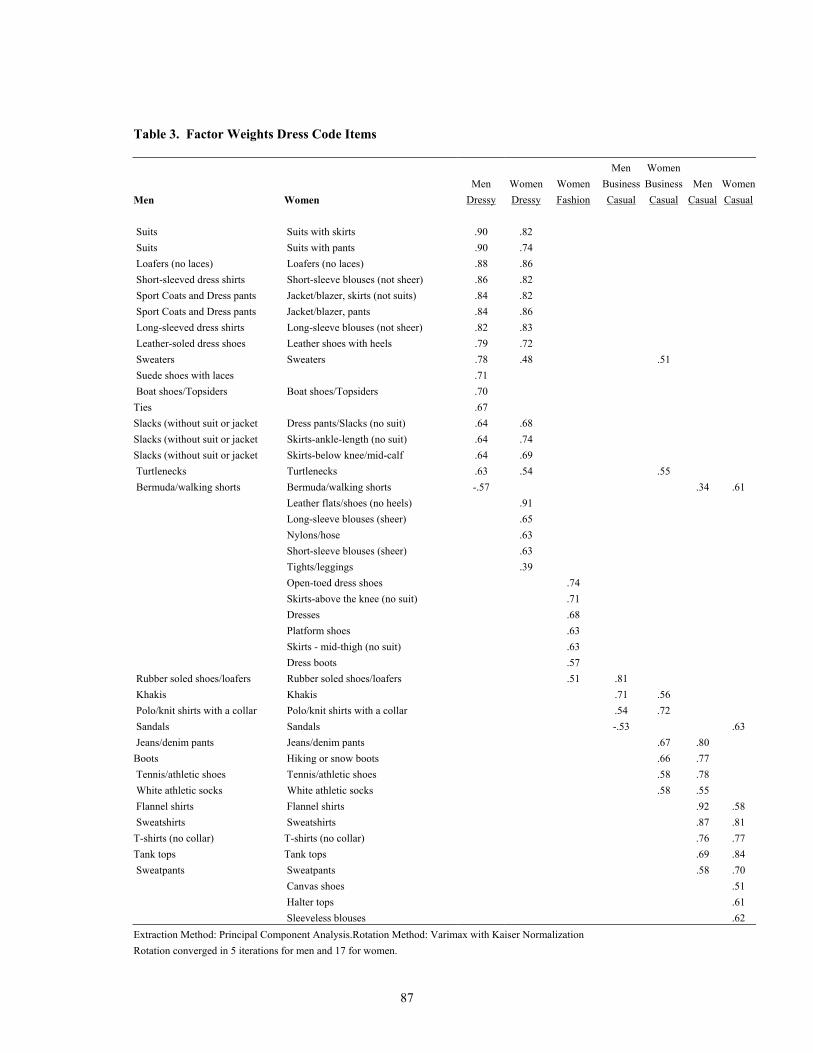
Table 3. Factor Weights Dress Code Items Men Women Men Women Women Business Business Men WomenMen Women Dressy Dressy Fashion Casual Casual Casual Casual Suits Suits with skirts .90 .82 Suits Suits with pants .90 .74 Loafers (no laces) Loafers (no laces) .88 .86 Short-sleeved dress shirts Short-sleeve blouses (not sheer) .86 .82 Sport Coats and Dress pants Jacket/blazer, skirts (not suits) .84 .82 Sport Coats and Dress pants Jacket/blazer, pants .84 .86 Long-sleeved dress shirts Long-sleeve blouses (not sheer) .82 .83 Leather-soled dress shoes Leather shoes with heels .79 .72 Sweaters Sweaters .78 .48 .51 Suede shoes with laces .71 Boat shoes/Topsiders Boat shoes/Topsiders .70 Ties .67 Slacks (without suit or jacket Dress pants/Slacks (no suit) .64 .68 Slacks (without suit or jacket Skirts-ankle-length (no suit) .64 .74 Slacks (without suit or jacket Skirts-below knee/mid-calf .64 .69 Turtlenecks Turtlenecks .63 .54 .55 Bermuda/walking shorts Bermuda/walking shorts -.57 .34 .61 Leather flats/shoes (no heels) .91 Long-sleeve blouses (sheer) .65 Nylons/hose .63 Short-sleeve blouses (sheer) .63 Tights/leggings .39 Open-toed dress shoes .74 Skirts-above the knee (no suit) .71 Dresses .68 Platform shoes .63 Skirts - mid-thigh (no suit) .63 Dress boots .57 Rubber soled shoes/loafers Rubber soled shoes/loafers .51 .81 Khakis Khakis .71 .56 Polo/knit shirts with a collar Polo/knit shirts with a collar .54 .72 Sandals Sandals -.53 .63 Jeans/denim pants Jeans/denim pants .67 .80 Boots Hiking or snow boots .66 .77 Tennis/athletic shoes Tennis/athletic shoes .58 .78 White athletic socks White athletic socks .58 .55 Flannel shirts Flannel shirts .92 .58 Sweatshirts Sweatshirts .87 .81 T-shirts (no collar) T-shirts (no collar) .76 .77 Tank tops Tank tops .69 .84 Sweatpants Sweatpants .58 .70 Canvas shoes .51 Halter tops .61 Sleeveless blouses .62 Extraction Method: Principal Component Analysis.Rotation Method: Varimax with Kaiser Normalization Rotation converged in 5 iterations for men and 17 for women.
87
Correlations were calculated among item scale scores created from the results of the factor analysis and opinions about formal and informal dress codes (see Table 4). These correlations provide further evidence of the validity of the attire factors. As can be seen in the table, responses from females on the traditional attire and business casual attire factors correlate strongly and positively with opinions about formal dress code, and responses on the casual attire factor correlate moderately and negatively with opinions about the formal dress code. These correlations are in the similar direction for males. However, none reached traditionally accepted levels of significance. This is most likely due to the small number of males who participated in the research study. Finally, the third research question asked whether any differences existed between males and females. Table 2 lists means and standard deviations for acceptable attire for men and women. As can be seen in Table 2, some differences may exist. These differences may include the fact that females perceive higher expectations to wear suits and jackets, and more formal (and possibly less comfortable) shoes, such as leather soled shoes or loafers. Females may also have less freedom to wear more comfortable or casual attire such as boots and white athletic socks. Finally, males are less free to wear sandals. T-tests comparing these means and standard deviations failed to reveal any statistically significant findings (once again, this may be due to the small number of males who participated) in the policy information. Interestingly, investigations about dress code preferences revealed significant sex differences. A one-way ANOVA was conducted using gender as a between-subjects factor and the five-item dress code preference scale as the dependent measure. The ANOVA revealed a significant main effect for sex, F(1, 92)=8.69, p<.001, such that females (M=2.70) prefer a more formal dress environment than do males (M=2.09), however, both mean scores fall below the midpoint of the scale. Table 4: Correlations between organizational dress policy and attire factors ______________________________________________________________ Formality of Formality of Attire Factor Current Dress Code Actual Attire ________________________ ________________ ____________ Traditional Dress – Men .31 .08 Traditional Dress – Women .39** .26 Fashion – Women - .17 - .19 Business Casual – Men .13 .14 Business Casual – Women .50** - .54** Casual Dress – Men - .33 - .30 Casual Dress – Women - .35* - .38** Hypothesis 1 stated that more casual dress policies would be related to more positive attitudes about the workplace (because of the response scale used, this would be shown with a negative correlation). This hypothesis was tested with bivariate Pearson correlations between the 5-item Job Satisfaction scale, the 10-item Job Effort scale and the 5-item dress code preference scale. As can be seen in Table
88
5, there is no significant relationship between preferences about dress code and job satisfaction. To further examine whether dress code polices are related to attitudes, the single item measuring intentions to leave was compared to the 5-item dress code preference scale. Similar to the previous results, no significant correlation was found between intentions to leave and the 5-item dress code preference scale. Finally, a bivariate correlation was conducted between the perceptions of job effort scale and the six dress code preference items, as well as the 5-item scale. As can be seen in Table 5, there is a significant positive relationship between preferences for a formal dress code and perceptions of job effort. An additional variable was calculated by subtracting responses about preferred attire policy from those of typical attire. An analysis revealed a significant negative relationship between this difference score and perceptions of job effort, suggesting that subjects who prefer to work in a casual environment perceive they put in less effort when working in a formal environment. Thus, hypothesis 1 received limited support. Hypothesis 2 stated that casual dress policies would be either positively (hypothesis 2a) or negatively (hypothesis 2b) related to measures of performance. This hypothesis was also tested with bivariate Pearson correlations. For this analysis, self-ratings of performance were compared to the six dress code policy items. Once again, the analysis failed to reveal any significant correlations. Thus, hypothesis 2 also failed to receive any support.
Discussion
The present study had two goals. The first was to determine whether trends about dress code policies exist in the workplace. The second was to determine whether these policies have any impact on attitudes or performance. Regarding the first goal, this research reveals the typical types of attire that are common in today’s work environment. Furthermore, the research demonstrated that there are a relatively small number of categories of attire, which can be clearly delineated. Finally, the study revealed that there might be gender differences in expectations about dress. The second goal, to determine whether dress code policy information had a relationship with attitudes, was not satisfied. In our sample, employee preferences for type of dress failed to predict job satisfaction, intentions to leave, or self-reports of job performance. Interestingly, however, employees who prefer more formal dress perceive themselves as putting in more effort, even though this does not seem to be the same for reported performance outcomes. Further, these preliminary results demonstrate the potential importance of matching policies to employee preferences: those who work in formal environments may actually put in less effort when they would prefer to work in a casual environment. If perceptual rather than actual performance differences are supported by subsequent research, then the trend toward business casual and casual dress environments should continue as long as employees request it and it does not negatively impact other job attitudes such as satisfaction or intentions to leave.
89
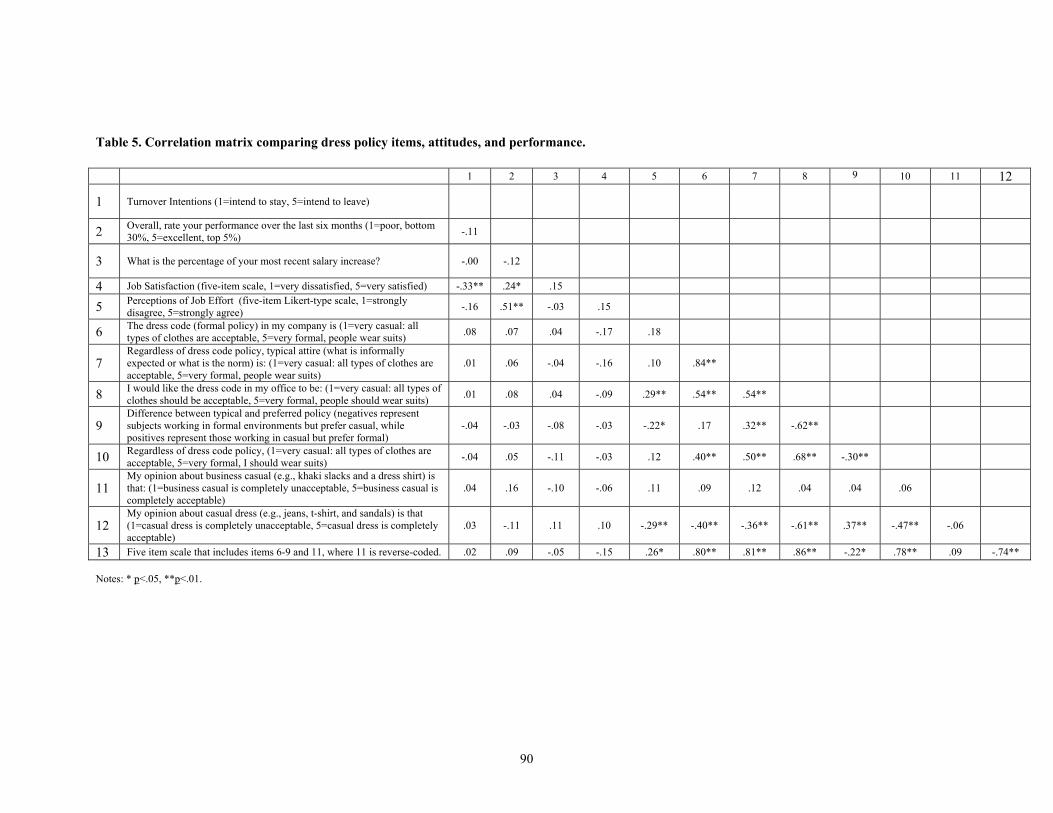
Table 5. Correlation matrix comparing dress policy items, attitudes, and performance. 1 2 3 4 5 6 7 8 9 10 11 12
1 Turnover Intentions (1=intend to stay, 5=intend to leave)
2 Overall, rate your performance over the last six months (1=poor, bottom 30%, 5=excellent, top 5%) -.11
3 What is the percentage of your most recent salary increase? -.00 -.12
4 Job Satisfaction (five-item scale, 1=very dissatisfied, 5=very satisfied) -.33** .24* .15
5 Perceptions of Job Effort (five-item Likert-type scale, 1=strongly disagree, 5=strongly agree) -.16 .51** -.03 .15
6 The dress code (formal policy) in my company is (1=very casual: all types of clothes are acceptable, 5=very formal, people wear suits) .08 .07 .04 -.17 .18
7 Regardless of dress code policy, typical attire (what is informally expected or what is the norm) is: (1=very casual: all types of clothes are acceptable, 5=very formal, people wear suits)
.01 .06 -.04 -.16 .10 .84**
8 I would like the dress code in my office to be: (1=very casual: all types of clothes should be acceptable, 5=very formal, people should wear suits) .01 .08 .04 -.09 .29** .54** .54**
9 Difference between typical and preferred policy (negatives represent subjects working in formal environments but prefer casual, while positives represent those working in casual but prefer formal)
-.04 -.03 -.08 -.03 -.22* .17 .32** -.62**
10 Regardless of dress code policy, (1=very casual: all types of clothes are acceptable, 5=very formal, I should wear suits) -.04 .05 -.11 -.03 .12 .40** .50** .68** -.30**
11 My opinion about business casual (e.g., khaki slacks and a dress shirt) is that: (1=business casual is completely unacceptable, 5=business casual is completely acceptable)
.04 .16 -.10 -.06 .11 .09 .12 .04 .04 .06
12 My opinion about casual dress (e.g., jeans, t-shirt, and sandals) is that (1=casual dress is completely unacceptable, 5=casual dress is completely acceptable)
.03 -.11 .11 .10 -.29** -.40** -.36** -.61** .37** -.47** -.06
13 Five item scale that includes items 6-9 and 11, where 11 is reverse-coded. .02 .09 -.05 -.15 .26* .80** .81** .86** -.22* .78** .09 -.74** Notes: * p<.05, **p<.01.
90
Finally, one of the most interesting findings is the difference between men and women in preference for formality of dress. Although men and women both reported preferences that were to the casual side of the scale midpoint between formal and casual, women in our sample preferred to dress more formally than did men. This may indicate gender biases in the workplace resulting from how people dress. This idea, however, needs further investigation. Two limitations with our exploratory study are listed below, and lead us to recommend caution when making generalizations from these results. The first limitation is the sample used in the study—a convenience sample of Introduction to Psychology and Introduction to Management students. This sample clearly may not be representative of the typical working population. However, many of these students work full-time in professional or managerial positions. A second major limitation in the present study is in using policy information from subjects working in their current positions to predict attitudes and performance. It is clear that employees choose companies that fit their value system (see Schneider, 1987). This means that employees in this sample may have chosen companies with dress code policies that fit their expectations. Once again, we recommend using caution when making any generalizations from the current study. This study can give fairly clear guidance for future research. First, similar research should be conducted using a sample of working adults. This would eliminate many of the problems in the present study and allow practitioners to make better generalizations from any results. Second, research should be designed to study changes in performance and attitudes as organizations change from traditional environments to more casual ones or from more casual environments to traditional ones. Direct quasi-experimental comparisons of changes in employee attitudes and behavior would help to eliminate issues with self-selection of professionals into organizations that have policies consistent with their values. Third, we examined self-perceptions in this study. However, future research can examine the effect of dress and dress policies on the perceptions of others, such as customers. It may be that dress policies have an absolute effect on the perception of others (e.g., clients of prefer lawyers to dress in a more traditional manner), but it is more likely that there is an interactive effect between the company policy and others (e.g., clients who work in causal environments prefer lawyers to dress more casually). Two major sets of recommendations for human resources professionals could result from the present research. First, human resource professionals could use the policy information from this study to determine what types of attire should fit in the specific dress code policy in their organizations. Although we only collected information from a small number of subjects, the types of acceptable attire fell neatly into three clear categories for men and women, with an additional category for women. Human resource professionals can use these categories as a starting point when defining policies within their organizations. Second, at this point we can tentatively recommend that organizations change their dress policy to best fit their organizational culture. We failed to find any relationships between dress codes and attitudes or performance. If this is the case, there is no evidence to prevent an organization from implementing a dress code policy, whether casual, business casual, or traditional, that best suits its own needs. Because of the aforementioned
91
limitations with our sample, we again recommend caution for anyone who wishes to make generalizations from these research results and careful, systematic evaluations for any organization making policy changes. Regardless, researchers investigating organizational climate or culture issues may wish to include dress policies as an additional variable. The appendix includes recommendations from this study for instructions and rating scales for suggested items. We also recommend collecting information on employee level (e.g., manager, professional, etc.) and function (e.g., sales, engineering, etc.). In closing, this research provides some preliminary guidance for organizations if they change dress code policies. Based on our research, we recommend that organizations carefully define the attire that is acceptable, provide clear examples for employees to follow, and then carefully evaluate the impact of these changes. Second, we believe that more research about business casual and its effect in the workplace is necessary. This exploratory study is one of only a small number that examines the policies that exist and how they impact workplace attitudes and behavior. As more organizations move to business casual dress policies (Leonard, 2001; Walter, 1996), and as these policies become entrenched in today’s corporate culture, more research can provide human resource professionals with the facts they need to make informed policy decisions.
References
Adams, J. (1988, August). A healthy cut in costs. Personnel Administrator, 42-47. Allen, N.J., & Meyer, J.P. (1990). The measurement and antecedents of affective, continuance,
and normative commitment. Journal of Occupational Psychology,63(1), 1-18. Bragg, R. (1994, July 15). Dressing down for the job. The New York Times, 143(49758), p. A1. Brody, N. and Ehrlichman, H. (1998). Personality psychology: The science of individuality (Ch.
2, pp. 28-29). Upper Saddle River, NJ: Prentice Hall. Brown, S.P., & Leigh, T.W. (1996). A new look at psychological climate and its relationship to
job involvement, effort, and performance. Journal of Applied Psychology,81, 358-368. Campion, M.A., Cheraskin, L., & Stevens, M.J. (1994). Career-related antecedents and outcomes
of job rotation. Academy of Management Journal, 37, 1518-1542. Ferris, G.R., & Rowland, K.M. (1987). Tenure as a moderator of the absence-intent to leave
relationship. Human Relations, 49, 225-266. Fink, A. (1995). The survey handbook: Volume 1 of the survey kit. Thousand Oaks, CA: Sage
Publications. Goldstein, I.L., & Ford, J. K. (2002). Training in Organizations (4th ed.). Pacific Grove, CA:
Wadsworth. Helmreich, R.L., Spence, J.T., & Pred, R.S. (1988). Making it without losing it: Type A,
achievement motivation, and scientific attainment revisited. Personality and Social Psychology Bulletin, 14, 495-504.
Jin, P. (1993). Work motivation and productivity in voluntary formed work teams: A field study in China. Organizational Behavior and Human Decision Processes, 54, 133-155.
Kazakoff, L. (1996). Dress-down Friday. San Francisco Chronicle, C1-C2. Kwon, Y. (1994a). Feeling toward one’s clothing and self-perception of emotion, sociability, and
work competency. Journal of Social Behavior and Personality, 9, 129-139. Kwon, Y. (1994b). The influence of appropriateness of dress and gender on the self-perception of
occupational attributes. Clothing and Textiles Research Journal, 12(3), 33-39. Leonard, B. (2001). Casual dress may be the policy, but appearances still count. HR Magazine,
46(8),34.
92
Liskey-Fitzwater, N., Moore, C.L., & Gurel, L.M. (1993). Clothing importance and self-perception of female adolescents with and without scoliosis. Clothing and Textiles Research Journal, 11(3), 16-22.
McGee, L. (1988, June). Keeping up the good work. Personnel Administrator, 68-72. Miller, K.A. (1997). Dress: Private and secret self-expression. Clothing and Textiles Research
Journal, 15(4), 223-234. Pratt, M.G., & Rafaeli, A. (1997). Organizational dress as a symbol of multilayered social
identities. Academy of Management Journal, 40, 862-898. Price, J.L., & Mueller, C.W. (1986). Handbook of organizational measurement. Marshfield, MA:
Pitman Publishing. Rafaeli, A. Dutton, J. Harquail, C.V., & Mackie-Lewis, S. (1997). Navigating by attire: The use
of dress by female administrative employees. Academy of Management Journal, 40(1), 9-45. Schneider, B. (1987). The people make the place. Personnel Psychology, 40, 437-454. Symon, G., & Cassell, C. (1998). Qualitative methods and analysis in organizational research.
Thousand Oaks, CA: Sage Publications, Inc. Tabachnick, B.G., & Fidell, L.S. (1989). Using multivariate statistics (2nd edition). New York,
NY: Harper Collins Publishers. VanDyne, L., Graham, J.W., & Dienesch, R.M. (1994). Organizational citizenship behaviors:
Construct redefinition, measurement, and validation. Academy of Management Journal, 37, 765-802. Walter, K. (1996, June). Dress for success and comfort. HR Magazine, 55-56. Wright, T.A., & Cropanzano, R. (1998). Emotional exhaustion as a predictor of job performance
and voluntary turnover. Journal of Applied Psychology, 83, 486-493. Yates, D.A., & Jones, G. (1998). Casual dress days: Are there bottom-line impacts? Organization
Development Journal, 16, 107-111. Address comments or questions regarding this article to: Dr. Timothy M. Franz Department of Psychology St. Fisher College 3690 East Avenue Rochester, NY 14618 (716) 385-8170 [email protected]
93
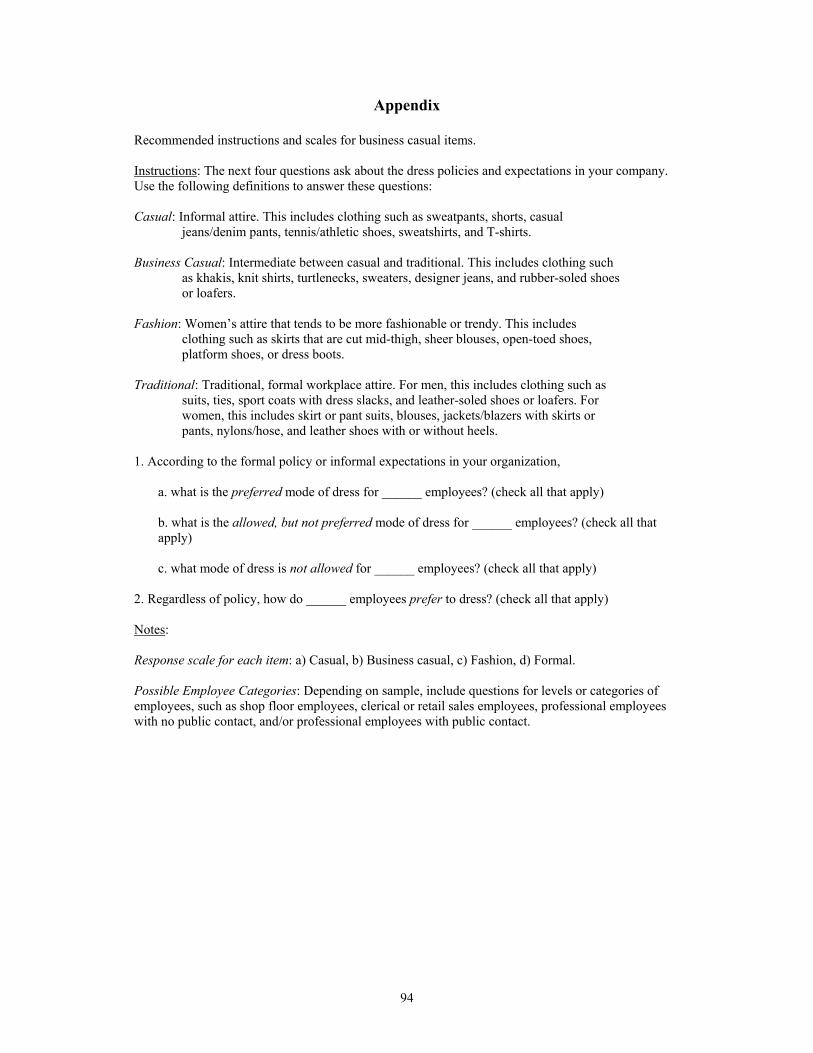
Appendix Recommended instructions and scales for business casual items. Instructions: The next four questions ask about the dress policies and expectations in your company. Use the following definitions to answer these questions: Casual: Informal attire. This includes clothing such as sweatpants, shorts, casual
jeans/denim pants, tennis/athletic shoes, sweatshirts, and T-shirts. Business Casual: Intermediate between casual and traditional. This includes clothing such
as khakis, knit shirts, turtlenecks, sweaters, designer jeans, and rubber-soled shoes or loafers.
Fashion: Women’s attire that tends to be more fashionable or trendy. This includes
clothing such as skirts that are cut mid-thigh, sheer blouses, open-toed shoes, platform shoes, or dress boots.
Traditional: Traditional, formal workplace attire. For men, this includes clothing such as
suits, ties, sport coats with dress slacks, and leather-soled shoes or loafers. For women, this includes skirt or pant suits, blouses, jackets/blazers with skirts or pants, nylons/hose, and leather shoes with or without heels.
1. According to the formal policy or informal expectations in your organization, a. what is the preferred mode of dress for ______ employees? (check all that apply)
b. what is the allowed, but not preferred mode of dress for ______ employees? (check all that apply)
c. what mode of dress is not allowed for ______ employees? (check all that apply) 2. Regardless of policy, how do ______ employees prefer to dress? (check all that apply) Notes: Response scale for each item: a) Casual, b) Business casual, c) Fashion, d) Formal. Possible Employee Categories: Depending on sample, include questions for levels or categories of employees, such as shop floor employees, clerical or retail sales employees, professional employees with no public contact, and/or professional employees with public contact.
94