Embed Size (px)
Citation preview

Investigating the role of nuclear myosin I in
the low serum induced repositioning of
chromosome 10 in interphase nuclei
Thesis submitted for the degree of
Master of Philosophy
at Brunel University, West London
by
Manelle Amira
Division of Bioscience
School of Health Sciences and Social Care
Brunel University, West London
September 2009

Abstract
The nucleus of mammalian cells has been proven to be highly organised. A
recent study on interphase chromosome positioning has identified low serum
induced rapid chromosome repositioning. Chromosome 10 initially localised
at an intermediate position in normal proliferating human dermal fibroblasts
(HDF) was found to relocate to the nuclear periphery 15 minutes after the cells
have been incubated in low serum. Whereas chromosome X has remained in
a peripheral position. The relocation of chromosome 10 has been shown to
be dependant on both actin and myosin functions. In this project we have
further investigated the possible role of nuclear myosin I in chromosome 10
repositioning. Using siRNA to block the expression of the nuclear myosin I
(NMI) we were able to identify this nuclear myosin as necessary for the rapid
repositioning of chromosome 10. Furthermore, using image analysis software
we investigated the effect of the NMI knock down on the overall nuclear size
and shape. The analysis has revealed that while the nuclear size of normal
proliferating cells remained unchanged after the low serum incubation both
in cells expressing the NMI and NMI depleted cells, the knock down of the
NMI seems to have affected the nuclear shape when the cells were subjected
to the serum incubation. On the other hand, the analysis of the chromosome
territories area has revealed significant differences in the chromosome territories
sizes before and after the low serum incubation, in normal proliferating HDF
cells .
i

Acknowledgements
I would first of all like to express my sincere thanks to my supervisors; Dr.
Joanna Bridger, not only for her advice and guidance during this research, but
for all her encouragement and support, Dr. Amanda Harvey for her support
and valuable input throughout this project.
I would like to acknowledge The School of health sciences and social care
for proving funding for this project’s consumables.
My thanks also go to Ishita Mehta for her FISH images and help, Lauren,
Ed and Raj for their help and friendliness. As it is impossible to acknowledge
everyone, I would like to thank all those who have contributed, in any way, to
this research.
My deepest gratitude goes to my loving husband for his patience and sup-
port, all my family and friends for their constant encouragement, love and for
the never failing confidence they have in me.
Finally and above all, I shall express all praises to God, as it was with his
help, that I was able to complete this work.
ii

List of Abbreviations
2D Two dimentional
2DD Human dermal fibroblast cell line
2G2 Anti actin antibody 1999 Gonsior, S.M. et al
ATP Adenosine triphosphate
BAF BRG-associated factor
BAP Brm-associated protein
C02 Carbon dioxide
cm Centimeter
CT Chromosome territory
Cy3 Cyanine 3
DAPI 4, 6-Diamidino-2-phenylindole
DFC Dense fibrillar component
D-MEM Delbeco’s modified Eagles Medium
DNA Deoxyribonucleic acid
EDTA Ethylenediamenetetra- acetic acid
Exp6 Exportin 6
FC Fibrillar centre
FISH Fluorescence in situ hybridisation
FRAP Fluorescence recovery after photo bleaching
G1 Gap phase 1
GC Granular centre
HDF Human dermal fibroblast
hnPNP Hetero nuclear ribonucleoproteins
iii

iv
KCl Potassium Chloride
KDa Kilo Dalton
MDa Mega Dalton
NCS Newborn calf serum
NES Nuclear export signal
NLS Nuclear Localisation Signal
NMI Nuclear myosin I
NuA4 Nucleosomal acetyltransferase of histone 4
PHA Phytohemagglutinin
rDNA Ribosomal DNA
RNA Ribonucleic acid
rpm Rotations per minute
S DNA synthesis phase of the cell cycle
siRNA Small interfering RNA
snRNP Small nuclear ribonucleoprotein
SSC Sodium Saline Citrate
SWI/SNF The switch mating type/sucrose non-fermenting
WSTF Williams Syndrome Transcription Factor

Contents
Abstract i
Acknowledgements ii
List of Abbreviations iii
1 Introduction 1
1.1 Architecture of the nucleus . . . . . . . . . . . . . . . . . . . . . 1
1.1.1 Nuclear envelope . . . . . . . . . . . . . . . . . . . . . . 1
1.1.2 Chromatin and Chromosomes . . . . . . . . . . . . . . . 2
1.1.3 Nuclear bodies . . . . . . . . . . . . . . . . . . . . . . . 4
1.1.4 Nuclear matrix . . . . . . . . . . . . . . . . . . . . . . . 6
1.2 Nuclear motors . . . . . . . . . . . . . . . . . . . . . . . . . . . 7
1.2.1 Nuclear actin . . . . . . . . . . . . . . . . . . . . . . . . 7
1.2.2 Nuclear Myosin I . . . . . . . . . . . . . . . . . . . . . . 15
1.2.3 Other myosins in the nucleus . . . . . . . . . . . . . . . 19
1.2.4 Functions of the Actin- Nuclear Myosin I complex . . . . 22
1.3 Aims of the project . . . . . . . . . . . . . . . . . . . . . . . . . 26
2 Methods and Materials 27
2.1 Laboratory based methods . . . . . . . . . . . . . . . . . . . . . 28
2.1.1 Tissue culture . . . . . . . . . . . . . . . . . . . . . . . . 28
2.1.2 Low serum assay . . . . . . . . . . . . . . . . . . . . . . 29
29
v
Contents vi
2.1.4 Image acquisition . . . . . . . . . . . . . . . . . . . . . . 32
2.1.5 Small interfering RNA (siRNA) . . . . . . . . . . . . . . 32
2.2 Computer Based Methods . . . . . . . . . . . . . . . . . . . . . 34
2.2.1 Web-based search . . . . . . . . . . . . . . . . . . . . . . 34
2.2.2 Sequence alignment tool . . . . . . . . . . . . . . . . . . 35
2.2.3 Design of siRNA constructs . . . . . . . . . . . . . . . . 37
2.2.4 Image analysis . . . . . . . . . . . . . . . . . . . . . . . . 38
3 The role of Nuclear Myosin 1 in interphase chromosomes posi-
tioning 44
3.1 Chromosome 10 positioning . . . . . . . . . . . . . . . . . . . . 45
3.1.1 Chromosome 10 repositioning before and after the low
serum assay . . . . . . . . . . . . . . . . . . . . . . . . . 45
3.1.2 Chromosome 10 positioning before and after the low serum
assay in NMI depleted cells [NMI(−)] . . . . . . . . . . . 50
3.2 Chromosome X positioning . . . . . . . . . . . . . . . . . . . . . 54
3.2.1 Chromosome X positioning before and after the low serum
assay in NMI depleted cells [NMI(−)] . . . . . . . . . . . 55
4 Results: Image Analysis 58
4.1 Analysis of nuclear size . . . . . . . . . . . . . . . . . . . . . . . 58
4.1.1 Investigating the effects of the low serum assay on the
nuclear size . . . . . . . . . . . . . . . . . . . . . . . . . 58
4.1.2 Investigating effects of the siRNA- mediated suppression
of NMI on the nuclear size . . . . . . . . . . . . . . . . . 64
4.2 Analysis of the nuclear shape . . . . . . . . . . . . . . . . . . . 74
4.2.1 Investigating the effect of the low serum assay on nuclear
shape . . . . . . . . . . . . . . . . . . . . . . . . . . . . 75
4.2.2 Investigating the effect of NMI silencing on nuclear shape 76
4.3 Image analysis of chromosome 10 and X territories . . . . . . . . 83
4.3.1 Image analysis of chromosome 10 territories . . . . . . . 83

Contents vii
4.3.2 Comparison of chromosome chromosome 10 territories be-
fore and after the low serum assay . . . . . . . . . . . . . 85
4.3.3 Comparison of chromosome 10 territories before and after
the low serum assay of NMI depleted cells . . . . . . . . 87
4.3.4 Image analysis of chromosome X territories . . . . . . . . 89
4.3.5 Comparison of chromosome chromosome X territories be-
fore and after the low serum assay . . . . . . . . . . . . . 90
4.3.6 Comparison of chromosome X territories before and after
the low serum assay of NMI depleted cells . . . . . . . . 91
5 Discussions 93
5.1 Role of the nuclear myosin I in chromosome positioning . . . . . 93
5.2 Role of the nuclear myosin I in maintaining nuclear shape . . . . 94
5.3 Effect of the nuclear myosin I on chromosome territories size . . 95
5.4 Conclusion . . . . . . . . . . . . . . . . . . . . . . . . . . . . . . 96

List of Figures
1.1 Cartoon showing the nuclear architecture . . . . . . . . . 2
1.2 Cartoon representation of a globular actin molecule . . . 8
1.3 Double helix strand of F actin. . . . . . . . . . . . . . . . . 8
1.4 Cartoon of myosin I. . . . . . . . . . . . . . . . . . . . . . . 16
1.5 Identified nuclear myosins . . . . . . . . . . . . . . . . . . . 20
2.1 Alignment tools on the EBI website. . . . . . . . . . . . . 35
2.2 ClustalW2 alignment tool settings. . . . . . . . . . . . . . 36
2.3 Corel Paint Shop Pro XI (RGB Split channels) . . . . . . 39
2.4 Scion image analysis. . . . . . . . . . . . . . . . . . . . . . . 40
2.5 Density slice on Scion image. . . . . . . . . . . . . . . . . . 41
2.6 Setting the measurements options. . . . . . . . . . . . . . . 42
2.7 Setting the measurement scale to micrometers. . . . . . . 43
3.1 Sample of chromosome 10 FISH images at 0 minute. . . 46
3.2 Sample of chromosome 10 FISH images at 15 minutes. . 47
3.3 Chromosome 10 positioning in nuclei of normal prolifer-
ating HDFs at 0 minute. . . . . . . . . . . . . . . . . . . . . 48
3.4 Chromosome 10 positioning in nuclei of normal prolifer-
ating HDFs at 15 minutes. . . . . . . . . . . . . . . . . . . . 49
3.5 Chromosome 10 positioning in nuclei of normal prolifer-
ating HDFs before and after the low serum incubation. 50
3.6 Sample of chromosome 10 FISH images at 0 minute in
NMI depleted cells. . . . . . . . . . . . . . . . . . . . . . . . 51
viii

List of Figures ix
3.7 Sample of chromosome 10 FISH images at 15 minute in
NMI depleted cells. . . . . . . . . . . . . . . . . . . . . . . . 52
3.8 Chromosome 10 positioning in NMI depleted nuclei be-
fore the low serum assay. . . . . . . . . . . . . . . . . . . . . 52
3.9 Chromosome 10 positioning in NMI depleted nuclei after
the low serum assay. . . . . . . . . . . . . . . . . . . . . . . . 53
3.10 Chromosome X positioning in NMI expressing nuclei at
0 minute. . . . . . . . . . . . . . . . . . . . . . . . . . . . . . . 54
3.11 Chromosome X positioning in NMI expressing nuclei at
15 minutes. . . . . . . . . . . . . . . . . . . . . . . . . . . . . 55
3.12 Chromosome X positioning in NMI depleted cells at 0
minute. . . . . . . . . . . . . . . . . . . . . . . . . . . . . . . . 56
3.13 Chromosome X positioning in NMI depleted cells at 15
minutes. . . . . . . . . . . . . . . . . . . . . . . . . . . . . . . 57
4.1 First comparison of the means nuclear area before and
after the low serum assay. . . . . . . . . . . . . . . . . . . . 60
4.2 Second comparison of the means nuclear area before and
after the low serum assay. . . . . . . . . . . . . . . . . . . . 62
4.3 Third comparison of the means nuclear area before and
after the low serum assay. . . . . . . . . . . . . . . . . . . . 63
4.4 Comparison of the means nuclear area before and after
the silencing of the NMI. . . . . . . . . . . . . . . . . . . . . 66
4.5 Comparison of the means nuclear area before and after
the low serum incubation in NMI depleted cells, data set
1. . . . . . . . . . . . . . . . . . . . . . . . . . . . . . . . . . . . 67
4.6 Comparison of the means nuclear area before and after
the low serum incubation of NMI depleted cells, data set 2 69
4.7 Comparison of the means nuclear area before and after
the low serum incubation of non NMI targeting siRNA
transfected nuclei 1. . . . . . . . . . . . . . . . . . . . . . . . 70

List of Figures x
4.8 Comparison of the means nuclear area before and after
the low serum incubation in non NMI targeting siRNA
transfected nuclei 2. . . . . . . . . . . . . . . . . . . . . . . . 72
4.9 HDFs, NMI(+) nuclei at 0 minute. . . . . . . . . . . . . . . 77
4.10 HDFs, NMI(−) nuclei at 0 minute. . . . . . . . . . . . . . . 77
4.11 HDFs, NMI(+) nuclei at 15 minutes . . . . . . . . . . . . . 80
4.12 HDFs, NMI(−) nuclei at 15 minutes . . . . . . . . . . . . . 80
4.13 Green channel of FISH images of chromosome 10 at 0
minute. . . . . . . . . . . . . . . . . . . . . . . . . . . . . . . . 84
4.14 Green channel of FISH images of chromosome 10 at 15
minutes. . . . . . . . . . . . . . . . . . . . . . . . . . . . . . . 84
4.15 Comparison of the size of chromosome 10 at 0 and 15
minutes.1 . . . . . . . . . . . . . . . . . . . . . . . . . . . . . . 85
4.16 Comparison of the size of chromosome 10 at 0 and 15
minutes.2 . . . . . . . . . . . . . . . . . . . . . . . . . . . . . . 86
4.17 Comparison of the size of chromosome 10 of NMI de-
pleted nuclei before and after the low serum incubation. 87
4.18 Green channel of FISH images of chromosome X at 0
minute . . . . . . . . . . . . . . . . . . . . . . . . . . . . . . . 89
4.19 Green channel of FISH images of chromosome X at 15
minutes . . . . . . . . . . . . . . . . . . . . . . . . . . . . . . . 90
4.20 Comparison of the size of chromosome X at 0 and 15
minutes. . . . . . . . . . . . . . . . . . . . . . . . . . . . . . . 91
4.21 Comparison of the size of chromosome X at 0 and 15
minutes of NMI depleted nuclei . . . . . . . . . . . . . . . 92

List of Tables
1.1 Actin-binding proteins in the nucleus . . . . . . . . . . . . . . . 12
1.2 Nuclear complexes that contain actin . . . . . . . . . . . . . . . 14
1.3 Reconciliation of myosin I names in the literature . . . . . . . . 17
4.1 Significance test for the nuclear size difference before and after
low serum assay, data set 1. . . . . . . . . . . . . . . . . . . . . 61
4.2 Significance test for the nuclear size difference before and after
low serum assay, data set 2. . . . . . . . . . . . . . . . . . . . . 61
4.3 Significance test for the nuclear size difference before and after
low serum assay, data set 3 . . . . . . . . . . . . . . . . . . . . . 63
4.4 Significance test for the difference in nuclear area before and after
the silencing of the NMI. . . . . . . . . . . . . . . . . . . . . . . 66
4.5 Significance test for the nuclear size difference before and after
low serum assay, in NMI depleted nuclei. data set 1 . . . . . . . 68
4.6 Significance test for the nuclear size difference before and after
low serum assay, in NMI depleted nuclei. data set 2 . . . . . . . 69
4.7 Significance test for the nuclear size difference before and after
low serum assay, in negative control(NMI(−C))cells, 1. . . . . . . 71
4.8 Significance test for the nuclear size difference before and after
low serum assay, in siRNA NMI negative control(NMI(−C))nuclei,
2. . . . . . . . . . . . . . . . . . . . . . . . . . . . . . . . . . . . 72
4.9 Significance test for the difference in nuclear contour ratio before
and after the low serum assay . . . . . . . . . . . . . . . . . . . 75
xi

List of Tables xii
4.10 Significance test for the difference in nuclear contour ratio before
and after the silencing of the NMI . . . . . . . . . . . . . . . . . 78
4.11 Significance test for the difference in nuclear contour ratio before
and after the silencing of the NMI . . . . . . . . . . . . . . . . . 79
4.12 Significance test for the difference in nuclear contour ratio before
and after the silencing of the NMI at 15 minute of the low serum
assay . . . . . . . . . . . . . . . . . . . . . . . . . . . . . . . . . 81
4.13 Significance test for the difference in nuclear contour ratio before
and after the silencing of the NMI at 15 minute of the low serum
assay, 2 . . . . . . . . . . . . . . . . . . . . . . . . . . . . . . . 82

Chapter 1
Introduction
1.1 Architecture of the nucleus
The eukaryotic cell nucleus, figure 1.1 houses most of the genetic material of
the cell. It accommodates all the materials and structures necessary for genome
replication and DNA repair, timely control of gene expression and processing
of transcripts. To perform these functions efficiently, the nucleus is extremely
well organised with several individual nuclear structures providing architecture
to maintain the nuclear integrity and participate in nuclear processes (Foster &
Bridger 2005).
1.1.1 Nuclear envelope
The nuclear envelope (NE) surrounds the nucleus, and consists of two sheets
of membrane with a lumen, with the inner and outer membranes connecting
only at the nuclear pores (Voeltz, et al., 2002). It serves in the transit of ma-
terials between the nucleus and cytoplasm (Stoffler, et al., 1999). The nuclear
pore complexes are highly complex structures that selectively regulate the tran-
sit of larger molecules in both directions, they allow the free passage of small
molecules, whereas, above 50 kilodaltons molecular weight, only ”nuclear” pro-
teins are allowed in the nucleus (Laskey, 1987).
1

1.1. Architecture of the nucleus 2
Figure 1.1: Cartoon showing the nuclear architectureThis cartoon representation of the nucleus shows some of the actin and myosinidentified locations and interactions, inluding; transcription machinery, nuclear
pore complex, nucleolus, emerin and nuclear lamina.
1.1.2 Chromatin and Chromosomes
Different patterns of interphase chromosome organization have been identified
in functionally distinct cell types (Manuelidis & Borden 1988). In the nucleus
of mammalian cell, the chromatin exists in the form of chromosome territo-
ries that can be visualized by fluorescence in situ hybridization (FISH) using
whole-chromosome DNA probes (Misteli & Spector 1998). In these chromo-
some territories, chromosomal sub-domains have been shown to occupy distinct
non random sub-nuclear localization depending on the cell’s cycle (Manuelidis,
1984). Chromosomes occupy distinct territories in the cell nucleus with pre-

1.1. Architecture of the nucleus 3
ferred nuclear locations (Cremer, et al., 2006). Using radial distance mea-
surements Cremer’s group has suggested that chromosomes have a probalistic
three-dimentional position (Bolzer, et al., 2005) rather than a determinate one
as previously concluded by Bickmore group in their studies on chromosome 18
and 19 positioning (Croft, et al., 1999). Cremer et al, found that small chro-
mosomes were distributed significantly closer to the center of the nucleus or
prometaphase rosette, while large chromosomes were located closer to the nu-
clear or rosette rim. This arrangement was confirmed in two cell types with flat-
ellipsoidal cell nuclei (human fibroblast and amniotic fluid cell nuclei). in the
same study Cremer’s group, had reported that gene-poor chromatin domains,
formed a layer beneath the nuclear envelope, while gene-enriched domain are
found in the nuclear interior (Bolzer, et al., 2005).
Measurements of the chromosome HSA18 and 19 territories, showed areas
of HSA18 signals were significantly smaller than those of chromosome 19 de-
spite that their DNA content being 85 Mb and 67 Mb respectively (Croft, et
al., 1999). To address whether the spatial organization of the genome affects
the gene expression, or whether it is just a reflection of it, Bikemore’s group in
2007, have actively induced the rearrangement of some chromosmes to the nu-
clear periphery by tethering them to the inner nuclear membrane (INM). The
repositioning of chromosome 4 and 11 to the nuclear periphery resulted in a
down- regulation of some of their active genes, but not all of them, with the
expression of genes closer to the tethering point being the most affected (Finlan,
et al., 2008).
Cremer, et al., (2000) have proposed a modular and dynamic model for chro-
mosome territory based on three nuclear compartments; an ”open” higher-order
chromatin compartment, a ”closed” chromatin compartment, and an interchro-
matin domain (ICD) compartment (Zirbel, et al., 1993). While the ”open”
chromatin compartments contain active genes , ”closed” chromatin compart-
ments comprise inactive genes, and the (ICD) includes macromolecular com-
plexes necessary for DNA replication, transcription, splicing, and repair. Only
1.1. Architecture of the nucleus 4
Genes in ”open” compartments would have access to transcription and splicing
complexes located in the ICD compartment (Cremer, et al., 2000)
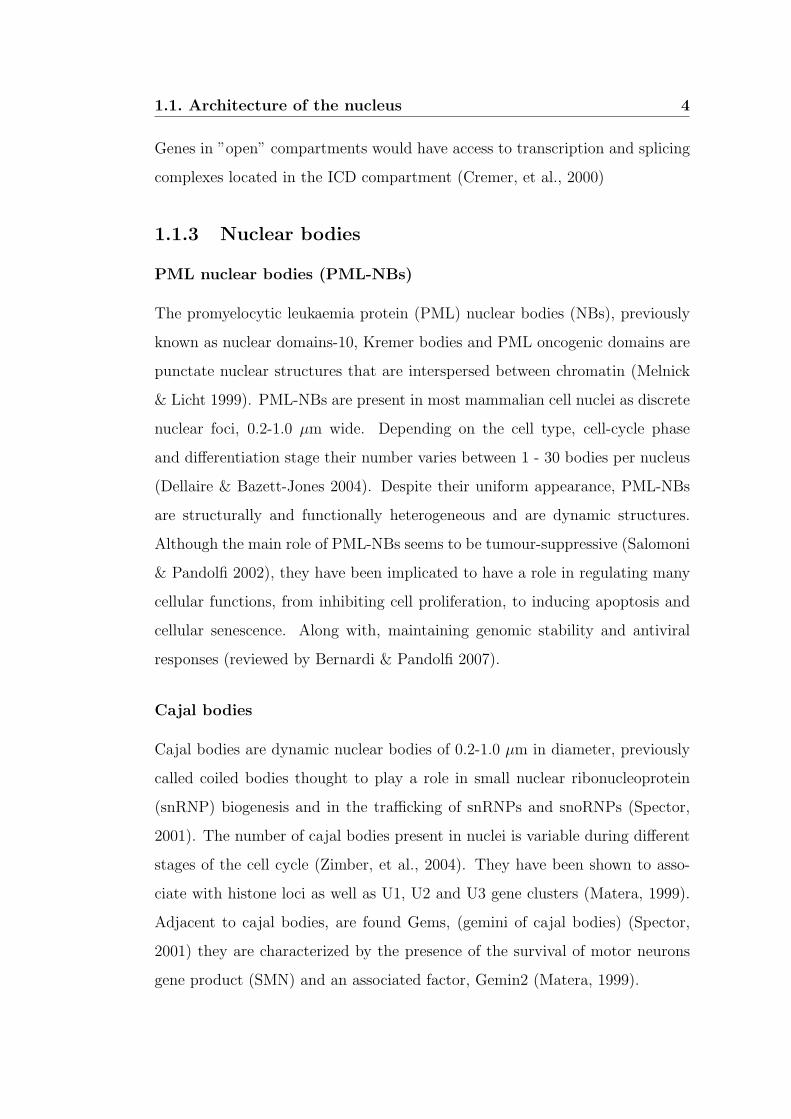
1.1.3 Nuclear bodies
PML nuclear bodies (PML-NBs)
The promyelocytic leukaemia protein (PML) nuclear bodies (NBs), previously
known as nuclear domains-10, Kremer bodies and PML oncogenic domains are
punctate nuclear structures that are interspersed between chromatin (Melnick
& Licht 1999). PML-NBs are present in most mammalian cell nuclei as discrete
nuclear foci, 0.2-1.0 µm wide. Depending on the cell type, cell-cycle phase
and differentiation stage their number varies between 1 - 30 bodies per nucleus
(Dellaire & Bazett-Jones 2004). Despite their uniform appearance, PML-NBs
are structurally and functionally heterogeneous and are dynamic structures.
Although the main role of PML-NBs seems to be tumour-suppressive (Salomoni
& Pandolfi 2002), they have been implicated to have a role in regulating many
cellular functions, from inhibiting cell proliferation, to inducing apoptosis and
cellular senescence. Along with, maintaining genomic stability and antiviral
responses (reviewed by Bernardi & Pandolfi 2007).
Cajal bodies
Cajal bodies are dynamic nuclear bodies of 0.2-1.0 µm in diameter, previously
called coiled bodies thought to play a role in small nuclear ribonucleoprotein
(snRNP) biogenesis and in the trafficking of snRNPs and snoRNPs (Spector,
2001). The number of cajal bodies present in nuclei is variable during different
stages of the cell cycle (Zimber, et al., 2004). They have been shown to asso-
ciate with histone loci as well as U1, U2 and U3 gene clusters (Matera, 1999).
Adjacent to cajal bodies, are found Gems, (gemini of cajal bodies) (Spector,
2001) they are characterized by the presence of the survival of motor neurons
gene product (SMN) and an associated factor, Gemin2 (Matera, 1999).

1.1. Architecture of the nucleus 5
Nuclear speckles
Nuclear speckles consist of regions in which splicing factors are concentrated
(spector, 1993). By immunofluorescence microscopy using anti-splicing-factor
antibodies, speckles can be visualised as irregularly shaped nuclear domain.
They are dynamic structures and their shape, size and number is variable even
within the same cell type, their number depends on the levels of gene expression
and metabolic and environmental signals. In interphase mammalian nucleus the
number of speckles, usually varies between 25-50 (Lamond & Spector 2003).
Also known as splicing factor compartments (SFCs), by light microscopy, they
appear as irregularly shaped entities with a diameter of 1-2 µm and correspond
to interchromatin granule clusters (IGCs) under electron microscope (Vecerova,
et al., 2004).
Paraspeckles
Paraspeckles are a relatively newly identified subnuclear body between 0.5-1.0
µm in size. These foci were named paraspeckles because they were observed in
the interchromatin space near to, the nuclear speckles but distinct from them
(Fox, et al., 2002). They are restricted to mammalian nuclei and their numbers
vary both within cell populations and depending on cell type (Bond & Fox 2009).
Paraspeckles proteins are defined by their co-localisation with a member of the
mammalian DBHS (Drosophila melanogaster behavior human splicing) protein
family in a subnuclear foci. But recent studies have reported that they are
formed around a long nuclear noncoding RNA (ncRNA) and contain a small
number of proteins involved in transcription and/or RNA processing. They
have been suggested to have a role in controlling gene expression by trapping
adenosine to inosine (A to I) hyperedited RNA within the nucleus (reviewed by
Bond and Fox 2009).
1.1. Architecture of the nucleus 6
1.1.4 Nuclear matrix
The nuclear matrix was revealed (Rando, et al., 2000); after extracting most
the DNA and the histones, to comprise inner filaments organized in a three-
dimensional anastomosed network and bounded by the nuclear lamina con-
nected to the cytoskeletal framework. The filaments range in diameter from 3
to 22 nm. The proteins of the nuclear matrix are very different from those of
the cytoskeleton and chromatin. Although some researchers view the nuclear
matrix as a functionally defined organelle in the nucleus, many other researchers
prefer to refer to it as a biochemical fraction (Rando, et al., 2000). The matrix
is thought to function in some ways as a nuclear homologue of the cytoplasmic
cytoskeleton, providing an organisational scaffold upon which nuclear events
might take place.

1.2. Nuclear motors 7
1.2 Nuclear motors
Introduction
Active transport in the cell is mostly driven by molecular motors. There are
three classes of molecular motors: the kinesin families that move toward the
plus-end of microtubules, the dynein families that move toward the minus-
end of microtubules, and the unconventional myosin motors that move along
actin filaments (reviewed by Mallik and Gross, 2004). While, the discovery in
the nucleus of actin (reviewed by Bettinger et al., 2004) and more recently of
a nuclear isoform of the myosin I (Nowak, et al., 1997) has opened a whole
new horizon of our understanding of some of the fundamental nuclear processes
involving this nuclear motor, more studies are needed to fully understand, many
of the functions allocated to the actin-myosin complex.
1.2.1 Nuclear actin
There are at least six actin genes in mammals encoding for six isoforms (α,
γ and β). These are alpha-skeletal (ACTA1), alpha-cardiac (ACTC1), alpha-
smooth muscle (ACTA2), gamma-smooth muscle (ACTG2), beta-cytoplasmic
(ACTB) and gamma-cytoplasmic isoactin (ACTG1) (Vandekerckhove & Weber
1987). The α actin isoforms are present in various muscle cells and are involved
in contractile structures, while γ actin and β actin isoforms are present in all
cell types (Bettinger, et al., 2004). β actin is a globular protein that is separated
into two lobes by a cleft that forms the ATP-binding site as illustrated in figure
1.2.
ATP-bound actin monomers (globular or G-actin) can assemble into fila-
ments (filamentous or F-actin), which results in the hydrolysis of ATP (Bet-
tinger, et al., 2004). Actin filaments are composed of two strands that twist
around one another to form a double right-handed helix as shown in figure 1.3.

1.2. Nuclear motors 8
Figure 1.2: Cartoon representation of a globular actin moleculeIn the cleft region, ATP binding is shown in red and Mg+ in yellow, the different
molecule regions are noted 1 to 4.
Figure 1.3: Double helix strand of F actin.(Available at www.daviddarling.info/images/actin.filament.jpg). Light blue: G actin
molecule. Actin filaments are formed by the twist of two strands (blue and purple)
one another around to form a double right-handed helix.

1.2. Nuclear motors 9
Actin in the nucleus
Actin was first revealed in the nucleus in the late sixties (lane, 1969), but
the low amounts of nuclear actin relative to cytoplasm, the inability to detect
nuclear actin using conventional staining methods, and the lack of a specific
function for actin in this compartment led to scepticism (reviewed by Pederson
& Aebi 2002 and Bettinger, et al., 2004). Gonsior, et al., (1999) presented
undisputed evidence of actin presence in the nucleus using a particular anti-
actin monoclonal antibody (2G2) directed against parts of the cleft region of
the actin molecule. Immunofluorescence studies revealed a distinctive focal
pattern of nuclear staining in differentiated myogenic cells, as well as a fibrillar
structures in nuclei of Xenopus oocytes (Gonsior, et al., 1999). At present,
although the presence of actin in the nucleus is undisputed, the molecular con-
formation and role in nuclear processes of this molecule is yet to be completely
uncovered (reviewed by Pederson & Aebi 2002, Bettinger, et al., 2004 and Var-
tiainen, 2008). McDonald, et al., (2006) reported that the actin pool in the
nucleus contains monomeric, oligomeric and polymeric populations that pre-
sented as both rapidly and slowly moving kinetic populations and that the only
significant difference between the cytoplasmic and nuclear actin is the bundling
of cytoplasmic actin that generates the stress fibers in the cytoplasm. They
also suggested that around 20% of the total nuclear actin pool has proper-
ties of polymeric actin that turns over rapidly. Moreover, Hu, et al., (2004)
have previously reported that beta actin is associated with and is necessary for
the function of the RNA polymerase III and it has been suggested that the
monomeric actin is the form of actin required for pol III transcription. On
the other hand, different studies have suggested that nuclear actin does not
form long F-actin filaments, but can undertake a shorter, potentially novel con-
formations that are distinct from those found in conventional actin filaments
in the cytoplasm (Pederson & Aebi 2002, 2005 and Jockusch, et al., 2006).
In the nucleoli of resting cells, actin was found to predominantly localised to
fibrillar centres (FCs). After transcriptional activation of phytohemagglutinin

1.2. Nuclear motors 10
(PHA) stimulated human lymphocytes, actin was found to accumulate in the
dense fibrillar component (DFC) and in the granular component of the nucle-
olus, but FCs remained the main site of actin localisation. Moreover, in the
nucleoplasm of transcriptionally active cells, both actin and NMI colocalised
with nucleoplasmic transcription sites at the decondensed chromatin, after they
were mostly localised in condensed chromatin (Kysela, et al., 2005).
Actin transport into and out of the nucleus
Thanks to its small size, actin can easily enter the nucleus by diffusion, however
the low concentration of nuclear actin compared to the cytoplasm suggests
the involvement of an active form in actin transport through the nuclear pore
complex (NPC) (reviewed by Vartiainen, 2008). Wada, et al.,(1998) reported
that actin sequence contains two functional leucine-rich type nuclear export
signal (NES) sequences. The rapid export of injected monomeric actin into the
nucleus was prevented by leptomycin B (LMB), a specific inhibitor of NES-
dependent nuclear export and the disruption of these NES resulted in a nuclear
accumulation of the actin. This was supported by the fact that the export
receptor Exportin 6 (EXP6), was found to mediate nuclear export of profilin-
actin complexes. Profilin was found to highly enhance the primary actin contact
with the exportin 6, and was considered as a cofactor of actin export (Stuven, et
al., 2003). Furthermore, EXP6 was found to recognise and specifically remove
actin from the nucleus (Jockusch, et al., 2006). On the other hand there is
evidence that many proteins that binds actin such as cofilin (Lida, et al., 1992
and Pendleton, et al., 2003) CapG (De Corte, et al., 2004) and MAL (Vartiainen,
et al., 2007) contain a nuclear localization signal (NLS) and may transport actin
in a complex (’piggy-back’ it) into the nucleus (Jockusch, et al., 2006, Yahara,
et al., 1996 and reviewed by Vartiainen, 2008).

1.2. Nuclear motors 11
Actin binding proteins
In the cell, the majority of actin molecules are bound to individual partners and
consequently locked in a specific conformation, these induced conformational
states eventually lead to distinct forms of monomeric, oligomeric or polymeric
actin but the exact conformation of the actin bound to these proteins is only
known in a few cases, since actin-binding proteins might trigger the formation of
different forms of actin. Many of the proteins reacting with conventional actin
forms in the cytoplasm are also found in the nucleus (Jockusch, et al., 2006),
these include F-actin-binding proteins such as gelsolin (Nishimura, et al., 2003),
CapG (De Corte, et al., 2004), myopodin (Weins, et al., 2001) and cofilin (Lida,
et al,. 1992), as well as the G-actin-binding proteins profilin (Skare, et al., 2003)
and thymosin β4 (Huff, et al., 2004).
A list of actin binding proteins shown to be present in the nucleus, as re-
ported by Pederson and Aebi, (2005) is shown in table 1.1, the original table has
been slightly modified by adding functions to some proteins (Profilin I, CapG)
initially listed as unknown in the original table , the respective references are
also provided.

1.2. Nuclear motors 12
Protein Function ReferenceProfilin I Monomer binding protein
that promotes nucleotideexchange
(Skare, et al., 2003),(Stuven et al., 2003)
Thymosinβ4 G-actin sequestering pep-tide in the nucleus
(Huff, et al., 2004)
Myosin I RNA polymerase I tran-scription
(Fomproix & Percipalle2004), (Philimonenko,et al., 2004), (Pestic-Dragovich, et al., 2000)
Filamin Androgen receptor action Ozanne et al(2000)Supervillin Androgen receptor action (Ting, et al., 2002)Gelsolin Androgen receptor action (Nishimura, et al., 2003)CapG Binds pointed ends of F-
actin(De Corte, et al., 2004),(Onoda, et al., 1993)
Emerin Cortical network at the in-ner nuclear membrane
(Holaska, et al., 2004)
Band 4.1 Nuclear pore-attached fila-ment association
(Kiseleva, et al., 2004)
Tropomodulin Unknown (Kong & Kedes 2004)NUANCE Linkage to cytoplasmic
actin filaments(Zhen, et al., 2002), (Li-botte, et al., 2005)
hnRNP U RNA polymerase II tran-scription
(Kukalev, et al., 2005)
DNA helicaseII/ RNA heli-case A
RNA polymerase II tran-scription and RNA process-ing
(Zhang, et al., 2002)
Zyxin Promotes actin polymeriza-tion
(Nix and Beckerle 1997),(Fradeliziet, et al., 2001)
Myopodin Filamentous actin bundlingprotein
(Weins, et al., 2001)
Nrf2 Forms a complex with actinthat translocates to the nu-cleus upon oxidative stress
(Onoda, et al., 1993)
Lamin A nuclear lamina protein (Sasseville, et al., 1998),(Shumaker, et al., 2003)
Table 1.1: Actin-binding proteins in the nucleus(adapted from Pederson & Aebi 2005)
1.2. Nuclear motors 13
Nuclear complexes that contain actin
Actin has been found to be a component in many nuclear complexes, hence
involved in many nuclear processes, a list of those complexes along with a brief
description of each complex as reported by Bettinger, et al., (2004) is provided
in table 1.2.
This plethora of actin binding proteins in the nucleus suggests that actin
is multifunctional in this compartment. Whether actin takes one or many un-
conventional forms in the nucleus, and which form for which job is yet to be
identified. One actin binding protein recently identified in the nucleus is the
nuclear myosin I (Pestic-Dragovich, et al., 2000) this molecule has been the
focus of our study as there are strong indications that it may be implicated in
chromosome repositioning.

1.2. Nuclear motors 14
The complex FunctionBAF complex Actin is required for the optimal ATPase activity
of the BAF (BRG-associated factor) complex, amammalian chromatin-remodelling complex thatis related to the yeast SWI/SNF complex
BAP complex Actin co-purifies with Brm, a SWI2/SNF2-relatedhelicase that functions as the catalytic subunitof the BAP(Brm-associated protein) complex,a Drosophila melanogaster chromatin-remodellingcomplex
Ino80 complex Actin co-purifies with INO80, which is the ATPasesubunit of the Ino80 complex, a Saccharomycescerevisiae SWI/SNF-like complex that is involvedin transcription and DNA processing
NuA4 complex Actin co-purifies with the NuA4 (nucleosomalacetyltransferase of H4) complex, that modifies hi-stones H4 a structural component of the nucleo-some and H2A
NuclearDNA helicase-II(NDHII)
(NDHII) binds actin and hnRNP C24.it unwindsdouble-stranded DNA and has been seen to stimu-late translation and have a role in RNA transport
p400 complex Actin co-purifies with p400 complex the mam-malian SWI/SNF-like ,which binds to the aden-ovirus E1A oncoprotein, and is involved in theoncogenic transformation of cells by E1A.The p400is also found in the TIP60 complex
PBAF complex Actin co-purifies with BAF180, a protein that isfound in the PBAF(polybromo BRG1-associatedfactors) complex which localizes to the kineto-chores of mitotic chromosomes complex
Pre-mRNP parti-cles
Actin binds to the heterogeneous nuclear ribonu-cleoproteins (hnRNPs); hrp36, DBP40 and hrp65.pre-mRNA molecules associate with the hnRNP toform ribonucleoprotein complexes that are knownas pre-mRNP particles
TIP60 complex Actin co-purifies with Tat interactive proteinTIP60, a histone acetylase of the mammalianTIP60 complex, which also has ATPase and DNA-helicase activity
Table 1.2: Nuclear complexes that contain actin(as described by Bettinger, et al.,2004)
1.2. Nuclear motors 15
1.2.2 Nuclear Myosin I
Introduction
According to an analysis of the draft human genome conducted by Cheney
et al., (2001) the human genome includes around 40 myosin genes, This fam-
ily can be divided in two major families; the conventional myosins or Class
II myosins consisting of 15 genes, mainly involved in muscle contraction and
the unconventional myosins family which constitute around two thirds of the
human myosins genes. Myosin superfamily members are characterised by the
presence in their heavy chain of a conserved catalytic domain ( 80 KDa), that
is followed in most myosins, by one or more IQ (calmodulin-binding) motifs
in addition to a C-terminal tail and /or an N-terminal extension, these are
thought to confer class-specific properties such as kinase activity and mem-
brane binding. In spite of the high relative conservation of motor domains
among the myosin classes, significant differences are found in biochemical and
enzymatic properties of these motor domains. These differences confer to each
class of myosin specific characteristics, hence different roles (Cheney et al 2001).
Nuclear myosin I is a member of the myosin I family (Pestic-Dragovich, et
al., 2000), members of this family was were first described by Pollard and Korn
in 1973 in Acanthamoeba. Single headed, the myosin I was first thought to be a
proteolytic form of the myosin II, figure 1.4. It was in 1987 that Hammer et al,
finally provided undoubted evidence of its individuality by cloning the myosin I
gene.
In mammalian cells, myosin I was found to be abundant in the brush border
where it may mediate membrane trafficking, it has an important role in function
of the hair cell, it has also been implicated in traction-mediated cytofission and
contractile vacuole function in Dictyostelium (Hoffman et al 2006). Another
role of myosin I as a molecular tension sensor has also recently been reported
(Laakso, et al., 2008).

1.2. Nuclear motors 16
Figure 1.4: Cartoon of myosin I.Schematic representation of the myosin I molecule with the different regions of the
molecule; Red: the head region or the motor domain, orange: the neck region
comprising the regulatory domain and green: the tail region or the binding domain.
The relatively recent discovery of new members of the unconventional myosin
I subfamily in human cells together with the fact that homologous in other
species have been given different but yet close similar names, has given rise to
much confusion in the literature. For this reason a group of leading scientists in
the field had come together in 2001 to recommend the adoption of a common
nomenclature based on the Human Genome Organization (HUGO) names sys-
tem. Names and corresponding coding genes for the myosin I family members
are shown in table 1.3.
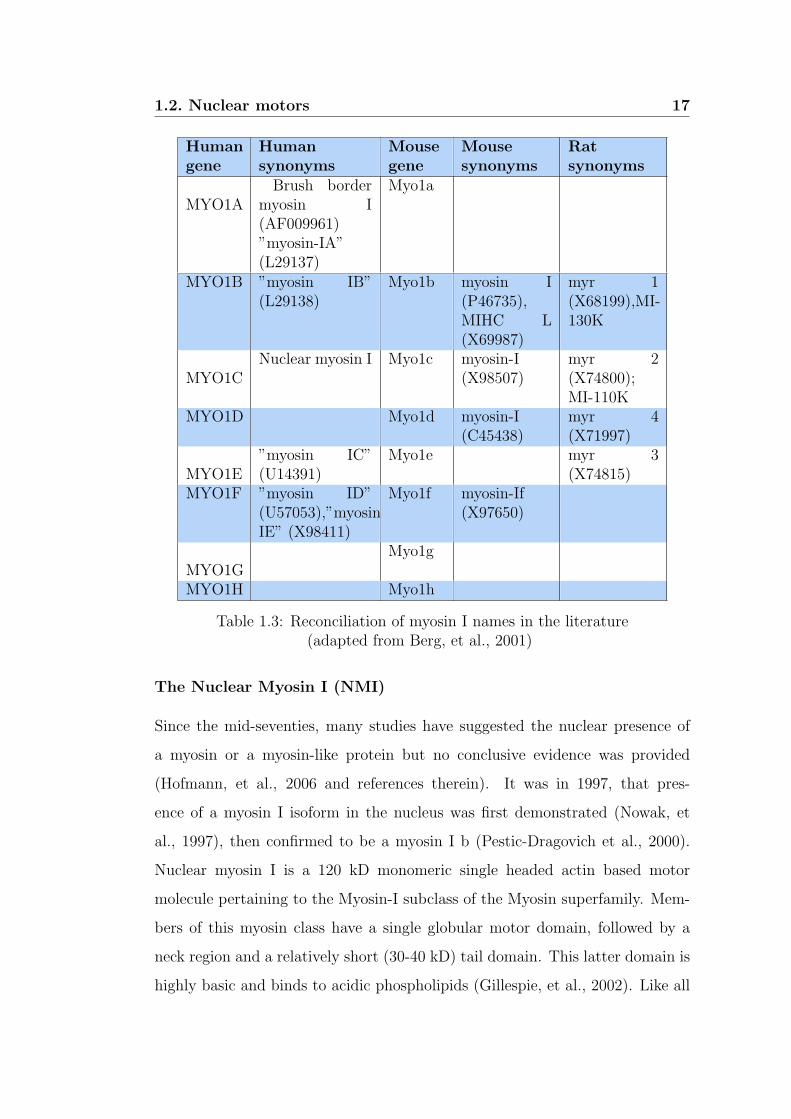
1.2. Nuclear motors 17
Humangene
Humansynonyms
Mousegene
Mousesynonyms
Ratsynonyms
MYO1ABrush border
myosin I(AF009961)”myosin-IA”(L29137)
Myo1a
MYO1B ”myosin IB”(L29138)
Myo1b myosin I(P46735),MIHC L(X69987)
myr 1(X68199),MI-130K
MYO1CNuclear myosin I Myo1c myosin-I
(X98507)myr 2(X74800);MI-110K
MYO1D Myo1d myosin-I(C45438)
myr 4(X71997)
MYO1E”myosin IC”(U14391)
Myo1e myr 3(X74815)
MYO1F ”myosin ID”(U57053),”myosin-IE” (X98411)
Myo1f myosin-If(X97650)
MYO1GMyo1g
MYO1H Myo1h
Table 1.3: Reconciliation of myosin I names in the literature(adapted from Berg, et al., 2001)
The Nuclear Myosin I (NMI)
Since the mid-seventies, many studies have suggested the nuclear presence of
a myosin or a myosin-like protein but no conclusive evidence was provided
(Hofmann, et al., 2006 and references therein). It was in 1997, that pres-
ence of a myosin I isoform in the nucleus was first demonstrated (Nowak, et
al., 1997), then confirmed to be a myosin I b (Pestic-Dragovich et al., 2000).
Nuclear myosin I is a 120 kD monomeric single headed actin based motor
molecule pertaining to the Myosin-I subclass of the Myosin superfamily. Mem-
bers of this myosin class have a single globular motor domain, followed by a
neck region and a relatively short (30-40 kD) tail domain. This latter domain is
highly basic and binds to acidic phospholipids (Gillespie, et al., 2002). Like all

1.2. Nuclear motors 18
biochemically characterized unconventional myosins, Myosin I binds calmodulin
in its light chain neck region (Barylko, et al., 1992). The human nuclear myosin
I (NMI) is encoded by the MYO1C gene, it is slightly shorter than its cyto-
plasmic homologue and contains a unique 16-amino acid N-terminal extension
that is necessary for its nuclear localisation. Although this extension was not
found to include a known nuclear localisation signal (NLS) sequence, removing
it resulted in retention of the NMI in the cytoplasm (Pestic-Dragovich, et al.,
2000). The localization of myosin I to the nucleus has been shown to predate
the origin of the vertebrates, as NMI has been present in the last common an-
cestor of vertebrates and tunicates. Thus, a functional role for NMI appears
to have been present at an early stage of animal evolution prior to the rise
of both the myosin IC isoform and the vertebrates (Hofmann, et al., 2009).
NMI has been found to be expressed in all mouse tissues with the exception of
terminal stages of spermiogenesis cell nuclei and has a minimum life span of 16
hours (Kahle at al., 2006). Despite its ubiquitous expression, the NMI level is
considerably variable in different tissues, suggesting a tissue specific roles for
this myosin. With the highest level in lung cell nuclei, higher levels of the NMI
have also been registered in cell nuclei of kidney, skin, small intestines, liver,
spleen, testis, and heart tissues. Whereas, lower levels have been detected in
brain, skeletal muscle and pancreas (Kahle, et al., 2007).
The level and distribution of NMI in the cell nucleus has been shown to be
dependent on the transcriptional state of the cell (Kysela, et al., 2005); tran-
scriptional activation in phytohemagglutinin (PHA) stimulated human lym-
phocytes was followed by an increase of NMI level and a redistribution of its
initial nuclear localization. While NMI was located mainly to the dense fibrillar
component (DFC) in nucleoli of resting cells a post-transcriptional activation
condensation of the NMI in the DFC and in the granular component of the nu-
cleolus was observed. Furthermore, in transcriptionally active cells, both actin
and NMI colocalized with nucleoplasmic transcription sites at the decondensed
chromatin, after they were mostly localized in condensed chromatin (Kysela,

1.2. Nuclear motors 19
et al., 2005). Expression of NMI has also been found to be affected by serum
variations, with a lower expression level in serum starved cells that increases
after serum stimulation (Kahle, et al., 2007).
1.2.3 Other myosins in the nucleus
The discovery of the nuclear myosin I (Nowak et al 1997) has given rise to the
possibility of the presence of other members of the myosin superfamily in the
nucleus, effectively many studies have reported the presence of several other
myosins in the nucleus, figure1.5.
Myosin V
The phospho-ser1650 myosin Va , a myosin V paralog has been found to lo-
calise at the nucleus( Pranchevicius, et al., 2008); immunofluorescence studies
had shown the exclusive colocalization of the phospho-ser1650 myosin Va with
a splicing factor at the nuclear speckles(SC35). Inhibition of transcription in
HeLa cells by actinomycin D has resulted in a dissociation of a fraction of phos-
phoser1650 MVa from SC35 and a redistribution of the phospho-ser1650 MVa
to nucleoli, suggesting a novel role for myosin Va in nuclear compartmentaliza-
tion(Pranchevicius, et al., 2008).
Myosin VI
The myosin VI is the only identified myosin that moves toward the minus end
of actin filaments (wells, et al., 1999). Analysis of myosin VI sequence revealed
the presence of five putative monopartite nuclear localization signals (MNLS)
and one putative bipartite nuclear localization signal (BNLS), mainly localized
in the tail region. Moreover, an immunofluorescence study demonstrated the
nuclear localization of the myosin VI (Vreugde, et al., 2006). MyosinVI is a
processive moving myosin, it is present both as monomers and as dimers, the
processive walking of myosin VI on actin filaments has been shown to require
dimerization of the molecule, whereas the protein can also function as a nonpro-
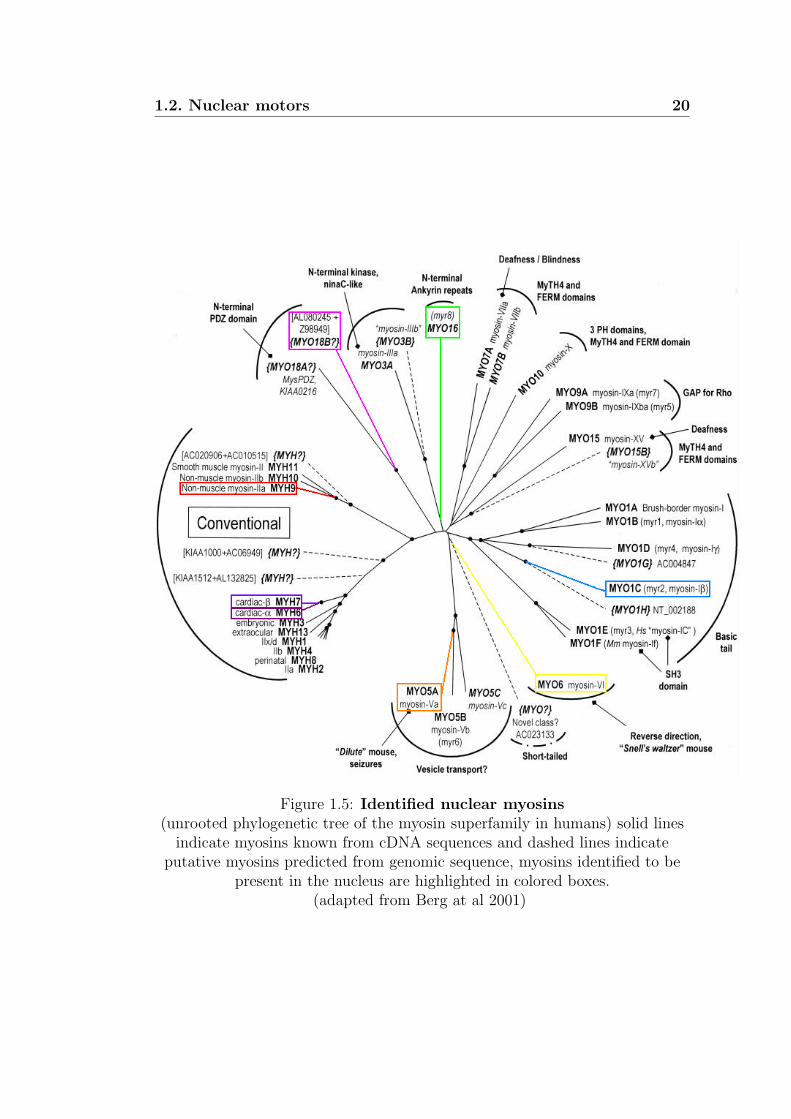
1.2. Nuclear motors 20
Figure 1.5: Identified nuclear myosins(unrooted phylogenetic tree of the myosin superfamily in humans) solid linesindicate myosins known from cDNA sequences and dashed lines indicate
putative myosins predicted from genomic sequence, myosins identified to bepresent in the nucleus are highlighted in colored boxes.
(adapted from Berg at al 2001)
1.2. Nuclear motors 21
cessive monomer (Ye, et al., 2009). Myosin VI has been reported to be highly
expressed in the nucleus of mammalian cells and modulates RNAPII-dependent
transcription; it has been found to be present in the RNAPII complex and to
specifically associates with RNAPII at active genes as well as colocalise with
nascent transcripts (Vreugd, et al., 2006).
Myosin XVIB
Myosin XVIB, is a founding member of the of the class XVI myosins which are
characterized by the presence six ankyrin repeats at the N-terminal that may
function as sites for protein-protein interaction (Berg, et al., 2001). The nuclear
transition of the myosin XVIB, is found to be dependent on the monopartite
nuclear localization signals located in the N-terminal portion of the Myo16b-
tail. Several leucine-rich nuclear export signals (NES) have been also identified
suggesting a controlled nuclear localization of the myosin16 b (Cameron, et al.,
2007). Myosin 16XVIB has been suggested to slow progression through S-phase
and its overexpression suppresses cell proliferation (Cameron, et al., 2007).
1.2. Nuclear motors 22
1.2.4 Functions of the Actin- Nuclear Myosin I complex
The actin-NMI complex has been implicated in many nuclear processes from
transport to transcription, in some cases they have been shown to work in
concert, whereas in other occasions they have been shown to have distinct roles;
Chromatin remodeling
The WSTF (Williams Syndrome Transcription Factor)-SNF2h chromatin re-
modeling complex has been reported to interact with the NMI during active
transcription (Cavelln, et al., 2006) Purification of cellular NM1 showed that
a fraction of NM1 was associated with a 2-3 MDa complex, termed B-WICH,
containing WSTF, SNF2h which bound both Pol I and rDNA . Interaction of
NM1 with WSTF was suggested to recruit the WICH and WINAC complex to
active genes to modify chromatin and activate transcription (Percipalle, et al.,
2006).
Transcription
Both actin and NMI cooperate in Pol I transcription activation (Ye, et al.,
2008); antibodies to actin inhibit transcription in cell-free transcription assay
and both actin and NMI are required to rescue transcription in nuclear extract
treated with anti-actin antibody. While, the complex formed by(Pol I, TIF-IA,
actin, and NM1) remained preserved in the presence of ADP, the presence of
ATP, prevented the association of actin with the transcription machinery and
the association of NMI with Pol I was reduced indicateing that ATP binding
and hydrolysis lead to detachment of actin from the Pol I/TIF-IA complex
and dissociation of actin-NMI complex. Whilest, the actin-dependent motor
activity of NMI was identified to be required for transcription elongation and
not for the recruitment of Pol I to rDNA, the tail domain seems to have a
role in earlier steps of transcription (Ye, et al., 2008). Actin was shown to co-
localise with RNA polymerase II and to be recruited to the promoter region of
the interferon-gamma-inducible MHC2TA gene as well as the interferon-alpha-
1.2. Nuclear motors 23
inducible G1P3 gene. It was also established to be part of the pre-initiation
complexes of which the formation was prevented by the actin depletion, sug-
gesting that it plays a crucial role in the initiation of transcription by RNA
polymerase II (Hofmann et al 2004). Similarly, NMI has been found to co-
localise and co-immunoprecipitate with RNA polymerase II. NMI Antibodies
to its NH2-terminal extension inhibit transcription by RNA polymerase II in
HeLa nuclear extracts (Pestic-Dragovich, et al., 2000). Similar findings were re-
ported by Hofmann, et al., (2006) they showed that antibodies to NMI inhibit
transcription both in vitro and in vivo, and this inhibition was found to be in a
concentration dependent manner. Antibodies to NMI inhibited the production
of the first 15 nucleotides RNA indicating that NMI is involved at the initiation
or pre-initiation state of transcription by RNA polymerase II (Hofmann, et al.,
2006). Furthermore, transcriptional activation in human lymphocytes has been
found to induce a dramatic increase of cellular levels of NMI (the western blot
showed about 15 fold after 24 h and 28 fold after 48 h increase in NMI protein
levels), while the levels of actin remained unchanged (Kysel, et al., 2005). It ap-
pears that NMI is required for transcription initiation and for a post-initiation
steps; as NMI has been found to be part of a multiprotein complex containing
the chromatin remodeling complex WICH (Percipalle, et al., 2006). On the
other hand, beta actin also has a role in RNA polymerase III transcription (Hu,
et al., 2004); beta actin has been shown to associate with highly purified pol
III and is essential for basal transcription. In addition, actin was localized at
the promoter region of an active U6 gene. The dissociation of actin and the
polymerase III resulted in an inactive transcription (Hu, et al., 2004). Nuclear
myosin I was also found to be associated with the RNA polymerase III genes 5 S
rRNA genes and 7SL and was found in complex including WSTF-SNF2h-NMI
that is believed to form a platform in transcription while providing chromatin
remodeling (Cavelln, et al., 2006)

1.2. Nuclear motors 24
Nuclear transport
A recent role of the nuclear myosin I and actin has been identified by Parcipalle’s
group; using Immunoelectron microscopy, they showed NM1 localization at the
NPC basket of Xenopus oocyte membrane, decorates pore-linked filaments rich
in actin. They also found that NMI coprecipitate with CRM1, and Nup153 as
well as same 18S and 28S rRNAs, suggesting a role of the NMI in preribosomal
subunits for maturation and their transport to the NPC (Obrdlik, et al., 2009).
Maintaining the nuclear shape and organisation
The co-localisation of nuclear actin spots and p80 coilin-positive cajal bodies
staining, that resisted nuclear extraction to reveal the nuclear matrix, and the
redistribution of actin to the nuclear periphery identified as a result of Aden-
ovirus 5 infection has led to the conclusion that actin may play an important
role in the organization or function of the cajal body (Gedge, et al., 2005). An-
other role of the nuclear myosin I-containing complexes in sensing and regulating
the mechanical tension at the nuclear envelope has been suggested by Holaska
and Wilson, (2007). They found that emerin scaffolds a variety of multipro-
tein complexes at the nuclear envelope that have distinct functions, including
nuclear myosin I-containing complexes, they proposed a model where emerin-
and-lamin A-anchored NMI might pull actin filaments towards, or along, the
nuclear envelope. Together with emerin-promoted actin polymerization at the
inner membrane, emerin-bound NMI has the potential to both sense and reg-
ulate the mechanical stiffness of the peripheral nuclear lamina network, hence
contribute to maintaining the nuclear shape and architecture (Holaska &Wilson
2007).
Chromatin reorganisation and chromosome movement
A fundamental role for the actin-myosin complex in chromatin movement was
identified by Chang, et al., (2006). They have demonstrated the migration of
a chromosome site from the nuclear periphery to the interior in cells during

1.2. Nuclear motors 25
interphase, 1-2 hours after transcriptional activation of this site has been tar-
geted. This chromosomal repositioning has been identified to exist throughout
a large fraction of the cell cycle ( G1 /early S) and depends on NMI and actin
polymerization .
Using 4D imaging analysis, Dundr and colleagues, (2007) revealed rapid and
directed long-range chromosomal movements of U2 genes during interphase.
followed by a stable association between cajal bodies (CBs) and U2 genes.
The interaction of CBs and U2 genes was inhibited by the overexpression of
a nonpolymerisable actin mutant, which also inhibited the repositioning within
the chromosome 7 territory of the U2 locus (Dundr, et al., 2007)
A role of actin and NMI in nuclear reorganisation and interchromosomal in-
teraction has been also identified. Chromosome 21 and chromosome 2, initially
localized independently in the nucleus before 17β-estradiol (E2) treatment were
found to became intimately localised after The E2 treatment with interchromo-
somal kissing, this chromosomal rearrangement and kissing was abolished by
the inhibition of actin polymerization or the siRNA depletion of the NMI (Hu,
et al., 2008).

1.3. Aims of the project 26
1.3 Aims of the project
While other studies have reported a role of the nuclear myosin I in chromosome
movement, they have been focusing on a gene or a chromosome region. In
this project the role of the nuclear myosin I in the repositioning of a whole
chromosome territory has been investigated using chromosome positioning and
image analysis tools. This project is aiming to:
1. Confirm chromosome 10 repositioning to the nuclear periphery after the
cells were incubated in low serum, using IPlab spectrum software.
2. Design siRNA constructs to target the respective nuclear myosin I encod-
ing gene.
3. Repeat the chromosome positioning study using images of nuclei where the
nuclear myosin I gene has been silenced by siRNA in order to investigate
the effect of the NMI depletion on low serum induced chromosome 10
repositioning.
4. Conduct a comparative study of the nuclear shape and size before and
after the low serum incubation.
5. Repeat the comparison of the nuclear size and shape after the siRNA
knockdown of the NMI gene.
In order to achieve the above a number of laboratory techniques and image
analysis tools have been used, as detailed in the following chapter.

Chapter 2
Methods and Materials
In this chapter all methods and tools used during this project will be described;
They can be divided in two categories. The first set is laboratory based, and
the second is computer based. The laboratory based methods section will de-
scribe techniques used to prepare the cells for the study. Tissue culture permits
the generation of enough cells to carry out the experiments. The low serum
assay was used to induce the chromosome repositioning. Fluorescence in situ
hybridisation (FISH), enabled us to probe the chromosomes in order to study
their position in the nucleus before and after the low serum incubation of the
cells, pre and post siRNA knock-down of the nuclear myosin 1 gene. FISH
images, captured in each experiment are subsequently used in the second part
of this Chapter. The computer based methods section will illustrate all the
tools utilised to identify all known myosins in the nucleus, design siRNA con-
structs for the gene knockdown and carry out further analysis on the images
generated from the first part of the project. Among which, the IP-Lab pro-
gram has provided us with raw data relating to a chromosome’s position in the
nucleus; combined with the Microsoft Excel, these data was put into charts
for easy interpretation. Other image analysis tools, including Paint Shop Pro
XI and Scion Image were used to investigate eventual effects of the low serum
assay and the NMI gene silencing on the nuclear size and shape and the studied
chromosomes territories.
27

2.1. Laboratory based methods 28
2.1 Laboratory based methods
2.1.1 Tissue culture
Human dermal fibroblasts (HDFs) 2DD (Bridger, et al., 1993) have been cul-
tured in Dulbeco’s Modified Eagles Medium (DMEM) with the following ad-
ditives: 10% new born calf serum (NCS), 1% penicillin, 1 % streptomycin,
L-glutamine. The cells were cultured in 75 mm flasks and incubated in 5%
CO2 incubator at 37◦C temperature. They were harvested and passaged twice
weekly. To harvest cells, the media and the necessary reagents are pre-heated
to 37◦C in a water bath before use. In the sterile hood, first the old media was
removed and the flasks were washed with versene (0.197g of EDTA in 1 litre
of 1 X PBS). To facilitate the detachment of the cells from the bottom of the
flasks, the cells were incubated in 5 ml diluted solution of trypsin: versene (1:10,
v:v) for up to five minutes. Meanwhile the cells detachment was checked closely
using a microscope. As soon as all the cells were detached from the flask’s
bottom, the trypsin solution was neutralized by adding an equal amount of the
D-MEM medium to the flasks. The resulting suspension was then transferred to
centrifuge tubes and centrifuged at 1000 (rpm) for 5 minutes. The supernatant
was removed and the pellet of cells was re-suspended in a known volume of fresh
medium (5 to 10 ml). To determine the number of cells in the suspension, the
haemocytometer was used to count the cells in a drop of the suspension then
the total number of the cells in this was calculated using the following equation:
Number of cells counted on the haemocytometer (CC), divided by number of
haemocytometer’s large squares where the cells have been counted (SH), the
result is multiplied by the total volume of the suspension (V) then by 104 , the
final result equals the total number of the cells in the suspension (TC).
(CC ÷ SH)× V × 104 = TC
The total volume of the cells suspension was then distributed in new flasks at
a density of 5×10⁵ cells per flask. The volume in each flask was toped to 20 ml
using fresh media and the cells were incubated at 37◦C in the incubator.

2.1. Laboratory based methods 29
2.1.2 Low serum assay
Normal proliferating 2DD were incubated in a low serum medium (0.5% NCS
DMEM) for 15 min to induce the chromosome movement as follows: In the
sterile hood the old media was first removed and the cultures were washed
twice with serum free fresh media. 20 ml of low serum (0.5% NCS) medium
was added to each flask and the cells were replaced in the incubator for 15
minute then immediately harvested as described above (all the media and the
reagents used are preheated to 37◦C). After centrifugation the supernatant was
removed and the cells were fixed in a 3:1 methanol: acetic acid solution as
described below in the FISH section.
2.1.3 Immuno-fluorescence in situ hybridisation
(Immuno-FISH)
Fixation
Fixation was performed using the methanol: acetic acid solution. Firstly, the
cells were harvested using trypsin as described in the previous section, then
after centrifugation most of the supernatant was removed and the cells were
re-suspended in the remaining media. A hypotonic solution (0.075 M KCl) was
added to the cells at room temperature for 15 min. Then, the samples were
centrifuged for five at 800 (rpm) for 5 minutes, most of the supernatant was
removed and the cells re-suspended in the residual solution. A fixative mixture
of methanol:acetic acid (75%:25% respectively) was freshly prepared and put
on ice, then was added drop wise to the sample with constant taping of the
tube to prevent the cells from clumping. The sample was stored at 4◦C for at
least 1 hour or overnight. The sample was then centrifuged at 800 (rpm) for five
minutes, the supernatant was removed and the fixing procedure was repeated
four to five times. A drop of the sample was observed under the microscope to
check that most the cytoplasm has been eliminated.

2.1. Laboratory based methods 30
Slide preparation and denaturation
The fixed cells were centrifuged at 1000 (rpm) for 5 minutes, the supernatant
discarded and the pellet of cells re-suspended in a small volume of fresh ice cold
methanol:acetic acid (3:1) solution to obtain a milky suspension. The cells were
dropped from a height onto humid or damp slides. To age the slides they were
first air dried then baked at 70◦C for 1 hour or left at room temperature for 2
days. The slides were dehydrated trough in 70%, 90%, 100% ethanol for five
minutes in each solution at room temperature, then air dried on a hot plate.
Pre-warmed slides (70◦C for 5 minutes in oven) were incubated in a denaturing
solution (70% formamide : 2X Sodium Saline Citrate (Na3C6H5O7)(V:V),pH
7.0) for 2 minutes, then were immediately plunged in ice cold 70% ethanol for
5 minutes. Next they were run through another ethanol raw (90%, 100% five
minute in each) at room temperature. After being air dried on a hot plate, the
slides were ready for hybridisation.
Probe preparation and hybridization
In house biotin labelled probes were used (kindly provided by Dr Bridger and
Mehta). First the probe DNA was precipitated into a mixture of Cot DNA and
Herring or Salmon sperm; for each slide:
• 8 µl of the probe template (10 or X), 7 µl of Cot DNA, 3 µl of Herring
sperm DNA were mixed.
• Then, 1/10th of the volume (1.8 µl) of 3 M sodium acetate (pH 5.0) and
2 volumes (40 µl) of ice cold 100% ethanol were added to the mixture.
The mixture was incubated at -80◦C for at least 30 minutes. Next, it was
centrifuged at 300-400 (rpm) for 30 minutes at 4◦C. The excess liquid was
discarded and the residual white DNA pellet is then washed by adding 200µl
of ice cold 70% ethanol, and then centrifuged again for another 15 min at
4◦C. The supernatant was removed and the pellet was dried at about 40◦C
(37 to 50◦C) on the hot block. When the pallet turned transparent, 12µl of

2.1. Laboratory based methods 31
the hybridization mix (see blow) was added and the pellet was left to dissolve
for at least 2 hours (with gentle tapping every 15 min) or overnight at room
temperature. Next, probes are ready for denaturation by baking them at 70◦C
for 10 minutes and re-annealing by incubating them at 37◦C for at least 30 min.
The hybridization mix:
• 10% dextran sulphate (V = 2.4 µl),
• 10% 20 X Sodium Saline Citrate (SSC) (V =1.2 µl),
• 50% formamide (V = 6 µl),
• 1% Tween 20 (V = 0.12 µl),
• 29% double distilled water (V = 2.28 µl).
For hybridization, 12µl of the probe mixture was applied to each prepared slide,
then covered with a coverslip and sealed with rubber cement. Finally, the slides
were left to hybridise at 37◦C in a moist chamber for at least 18 hours.
2 D FISH washing and signal detection
After hybridization, coverslips were removed, the slides were washed in buffers
A and B as follows; first, slides were washed in the preheated to 45◦C Buffer A
(50% formamide: 2X SSC (v:v), pH 7) three times for five minutes and changing
the buffer each time. Then the same process is repeated with the buffer B (0.1X
SSC, pH 7, preheated to 60◦C). Next slides were allowed to cool down in a
solution of 4X SCC at room temperature. To detect the fluorescent signal, the
slides were first incubated with 50 to 100 µl of a blocking solution (4% bovine
serum albumin) at room temperature for 10 min. Then a similar amount of
(1:200) diluted Streptavidin-Cyanine 3 (Cy3) solution was added to each slide
and incubated in dark for 30 minute at 37◦C, or 1 hour at room temperature.
Next the slides were washed in a solution of 4X SSC with 0.05% Tween 20, at
42◦C three times for five minutes, changing the buffer each time. Finally the
2.1. Laboratory based methods 32
slides were mounted in Vectashield medium + 4, 6-diamidino-2-phenylindole
(DAPI) and were ready for observation by the fluorescence microscope.
pKi-67 Staining
To distinguish proliferating cells from non proliferating ones, the 2-D FISH was
combined with anti pKi-67 staining as follows.
2-D FISH slides were placed in a solution of 1X PBS to allow the coverslips
to detach from the slides, then they are incubated with 40 to 100µl of the pri-
mary antibody (1:1500 rabbit anti Ki-67, diluted in 1% NCS), for one hour at
room temperature. Slides were washed in 1X PBS for five minutes three times
to eliminate non bound antibody, then they were incubated with the similar
amount of the secondary secondary antibody conjugated to fluorescein isothio-
cynate (FITC) (1:30 diluted in 1% NCS, swine anti-rabbit polyclonal) for one
hour at room temperature. Excess antibody was eliminated by washing the
slides in 1X PBS for five minutes three times. Finally, slides were mounted in
counter-stain DAPI in vectashield mounting medium (Vector Laboratories).
2.1.4 Image acquisition
The Olympus BX41 fluorescence microscope has been used to inspect the slides;
the microscope is equipped with a Viewpoint digital camera (digital scientific).
The cells were examined using a 100X plan oil immersion lens, 50-80 images
of pKi-67 positive, randomly selected nuclei have been captured. The Smart
Capture 3 software was used to visualise a merged colour picture of the three
different staining (blue: DAPI, green: Cy3 and red: pKi-67). For each slide a
new film strip was opened and images saved were in PICT format.
2.1.5 Small interfering RNA (siRNA)
Although, both nuclear myosin I and unconventional myosin VI have been ini-
tially chosen as possible targets for the siRNA knock down, the literature review

2.1. Laboratory based methods 33
has shown that NMI was more likely to be involved in the chromosome repo-
sitioning as previous studies have identified a role of the NMI in chromatin
movement(see Chapter 1, section 1.3.4), the siRNA experiment was only car-
ried out for the nuclear myosin I. Despite our efforts to design a specific siRNA
construct against the nuclear isoform of the MYO1C gene, it was technically
impossible to generate functionally efficient siRNA constructs against the NMI
5’ UTR region of this gene which is the only specific region for the nuclear
myosin I isoform (details provided in section 2.3.3 of this chapter). For this
reason, it was more sensible to opt for ready made and tested constructs. ON-
TARGETplus SMARTpool siRNA (Thermo Fisher Scientific, Lafayette. CO;
Dharmacon Catalog -E-015121-00) has been used to target the nuclear myosin
I. The pool included four specificity-enhanced duplexes that targets different
regions of the MYO1C gene, other benefits of using a SMARTpool include min-
imum off site effects, since the concentration of each construct is kept very low.
Used sequences are as follows:
• 5’GCUCAAAGAAUCCCAUUAU3’
• 5’GCUGAAUUCUCGGUGAUAA3’
• 5’GCACUCGGCUUGGUACAGA3’
• 5’GUACAGCGUGCGGACAAUA3’
For negative control, the cells were transfected using ON-TARGETplus Non-
targeting Pool.

2.2. Computer Based Methods 34
2.2 Computer Based Methods
2.2.1 Web-based search
The aim of this search was to identify possible other nuclear myosin candi-
dates for the role of chromosome 10 rapid repositioning. First up-to-date data
about all known myosins in the nucleus were collected by searching the protein
databases on the following websites:
• The National Centre for Biotechnology Information: www.ncbi.nlm.nih.gov
• The European Bioinformatics Institute: www.ebi.ac.uk
• The Universal Protein Resource :www.uniprot.org
• Expert Protein Analysis System: www.expasy.org
Different key words and searching formulae have been used, in order to es-
tablish a comprehensive and yet specific data about the nuclear myosins. After
identifying all known myosins in the nucleus and respective split variants’ se-
quences and encoding genes, the sequences alignment tool ClustralW have been
used to align recognized nuclear myosins sequences with regard to determine
their similarities and align the sequences of splits variant of selected nuclear
myosins in order to identify possible targets for siRNA constructs.
2.2. Computer Based Methods 35
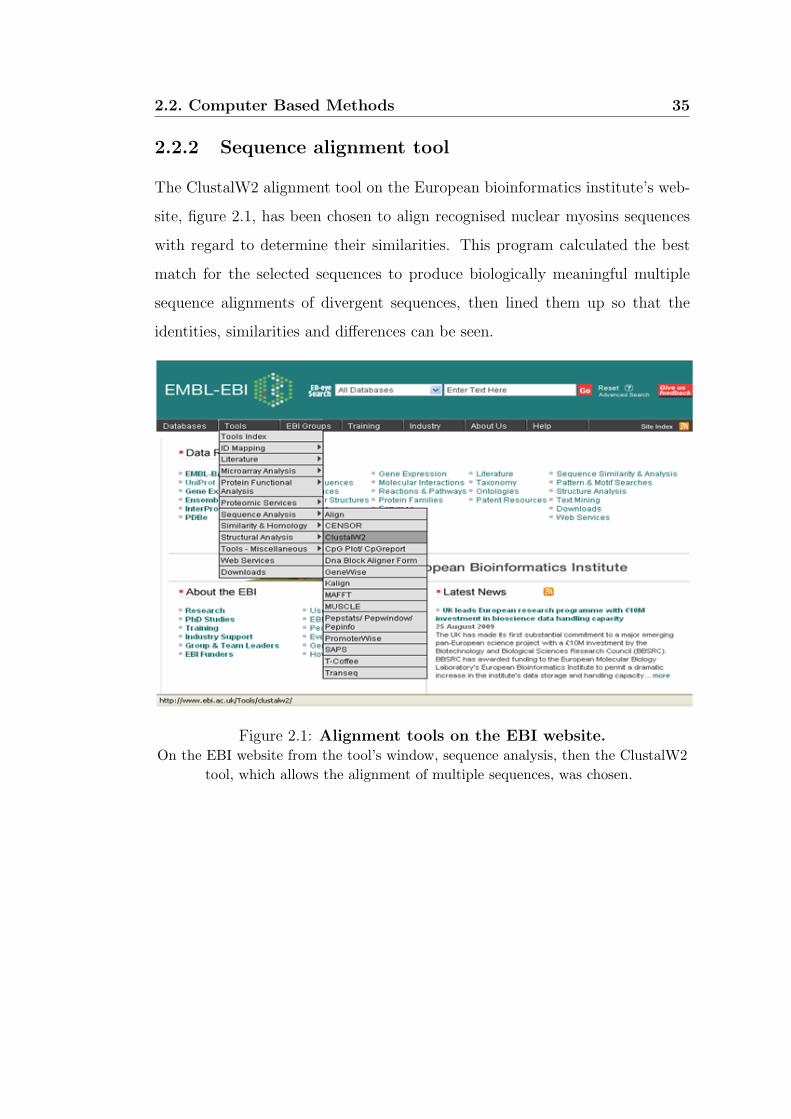
2.2.2 Sequence alignment tool
The ClustalW2 alignment tool on the European bioinformatics institute’s web-
site, figure 2.1, has been chosen to align recognised nuclear myosins sequences
with regard to determine their similarities. This program calculated the best
match for the selected sequences to produce biologically meaningful multiple
sequence alignments of divergent sequences, then lined them up so that the
identities, similarities and differences can be seen.
Figure 2.1: Alignment tools on the EBI website.On the EBI website from the tool’s window, sequence analysis, then the ClustalW2
tool, which allows the alignment of multiple sequences, was chosen.
2.2. Computer Based Methods 36
Using ClustalW2, sequences of myosin I and myosin VI have respectively
been lined up together with the other the splits variants encoded by the same
respective gene. This program permits visualisation of peculiar segments of
the myosin I and myosin VI which can be targeted when designing siRNA
constructs.
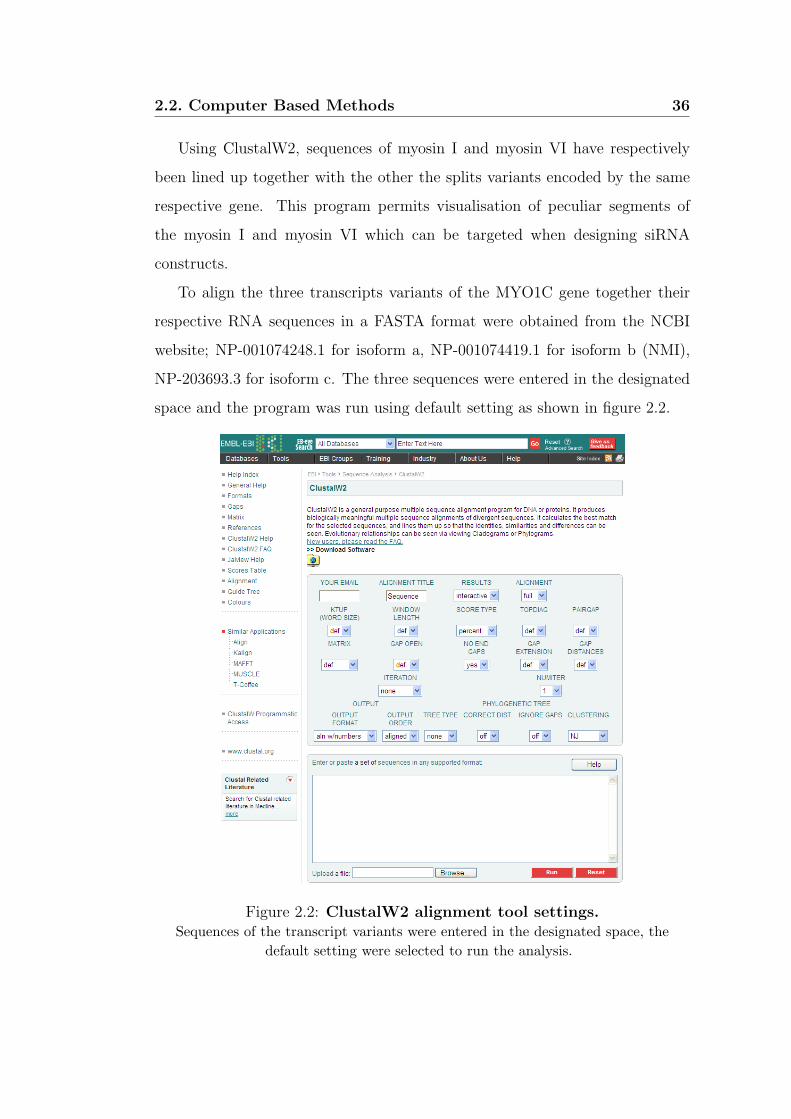
To align the three transcripts variants of the MYO1C gene together their
respective RNA sequences in a FASTA format were obtained from the NCBI
website; NP-001074248.1 for isoform a, NP-001074419.1 for isoform b (NMI),
NP-203693.3 for isoform c. The three sequences were entered in the designated
space and the program was run using default setting as shown in figure 2.2.
Figure 2.2: ClustalW2 alignment tool settings.Sequences of the transcript variants were entered in the designated space, the
default setting were selected to run the analysis.

2.2. Computer Based Methods 37
2.2.3 Design of siRNA constructs
Nuclear myosin I and unconventional myosin VI have been chosen as initial tar-
gets to be investigated for their possible role in the Chromosome 10 low serum
induced repositioning. To generate a list of candidates’ sequences for siRNA
targeting MYO1C and MYO6 genes respectively, the siRNA design tool; The
siDESIGN Center on the Dharmacon website (www.dharmacon.com/designcenter)
has been used. This tool allows to choose an identifier type (Accession Num-
ber, Gene ID, Nucleotide sequence, GI Number), to select desired region(s) for
siRNA design. Since, the nuclear myosin I is distinguished from other tran-
scripts variants encoded by the MYO1C only by its 5’UTR region, this section
has been initially selected as target region for siRNA design by using the NMI
accession number as identifier. Unfortunately, no siRNA candidates could be
built with these given inputs. The next step was to extend the target region
to include the ORF section and specify the transcript target to be the isoform
b of the MYO1C by entering the gene ID (4641). No siRNA candidates could
be built with these given inputs also, the reason why it was decided to use
commercially tried construct and ON-TARGET plus SMARTpool siRNA was
chosen for the MYO1C knock-down.
2.2. Computer Based Methods 38
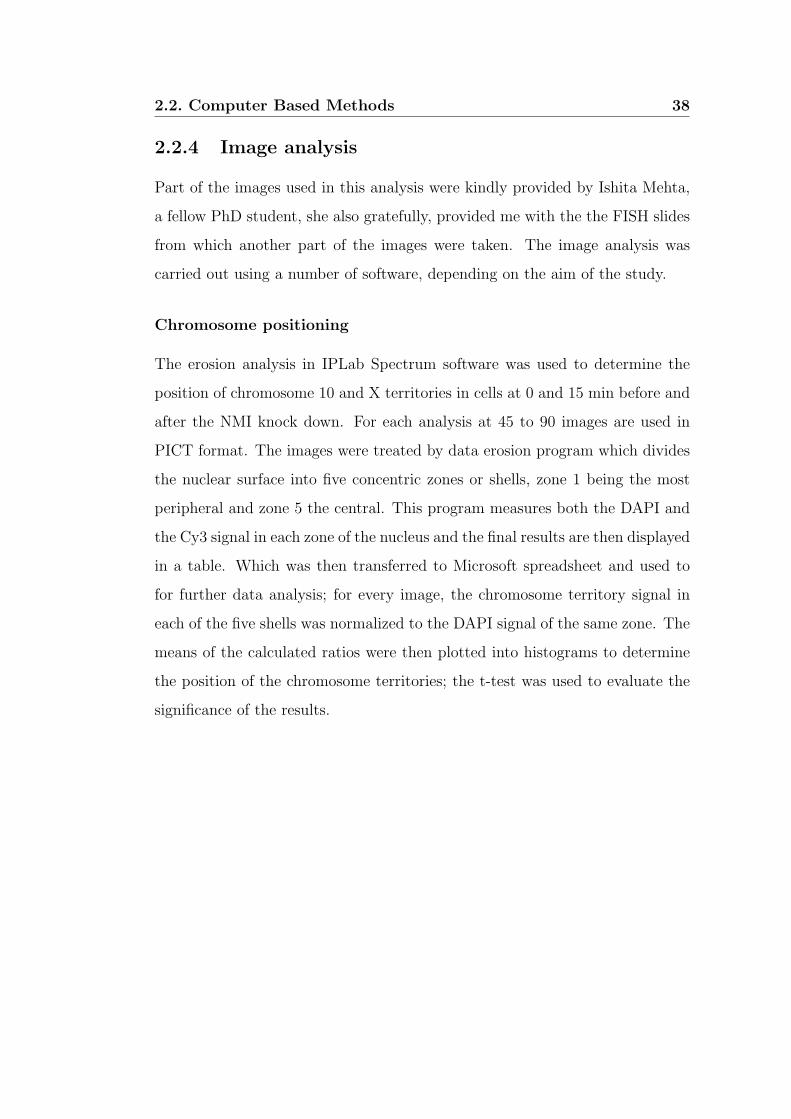
2.2.4 Image analysis
Part of the images used in this analysis were kindly provided by Ishita Mehta,
a fellow PhD student, she also gratefully, provided me with the the FISH slides
from which another part of the images were taken. The image analysis was
carried out using a number of software, depending on the aim of the study.
Chromosome positioning
The erosion analysis in IPLab Spectrum software was used to determine the
position of chromosome 10 and X territories in cells at 0 and 15 min before and
after the NMI knock down. For each analysis at 45 to 90 images are used in
PICT format. The images were treated by data erosion program which divides
the nuclear surface into five concentric zones or shells, zone 1 being the most
peripheral and zone 5 the central. This program measures both the DAPI and
the Cy3 signal in each zone of the nucleus and the final results are then displayed
in a table. Which was then transferred to Microsoft spreadsheet and used to
for further data analysis; for every image, the chromosome territory signal in
each of the five shells was normalized to the DAPI signal of the same zone. The
means of the calculated ratios were then plotted into histograms to determine
the position of the chromosome territories; the t-test was used to evaluate the
significance of the results.

2.2. Computer Based Methods 39
Nucleus and chromosome territories analysis
This analysis has been carried out in three main steps, different software or data
analysis tools has been used in each step depending on the aim of the study.
1. Corel Paint Shop Pro XI: The images obtained from the fluorescent mi-
croscope were transformed from a PICT format to a Tiff uncompressed
format using a trial version of the ”Corel Paint Shop Pro XI”. Then each
image was split to the three channel colours RBG (Red Bleu Green) and
saved as Tiff to be used for the area analysis, as illustrated in figure 2.3.
Figure 2.3: Corel Paint Shop Pro XI (RGB Split channels)A:immono-FISH original image before the split (nucleus in blue, chromosome 10
territories in green, nucleolus in red). B: red channel (only the red staining from the
original image is highlighted, corresponding to the FICT staining or the nucleolus).
C: blue channel (only the blue staining is selected corresponding to the DAPI
staining or nucleus). D: Green channel (only the green staining is selected
corresponding to the Cy3 staining or chromosome territories).
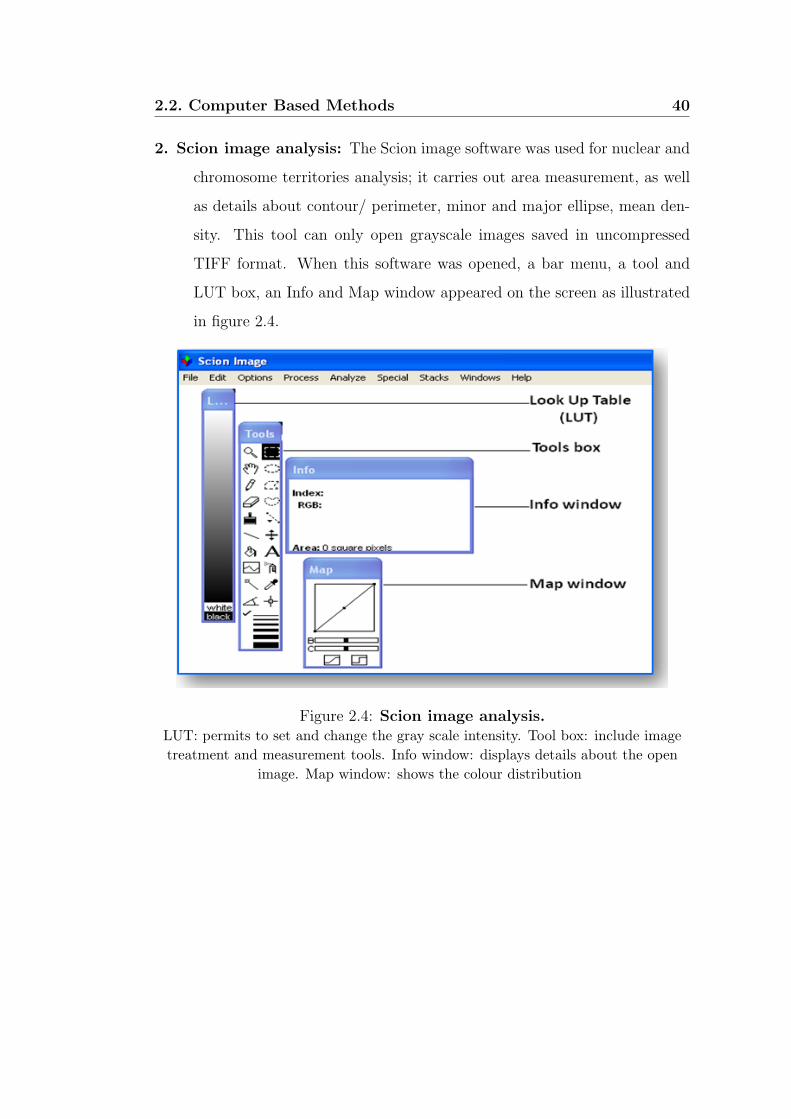
2.2. Computer Based Methods 40
2. Scion image analysis: The Scion image software was used for nuclear and
chromosome territories analysis; it carries out area measurement, as well
as details about contour/ perimeter, minor and major ellipse, mean den-
sity. This tool can only open grayscale images saved in uncompressed
TIFF format. When this software was opened, a bar menu, a tool and
LUT box, an Info and Map window appeared on the screen as illustrated
in figure 2.4.
Figure 2.4: Scion image analysis.LUT: permits to set and change the gray scale intensity. Tool box: include image
treatment and measurement tools. Info window: displays details about the open
image. Map window: shows the colour distribution

2.2. Computer Based Methods 41
For nuclear analysis, the blue channel image of each colored nucleus image
was opened using ”import” command from the file menu, then the density
slice option was selected which highlights the area of interest in red figure 2.5
according to a gray scale threshold, this could be manipulated using the LUT
window depending on the clarity and the brightness of the picture.
Figure 2.5: Density slice on Scion image.The LUT box permits to establish a grayscale threshold for the density slice, which
permits to highlight the region of interest.
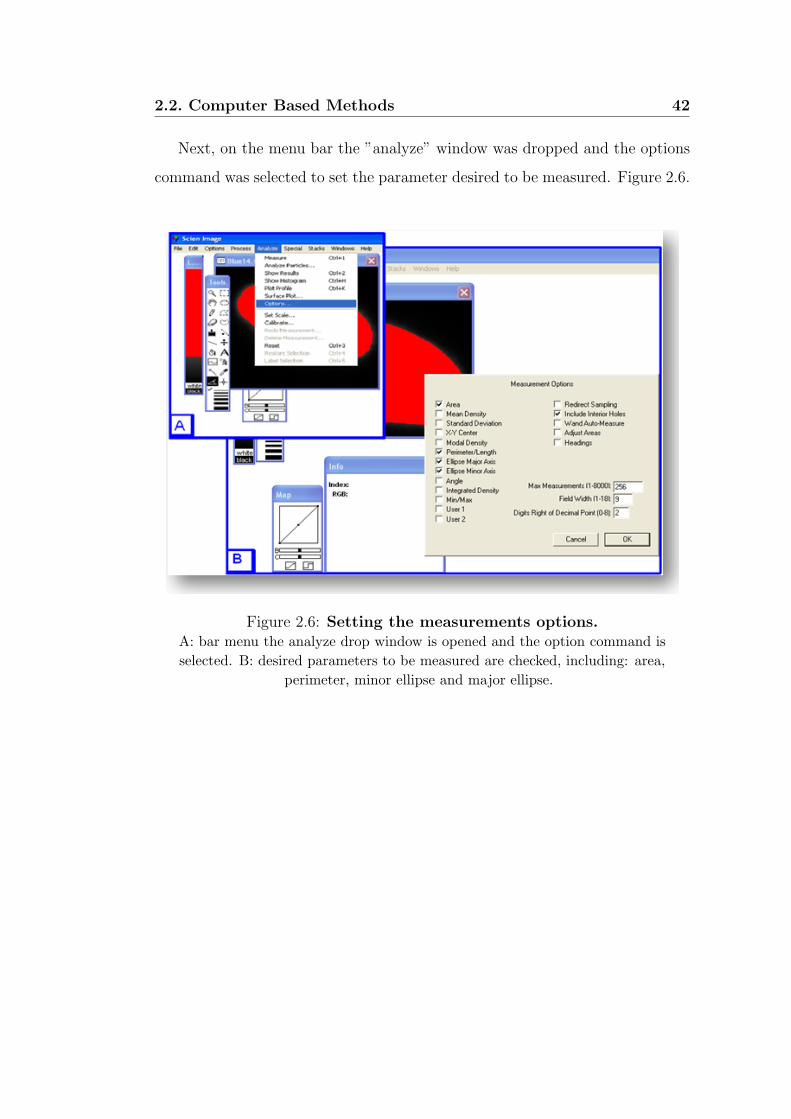
2.2. Computer Based Methods 42
Next, on the menu bar the ”analyze” window was dropped and the options
command was selected to set the parameter desired to be measured. Figure 2.6.
Figure 2.6: Setting the measurements options.A: bar menu the analyze drop window is opened and the option command is
selected. B: desired parameters to be measured are checked, including: area,
perimeter, minor ellipse and major ellipse.

2.2. Computer Based Methods 43
The following step consisted in setting the measurement scale from the anal-
yse command box, figure 2.7, the scale was set to 10.8 pixels per µm. this value
has been calculated using a graticule picture.
Figure 2.7: Setting the measurement scale to micrometers.from the ”analyze” drop window, set the scale option was selected and the scale is
set to the desired value.
Microsoft Excel
The raw data obtained from the image analysis software, were transferred to a
Microsoft Excel worksheet for further statistical analysis.

Chapter 3
The role of Nuclear Myosin 1 in
interphase chromosomes
positioning
44

3.1. Chromosome 10 positioning 45
3.1 Chromosome 10 positioning
Images obtained from FISH slides performed as described in chapter 2, were run
through a simple erosion script using IP-Lab image analysis software, which di-
vided the nucleus into 5 equal concentric shells . The DAPI and Cy3 signals
were measured in each shell. The raw data was then transferred to an Excel
worksheet, the chromosome territory’s (Cy3) signal was normalised to the nu-
clear (DAPI) signal in each shell where the mean of the ratio (% of the cy3
signal / % of the DAPI signal) has been calculated for each shell, then plot-
ted in charts. The position of the chromosomes was then defined as periphery,
intermediate or interior. A chromosome territory was identified to locate at
the nuclear periphery, when after normalisation; the mean Cy3 signal was the
highest in shell 1 and 2; intermediate if the shells 2, 3 and 4 had higher probe
signal with shell 3 having the highest signal or all the three shells showed equal
amount of Cy3 signal. Finally, the chromosome position is defined as interior
when the highest probe signal is localised in shells 4 and 5. To identify the role
of nuclear myosin 1 in chromosome 10 repositioning , the low serum inuduced
relocation of chromosome 10 from an intermediate region in the nucleus to the
nuclear periphery was first confirmed by analysing chromosome 10 positions
before and after the low serum assay. Next the NMI expression has been sup-
pressed, and the low serum assay was repeated using the NMI depleted cells
and chromosome 10 positioning before and after the low serum incubation has
been analysed and compared to chromosome positioning in cells expressing the
NMI. For each experiment 45 to 60 images were analysed .
3.1.1 Chromosome 10 repositioning before and after the
low serum assay
To confirm the low serum induced Chromosome 10 relocation from an interme-
diate region of the nucleus to its periphery 15 minutes after the cells have been
incubated in low serum media, the low serum assay using normal proliferation

3.1. Chromosome 10 positioning 46
HDF (as described in section 2.2.2 of chapter 2) has been repeated. FISH images
(figure 3.1) of nuclei from control cells (cells at 0 minute; that have not been
incubated in low serum media), and FISH images (figure 3.2) of nuclei after the
low serum assay at 15 minutes), were treated by a simple erosion analysis using
IPLab program as discribed in section 2.3.4 of chapter 2.
Figure 3.1: Sample of chromosome 10 FISH images at 0 minute.Representative images displaying nuclei prepared for fluorescence in situ
hybridization (2D-FISH) before the low serum incubation. With whole-chromosome
10 painting probes (green), nuclear DNA was counterstained with DAPI (blue) and
indirect immunofluorescence with anti-pKi-67 antibodies (red staining) permitted
the selection of normal proliferating cells.

3.1. Chromosome 10 positioning 47
Figure 3.2: Sample of chromosome 10 FISH images at 15 minutes.Representative images displaying nuclei prepared for fluorescence in situ
hybridization (2D-FISH) after the cells have been subjected to the low serum assay.
With whole-chromosome 10 painting probes (green), nuclear DNA was
counterstained with DAPI (blue) and indirect immunofluorescence with anti-pKi-67
antibodies (red staining) permitted the selection of normal proliferating cells.
Chromosome 10 position at 0 minute in NMI(+) nuclei
Chromosome 10 in normal proliferating cells before the low serum assay (at 0
minute) has been confirmed to locate at an intermediate region of the nucleus
as the highest cy3 signals were localised in shells 2 and 3, as shown in figure
3.3. Calculated paired t test has confirmed the significant cy3 signal difference
between shells 2 and 3 and the other shells.

3.1. Chromosome 10 positioning 48
Figure 3.3: Chromosome 10 positioning in nuclei of normal proliferat-ing HDFs at 0 minute.Displays the distribution of the chromosome 10 signal for 2D FISH before the low
serum incubation, as analyzed with erosion analysis. The percentage of chromosome
signal measured in each shell was divided by the percentage of DAPI signal in that
shell. Bars represent the mean normalised percentage of chromosome 10 signal in
each shell (1-5) with shell 5 being the most intern and 1 the most peripheral.
Chromosome 10 position at 15 minutes in NMI(+) nuclei
After the low serum incubation, Chromosome 10 in normal proliferating HDFs
nuclei is found to relocate to the periphery of the nucleus (figure 3.4), with the
highest chromosome signal (cy3) in shell 1 followed by shell 2, and considerably
lower signals in shells 3 and 4 and nearly null signal in shell 5. the paired t test
for means has confirmed the significantly diffrence between signals in shells 1
and 2 and the rest of the shells. p 6 0.005.

3.1. Chromosome 10 positioning 49
Figure 3.4: Chromosome 10 positioning in nuclei of normal proliferat-ing HDFs at 15 minutes.Displays the distribution of the chromosome 10 signal for 2D FISH after the low
serum incubation, as analyzed with erosion analysis. The percentage of chromosome
signal measured in each shell was divided by the percentage of DAPI signal in that
shell. Bars represent the mean normalised percentage of chromosome 10 signal in
each shell (1-5) with shell 5 being the most intern and 1 the most peripheral.
In order to better visualise the chromosome 10 relocation to the periphery
after the low serum incubation, both charts of chromosome 10 position at 0 and
15 minutes have been aligned in figure 3.5, in blue is chromosome 10 position
before the low serum assay and in pink is chromosome 10 position after the low
serum assay.

3.1. Chromosome 10 positioning 50
Figure 3.5: Chromosome 10 positioning in nuclei of normal proliferat-ing HDFs before and after the low serum incubation.Displays a juxtaposition of the chromosome 10 positioning graphs before and after
the low serum assay in normal proliferating HDFs. Blue: chromosome 10 signals at
0 minute. Pink: chromosome 10 signal at 15 minutes.
3.1.2 Chromosome 10 positioning before and after the
low serum assay in NMI depleted cells [NMI(−)]
Low serum assay has been repeated using cells where the expression of the NMI
has been suppressed using ON-TargetPlus NMI siRNA, then FISH images of
Chromosome 10 territories at 0 minute ; before the low serum incubation and at
15 minutes, figure 3.6, then after 15 minutes of low serum incubation, figure3.7
have been subjected to simple erosion using IPlab.

3.1. Chromosome 10 positioning 51
Figure 3.6: Sample of chromosome 10 FISH images at 0 minute in NMIdepleted cells.
Representative images displaying nuclei prepared for fluorescence in situ
hybridization (2D-FISH) before the low serum incubation of NMI depleted cells.
With whole-chromosome 10 painting probes (green), nuclear DNA was
counterstained with DAPI (blue).
Chromosome 10 position at 0 minute in NMI(−) nuclei
The results obtained from the erosion analysis of chromosome 10 FISH images
at 0 minute (before the low serum assay), have been plotted in the chart below,
Chromosome 10 signals are found to be the highest in shell 3 followed by shell
2, indicating an intermediate position of the chromosome 10 territories in nuclei
where the expression of the NMI has been blocked using siRNA, figure 3.8.
Chromosome 10 position at 15 minutes in NMI(−) nuclei
The results obtained from the erosion analysis of chromosome 10 FISH images
at 15 minutes (after the low serum assay), have been plotted in the chart below.
this time also, Chromosome 10 signals are found to be the highest in shell 3 fol-
lowed by shell 2, and 4 indicating an intermediate position of the chromosome 10
territories in NMI(−) nuclei after the low serum incubation, as shown in figure
3.9.
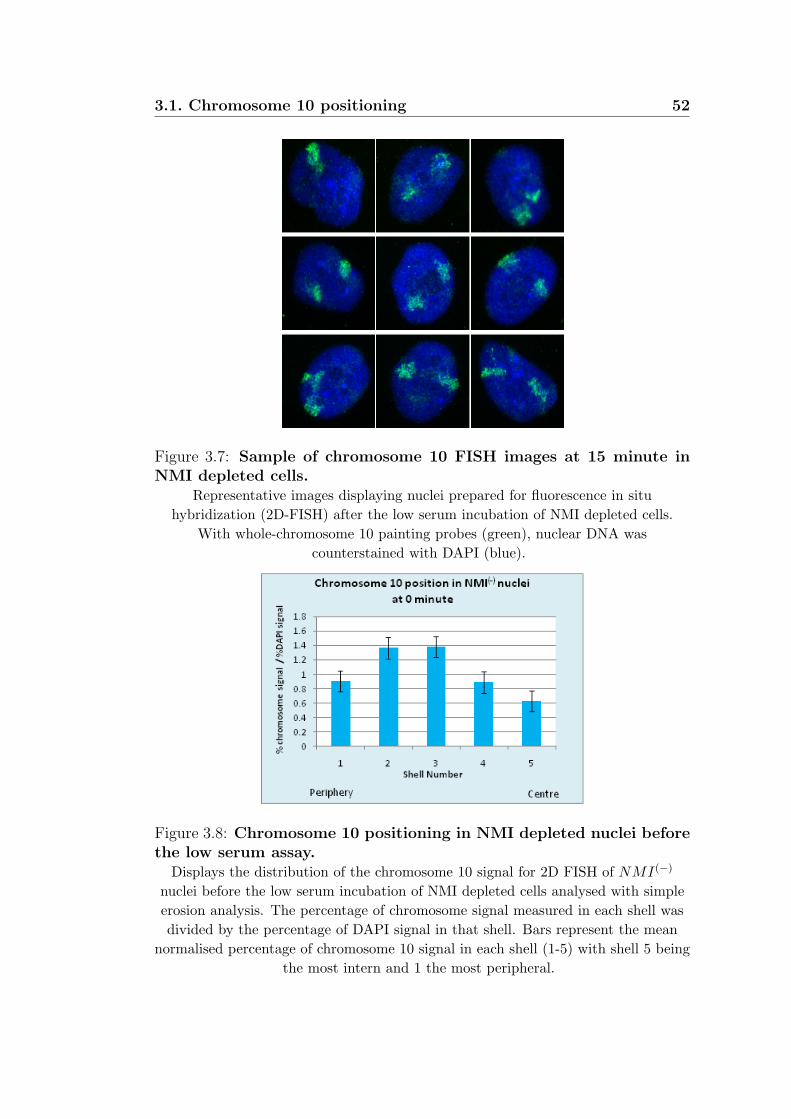
3.1. Chromosome 10 positioning 52
Figure 3.7: Sample of chromosome 10 FISH images at 15 minute inNMI depleted cells.
Representative images displaying nuclei prepared for fluorescence in situ
hybridization (2D-FISH) after the low serum incubation of NMI depleted cells.
With whole-chromosome 10 painting probes (green), nuclear DNA was
counterstained with DAPI (blue).
Figure 3.8: Chromosome 10 positioning in NMI depleted nuclei beforethe low serum assay.
Displays the distribution of the chromosome 10 signal for 2D FISH of NMI(−)
nuclei before the low serum incubation of NMI depleted cells analysed with simple
erosion analysis. The percentage of chromosome signal measured in each shell was
divided by the percentage of DAPI signal in that shell. Bars represent the mean
normalised percentage of chromosome 10 signal in each shell (1-5) with shell 5 being
the most intern and 1 the most peripheral.

3.1. Chromosome 10 positioning 53
Figure 3.9: Chromosome 10 positioning in NMI depleted nuclei afterthe low serum assay.
Displays the distribution of the chromosome 10 signal for 2D FISH of NMI(−)
nuclei after the low serum incubation of NMI depleted cells analysed with simple
erosion analysis. The percentage of chromosome signal measured in each shell was
divided by the percentage of DAPI signal in that shell. Bars represent the mean
normalised percentage of chromosome 10 signal in each shell (1-5) with shell 5 being
the most intern and 1 the most peripheral.
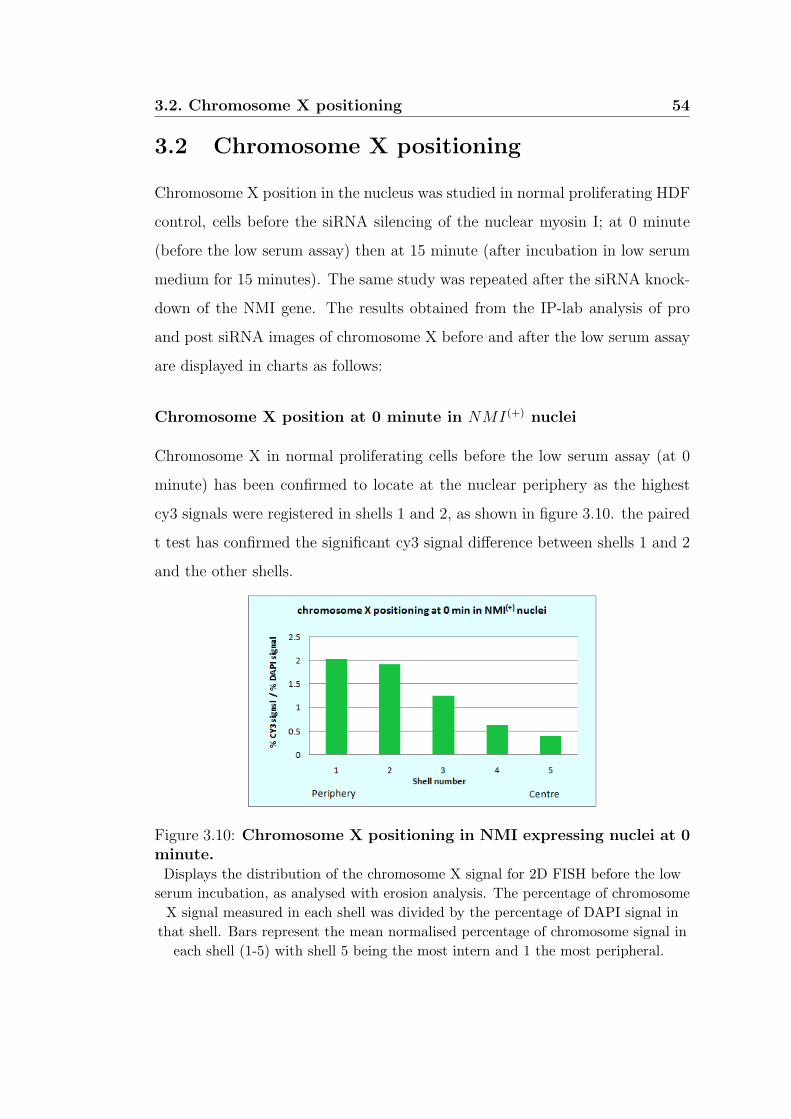
3.2. Chromosome X positioning 54
3.2 Chromosome X positioning
Chromosome X position in the nucleus was studied in normal proliferating HDF
control, cells before the siRNA silencing of the nuclear myosin I; at 0 minute
(before the low serum assay) then at 15 minute (after incubation in low serum
medium for 15 minutes). The same study was repeated after the siRNA knock-
down of the NMI gene. The results obtained from the IP-lab analysis of pro
and post siRNA images of chromosome X before and after the low serum assay
are displayed in charts as follows:
Chromosome X position at 0 minute in NMI(+) nuclei
Chromosome X in normal proliferating cells before the low serum assay (at 0
minute) has been confirmed to locate at the nuclear periphery as the highest
cy3 signals were registered in shells 1 and 2, as shown in figure 3.10. the paired
t test has confirmed the significant cy3 signal difference between shells 1 and 2
and the other shells.
Figure 3.10: Chromosome X positioning in NMI expressing nuclei at 0minute.Displays the distribution of the chromosome X signal for 2D FISH before the low
serum incubation, as analysed with erosion analysis. The percentage of chromosome
X signal measured in each shell was divided by the percentage of DAPI signal in
that shell. Bars represent the mean normalised percentage of chromosome signal in
each shell (1-5) with shell 5 being the most intern and 1 the most peripheral.

3.2. Chromosome X positioning 55
Chromosome X position at 15 minutes in NMI(+) nuclei
After the low serum incubation, Chromosome X in normal proliferating HDFs
nuclei is found to locate also to the periphery of the nucleus (figure 3.11),
with the highest chromosome signal (cy3) in shell 1 followed by shell 2, and
considerably lower signals in shells 3 and 4 and nearly null signal in shell 5.
the paired t test for means has confirmed the significantly difference between
signals in shells 1 and 2 and the rest of the shells.p 6 0.005
Figure 3.11: Chromosome X positioning in NMI expressing nuclei at15 minutes.Displays the distribution of the chromosome X signal for 2D FISH after the low
serum incubation, as analysed with erosion analysis. The percentage of chromosome
X signal measured in each shell was divided by the percentage of DAPI signal in
that shell. Bars represent the mean normalised percentage of chromosome signal in
each shell (1-5) with shell 5 being the most intern and 1 the most peripheral.
3.2.1 Chromosome X positioning before and after the
low serum assay in NMI depleted cells [NMI(−)]
Using NMI depleted cells, the low serum assay was repeated and FISH images
of chromosome X before (at 0 minute) and after the low serum assay (at 15
minutes) have been treated through the IPLab simple erosion program. the
chromosome signal (Cy3) in each shell was normalised to the DAPI signal and
the mean result in each shell has been plotted in the charts below.

3.2. Chromosome X positioning 56
Chromosome X position at 0 minute in NMI(−) nuclei
It is evident from the distribution of the chromosome X signals, that this chro-
mosome has a peripheral position in nuclei of NMI depleted HDFs before the
low serum assay. with the highest Cy3 signal registered in shell 1 followed by
shell 2, figure 3.12.
Figure 3.12: Chromosome X positioning in NMI depleted cells at 0minute.
Displays the distribution of the chromosome X signal for 2D FISH of NMI(−)
nuclei before the low serum incubation of NMI depleted cells, analysed with simple
erosion analysis. The percentage of chromosome signal measured in each shell was
divided by the percentage of DAPI signal in that shell. Bars represent the mean
normalised percentage of chromosome X signal in each shell (1-5) with shell 5 being
the most intern and 1 the most peripheral.
Chromosome X position at 15 minutes in NMI(−) nuclei
From the distribution of the Cy3 signals, this chromosome has also a peripheral
position in the nuclei of NMI depleted HDFs after the low serum incubation.
The highest Cy3 signal registered in shell 1 followed by shell 2, figure3.13.

3.2. Chromosome X positioning 57
Figure 3.13: Chromosome X positioning in NMI depleted cells at 15minutes.
Displays the distribution of the chromosome X signal for 2D FISH of NMI(−)
nuclei after the low serum incubation of NMI depleted cells, analysed with simple
erosion analysis. The percentage of chromosome signal measured in each shell was
divided by the percentage of DAPI signal in that shell. Bars represent the mean
normalised percentage of chromosome X signal in each shell (1-5) with shell 5 being
the most intern and 1 the most peripheral.
conclusion
The study of chromosome 10 positions before and after the low serum assay has
permitted the confirmation of the low serum induced chromosome 10 reposi-
tioning from an intermediate position to the periphery of the nucleus. In nuclei
where the expression of the NMI has been suppressed using siRNA, chromosome
10 position before and after the low serum assay did not seem to have changed
from the intermediate position. This indicates that the NMI is necessary for
the low serum induced relocation of the chromosome 10 from the intermediate
position to the peripheral location in interphase HDFs. On the other hand,
chromosome X positioning analysis showed no significant changes of its posi-
tion. Chromosome X was found to locate at nuclear periphery before and after
the low serum assay in both, NMI depleted and expressing cells.

Chapter 4
Results: Image Analysis
4.1 Analysis of nuclear size
Introduction
The raw data obtained from Scion analysis of the nuclei and the chromosome
territories were transferred to an Excel worksheet where data analysis tools have
been utilized to compare the resulting means of each studied parameter. To test
the statistical significance of any encountered differences, the T-test for unpaired
samples assuming unequal variances has been employed; as is convention any
tested difference is said to be statistically significant if the calculated t-Stat is
bigger than the given t-Critical for two samples and the value of P is smaller
than 0.05 at 95 % confidence intervals. Finally, results have been presented in
charts to aid interpretation .
4.1.1 Investigating the effects of the low serum assay on
the nuclear size
The aim of this study is to investigate any changes in nuclear size that may
have occurred as a result of subjecting the cells to the low serum assay. Since
we have already identified a strikingly rapid chromosome rearrangement as a
result to incubating the cells in low serum for just 15 minutes. It was important
58
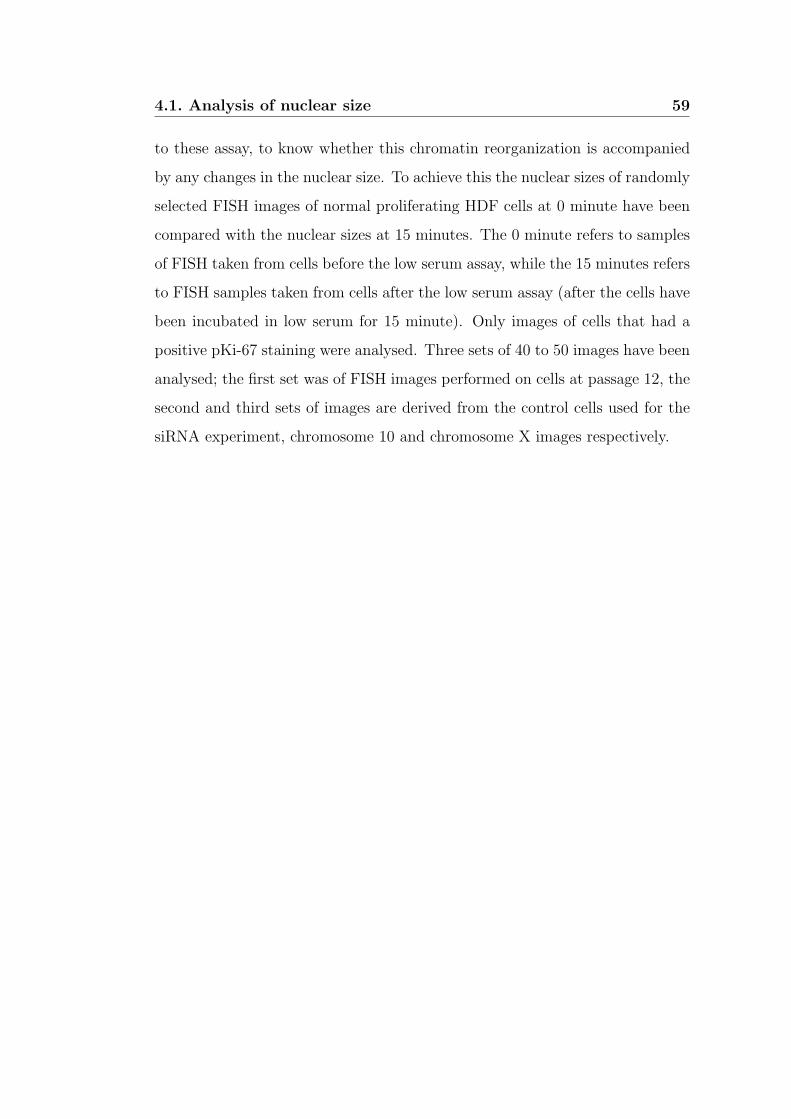
4.1. Analysis of nuclear size 59
to these assay, to know whether this chromatin reorganization is accompanied
by any changes in the nuclear size. To achieve this the nuclear sizes of randomly
selected FISH images of normal proliferating HDF cells at 0 minute have been
compared with the nuclear sizes at 15 minutes. The 0 minute refers to samples
of FISH taken from cells before the low serum assay, while the 15 minutes refers
to FISH samples taken from cells after the low serum assay (after the cells have
been incubated in low serum for 15 minute). Only images of cells that had a
positive pKi-67 staining were analysed. Three sets of 40 to 50 images have been
analysed; the first set was of FISH images performed on cells at passage 12, the
second and third sets of images are derived from the control cells used for the
siRNA experiment, chromosome 10 and chromosome X images respectively.

4.1. Analysis of nuclear size 60
First data set
The analysis of the nuclear area before and after the low serum assay in normal
proliferating HDFs at passage 12 shows that the mean nuclear area of cells after
the low serum assay is smaller than that of control cells (before the low serum
assay), as displayed in figure 4.1. The two samples t-test assuming unequal
variances shows a calculated value of t Stat = 3.03 > t critical two tails = 1.99
and P = 0.003 suggesting that the difference observed between the nuclear size
at 0 and 15 minutes is statistically significant. Results are listed in table 4.1
Figure 4.1: First comparison of the means nuclear area before and afterthe low serum assay.Blue: nuclear area at 0 minute or before the low serum incubation, Red:nuclear area
at 15 minute after the low serum incubation, all measurements are shown in µm2

4.1. Analysis of nuclear size 61
t-Test: Two-Sample Assuming Unequal VariancesNuclear area
at 0 min
Nuclear area
at 15 min
Mean 452.46 350.31Variance 26898.77 18275.97Observations 40 40Hypothesized Mean Difference 0df 75t Stat 3.03951p(T<=t) one-tail 0.001631t Critical one-tail 1.665425p(T<=t) two-tail 0.003262t Critical two-tail 1.992102
Table 4.1: Significance test for the nuclear size difference before and after lowserum assay, data set 1.
Second data set
The analysis of the nuclear area before and after the low serum assay in normal
proliferating HDF was repeated using FISH images from cells at passage 10.
From the results of this analysis it seems that the nuclear area is also smaller
after the low serum treatments of the cells, as shown in figure 4.2.
The t-test this time shows that this difference is statistically insignificant
with a t Stat<t Critical two tails and p=0.13, results are displayed in table 4.2
t-Test: Two-Sample Assuming Unequal VariancesNuclear area
at 0 min
Nuclear area
at 15 min
Mean 725.334 659.69Variance 50240.29954 44060.4481Observations 50 50Hypothesized Mean Difference 0df 98t Stat 1.51155p(T<=t) one-tail 0.066933t Critical one-tail 1.660551pT<= t two-tail 0.133866t Critical two-tail 1.984467
Table 4.2: Significance test for the nuclear size difference before and after lowserum assay, data set 2.

4.1. Analysis of nuclear size 62
Figure 4.2: Second comparison of the means nuclear area before andafter the low serum assay.Blue: nuclear area at 0 minute or before the low serum incubation, Red : nuclear
area at 15 minute after the low serum incubation, all measurements are shown in
µm2
Third data set
The analysis of the nuclear area before and after the low serum assay in normal
proliferating HDF has been repeated using a third set of FISH images from cells
from the same passage 10 as the previous one. From the results of this analysis
it seems that the mean nuclear area is bigger, after the low serum treatments
of the cells, figure 4.3, but the t-test this time shows that this difference is
statistically insignificant (t Stat < t Critical two tails and p = 0.14). The
results are displayed below in in the table 4.3.

4.1. Analysis of nuclear size 63
Figure 4.3: Third comparison of the means nuclear area before andafter the low serum assay.Blue: nuclear area at 0 minute or before the low serum incubation, Red:nuclear area
at 15 minute after the low serum incubation, all measurements are shown in µm2.
t-Test: Two-Sample Assuming Unequal VariancesNuclear area
at 0 min
Nuclear area
at 15 min
Mean 433.19 508.2881Variance 62326.4 45818.15Observations 42 42Hypothesized Mean Difference 0df 80t Stat -1.47996p(T<=t)one-tail 0.071405t Critical one-tail 1.664125p(T<=t) two-tail 0.14281t Critical two-tail 1.990063
Table 4.3: Significance test for the nuclear size difference before and after lowserum assay, data set 3
Conclusion
There is no significant difference between the nuclear size of cells subjected to
the low serum assay and control cells. Initially, it seemed that the nuclear size
had become smaller after incubating the cells in low serum for 15 minutes when

4.1. Analysis of nuclear size 64
compared to the size of nuclei of control cells (data set 1 and 2). To test the
significance of this difference of mean nuclei areas between 0 and 15 minute,
a two samples t-test for unequal variances have been calculated. While, the
calculated t-test for the first set of data showed that the observed difference
between the nuclei sizes at 0 and 15 minutes was significant (t stat = 3.03 >
t critical two tails = 1.99; p = 0.003), the second t-test for data set 2 was
found to be insignificant (t stat = 1.51< t critical two tails = 1.98; p = 0.066
). In data set 3 a different trend was observed; it appeared that the nuclear
size increased after the low serum incubation of the cells, this time again the
t-test has indicated that this difference observed between the nuclei size at 0
and 15 minutes is statistically insignificant (t stat = 1.47 < t critical two tails
= 1.99 ; p= 0.07). It is evident that the differences observed in the nuclei size
between the cells that have been subjected to the low serum assay and those
that have not been, is statistically insignificant, therefore there are no notable
changes in the nuclei size when the cells have been incubated in low serum for
15 minutes. Thus, subjecting the cells to the low serum assay has not induced
any significant changes in the nuclear area.
4.1.2 Investigating effects of the siRNA- mediated sup-
pression of NMI on the nuclear size
The aim of this part of the study was to investigate whether the siRNA-mediated
knock down of nuclear myosin I protein resulted in any changes in the overall
nuclear size of the cells. This was achieved by conducting a series of comparisons
of the mean nuclear area of cells where the siRNA transfection have been used to
block the expression of the nuclear myosin I with control cells that have not been
transfected. Next the comparison of the nuclear size before and after the low
serum assay has been repeated in cells where the NMI gene has been silenced.
Then comparing the mean nuclear area of cells incubated in low serum for 15
minutes before and after the nuclear myosin I has been silenced, as follows.
Whenever, a significant difference between the NMI(+) nuclei and the NMI(−)
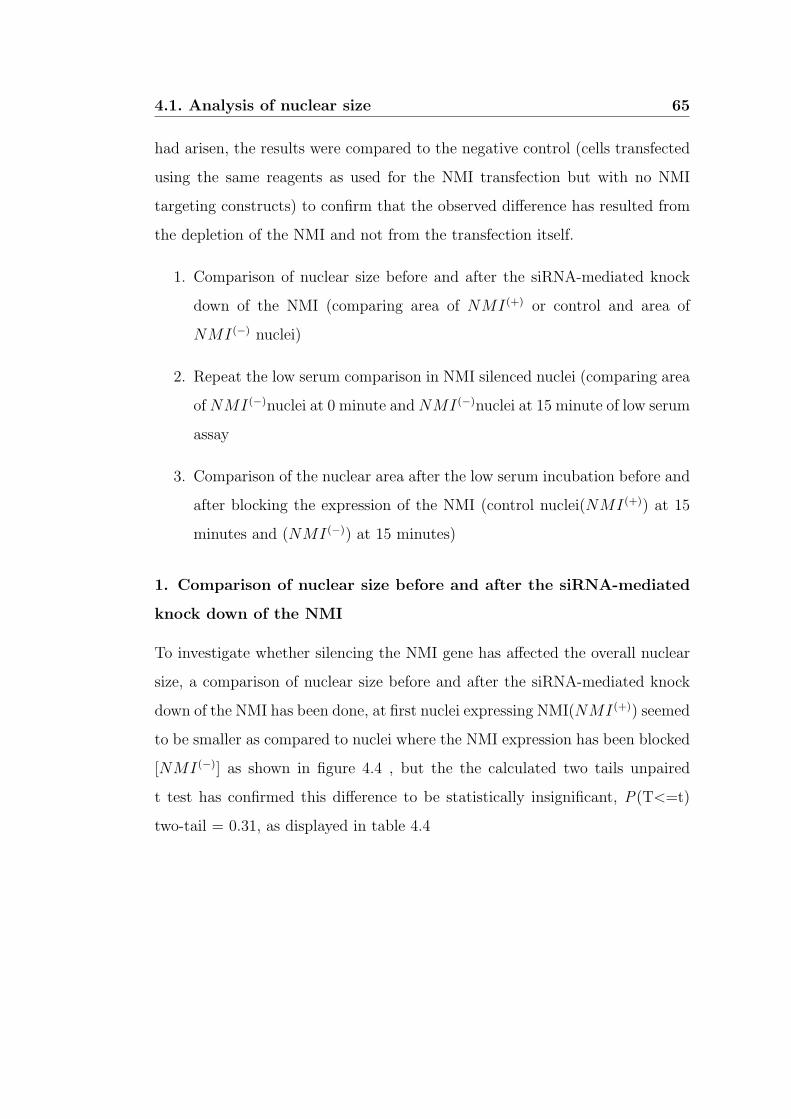
4.1. Analysis of nuclear size 65
had arisen, the results were compared to the negative control (cells transfected
using the same reagents as used for the NMI transfection but with no NMI
targeting constructs) to confirm that the observed difference has resulted from
the depletion of the NMI and not from the transfection itself.
1. Comparison of nuclear size before and after the siRNA-mediated knock
down of the NMI (comparing area of NMI(+) or control and area of
NMI(−) nuclei)
2. Repeat the low serum comparison in NMI silenced nuclei (comparing area
ofNMI(−)nuclei at 0 minute andNMI(−)nuclei at 15 minute of low serum
assay
3. Comparison of the nuclear area after the low serum incubation before and
after blocking the expression of the NMI (control nuclei(NMI(+)) at 15
minutes and (NMI(−)) at 15 minutes)
1. Comparison of nuclear size before and after the siRNA-mediated
knock down of the NMI
To investigate whether silencing the NMI gene has affected the overall nuclear
size, a comparison of nuclear size before and after the siRNA-mediated knock
down of the NMI has been done, at first nuclei expressing NMI(NMI(+)) seemed
to be smaller as compared to nuclei where the NMI expression has been blocked
[NMI(−)] as shown in figure 4.4 , but the the calculated two tails unpaired
t test has confirmed this difference to be statistically insignificant, P(T<=t)
two-tail = 0.31, as displayed in table 4.4
4.1. Analysis of nuclear size 66
Figure 4.4: Comparison of the means nuclear area before and after thesilencing of the NMI.Blue: nuclear area at before the siRNA knock down of the NMI , Purple: nuclear
area after the siRNA knock down of the NMI, standard error bars have been
plotted, all measurements are shown in µm2
t-Test: Two-Sample Assuming Unequal VariancesMean area ofNMI(+)
Mean area ofNMI(−) nuclei
Mean 452.3768 485.704Variance 0.002179 0.003219Observations 50 50Hypothesized Mean Difference 0df 93t Stat -1.00804P(T<=t) one-tail 0.157972t Critical one-tail 1.660715P(T<=t) two-tail 0.315943t Critical two-tail 1.984723
Table 4.4: Significance test for the difference in nuclear area before and afterthe silencing of the NMI.
2. Comparison of the nuclei size before and after the low serum assay
in NMI depleted nuclei(NMI(−))
The low serum assay has been repeated using cells where the expression of
the NMI has been blocked using siRNA (NMI(−)). To investigate whether
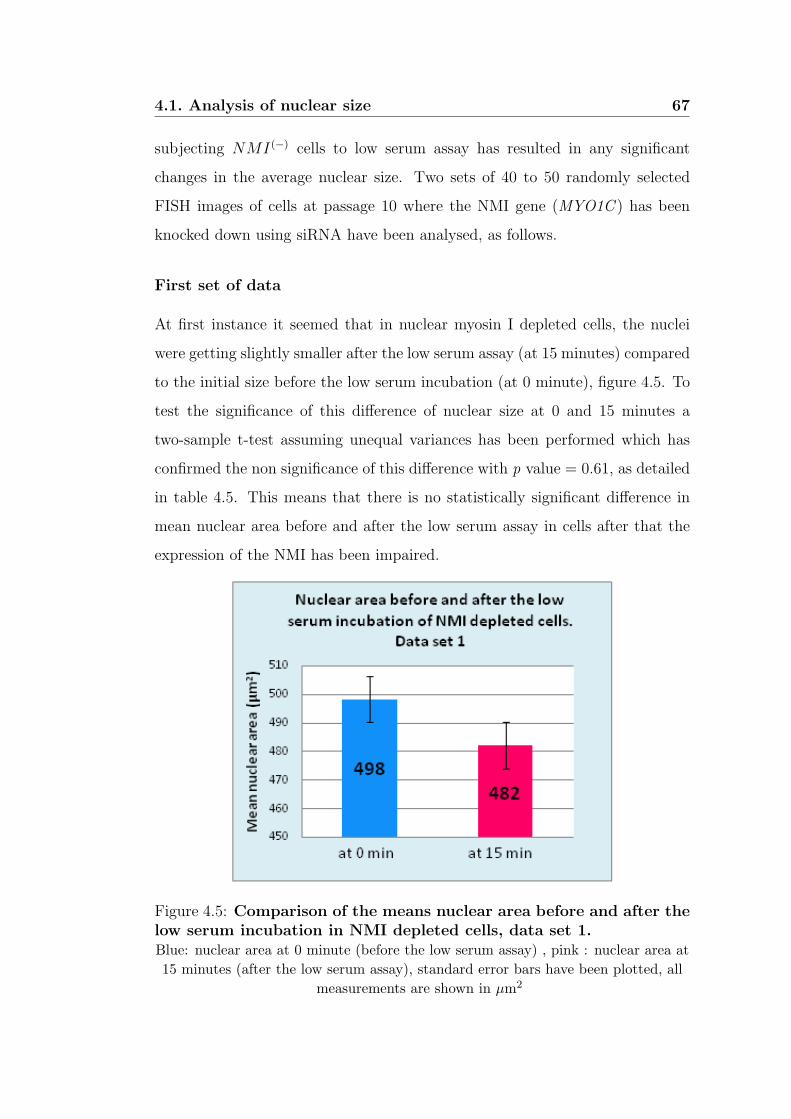
4.1. Analysis of nuclear size 67
subjecting NMI(−) cells to low serum assay has resulted in any significant
changes in the average nuclear size. Two sets of 40 to 50 randomly selected
FISH images of cells at passage 10 where the NMI gene (MYO1C ) has been
knocked down using siRNA have been analysed, as follows.
First set of data
At first instance it seemed that in nuclear myosin I depleted cells, the nuclei
were getting slightly smaller after the low serum assay (at 15 minutes) compared
to the initial size before the low serum incubation (at 0 minute), figure 4.5. To
test the significance of this difference of nuclear size at 0 and 15 minutes a
two-sample t-test assuming unequal variances has been performed which has
confirmed the non significance of this difference with p value = 0.61, as detailed
in table 4.5. This means that there is no statistically significant difference in
mean nuclear area before and after the low serum assay in cells after that the
expression of the NMI has been impaired.
Figure 4.5: Comparison of the means nuclear area before and after thelow serum incubation in NMI depleted cells, data set 1.Blue: nuclear area at 0 minute (before the low serum assay) , pink : nuclear area at
15 minutes (after the low serum assay), standard error bars have been plotted, all
measurements are shown in µm2
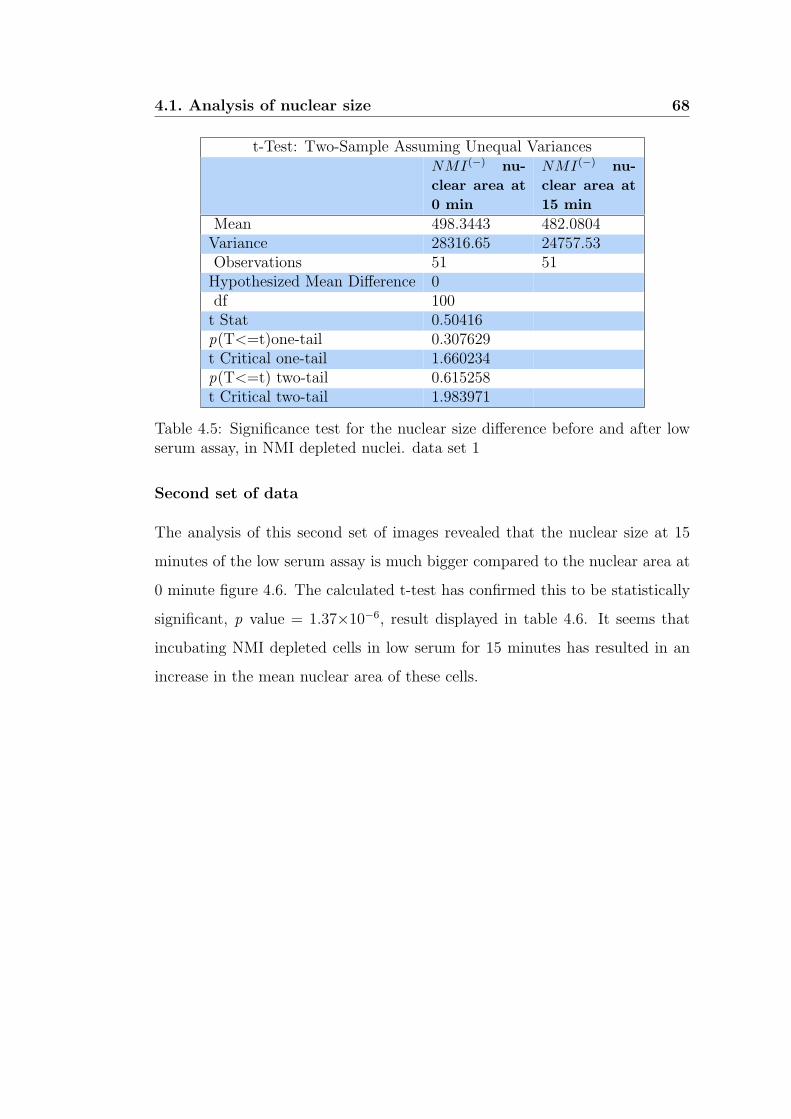
4.1. Analysis of nuclear size 68
t-Test: Two-Sample Assuming Unequal VariancesNMI(−) nu-
clear area at
0 min
NMI(−) nu-
clear area at
15 min
Mean 498.3443 482.0804Variance 28316.65 24757.53Observations 51 51Hypothesized Mean Difference 0df 100t Stat 0.50416p(T<=t)one-tail 0.307629t Critical one-tail 1.660234p(T<=t) two-tail 0.615258t Critical two-tail 1.983971
Table 4.5: Significance test for the nuclear size difference before and after lowserum assay, in NMI depleted nuclei. data set 1
Second set of data
The analysis of this second set of images revealed that the nuclear size at 15
minutes of the low serum assay is much bigger compared to the nuclear area at
0 minute figure 4.6. The calculated t-test has confirmed this to be statistically
significant, p value = 1.37×10⁻⁶, result displayed in table 4.6. It seems that
incubating NMI depleted cells in low serum for 15 minutes has resulted in an
increase in the mean nuclear area of these cells.
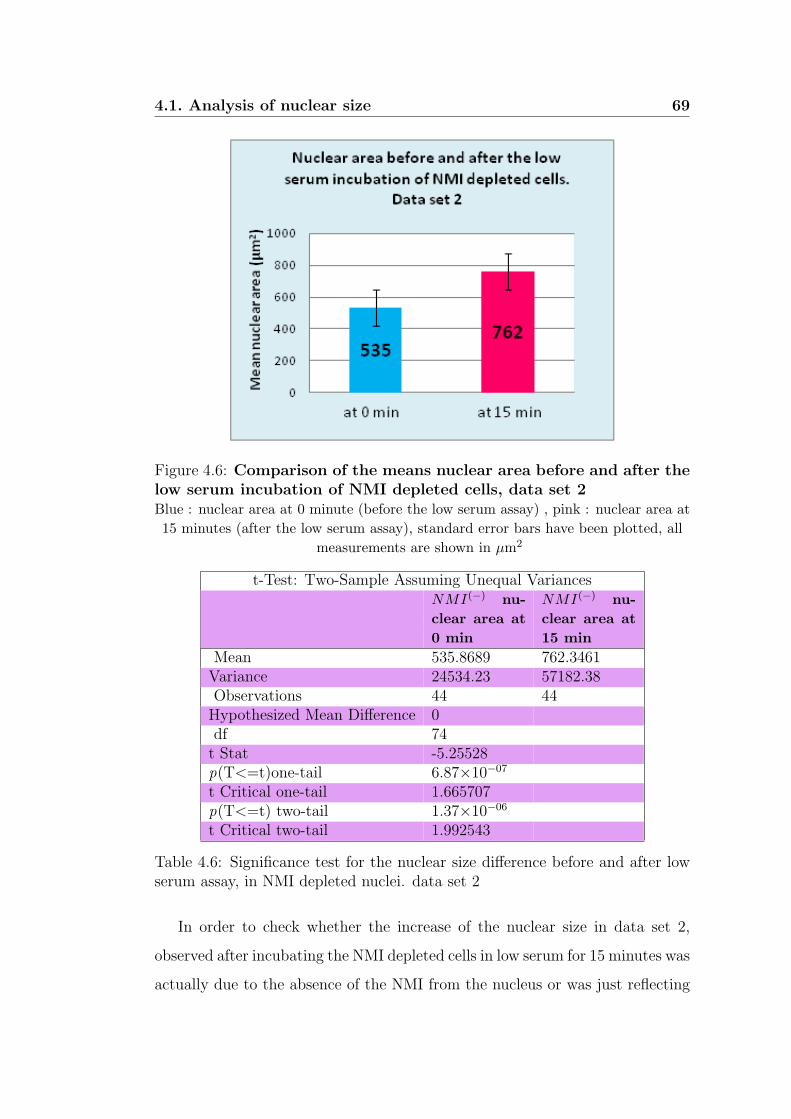
4.1. Analysis of nuclear size 69
Figure 4.6: Comparison of the means nuclear area before and after thelow serum incubation of NMI depleted cells, data set 2Blue : nuclear area at 0 minute (before the low serum assay) , pink : nuclear area at
15 minutes (after the low serum assay), standard error bars have been plotted, all
measurements are shown in µm2
t-Test: Two-Sample Assuming Unequal VariancesNMI(−) nu-
clear area at
0 min
NMI(−) nu-
clear area at
15 min
Mean 535.8689 762.3461Variance 24534.23 57182.38Observations 44 44Hypothesized Mean Difference 0df 74t Stat -5.25528p(T<=t)one-tail 6.87×10−07
t Critical one-tail 1.665707p(T<=t) two-tail 1.37×10−06
t Critical two-tail 1.992543
Table 4.6: Significance test for the nuclear size difference before and after lowserum assay, in NMI depleted nuclei. data set 2
In order to check whether the increase of the nuclear size in data set 2,
observed after incubating the NMI depleted cells in low serum for 15 minutes was
actually due to the absence of the NMI from the nucleus or was just reflecting

4.1. Analysis of nuclear size 70
a natural variation of the cells population; we repeated the same analysis in
negative control (NMI−c) cells (cells transfected using non targeting siRNA).
The result obtained were similar to the previously observed difference in data
set 2 of the NMI knocked down cells with a nuclear area after the 15 minutes
low serum incubation much more bigger then the nuclear area at 0 minute (cells
that have not been incubated in low serum media). As shown in figure 4.7, the t
test in this case, showed that this difference is significant; p value =6.98×10⁻¹¹
as displayed in table 4.7.
Figure 4.7: Comparison of the means nuclear area before and after thelow serum incubation of non NMI targeting siRNA transfected nuclei1.Blue: nuclear area at 0 minute (before the low serum assay), Pink: nuclear at 15
minutes(after the low serum assay), standard error bars have been plotted, all
measurements are shown in µm2
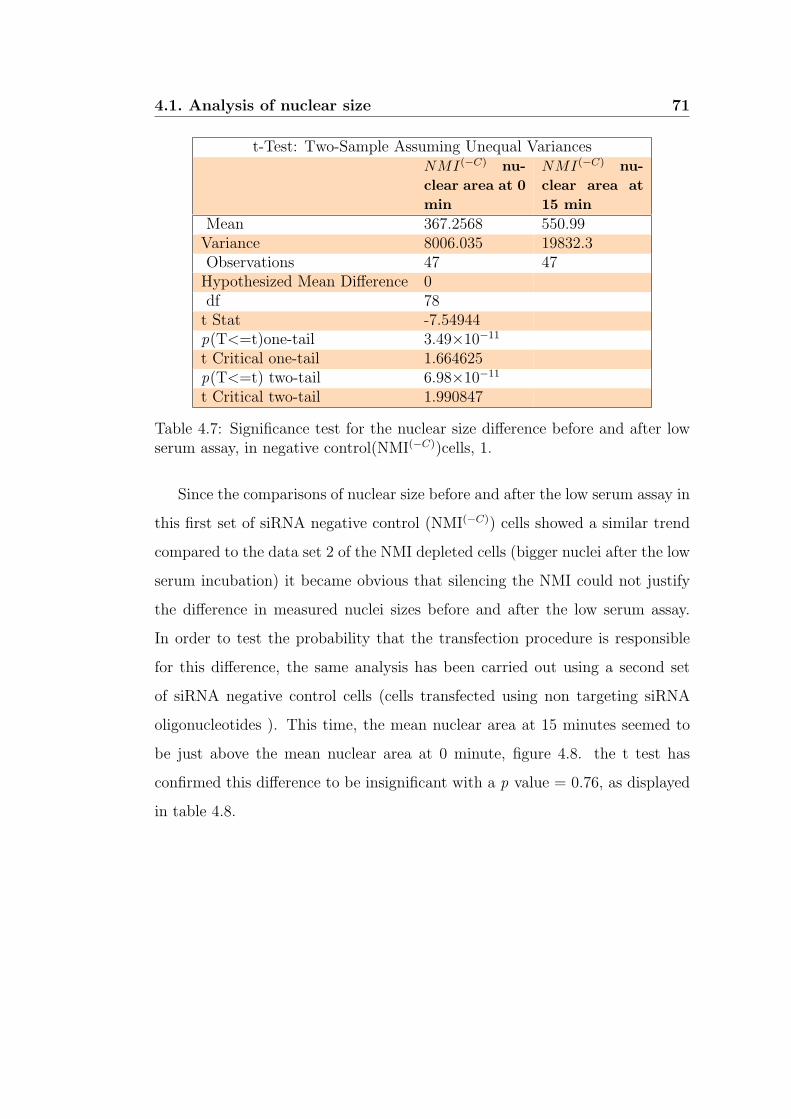
4.1. Analysis of nuclear size 71
t-Test: Two-Sample Assuming Unequal VariancesNMI(−C) nu-
clear area at 0
min
NMI(−C) nu-
clear area at
15 min
Mean 367.2568 550.99Variance 8006.035 19832.3Observations 47 47Hypothesized Mean Difference 0df 78t Stat -7.54944p(T<=t)one-tail 3.49×10⁻¹¹
t Critical one-tail 1.664625p(T<=t) two-tail 6.98×10⁻¹¹
t Critical two-tail 1.990847
Table 4.7: Significance test for the nuclear size difference before and after lowserum assay, in negative control(NMI(−C))cells, 1.
Since the comparisons of nuclear size before and after the low serum assay in
this first set of siRNA negative control (NMI(−C)) cells showed a similar trend
compared to the data set 2 of the NMI depleted cells (bigger nuclei after the low
serum incubation) it became obvious that silencing the NMI could not justify
the difference in measured nuclei sizes before and after the low serum assay.
In order to test the probability that the transfection procedure is responsible
for this difference, the same analysis has been carried out using a second set
of siRNA negative control cells (cells transfected using non targeting siRNA
oligonucleotides ). This time, the mean nuclear area at 15 minutes seemed to
be just above the mean nuclear area at 0 minute, figure 4.8. the t test has
confirmed this difference to be insignificant with a p value = 0.76, as displayed
in table 4.8.

4.1. Analysis of nuclear size 72
Figure 4.8: Comparison of the means nuclear area before and after thelow serum incubation in non NMI targeting siRNA transfected nuclei2.Blue: nuclear area at 0 minute (before the low serum assay) , Pink: nuclear area at
15 minutes (after the low serum assay), standard error bars have been plotted, all
measurements are shown in µm2
t-Test: Two-Sample Assuming Unequal VariancesNMI(−C) nu-
clear area at 0
min
NMI(−C) nu-
clear area at
15 min
Mean 533.1143 545.14152Variance 42010.3844 28953.94272Observations 46 46Hypothesized Mean Difference 0df 87t Stat 0.306212181p(T<=t)one-tail 0.380087344t Critical one-tail 1.66255735p(T<=t) two-tail 0.760174687t Critical two-tail 1.987608241
Table 4.8: Significance test for the nuclear size difference before and after lowserum assay, in siRNA NMI negative control(NMI(−C))nuclei, 2.
Conclusion
The comparison of the nuclear size at 0 and 15 minutes of the low serum assay
after the NMI depletion, has revealed a significant increase in nuclear size after

4.1. Analysis of nuclear size 73
the low serum incubation in one set of data while no significant change has
been registered in the other set. A comparable pattern has been identified
in negative control cells (cells that have been transfected using non targeting
siRNA) obtained from cells issued from the same culture as data set 2. In this
case also, a significantly larger mean nuclear area at 15 minutes compared to 0
minute was registered. Thus, we can conclude that even so there was significant
difference between nuclear areas before and after the low serum incubation in
NMI depleted nuclei, the observed difference could not have been caused by the
silencing of the NMI, since a comparable difference was also observed in negative
control cells where the NMI has not been targeted by the siRNA (negative
control 1). The probability that this difference could be have been due the
transfection procedure itself, has been eliminated because, a separately non
targeting siRNA transfected sample (negative control 2) showed no significant
difference in the nuclear size before and after the low serum assay. Thus, the
apparent increase in nuclear size after the low serum incubation observed in
only one cells sample could not have been induced by the siRNA transfection
nor by the NMI depletion, as other samples showed no significant difference in
nuclear size before and after the low serum incubation. Hence, this difference
was probably secondary to sample variations; repeating similar experiments in
the future should provide us with more conclusive evidence.
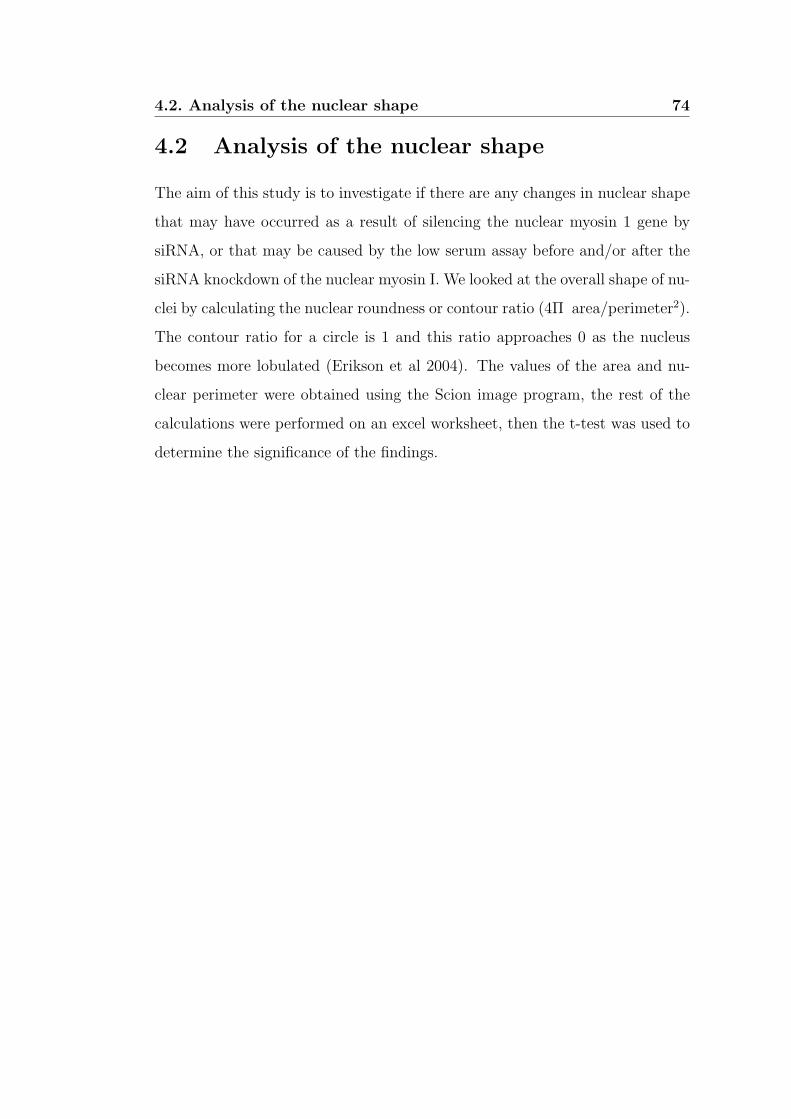
4.2. Analysis of the nuclear shape 74
4.2 Analysis of the nuclear shape
The aim of this study is to investigate if there are any changes in nuclear shape
that may have occurred as a result of silencing the nuclear myosin 1 gene by
siRNA, or that may be caused by the low serum assay before and/or after the
siRNA knockdown of the nuclear myosin I. We looked at the overall shape of nu-
clei by calculating the nuclear roundness or contour ratio (4Π area/perimeter2).
The contour ratio for a circle is 1 and this ratio approaches 0 as the nucleus
becomes more lobulated (Erikson et al 2004). The values of the area and nu-
clear perimeter were obtained using the Scion image program, the rest of the
calculations were performed on an excel worksheet, then the t-test was used to
determine the significance of the findings.

4.2. Analysis of the nuclear shape 75
4.2.1 Investigating the effect of the low serum assay on
nuclear shape
In order to identify whether the low serum assay has had any effects on the
nuclear shape, we compared the results of the calculated nuclear contour ratio
(4Π area/perimeter2) in normal proliferating cells before the low serum assay
(at 0 minute) with the nuclear contour ratio after the low serum incubation (at
15 minutes). All the compared cells were from same cultures at same passage,
and fixed using the same procedure described in section 2.2.3 of chapter 2. The
results of the calculated contour ratio at 0 minute and 15 minutes, were quite
similar at (0.38) and (0.37) respectively results. To evaluate how significant
these results , a t-test for two samples assuming unequal variances has been
calculated which confirmed that the difference between the contour ratio of
cells at 0 minute and 15 minutes is statistically insignificant with a value of
p = 0.68, details of the t-test are displayed in table 4.9. This suggested that
there is no significant difference between the nuclear shape before and after the
low serum assay, hence subjecting the cells to low serum for 15 minutes had no
significant effect on the nuclear shape.
t-Test: Two-Sample Assuming Unequal VariancesNuclei contour
ratio at 0 min
Nuclei contour
ratio at 15 min
Mean 0.380799 0.377022Variance 0.002185 0.002169Observations 50 50Hypothesized Mean Difference 0df 98t Stat 0.404686P(T<=t) one-tail 0.343295t Critical one-tail 1.660551P(T<=t) two-tail 0.68659t Critical two-tail 1.984467
Table 4.9: Significance test for the difference in nuclear contour ratio before andafter the low serum assay
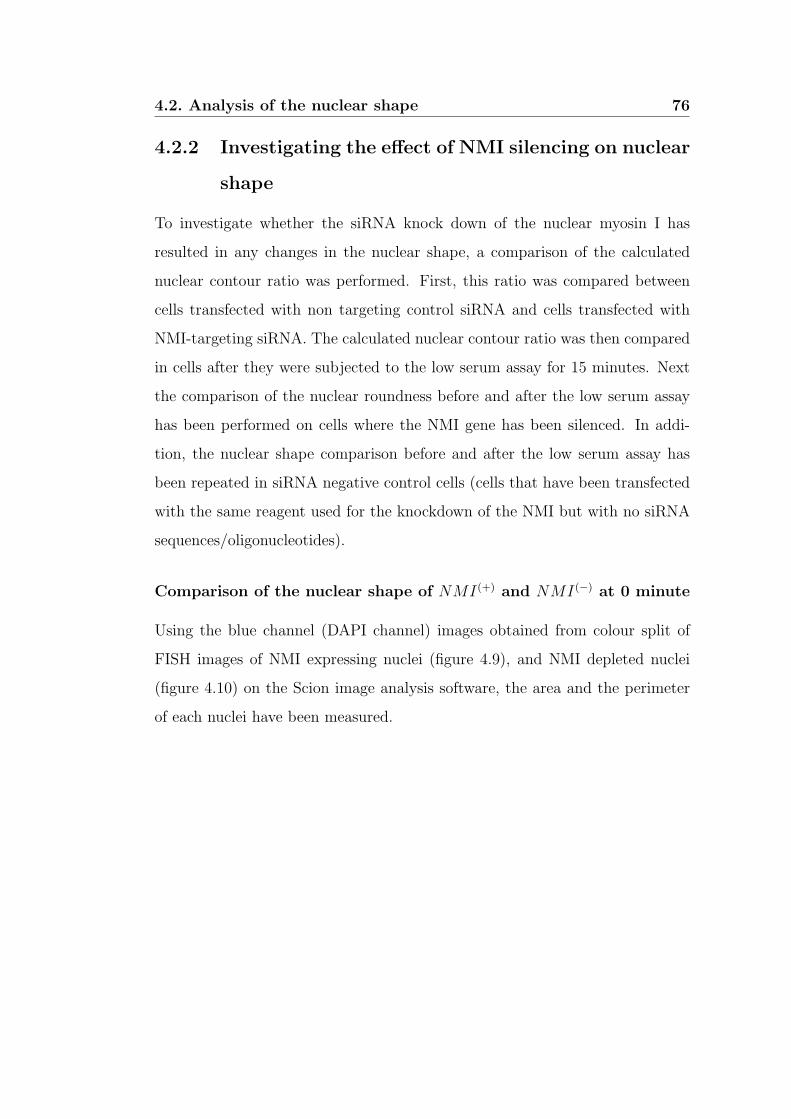
4.2. Analysis of the nuclear shape 76
4.2.2 Investigating the effect of NMI silencing on nuclear
shape
To investigate whether the siRNA knock down of the nuclear myosin I has
resulted in any changes in the nuclear shape, a comparison of the calculated
nuclear contour ratio was performed. First, this ratio was compared between
cells transfected with non targeting control siRNA and cells transfected with
NMI-targeting siRNA. The calculated nuclear contour ratio was then compared
in cells after they were subjected to the low serum assay for 15 minutes. Next
the comparison of the nuclear roundness before and after the low serum assay
has been performed on cells where the NMI gene has been silenced. In addi-
tion, the nuclear shape comparison before and after the low serum assay has
been repeated in siRNA negative control cells (cells that have been transfected
with the same reagent used for the knockdown of the NMI but with no siRNA
sequences/oligonucleotides).
Comparison of the nuclear shape of NMI(+) and NMI(−) at 0 minute
Using the blue channel (DAPI channel) images obtained from colour split of
FISH images of NMI expressing nuclei (figure 4.9), and NMI depleted nuclei
(figure 4.10) on the Scion image analysis software, the area and the perimeter
of each nuclei have been measured.

4.2. Analysis of the nuclear shape 77
Figure 4.9: HDFs, NMI(+) nuclei at 0 minute.displays the blue channel of the FISH images of nuclei expressing the NMI before
the low serum assay, were obtained by colour channels spliting using the Corel
software. the blue channel corresponds to the DAPI staining (nuclei).
Figure 4.10: HDFs, NMI(−) nuclei at 0 minute.displays the blue channel of the FISH images NMI depleted nuclei before the low
serum assay, were obtained by colour channels spliting using the Corel software. the
blue channel corresponds to the DAPI staining (nuclei).

4.2. Analysis of the nuclear shape 78
First data set
Using area and perimeter measurements of cells at 0 minute (before the low
serum assay) of the control cells, and similar measurements of cells at 0 minute
of nuclear myosin I supressed cells, the contour ratio for each set of cells was
calculated and compared, the results were respectively (=0.38) and (=0.32) .
The t-test has confirmed that this difference between the nuclear contour at 0
minute before and after siRNA knockdown of the NMI, is statistically significant
(P= 1.49×10⁻⁷) as shown in table 4.10. In other words, nuclear shape of cells
at 0 minute is significantly different from the nuclei shape of similar cells after
that the NMI gene have been silenced with nuclei getting more lobulated after
the siRNA.
t-Test: Two-Sample Assuming Unequal VariancesContour ratio of
NMI(+) nuclei
at 0 min
Contour ratio of
NMI(−) nuclei
at 0 min
Mean 0.380799 0.325588Variance 0.002185 0.002562Observations 50 50Hypothesized Mean Difference 0df 97t Stat 5.666532P(T<=t) one-tail 7.47E-08t Critical one-tail 1.660715P(T<=t) two-tail 1.49E-07t Critical two-tail 1.984723
Table 4.10: Significance test for the difference in nuclear contour ratio beforeand after the silencing of the NMI
Second data set
To verify whether these changes in nuclear lobulation followed a general trend,
a second set of images have been used to repeat the same study. It was evident
this time that this second set of data showed a different trend then what was
previously described in table 4.11. The nuclear contour ratio at 0 minutes before
the siRNA knock down of the NMI was found this time to be bigger after the
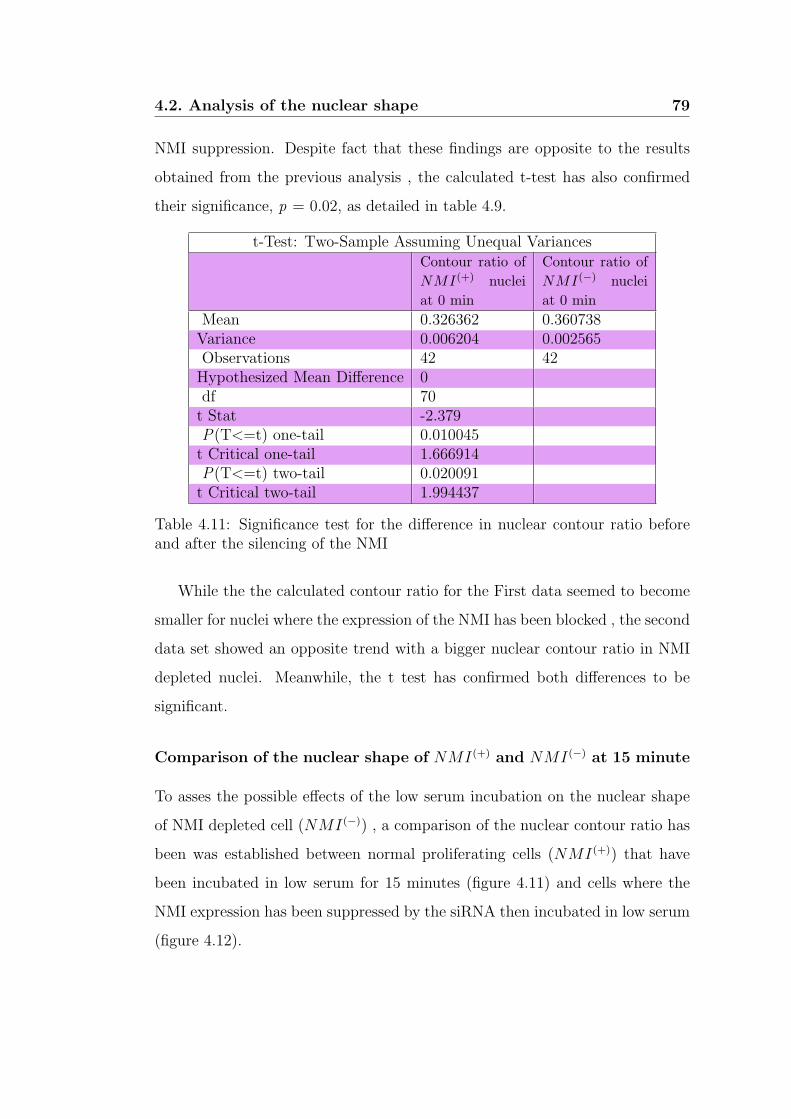
4.2. Analysis of the nuclear shape 79
NMI suppression. Despite fact that these findings are opposite to the results
obtained from the previous analysis , the calculated t-test has also confirmed
their significance, p = 0.02, as detailed in table 4.9.
t-Test: Two-Sample Assuming Unequal VariancesContour ratio of
NMI(+) nuclei
at 0 min
Contour ratio of
NMI(−) nuclei
at 0 min
Mean 0.326362 0.360738Variance 0.006204 0.002565Observations 42 42Hypothesized Mean Difference 0df 70t Stat -2.379P(T<=t) one-tail 0.010045t Critical one-tail 1.666914P(T<=t) two-tail 0.020091t Critical two-tail 1.994437
Table 4.11: Significance test for the difference in nuclear contour ratio beforeand after the silencing of the NMI
While the the calculated contour ratio for the First data seemed to become
smaller for nuclei where the expression of the NMI has been blocked , the second
data set showed an opposite trend with a bigger nuclear contour ratio in NMI
depleted nuclei. Meanwhile, the t test has confirmed both differences to be
significant.
Comparison of the nuclear shape of NMI(+) and NMI(−) at 15 minute
To asses the possible effects of the low serum incubation on the nuclear shape
of NMI depleted cell (NMI(−)) , a comparison of the nuclear contour ratio has
been was established between normal proliferating cells (NMI(+)) that have
been incubated in low serum for 15 minutes (figure 4.11) and cells where the
NMI expression has been suppressed by the siRNA then incubated in low serum
(figure 4.12).
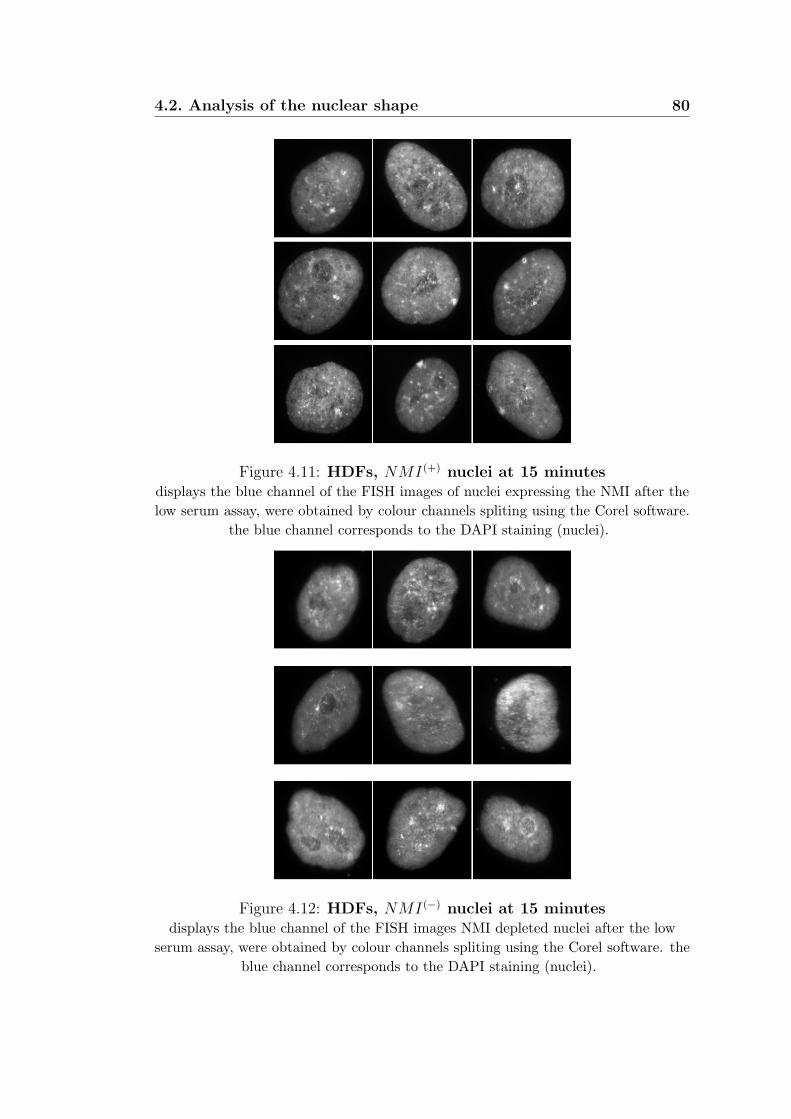
4.2. Analysis of the nuclear shape 80
Figure 4.11: HDFs, NMI(+) nuclei at 15 minutesdisplays the blue channel of the FISH images of nuclei expressing the NMI after the
low serum assay, were obtained by colour channels spliting using the Corel software.
the blue channel corresponds to the DAPI staining (nuclei).
Figure 4.12: HDFs, NMI(−) nuclei at 15 minutesdisplays the blue channel of the FISH images NMI depleted nuclei after the low
serum assay, were obtained by colour channels spliting using the Corel software. the
blue channel corresponds to the DAPI staining (nuclei).

4.2. Analysis of the nuclear shape 81
The results showed a smaller roundness ratio at 15 minutes for nuclei non
expressing the NMI suggesting that they are more lobulated than the nuclei
of cells expressing the NMI after the low serum incubation. The calculated t
test has confirmed this difference to be statistically significant with a p value =
0.015, as shown in table 4.12
t-Test: Two-Sample Assuming Unequal VariancesContour ratio of
NMI(+) nuclei
at 15 min
Contour ratio of
NMI(−) nuclei
at 15 min
Mean 0.377861 0.352056Variance 0.002179 0.003219Observations 49 49Hypothesized Mean Difference 0df 93t Stat 2.458648P(T<=t) one-tail 0.007898t Critical one-tail 1.661404P(T<=t) two-tail 0.015797t Critical two-tail 1.985802
Table 4.12: Significance test for the difference in nuclear contour ratio beforeand after the silencing of the NMI at 15 minute of the low serum assay
In order to verify whether these changes in nuclear lobulation represent a
general trend, a second set of images have been used to repeat the same study.
This second set of data showed a similar trend, with a significantly smaller
nuclear contour ratio of NMI(−) at 15 minutes compared to NMI(+) at 15
minutes. The p value = 0.05, as shown in table 4.13.

4.2. Analysis of the nuclear shape 82
t-Test: Two-Sample Assuming Unequal VariancesContour ratio of
NMI(+) nuclei
at 15 min
Contour ratio of
NMI(−) nuclei
at15 min
Mean 0.353302 0.376605Variance 0.002744 0.003369Observations 44 44Hypothesized Mean Difference 0df 85t Stat -1.97708P(T<=t) one-tail 0.025637t Critical one-tail 1.662979P(T<=t) two-tail 0.051274t Critical two-tail 1.988268
Table 4.13: Significance test for the difference in nuclear contour ratio beforeand after the silencing of the NMI at 15 minute of the low serum assay, 2
Conclusion
It has emerged from the previous analysis that there is no significant change in
the nuclear roundness ratio of nuclei after the the cells are subjected to the low
serum assay, meaning that incubating the cells in low serum assay for 15 minutes
had not affected the overall shape of the nuclei. On the other hand, the silencing
of the nuclear myosin I has resulted in a statistically significant difference of the
calculated nuclear contour ratio, between the NMI expressing cells and the NMI
depleted cells. The roundness ratio was found to significantly increase in one
of the analysed set of images, giving indication that the nuclei lacking the NMI
are significantly more lobulated compared to the cells expressing the NMI, it
has been also found to significantly decrease in the other set of images. In
addition, the comparison of the nuclear shape after the low serum assay in
cells expressing the NMI and in cells depleted of the NMI has revealed that,
subjecting the cells where the NMI expression has been suppressed to the serum
incubation, resulted in the nuclei to become more lobulated. Therefore more
comparison analysis needs to be carried out to determine whether other factors
beside the nuclear myosin I knock down determine the trend of these changes
and thus the nuclear shape.
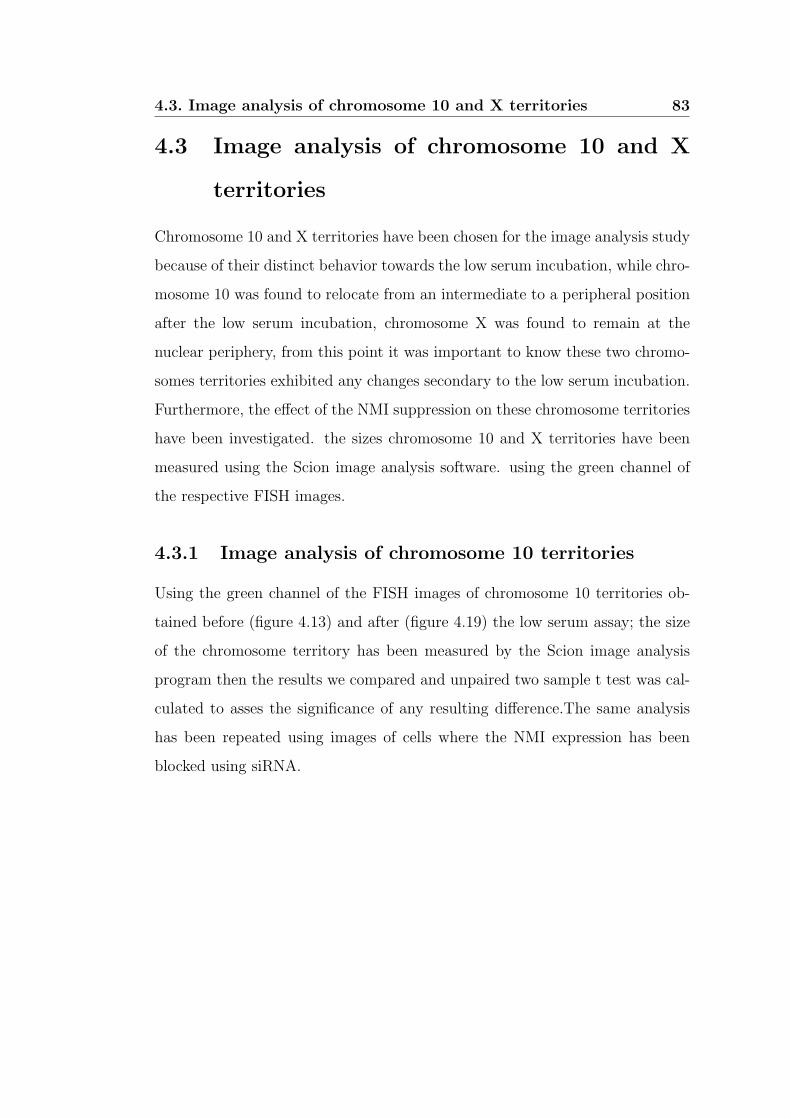
4.3. Image analysis of chromosome 10 and X territories 83
4.3 Image analysis of chromosome 10 and X
territories
Chromosome 10 and X territories have been chosen for the image analysis study
because of their distinct behavior towards the low serum incubation, while chro-
mosome 10 was found to relocate from an intermediate to a peripheral position
after the low serum incubation, chromosome X was found to remain at the
nuclear periphery, from this point it was important to know these two chromo-
somes territories exhibited any changes secondary to the low serum incubation.
Furthermore, the effect of the NMI suppression on these chromosome territories
have been investigated. the sizes chromosome 10 and X territories have been
measured using the Scion image analysis software. using the green channel of
the respective FISH images.
4.3.1 Image analysis of chromosome 10 territories
Using the green channel of the FISH images of chromosome 10 territories ob-
tained before (figure 4.13) and after (figure 4.19) the low serum assay; the size
of the chromosome territory has been measured by the Scion image analysis
program then the results we compared and unpaired two sample t test was cal-
culated to asses the significance of any resulting difference.The same analysis
has been repeated using images of cells where the NMI expression has been
blocked using siRNA.

4.3. Image analysis of chromosome 10 and X territories 84
Figure 4.13: Green channel of FISH images of chromosome 10 at 0minute.displays the green channel of the FISH images of nuclei expressing the NMI before
the low serum assay, were obtained by colour channels spliting using the Corel
software. the green channel corresponds to the Cy3 staining (CT).
Figure 4.14: Green channel of FISH images of chromosome 10 at 15minutes.displays the green channel of the FISH images of nuclei expressing the NMI after
the low serum assay, were obtained by colour channels spliting using the Corel
software. the green channel corresponds to the cy3 staining (CT).

4.3. Image analysis of chromosome 10 and X territories 85
4.3.2 Comparison of chromosome chromosome 10 terri-
tories before and after the low serum assay
The size of chromosome 10 territories measured in nuclei of HDFs before the
low serum assay ( at 0 minute) was compared to the size of chromosome 10
territories measured after the low serum assay ( at 15 minutes). It seemed
that the chromosome 10 territories were getting smaller after the low serum
incubation, as shown in figure 4.15, the t test has confirmed the statistical
significance of this difference; p = 3.19 × 10(−13).
Figure 4.15: Comparison of the size of chromosome 10 at 0 and 15minutes.1
Purple: the mean size of chromosome 10 territories before the low serumincubation, Orange: the mean size of chromosome 10 territories after the low
serum incubation

4.3. Image analysis of chromosome 10 and X territories 86
In order to verify whether, smaller chromosome 10 territories after the low
serum incubation is a general trend , a second set of images have been analysed.
Similar trend have also been registered with chromosome 10 territories becoming
smaller after the low serum incubation (figure 4.16), p = 0.39.
Figure 4.16: Comparison of the size of chromosome 10 at 0 and 15minutes.2
Purple: the mean size of chromosome 10 territories before the low serumincubation, Orange: the mean size of chromosome 10 territories after the low
serum incubation

4.3. Image analysis of chromosome 10 and X territories 87
4.3.3 Comparison of chromosome 10 territories before
and after the low serum assay of NMI depleted
cells
The assess the effect of the suppression of the NMI on chromosome territories
sizes, the low serum assay has been repeated on cells where the NMI expression
has been blocked using siRNA. Results have shown that the size of chromosome
10 territories was nearly the same before and after the low serum incubation
of NMI depleted cells (figure 4.15). the t test has confirmed that there is no
significant difference in chromosome 10 territories at 0 and 15 minutes in NMI
depleted nuclei; p = 0.47.
Figure 4.17: Comparison of the size of chromosome 10 of NMI depletednuclei before and after the low serum incubation.
Purple: the mean size of chromosome 10 territories before the low serumincubation, Orange: the mean size of chromosome 10 territories after the low
serum incubation
Conclusion
The comparison of the size of chromosome 10 territories in normal proliferating
HDFs has revealed significant changes in the territory size after the cells have
been incubated in low serum assay for 15 minutes. Chromosome 10 territories

4.3. Image analysis of chromosome 10 and X territories 88
seem to become smaller when the cells have been subjected to the low serum
assay. The same comparison have been repeated using cells where the expression
of the nuclear myosin I has been blocked by siRNA, in these cells, no significant
change in the chromosome 10 territories’ sizes has been identified. Chromosome
10 territories ahve similar sizes before and after incubating NMI depleted cells
in low serum for 15 minutes.

4.3. Image analysis of chromosome 10 and X territories 89
4.3.4 Image analysis of chromosome X territories
Using the green channel of the FISH images of chromosome X territories ob-
tained before (figure 4.18) and after (figure??) the low serum assay; the size
of the chromosome territory has been measured by the Scion image analysis
program then the results we compared and unpaired two sample t test was cal-
culated to asses the significance of any resulting difference. The same analysis
has been repeated using images of cells where the NMI expression has been
blocked using siRNA.
Figure 4.18: Green channel of FISH images of chromosome X at 0minutedisplays the green channel of the FISH images of nuclei expressing the NMI before
the low serum assay, were obtained by colour channels spliting using the Corel
software. the green channel corresponds to the cy3 staining (CT).

4.3. Image analysis of chromosome 10 and X territories 90
Figure 4.19: Green channel of FISH images of chromosome X at 15minutesdisplays the green channel of the FISH images of nuclei expressing the NMI after
the low serum assay, were obtained by colour channels spliting using the Corel
software. the green channel corresponds to the cy3 staining (CT).
4.3.5 Comparison of chromosome chromosome X terri-
tories before and after the low serum assay
The size of chromosome X territories measured in nuclei of normal proliferating
HDFs before the low serum assay (at 0 minute) was compared to the size of
chromosome X territories measured after the low serum assay (at 15 minutes).
It seemed that the chromosome X territories were bigger after the low serum
incubation, as shown in figure 4.20, the t test has confirmed the statistical
significance of this difference; p = 0.001.
4.3. Image analysis of chromosome 10 and X territories 91
Figure 4.20: Comparison of the size of chromosome X at 0 and 15minutes.
Green: the mean size of chromosome X territories before the low serumincubation, Violet: the mean size of chromosome X territories after the low
serum incubation
4.3.6 Comparison of chromosome X territories before
and after the low serum assay of NMI depleted
cells
The assess the effect of the suppression of the NMI on chromosome territories
sizes, the low serum assay has been repeated on cells where the NMI expression
has been blocked using siRNA. Results have shown that the size of chromosome
X territories seemed to be bigger before the low serum incubation of NMI de-
pleted cells (at 0 minute) compared to the size of X territory at 15 minutes, as
shown in figure 4.21. despite the apparent difference in chromosome X territo-
ries at 0 and 15 minutes of NMI depleted cells, the t test has confirmed that
this difference was statistically insignificant, p = 0.39.

4.3. Image analysis of chromosome 10 and X territories 92
Figure 4.21: Comparison of the size of chromosome X at 0 and 15minutes of NMI depleted nuclei
Green: the mean size of chromosome X territories before the low serumincubation, Violet: the mean size of chromosome X territories after the low
serum incubation
Conclusion
The image analysis of the chromosome X territories before and after the low
serum incubation has revealed significant changes in the size of these territories
before and after the low serum assay. It has emerged that chromosome X ter-
ritory becomes bigger after incubating normal proliferating cells in low serum
for 15 minutes. In NMI depleted cells, subjecting the cells to low serum incuba-
tion resulted in no significant difference in the size of chromosome X territories
before and after the low serum assay .
Chapter 5
Discussions
5.1 Role of the nuclear myosin I in chromo-
some positioning
In this study we have been able to confirm that the myosin responsible for the
rapid chromosome 10 repositioning as result to low serum incubation is the
nuclear myosin I. Low serum induced chromosome 10 repositioning from an in-
termediate position in the nucleus to the nuclear periphery has been previously
identified by our to be depending on the function of both actin myosin (Mehta
& Bridger unpublished), with several myosins identified in the nucleus (see sec-
tion 4.2 chapter 1), it was important to know which of these nuclear myosin is
actually responsible for the rapid chromosome 10 repositioning to the nuclear
periphery. In this study, using RNA interference techniques to block the expres-
sion of the NMI gene performed on similar cultures and using same procedures,
we provide evidence that this rapid chromosome 10 repositioning is dependent
on the presence of the nuclear myosin I in the nucleus. By comparing the chro-
mosome 10 positions at 0 and 15 minutes of the low serum assay in control cells
before the siRNA transfection, with the respective chromosome positions at 0
and 15 minute of the low serum incubation repeated on cells where the NMI
expression have been blocked, we have found that the relocation of chromosome
10 to the nuclear periphery after 15 minutes of the low serum incubation, pre-
93

5.2. Role of the nuclear myosin I in maintaining nuclear shape 94
viously identified in normal proliferating control cells did not manifest in NMI
depleted nuclei. In nuclei where the NMI gene has been silenced using siRNA,
chromosome 10 have been found to occupy an intermediate position both at 0
and 15 minutes of the low serum assay. The role of nuclear myosin I in chro-
matin movements have been previously reported (Chang, et al., 2006, Dundr et
al., 2007, Hu, et al., 2008) but this is the first time where a whole chromosome
territory relocation have been shown to be dependant on the presence of the
NMI in the nucleus. While these finding confirm a model where the interphase
chromatin is highly dynamic with NMI dependant active chromosome domains
repositioning.
5.2 Role of the nuclear myosin I in maintaining
nuclear shape
The image analysis of the nuclear shape before and after the siRNA silencing of
the nuclear myosin gene, has revealed significant changes in the shape of nuclei
after the low serum incubation NMI depleted nuclei compared to nuclei of cells
where the expression of the NMI has not been affected, the nuclei where the
NMI expression has been blocked were found to become more lobulated after
the cells were subjected to the low serum assay. The low serum incubation of
cells expressing the NMI did not seem to have significant effect on the shape
or the size of the nuclei. A role of NMI in maintaining the nuclear shape has
recently been suggested by Holaska and Wilson, (2007); NMI bound to emerin
can act as a sencor and a regulator of the peripheral nuclear lamina network.
In this study further evidence of the involvement of the nuclear myosin I in
maintaining the nuclear shape is provided.

5.3. Effect of the nuclear myosin I on chromosome territories size 95
5.3 Effect of the nuclear myosin I on chromo-
some territories size
The analysis of chromosome 10 and X territories has revealed significant changes
of the size of chromosome territories after the cells have been incubated in low
serum for 15 minutes. while the size of chromosome 10 territories seemed to
have shrunk after the low serum assay, the chromosome X territories seemed
to have expanded. These changes in chromosome territories’ sizes are found
to be dependent on the presence of the nuclear myosin I in the nucleus, since
no significant changes in both chromosome 10 and X territory size have been
registered when the NMI depleted cells have been subjected to the low serum
assay.
5.4. Conclusion 96
5.4 Conclusion
The newly uncovered role of the NMI in chromosome repositioning brings to
mind the case of senescent cells where a study by Mehta, et al, (2010) has shown,
absence of the low serum induced chromosome repositioning initially observed
in normal proliferating cells. It is tempting to speculate that the abolishment of
the chromosomal repositioning in this case is comparable to the one observed in
this study when the NMI depleted cells were subjected to the low serum assay.
Thus, the absence of the low serum induced chromosome repositioning in senes-
cent cell, could reflect or result from impairment in the function of the NMI.
In favour of this idea, is the striking difference in the distribution of the NMI
in senescent cells compared to normal proliferating cells, observed by indirect-
immunofluorescence (Mehta, et al ., 2010). Further studies are required to verify
this hypothesis, which could result in a breakthrough in the field of progeria re-
search where a comparable pattern has been also observed (Mehta, et al., 2010).
The study of chromosome territories has also revealed that chromosome ter-
ritories (CT) are affected differently by the low serum assay (while chromosome
10 territories seem to have shrunk in size, chromosome X territories have ex-
panded). It would be interesting to know whether these changes in CT sizes are
correlating with the transcriptional status of these chromosomes and how the
serum deprivation affects the CT sizes. Interestingly, the siRNA knockdown of
the NMI resulted in the absence of the low serum induced changes in CT sizes.
More studies are needed to investigate how the NMI is affecting the CT in serum
deprived cultures.
The results of this study have provided new insights into the importance of
the nuclear myosin I in nuclear organisation and architecture, this multi func-
tional motor has been found necessary for chromosome movements, maintaining
the nuclear shape, and affecting the chromosome territories sizes. The mecha-
nism by which the NMI is maintaining these functions and whether the NMI

5.4. Conclusion 97
has been acting directly or indirectly (in a complex or as regulator), needs to
be further investigated.

REFERECES
Barylko, B., Wagner, M.C., Reizes, O., Albanesi, J. P., 1992. Purification and characterization of a mammalian myosin I. Proceedings the National Academy of Sciences USA, 89 (2), pp. 490-494. Berg, J.S., Powell, B.C., Cheney, R.E., 2001. A millennial myosin census. Molecular Biology of the Cell, 12(4), pp. 780-794. Bernardi, R., Pandolfi, P.P., 2007. Structure, dynamics and functions of promyelocytic leukaemia nuclear bodies. Nature Reviews Molecular Cell Biology, 8, pp. 1006-1016.
Bettinger, B.T., Gilbert, D.M., Amberg, D.C., 2004. Actin up in the nucleus. Nature Review Molecular Cell Biolog, 5, pp. 410-415.
Bolzer, A., Kreth, G., Solovei, I., Koehler, D., Saracoglu, K., Fauth, C., Muller, S., Eils, R., Cremer, C., Speicher, M.R., 2005. Three-dimensional maps of all chromosomes in human male fibroblast nuclei and prometaphase rosettes. PLoS Biology, 3, pp. e157.
Bond, C.S., Fox, A.H., 2009. Paraspeckles: nuclear bodies built on long noncoding RNA. The journal of cell biology, 186(5), pp. 637-644
Cameron, R.C., Liu, C., Mixon, AS., Pihkala, J.S., Rahn, R.J., Cameron, P.L., 2007. Myosin16b: The COOH-Tail Region Directs Localization to the Nucleus and Overexpression Delays S-Phase Progression. Cell Motility and the Cytoskeleton, 64, pp. 19-48.
Cavellán, E., Asp, P., Percipalle, P., Farrants, A.K., 2006. The WSTF-SNF2h chromatin remodeling complex interacts with several nuclear proteins in transcription. Journal of Biology and Chemistry, 16; 281 (24), pp. 16264-71.
Cremer, T., Kreth, G., Koester, H., Fink, R.H., Heintzmann, R., Cremer, M., Solovei, I., Zink, D., Cremer, C., 2000. Chromosome territories, interchromatin domain compartment, and nuclear matrix: an integrated view of the functional nuclear architecture. Critical Reviews in Eukaryotic Gene Expression, 10 (2), pp. 179-212.
Cremer, T., Cremer, M., Dietzel, S., Müller, S., Solovei, I., Fakan, S., 2006. Chromosome territories – a functional nuclear landscape. Current Opinion in Cell Biology, 18(3), pp. 307-316.

Croft, J.A., Bridger, J.M., Boyle, S., Perry, P., Teague, P., Bickmore, W.A., 1999. Differences in the localization and morphology of chromosomes in the human nucleus. Journal of Cell Biology, 145(6), pp. 1119-31.
Dellaire, G., Bazett-Jones, D.P., 2004. PML nuclear bodies: dynamic sensors of DNA damage and cellular stress. Bioessays, 26, pp. 963–977.
Dundr M, Ospina JK, Sung MH, John S, Upender, M., Ried, T., Hage,r G.L., Matera, A.G., 2007. Actin-dependent intranuclear repositioning of an active gene locus in vivo. Journal of Cell Biology, 17;179(6), pp., 1095-103.
Finlan, L.E., Sproul, D., Thomson, I., Boyle, S., Kerr, E., Perry, P., Ylstra, B., Chubb, J.R., Bickmore, W.A., 2008. Recruitment to the nuclear periphery can alter expression of genes in human cells. PLoS Genetics, 4 (3), pp. e1000039.
Foster, H.A., Bridger, J.M., 2005. The genome and the nucleus: a marriage made by evolution. Genome organisation and nuclear architecture, 14 (4), pp. 212-29.
Fox, A.H., Lam, Y.W., Leung, A.K., Lyon, C.E., Andersen, J., Mann, M., Lamond, M.I., 2002. Paraspeckles: a novel nuclear domain. Current Biology, 12, pp. 13-25.
Fradelizi, J., Noireaux, V., Plastino, J., Menichi, B., Louvard, D., Sykes, C., Golsteyn, R.M, Friederich, E., 2001. ActA and human zyxin harbour Arp2/3-independent actin-polymerization activity. Nature Cell Biology. 3, pp. 699-707.
Gedge, L.J., Morrison , EE., Blair GE, Walker, JH., 2005. Nuclear actin is partially associated with Cajal bodies in human cells in culture and relocates to the nuclear periphery after infection of cells by adenovirus 5. Experimental cell research, 15,303(2), pp. 229-39.
Gilbert, N., Boyle, S., Fiegler, H., Woodfine, K., Carter, N.P., Bickmore, W.A., 2004. Chromatin Architecture of the Human Genome: Gene-Rich Domains Are Enriched in Open Chromatin Fibers. Cell, 118, pp. 555-566.
Gillespie, P.G., Cyr, J.L., 2002. Calmodulin binding to recombinant myosin-1c and myosin-1c IQ peptides. BMC Biochemistry, 26, pp. 3-31.
Gonsior, M.S., Platz, S., Buchmeier, S., Scheer, U., Jockusch, B.M., Hinssen, H., 1999. Conformational difference between nuclear and cytoplasmic actin as detected by a monoclonal antibody. Journal of Cell Science, 112, pp. 797–809.

Hofmann, W.A., Gabriela M.V., Ramchandran, R., Stojiljkovic, L., James, A.G., De Lanerolle, P., 2006. Nuclear myosin I is necessary for the formation of the first phophodiester bond during transcription initiation by RNA polymerase II. Journal of Cell Biochemistry, 1;99 (4), pp. 1001-9.
Hofmann, W.A., Johnson, T., Klapczynski, M., Fan, J.L., de Lanerolle. P., 2006. From transcription to transport: emerging roles for nuclear myosin I. Biochemistry Cell Biology, 84, pp. 418-426.
Hofmann, W.A., Stojiljkovic, L., Fuchsova, B., Vargas, G.M., Mavrommatis, E., Philimonenko, V., Kysela, K., Goodrich., J.A., Lessard, J.L., Hope, T.J., Hozak, P., De Lanerolle, P., 2004. Actin is part of pre-initiation complexes and is necessary for transcription by RNA polymerase II. Nature Cell Biology, 6(11), pp. 1094-101.
Hofmann, W.A., Thomas, A.R., De Lanerolle, P., 2009. Ancient animal ancestry for nuclear myosin. Journal of Cell Science, 1;122 (Pt 5), pp. 636-43.
Holaska, J.M., Kowalski, A.M., Wilson, K.L., 2004. Emerin caps the pointed end of actin filaments: evidence for an actin cortical network at the nuclear inner membrane. PLoS Biology, 2, pp. 1354-1362.
Holaska, J.M. and Wilson, K.L. 2007. An emerin "proteome": purification of distinct emerin-containing complexes from HeLa cells suggests molecular basis for diverse roles including gene regulation, mRNA splicing, signaling, mechanosensing, and nuclear architecture. Biochemistry. , 46(30), pp. 8897-908.
Hu, P., Wu, S., Hernandez, N., 2003. A minimal RNA polymerase III transcription system from human cells reveals positive and negative regulatory roles for CK2. Moecular Cell, 12, pp. 699-709.
Hu, P., Wu, S., Hernandez, N., 2004. A role for beta-actin in RNA polymerase III transcription. Genes and Development. 18(24), pp. 3010-5.
Hu,Q., Kwon,Y.S., Nunez, E., Cardamone, M.D., Hutt, K.R., Ohgi, K.A., Garcia-Bassets, I., Rose, D.W., Glass, C.K., Michael G. Rosenfeld, Fu, X.D., 2008. Enhancing nuclear receptor-induced transcription requires nuclear motor and LSD1-dependent gene networking in interchromatin granules. Proceeding of the National Academy of Sciences 9; 105(49), pp. 19199-19204.
Jockusch, B.M., Schoenenberger, C.A., Stetefeld, J., Aebi, U., 2006. Tracking down the different forms of nuclear actin. Trends in Cell Biology, 16, pp. 391-396.
Kahle, M., Pridalová, J., Spacek, M., Dzijak, R., Hozák, P., 2007. Nuclear myosin is ubiquitously expressed and evolutionary conserved in vertebrates. Histochemistry and cell biology, 127(2), pp. 139-48.
Khatau, SB., Hale, CM., Stewart-Hutchinson, PJ., Patel, MS., Stewart, CL., Searson, PC., Hodzic, D., Wirtz D., 2009. Perinuclear actin cap regulates nuclear shape. Proceedings of the National Academy of Sciences of the United States of America, (Electrinc publication ahead of print, www.pubmed.com)
Kiseleva, E., Drummond, S.P., Goldberg, M.W., Rutherford, S.A Allen, T, D Wilson, K. L., 2004. Actin- and protein-4.1-containing filaments link nuclear pore complexes to subnuclear organelles in Xenopus oocyte nuclei. Journal Cell Science, 117, pp. 2481–2490.
Kysela, K., Philimonenko, A.A., Philimonenko, V.V., Janacek,J., Kahle, M., Hozak, P., 2005. Nuclear distribution of actin and myosin I depends on transcriptional activity of the cell. Histochemistry of the Cell Biology, 124(5), pp. 347-58.
Laakso, J.M., Lewis, J.H., Shuman, H., Ostap, E.M., 2008. Myosin I can act as a molecular force sensor. Science, 4;321 (5885), pp. 133-6.
Lamond, A.I and Spector, D.L., 2003. Nuclear speckles: a model for nuclear organelles. Nature Reviews Molecular Cell Biology, 4, pp. 605-612
Lane, N.J., 1969. Intranuclear fibrillar bodies in actinomycin D-treated oocytes. Journal of Cell Biology, 40, pp. 286–29.
Laskey, R. A., 1987. Basic Molecular and Cell Biology: The cell nucleus. The British Medical Journal, 295.
Manuelidis, L and Borden, J., 1988. Reproducible compartmentalization of individual chromosome domains in human CNS cells revealed by in situ hybridization and three-dimensional reconstruction. Chromosoma, 96, pp. 397-410.
Manuelidis, L., 1984. Different central nervous system cell types display distinct and nonrandom arrangements of satellite DNA sequences. Proceedings of the National Academy of Sciences of the United States of America, 81, pp. 3123-3127.
Matera, A. G, 1999. Nuclear bodies: multifaceted subdomains of the interchromatin space. Trends Cell Biol. 9, pp. 302-309.
McDonald, D., Carrero, G., Andrin, C., De Vries, G., Hendzel, M. J., 2006. Nucleoplasmic beta-actin exists in a dynamic equilibrium between low-mobility polymeric species and rapidly diffusing populations. Journal of Cell Biology, 172, pp. 541-552.
Melnick, A and Licht, J. D., 1999. Deconstructing a disease: RAR , its fusion partners and their roles in the pathogenesis of acute promyelocytic leukemia. Blood, 93, pp. 3167-3215.
Misteli, T and Spector, D. L., 1998. The cellular organization of gene expression. Current Opinion in Cell Biology, 10, pp. 323-331.
Nix, D.A and Beckerle, M.C., 1997. Nuclear-cytoplasmic shuttling of the focal contact protein, zyxin: a potential mechanism for communication between sites of cell adhesion and the nucleus. Journal of Cell Biology, 138, pp. 1139-1147.
Obrdlik, A., Louvet, E., Kukalev, A., Naschekin, D., Kiseleva, E., Fahrenkrog, B., Percipalle, P., 2009. Nuclear myosin 1 is in complex with mature rRNA transcripts and associates with the nuclear pore basket. The FASEB journal (official publication of the Federation of American Societies for Experimental Biology, 24(1), pp. 146-57
Onoda, K., Yu, F.X., Yin, H.L., 1993. gCap39 is a nuclear and cytoplasmic protein. Cell Motility Cytoskeleton, 26(3), pp. 227-238.
Pederson, T and Aebi, U., 2002. Actin in the nucleus: What form and what for? Journal of Structural Biology, 140, pp. 3-9.
Pederson, T and Aebi, U., 2005. Nuclear actin extends, with no contraction in sight. Molecular Biology of the Cell, 16, pp. 5055-5060.
Pendleton, A., Pope, B., Weeds, A., Koffer, A., 2003. Latrunculin B or ATP depletion induces cofilin-dependent translocation of actin into nuclei of mast cells. Journal of Biological Chemistry, 278, pp. 14394-14400.

Pestic-Dragovich, L., Stojiljkovic, L., Philimonenko, A.A., Nowak, G., Ke, Y., Settlage, R.E., Shabanowitz, J., Hunt, D.F., Hozak, P., De Lanerolle, P., 2000. A myosin I isoform in the nucleus. Science, 290(5490), pp. 337-41.
Philimonenko, V.V., Zhao, J., Iben, S., Dingova, H., Kysela, K., Kahle, M., Zentgraf, H., Hofmann, W.A., De Lanerolle, P., Hozak, P., et al., 2004. Nuclear actin and myosin I are required for RNA polymerase I transcription. Nature Cell Biology, pp. 1165-1172.
Percipalle, P., Fomproix, N., Cavellan, E., Voit, R., Reimer, G., Kruger, T., Thyberg , J. Scheer, U., Grummt, I., Farrants, AK., 2006. The chromatin remodelling complex WSTF–SNF2h interacts with nuclear myosin 1 and has a role in RNA polymerase I transcription. EMBO report, 7(5), pp. 525-30
Pranchevicius, M.S., Baqui, M.A., Ishikawa-Ankerhold, H.C., Lourenc, E.V., Lea, M.L., Banzi, S.R., dos Santos, CT., Barreira, M.C., Esprea, E.M., Larson, R.E., 2008. Myosin Va Phosphorylated on Ser1650 IsFound in Nuclear Speckles and Redistributes to Nucleoli Upon Inhibition of Transcription. Cell Motility Cytoskeleton, 65, pp. 441-456 Rando, O.J., Zhao, K., Crabtree, G.R., 2000. Searching for a function for nuclear actin. Trends. Cell Biology, 10, pp. 92-97.
Salomoni, P and Pandolfi, P.P., 2002. The role of PML in tumor suppression. Cell, 108, pp. 165-170.
Sasseville, A.M and Langelier, Y., 1998. In vitro interaction of the carboxy-terminal domain of lamin A with actin. FEBS Letters, 425(3), pp. 485-9.
Shumaker, D.K., Kuczmarski, E.R., Goldman, R.D., 2003 The nucleoskeleton: lamins and actin are major players in essential nuclear functions. Current Opinion in Cell Biologgy. 15, pp. 358-366.
Spector, D.L., 1993. Nuclear organization of pre-mRNA processing. Current Opinion in Cell
Biology, 5, pp. 442-447.
Spector, D. L., 2001. Nuclear domains. Journal of Cell Science, 114, pp. 2891-2893.
Stuven, T., Hartmann, E., Görlich, D., 2003. Exportin 6 : A novel nuclear export receptor that is specific for profiling-actin complexes. The EMBO Journal, 22, pp. 5928–5940.

Vandekerckhove, J and Weber, K., 1978. At least six different actins are expressed in a higher mammal: An analysis based on the amino acid sequence of the amino-terminal tryptic peptide. Journal of Molecular Biology, 126(4), pp. 783-802.
Vartiainen, M.K, 2008. Nuclear actin dynamics – From form to function. FEBS Letters, 582, pp. 2033-2040.
Vecerová, J., Koberna, K., Malínsky, J., Soutoglou, E., Sullivan, T., Stewart, C.L., Raska, I., Misteli, T., 2004. Formation of Nuclear Splicing Factor Compartments Is Independent of Lamins A/C. Molecular Biology of the Cell, 15(11), pp. 4904-10.
Voeltz, G.K., Rolls, M.M., Rapoport, T.A, 2002. Structural organization of the endoplasmic reticulum. EMBO reports, 3(10), pp. 944-50.
Vreugde, S., Ferrai, C., Miluzio, A., Hauben, E., Marchisio, P.C., Crippa, M.P., Bussi, M., Biffo, S. 2006. Nuclear Myosin VI Enhances RNA Polymerase II-Dependent Transcription . Molecular cell, 23(5) 1, pp. 749-755
Webster, M., Witkin, K. L., Cohen-Fix.O., 2009. Sizing up the nucleus: nuclear shape, size and nuclear-envelope assembly. Journal of Cell Science, 122, pp. 1477-1486. Weins, A., Schwarz, K., Faul, C., Barisoni, L., Linke, W.A., Mundel, P., 2001. Differentiation and stress-dependent nuclear cytoplasmic redistribution of myopodin, a novel actin-bundling protein, Journal of Cell Biology, 155, pp. 393-404.
Wells, A.L., Lin, A.W., Chen, L.Q., Safer, D., Cain, S.M., Hasson, T., Carragher, B.O., Milligan, R.A., Sweeney, H.L., 1999. Myosin VI is an actin-based motor that moves backwards, Nature. 401. pp. 505-508.
Wu, X., Yoo, Y., Okuhama, N.N., Tucker, P.W., Liu, G., Guan, J. L., 2006. Regulation of RNA-polymerase-II-dependent transcription by N-WASP and its nuclear-binding partners. Nature Cell Biology, 8, pp. 756-763.
Yahara, I., Aizawa, H., Moriyama, K., Iida, K., Yonezawa, N., Nishida, E., Hatanaka, H., Inagaki, F., 1996. Role of cofilin/destrin in reorganization of actin cytoskeleton in response to stresses and cell stimuli, Cell Structure and Function, 21, pp. 421-424.
Yanaihara, N., Nishioka, M., Kohno, T., Otsuka, A., Okamoto, A., Ochiai, K., Tanaka, T., Yokota, J., 2004. Reduced expression of MYO18b, a candidate tumor-suppressor gene on chromosome arm 22q, in ovarian cancer. International Journal of Cancer, 112, pp. 150-154.
Ye, J., Zhao, J., Hoffmann-Rohrer, U., Grummt, I., 2008. Nuclear myosin I acts in concert with polymeric actin to drive RNA polymerase I transcription. Gene & Development journal 1; 22(3), pp. 322-30
Yu, C., Feng, W., Wei, Z., Miyanoiri, Y., Wen, W., Zhao, Y., Zhang, M., 2009. Myosin VI undergoes cargo-mediated dimerization. Cell. 138(3), pp. 537-48.
Zhen, Y.Y., Libotte, T., Munck, M., Noegel, A.A., Korenbaum, E., 2002. NUANCE, a giant protein connecting the nucleus and actin cytoskeleton. Journal of Cell Science, 115, pp. 3207-3222.
Zhu, X.J., Huang, B.Q., Wang, X.Z., Hao, S., Zeng, X.L., 2006. Actin and nuclear myosin I are associated with RNAP II and function in gene transcription. Chinese Science Bulletin, 52(6), pp. 766-770.
Zirbel, R.M., Mathieu, U.R., Kurz, A., Cremer, T., Lichter, P., 1993. Evidence for a nuclear compartment of transcription and splicing located at chromosome domain boundaries. Chromosome Research, Journal of Cell Science, 1(2), pp. 93-106.
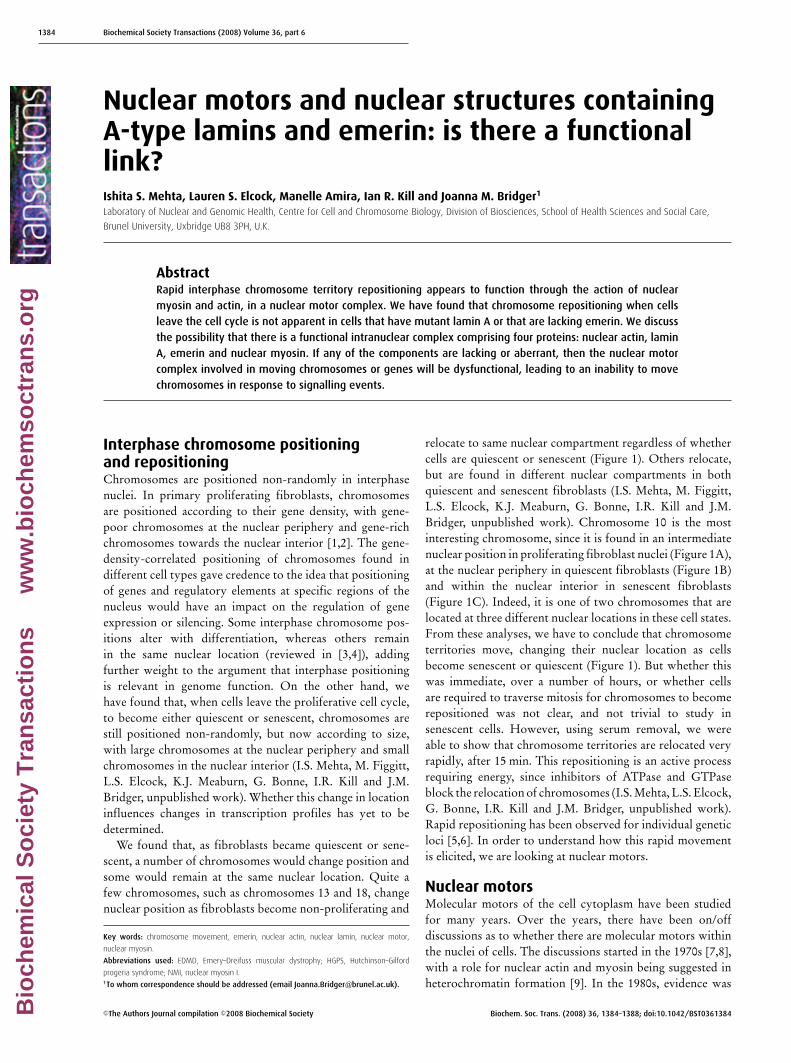
1384 Biochemical Society Transactions (2008) Volume 36, part 6
Nuclear motors and nuclear structures containingA-type lamins and emerin: is there a functionallink?Ishita S. Mehta, Lauren S. Elcock, Manelle Amira, Ian R. Kill and Joanna M. Bridger1
Laboratory of Nuclear and Genomic Health, Centre for Cell and Chromosome Biology, Division of Biosciences, School of Health Sciences and Social Care,
Brunel University, Uxbridge UB8 3PH, U.K.
AbstractRapid interphase chromosome territory repositioning appears to function through the action of nuclearmyosin and actin, in a nuclear motor complex. We have found that chromosome repositioning when cellsleave the cell cycle is not apparent in cells that have mutant lamin A or that are lacking emerin. We discussthe possibility that there is a functional intranuclear complex comprising four proteins: nuclear actin, laminA, emerin and nuclear myosin. If any of the components are lacking or aberrant, then the nuclear motorcomplex involved in moving chromosomes or genes will be dysfunctional, leading to an inability to movechromosomes in response to signalling events.
Interphase chromosome positioningand repositioningChromosomes are positioned non-randomly in interphasenuclei. In primary proliferating fibroblasts, chromosomesare positioned according to their gene density, with gene-poor chromosomes at the nuclear periphery and gene-richchromosomes towards the nuclear interior [1,2]. The gene-density-correlated positioning of chromosomes found indifferent cell types gave credence to the idea that positioningof genes and regulatory elements at specific regions of thenucleus would have an impact on the regulation of geneexpression or silencing. Some interphase chromosome pos-itions alter with differentiation, whereas others remainin the same nuclear location (reviewed in [3,4]), addingfurther weight to the argument that interphase positioningis relevant in genome function. On the other hand, wehave found that, when cells leave the proliferative cell cycle,to become either quiescent or senescent, chromosomes arestill positioned non-randomly, but now according to size,with large chromosomes at the nuclear periphery and smallchromosomes in the nuclear interior (I.S. Mehta, M. Figgitt,L.S. Elcock, K.J. Meaburn, G. Bonne, I.R. Kill and J.M.Bridger, unpublished work). Whether this change in locationinfluences changes in transcription profiles has yet to bedetermined.
We found that, as fibroblasts became quiescent or sene-scent, a number of chromosomes would change position andsome would remain at the same nuclear location. Quite afew chromosomes, such as chromosomes 13 and 18, changenuclear position as fibroblasts become non-proliferating and
Key words: chromosome movement, emerin, nuclear actin, nuclear lamin, nuclear motor,
nuclear myosin.
Abbreviations used: EDMD, Emery–Dreifuss muscular dystrophy; HGPS, Hutchinson–Gilford
progeria syndrome; NMI, nuclear myosin I.1To whom correspondence should be addressed (email [email protected]).
relocate to same nuclear compartment regardless of whethercells are quiescent or senescent (Figure 1). Others relocate,but are found in different nuclear compartments in bothquiescent and senescent fibroblasts (I.S. Mehta, M. Figgitt,L.S. Elcock, K.J. Meaburn, G. Bonne, I.R. Kill and J.M.Bridger, unpublished work). Chromosome 10 is the mostinteresting chromosome, since it is found in an intermediatenuclear position in proliferating fibroblast nuclei (Figure 1A),at the nuclear periphery in quiescent fibroblasts (Figure 1B)and within the nuclear interior in senescent fibroblasts(Figure 1C). Indeed, it is one of two chromosomes that arelocated at three different nuclear locations in these cell states.From these analyses, we have to conclude that chromosometerritories move, changing their nuclear location as cellsbecome senescent or quiescent (Figure 1). But whether thiswas immediate, over a number of hours, or whether cellsare required to traverse mitosis for chromosomes to becomerepositioned was not clear, and not trivial to study insenescent cells. However, using serum removal, we wereable to show that chromosome territories are relocated veryrapidly, after 15 min. This repositioning is an active processrequiring energy, since inhibitors of ATPase and GTPaseblock the relocation of chromosomes (I.S. Mehta, L.S. Elcock,G. Bonne, I.R. Kill and J.M. Bridger, unpublished work).Rapid repositioning has been observed for individual geneticloci [5,6]. In order to understand how this rapid movementis elicited, we are looking at nuclear motors.
Nuclear motorsMolecular motors of the cell cytoplasm have been studiedfor many years. Over the years, there have been on/offdiscussions as to whether there are molecular motors withinthe nuclei of cells. The discussions started in the 1970s [7,8],with a role for nuclear actin and myosin being suggested inheterochromatin formation [9]. In the 1980s, evidence was
C©The Authors Journal compilation C©2008 Biochemical Society Biochem. Soc. Trans. (2008) 36, 1384–1388; doi:10.1042/BST0361384Bio
chem
ical
So
ciet
y T
ran
sact
ion
s
ww
w.b
ioch
emso
ctra
ns.
org

Nuclear Envelope Diseases and Chromatin Organization 1385
Figure 1 Chromosomes occupy differential locations in normal proliferating, quiescent and senescent primary fibroblasts
(A) In a young proliferating fibroblast nucleus, chromosome 10 occupies an intermediate location, whereas chromosomes
13, 18 and X localize at the nuclear periphery. (B) In a young quiescent fibroblast nucleus, this position of chromosomes is
altered and chromosome 10 localizes at the nuclear periphery, whereas territories for chromosomes 13 and 18 are positioned
in the nuclear interior. Chromosome X remains at the nuclear periphery. (C) In senescent cells, whereas chromosomes 13
and 18 are still localized in the nuclear interior, chromosome 10 is also observed to be positioned in the nuclear interior.
Chromosome X remains at the nuclear periphery.
provided that nuclear actin and myosin were involved innucleocytoplasmic transport [10], and, in the 1990s, moreultrastructural studies were performed, localizing actin andmyosin in the nucleus [11,12]. Within the last 10 years,scientists have uncovered several isoforms of myosin that arefound in nuclei, including NMI (nuclear myosin I) (reviewedin [13]), myosin VI [14], myosin 16b [15] and myosin Va[16]. In the 1970s, actin was also shown to be a nuclearprotein [17,18]. However, it is still an unresolved questionas to whether this actin in the nucleus is a polymerized or anunpolymerized form [19].
Using microinjection of antibodies, actin [20,21], and actinand myosin together [22], were shown to be involved inRNA polymerase II transcription, which has been confirmedfurther using drugs and mutant cell lines not only for nuclearactin and NMI [13,23], but also for myosin VI [14]. Theseacto–myosin motors also appear to be involved in RNApolymerase I transcription [23–25].
Both nuclear actin and NMI have also been foundto associate with chromatin-remodelling complexes. Actinbinds to SWI/SWF-like BAF (barrier to autointegrationfactor) remodelling complexes, whereas NMI associateswith components of the WICH (WSTF–SNF2h complex)chromatin-remodelling complex [13].
However, the involvement of nuclear motors in transcrip-tion and chromatin remodelling appears not to be their onlynuclear function. There is an increasing body of evidencethat they are also involved in movement of chromatin aroundnuclei [5,26].
We have found that the rapid relocation of chromosomesin interphase is blocked by drugs preventing polymerizationof actin and myosin (I.S. Mehta, L.S. Elcock, G. Bonne, I.R.Kill and J.M. Bridger, unpublished work).
It is interesting to note that Hozak and colleagues foundthat both nuclear actin and NMI are distributed quitedifferently in resting non-stimulated lymphocytes comparedwith PHA (phytohaemagglutinin)-stimulated lymphocytes[27] and Riddle et al. [28] demonstrated that nuclear actinwas decreased in quiescent fibroblasts. We have stainedproliferating and senescent fibroblasts with a commercialanti-NMI antibody and have seen quite different distribu-tions of NMI in senescent cells compared with proliferatingfibroblasts; it could be described as disorganized (I.S. Mehta,L.S. Elcock, M. Amira, I.R. Kill and J.M. Bridger, unpublishedwork).
From our studies, we know that, when quiescent cellsare re-stimulated with serum, chromosomes do not relocateto a proliferating gene-density distribution until after cellshave traversed mitosis with a breakdown and rebuildingof the nucleus [29]. Thus we suggest that not only doquiescent cells have a compromised nuclear motor for movingchromatin, but also the same is true for senescent cells,since we have not visualized any chromosome repositioningin senescent cells after removal of serum. This mayindicate that nuclear motors containing actin and myosindo not function in the same manner in non-proliferatingcells with respect to dynamic chromatin/chromosomemovement.
C©The Authors Journal compilation C©2008 Biochemical Society

1386 Biochemical Society Transactions (2008) Volume 36, part 6
A-type lamins and emerinThe nuclear lamina is described as a meshwork [30] or auniparallel array [31] of interconnecting filaments underlyingthe inner nuclear envelope. This structure, together with thenuclear envelope and nuclear envelope proteins, is importantfor organizing the structure of the entire nucleus and thechromatin within it [32].
In most vertebrate cells, two major types of nuclear laminare found: A and B. A-type lamins are encoded by LMNAwhich undergoes alternative splicing to form lamins A, deltaA, C and C2, whereas B-type lamins are encoded by twoseparate genes LMNB1 and LMNB2 to form lamins B1, B2and B3 (reviewed in [33]).
A-type lamin proteins not only are located at the nuclearperiphery, but also are probably part of the nuclear matrix[34,35]. Further lamin proteins have been observed withinthe nuclear interior [36,37] with sites of replication [38],transcription factories [39] and splicing speckles [40]. NuclearA-type lamins seem to be involved in many nuclear functionssuch as nuclear structural integrity, DNA replication,transcription, splicing, cell signalling, DNA repair, cellularproliferation, transit of mitosis, organization and stabilityof the genome, differentiation, normal aging, apoptosis andepigenetic control of chromatin (reviewed in [41]).
A-type lamins have a number of binding partners, and thismight well explain their multifaceted roles and importancewithin the nucleus, but this also adds another level ofcomplexity in assigning roles to particular complexesof proteins containing A-type lamins. One of the bindingpartners of nuclear A-type lamins is emerin (reviewed in[32]). The lamin–emerin interaction has been implicatedto be important in maintaining the structural integrity ofthe nucleus, in correct localization of the complex and inefficient progression of the cell through the cell cycle [42].The importance of this complex is emphasized by bothproteins causing similar diseases when the respective genesare mutated, i.e. EDMD (Emery–Dreifuss muscular dys-trophy). HGPS (Hutchinson–Gilford progeria syndrome) isa premature aging syndrome caused by a base substitution inthe LMNA gene encoding a G608G mutation [43] resultingin the formation of a truncated lamin A protein termedprogerin, which acts in a dominant-negative way [44]. Studieson patients suffering from HGPS have revealed that laminsare important in the maintenance of nuclear structure andshape as well as in heterochromatin formation, chromatinmodification and gene expression [45]. Studies using emerin-null cells derived from patients suffering from X-linkedEDMD have revealed that emerin may also influence geneexpression, heterochromatin organization and be involved inmaintaining the structural integrity of the nuclear envelope(reviewed in [32]).
A-type lamins and emerin: are theyintegral to the function of a nuclear motor?If lamins A and C and emerin are involved in the function of anuclear motor comprising nuclear actin and nuclear myosins,then there should be evidence that they bind one another in
Figure 2 Model showing the interactions between the nuclear
actin–myosin and the nuclear lamin–emerin complexes for
efficient functioning of the nuclear motor
Nuclear lamins are known to bind to nuclear actin and nuclear eme-
rin. Nuclear emerin binds nuclear actin, nuclear myosin and nuclear
actin. Nuclear myosins are known to bind to DNA, whereas nu-
clear actin, emerin and lamins are known to interact with the nuclear
matrix. Thus chromosome territories are bound by nuclear myosins
which binds emerin which bind both nuclear actin and lamins. Thus
this four-protein complex, with the support of the nuclear matrix, may
function to move the chromosome territories within the nuclear space.
such a way as to form a complex. Indeed, in vitro studieshave demonstrated the binding of actin to the C-terminusof lamin A [46]. In addition, the tail region of lamin A hasan additional site with affinity for actin [47]. Emerin bindsto both actin [F- (filamentous) and G- (globular) actin] andNMI, revealed by proteomic studies [32]. Thus we know thatemerin binds lamin A that can bind to actin, which can bindto both emerin and NMI which can bind emerin. This makesan interesting hypothetical complex (Figure 2) and, althoughit has been discussed as being present at the nuclear envelope[48], could it also be present and functional throughout thenucleus?
If this complex exists, does it function to move chro-matin/chromosomes around the nucleus? We have started toaddress this question by performing chromosome positioningassays [two- and three-dimensional FISH (fluorescence in situhybridization)] in proliferating fibroblasts of patients thathave mutations in either LMNA or EMD genes (Figure 3Band 3D) [49] and comparing chromosome positioning whenthese cells have become senescent. Intriguingly, in HGPS cellsthat have become senescent, the chromosomes do not altertheir nuclear location as they would do in normal control cells(Figure 3C). This implies that the nuclear motor function,which would have been involved in chromosome movementduring transition from a proliferating to a senescent state, isnot functional. Indeed, anti-NMI antibody staining reveals
C©The Authors Journal compilation C©2008 Biochemical Society

Nuclear Envelope Diseases and Chromatin Organization 1387
Figure 3 Chromosome 10 localizes at the nuclear periphery in proliferating HGPS and EDMD fibroblasts, and the position of chromosome
10 does not change once the cell is senescent
In senescent cells that are quiescent, the territories of chromosome 10 are in the nuclear interior (A). In primary proliferating
fibroblasts derived from patients suffering from HGPS or EDMD, chromosome 10 territories are at the nuclear periphery
(B and D respectively), and this localization of chromosome 10 does not change when these HGPS cells become
senescent (C).
the same disorganized distribution of NMI as in senescentcells (I.S. Mehta, L.S. Elcock, M. Amira, I.R. Kill and J.M.Bridger, unpublished work).
If emerin is functionally involved in this complex, thenchromosomes would also not be relocated in EDMD cellsthat became senescent. Unfortunately, we have only looked atchromosomes 13 and 18 (Figure 3D) so far, and they are foundin the nuclear interior in both proliferating and senescentEDMD cells [49].
Thus, for efficient movement of whole chromosometerritories, the formation and functionality of this proteincomplex including nuclear actin, myosin, lamin and emerin(Figure 2) may be vital. It has also been shown that, in normalsenescent cells, there is an accumulation of the mutant form oflamin A [50,51]. This may well explain why, in senescent cells,chromosome 10 is not repositioned when senescent cells areplaced in low serum (Figure 3A), indicating that the nuclearmotor controlling chromosome movement in senescent cellsis dysfunctional.
In order to test these hypotheses and the functionalityof nuclear motors in non-proliferating and diseased cells,we need to perform a number of experiments. These wouldinclude interfering with the complex in normal cells as wellas rebuilding it in cells where this complex is dysfunctionalor missing; these studies are on-going in our laboratory.
References1 Boyle, S., Gilchrist, S., Bridger, J.M., Mahy, N.L., Ellis, J.A. and Bickmore,
W.A. (2001) The spatial organization of human chromosomes within thenuclei of normal and emerin-mutant cells. Hum. Mol. Genet. 10,211–219
2 Croft, J.A., Bridger, J.M., Boyle, S., Perry, P., Teague, P. and Bickmore,W.A. (1999) Differences in the localization and morphology ofchromosomes in the human nucleus. J. Cell Biol. 145, 1119–1131
3 Bartova, E. and Kozubek, S. (2006) Nuclear architecture in the light ofgene expression and cell differentiation studies. Biol. Cell 98,323–336
4 Foster, H.A. and Bridger, J.M. (2005) The genome and the nucleus:a marriage made by evolution: genome organisation and nucleararchitecture. Chromosoma 114, 212–229
5 Chuang, C.H., Carpenter, A.E., Fuchsova, B., Johnson, T., de Lanerolle, P.and Belmont, A.S. (2006) Long-range directional movement of aninterphase chromosome site. Curr. Biol. 16, 825–831
6 Volpi, E.V., Chevret, E., Jones, T., Vatcheva, R., Williamson, J., Beck, S.,Campbell, R.D., Goldsworthy, M., Powis, S.H., Ragoussis, J. et al. (2000)Large-scale chromatin organization of the major histocompatibilitycomplex and other regions of human chromosome 6 and itsresponse to interferon in interphase nuclei. J. Cell Sci. 113,1565–1576
7 Clark, T.G. and Rosenbaum, J.L. (1979) An actin filament matrix inhand-isolated nuclei of X. laevis oocytes. Cell 18, 1101–1108
8 Lestourgeon, W.M., Forer, A., Yang, Y.Z., Bertram, J.S. and Pusch, H.P.(1975) Contractile proteins: major components of nuclear andchromosome non-histone proteins. Biochim. Biophys. Acta 379,529–552
9 Comings, D.E. and Okada, T.A. (1976) Nuclear proteins. III. The fibrillarnature of the nuclear matrix. Exp. Cell Res. 103, 341–360
10 Schindler, M., Jiang, L.W., Swaisgood, M. and Wade, M.H. (1989)Analysis, selection, and sorting of anchorage-dependent cells undergrowth conditions. Methods Cell Biol. 32, 423–446
11 Amankwah, K.S. and De Boni, U. (1994) Ultrastructural localization offilamentous actin within neuronal interphase nuclei in situ. Exp. Cell Res.210, 315–325
12 Milankov, K. and De Boni, U. (1993) Cytochemical localization of actinand myosin aggregates in interphase nuclei in situ. Exp. Cell Res. 209,189–199
13 Hofmann, W.A., Johnson, T., Klapczynski, M., Fan, J.L. and de Lanerolle, P.(2006) From transcription to transport: emerging roles for nuclearmyosin I. Biochem. Cell Biol. 84, 418–426
14 Vreugde, S., Ferrai, C., Miluzio, A., Hauben, E., Marchisio, P.C., Crippa,M.P., Bussi, M. and Biffo, S. (2006) Nuclear myosin VI enhances RNApolymerase II-dependent transcription. Mol. Cell 23, 749–755
C©The Authors Journal compilation C©2008 Biochemical Society

1388 Biochemical Society Transactions (2008) Volume 36, part 6
15 Cameron, R.S., Liu, C., Mixon, A.S., Pihkala, J.P., Rahn, R.J. and Cameron,P.L. (2007) Myosin 16b: the COOH-tail region directs localization to thenucleus and overexpression delays S-phase progression.Cell Motil. Cytoskeleton 64, 19–48
16 Pranchevicius, M.C., Baqui, M.M., Ishikawa-Ankerhold, H.C., Lourenco,E.V., Leao, R.M., Banzi, S.R., dos Santos, C.T., Barreira, M.C., Espreafico,E.M. and Larson, R.E. (2008) Myosin Va phosphorylated on Ser1650 isfound in nuclear speckles and redistributes to nucleoli upon inhibition oftranscription. Cell Motil. Cytoskeleton 65, 441–456
17 Bremer, J.W., Busch, H. and Yeoman, L.C. (1981) Evidence for a speciesof nuclear actin distinct from cytoplasmic and muscles actins.Biochemistry 20, 2013–2017
18 Goldstein, L., Rubin, R. and Ko, C. (1977) The presence of actin in nuclei:a critical appraisal. Cell 12, 601–608
19 Hofmann, W.A. and de Lanerolle, P. (2006) Nuclear actin: to polymerizeor not to polymerize. J. Cell Biol. 172, 495–496
20 Ankenbauer, T., Kleinschmidt, J.A., Walsh, M.J., Weiner, O.H. and Franke,W.W. (1989) Identification of a widespread nuclear actin binding protein.Nature 342, 822–825
21 Zhu, X., Zeng, X., Huang, B. and Hao, S. (2004) Actin is closely associatedwith RNA polymerase II and involved in activation of gene transcription.Biochem. Biophys. Res. Commun. 321, 623–630
22 Scheer, U., Hinssen, H., Franke, W.W. and Jockusch, B.M. (1984)Microinjection of actin-binding proteins and actin antibodiesdemonstrates involvement of nuclear actin in transcription of lampbrushchromosomes. Cell 39, 111–122
23 Percipalle, P. (2007) Genetic connections of the actin cytoskeleton andbeyond. BioEssays 29, 407–411
24 Philimonenko, V.V., Zhao, J., Iben, S., Dingova, H., Kysela, K., Kahle, M.,Zentgraf, H., Hofmann, W.A., de Lanerolle, P., Hozak, P. et al. (2004)Nuclear actin and myosin I are required for RNA polymerase Itranscription. Nat. Cell Biol. 6, 1165–1172
25 Ye, J., Zhao, J., Hoffmann-Rohrer, U. and Grummt, I. (2008) Nuclearmyosin I acts in concert with polymeric actin to drive RNA polymerase Itranscription. Genes Dev. 22, 322–330
26 Dundr, M., Ospina, J.K., Sung, M.H., John, S., Upender, M., Ried, T., Hager,G.L. and Matera, A.G. (2007) Actin-dependent intranuclear repositioningof an active gene locus in vivo. J. Cell Biol. 179, 1095–1103
27 Kysela, K., Philimonenko, A.A., Philimonenko, V.V., Janacek, J., Kahle, M.and Hozak, P. (2005) Nuclear distribution of actin and myosin I dependson transcriptional activity of the cell. Histochem. Cell Biol. 124,347–358
28 Riddle, V.G., Dubrow, R. and Pardee, A.B. (1979) Changes in thesynthesis of actin and other cell proteins after stimulation ofserum-arrested cells. Proc. Natl. Acad. Sci. U.S.A. 76, 1298–1302
29 Bridger, J.M., Boyle, S., Kill, I.R. and Bickmore, W.A. (2000) Re-modellingof nuclear architecture in quiescent and senescent human fibroblasts.Curr. Biol. 10, 149–152
30 Aebi, U., Cohn, J., Buhle, L. and Gerace, L. (1986) The nuclear lamina is ameshwork of intermediate-type filaments. Nature 323, 560–564
31 Goldberg, M.W., Huttenlauch, I., Hutchison, C.J. and Stick, R. (2008)Filaments made from A- and B-type lamins differ in structure andorganization. J. Cell Sci. 121, 215–225
32 Holaska, J.M. and Wilson, K.L. (2006) Multiple roles for emerin:implications for Emery–Dreifuss muscular dystrophy. Anat. Rec. A Discov.Mol. Cell. Evol. Biol. 288, 676–680
33 Goldman, R.D., Gruenbaum, Y., Moir, R.D., Shumaker, D.K. and Spann,T.P. (2002) Nuclear lamins: building blocks of nuclear architecture.Genes Dev. 16, 533–547
34 Barboro, P., D’Arrigo, C., Diaspro, A., Mormino, M., Alberti, I., Parodi, S.,Patrone, E. and Balbi, C. (2002) Unraveling the organization of theinternal nuclear matrix: RNA-dependent anchoring of NuMA to a laminscaffold. Exp. Cell Res. 279, 202–218
35 Hozak, P., Sasseville, A.M., Raymond, Y. and Cook, P.R. (1995) Laminproteins form an internal nucleoskeleton as well as a peripheral laminain human cells. J. Cell Sci. 108, 635–644
36 Bridger, J.M., Kill, I.R., O’Farrell, M. and Hutchison, C.J. (1993) Internallamin structures within G1 nuclei of human dermal fibroblasts. J. Cell Sci.104, 297–306
37 Goldman, A.E., Moir, R.D., Montag-Lowy, M., Stewart, M. and Goldman,R.D. (1992) Pathway of incorporation of microinjected lamin A into thenuclear envelope. J. Cell Biol. 119, 725–735
38 Kennedy, B.K., Barbie, D.A., Classon, M., Dyson, N. and Harlow, E. (2000)Nuclear organization of DNA replication in primary mammalian cells.Genes Dev. 14, 2855–2868
39 Moir, R.D., Montag-Lowy, M. and Goldman, R.D. (1994) Dynamicproperties of nuclear lamins: lamin B is associated with sites of DNAreplication. J. Cell Biol. 125, 1201–1212
40 Jagatheesan, G., Thanumalayan, S., Muralikrishna, B., Rangaraj, N.,Karande, A.A. and Parnaik, V.K. (1999) Colocalization of intranuclearlamin foci with RNA splicing factors. J. Cell Sci. 112, 4651–4661
41 Vlcek, S. and Foisner, R. (2007) Lamins and lamin-associated proteins inaging and disease. Curr. Opin. Cell Biol. 19, 298–304
42 Fairley, E.A., Riddell, A., Ellis, J.A. and Kendrick-Jones, J. (2002) The cellcycle dependent mislocalisation of emerin may contribute to theEmery–Dreifuss muscular dystrophy phenotype. J. Cell Sci. 115, 341–354
43 Eriksson, M., Brown, W.T., Gordon, L.B., Glynn, M.W., Singer, J., Scott, L.,Erdos, M.R., Robbins, C.M., Moses, T.Y., Berglund, P. et al. (2003)Recurrent de novo point mutations in lamin A cause Hutchinson–Gilfordprogeria syndrome. Nature 423, 293–298
44 De Sandre-Giovannoli, A., Bernard, R., Cau, P., Navarro, C., Amiel, J.,Boccaccio, I., Lyonnet, S., Stewart, C.L., Munnich, A. Le Merrer, M. andLevy, N. (2003) Lamin A truncation in Hutchinson–Gilford progeria.Science 300, 2055
45 Verstraeten, V.L., Broers, J.L., Ramaekers, F.C. and van Steensel, M.A.(2007) The nuclear envelope, a key structure in cellular integrity andgene expression. Curr. Med. Chem. 14, 1231–1248
46 Sasseville, A.M. and Langelier, Y. (1998) In vitro interaction of thecarboxy-terminal domain of lamin A with actin. FEBS Lett. 425,485–489
47 Zastrow, M.S., Vlcek, S. and Wilson, K.L. (2004) Proteins that bind A-typelamins: integrating isolated clues. J. Cell Sci. 117, 979–987
48 Lattanzi, G., Cenni, V., Marmiroli, S., Capanni, C., Mattioli, E., Merlini, L.,Squarzoni, S. and Maraldi, N.M. (2003) Association of emerin withnuclear and cytoplasmic actin is regulated in differentiating myoblasts.Biochem. Biophys. Res. Commun. 303, 764–770
49 Meaburn, K.J., Cabuy, E., Bonne, G., Levy, N., Morris, G.E., Novelli, G., Kill,I.R. and Bridger, J.M. (2007) Primary laminopathy fibroblasts displayaltered genome organization and apoptosis. Aging Cell 6, 139–153
50 McClintock, D., Ratner, D., Lokuge, M., Owens, D.M., Gordon, L.B., Collins,F.S. and Djabali, K. (2007) The mutant form of lamin A that causesHutchinson–Gilford progeria is a biomarker of cellular aging in humanskin. PLoS ONE 2, e1269
51 Scaffidi, P. and Misteli, T. (2006) Lamin A-dependent nuclear defects inhuman aging. Science 312, 1059–1063
Received 8 July 2008doi:10.1042/BST0361384
C©The Authors Journal compilation C©2008 Biochemical Society

Mehta et al. Genome Biology 2010, 11:R5http://genomebiology.com/2010/11/1/R5
Open AccessR E S E A R C H
ResearchRapid chromosome territory relocation by nuclear motor activity in response to serum removal in primary human fibroblastsIshita S Mehta1, Manelle Amira1,2, Amanda J Harvey2 and Joanna M Bridger*1
Chromosome positioning dynamicsNuclear myosin 1β-dependent repositioning of chromosome territories occurs within 15 min-utes of serum starvation in human cells.AbstractBackground: Radial chromosome positioning in interphase nuclei is nonrandom and can alter according to developmental, differentiation, proliferation, or disease status. However, it is not yet clear when and how chromosome repositioning is elicited.
Results: By investigating the positioning of all human chromosomes in primary fibroblasts that have left the proliferative cell cycle, we have demonstrated that in cells made quiescent by reversible growth arrest, chromosome positioning is altered considerably. We found that with the removal of serum from the culture medium, chromosome repositioning took less than 15 minutes, required energy and was inhibited by drugs affecting the polymerization of myosin and actin. We also observed that when cells became quiescent, the nuclear distribution of nuclear myosin 1β was dramatically different from that in proliferating cells. If we suppressed the expression of nuclear myosin 1β by using RNA-interference procedures, the movement of chromosomes after 15 minutes in low serum was inhibited. When high serum was restored to the serum-starved cultures, chromosome repositioning was evident only after 24 to 36 hours, and this coincided with a return to a proliferating distribution of nuclear myosin 1β.
Conclusions: These findings demonstrate that genome organization in interphase nuclei is altered considerably when cells leave the proliferative cell cycle and that repositioning of chromosomes relies on efficient functioning of an active nuclear motor complex that contains nuclear myosin 1β.
BackgroundWithin interphase nuclei, individual chromosomes areorganized within their own nuclear space, known aschromosome territories [1,2]. These interphase chromo-some territories are organized in a nonrandom manner inthe nuclei of human cells and cells from other species [3].Chromosomes in different species are positioned radially,according to either their gene density [4-9] or their size[10-12] or both [11,13-16]. The nuclear microenviron-ment within which a chromosome is located could affectits gene regulation, and it has been proposed that wholechromosomes or regions of chromosomes are shiftedaround the nucleus to control gene expression [17,18].Active genes appear to come together in a commonnuclear space, possibly to be co-transcribed [19-21]. This
fits with the increasing number of observations made ofchromosome loops, containing active areas of thegenome, coming away from the main body of the chro-mosome territory, such as regions containing FLNA onthe X chromosome [22]; major histocompatibility com-plex (MHC) genes [23], specific genes on chromosome 11[24]; β- globin-like genes [25], epidermal differentiationcomplex genes [26], specific genes within the Hox B clus-ter [27,28], and genes inducing porcine stem cell differen-tiation into adipocytes [29]. Chromatin looping isapparently associated with gene expression, because inhi-bition of RNA polymerase II transcription affects the out-ward movement of these chromosome loops [30].
Repositioning of whole chromosome territories hasbeen observed in erythroid differentiation [25], adipo-genesis [31], T-cell differentiation [32], porcine sper-matogenesis [33], and after hormonal stimulus [34]. Evenmore studies revealed genomic loci being repositionedduring differentiation (see [35], for comprehensive
* Correspondence: [email protected] Centre for Cell and Chromosome Biology, Division of Biosciences, School of Health Sciences and Social Care, Brunel University, Kingston Lane, Uxbridge,
UB8 3PH, UK
© 2010 Mehta et al., licensee BioMed Central Ltd. This is an open access article distributed under the terms of the Creative CommonsAttribution License (http://http:/creativecommons.org/licenses/by/2.0), which permits unrestricted use, distribution, and reproductionin any medium, provided the original work is properly cited.

Mehta et al. Genome Biology 2010, 11:R5http://genomebiology.com/2010/11/1/R5
Page 2 of 17
review). We demonstrated previously that interphasechromosomes occupy alternative nuclear positions whenproliferating cells become quiescent or senescent [5,7,9].For example, chromosomes 13 and 18 move from aperipheral nuclear location to an internal nuclear loca-tion in serum-starved or senescent fibroblast cells [5,9].From these early studies, it was not clear how other chro-mosomes behaved after induction of growth arrest, andso we have now positioned all human chromosomes incells made quiescent by serum starvation. We found thatjust less than half of the chromosomes alter their nuclearlocation. The ability to control, temporally, the entry ofcells to quiescence through serum starvation allows thedetermination of a response time of nuclear architectureto the change in environment. In this study, we demon-strate that chromosome repositioning in interphasenuclei occurs within 15 minutes.
The presence of actin [36] and myosin [37-41] havebeen reported in nuclei, and an increasing body of evi-dence suggests that they cooperate to form a nuclearmyosin-actin motor [42]. Actin and myosin have beenshown to be involved in the intranuclear movement ofchromosomal regions [43,44] and whole chromosomes[34]. Further, nuclear actin and myosin are involved inRNA polymerase I transcription [37,40], RNA poly-merase II transcription [37-41], and RNA polymerase IIItranscription [45]. In a model put forward by Hoffmanand colleagues [42], myosin I could bind through its tailto the nuclear entity that requires movement, with actinbinding to the globular head of the nuclear myosin I mol-ecule. This nuclear motor would then translocate thenuclear entity along highly dynamic tracks of nuclearactin [42]. In this study, we demonstrated that the rapidmovement of chromosome territories in response toserum deprivation is dependent on the function of bothactin and myosin, probably nuclear myosin 1β.
ResultsInterphase chromosome positioning in proliferating and nonproliferating cellsTo determine the nuclear location of specific chromo-somes, human dermal fibroblasts (HDFs) were harvestedand fixed for standard 2D-fluorescence in situ hybridiza-tion (FISH). Representative images of chromosome terri-tories in proliferating cells are displayed in Figure 1a-d.Digital images were subjected to erosion analysis [4-6,8,9], whereby the images of 4',6-diamidino-2-phenylin-dole (DAPI)-stained flattened nuclei are divided into fiveconcentric shells of equal area, and the intensity of theDAPI signal and probe signal is measured in each shell.The chromosome signal is then normalized by dividing itby the percentage of DAPI signal. The data for each chro-mosome are then plotted as a histogram with error bars,with the x-axis displaying the nuclear shells from 1 to 5,
representing the nuclear periphery to the nuclear interior,respectively (Figure 1e-h).
In young proliferating fibroblasts, interphase chromo-somes are positioned nonrandomly in a radial patternwithin nuclei [3]. In our 2D studies, we consistently foundgene-poor chromosomes, such as chromosomes X, 13,and 18, located at the nuclear periphery [5,9], which fitswith their having more lamina-associated domains thangene-poor chromosomes (see [46]). In this study, werecapitulated the interphase chromosome positioningwith our present cultures and demonstrated that thesechromosomes are located at the nuclear periphery inyoung proliferating cells (Figure 1b-d, f-h). Proliferatingcells within the primary cultures were identified by usingthe proliferative marker, anti-pKi-67, which is distributedin a number of different patterns within proliferatinghuman fibroblasts [47]. Its distribution is mainly nucleo-lar and is shown in red (Figure 1a-d). Figure 1a and edemonstrate the nuclear location of chromosome 10,unlike chromosomes 13, 18, and X it is found in an inter-mediate position in proliferating fibroblasts. The relativeinterphase positions of chromosomes 10 and X have beenconfirmed in 3D-FISH analyses (Figure 1i-k), wherebyHDFs were fixed to preserve their three-dimensionalitywith 4% paraformaldehyde and subjected to 3D-FISH[48]. Measurements in micrometers from the geometriccenter the chromosome territories to the nearest nuclearperiphery, as determined by the DAPI staining, weretaken in at least 20 nuclei. The data were not normalizedfor size measurements, so that actual measurements inmicrometers can be seen. However, all data were normal-ized by a size measurement, and this not does alter therelative positioning of the chromosomes.
We have evidence from prior studies that chromo-somes such as chromosomes 13 [9] and 18 [5,9] alter theirnuclear position when primary fibroblasts exit the prolif-erative cell cycle and that chromosome X remains at thenuclear periphery [9]. However, this is only two chromo-somes of 24, and so to determine which other chromo-somes reposition after cell-cycle exit into quiescence(G0), elicited through serum removal, we positioned allhuman chromosomes in G0 cells (Figures 2 and 3).
To make cells quiescent, young, HDFs were grown in10% NCS for 48 hours, and then the cells were washedtwice with serum-free medium and placed in 0.5% NCSmedium for 168 hours (7 days). However, when the posi-tioning analysis was performed on the quiescent nuclei,we found that certain chromosomes were in very differ-ent positions from those in which they were found in pro-liferating nuclei, that is, chromosomes 1, 6, 8, 10, 11, 12,13, 15, 18, and 20 (Table 1).
The data demonstrated in Figure 3 and Table 1 revealthat a number of chromosomes alter their nuclear posi-tions when cells become quiescent; as shown before, both
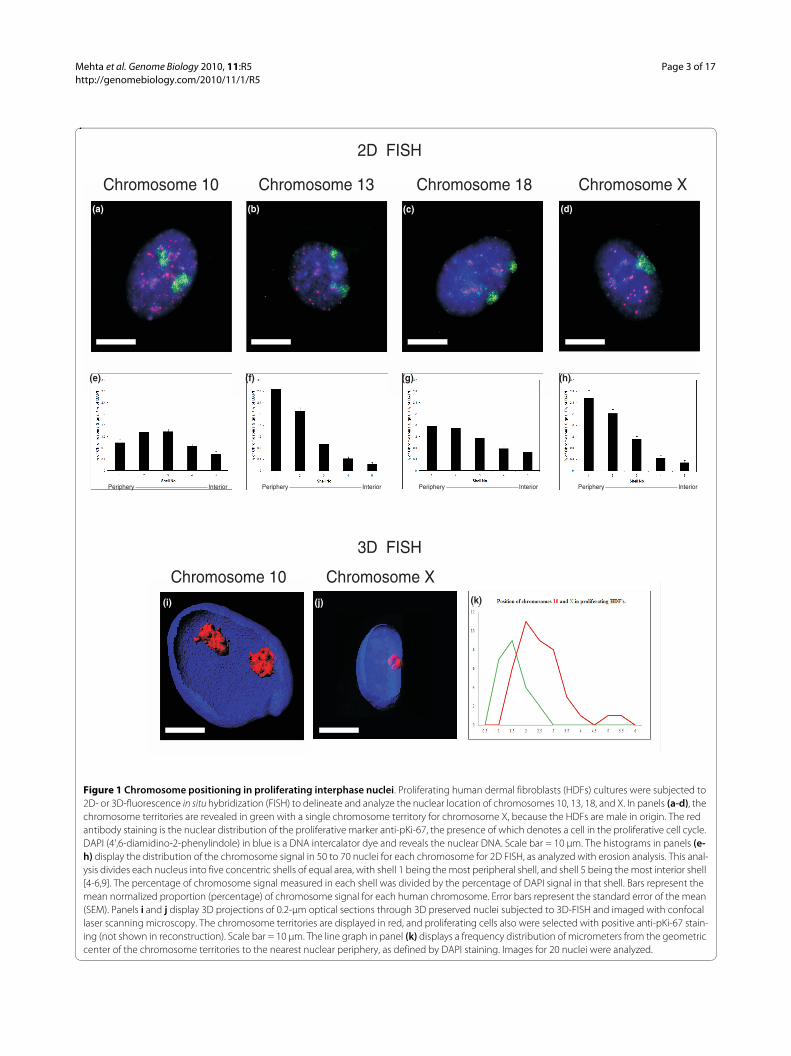
Mehta et al. Genome Biology 2010, 11:R5http://genomebiology.com/2010/11/1/R5
Page 3 of 17
Chromosome positioning in proliferating interphase nucleiFigure 1 Chromosome positioning in proliferating interphase nuclei. Proliferating human dermal fibroblasts (HDFs) cultures were subjected to 2D- or 3D-fluorescence in situ hybridization (FISH) to delineate and analyze the nuclear location of chromosomes 10, 13, 18, and X. In panels (a-d), the chromosome territories are revealed in green with a single chromosome territory for chromosome X, because the HDFs are male in origin. The red antibody staining is the nuclear distribution of the proliferative marker anti-pKi-67, the presence of which denotes a cell in the proliferative cell cycle. DAPI (4',6-diamidino-2-phenylindole) in blue is a DNA intercalator dye and reveals the nuclear DNA. Scale bar = 10 μm. The histograms in panels (e-h) display the distribution of the chromosome signal in 50 to 70 nuclei for each chromosome for 2D FISH, as analyzed with erosion analysis. This anal-ysis divides each nucleus into five concentric shells of equal area, with shell 1 being the most peripheral shell, and shell 5 being the most interior shell [4-6,9]. The percentage of chromosome signal measured in each shell was divided by the percentage of DAPI signal in that shell. Bars represent the mean normalized proportion (percentage) of chromosome signal for each human chromosome. Error bars represent the standard error of the mean (SEM). Panels i and j display 3D projections of 0.2-μm optical sections through 3D preserved nuclei subjected to 3D-FISH and imaged with confocal laser scanning microscopy. The chromosome territories are displayed in red, and proliferating cells also were selected with positive anti-pKi-67 stain-ing (not shown in reconstruction). Scale bar = 10 μm. The line graph in panel (k) displays a frequency distribution of micrometers from the geometric center of the chromosome territories to the nearest nuclear periphery, as defined by DAPI staining. Images for 20 nuclei were analyzed.
Chromosome 10 Chromosome 13 Chromosome 18 Chromosome X(a) (b) (c) (d)
(h)
(i)
3D FISH
Chromosome 10
2D FISH
Chromosome X(j)
Periphery Interior Periphery InteriorPeriphery InteriorPeriphery Interior
(e) (f) (g)
(k)

Mehta et al. Genome Biology 2010, 11:R5http://genomebiology.com/2010/11/1/R5
Page 4 of 17
chromosomes 13 and 18 move from a peripheral nuclearlocation to an interior location (Figure 3m and r). Chro-mosome 10 is one of a number of chromosomes thatmove from an intermediate nuclear location to thenuclear periphery (Figure 3j, Table 1), whereas chromo-some X does not change its location at the nuclearperiphery (Figure 3w), and chromosomes such as 17 and19 do not change their interior location (Figure 3q and s,respectively).
It certainly appears that the chromosome positioning inquiescent G0 cells is correlated with size. However, it isnot clear why a repositioning of chromosomes occursafter serum removal and when and how it is elicited.
The movement of chromosomes when normal fibroblasts exit the cell cycle is rapid, active, and requires myosin and actinTo determine when the genome is reorganized on exitfrom the cell cycle and the speed of the response to theremoval of growth factors, we took actively proliferating
young cultures of primary HDFs and replaced 10% NCSmedium with 0.5% NCS medium. Samples were taken at0, 5, 10, 15, and 30 minutes after serum starvation for fix-ation, and chromosome position in interphase was deter-mined with 2D-FISH and erosion analysis (Figure 4 andAdditional file 1). Chromosomes 13 and 18 relocatedfrom the nuclear periphery to the nuclear interior within15 minutes (Figure 4h and l), with an intermediate-typenuclear positioning visible in the intervening time points(5 and 10 minutes; Figure 4f, g, j, and k). In addition,chromosome 10 moved from an intermediate location toa peripheral location in the same time window (15 min-utes; Figure 4d). Chromosome X did not relocalize at all,as was reported previously [9] (Figure 4m-o), apart fromsome slight difference at 15 minutes (Figure 4p).
In a previous study, we demonstrated that relocation ofchromosome 18 from the nuclear interior in G0 cells tothe nuclear periphery in serum-restimulated cells took30+ hours and appeared to require cells to rebuild theirnuclear architecture after a mitotic division [5]. We
Chromosome positioning in quiescent interphase nucleiFigure 2 Chromosome positioning in quiescent interphase nuclei. Representative images displaying nuclei prepared for fluorescence in situ hy-bridization (2D-FISH), with whole-chromosome painting probes (green), and nuclear DNA is counterstained with 4',6-diamidino-2-phenylindole (DA-PI) (blue). The cells were subjected to indirect immunofluorescence with anti-pKi-67 antibodies, and negative cells were selected. Cells were placed in low serum (0.5%) for 7 days, before fixation with methanol:acetic acid (3:1). The numbers (or letters) on the left side of each panel indicate the chro-mosome that has been hybridized. Scale bar = 10 μm.

Mehta et al. Genome Biology 2010, 11:R5http://genomebiology.com/2010/11/1/R5
Page 5 of 17
Analysis of radial chromosome positioning in quiescent cell nucleiFigure 3 Analysis of radial chromosome positioning in quiescent cell nuclei. Histograms displaying chromosome positions in primary human quiescent fibroblast nuclei. The 50 to 70 nuclei per chromosome were subjected to erosion analysis, which divides each nucleus into five concentric shells of equal area, with shell 1 being the most peripheral shell, and shell 5 being the most interior shell [4-6,9]. The percentage of chromosome signal measured in each shell was divided by the percentage of 4',6-diamidino-2-phenylindole (DAPI) signal in that shell. Bars represent the mean normalized proportion (percentage) of chromosome signal for each human chromosome. Error bars represent the standard error of mean (SEM).
Chromosome 13
0
0.4
0.8
1.2
1.6
2
2.4
1 2 3 4 5
Shell No.
%o
fC
hro
mo
so
me
Sig
na
l/%
of
DA
PI
Chromosome 17
0
0.4
0.8
1.2
1.6
2
2.4
1 2 3 4 5
Shell No.
%o
fC
hro
mo
so
me
Sig
na
l/%
of
DA
PI
Chromosome 12
0
0.4
0.8
1.2
1.6
2
2.4
1 2 3 4 5
Shell No.
%o
fC
hro
mo
so
me
Sig
na
l/%
of
DA
PI
Chromosome 21
0
0.4
0.8
1.2
1.6
2
2.4
1 2 3 4 5
Shell No.
%o
fC
hro
mo
so
me
Sig
na
l/%
of
DA
PI
Chromosome 22
0
0.4
0.8
1.2
1.6
2
2.4
1 2 3 4 5
Shell No.
%o
fC
hro
mo
so
me
Sig
na
l/%
of
DA
PI
Chromosome X
0
0.4
0.8
1.2
1.6
2
2.4
1 2 3 4 5
Shell No.
%o
fC
hro
mo
so
me
Sig
na
l/%
of
DA
PI
Chromosome Y
0
0.4
0.8
1.2
1.6
2
2.4
1 2 3 4 5
Shell No.
%o
fC
hro
mo
so
me
Sig
na
l/%
of
DA
PI
Chromosome 18
0
0.4
0.8
1.2
1.6
2
2.4
1 2 3 4 5
Shell No.
%o
fC
hro
mo
so
me
Sig
na
l/%
of
DA
PI
Chromosome 19
0
0.4
0.8
1.2
1.6
2
2.4
1 2 3 4 5
Shell No.
%o
fC
hro
mo
so
me
Sig
na
l/%
of
DA
PI
Chromosome 20
0
0.4
0.8
1.2
1.6
2
2.4
1 2 3 4 5
Shell No.
%o
fC
hro
mo
so
me
Sig
na
l/%
of
DA
PI
Chromosome 14
0
0.4
0.8
1.2
1.6
2
2.4
1 2 3 4 5
Shell No.
%o
fC
hro
mo
so
me
Sig
na
l/%
of
DA
PI
Chromosome 15
0
0.4
0.8
1.2
1.6
2
2.4
1 2 3 4 5
Shell No.
%o
fC
hro
mo
so
me
Sig
na
l/%
of
DA
PI
Chromosome 16
0
0.4
0.8
1.2
1.6
2
2.4
1 2 3 4 5
Shell No.
%o
fC
hro
mo
so
me
Sig
na
l/%
of
DA
PI
Chromosome 10
0
0.4
0.8
1.2
1.6
2
2.4
1 2 3 4 5
Shell No.
%o
fC
hro
mo
so
me
Sig
na
l/%
of
DA
PI
Chromosome 11
0
0.4
0.8
1.2
1.6
2
2.4
1 2 3 4 5
Shell No.
%o
fC
hro
mo
so
me
Sig
na
l/%
of
DA
PI
Chromosome 9
0
0.4
0.8
1.2
1.6
2
2.4
1 2 3 4 5
Shell No.
%o
fC
hro
mo
so
me
Sig
na
l/%
of
DA
PI
Chromosome 1
0
0.4
0.8
1.2
1.6
2
2.4
1 2 3 4 5
Shell No.
%o
fC
hro
mo
so
me
Sig
na
l/
%o
fD
AP
I
Chromosome 5
0
0.4
0.8
1.2
1.6
2
2.4
1 2 3 4 5
Shell No.
%o
fC
hro
mo
so
me
Sig
na
l/%
of
DA
PI
Chromosome 6
0
0.4
0.8
1.2
1.6
2
2.4
1 2 3 4 5
Shell No.
%o
fC
hro
mo
so
me
Sig
na
l/%
of
DA
PI
Chromosome 7
0
0.4
0.8
1.2
1.6
2
2.4
1 2 3 4 5
Shell No.
%o
fC
hro
mo
so
me
Sig
na
l/%
of
DA
PI
Chromosome 8
0
0.4
0.8
1.2
1.6
2
2.4
1 2 3 4 5
Shell No.
%o
fC
hro
mo
so
me
Sig
na
l/%
of
DA
PI
Chromosome 3
0
0.4
0.8
1.2
1.6
2
2.4
1 2 3 4 5
Shell No.
%o
fC
hro
mo
so
me
Sig
na
l/%
of
DA
PI
Chromosome 4
0
0.4
0.8
1.2
1.6
2
2.4
1 2 3 4 5
Shell No.
%o
fC
hro
mo
so
me
Sig
na
l/%
of
DA
PI
Chromosome 2
0
0.4
0.8
1.2
1.6
2
2.4
1 2 3 4 5
Shell No.
%o
fC
hro
mo
so
me
Sig
na
l/%
of
DA
PI
(c) (d)
(g) (h)
(o) (p)
(q) (r) (s) (t)
(b)(a)
(f)(e)
(k)(i) (l)(j)
(n)(m)
(x)(w)(v)(u)

Mehta et al. Genome Biology 2010, 11:R5http://genomebiology.com/2010/11/1/R5
Page 6 of 17
showed here that the same is true for chromosome 10,with a return to an intermediate nuclear location 24 to 36hours after restimulation of G0 cells with 10% NCS (Fig-ure 5d-f). We again showed that chromosome 18 requiressimilar times to return to the nuclear periphery (that is,36 hours; Figure 5l). Although chromosome X remains atthe nuclear periphery, a slight change in the distributionof chromosome X occurs at 32 to 36 hours (Figure 5q-r).From these data, it seems that a rapid response to theremoval of growth factors reorganizes the whole genomewithin the interphase nucleus, and this reorganization iscorrected in proliferating cells only after 24+ hours inhigh serum, presumably after the cells have passed
through mitosis, as indicated by the peak of mitotic cellsat 24 to 36 hours after serum restimulation (0 hours,none; 8 hours, none; 24 hours, 0.3%; 32 hours, 2.6%; and36 hours, 1.2%).
Such rapid movement of large regions of the genome inresponse to low serum implies an active process, perhapsrequiring ATP/GTP. When inhibitors of ATPase and/orGTPase, ouabain, and AG10, were incubated with prolif-erating cell cultures in combination with low serum,chromosome 10 did not change nuclear location (Figure6a-d, and see Additional file 3). The relocation to thenuclear interior of chromosome 18 territories after incu-bation of cells in low serum also was perturbed by these
Table 1: The position of all chromosome territories in primary human dermal fibroblasts as determined by 2D FISH, image
acquisition, and erosion analysis
Chromosome by size ProliferatingHDFs
QuiescentHDFs
1 IMb P
2 Pb P
3 Pd P
4 Pcd Pc
5 IMd IM
6 IMb P
7 P^ P
X Pab Pc
8 IMb P
9 Pd P
10 IMd P
11 IMd P
12 Pb I
13 Pa Ic
14 Ib I
15 Pb I
16 Ib I
17 Ib I
18 Pac Iac
19 Ia Ia
20 Id IM
22 Ib I
21 Ib I
Y I^ I
This table summarizes the locations of all the chromosomes in quiescent and proliferating nuclei of human dermal fibroblasts (HDFs). The positions of chromosomes shown without a symbol have been determined for this study. aData derived from [5]. bData derived from [4]. cData derived from [9]. dData derived from [7].

Mehta et al. Genome Biology 2010, 11:R5http://genomebiology.com/2010/11/1/R5
Page 7 of 17
inhibitors (Figure 6a-d). The control chromosome, chro-mosome X, remained at the nuclear periphery (Figure 6and Additional file 3). Because other studies suggest thatnuclear motors move genomic regions around thenucleus by actin and/or myosin [42,44] we decided to useinhibitors of actin and myosin polymerization to attemptto block any chromosome movement elicited by thesenuclear motors when serum was removed. Latrunculin A,
an inhibitor of actin polymerization, inhibited the move-ment of both chromosomes 10 and 18 when cells wereplaced in low serum (Figure 7a and Additional file 3). Incontrast, phalloidin oleate, another inhibitor of actinpolymerization did not prevent relocalization of eitherchromosome 10 or 18, when cells were placed in lowserum (Figure 7b and Additional file 3). However, twoinhibitors of myosin polymerization (BDM) and function
Rapid repositioning of chromosomes after removal of serumFigure 4 Rapid repositioning of chromosomes after removal of serum. Chromosomes move rapidly in proliferating cells placed in low serum. The nuclear locations of human chromosomes 10 (a-d), 13 (e-h), 18 (i-l), and X (m-p) were analyzed in normal fibroblast cell nuclei fixed for 2D-FISH (fluorescence in situ hybridization) after incubation in medium containing low serum (0.5%) for 0, 5, 10, and 15 minutes. The filled-in squares indicate significance difference (P < 0.05) when compared with control proliferating fibroblast cell nuclei.
(i)
5 Minutes 10 Minutes 15 Minutes0 Minutes
Chro
moso
me 1
0C
hro
moso
me 1
3C
hro
moso
me 1
8C
hro
moso
me X
0
0.4
0.8
1.2
1.6
2
2.4
1 2 3 4 5
Shell No.
%o
fC
hro
mo
so
me
Sig
na
l/%
of
DA
PI
0
0.4
0.8
1.2
1.6
2
2.4
1 2 3 4 5
Shell No
%o
fC
hro
mo
so
me
Sig
na
l/%
of
DA
PI
0
0.4
0.8
1.2
1.6
2
2.4
1 2 3 4 5
Shell No.
%o
fC
hro
mo
so
me
Sig
na
l/%
of
DA
PI
0
0.4
0.8
1.2
1.6
2
2.4
1 2 3 4 5
Shell No.
%o
fC
hro
mo
so
me
Sig
na
l/%
of
DA
PI
0
0.4
0.8
1.2
1.6
2
2.4
1 2 3 4 5
Shell No
%o
fC
hro
mo
so
me
Sig
na
l/%
of
DA
PI
0
0.4
0.8
1.2
1.6
2
2.4
1 2 3 4 5
Shell No
%o
fC
hro
mo
so
me
Sig
na
l/%
of
DA
PI
0
0.4
0.8
1.2
1.6
2
2.4
1 2 3 4 5
Shell No
%o
fC
hro
mo
so
me
Sig
na
l/%
of
DA
PI
0
0.4
0.8
1.2
1.6
2
2.4
1 2 3 4 5
Shell No
%o
fC
hro
mo
so
me
Sig
na
l/%
of
DA
PI
0
0.4
0.8
1.2
1.6
2
2.4
1 2 3 4 5
Shell No
%o
fC
hro
mo
so
me
Sig
na
l/%
of
DA
PI
0
0.4
0.8
1.2
1.6
2
2.4
1 2 3 4 5
Shell No.
%o
fC
hro
mo
so
me
Sig
na
l/%
of
DA
PI
0
0.4
0.8
1.2
1.6
2
2.4
1 2 3 4 5
Shell No.
%o
fC
hro
mo
so
me
Sig
na
l/%
of
DA
PI
0
0.4
0.8
1.2
1.6
2
2.4
1 2 3 4 5
Shell No.
%o
fC
hro
mo
so
me
Sig
na
l/%
of
DA
PI
0
0.4
0.8
1.2
1.6
2
2.4
2.8
1 2 3 4 5
Shell No.
%o
fC
hro
mo
so
me
Sig
na
l/%
of
DA
PI
0
0.4
0.8
1.2
1.6
2
2.4
1 2 3 4 5
Shell No.
%o
fC
hro
mo
so
me
Sig
na
l/%
of
DA
PI
0
0.4
0.8
1.2
1.6
2
2.4
1 2 3 4 5
Shell No.
%o
fC
hro
mo
so
me
Sig
na
l/%
of
DA
PI
0
0.4
0.8
1.2
1.6
2
2.4
2.8
1 2 3 4 5
Shell No.
%o
fC
hro
mo
so
me
Sig
na
l/%
of
DA
PI
(c) (d)
(g) (h)
(o) (p)
(a) (b)
(e) (f)
(j) (k) (l)
(m) (n)
(i)

Mehta et al. Genome Biology 2010, 11:R5http://genomebiology.com/2010/11/1/R5
Page 8 of 17
Restoration of proliferative chromosome position after restimulation of G0 cellsFigure 5 Restoration of proliferative chromosome position after restimulation of G0 cells. The relocation of chromosomes to their proliferative nuclear location takes 24+ hours for chromosome 10 and 36 hours for chromosome 18. Proliferating cells (a, g, m) were placed in low serum (0.5%) for 7 days (b, h, n) and then restimulated to enter the proliferative cell cycle with the readdition of high serum. Samples were taken at 8 hours (c, i, o), 24 hours (d, j, p), 32 hours (e, k, q), and 36 hours (f, l, r) after restimulation. The graphs display the normalized distribution of chromosome signal in each of the five shells. Shell 1 is the nuclear periphery, and shell 5 is the innermost region of the nucleus. The solid squares represent a significant difference (P < 0.05) for that shell when compared with the equivalent shell for the time 0 data (G0 data) for the erosion analysis.
Pro
lifer
atin
g ce
lls0
hour
s(q
uies
cent
cel
ls)
8ho
urs
24ho
urs
32ho
urs
36ho
urs
Chromosome 10 Chromosome X
(h)
(i)
(j)
(k)
(l)
(n)
(o)
(p)
(q)
(r)
(a)
(b)
(c)
(d)
(e)
(f)
(g) (m)
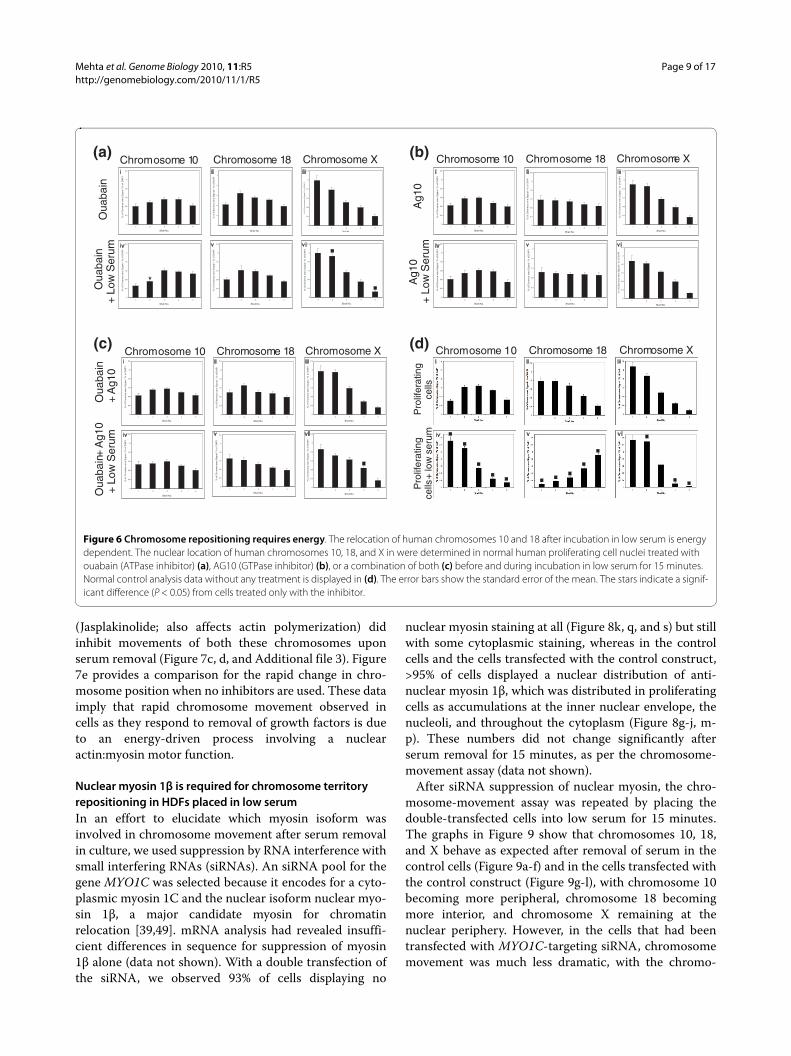
Mehta et al. Genome Biology 2010, 11:R5http://genomebiology.com/2010/11/1/R5
Page 9 of 17
(Jasplakinolide; also affects actin polymerization) didinhibit movements of both these chromosomes uponserum removal (Figure 7c, d, and Additional file 3). Figure7e provides a comparison for the rapid change in chro-mosome position when no inhibitors are used. These dataimply that rapid chromosome movement observed incells as they respond to removal of growth factors is dueto an energy-driven process involving a nuclearactin:myosin motor function.
Nuclear myosin 1β is required for chromosome territory repositioning in HDFs placed in low serumIn an effort to elucidate which myosin isoform wasinvolved in chromosome movement after serum removalin culture, we used suppression by RNA interference withsmall interfering RNAs (siRNAs). An siRNA pool for thegene MYO1C was selected because it encodes for a cyto-plasmic myosin 1C and the nuclear isoform nuclear myo-sin 1β, a major candidate myosin for chromatinrelocation [39,49]. mRNA analysis had revealed insuffi-cient differences in sequence for suppression of myosin1β alone (data not shown). With a double transfection ofthe siRNA, we observed 93% of cells displaying no
nuclear myosin staining at all (Figure 8k, q, and s) but stillwith some cytoplasmic staining, whereas in the controlcells and the cells transfected with the control construct,>95% of cells displayed a nuclear distribution of anti-nuclear myosin 1β, which was distributed in proliferatingcells as accumulations at the inner nuclear envelope, thenucleoli, and throughout the cytoplasm (Figure 8g-j, m-p). These numbers did not change significantly afterserum removal for 15 minutes, as per the chromosome-movement assay (data not shown).
After siRNA suppression of nuclear myosin, the chro-mosome-movement assay was repeated by placing thedouble-transfected cells into low serum for 15 minutes.The graphs in Figure 9 show that chromosomes 10, 18,and X behave as expected after removal of serum in thecontrol cells (Figure 9a-f) and in the cells transfected withthe control construct (Figure 9g-l), with chromosome 10becoming more peripheral, chromosome 18 becomingmore interior, and chromosome X remaining at thenuclear periphery. However, in the cells that had beentransfected with MYO1C-targeting siRNA, chromosomemovement was much less dramatic, with the chromo-
Chromosome repositioning requires energyFigure 6 Chromosome repositioning requires energy. The relocation of human chromosomes 10 and 18 after incubation in low serum is energy dependent. The nuclear location of human chromosomes 10, 18, and X in were determined in normal human proliferating cell nuclei treated with ouabain (ATPase inhibitor) (a), AG10 (GTPase inhibitor) (b), or a combination of both (c) before and during incubation in low serum for 15 minutes. Normal control analysis data without any treatment is displayed in (d). The error bars show the standard error of the mean. The stars indicate a signif-icant difference (P < 0.05) from cells treated only with the inhibitor.
0
0.4
0.8
1.2
1.6
2
2.4
1 2 3 4 5
Shell No.
%o
fC
hro
mo
so
me
Sig
na
l/%
of
DA
PI
0
0.4
0.8
1.2
1.6
2
2.4
1 2 3 4 5
Shell No.
%o
fC
hro
mo
so
me
Sig
na
l/%
of
DA
PI
0
0.4
0.8
1.2
1.6
2
2.4
1 2 3 4 5
Shell No.
%o
fC
hro
mo
so
me
Sig
na
l/%
of
DA
PI
Ag1
0A
g10
+Lo
wS
erum
Chromosome 10 Chromosome 18 Chromosome X
0
0.4
0.8
1.2
1.6
2
2.4
1 2 3 4 5
Shell No.
%o
fC
hro
mo
so
me
Sig
na
l/%
of
DA
PI
0
0.4
0.8
1.2
1.6
2
1 2 3 4 5
Shell No.
%o
fC
hro
mo
so
me
Sig
na
l/%
of
DA
PI
0
0.4
0.8
1.2
1.6
2
2.4
1 2 3 4 5
Shell No.
%o
fC
hro
mo
so
me
Sig
na
l/%
of
DA
PI
Oua
bain
+A
g10
Oua
bain
+A
g10
+Lo
wS
erum
Chromosome 10 Chromosome 18 Chromosome X
0
0.4
0.8
1.2
1.6
2
2.4
1 2 3 4 5
Shell No.
%o
fC
hro
mo
so
me
Sig
na
l/%
of
DA
PI
0
0.4
0.8
1.2
1.6
2
2.4
1 2 3 4 5
Shell No.
%o
fC
hro
mo
so
me
Sig
na
l/%
of
DA
PI
0
0.4
0.8
1.2
1.6
2
2.4
1 2 3 4 5
Shell No.
%o
fC
hro
mo
so
me
Sig
na
l/%
of
DA
PI
0
0.4
0.8
1.2
1.6
2
2.4
1 2 3 4 5
Shell No.
%o
fC
hro
mo
so
me
Sig
na
l/%
of
DA
PI
0
0.4
0.8
1.2
1.6
2
2.4
1 2 3 4 5
Shell No.
%o
fChr
omos
ome
Sig
nal/
%o
fD
AP
I
0
0.4
0.8
1.2
1.6
2
2.4
1 2 3 4 5
Shell No.
%o
fC
hro
mo
so
me
Sig
na
l/%
of
DA
PI
Chromosome 10 Chromosome 18 Chromosome X
Oua
bain
Oua
bain
+Lo
wS
erum
0
0.4
0.8
1.2
1.6
2
2.4
1 2 3 4 5
Shell No.
%o
fC
hro
mo
so
me
Sig
na
l/%
of
DA
PI
0
0.4
0.8
1.2
1.6
2
1 2 3 4 5
Shell No.
%o
fC
hro
mo
so
me
Sig
na
l/%
of
DA
PI
0
0.4
0.8
1.2
1.6
2
2.4
1 2 3 4 5
Shell No.
%o
fC
hro
mo
so
me
Sig
na
l/%
of
DA
PI
0
0.4
0.8
1.2
1.6
2
2.4
1 2 3 4 5
Shell No.
%o
fC
hro
mo
so
me
Sig
na
l/%
of
DA
PI
0
0.4
0.8
1.2
1.6
2
2.4
1 2 3 4 5
Shell No.
%o
fC
hro
mo
so
me
Sig
na
l/%
of
DA
PI
0
0.4
0.8
1.2
1.6
2
2.4
1 2 3 4 5
Shell No.%
of
Ch
rom
os
om
eS
ign
al/
%o
fD
AP
I
Chromosome 10 Chromosome 18 Chromosome X(d)
Pro
lifer
atin
gce
llsP
rolif
erat
ing
cells
+lo
wse
rum
(a) (b)
(c)

Mehta et al. Genome Biology 2010, 11:R5http://genomebiology.com/2010/11/1/R5
Page 10 of 17
somes still residing in similar nuclear compartmentsbefore and after the serum removal (Figure 9m-r).
The distribution of the nuclear myosin 1β is very inter-esting in these cells, because it gives a nuclear envelopedistribution, a nucleolar distribution, and a nucleoplas-mic distribution (Figure 10a-c). These distributions,although revealing, are not so surprising, because nuclearmyosin has a binding affinity for the integral nuclearmembrane protein emerin [50] and is involved in RNApolymerase I transcription [37,40,51]. The distribution inquiescent cells is quite different, with large aggregates ofNM1β within the nucleoplasm and is missing from thenuclear envelope and nucleoli. This distribution is similarto that observed in senescent human dermal fibroblasts(Mehta, Kill, and Bridger, unpublished data). With
respect to chromosome movement back to a proliferatingposition after incubation in low serum, we showed that itdoes not occur until 24 to 36 hours after repeated addi-tion of serum to a quiescent culture (Figure 5) [5]. Corre-lating with this is the rebuilding of daughter nuclei aftermitosis and the return of a proliferating distribution ofNM1β to the nuclear envelope, nucleoli, and nucleoplasm(Figure 10g, j, p).
DiscussionThis study completes the nuclear positioning of all 24chromosomes in quiescent (serum-starved) normal pri-mary HDFs, as assessed with 2D-FISH and erosion analy-sis, with a number of chromosomal positions confirmedin 3D-preserved nuclei. This study, which was performed
Chromosome repositioning requires nuclear myosin and actinFigure 7 Chromosome repositioning requires nuclear myosin and actin. The relocation of human chromosomes 10 and 18 after incubation in low serum is myosin and actin dependent. The nuclear locations of chromosomes 10, 18, and X were determined in normal human proliferating cell nuclei treated with latrunculin A and phalloidin oleate (inhibitors of actin polymerisation) (a, b) and BDM and jasplakinolide (inhibitors of myosin po-lymerization) (c, d) before and during incubation in low serum for 15 minutes. The error bars show the standard error of the mean. The stars indicate a significant difference (P < 0.05) from cells treated only with the inhibitor. Normal control analysis data without any treatment is displayed in (e).
Chromosome 10 Chromosome 18 Chromosome X
Latr
uncu
linA
Latr
uncu
linA
+Lo
wS
erum
Pha
lloid
inO
leat
eP
hallo
idin
Ole
ate
+Lo
wS
erum
BD
MB
DM
+Lo
wS
erum
Jasp
laki
nolid
e+
Low
Ser
umJa
spla
kino
lide
Chromosome 10 Chromosome 18 Chromosome X
Chromosome 10 Chromosome 18 Chromosome XChromosome 10 Chromosome 18 Chromosome X
0
0.4
0.8
1.2
1.6
2
2.4
1 2 3 4 5
Shell N o.
%of
Chr
omos
ome
Sig
nal/
%of
DA
PI
0
0.4
0.8
1.2
1.6
2
2.4
1 2 3 4 5
Shell N o.%
ofC
hrom
osom
eS
igna
l/%
ofD
AP
I
0
0.4
0.8
1.2
1.6
2
2.4
1 2 3 4 5
Shell N o.
%of
Chr
omos
ome
Sig
nal/
%of
DA
PI
0
0.4
0.8
1.2
1.6
2
2.4
1 2 3 4 5
Shell N o.
%of
Chr
omos
ome
Sig
nal/
%of
DA
PI
0
0.4
0.8
1.2
1.6
2
2.4
1 2 3 4 5
Shell N o.
%of
Chr
omos
ome
Sig
nal/
%of
DA
PI
0
0.4
0.8
1.2
1.6
2
2.4
1 2 3 4 5
Shell N o.
%of
Chr
omos
ome
Sig
nal/
%of
DA
PI
0
0.4
0.8
1.2
1.6
2
2.4
1 2 3 4 5
Shell N o.
%of
Chr
omos
ome
Sig
nal/
%of
DA
PI
0
0.4
0.8
1.2
1.6
2
2.4
1 2 3 4 5
Shell N o.
%of
Chr
omos
ome
Sig
nal/
%of
DA
PI
0
0.4
0.8
1.2
1.6
2
2.4
1 2 3 4 5
Shell N o.
%of
Chr
omos
ome
Sig
nal/
%of
DA
PI
0
0.4
0.8
1.2
1.6
2
1 2 3 4 5
Shell N o.
%of
Chr
omos
ome
Sig
nal/
%of
DA
PI
0
0.4
0.8
1.2
1.6
2
2.4
1 2 3 4 5
Shell No.
%of
Chr
omos
ome
Sig
nal/
%of
DA
PI
0
0.4
0.8
1.2
1.6
2
2.4
1 2 3 4 5
S hell No.
%of
Chr
omos
ome
Sig
nal/
%of
DA
PI
0
0.4
0.8
1.2
1.6
2
2.4
1 2 3 4 5
Shell N o.
%of
Chr
omos
ome
Sig
nal/
%of
DA
PI
0
0.4
0.8
1.2
1.6
2
2.4
1 2 3 4 5
Shell N o.
%of
Chr
omos
ome
Sig
nal/
%of
DA
PI
0
0.4
0.8
1.2
1.6
2
2.4
1 2 3 4 5
Shell N o.
%of
Chr
omos
ome
Sig
nal/
%of
DA
PI
0
0.4
0.8
1.2
1.6
2
2.4
1 2 3 4 5
Shell N o.
%of
Chr
omos
ome
Sig
nal/
%of
DA
PI
0
0.4
0.8
1.2
1.6
2
2.4
1 2 3 4 5
Shell N o.
%of
Chr
omos
ome
Sig
nal/
%of
DA
PI
0
0.4
0.8
1.2
1.6
2
2.4
1 2 3 4 5
Shell N o.
%of
Chr
omos
ome
Sig
nal/
%of
DA
PI
0
0.4
0.8
1.2
1.6
2
2.4
1 2 3 4 5
Shell no.%
ofC
hrom
osom
eS
igna
l/%
ofD
AP
I
0
0.4
0.8
1.2
1.6
2
1 2 3 4 5
S hell No.
%of
Chr
omos
ome
Sig
nal/
%of
DA
PI
0
0.4
0.8
1.2
1.6
2
2.4
1 2 3 4 5
Shell N o.
%of
Chr
omos
ome
Sig
nal/
%of
DA
PI
0
0.4
0.8
1.2
1.6
2
2.4
1 2 3 4 5
Shell N o.
%of
Chr
omos
ome
Sig
nal/
%of
DA
PI
0
0.4
0.8
1.2
1.6
2
2.4
1 2 3 4 5
Shell N o.
%of
Chr
omos
ome
Sig
nal/
%of
DA
PI
0
0.4
0.8
1.2
1.6
2
2.4
1 2 3 4 5
Shell N o.
%of
Chr
omos
ome
Sig
nal/
%of
DA
PI
Chromosome 10 Chromosome 18 Chromosome X(e)
Pro
lifer
ating
cells
Pro
lifer
atin g
cells
+lo
wse
rum
(a) (b)
(c) (d)
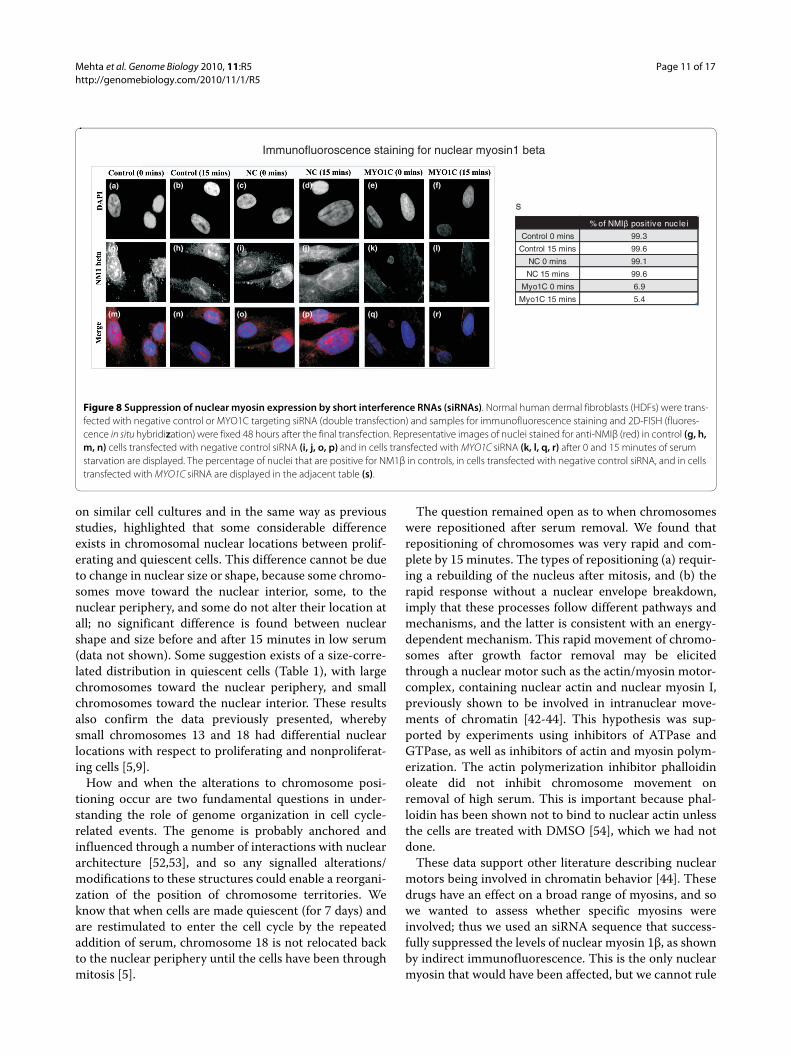
Mehta et al. Genome Biology 2010, 11:R5http://genomebiology.com/2010/11/1/R5
Page 11 of 17
on similar cell cultures and in the same way as previousstudies, highlighted that some considerable differenceexists in chromosomal nuclear locations between prolif-erating and quiescent cells. This difference cannot be dueto change in nuclear size or shape, because some chromo-somes move toward the nuclear interior, some, to thenuclear periphery, and some do not alter their location atall; no significant difference is found between nuclearshape and size before and after 15 minutes in low serum(data not shown). Some suggestion exists of a size-corre-lated distribution in quiescent cells (Table 1), with largechromosomes toward the nuclear periphery, and smallchromosomes toward the nuclear interior. These resultsalso confirm the data previously presented, wherebysmall chromosomes 13 and 18 had differential nuclearlocations with respect to proliferating and nonproliferat-ing cells [5,9].
How and when the alterations to chromosome posi-tioning occur are two fundamental questions in under-standing the role of genome organization in cell cycle-related events. The genome is probably anchored andinfluenced through a number of interactions with nucleararchitecture [52,53], and so any signalled alterations/modifications to these structures could enable a reorgani-zation of the position of chromosome territories. Weknow that when cells are made quiescent (for 7 days) andare restimulated to enter the cell cycle by the repeatedaddition of serum, chromosome 18 is not relocated backto the nuclear periphery until the cells have been throughmitosis [5].
The question remained open as to when chromosomeswere repositioned after serum removal. We found thatrepositioning of chromosomes was very rapid and com-plete by 15 minutes. The types of repositioning (a) requir-ing a rebuilding of the nucleus after mitosis, and (b) therapid response without a nuclear envelope breakdown,imply that these processes follow different pathways andmechanisms, and the latter is consistent with an energy-dependent mechanism. This rapid movement of chromo-somes after growth factor removal may be elicitedthrough a nuclear motor such as the actin/myosin motor-complex, containing nuclear actin and nuclear myosin I,previously shown to be involved in intranuclear move-ments of chromatin [42-44]. This hypothesis was sup-ported by experiments using inhibitors of ATPase andGTPase, as well as inhibitors of actin and myosin polym-erization. The actin polymerization inhibitor phalloidinoleate did not inhibit chromosome movement onremoval of high serum. This is important because phal-loidin has been shown not to bind to nuclear actin unlessthe cells are treated with DMSO [54], which we had notdone.
These data support other literature describing nuclearmotors being involved in chromatin behavior [44]. Thesedrugs have an effect on a broad range of myosins, and sowe wanted to assess whether specific myosins wereinvolved; thus we used an siRNA sequence that success-fully suppressed the levels of nuclear myosin 1β, as shownby indirect immunofluorescence. This is the only nuclearmyosin that would have been affected, but we cannot rule
Suppression of nuclear myosin expression by short interference RNAs (siRNAs)Figure 8 Suppression of nuclear myosin expression by short interference RNAs (siRNAs). Normal human dermal fibroblasts (HDFs) were trans-fected with negative control or MYO1C targeting siRNA (double transfection) and samples for immunofluorescence staining and 2D-FISH (fluores-cence in situ hybridization) were fixed 48 hours after the final transfection. Representative images of nuclei stained for anti-NMIβ (red) in control (g, h, m, n) cells transfected with negative control siRNA (i, j, o, p) and in cells transfected with MYO1C siRNA (k, l, q, r) after 0 and 15 minutes of serum starvation are displayed. The percentage of nuclei that are positive for NM1β in controls, in cells transfected with negative control siRNA, and in cells transfected with MYO1C siRNA are displayed in the adjacent table (s).
(b) (c) (d) (e) (f)
(g) (h) (i) (j) (k) (l)
(m) (n) (o) (p) (q) (r)
Immunofluoroscence staining for nuclear myosin1 beta
Column1 % of NMIβ posit ive nuc le i
Control 0 mins 99.3
Control 15 mins 99.6
NC 0 mins 99.1
NC 15 mins 99.6
Myo1C 0 mins 6.9
Myo1C 15 mins 5.4
S
(a)
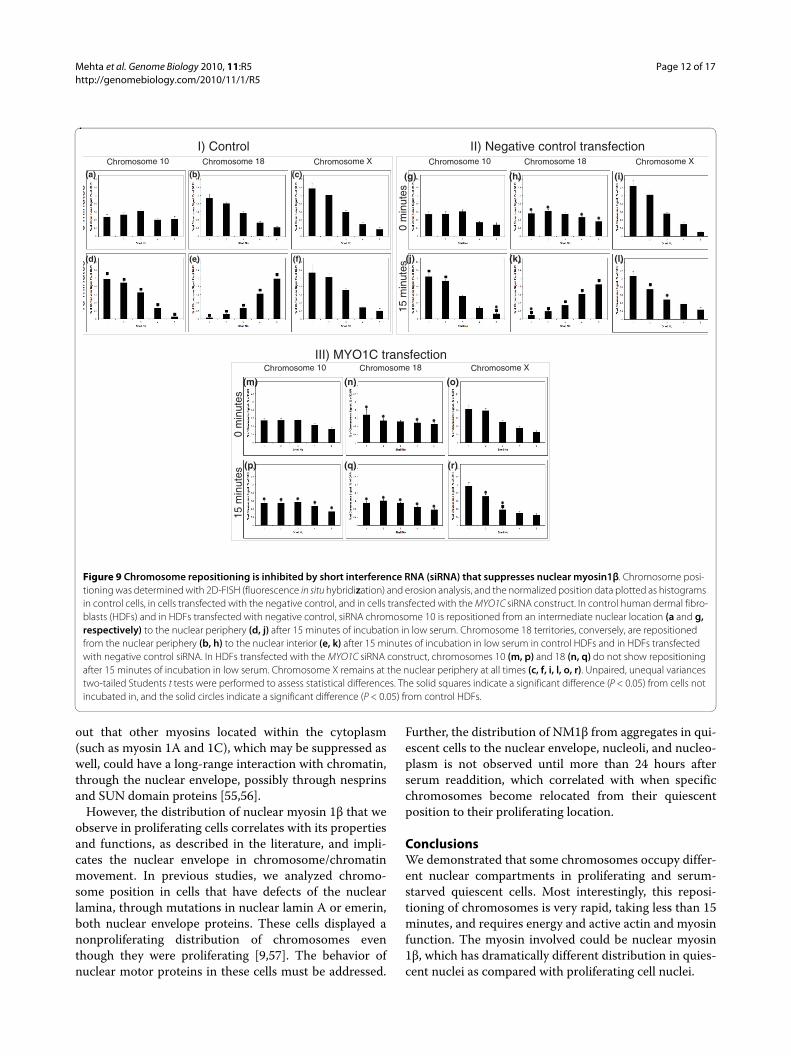
Mehta et al. Genome Biology 2010, 11:R5http://genomebiology.com/2010/11/1/R5
Page 12 of 17
out that other myosins located within the cytoplasm(such as myosin 1A and 1C), which may be suppressed aswell, could have a long-range interaction with chromatin,through the nuclear envelope, possibly through nesprinsand SUN domain proteins [55,56].
However, the distribution of nuclear myosin 1β that weobserve in proliferating cells correlates with its propertiesand functions, as described in the literature, and impli-cates the nuclear envelope in chromosome/chromatinmovement. In previous studies, we analyzed chromo-some position in cells that have defects of the nuclearlamina, through mutations in nuclear lamin A or emerin,both nuclear envelope proteins. These cells displayed anonproliferating distribution of chromosomes eventhough they were proliferating [9,57]. The behavior ofnuclear motor proteins in these cells must be addressed.
Further, the distribution of NM1β from aggregates in qui-escent cells to the nuclear envelope, nucleoli, and nucleo-plasm is not observed until more than 24 hours afterserum readdition, which correlated with when specificchromosomes become relocated from their quiescentposition to their proliferating location.
ConclusionsWe demonstrated that some chromosomes occupy differ-ent nuclear compartments in proliferating and serum-starved quiescent cells. Most interestingly, this reposi-tioning of chromosomes is very rapid, taking less than 15minutes, and requires energy and active actin and myosinfunction. The myosin involved could be nuclear myosin1β, which has dramatically different distribution in quies-cent nuclei as compared with proliferating cell nuclei.
Chromosome repositioning is inhibited by short interference RNA (siRNA) that suppresses nuclear myosin1βFigure 9 Chromosome repositioning is inhibited by short interference RNA (siRNA) that suppresses nuclear myosin1β. Chromosome posi-tioning was determined with 2D-FISH (fluorescence in situ hybridization) and erosion analysis, and the normalized position data plotted as histograms in control cells, in cells transfected with the negative control, and in cells transfected with the MYO1C siRNA construct. In control human dermal fibro-blasts (HDFs) and in HDFs transfected with negative control, siRNA chromosome 10 is repositioned from an intermediate nuclear location (a and g, respectively) to the nuclear periphery (d, j) after 15 minutes of incubation in low serum. Chromosome 18 territories, conversely, are repositioned from the nuclear periphery (b, h) to the nuclear interior (e, k) after 15 minutes of incubation in low serum in control HDFs and in HDFs transfected with negative control siRNA. In HDFs transfected with the MYO1C siRNA construct, chromosomes 10 (m, p) and 18 (n, q) do not show repositioning after 15 minutes of incubation in low serum. Chromosome X remains at the nuclear periphery at all times (c, f, i, l, o, r). Unpaired, unequal variances two-tailed Students t tests were performed to assess statistical differences. The solid squares indicate a significant difference (P < 0.05) from cells not incubated in, and the solid circles indicate a significant difference (P < 0.05) from control HDFs.
0m
inut
es
Chromosome 10
(e)
(b)
Chromosome 18 Chromosome X
(f)
15m
inut
es
0m
inut
es
Chromosome 10 Chromosome 18 Chromosome X
15m
inut
es
0m
inut
es
Chromosome 10 Chromosome 18 Chromosome X
15m
inut
es
I) Control II) Negative control transfection
III) MYO1C transfection
(g)
(l)
(o)
(p) (q) (r)
(m) (n)
(h) (i)
(j) (k)
(a)
(d)
(c)

Mehta et al. Genome Biology 2010, 11:R5http://genomebiology.com/2010/11/1/R5
Page 13 of 17
Materials and methodsCell cultureHuman dermal fibroblasts (HDFs), 2DD [58] were grownin Dulbecco's Modified Eagles Medium (DMEM) con-taining 10% newborn calf serum (vol/vol NCS), glu-tamine, and antibiotics, at 37°C. Cells were passagedtwice a week and seeded at a density of 3 × 10³/cm2. Cellswere made quiescent by incubation in 10% NCS DMEMfor 2 days, washing in serum-free medium, followed byincubation in DMEM containing 0.5% NCS (vol/vol) for 7days.
Inhibitors of ATPase, GTPase, myosin, and actin polymerizationTo inhibit the activity of ATPase or GTPase, cells weretreated with 100 μmol/L ouabain (Calbiochem-Novabio-chem, Beeston, Nottingham, UK) for 30 minutes [59] orwith 100 μmol/L AG10 (Calbiochem) for 20 or 30 min-utes before serum withdrawal [60,61], respectively. Toinhibit the polymerization of actin, cells were treatedwith 1 μmol/L either Latrunculin A (Calbiochem) [62,63]or phalloidin oleate (Calbiochem) [64] for 30 minutes.Myosin polymerization was inhibited by treating cells
Anti-nuclear myosin 1b (NM1β) staining patterns in proliferating cells, quiescent cells, and after restimulationFigure 10 Anti-nuclear myosin 1b (NM1β) staining patterns in proliferating cells, quiescent cells, and after restimulation. Normal 2DD hu-man dermal fibroblasts (HDFs) were serum starved for 7 days to induce quiescence. The cells were then restimulated with fresh serum, and samples were collected at 0, 24, 36 and 48 hours after serum restoration. Samples were also collected before serum withdrawal (proliferating cells). The samples were then fixed with methanol/acetone (1:1), and the distribution of NMIβ was assessed by performing an indirect immunofluorescence assay for NMIβ. Images in (a, c) display the distribution of NMIβ in proliferating cells, whereas those in (d and f) show the distribution of NMIβ after 0, 24, 36 and 48 hours after restimulation of quiescent fibroblasts. The table (p) displays the percentage of cells displaying various patterns of NMIβ staining after restimulation. Error is indicated by standard deviation. Scale bar = 10 μm.
(a)
(b)
(c)
(d)
(e)
(f)
(g)
(h)
(i)
(j)
(k)
(l)
(m)
(n)
(o)
(p)

Mehta et al. Genome Biology 2010, 11:R5http://genomebiology.com/2010/11/1/R5
Page 14 of 17
either with 10 mmol/L 2,3-butanedione 2-monoxime(Calbiochem) for 15 minutes [65-67] or 1 μmol/L Jas-plakinolide (Calbiochem) for 60 minutes [68]. See Addi-tional file 5.
Fluorescence in situ hybridizationFor the two-dimensional FISH assay, fibroblasts were har-vested and placed in hypotonic buffer (0.075 mol/L KCl,wt/vol) for 15 minutes at room temperature. After cen-trifugation at 400 g, cells were fixed in 3:1 (vol/vol) meth-anol/acetic acid (vol/vol) for 1 hour on ice. The fixationstep was repeated between 5 and 7 times before cells weredropped onto humidified glass microscope slides. Theslides were aged at room temperature for 2 days or for anhour at 70°C before being subjected to dehydrationthrough an ethanol series of 70%, 90%, and 100%, for 5minutes each. The cells were denatured in 70% forma-mide, 2 × sodium saline citrate buffer (SSC), pH 7, at 70°Cfor 2 minutes. After denaturation, the slides were imme-diately plunged into ice-cold 70% ethanol for 5 minutesand then taken through the ethanol series and air-dried.
For three-dimensional FISH assay, fibroblasts werewashed in 1 × PBS and then fixed in 4% paraformalde-hyde (wt/vol) in 1 × PBS for 10 minutes. The cells werethen permeabilized with 0.5% Triton-X100 (vol/vol) and0.5% saponin (wt/vol) in 1 × PBS solution for 20 minutes.The cells were then incubated in 20% glycerol, 1 × PBSsolution for at least 30 minutes before being snap-frozenin liquid nitrogen. The cells were repeatedly frozen andthawed for up to 5 times. After the freeze/thaw cycles, thecells were then washed in 1 × PBS for at least 30 minutesand then incubated in 0.1 N HCl for 10 minutes fordepurination. The cells were then washed in 2 × SSC for15 minutes, with three changes of the buffer, and incu-bated in 50% formamide, 2 × SSC, at pH 7.0, overnight.For denaturation, cells were incubated at 73°C to 76°C in70% formamide, 2 × SSC, pH 7 solution for 3 minutes andthen were immediately transferred to 50% formamide, 2 ×SSC, pH 7 solution for 1 minute at the same temperature.Chromosome paints for HSA 10, 13, 18, and X wereamplified from flow-sorted whole-chromosome tem-plates and labelled with biotin-dUTP by DOP-PCR [69].The 200- to 400-μg chromosome paints, 7 μg of C0t-1DNA, and 3 μg of herring sperm were used per slide. Allother chromosome territories were delineated withdirectly labelled whole human chromosome paints(Qbiogene, Cambridge, UK). Probes were denatured at70°C for 10 minutes with reannealing of repetitivesequences at 37°C for 30 to 120 minutes. Hybridizationwas performed in a humified chamber for 18 to 24 hoursat 37°C. The slides were washed in three changes of 50%formamide, 2 × SSC, pH 7, at 45°C over a 15-minuteperiod, followed by three changes of 0.1 × SSC pre-warmed to 60°C over a 15-minute period at 45°C.
The slides were then transferred to 4 × SSC at roomtemperature. Slides hybridized with the in-house biotin-labelled probes were then incubated with a blocking solu-tion of 4% bovine serum albumin (BSA; Sigma Aldrich) of4 × SSC followed by detection with streptavidin-cyanine3 (Amersham Life Science Ltd; 1:200 dilution in 0.1%BSA/4 × SSC). The slides were washed in three changesof 4 × SSC/0.05% Tween 20 (vol/vol) for 5 minutes each.
Suppressing the expression of nuclear myosin 1β by interference RNATo suppress nuclear myosin 1β expression, young prolif-erating HDFs were seeded at 1 × 10⁴ cells per well in a 12-well plate. Transfection efficiency was previously deter-mined with siGLO-labelled siRNA to be more than 95%.The siRNA transfection was carried out with 2 μl Dhar-mafect 1 and 50 μl of either negative control (2 μmol/LON-TARGETplus Non-targeting Pool; Thermo Scien-tific) or myosin-targeting siRNA (2 μmol/L ON-TAR-GETplus SMART pool, human MYO1C; ThermoScientific Cat number L-015121-00) in 200 μl serum-freemedium. Complete medium was added to the transfec-tion mix to ensure that transfections were carried out inserum-containing medium with a final siRNA concentra-tion of 100 nmol/L per well/dish. Six hours after transfec-tion, the medium in the well was replaced with normalgrowth medium. At 24 hours after the first transfection, asecond identical transfection was performed to increasethe amount of suppression. Samples were collected at 48hours after final transfection and fixed for 2D FISH andindirect immunofluorescence.
Indirect immunofluorescenceDiluted rabbit anti-Ki-67 antibody (Dako; 1:1,500 dilu-tion in PBS/1% NCS), 40 μl, was placed on the slides afterFISH for 1 hour at 37°C. Slides were washed in PBS for 15minutes, with three changes. The slides were incubatedwith 40 μl of swine anti-rabbit secondary antibody conju-gated either to fluorescein isothiocynate (FITC, Dako) orto tetrarhodamine isothiocynate (TRITC, Dako) (1:30dilution in 1% NCS/PBS) for 1 hour at 37°C.
For anti-nuclear myosin 1β staining, cells were grownon glass coverslips and fixed in 1:1 (vol/vol) methanol/acetone for 10 minutes on ice. Rabbit anti-NM1β (Sigma-Aldrich) was diluted in PBS/1% NCS (1:200) and incu-bated with the fixed cells at room temperature for 1 hourafter washing thrice in PBS swine anti-rabbit conjugatedto tetrarhodamine isothiocyanate was incubated for 1hour at room temperature.
Thereafter the slides were washed in PBS with threechanges over a 15-minute period and mounted in self-sealing Vectashield mounting medium (Vector Laborato-ries) containing the counterstain 4, 6-diamidino-2-phe-

Mehta et al. Genome Biology 2010, 11:R5http://genomebiology.com/2010/11/1/R5
Page 15 of 17
nylindole (DAPI).
Image capture and analysisTwo-dimensional FISHDigital grey-scale images of random nuclei were capturedby using a Photometrics cooled charged-coupled device(CCD) camera, pseudocolored, and merged by using Dig-ital Scientific software, the Quips Pathvysion, Smart Cap-ture VP V1.4, a Leica fluorescence microscope (LeitzDMRB) with Plan Fluotar 100 × oil-immersion lens. Theimages were run through a simple erosion script in IPLabspectrum software, as described in [4]. The DAPI imageof the nucleus is outlined and divided into five concentricshells of equal area, the first shell being most peripheral,and the innermost denoting the interior of the nucleus.The script measures the pixel intensity of DAPI and thechromosome probe in these five shells. The probe signalwas normalized by dividing the percentage of the probeby the percentage of DAPI signal in each shell. Histo-grams were plotted with standard error bars representingthe standard error of the mean (± SEM). Simple statisticalanalyses were performed by using the unpaired two-tailed Student's t test with Microsoft Excel.
Three-dimensional FISHThe images of nuclei prepared by three-dimensionalFISH were captured by using a Nikon confocal laser scan-ning microscope (TE2000-S) equipped with a 60 ×/1.49Nikon Apo oil-immersion objective. The microscope wascontrolled by Nikon confocal microscope C1 (EZ-C1)software, version 3.00. Stacks of optical sections with anaxial distance of 0.2 μm were collected from 20 randomnuclei. Stacks of eight-bit grey-scale 2D images wereobtained with a pixel dwell of 4.56, and eight averageswere taken for each optical image. The positioning ofchromosomes in relation to the nuclear periphery wasassessed by performing measurements with Imaris Soft-ware (Bitplane Scientific Solutions), whereby the distancein micrometers between the geometric center of eachchromosome territory and the nearest nuclear periphery,as determined with DAPI staining, in three dimensions.These data were not normalized for size, but when thedata were normalized by dividing by the length of themajor axis + the length of the minor axis divided by 2, orthe length of the major axis alone, the relative positions ofthe individual chromosomes in frequency distributionsdid not change.
Frequency distribution curves were plotted with thedistance between the geometric center of chromosometerritory and the nearest nuclear periphery on the x-axisin actual micrometers, and the frequency, on the y-axis.
Additional material
AbbreviationsBDM: 2,3-butanedione 2-monoxime; FITC: fluorescein isothiocyanate; G0: qui-escence; HDF: human dermal fibroblast; I: interior; IM: intermediate; NCS: new-born calf serum; NMIβ: nuclear myosin Iβ; P: peripheral; TRITC: tetrarhodamineisothiocyanate.
Authors' contributionsISM provided material, experimentation, data collection and analysis, writingmanuscript, and intellectual input. MA provided some data for nuclear shapeand size and some intellectual input for siRNA. AH provided intellectual inputfor siRNA experimentation and writing of the manuscript. JMB participated indata analysis, writing the manuscript, and intellectual input.
AcknowledegmentsWe are grateful to Prof. Wendy Bickmore and Dr. Paul Perry for the simple ero-sion script for analysis of 2D-FISH data. We also thank Dr. Julio Masabanda for providing whole-chromosome flow-sorted templates. The authors also thank Drs. Ian Kill and Karen Meaburn for helpful suggestions concerning the manu-script.
Author Details1Centre for Cell and Chromosome Biology, Division of Biosciences, School of Health Sciences and Social Care, Brunel University, Kingston Lane, Uxbridge, UB8 3PH, UK and 2Brunel Institute for Cancer Genetics and Pharmacogenomics, Division of Biosciences, School of Health Sciences and Social Care, Brunel University, Kingston Lane, Uxbridge, UB8 3PH, UK
Additional data file 1
The chromosome position of chromosomes 10, 13, 18, and X 30 minutes after serum removal from a proliferating culture of human dermal fibro-blasts in a 2D study (1A-D), and the 3D analysis of the nuclear position of chromosomes 10 and X after 15 minutes after serum removal from a pro-liferating culture (1E).
Additional data file 2
Treating cells with 0.1% DMSO, in which the drugs are dissolved, does not interfere with the chromosome-repositioning response.
Additional data file 3
3D analyses of chromosome position for chromosomes 10 and X after treatment with GTPase inhibitor AG10 and serum removal (3A), after treat-ment with phalloidin oleate and serum removal (3B) and after treatment with BDM and serum removal (3C).
Additional data file 4
The DAPI distribution with each shell of the 2D erosion analysis script for each experiment performed, revealing that the DNA content did not alter after any of the treatments (4).
Additional data file 5
A table describing the inhibitors and drugs used in this study.
Received: 25 September 2009 Revised: 23 November 2009 Accepted: 13 January 2010 Published: 13 January 2010This article is available from: http://genomebiology.com/2010/11/1/R5© 2010 Mehta et al., licensee BioMed Central Ltd. This is an open access article distributed under the terms of the Creative Commons Attribution License (http://http:/creativecommons.org/licenses/by/2.0), which permits unrestricted use, distribution, and reproduction in any medium, provided the original workis properly cited.Genome Biology 2010, 11:R5

Mehta et al. Genome Biology 2010, 11:R5http://genomebiology.com/2010/11/1/R5
Page 16 of 17
References1. Cremer T, Cremer C: Rise, fall and resurrection of chromosome
territories: a historical perspective; part II: fall and resurrection of chromosome territories during the 1950s to 1980s; part III: chromosome territories and the functional nuclear architecture: experiments and models from the 1990s to the present. Eur J Histochem 2006, 50:223-272.
2. Meaburn KJ, Misteli T: Cell biology: chromosome territories. Nature 2007, 445:379-781.
3. Foster HA, Bridger JM: The genome and the nucleus: a marriage made by evolution: genome organisation and nuclear architecture. Chromosoma 2005, 114:212-229.
4. Boyle S, Gilchrist S, Bridger JM, Mahy NL, Ellis JA, Bickmore WA: The spatial organization of human chromosomes within the nuclei of normal and emerin-mutant cells. Hum Mol Genet 2001, 10:211-219.
5. Bridger JM, Boyle S, Kill IR, Bickmore WA: Re-modelling of nuclear architecture in quiescent and senescent human fibroblasts. Curr Biol 2000, 10:149-152.
6. Croft JA, Bridger JM, Boyle S, Perry P, Teague P, Bickmore WA: Differences in the localization and morphology of chromosomes in the human nucleus. J Cell Biol 1999, 145:1119-1131.
7. Meaburn KJ, Newbold RF, Bridger JM: Positioning of human chromosomes in murine cell hybrids according to synteny. Chromosoma 2008, 117:579-591.
8. Meaburn KJ, Levy N, Toniolo D, Bridger JM: Chromosome positioning is largely unaffected in lymphoblastoid cell lines containing emerin or A-type lamin mutations. Biochem Soc Trans 2005, 33:1438-1440.
9. Meaburn KJ, Cabuy E, Bonne G, Levy N, Morris GE, Novelli G, Kill IR, Bridger JM: Primary laminopathy fibroblasts display altered genome organization and apoptosis. Aging Cell 2007, 6:139-153.
10. Bolzer A, Kreth G, Solovei I, Koehler D, Saracoglu K, Fauth C, Muller S, Eils R, Cremer C, Speicher MR, Cremer T: Three-dimensional maps of all chromosomes in human male fibroblast nuclei and prometaphase rosettes. PLoS Biol 2005, 3:e157.
11. Mora L, Sanchez I, Garcia M, Ponsa M: Chromosome territory positioning of conserved homologous chromosomes in different primate species. Chromosoma 2006, 115:367-375.
12. Sun HB, Shen J, Yokota H: Size-dependent positioning of human chromosomes in interphase nuclei. Biophys J 2000, 79:184-190.
13. Habermann FA, Cremer M, Walter J, Kreth G, von Hase J, Bauer K, Wienberg J, Cremer C, Cremer T, Solovei I: Arrangements of macro- and microchromosomes in chicken cells. Chromosome Res 2001, 9:569-584.
14. Mayer R, Brero A, von Hase J, Schroeder T, Cremer T, Dietzel S: Common themes and cell type specific variations of higher order chromatin arrangements in the mouse. BMC Cell Biol 2005, 6:44.
15. Neusser M, Schubel V, Koch A, Cremer T, Muller S: Evolutionarily conserved, cell type and species-specific higher order chromatin arrangements in interphase nuclei of primates. Chromosoma 2007, 116:307-320.
16. Tanabe H, Habermann FA, Solovei I, Cremer M, Cremer T: Non-random radial arrangements of interphase chromosome territories: evolutionary considerations and functional implications. Mutat Res 2002, 504:37-45.
17. Fraser P, Bickmore W: Nuclear organization of the genome and the potential for gene regulation. Nature 2007, 447:413-417.
18. Parada L, Misteli T: Chromosome positioning in the interphase nucleus. Trends Cell Biol 2002, 12:425-432.
19. Osborne CS, Chakalova L, Brown KE, Carter D, Horton A, Debrand E, Goyenechea B, Mitchell JA, Lopes S, Reik W, Fraser P: Active genes dynamically colocalize to shared sites of ongoing transcription. Nat Genet 2004, 36:1065-1071.
20. Osborne CS, Chakalova L, Mitchell JA, Horton A, Wood AL, Bolland DJ, Corcoran AE, Fraser P: Myc dynamically and preferentially relocates to a transcription factory occupied by IgH. PLoS Biol 2007, 5:e192.
21. Spilianakis CG, Lalioti MD, Town T, Lee GR, Flavell RA: Interchromosomal associations between alternatively expressed loci. Nature 2005, 435:637-645.
22. Scheuermann MO, Tajbakhsh J, Kurz A, Saracoglu K, Eils R, Lichter P: Topology of genes and nontranscribed sequences in human interphase nuclei. Exp Cell Res 2004, 301:266-279.
23. Volpi EV, Chevret E, Jones T, Vatcheva R, Williamson J, Beck S, Campbell RD, Goldsworthy M, Powis SH, Ragoussis J, Trowsdale J, Sheer D: Large-scale chromatin organization of the major histocompatibility complex and other regions of human chromosome 6 and its response to interferon in interphase nuclei. J Cell Sci 2000, 113:1565-1576.
24. Mahy NL, Perry PE, Gilchrist S, Baldock RA, Bickmore WA: Spatial organization of active and inactive genes and noncoding DNA within chromosome territories. J Cell Biol 2002, 157:579-589.
25. Galiova G, Bartova E, Kozubek S: Nuclear topography of beta-like globin gene cluster in IL-3-stimulated human leukemic K-562 cells. Blood Cells Mol Dis 2004, 33:4-14.
26. Williams RR, Broad S, Sheer D, Ragoussis J: Subchromosomal positioning of the epidermal differentiation complex (EDC) in keratinocyte and lymphoblast interphase nuclei. Exp Cell Res 2002, 272:163-175.
27. Chambeyron S, Da Silva NR, Lawson KA, Bickmore WA: Nuclear re-organisation of the Hoxb complex during mouse embryonic development. Development 2005, 132:2215-2223.
28. Chambeyron S, Bickmore WA: Chromatin decondensation and nuclear reorganization of the HoxB locus upon induction of transcription. Genes Dev 2004, 18:1119-1130.
29. Szczerbal I, Foster HA, Bridger JM: The spatial repositioning of adipogenesis genes is correlated with their expression status in a porcine mesenchymal stem cell adipogenesis model system. Chromosoma 2009, 118:647-663.
30. Heard E, Bickmore W: The ins and outs of gene regulation and chromosome territory organisation. Curr Opin Cell Biol 2007, 19:311-316.
31. Kuroda M, Tanabe H, Yoshida K, Oikawa K, Saito A, Kiyuna T, Mizusawa H, Mukai K: Alteration of chromosome positioning during adipocyte differentiation. J Cell Sci 2004, 117:5897-5903.
32. Kim SH, McQueen PG, Lichtman MK, Shevach EM, Parada LA, Misteli T: Spatial genome organization during T-cell differentiation. Cytogenet Genome Res 2004, 105:292-301.
33. Foster HA, Abeydeera LR, Griffin DK, Bridger JM: Non-random chromosome positioning in mammalian sperm nuclei, with migration of the sex chromosomes during late spermatogenesis. J Cell Sci 2005, 118:1811-1820.
34. Hu Q, Kwon YS, Nunez E, Cardamone MD, Hutt KR, Ohgi KA, Garcia-Bassets I, Rose DW, Glass CK, Rosenfeld MG, Fu XD: Enhancing nuclear receptor-induced transcription requires nuclear motor and LSD1-dependent gene networking in interchromatin granules. Proc Natl Acad Sci USA 2008, 105:19199-19204.
35. Bartova E, Kozubek S: Nuclear architecture in the light of gene expression and cell differentiation studies. Biol Cell 2006, 98:323-336.
36. Bettinger BT, Gilbert DM, Amberg DC: Actin up in the nucleus. Nat Rev Mol Cell Biol 2004, 5:410-415.
37. Fomproix N, Percipalle P: An actin-myosin complex on actively transcribing genes. Exp Cell Res 2004, 294:140-148.
38. Grummt I: Life on a planet of its own: regulation of RNA polymerase I transcription in the nucleolus. Genes Dev 2003, 17:1691-1702.
39. Pestic-Dragovich L, Stojiljkovic L, Philimonenko AA, Nowak G, Ke Y, Settlage RE, Shabanowitz J, Hunt DF, Hozak P, de Lanerolle P: A myosin I isoform in the nucleus. Science 2000, 290:337-341.
40. Philimonenko VV, Zhao J, Iben S, Dingova H, Kysela K, Kahle M, Zentgraf H, Hofmann WA, de Lanerolle P, Hozak P, Grummt I: Nuclear actin and myosin I are required for RNA polymerase I transcription. Nat Cell Biol 2004, 6:1165-1172.
41. Vreugde S, Ferrai C, Miluzio A, Hauben E, Marchisio PC, Crippa MP, Bussi M, Biffo S: Nuclear myosin VI enhances RNA polymerase II-dependent transcription. Mol Cell 2006, 23:749-755.
42. Hofmann WA, Johnson T, Klapczynski M, Fan JL, de Lanerolle P: From transcription to transport: emerging roles for nuclear myosin I. Biochem Cell Biol 2006, 84:418-426.
43. Dundr M, Ospina JK, Sung MH, John S, Upender M, Ried T, Hager GL, Matera AG: Actin-dependent intranuclear repositioning of an active gene locus in vivo. J Cell Biol 2007, 179:1095-1103.
44. Chuang CH, Carpenter AE, Fuchsova B, Johnson T, de Lanerolle P, Belmont AS: Long-range directional movement of an interphase chromosome site. Curr Biol 2006, 16:825-831.
45. Cavellan E, Asp P, Percipalle P, Farrants AK: The WSTF-SNF2h chromatin remodeling complex interacts with several nuclear proteins in transcription. J Biol Chem 2006, 281:16264-16271.

Mehta et al. Genome Biology 2010, 11:R5http://genomebiology.com/2010/11/1/R5
Page 17 of 17
46. Guelen L, Pagie L, Brasset E, Meuleman W, Faza MB, Talhout W, Eussen BH, de Klein A, Wessels L, de Laat W, van Steensel B: Domain organization of human chromosomes revealed by mapping of nuclear lamina interactions. Nature 2008, 453:948-951.
47. Bridger JM, Kill IR, Lichter P: Association of pKi-67 with satellite DNA of the human genome in early G1 cells. Chromosome Res 1998, 6:13-24.
48. Bridger JM, Herrmann H, Munkel C, Lichter P: Identification of an interchromosomal compartment by polymerization of nuclear-targeted vimentin. J Cell Sci 1998, 111:1241-1253.
49. Gillespie PG, Albanesi JP, Bahler M, Bement WM, Berg JS, Burgess DR, Burnside B, Cheney RE, Corey DP, Coudrier E, de Lanerolle P, Hammer JA, Hasson T, Holt JR, Hudspeth AJ, Ikebe M, Kendrick-Jones J, Korn ED, Li R, Mercer JA, Milligan RA, Mooseker MS, Ostap EM, Petit C, Pollard TD, Sellers JR, Soldati T, Titus MA: Myosin-I nomenclature. J Cell Biol 2001, 155:703-704.
50. Holaska JM, Wilson KL: Multiple roles for emerin: implications for Emery-Dreifuss muscular dystrophy. Anat Rec A Discov Mol Cell Evol Biol 2006, 288:676-680.
51. Percipalle P, Fomproix N, Cavellan E, Voit R, Reimer G, Kruger T, Thyberg J, Scheer U, Grummt I, Farrants AK: The chromatin remodelling complex WSTF-SNF2h interacts with nuclear myosin 1 and has a role in RNA polymerase I transcription. EMBO Rep 2006, 7:525-530.
52. Bridger JM, Foeger N, Kill IR, Herrmann H: The nuclear lamina: both a structural framework and a platform for genome organization. FEBS J 2007, 274:1354-1361.
53. Mehta IS, Figgitt M, Clements CS, Kill IR, Bridger JM: Alterations to nuclear architecture and genome behavior in senescent cells. Ann N Y Acad Sci 2007, 1100:250-263.
54. Sanger JW, Sanger JM, Kreis TE, Jockusch BM: Reversible translocation of cytoplasmic actin into the nucleus caused by dimethyl sulfoxide. Proc Natl Acad Sci USA 1980, 77:5268-5272.
55. Starr DA: A nuclear-envelope bridge positions nuclei and moves chromosomes. J Cell Sci 2009, 122:577-586.
56. Haque F, Lloyd DJ, Smallwood DT, Dent CL, Shanahan CM, Fry AM, Trembath RC, Shackleton S: SUN1 interacts with nuclear lamin A and cytoplasmic nesprins to provide a physical connection between the nuclear lamina and the cytoskeleton. Mol Cell Biol 2006, 26:3738-3751.
57. Mehta IS, Elcock LS, Amira M, Kill IR, Bridger JM: Nuclear motors and nuclear structures containing A-type lamins and emerin: Is there a functional link? Biochem Soc Trans 2008, 36:1384-1388.
58. Bridger JM, Kill IR, O'Farrell M, Hutchison CJ: Internal lamin structures within G1 nuclei of human dermal fibroblasts. J Cell Sci 1993, 104:297-306.
59. Senol M, Ozerol IH, Patel AV, Skoner DP: The effect of Na+-K+ ATPase inhibition by ouabain on histamine release from human cutaneous mast cells. Mol Cell Biochem 2007, 294:25-29.
60. Moriya M, Linder MC: Vesicular transport and apotransferrin in intestinal iron absorption, as shown in the Caco-2 cell model. Am J Physiol Gastrointest Liver Physiol 2006, 290:G301-G309.
61. Soltoff SP: Evidence that tyrphostins AG10 and AG18 are mitochondrial uncouplers that alter phosphorylation-dependent cell signaling. J Biol Chem 2004, 279:10910-10918.
62. Munter S, Enninga J, Vazquez-Martinez R, Delbarre E, David-Watine B, Nehrbass U, Shorte SL: Actin polymerisation at the cytoplasmic face of eukaryotic nuclei. BMC Cell Biol 2006, 7:23.
63. Schoenenberger CA, Buchmeier S, Boerries M, Sutterlin R, Aebi U, Jockusch BM: Conformation-specific antibodies reveal distinct actin structures in the nucleus and the cytoplasm. J Struct Biol 2005, 152:157-168.
64. Laudadio RE, Millet EJ, Fabry B, An SS, Butler JP, Fredberg JJ: Rat airway smooth muscle cell during actin modulation: rheology and glassy dynamics. Am J Physiol Cell Physiol 2005, 289:C1388-C1395.
65. Cramer LP, Mitchison TJ: Myosin is involved in postmitotic cell spreading. J Cell Biol 1995, 131:179-189.
66. Fabian L, Troscianczuk J, Forer A: Calyculin A, an enhancer of myosin, speeds up anaphase chromosome movement. Cell Chromosome 2007, 6:1.
67. Soeno Y, Shimada Y, Obinata T: BDM (2,3-butanedione monoxime), an inhibitor of myosin-actin interaction, suppresses myofibrillogenesis in skeletal muscle cells in culture. Cell Tissue Res 1999, 295:307-316.
68. McDonald D, Carrero G, Andrin C, de Vries G, Hendzel MJ: Nucleoplasmic beta-actin exists in a dynamic equilibrium between low-mobility
polymeric species and rapidly diffusing populations. J Cell Biol 2006, 172:541-552.
69. Telenius H, Pelmear AH, Tunnacliffe A, Carter NP, Behmel A, Ferguson-Smith MA, Nordenskjold M, Pfragner R, Ponder BA: Cytogenetic analysis by chromosome painting using DOP-PCR amplified flow-sorted chromosomes. Genes Chromosomes Cancer 1992, 4:257-263.
doi: 10.1186/gb-2010-11-1-r5Cite this article as: Mehta et al., Rapid chromosome territory relocation by nuclear motor activity in response to serum removal in primary human fibro-blasts Genome Biology 2010, 11:R5