Embed Size (px)
Citation preview
Investigation of Link between Air Exchange Rate and Operational
Frequency of Cooling Systems to Create a Design Target for Natural Ventilation during the Early Stages of Building Design
K. Hiyama1,2,* and L. Glicksman2
1 Faculty of Engineering, Yamaguchi University, Ube, Yamaguchi, 755-8611, Japan 2 Department of Architecture, Massachusetts Institute of Technology, Cambridge, MA,
02139, USA
ABSTRACT The development of information technologies such as BEMS and BIM has allowed
access to an enormous amount of data related to building environment performance. It
is worth considering the active usage of these data to provide information to architects during the design of naturally ventilated buildings. Architects want to create clear
design targets for air exchange rates through the use of natural ventilation. However,
the air exchange rate, in and of itself, does not explain the effects of energy savings and environmental improvements due to natural ventilation. Data indicating the extent
to which an improvement in the air exchange rate improves the building performance,
therefore, can help architects craft a rational design target for natural ventilation. The link between the air exchange rate and the operational frequency of the cooling
system is useful for this purpose. In this study, we developed a method for
determining links among natural air ventilation databases. A link can be defined by the approximation formula using a Weibull distribution. In addition, it is expected that
naturally ventilated buildings can be categorized according to the parameters of the
Weibull distribution into four types with different levels of adequate air exchange rate. This categorization helps architects craft a rational design strategy early in the design
stage.
KEYWORDS Data Mining, Natural Ventilation, Air Exchange Rate, Adaptive Comfort Model
INTRODUCTION Building shape has a significant impact on Green Building design, particularly in
terms of natural ventilation. A building’s shape is typically sketched and discussed at the early stages of building design. It is important to set a design target for natural
ventilation at this early stage so that architects can incorporate natural ventilation into
* Corresponding author email: [email protected]
107
the building design, while meeting the other design targets. Simplified simulation
software programs such as CoolVent (Menchaca-B and Glicksman 2008) allow architects and engineers to predict the effects of natural ventilation. This knowledge is
useful in determining which natural ventilation strategy—single-side ventilation,
cross ventilation or stack ventilation—should be employed to meet the design target for ventilation. However, there is no consensus on how to actually develop this design
target. One common method is to implement an optimization analysis to determine
the optimal air exchange rate in terms of energy savings, occupant satisfactions and minimized cost. This optimization analysis, however, requires significant effort that
often prevents architects and engineers from implementing it. Furthermore, the
building information at this early design stage is often insufficient to carry out the sophisticated energy simulations necessary for the optimization analysis. As a result,
the various targets, e.g., air exchange rate, are often based on the architects’
experience or through case research. This makes it difficult to verify their accuracy. The air exchange rate determined by the architect might be too small to achieve the
effects as intended or too large to be cost-effective. Therefore, the links between air
exchange rates and the effects of natural ventilation obtained through monitoring existing buildings can provide useful information for determining early stage building
design targets.
In this study, the operational frequency of a cooling system throughout the year is used to estimate the effect of natural ventilation. Architects can easily understand this
effect on natural ventilation and incorporate it into their design. For example, we can
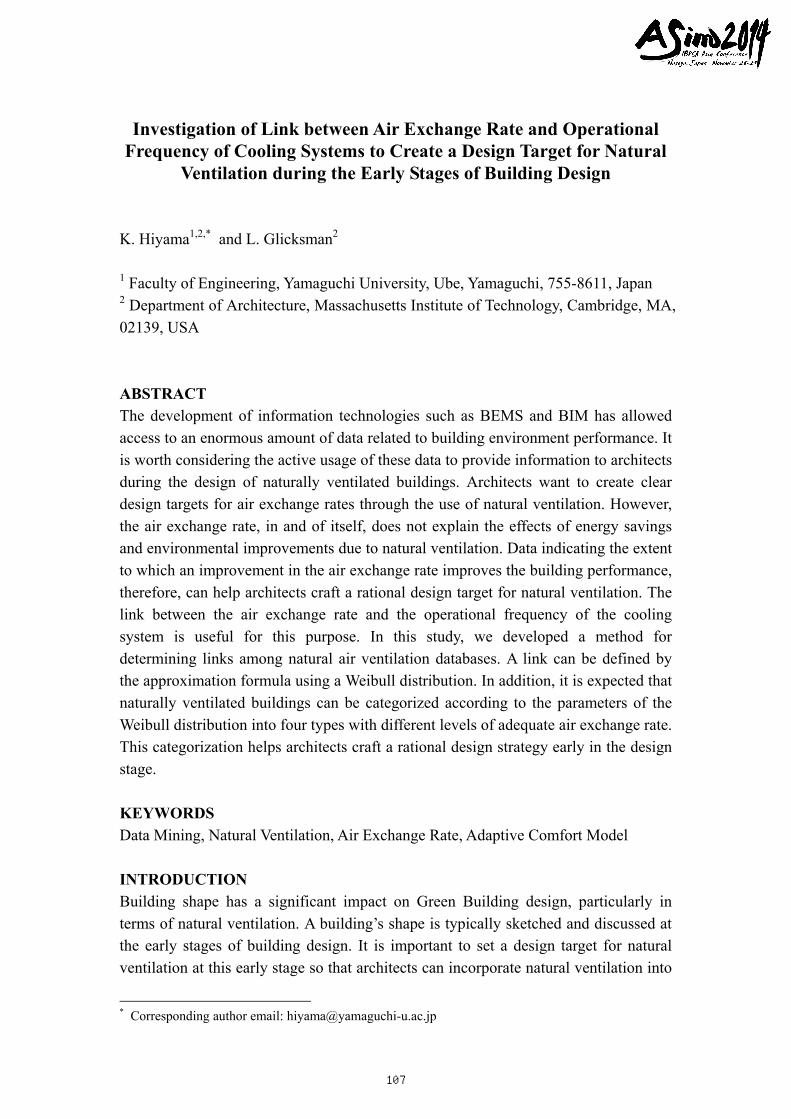
separate buildings into two categories based on this estimate. In the first category, i.e., where an enhancement in air exchange rate reduces the operational frequency of the
cooling system (Figure1), it is expected that significant improvement in building
ventilation can be achieved through natural ventilation. In this case, natural ventilation itself can reduce energy consumption and improve the satisfaction of the
occupants by reducing the operational frequency of the cooling system. In this context,
while mixed-mode ventilation that enables a combination of natural ventilation and mechanical cooling systems might improve the effect, architects can plan natural
ventilation strategies without mixed-mode operation to avoid the complexity and the
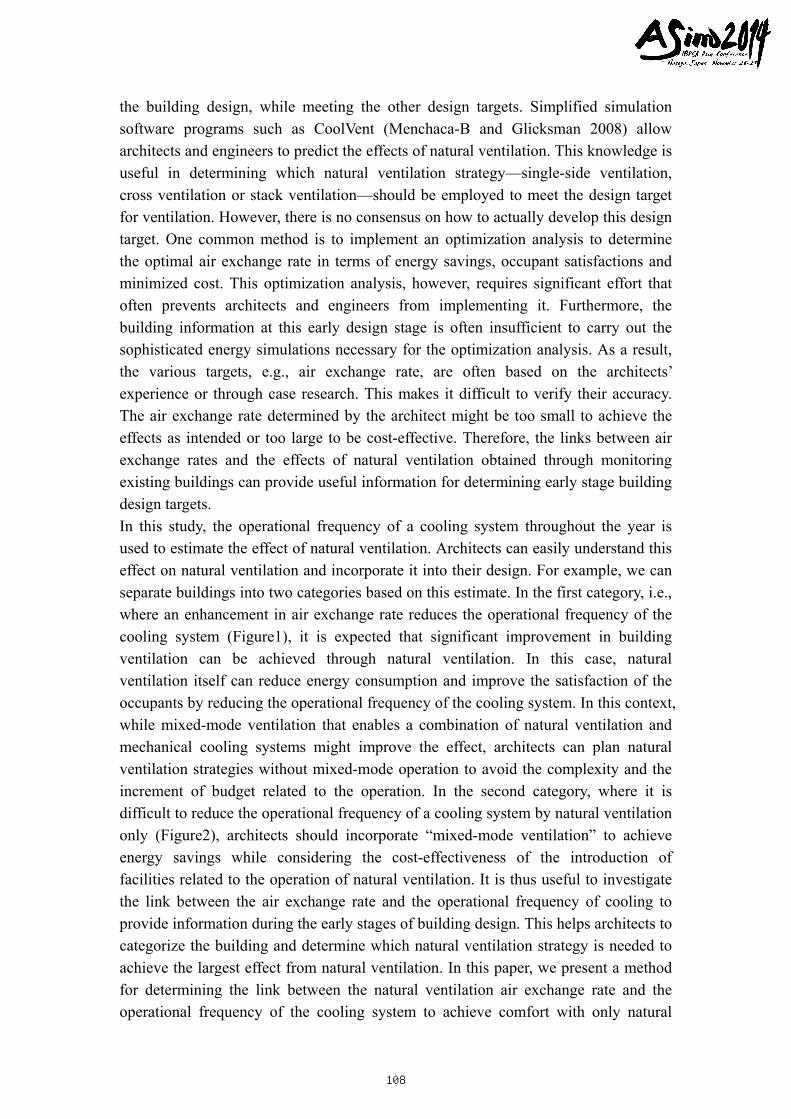
increment of budget related to the operation. In the second category, where it is difficult to reduce the operational frequency of a cooling system by natural ventilation
only (Figure2), architects should incorporate “mixed-mode ventilation” to achieve
energy savings while considering the cost-effectiveness of the introduction of facilities related to the operation of natural ventilation. It is thus useful to investigate
the link between the air exchange rate and the operational frequency of cooling to
provide information during the early stages of building design. This helps architects to categorize the building and determine which natural ventilation strategy is needed to
achieve the largest effect from natural ventilation. In this paper, we present a method
for determining the link between the natural ventilation air exchange rate and the operational frequency of the cooling system to achieve comfort with only natural
108
ventilation. As a first step of this study, we use a database based on building
performance simulations with a basic building model to identify the general law of the relationship between air exchange rate and operational frequency. In future studies,
the feasibility of this general law will be cross-referenced with existing building
databases.
0
20
40
60
80
100
0 2 4 6 8 10 12% of Year in Adap
tive
Comfort Zone
air exchange rate [ac/h]
0
20
40
60
80
100
0 2 4 6 8 10 12% of Year in Adap
tive
Comfort Zone
air exchange rate [ac/h]
RESEARCH APPROACH The overall goal of this study is to provide a data mining methodology that
streamlines a building database from a pile of inordinate data to useful design information that can assist architects in creating rational design targets. In this paper,
we focus on the methodology for naturally ventilated building design.
The links between the operational frequencies and the air exchange rates observed in existing buildings, however, cannot be directly used to create a design target for a new
building. It is helpful to draw an approximate curve to describe the features of the link
between these two parameters. These features can be used to categorize naturally ventilated buildings. The categorization helps architects consider to what extent their
building project demands improvement in the air exchange rate to achieve the largest
effects of natural ventilation. In this study, a general form of the approximation formula was investigated first.
Moreover, there are typically differences in the design conditions that affect this
approximation formula. Adjustments must be made to account for variations such as climate condition, internal heat, building orientation, window to floor area percentage
and thermal mass. This study also seeks to establish a methodology based on the
sensitivity analyses of the various conditions that affect natural ventilation to guide the adjustments.
BASIC BUILDING MODEL FOR THE CASE STUDIES A basic office building model is established. An approximation formula is
Figure 2. Image of the link between air exchange rate and operational frequency in
Category II. A small amount of air exchange, 1-2 ac/h, cannot effectively
increase the % of year using NV alone.
Figure 1. Image of the link between air exchange rate and operational frequency in
Category I. Even a small amount of air exchange, 1-2 ac/h, can effectively increase
the % of year using NV alone.
109
investigated based on the simulation results using this simple office model. In this
formula, the operational frequency of the cooling system is selected as the objective variable. The air exchange rate is the primary explanatory variable. Other variables,
such as the amount of internal heat, the window area and the floor area all affect the
natural ventilation. Thus, these variables will be used to adjust the parameter in the formula in future studies. Ultimately, this study should include the air change rate
fluctuations due to pressure effects of wind. In addition, the increment in % of year in
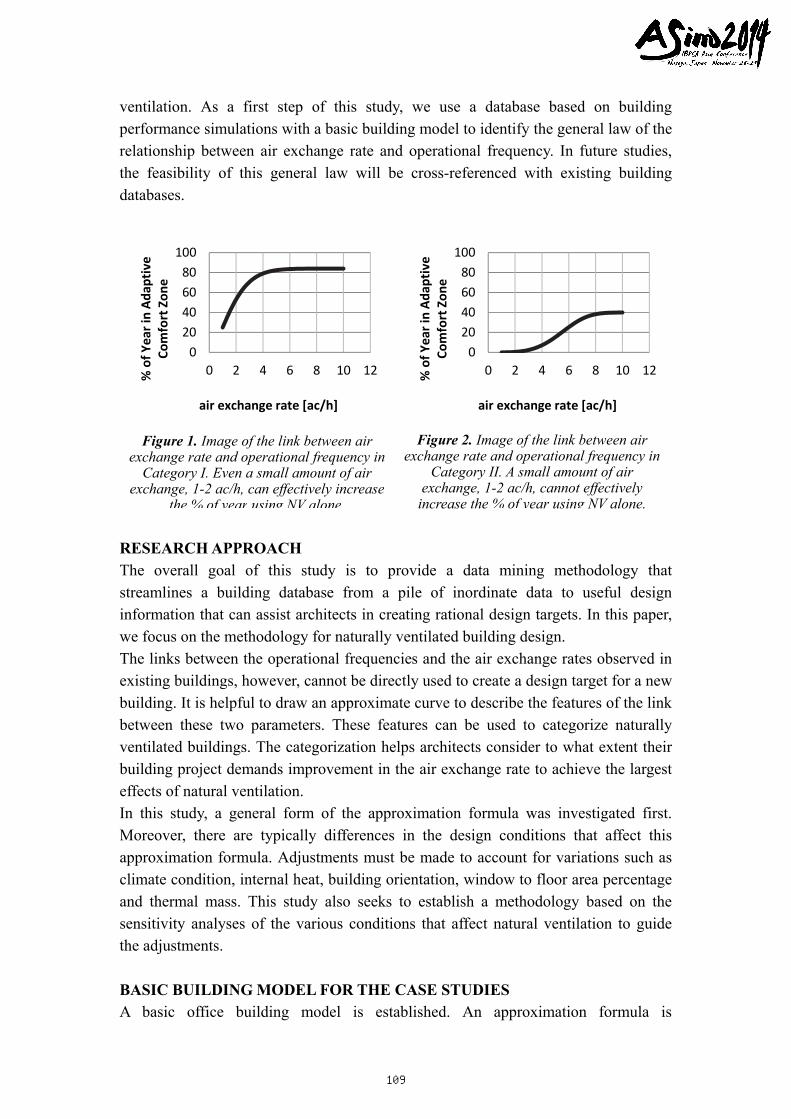
comfort zone achieved by night cooling should also be discussed. The basic building model is a three-story office building model. The area of each floor
is 25 x 25 m2 and the floor height is 3.5 m, including the plenum space. Figure 3
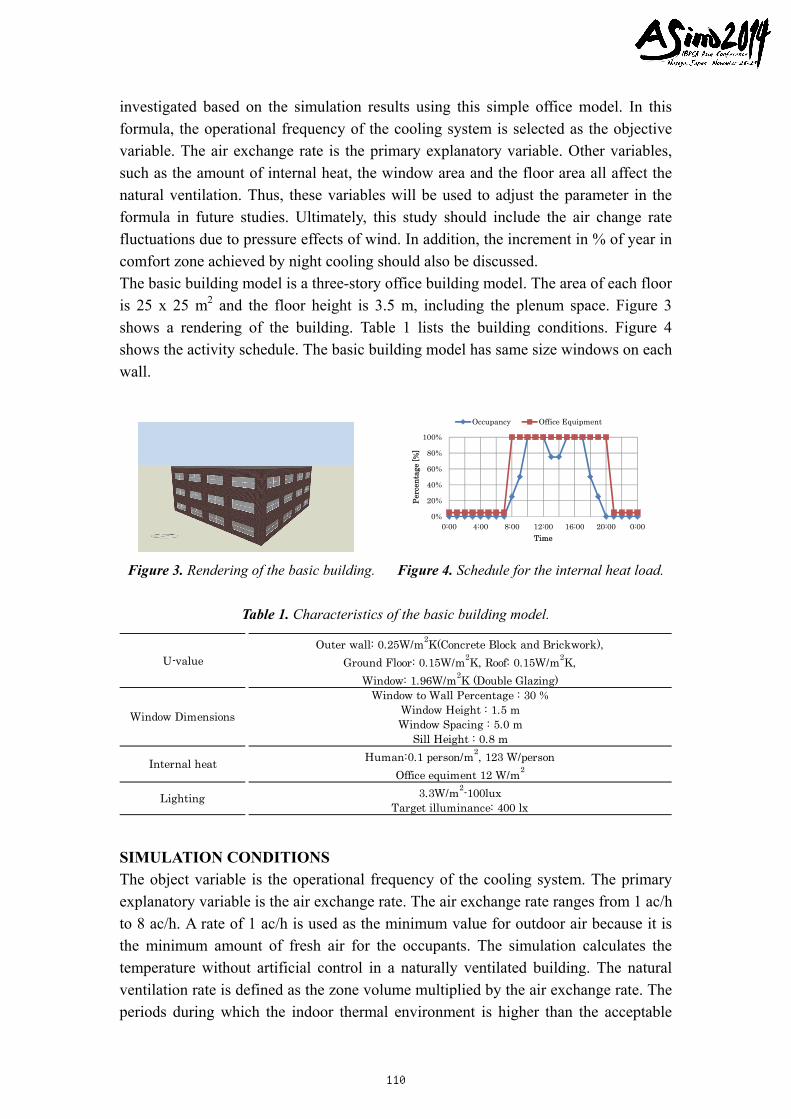
shows a rendering of the building. Table 1 lists the building conditions. Figure 4 shows the activity schedule. The basic building model has same size windows on each
wall.
0%
20%
40%
60%
80%
100%
0:00 4:00 8:00 12:00 16:00 20:00 0:00
Per
cen
tage
[%]
Time
Occupancy Office Equipment
Figure 3. Rendering of the basic building. Figure 4. Schedule for the internal heat load.
Table 1. Characteristics of the basic building model.
U-valueOuter wall: 0.25W/m
2K(Concrete Block and Brickwork),
Ground Floor: 0.15W/m2K, Roof: 0.15W/m
2K,
Window: 1.96W/m2K (Double Glazing)
Window Dimensions
Window to Wall Percentage : 30 %Window Height : 1.5 mWindow Spacing : 5.0 m
Sill Height : 0.8 m
Internal heatHuman:0.1 person/m
2, 123 W/person
Office equiment 12 W/m2
Lighting 3.3W/m2-100lux
Target illuminance: 400 lx
SIMULATION CONDITIONS The object variable is the operational frequency of the cooling system. The primary
explanatory variable is the air exchange rate. The air exchange rate ranges from 1 ac/h
to 8 ac/h. A rate of 1 ac/h is used as the minimum value for outdoor air because it is the minimum amount of fresh air for the occupants. The simulation calculates the
temperature without artificial control in a naturally ventilated building. The natural
ventilation rate is defined as the zone volume multiplied by the air exchange rate. The periods during which the indoor thermal environment is higher than the acceptable
110
temperature in a naturally ventilated building are regarded as periods that require
cooling operations. The operational frequency of the cooling system is calculated during normal business hours, 8:00 to 18:00, over the course of the year. The
operative temperature is used to represent the indoor thermal environment. The
adaptive comfort zone is defined as the acceptable temperature range around the optimum comfort temperature Tcomf in a naturally ventilated building and specified as
±3.5 for 80% general acceptability (de Dear and Brager 2002).
Tcomf = 0.31 x Ta,out + 17.8 (1)
where Ta,out is the monthly average of the daily average outdoor dry bulb temperatures (Levitt et al. 2013).
We assume that the operational frequency of the cooling system is equal to the
cumulative probability of the period when the indoor operative temperature is above the adaptive comfort zone. The simulation is performed using a software; Design
Builder. This software calculates the internal operative temperature as the mean of the
internal air and mean radiant temperature (MRT). The MRT of the zone is calculated by assuming that the person is in the center of the zone, with no weighting for any
particular surface.
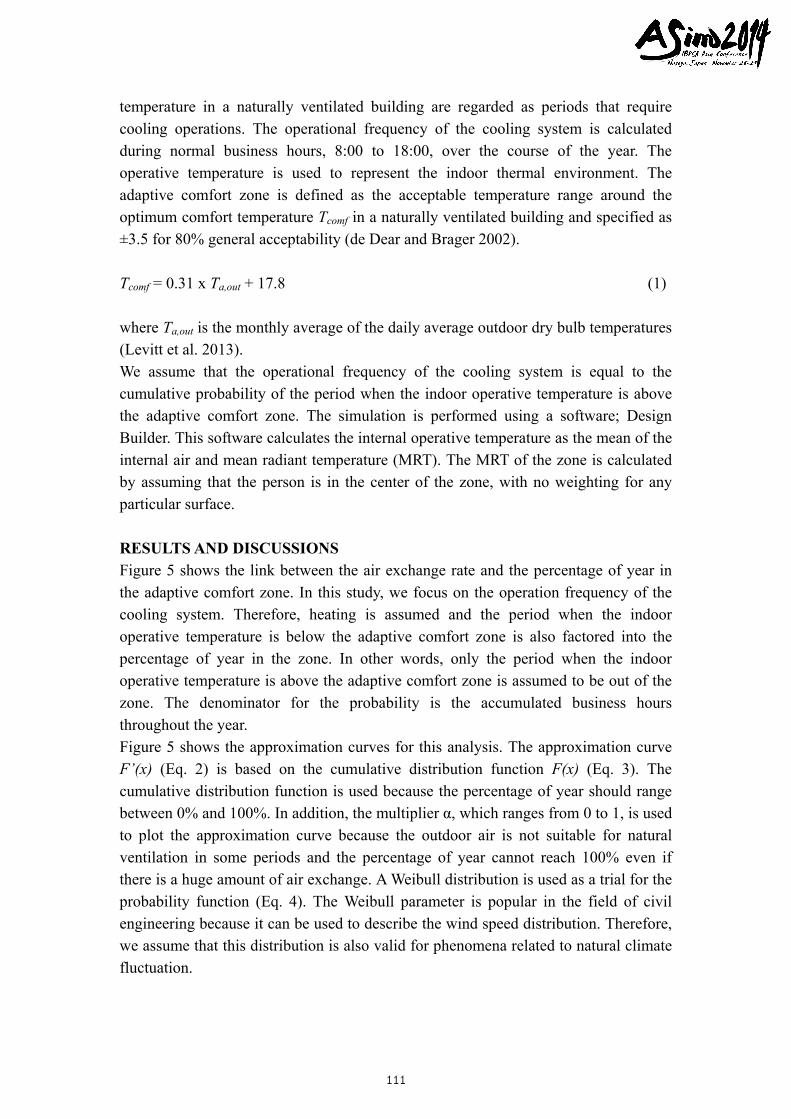
RESULTS AND DISCUSSIONS Figure 5 shows the link between the air exchange rate and the percentage of year in
the adaptive comfort zone. In this study, we focus on the operation frequency of the cooling system. Therefore, heating is assumed and the period when the indoor
operative temperature is below the adaptive comfort zone is also factored into the
percentage of year in the zone. In other words, only the period when the indoor operative temperature is above the adaptive comfort zone is assumed to be out of the
zone. The denominator for the probability is the accumulated business hours
throughout the year. Figure 5 shows the approximation curves for this analysis. The approximation curve
F’(x) (Eq. 2) is based on the cumulative distribution function F(x) (Eq. 3). The
cumulative distribution function is used because the percentage of year should range between 0% and 100%. In addition, the multiplier α, which ranges from 0 to 1, is used
to plot the approximation curve because the outdoor air is not suitable for natural
ventilation in some periods and the percentage of year cannot reach 100% even if there is a huge amount of air exchange. A Weibull distribution is used as a trial for the
probability function (Eq. 4). The Weibull parameter is popular in the field of civil
engineering because it can be used to describe the wind speed distribution. Therefore, we assume that this distribution is also valid for phenomena related to natural climate
fluctuation.
111
0
10
20
30
40
50
60
70
80
90
100
0 2 4 6 8 10 12
% of Year in
Adap
tive Comfort
Zone
air exchange rate [ac/h]
0
10
20
30
40
50
60
70
80
90
100
0 2 4 6 8 10 12% of Year in
Adap
tive Comfort Zone
air exchange rate [ac/h]
0
10
20
30
40
50
60
70
80
90
100
0 2 4 6 8 10 12% of Year in
Adap
tive Comfort Zone
air exchange rate [ac/h]
a) Boston b) Miami c) Los Angeles
(0.84, 1.22, 2.03) (0.30, 2.15, 5.77) (0.95, 2.66, 4.11) Figure 5. Simulation results and the respective approximation curves.
Values in the parentheses show parameters α, k and λ, respectively. The data points are the
calculated cases shown with a best fit distribution
)()(' xFxF (2)
x
duufxF0
)()( (3)
kkxxk
kxf
exp),;(1
(4)
In the equation above, f(x) is the probability distribution, α is the multiplier, k is the shape parameter and λ is the scale parameter.
Parameters α, k and λ, are calculated by the least squares method. The approximation
curves fit well with the simulation results in all cases. Using these curves, the naturally ventilated buildings can be categorized as follows:
Category I (e.g., Fig 5a): In this category, buildings have capabilities to significantly
increase the percentage of year that the indoor thermal environment is in the adaptive comfort
zone, even with a small amount of air exchange rate, e.g., 1-2 ac/h. Although mixed-mode
ventilation is recommended to achieve more effect from natural ventilation, the introduction
of simple natural ventilation facilities alone, such as operable windows, can save energy and
improve occupant satisfaction. It is worth considering natural ventilation strategies even
though only a small improvement in air exchange rate can be expected.
Category I’ (special cases in Category I): The buildings have capabilities to eliminate the
cooling systems when the air exchange rate is high, e.g., 8 ac/h. It is worth considering
“affirmative” natural ventilation strategies, such as solar chimneys, to increase the amount of
air exchange rate as much as possible.
Category II (e.g., Fig 5b): In this category, it may be difficult to increase the percentage of
year that the indoor thermal environment is in the adaptive comfort zone using only natural
ventilation, with a small amount of air exchange rate, e.g., 1-2 ac/h. Mixed mode ventilation
112
is necessary to achieve energy savings by natural ventilation in these cases.
Category II’ (e.g., Fig 5c; special cases in Category II): The buildings have capabilities to
eliminate the cooling systems when the air exchange rate is high, e.g., 8 ac/h. It is worth
considering “affirmative” natural ventilation strategies with full examinations to obtain a
large improvement in the air exchange rate.
This categorization is useful for identifying natural ventilation strategies during early
stage building design. If the necessary parameters can be obtained at the early design stage, the architects can set more realistic target values for air exchange rate using
natural ventilation strategies.
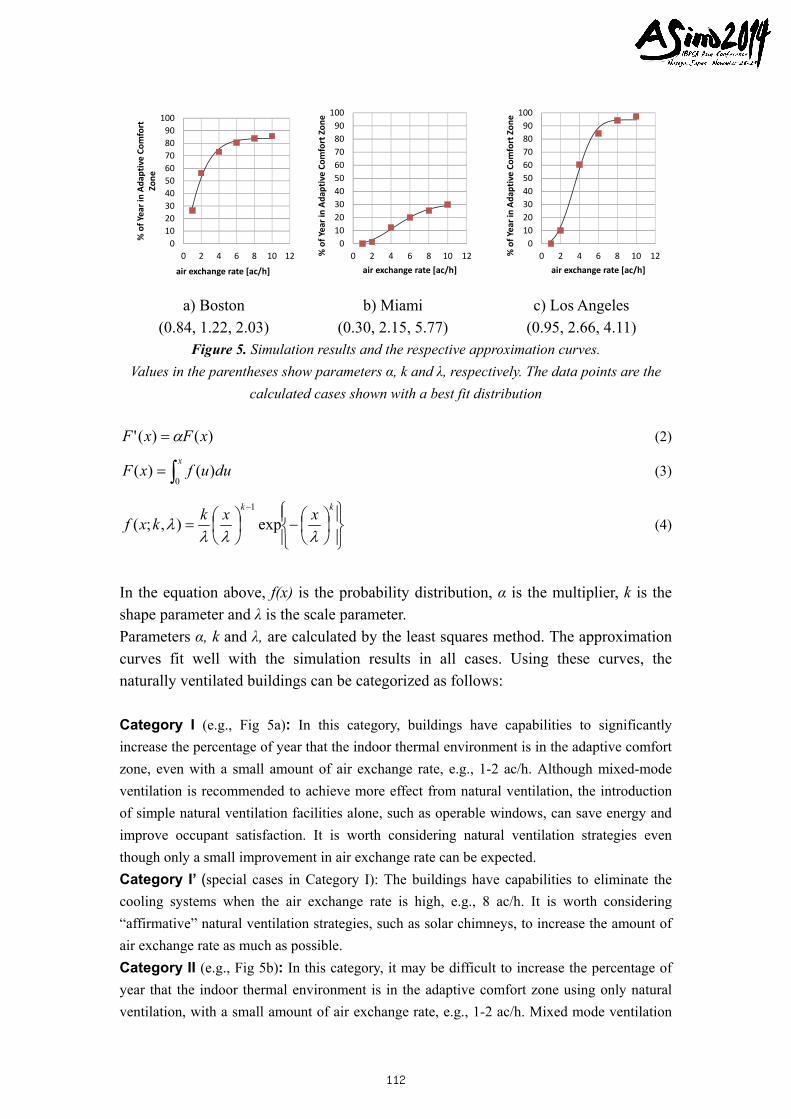
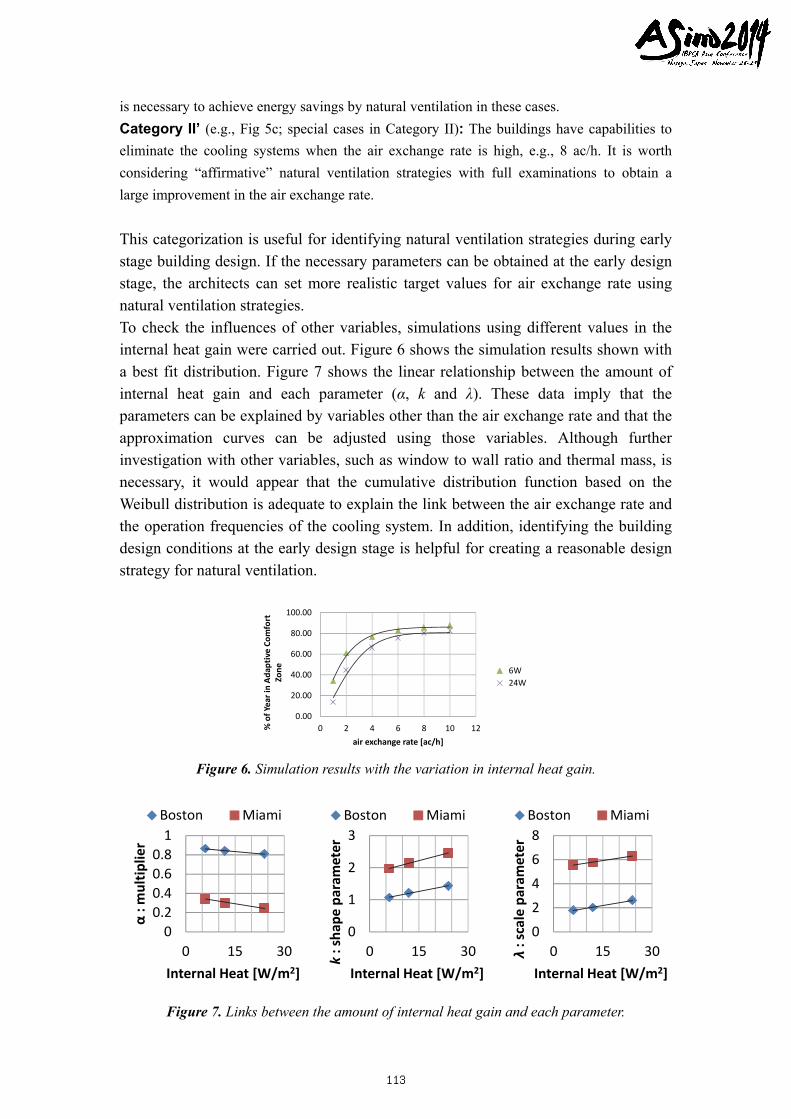
To check the influences of other variables, simulations using different values in the internal heat gain were carried out. Figure 6 shows the simulation results shown with
a best fit distribution. Figure 7 shows the linear relationship between the amount of
internal heat gain and each parameter (α, k and λ). These data imply that the parameters can be explained by variables other than the air exchange rate and that the
approximation curves can be adjusted using those variables. Although further
investigation with other variables, such as window to wall ratio and thermal mass, is necessary, it would appear that the cumulative distribution function based on the
Weibull distribution is adequate to explain the link between the air exchange rate and
the operation frequencies of the cooling system. In addition, identifying the building design conditions at the early design stage is helpful for creating a reasonable design
strategy for natural ventilation.
0.00
20.00
40.00
60.00
80.00
100.00
0 2 4 6 8 10 12% of Year in
Adap
tive Comfort
Zone
air exchange rate [ac/h]
6W
24W
Figure 6. Simulation results with the variation in internal heat gain.
0
0.2
0.4
0.6
0.8
1
0 15 30
α : m
ultiplier
Internal Heat [W/m2]
Boston Miami
0
1
2
3
0 15 30
k: shap
e param
eter
Internal Heat [W/m2]
Boston Miami
0
2
4
6
8
0 15 30λ: scale param
eter
Internal Heat [W/m2]
Boston Miami
Figure 7. Links between the amount of internal heat gain and each parameter.
113
CONCLUSIONS The goal of this study was to establish a methodology for data mining of existing building designs and monitoring data. It is expected that the knowledge gained in this
study can be used by architects to define building categories in their projects based on
the link between the air exchange rate and operation frequencies of the cooling system for similar locations and building designs. This categorization is helpful for
implementing natural ventilation strategies, such as introduction of mixed-mode
ventilation and solar chimneys. Throughout this case study, it was shown that the operational frequency of the cooling
system can be described with an approximation curve based on the Weibull
distribution using the air exchange rate as the design value. In addition, the effects of other design variables, e.g., internal heat gain in this case study, were verified.
Although the amount of internal heat generation affects the system, this influence can
be attenuated to the approximation curve by adjusting its parameters. The parameters in the approximation curve have linear relationships with the amount of internal heat
generation. The approximation curves can be adjusted by the amount of heat
generation, even in a design project with different internal heat conditions. In future work, we will perform sensitivity analyses using other design variables such
as outdoor climate, thermal mass, window to wall ratio and window properties, with
varying orientations and materials. We will also search for explanatory variables that can be used to further adjust the parameters of the approximation curves. Finally, we
will search for conditions that can group data samples to obtain higher accuracy
approximation curves.
ACKNOWLEDGEMENTS This work was supported by JSPS KAKENHI Grant Number 25709051.
REFERENCES de Dear, Richard J., and Gail S. Brager. 2002. "Thermal comfort in naturally ventilated
buildings: revisions to ASHRAE Standard 55." Energy and Buildings no. 34
(6):549-561.
Levitt, Brendon, M. Susan Ubbelohde, George Loisos, and Nathan Brown. 2013. Thermal
Autonomy as Metric and Design Process. Pushing the Boundaries: Net positive
Buildings, SB13 Vancouver, at Vancouver.
Menchaca-B, Maria-Alejandra, and Leon Glicksman. 2008. COOLVENT: A Multizone
Airflow and Thermal Analysis Simulator for Natural Ventilation in Buildings.
SimBuild 2008, July 30 - August 1, at Berkeley, Calfornia, USA.
114