Embed Size (px)
Citation preview
20
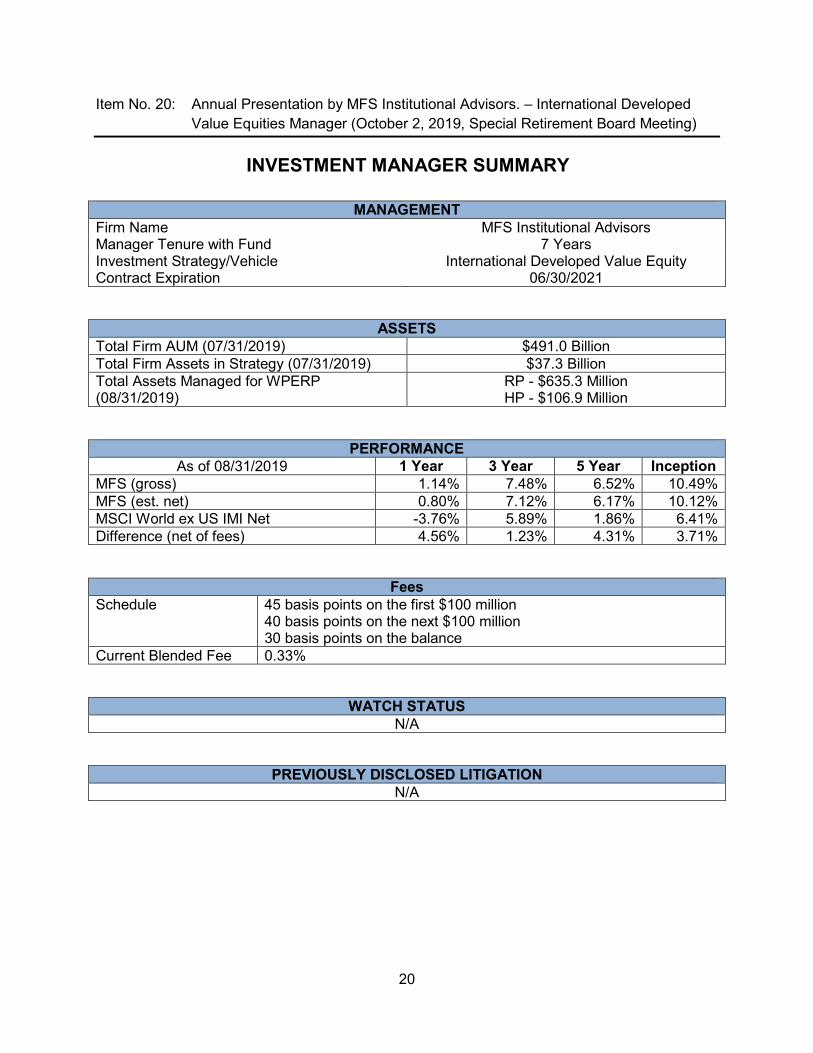
Item No. 20: Annual Presentation by MFS Institutional Advisors. – International Developed Value Equities Manager (October 2, 2019, Special Retirement Board Meeting)
INVESTMENT MANAGER SUMMARY
MANAGEMENT Firm Name MFS Institutional Advisors Manager Tenure with Fund 7 Years Investment Strategy/Vehicle International Developed Value Equity Contract Expiration 06/30/2021
ASSETS Total Firm AUM (07/31/2019) $491.0 Billion Total Firm Assets in Strategy (07/31/2019) $37.3 Billion Total Assets Managed for WPERP (08/31/2019)
RP - $635.3 Million HP - $106.9 Million
PERFORMANCE As of 08/31/2019 1 Year 3 Year 5 Year Inception
MFS (gross) 1.14% 7.48% 6.52% 10.49% MFS (est. net) 0.80% 7.12% 6.17% 10.12% MSCI World ex US IMI Net -3.76% 5.89% 1.86% 6.41% Difference (net of fees) 4.56% 1.23% 4.31% 3.71%
Fees Schedule 45 basis points on the first $100 million
40 basis points on the next $100 million 30 basis points on the balance
Current Blended Fee 0.33%
WATCH STATUS N/A
PREVIOUSLY DISCLOSED LITIGATION N/A
The Global Industry Classifi cation Standard (GICS®) was developed by and/or is the exclusive property of MSCI, Inc. and S&P Global Market Intelligence Inc. (“S&P Global Market Intelligence”). GICS is a service mark of MSCI and S&P Global Market Intelligence and has been licensed for use by MFS.
MFS® International Intrinsic Value Equity
Presented to
Water and Power Employees' Retirement Plan02 October 2019
19964.12 ex31OCT19FOR ONE-ON-ONE USE ONLY
Effective 1 June 2019, the name of the MFS International Value Equity strategy changed to the MFS International Intrinsic Value Equity strategy. There was no change to the investment strategy or objective.
MFS® International Intrinsic Value Equity ii299-I-CT-IIV-02Oct19.ii
Presenters
John W. Mahoney, CFA Director, Investment Products
As an Investment Product Specialist, works closely with the portfolio management teams and is responsible for communicating investment philosophy, process and the positioning of MFS investment strategies
Joined MFS in 2005; previous positions include Investment Product Analyst; Client Report Specialist; Asset Control Specialist
Previous experience includes 1 year as Cash Control Analyst at State Street Bank
FINRA License: Series 7 & 63
Affiliations include CFA Institute, CFA Society of Boston
Bentley University, BS, Financial Management Association National Honors Society
Carolyn Lucey, CIMA Director, Relationship Management
As a Relationship Manager, works with clients across the United States and is responsible for assisting them with theirlong-term investment strategy. Meets with clients to share investment insights, evaluate market opportunities and discuss any investment and business-related issues.
Joined MFS in 1998; previous positions include Investment Director for Private Portfolio Services; Vice President,Director of Product Management; Assistant Vice President, Domestic Equity Product Manager
Previous experience includes 1 year as Product Manager at Van Kampen American Capital; 6 years as ProductManager at John Hancock Funds; 2 years as Associate at Putnam Investments
Affiliations include Investment & Wealth Institute
Manhattanville College, BA
18SEP19
MFS® International Intrinsic Value Equity iii299-I-CT-IIV-02Oct19.iii
Table of Contents
Contents Tab
Section A: Company Overview 1
Section B: Investment Process and Discipline 2
Section C: Market Overview 3
Section D: Performance Review 4
Section E: Portfolio Review and Characteristics 5
Section F: Fee Schedule 6
Section G: Glossary of Investment Terms 7
Company Overview
MFS® International Intrinsic Value Equity 1299-I-CT-IIV-02Oct19.1
Assets under management (USD) as of 31 July 2019:
Total firm AUM:
491 billion USD
Total MFS International Intrinsic Value Equity strategy AUM:
37.3 billion USD
Personnel Changes
On March 25, 2019, Nola Kopfer, CFA, joined MFS as director of Global Trading. In this role, she has oversight of the firm's global equity and global fixed income trading functions, leading a team of trading professionals across the firm's three trading desks in Boston, London and Toronto.
She joins MFS from UBS Securities, LLC, where she most recently was an executive director and head of Americas Equities Electronic Sales Trading. She previously worked for Goldman, Sachs & Co. for 14 years in multiple roles where she helped champion and lead the implementation of electronic trading, including eight years managing the firm's Boston-based electronic sales trading team. She holds a Bachelor of Arts in Economics from Columbia University and holds the CFA charter as a member of the CFA Institute.
MFS Corporate Update
MFS® International Intrinsic Value Equity 2299-I-CT-IIV-02Oct19.2
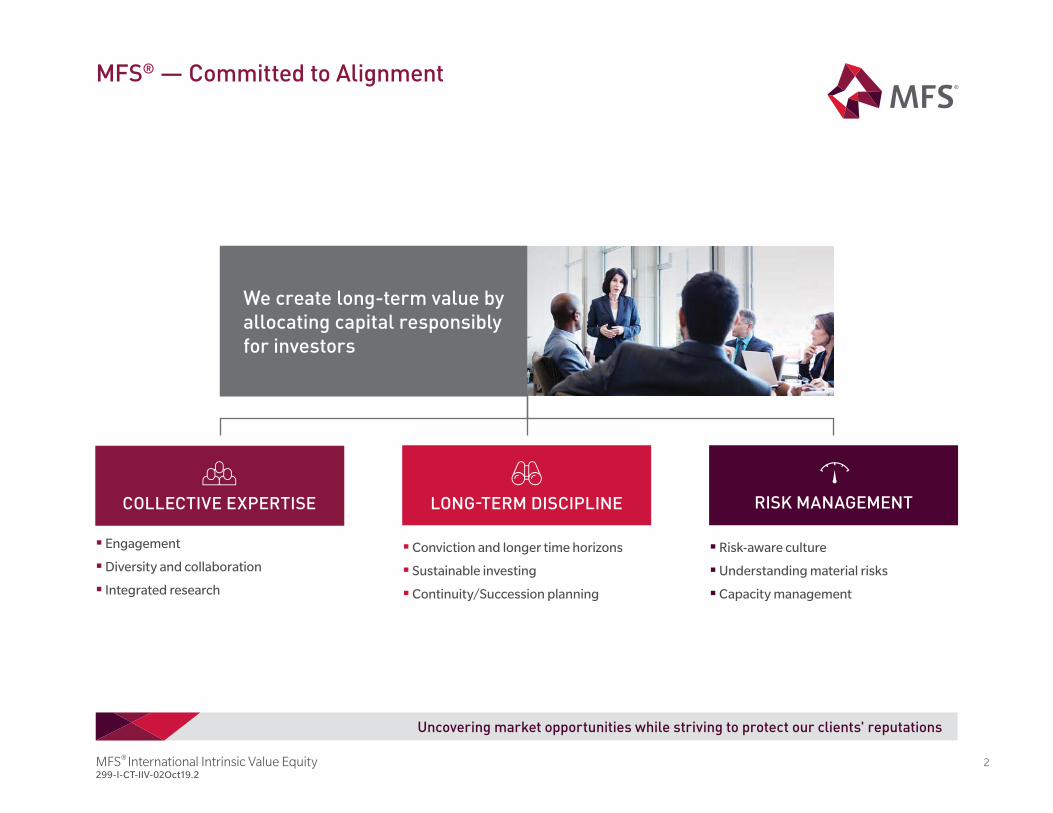
We create long-term value by
allocating capital responsibly
for investors
RISK MANAGEMENTLONG-TERM DISCIPLINE
Conviction and longer time horizons
Sustainable investing
Continuity/Succession planning
Engagement
Diversity and collaboration
Integrated research
Risk-aware culture
Understanding material risks
Capacity management
MFS® — Committed to Alignment
COLLECTIVE EXPERTISE
Uncovering market opportunities while striving to protect our clients' reputations
MFS® International Intrinsic Value Equity 3299-I-CT-IIV-02Oct19.3
41718.4
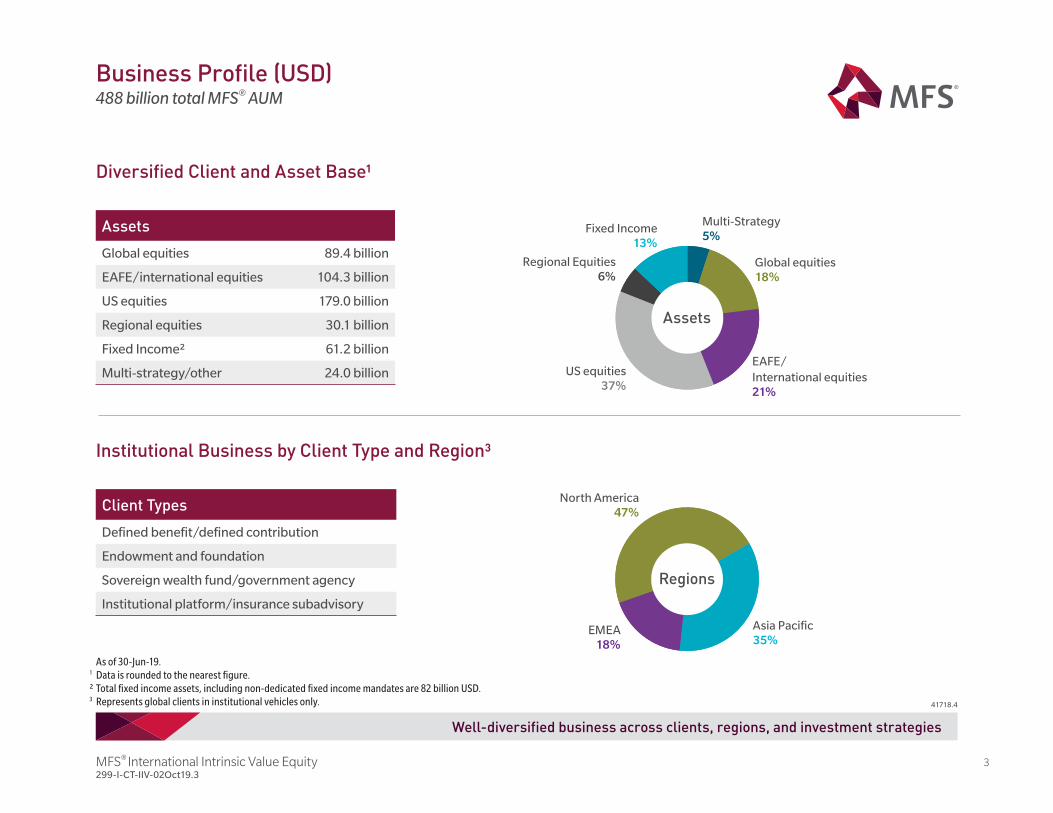
As of 30-Jun-19.1 Data is rounded to the nearest fi gure. ² Total fi xed income assets, including non-dedicated fi xed income mandates are 82 billion USD.3 Represents global clients in institutional vehicles only.
Well-diversified business across clients, regions, and investment strategies
Business Profile (USD) 488 billion total MFS® AUM
Client Types
Defi ned benefi t/defi ned contribution
Endowment and foundation
Sovereign wealth fund/government agency
Institutional platform/insurance subadvisory
Diversified Client and Asset Base¹
Institutional Business by Client Type and Region³
Regions
Assets
Regions
Assets
Fixed Income13%
US equities37%
Regional Equities6%
EMEA18%
North America47%
Global equities18%
EAFE/International equities21%
Asia Pacifi c35%
Multi-Strategy5%
Assets
Global equities 89.4 billion
EAFE/international equities 104.3 billion
US equities 179.0 billion
Regional equities 30.1 billion
Fixed Income² 61.2 billion
Multi-strategy/other 24.0 billion
MFS® International Intrinsic Value Equity 4299-I-CT-IIV-02Oct19.4
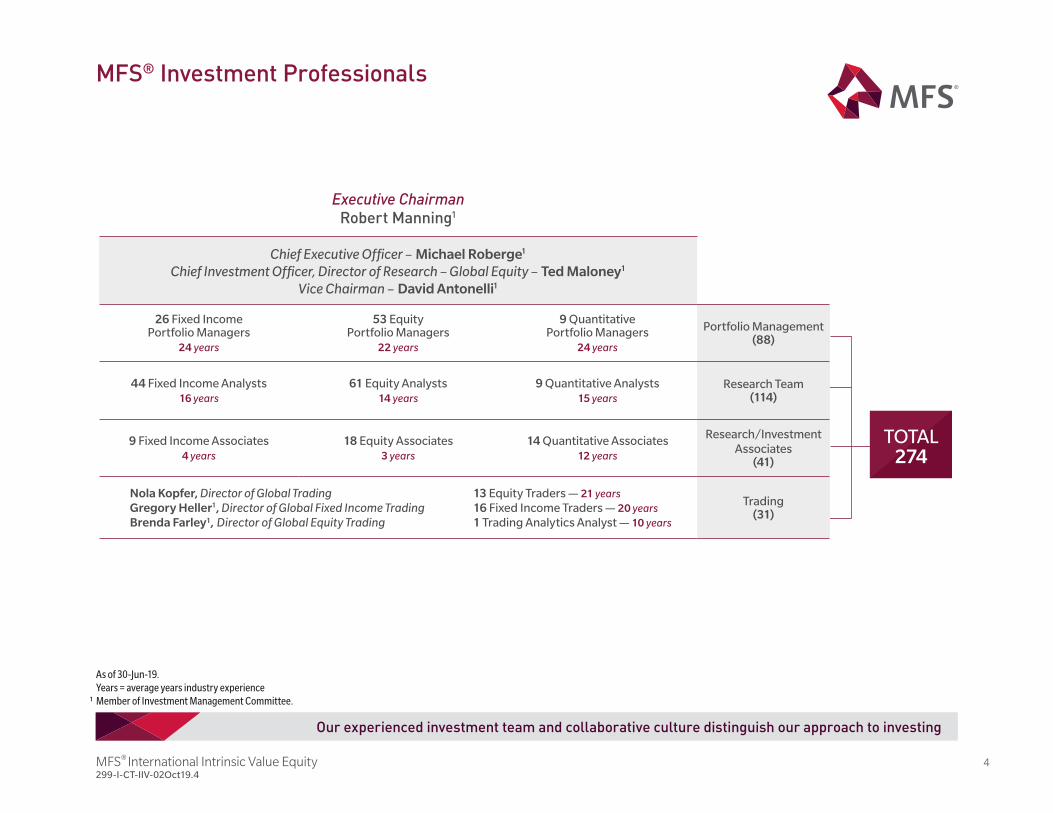
Our experienced investment team and collaborative culture distinguish our approach to investing
MFS® Investment Professionals
As of 30-Jun-19.Years = average years industry experience
¹ Member of Investment Management Committee.
Executive ChairmanRobert Manning1
Chief Executive Offi cer – Michael Roberge1
Chief Investment Offi cer, Director of Research – Global Equity – Ted Maloney1
Vice Chairman – David Antonelli1
26 Fixed IncomePortfolio Managers
24 years
53 EquityPortfolio Managers
22 years
9 QuantitativePortfolio Managers
24 years
Portfolio Management(88)
44 Fixed Income Analysts16 years
61 Equity Analysts14 years
9 Quantitative Analysts15 years
Research Team(114)
9 Fixed Income Associates4 years
18 Equity Associates3 years
14 Quantitative Associates12 years
Research/Investment Associates
(41)
Nola Kopfer, Director of Global Trading 13 Equity Traders — 21 yearsGregory Heller1, Director of Global Fixed Income Trading 16 Fixed Income Traders — 20 yearsBrenda Farley¹, Director of Global Equity Trading 1 Trading Analytics Analyst — 10 years
Trading(31)
TOTAL274
MFS® International Intrinsic Value Equity 5299-I-CT-IIV-02Oct19.5
As of 30-Jun-19.
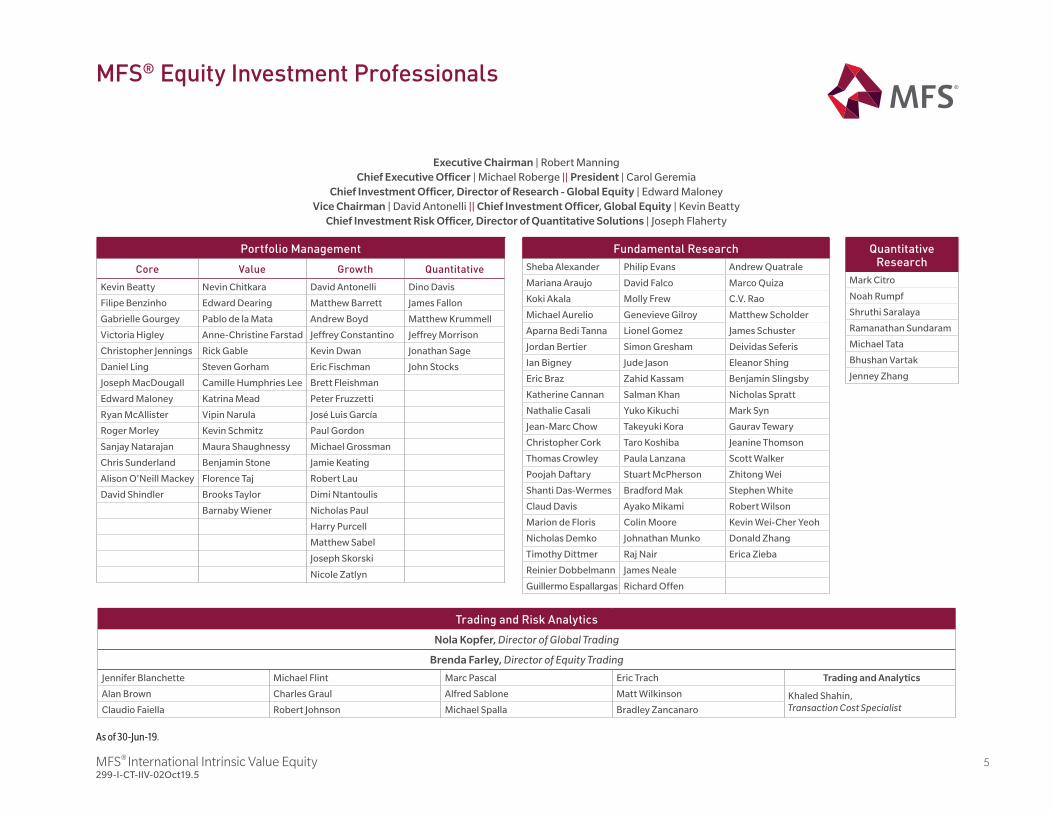
MFS® Equity Investment Professionals
Executive Chairman | Robert ManningChief Executive Offi cer | Michael Roberge || President | Carol Geremia
Chief Investment Offi cer, Director of Research - Global Equity | Edward MaloneyVice Chairman | David Antonelli || Chief Investment Offi cer, Global Equity | Kevin Beatty
Chief Investment Risk Offi cer, Director of Quantitative Solutions | Joseph Flaherty
Portfolio Management
Core Value Growth Quantitative
Kevin Beatty Nevin Chitkara David Antonelli Dino Davis
Filipe Benzinho Edward Dearing Matthew Barrett James Fallon
Gabrielle Gourgey Pablo de la Mata Andrew Boyd Matthew Krummell
Victoria Higley Anne-Christine Farstad Jeffrey Constantino Jeffrey Morrison
Christopher Jennings Rick Gable Kevin Dwan Jonathan Sage
Daniel Ling Steven Gorham Eric Fischman John Stocks
Joseph MacDougall Camille Humphries Lee Brett Fleishman
Edward Maloney Katrina Mead Peter Fruzzetti
Ryan McAllister Vipin Narula José Luis García
Roger Morley Kevin Schmitz Paul Gordon
Sanjay Natarajan Maura Shaughnessy Michael Grossman
Chris Sunderland Benjamin Stone Jamie Keating
Alison O'Neill Mackey Florence Taj Robert Lau
David Shindler Brooks Taylor Dimi Ntantoulis
Barnaby Wiener Nicholas Paul
Harry Purcell
Matthew Sabel
Joseph Skorski
Nicole Zatlyn
Fundamental Research
Sheba Alexander Philip Evans Andrew Quatrale
Mariana Araujo David Falco Marco Quiza
Koki Akala Molly Frew C.V. Rao
Michael Aurelio Genevieve Gilroy Matthew Scholder
Aparna Bedi Tanna Lionel Gomez James Schuster
Jordan Bertier Simon Gresham Deividas Seferis
Ian Bigney Jude Jason Eleanor Shing
Eric Braz Zahid Kassam Benjamin Slingsby
Katherine Cannan Salman Khan Nicholas Spratt
Nathalie Casali Yuko Kikuchi Mark Syn
Jean-Marc Chow Takeyuki Kora Gaurav Tewary
Christopher Cork Taro Koshiba Jeanine Thomson
Thomas Crowley Paula Lanzana Scott Walker
Poojah Daftary Stuart McPherson Zhitong Wei
Shanti Das-Wermes Bradford Mak Stephen White
Claud Davis Ayako Mikami Robert Wilson
Marion de Floris Colin Moore Kevin Wei-Cher Yeoh
Nicholas Demko Johnathan Munko Donald Zhang
Timothy Dittmer Raj Nair Erica Zieba
Reinier Dobbelmann James Neale
Guillermo Espallargas Richard Offen
Quantitative Research
Mark Citro
Noah Rumpf
Shruthi Saralaya
Ramanathan Sundaram
Michael Tata
Bhushan Vartak
Jenney Zhang
Trading and Risk Analytics
Nola Kopfer, Director of Global Trading
Brenda Farley, Director of Equity Trading
Jennifer Blanchette Michael Flint Marc Pascal Eric Trach Trading and Analytics
Alan Brown Charles Graul Alfred Sablone Matt Wilkinson Khaled Shahin, Transaction Cost SpecialistClaudio Faiella Robert Johnson Michael Spalla Bradley Zancanaro
MFS® International Intrinsic Value Equity 6299-I-CT-IIV-02Oct19.6
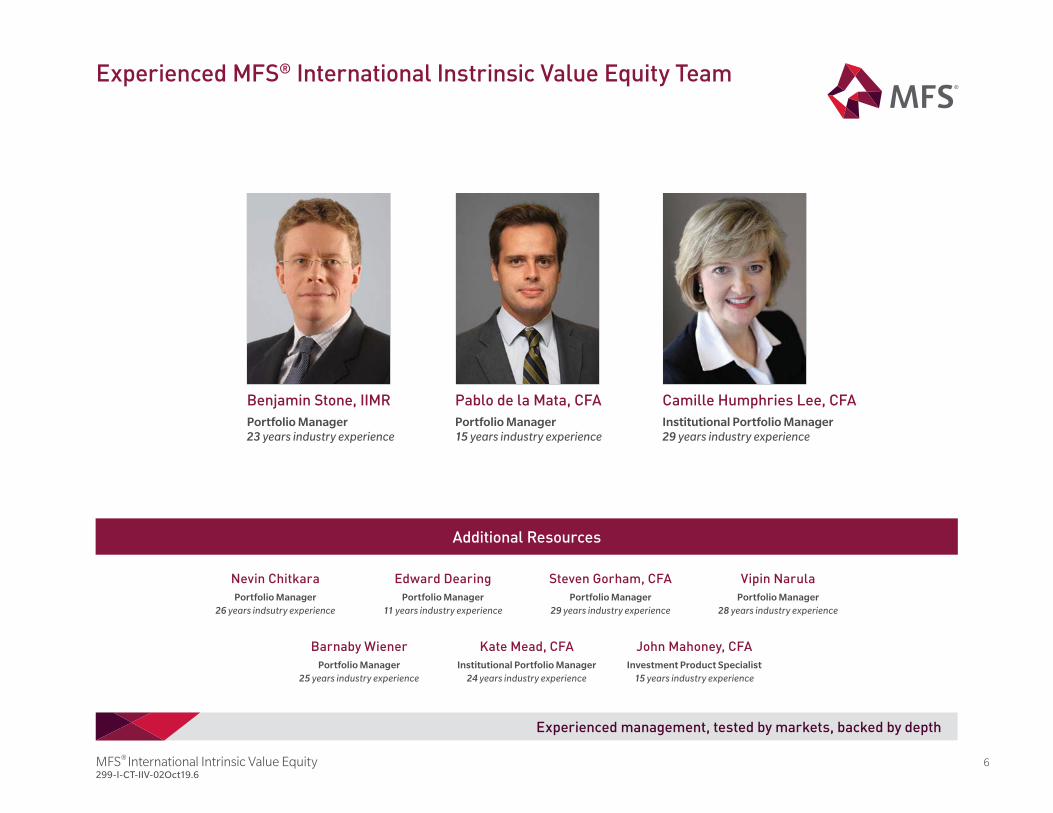
Experienced MFS® International Instrinsic Value Equity Team
Experienced management, tested by markets, backed by depth
Additional Resources
Barnaby Wiener
Portfolio Manager
25 years industry experience
Kate Mead, CFA
Institutional Portfolio Manager
24 years industry experience
John Mahoney, CFA
Investment Product Specialist
15 years industry experience
Nevin Chitkara
Portfolio Manager
26 years indsutry experience
Edward Dearing
Portfolio Manager
11 years industry experience
Steven Gorham, CFA
Portfolio Manager
29 years industry experience
Vipin Narula
Portfolio Manager
28 years industry experience
Benjamin Stone, IIMR
Portfolio Manager
23 years industry experience
Pablo de la Mata, CFA
Portfolio Manager
15 years industry experience
Camille Humphries Lee, CFA
Institutional Portfolio Manager
29 years industry experience

MFS® International Intrinsic Value Equity 7299-I-CT-IIV-02Oct19.7
MFS International Instrinsic Value Equity Team
Benjamin Stone, IIMR Investment Officer
Equity Portfolio Manager
As an Equity Portfolio Manager, responsible for buy and sell decisions, portfolio construction, risk control and cash management. Participates in the research process and strategy discussions.
Joined MFS in 2005; previous positions include Equity Research Analyst
Previous experience includes 9 years as Research Analyst at Schroders Investment Management
Affiliations include Institute of Investment Management and Research
Durham University, BA, 2:1
Pablo de la Mata, CFA Investment Officer
Equity Portfolio Manager
As a Non-U.S. Equity Portfolio Manager, responsible for final buy and sell decisions, portfolio construction, risk and cash management. Participates in the research process and strategy discussions.
Joined MFS in 2008; previous positions include Global Equity Research Analyst
Previous experience includes 1 year as Equity Research Analyst at Magnetar Capital; 3 years as Equity Research Analyst at Blackrock/Merrill Lynch Investment Managers; 1 year as Wholesale Support at Merrill Lynch Investment Managers
Affiliations include CFA Institute
Colegio Universitario de Estudios Financieros (CUNEF), BS
03JUL19
MFS® International Intrinsic Value Equity 8299-I-CT-IIV-02Oct19.8
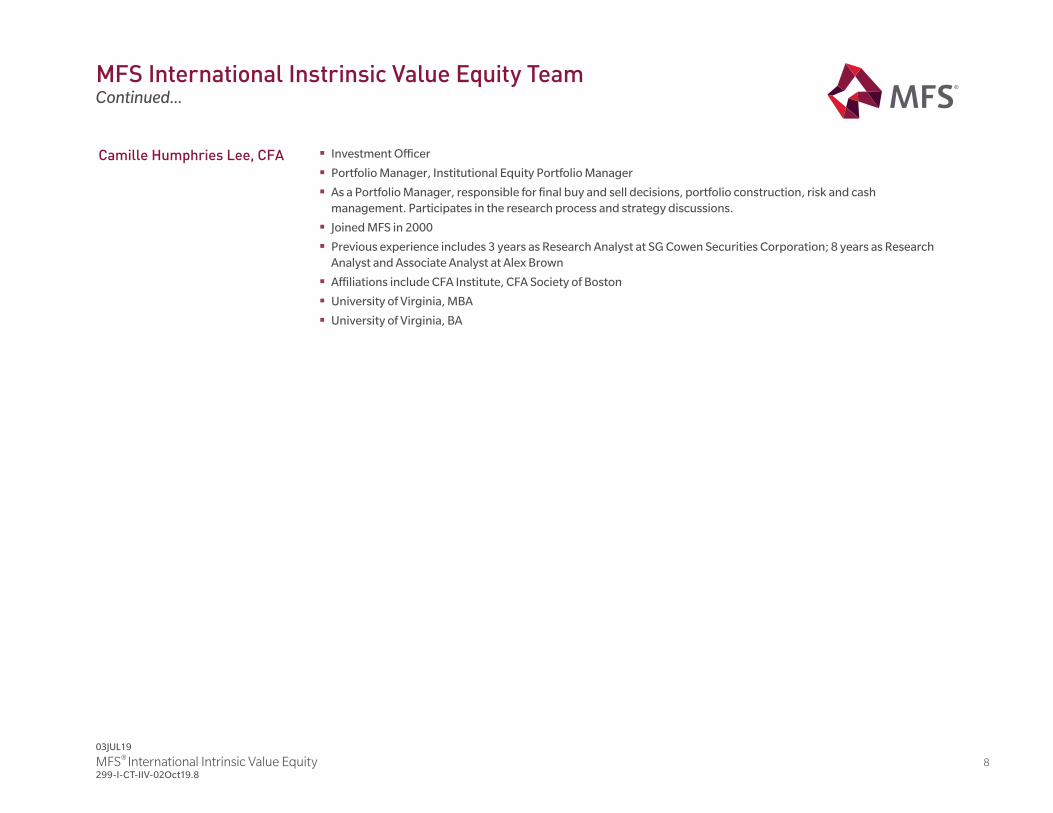
MFS International Instrinsic Value Equity Team
Camille Humphries Lee, CFA Investment Officer
Portfolio Manager, Institutional Equity Portfolio Manager
As a Portfolio Manager, responsible for final buy and sell decisions, portfolio construction, risk and cash management. Participates in the research process and strategy discussions.
Joined MFS in 2000
Previous experience includes 3 years as Research Analyst at SG Cowen Securities Corporation; 8 years as Research Analyst and Associate Analyst at Alex Brown
Affiliations include CFA Institute, CFA Society of Boston
University of Virginia, MBA
University of Virginia, BA
Continued...
03JUL19
MFS® International Intrinsic Value Equity 9299-I-CT-IIV-02Oct19.9
Commitment to world class client service results in enduring relationships
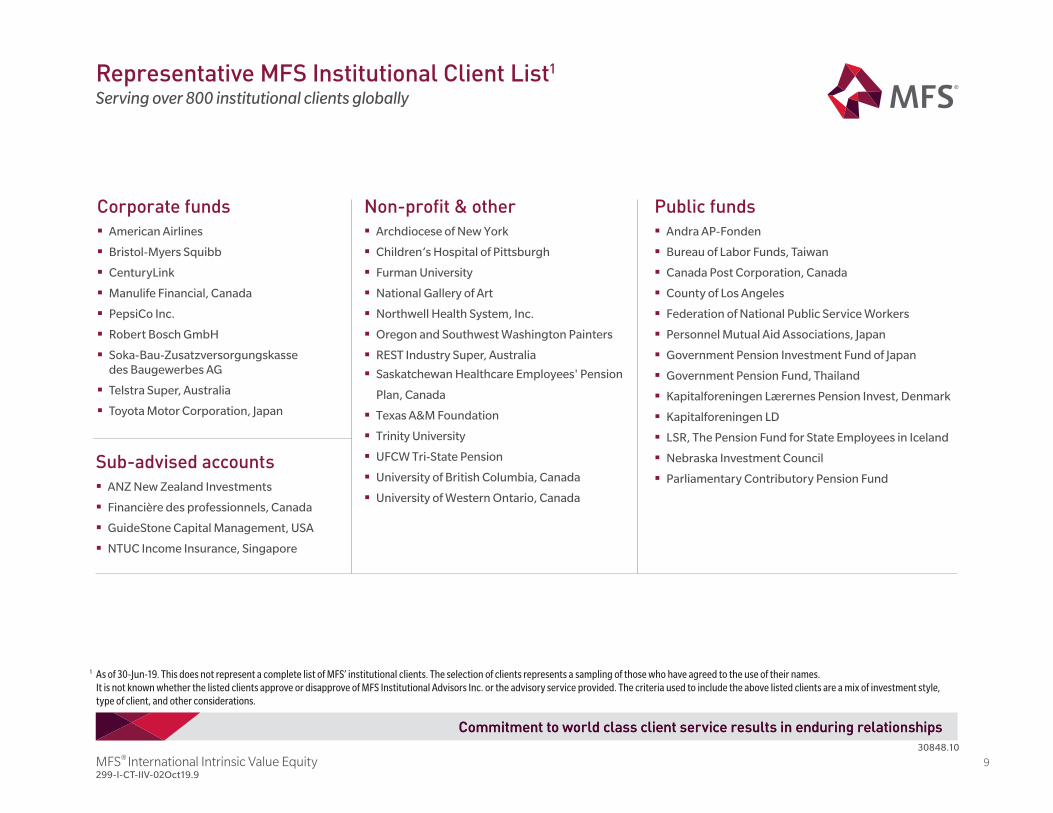
Non-profit & other
Archdiocese of New York
Children’s Hospital of Pittsburgh
Furman University
National Gallery of Art
Northwell Health System, Inc.
Oregon and Southwest Washington Painters
REST Industry Super, Australia
Saskatchewan Healthcare Employees' Pension
Plan, Canada
Texas A&M Foundation
Trinity University
UFCW Tri-State Pension
University of British Columbia, Canada
University of Western Ontario, Canada
Corporate funds
American Airlines
Bristol-Myers Squibb
CenturyLink
Manulife Financial, Canada
PepsiCo Inc.
Robert Bosch GmbH
Soka-Bau-Zusatzversorgungskassedes Baugewerbes AG
Telstra Super, Australia
Toyota Motor Corporation, Japan
Sub-advised accounts
ANZ New Zealand Investments
Financière des professionnels, Canada
GuideStone Capital Management, USA
NTUC Income Insurance, Singapore
1 As of 30-Jun-19. This does not represent a complete list of MFS’ institutional clients. The selection of clients represents a sampling of those who have agreed to the use of their names.It is not known whether the listed clients approve or disapprove of MFS Institutional Advisors Inc. or the advisory service provided. The criteria used to include the above listed clients are a mix of investment style, type of client, and other considerations.
Representative MFS Institutional Client List1
Serving over 800 institutional clients globally
Commitment to world class client service results in enduring relationships
Public funds
Andra AP-Fonden
Bureau of Labor Funds, Taiwan
Canada Post Corporation, Canada
County of Los Angeles
Federation of National Public Service Workers
Personnel Mutual Aid Associations, Japan
Government Pension Investment Fund of Japan
Government Pension Fund, Thailand
Kapitalforeningen Lærernes Pension Invest, Denmark
Kapitalforeningen LD
LSR, The Pension Fund for State Employees in Iceland
Nebraska Investment Council
Parliamentary Contributory Pension Fund
30848.10
MFS® International Intrinsic Value Equity 10299-I-CT-IIV-02Oct19.10
Key Contacts
Carolyn Lucey, CIMA
Director, Relationship Manager
Office phone: 617.954.5980
Cell phone: 617.513.5831
Email: [email protected]
Erin Mandigo
Client Service Manager
Phone: 617-954-4046
Email: [email protected]
Mailing Address
MFS Investment Management
111 Huntington Avenue, 23rd Floor
Boston, MA 02199

Investment Process and Discipline
MFS® International Intrinsic Value Equity 12299-I-CT-IIV-02Oct19.12
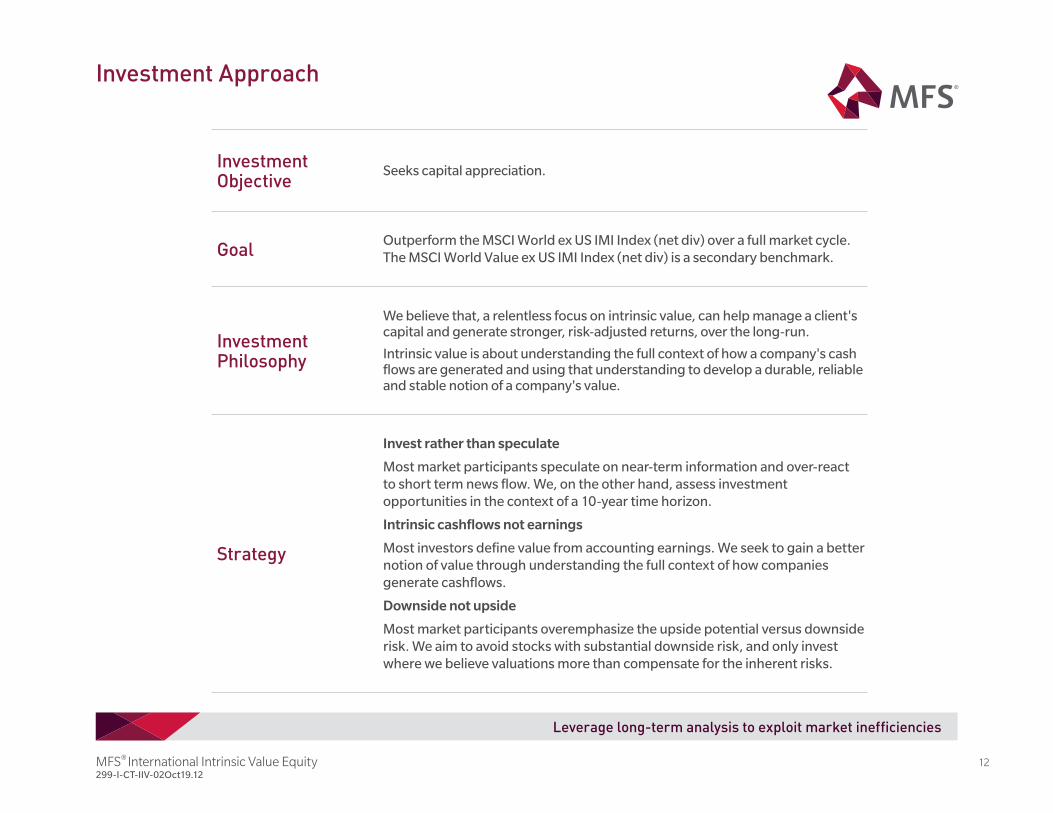
Investment Approach
Leverage long-term analysis to exploit market inefficiencies
Investment Objective
Seeks capital appreciation.
GoalOutperform the MSCI World ex US IMI Index (net div) over a full market cycle. The MSCI World alue ex US IMI Index (net div) is a secondary benchmark.
Investment Philosophy
We believe that, a relentless focus on intrinsic value, can help manage a client's capital and generate stronger, risk-adjusted returns, over the long-run.
Intrinsic value is about understanding the full context of how a company's cash flows are generated and using that understanding to develop a durable, reliable and stable notion of a company's value.
Strategy
Invest rather than speculate
Most market participants speculate on near-term information and over-react to short term news flow. We, on the other hand, assess investment opportunities in the context of a 10-year time horizon.
Intrinsic cashflows not earnings
Most investors define value from accounting earnings. We seek to gain a better notion of value through understanding the full context of how companies generate cashflows.
Downside not upside
Most market participants overemphasize the upside potential versus downside risk. We aim to avoid stocks with substantial downside risk, and only invest where we believe valuations more than compensate for the inherent risks.

MFS® International Intrinsic Value Equity 13299-I-CT-IIV-02Oct19.13
Investment Process Overview
Idea generationFundamental analysis
Portfolio construction
Industry evaluation and company analysis
Comprehensive analysis of industry context
Assess long term durability and range of returns
Focus on aimingto minimize downside risk
Broad diversifi cation
Position sizing a function of downside risk
Constant search for new ideas
Proprietary Research
Company Managements
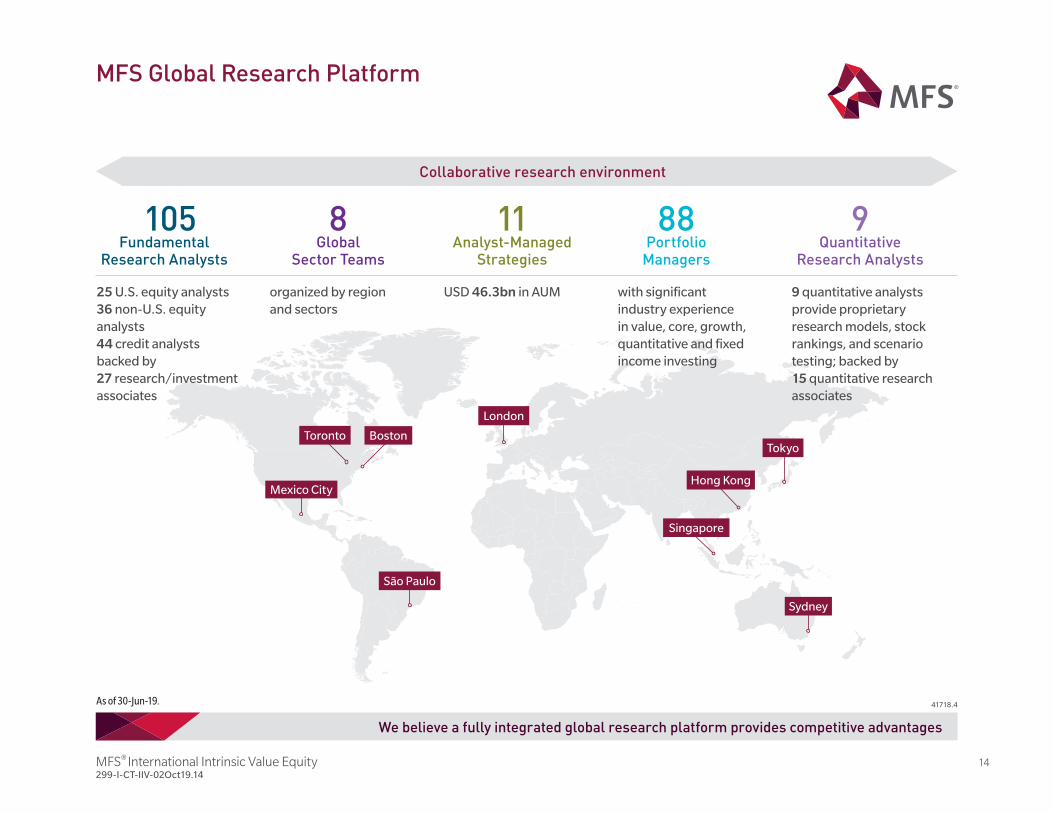
Global Research Platform
Best high-quality ideas
Generally, has held 80-110 holdings
The information listed above is current as of the date of the material, and any additions, modifi cations, or deletions that have occurred since that date are not refl ected.
Rigorous analysis of business, risk and valuation
MFS® International Intrinsic Value Equity
MFS® International Intrinsic Value Equity 14299-I-CT-IIV-02Oct19.14
organized by regionand sectors
41718.4
USD 46.3bn in AUM
We believe a fully integrated global research platform provides competitive advantages
Toronto Boston
Mexico City
São Paulo
London
Tokyo
Hong Kong
Singapore
Sydney
105Fundamental
Research Analysts
8Global
Sector Teams
88Portfolio
Managers
with signifi cant industry experience in value, core, growth, quantitative and fi xed income investing
9 quantitative analysts provide proprietary research models, stock rankings, and scenario testing; backed by15 quantitative researchassociates
Collaborative research environment
MFS Global Research Platform
Analyst-Managed Strategies
11Quantitative
Research Analysts
9
25 U.S. equity analysts 36 non-U.S. equity analysts44 credit analysts backed by27 research/investment associates
As of 30-Jun-19.
MFS® International Intrinsic Value Equity 15299-I-CT-IIV-02Oct19.15
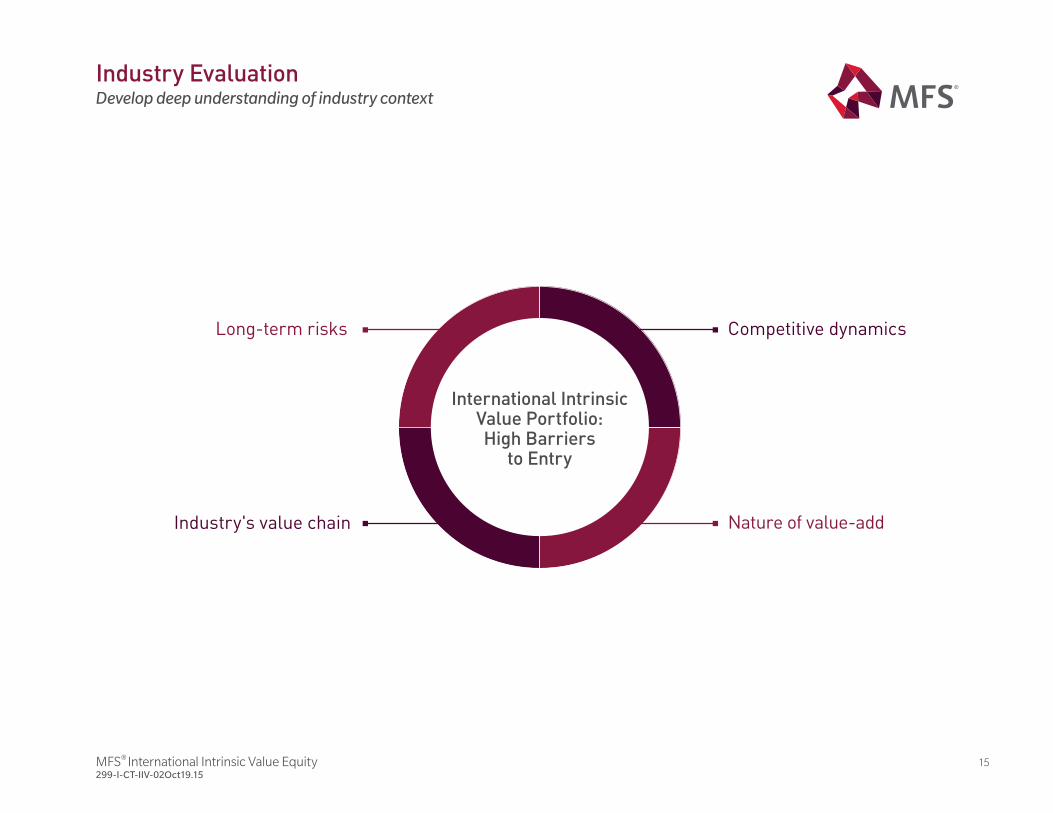
Industry EvaluationDevelop deep understanding of industry context
Long-term risks
Nature of value-add
Competitive dynamics
International IntrinsicValue Portfolio: High Barriers
to Entry
Industry's value chain
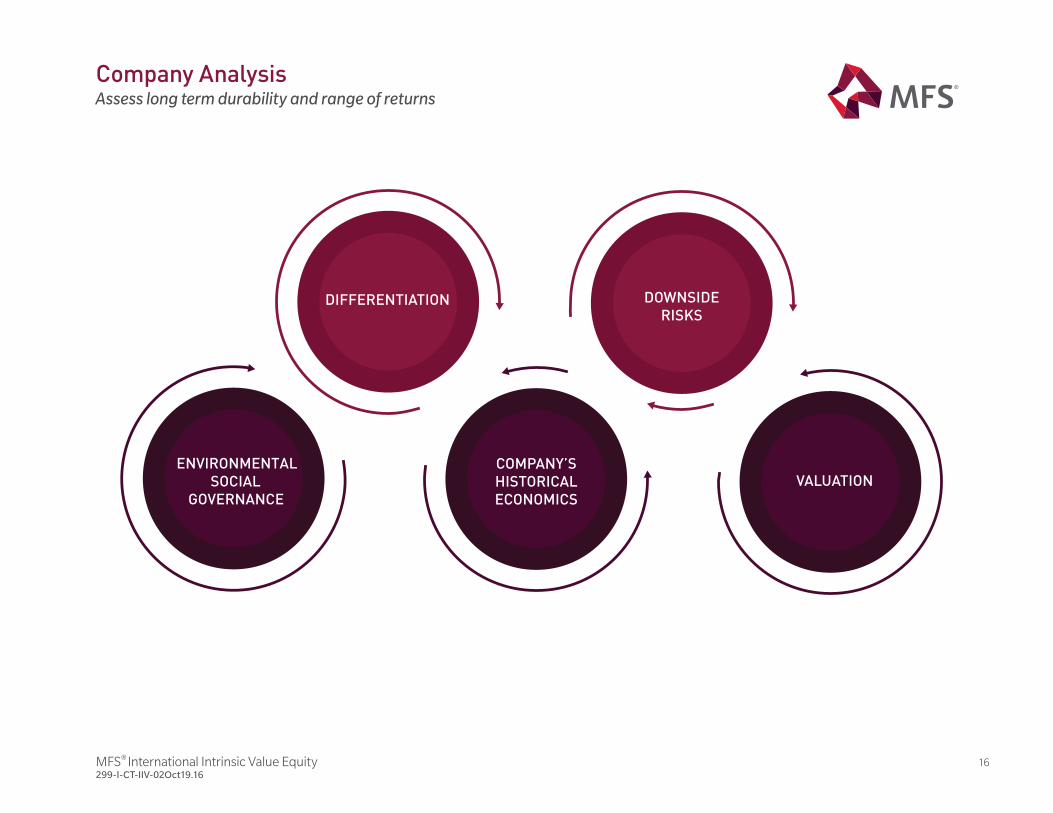
MFS® International Intrinsic Value Equity 16299-I-CT-IIV-02Oct19.16
DOWNSIDE
RISKS
COMPANY’S
HISTORICAL
ECONOMICS
VALUATION
DIFFERENTIATION
Company AnalysisAssess long term durability and range of returns
MFS® International Intrinsic Value Equity 17299-I-CT-IIV-02Oct19.17
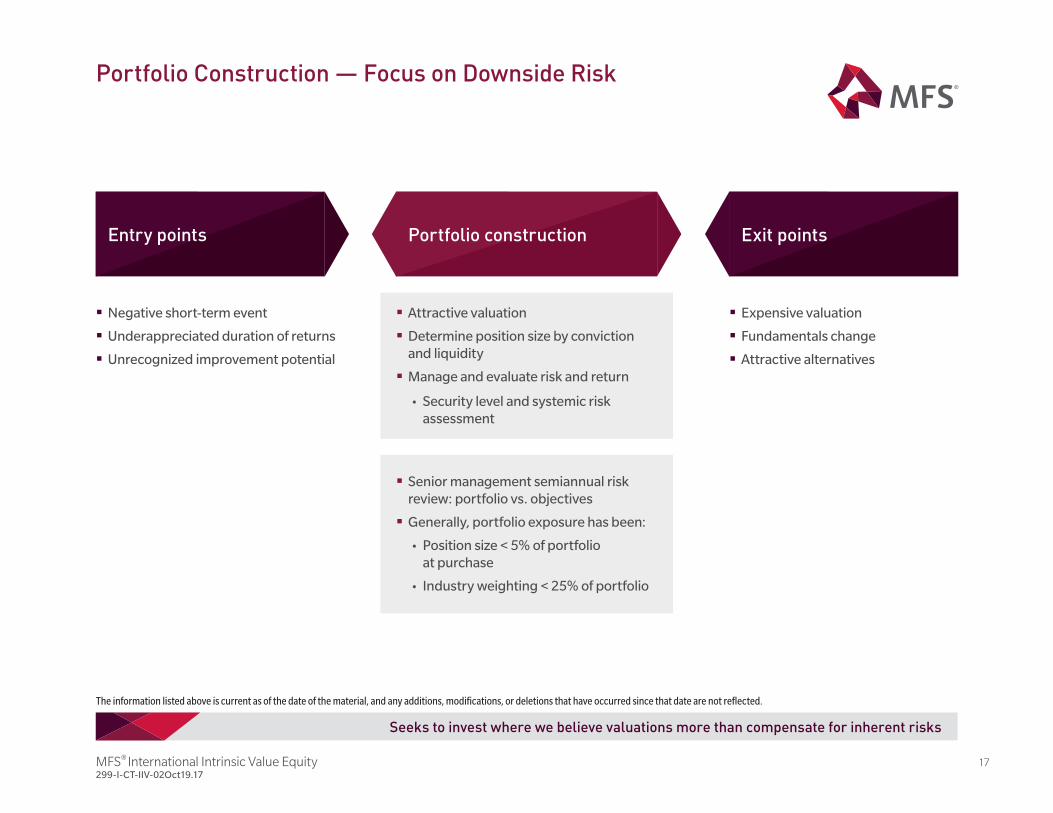
Entry points Portfolio construction Exit points
Negative short-term event
Underappreciated duration of returns
Unrecognized improvement potential
Attractive valuation
Determine position size by conviction and liquidity
Manage and evaluate risk and return
• Security level and systemic risk assessment
Senior management semiannual risk review: portfolio vs. objectives
Generally, portfolio exposure has been:
• Position size < 5% of portfolio at purchase
• Industry weighting < 25% of portfolio
Expensive valuation
Fundamentals change
Attractive alternatives
Portfolio Construction — Focus on Downside Risk
Seeks to invest where we believe valuations more than compensate for inherent risks
The information listed above is current as of the date of the material, and any additions, modifications, or deletions that have occurred since that date are not reflected.
MFS® International Intrinsic Value Equity 18299-I-CT-IIV-02Oct19.18
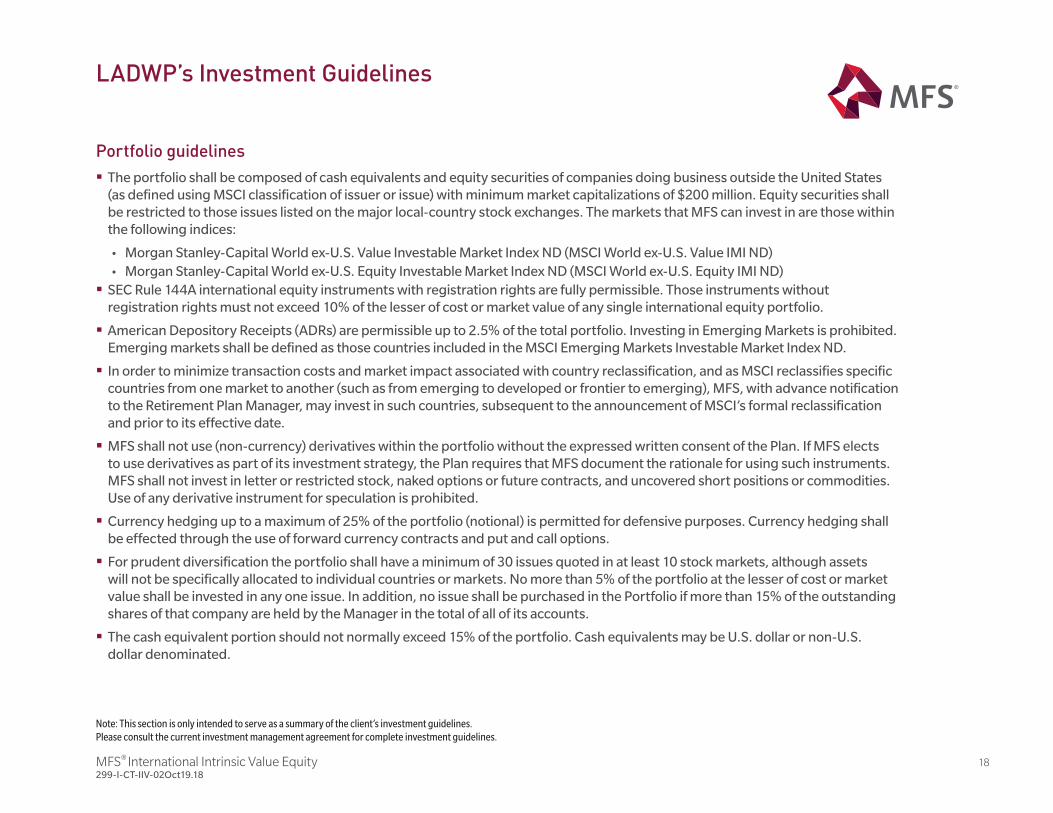
Note: This section is only intended to serve as a summary of the client’s investment guidelines.Please consult the current investment management agreement for complete investment guidelines.
Portfolio guidelines
The portfolio shall be composed of cash equivalents and equity securities of companies doing business outside the United States (as defined using MSCI classification of issuer or issue) with minimum market capitalizations of $200 million. Equity securities shall be restricted to those issues listed on the major local-country stock exchanges. The markets that MFS can invest in are those within the following indices:
• Morgan Stanley-Capital World ex-U.S. Value Investable Market Index ND (MSCI World ex-U.S. Value IMI ND) • Morgan Stanley-Capital World ex-U.S. Equity Investable Market Index ND (MSCI World ex-U.S. Equity IMI ND)
SEC Rule 144A international equity instruments with registration rights are fully permissible. Those instruments without registration rights must not exceed 10% of the lesser of cost or market value of any single international equity portfolio.
American Depository Receipts (ADRs) are permissible up to 2.5% of the total portfolio. Investing in Emerging Markets is prohibited. Emerging markets shall be defined as those countries included in the MSCI Emerging Markets Investable Market Index ND.
In order to minimize transaction costs and market impact associated with country reclassification, and as MSCI reclassifies specific countries from one market to another (such as from emerging to developed or frontier to emerging), MFS, with advance notification to the Retirement Plan Manager, may invest in such countries, subsequent to the announcement of MSCI’s formal reclassification and prior to its effective date.
MFS shall not use (non-currency) derivatives within the portfolio without the expressed written consent of the Plan. If MFS elects to use derivatives as part of its investment strategy, the Plan requires that MFS document the rationale for using such instruments. MFS shall not invest in letter or restricted stock, naked options or future contracts, and uncovered short positions or commodities. Use of any derivative instrument for speculation is prohibited.
Currency hedging up to a maximum of 25% of the portfolio (notional) is permitted for defensive purposes. Currency hedging shall be effected through the use of forward currency contracts and put and call options.
For prudent diversification the portfolio shall have a minimum of 30 issues quoted in at least 10 stock markets, although assets will not be specifically allocated to individual countries or markets. No more than 5% of the portfolio at the lesser of cost or market value shall be invested in any one issue. In addition, no issue shall be purchased in the Portfolio if more than 15% of the outstanding shares of that company are held by the Manager in the total of all of its accounts.
The cash equivalent portion should not normally exceed 15% of the portfolio. Cash equivalents may be U.S. dollar or non-U.S. dollar denominated.
LADWP’s Investment Guidelines
Market Overview
MFS® International Intrinsic Value Equity 20299-I-CT-IIV-02Oct19.20
The views expressed in this presentation are subject to change at any time. These views should not be relied upon as investment advice, as securities recommendation, or as an indication of trading intent on behalf of any other MFS investment product.
Global equity markets have rallied this year, even as investors worried about the slowing global economy and US -China trade tensions. For the year-to-date period ending August 30, 2019, technology stocks continued to lead market gains, with the consumer staples and health care sectors beating the broader MSCI World ex US IMI Index as well. Energy stocks was the worst performer of the index as they underperformed on weak oil prices. Financials also lagged the broader market index.
Looking forward, we are concerned about the ever-increasing risks to the global economy, particularly the high levels of debt around the world. Global growth has slowed, and China, the world's second largest economy, may experience a hard landing. In Europe, Italy continues to struggle with an overwhelming debt burden and a weak economy. French President Macron is facing opposition to his efforts to reform the economy, and in Germany, Angela Merkel's long tenure is coming to an end, as populists gain more power. In the United Kingdom, tremendous uncertainty continues, as a hard Brexit looks more likely than ever. Trade tensions between the US and China have eased somewhat, but no agreement has been reached, and risks remain.
Market OverviewAs of 31 August 2019

Performance Review
MFS® International Intrinsic Value Equity 22299-I-CT-IIV-02Oct19.22
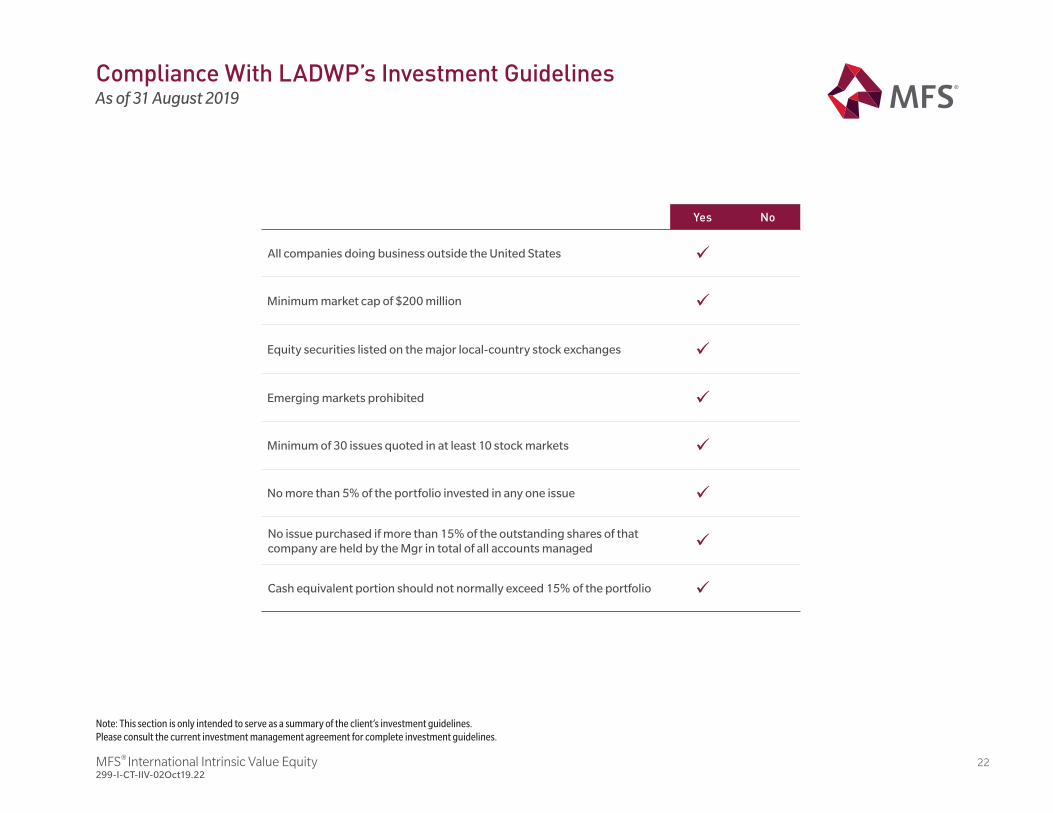
Compliance With LADWP’s Investment GuidelinesAs of 31 August 2019
Yes No
All companies doing business outside the United States
Minimum market cap of $200 million
Equity securities listed on the major local-country stock exchanges
Emerging markets prohibited
Minimum of 30 issues quoted in at least 10 stock markets
No more than 5% of the portfolio invested in any one issue
No issue purchased if more than 15% of the outstanding shares of that company are held by the Mgr in total of all accounts managed
Cash equivalent portion should not normally exceed 15% of the portfolio
Note: This section is only intended to serve as a summary of the client’s investment guidelines.Please consult the current investment management agreement for complete investment guidelines.
MFS® International Intrinsic Value Equity 23299-I-CT-IIV-02Oct19.23
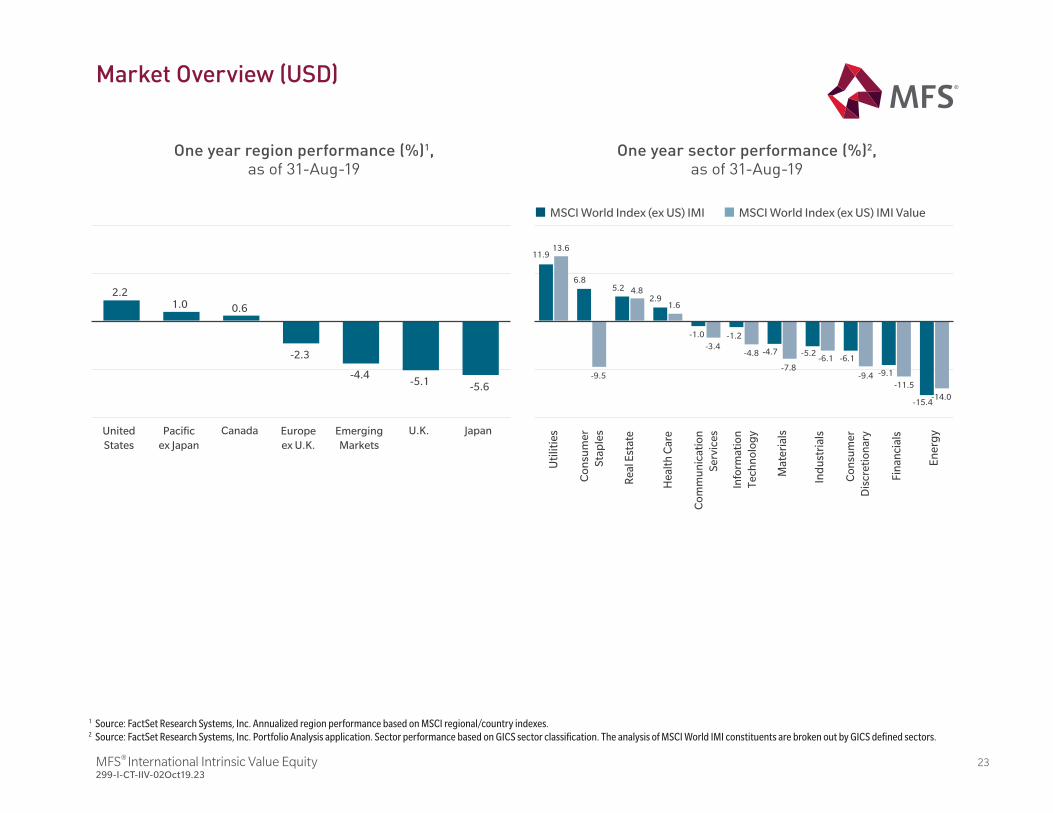
One year region performance (%)1, as of 31-Aug-19
One year sector performance (%)2, as of 31-Aug-19
UnitedStates
Pacificex Japan
Canada Europeex U.K.
EmergingMarkets
U.K. Japan
2.21.0 0.6
-2.3
-4.4-5.1 -5.6
Uti
litie
s
Co
nsu
mer
Stap
les
Rea
l Est
ate
Hea
lth
Car
e
Com
mu
nic
atio
nSe
rvic
es
Info
rmat
ion
Tech
nol
ogy
Mat
eria
ls
Ind
ustr
ials
Con
sum
erD
iscr
etio
nar
y
Fina
ncia
ls
Ener
gy
11.913.6
6.8
-9.5
5.2 4.82.9
1.6
-1.0
-3.4-1.2
-4.8 -4.7
-7.8
-5.2-6.1 -6.1
-9.4 -9.1
-11.5
-15.4-14.0
MSCI World Index (ex US) IMI MSCI World Index (ex US) IMI Value
Market Overview (USD)
1 Source: FactSet Research Systems, Inc. Annualized region performance based on MSCI regional/country indexes.2 Source: FactSet Research Systems, Inc. Portfolio Analysis application. Sector performance based on GICS sector classification. The analysis of MSCI World IMI constituents are broken out by GICS defined sectors.
MFS® International Intrinsic Value Equity 24299-I-CT-IIV-02Oct19.24
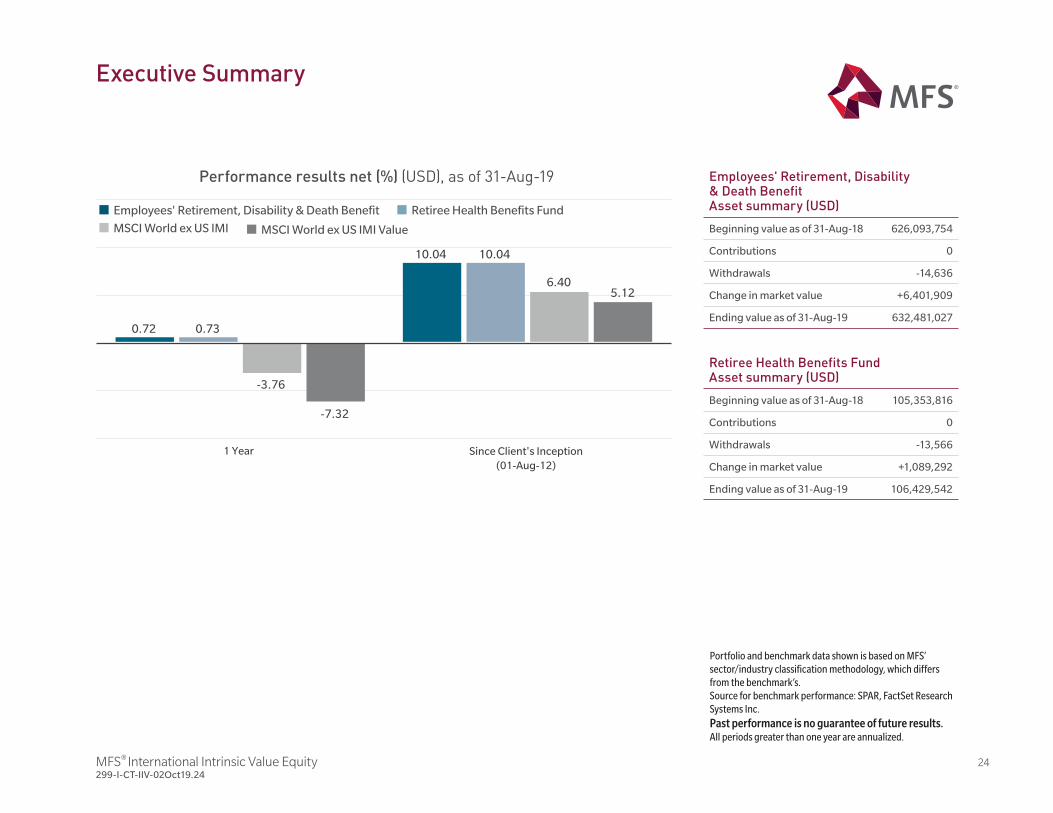
Executive Summary
Employees' Retirement, Disability & Death Benefit Asset summary (USD)
Beginning value as of 31-Aug-18 626,093,754
Contributions 0
Withdrawals -14,636
Change in market value +6,401,909
Ending value as of 31-Aug-19 632,481,027
Portfolio and benchmark data shown is based on MFS’ sector/industry classification methodology, which differs from the benchmark’s.Source for benchmark performance: SPAR, FactSet Research Systems Inc.Past performance is no guarantee of future results. All periods greater than one year are annualized.
Performance results net (%) (USD), as of 31-Aug-19
1 Year Since Client's Inception(01-Aug-12)
0.72 0.73
-3.76
-7.32
10.04 10.04
6.405.12
Employees' Retirement, Disability & Death Benefit
MSCI World ex US IMI
Retiree Health Benefits Fund Asset summary (USD)
Beginning value as of 31-Aug-18 105,353,816
Contributions 0
Withdrawals -13,566
Change in market value +1,089,292
Ending value as of 31-Aug-19 106,429,542
Retiree Health Benefits Fund
MSCI World ex US IMI Value

MFS® International Intrinsic Value Equity 25299-I-CT-IIV-02Oct19.25
Please note the composite shown is unrestricted and allows for investment in Emerging Markets and US securities.
Historical Relative Performance in Diverse MarketsGross of fees (USD)
MFS International Intrinsic Value Equity Unrestricted Composite vs MSCI World (ex-US) Investable Market Index (net div)January 1998-June 2019
Market return less than -5%
Market return -5% to +5%
Market return greater than +5%
Total
Average quarterly relative performance (%) +4.03 +0.96 -0.79 +0.99
Nu
mb
er o
f qu
arte
rs a
bov
e /b
elow
ben
chm
ark
Source: Benchmark performance from SPAR, FactSet Research Systems Inc. The exhibit above reflects the performance of a fully discretionary composite; individual portfolio results will vary. This performance information is supplemental to the composite's compliant presentation. Please see appendix for composite report, and other information. It is not possible to invest directly in an index.Past performance is not a reliable indicator for future results. All financial investments involve an element of risk. The value of investments may rise and fall so you may get back less than originally invested. Investors should consider the risks, including lower returns, related to currency movements between their investing currency and the portfolio's base currency, if different.
Number of outperforming quarters Number of underperforming quarters
0
10
20
30
40
50
60

MFS® International Intrinsic Value Equity 26299-I-CT-IIV-02Oct19.26
13.3310.37
4.21
0.72
-3.76
-7.32
7.13 5.894.11
6.11
1.86
-0.50
9.75
6.06 4.70
10.04
6.40 5.12
Periods greater than one year are annualized, as of 31-Aug-19
Annual performance (%) 2018 2017 2016 2015 2014 2013
Portfolio — Net -9.09 26.89 -0.80 6.81 0.86 30.86
MSCI World ex US IMI -14.68 25.17 2.95 -1.95 -4.45 21.57
MSCI World ex US IMI Value -15.56 22.01 7.45 -6.57 -5.46 22.23
Source: benchmark performance from SPAR, FactSet Research Systems, Inc. Past performance is no guarantee of future results.
Excess returns (%)YTD 1 Year 3 Years 5 Years 7 Years
Since inception (01-Aug-12)
Net vs. MSCI World (ex-US) Investable Market Index (net div)
2.96 4.48 1.24 4.25 3.69 3.64
Net vs. MSCI World (ex-US) Investable Market Index Value (net div)
9.12 8.04 3.02 6.61 5.05 4.92
Portfolio - Net MSCI World ex US IMI Value MSCI World ex US IMI
Performance — net of fees (USD)Employees' Retirement, Disability & Death Benefit Plan
MFS® International Intrinsic Value Equity 27299-I-CT-IIV-02Oct19.27
Source: benchmark performance from SPAR, FactSet Research Systems, Inc. Past performance is no guarantee of future results.
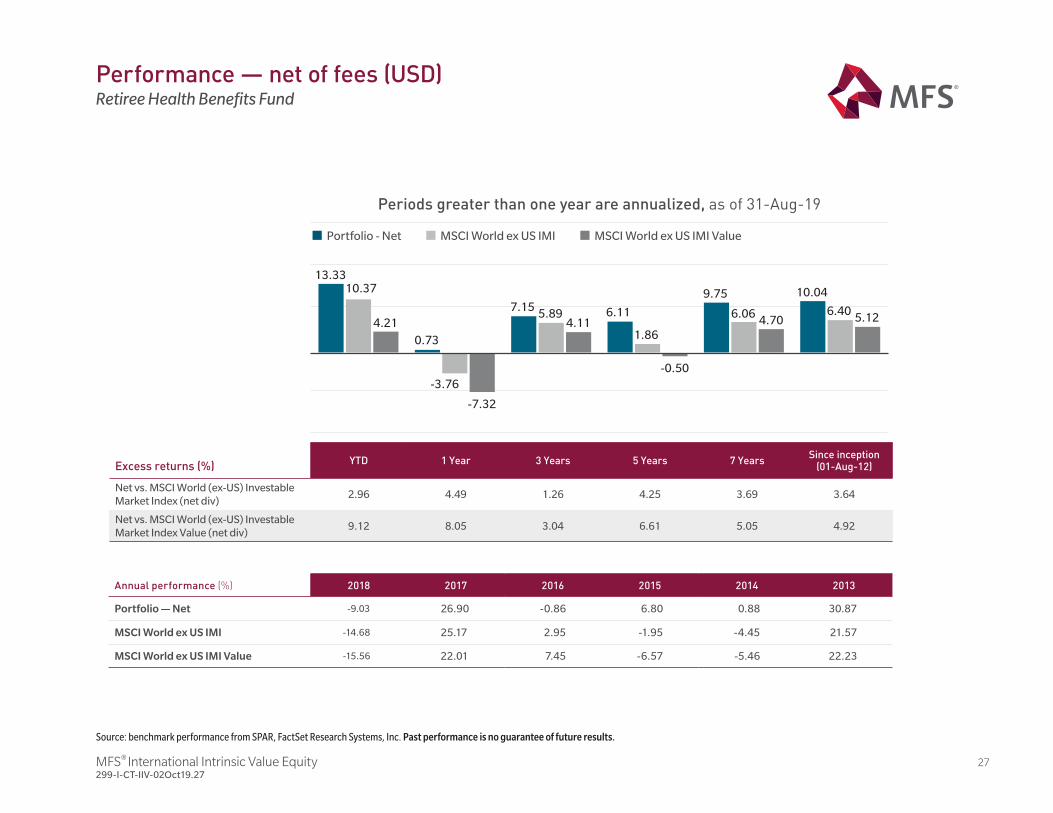
Performance — net of fees (USD)Retiree Health Benefits Fund
13.3310.37
4.21
0.73
-3.76
-7.32
7.15 5.894.11
6.11
1.86
-0.50
9.75
6.06 4.70
10.04
6.40 5.12
Periods greater than one year are annualized, as of 31-Aug-19
Annual performance (%) 2018 2017 2016 2015 2014 2013
Portfolio — Net -9.03 26.90 -0.86 6.80 0.88 30.87
MSCI World ex US IMI -14.68 25.17 2.95 -1.95 -4.45 21.57
MSCI World ex US IMI Value -15.56 22.01 7.45 -6.57 -5.46 22.23
Excess returns (%)YTD 1 Year 3 Years 5 Years 7 Years
Since inception (01-Aug-12)
Net vs. MSCI World (ex-US) Investable Market Index (net div)
2.96 4.49 1.26 4.25 3.69 3.64
Net vs. MSCI World (ex-US) Investable Market Index Value (net div)
9.12 8.05 3.04 6.61 5.05 4.92
Portfolio - Net MSCI World ex US IMI Value MSCI World ex US IMI
MFS® International Intrinsic Value Equity 28299-I-CT-IIV-02Oct19.28
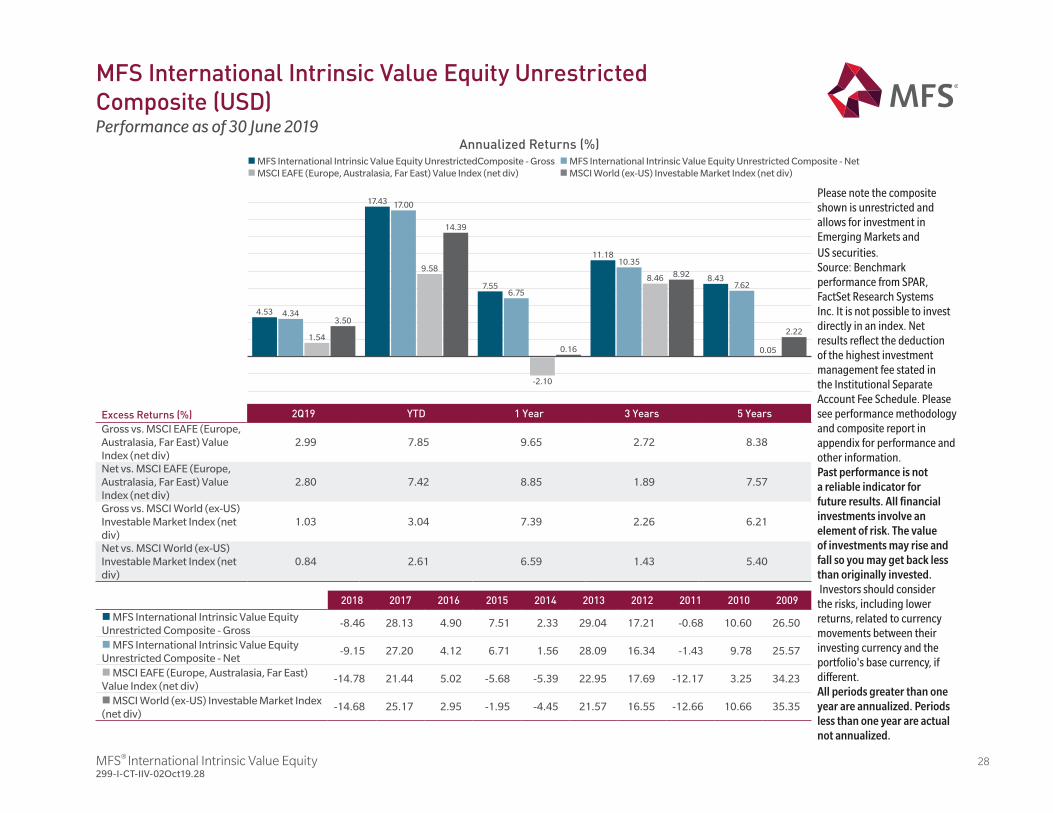
Annualized Returns (%)
Excess Returns (%) 2Q19 YTD 1 Year 3 Years 5 YearsGross vs. MSCI EAFE (Europe, Australasia, Far East) Value Index (net div)
2.99 7.85 9.65 2.72 8.38
Net vs. MSCI EAFE (Europe, Australasia, Far East) Value Index (net div)
2.80 7.42 8.85 1.89 7.57
Gross vs. MSCI World (ex-US) Investable Market Index (net div)
1.03 3.04 7.39 2.26 6.21
Net vs. MSCI World (ex-US) Investable Market Index (net div)
0.84 2.61 6.59 1.43 5.40
2018 2017 2016 2015 2014 2013 2012 2011 2010 2009
n MFS International Intrinsic Value Equity Unrestricted Composite - Gross
-8.46 28.13 4.90 7.51 2.33 29.04 17.21 -0.68 10.60 26.50
n MFS International Intrinsic Value Equity Unrestricted Composite - Net
-9.15 27.20 4.12 6.71 1.56 28.09 16.34 -1.43 9.78 25.57
n MSCI EAFE (Europe, Australasia, Far East) Value Index (net div)
-14.78 21.44 5.02 -5.68 -5.39 22.95 17.69 -12.17 3.25 34.23
n MSCI World (ex-US) Investable Market Index (net div)
-14.68 25.17 2.95 -1.95 -4.45 21.57 16.55 -12.66 10.66 35.35
n MFS International Intrinsic Value Equity UnrestrictedComposite - Grossn MSCI EAFE (Europe, Australasia, Far East) Value Index (net div)
n MFS International Intrinsic Value Equity Unrestricted Composite - Netn MSCI World (ex-US) Investable Market Index (net div)
Please note the composite shown is unrestricted and allows for investment in Emerging Markets and US securities. Source: Benchmark performance from SPAR, FactSet Research Systems Inc. It is not possible to invest directly in an index. Net results reflect the deduction of the highest investment management fee stated in the Institutional Separate Account Fee Schedule. Please see performance methodology and composite report in appendix for performance and other information.Past performance is not a reliable indicator for future results. All financial investments involve an element of risk. The value of investments may rise and fall so you may get back less than originally invested. Investors should consider the risks, including lower returns, related to currency movements between their investing currency and the portfolio's base currency, if different.All periods greater than one year are annualized. Periods less than one year are actual not annualized.
MFS International Intrinsic Value Equity Unrestricted Composite (USD)Performance as of 30 June 2019
4.53 4.34
1.54
3.50
17.43 17.00
9.58
14.39
7.556.75
-2.10
0.16
11.1810.35
8.46 8.92 8.437.62
0.05
2.22
MFS® International Intrinsic Value Equity 29299-I-CT-IIV-02Oct19.29
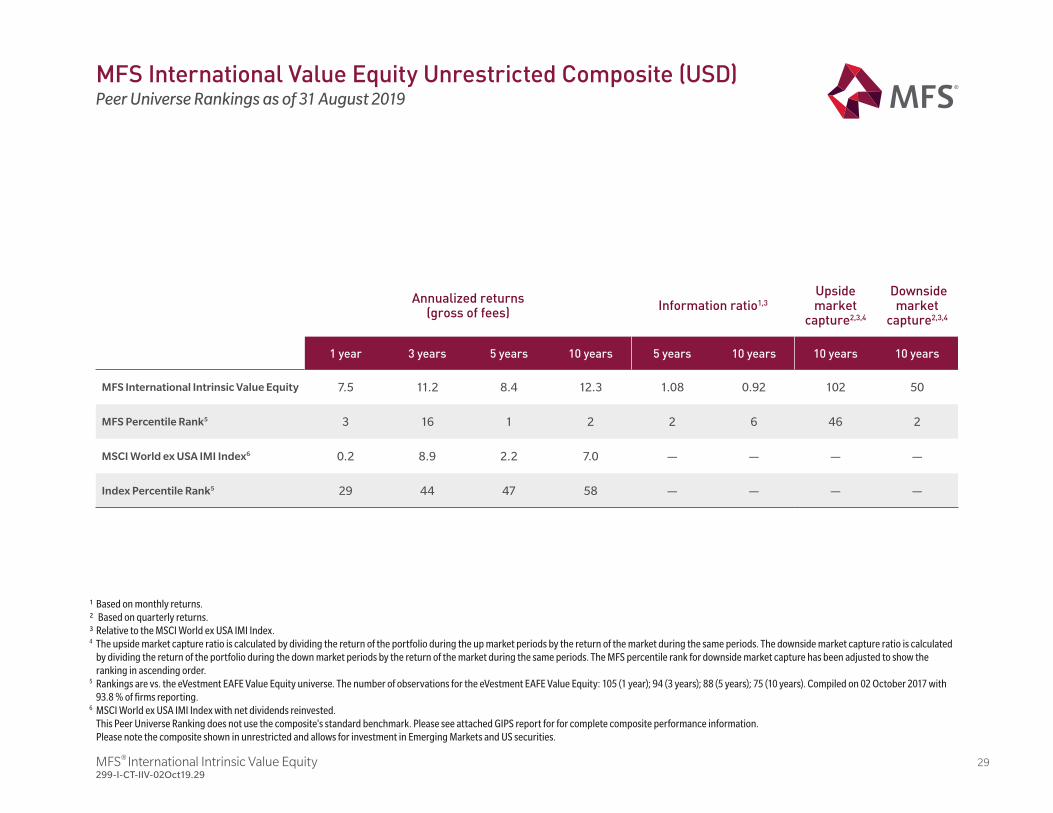
¹ Based on monthly returns.² Based on quarterly returns.³ Relative to the MSCI World ex USA IMI Index.4 The upside market capture ratio is calculated by dividing the return of the portfolio during the up market periods by the return of the market during the same periods. The downside market capture ratio is calculated
by dividing the return of the portfolio during the down market periods by the return of the market during the same periods. The MFS percentile rank for downside market capture has been adjusted to show the ranking in ascending order.
5 Rankings are vs. the eVestment EAFE Value Equity universe. The number of observations for the eVestment EAFE Value Equity: 105 (1 year); 94 (3 years); 88 (5 years); 75 (10 years). Compiled on 02 October 2017 with 93.8 % of firms reporting.
6 MSCI World ex USA IMI Index with net dividends reinvested. This Peer Universe Ranking does not use the composite's standard benchmark. Please see attached GIPS report for for complete composite performance information. Please note the composite shown in unrestricted and allows for investment in Emerging Markets and US securities.
Annualized returns (gross of fees)
Information ratio1,3
Upside market
capture2,3,4
Downside market
capture2,3,4
1 year 3 years 5 years 10 years 5 years 10 years 10 years 10 years
MFS International Intrinsic Value Equity 7.5 11.2 8.4 12.3 1.08 0.92 102 50
MFS Percentile Rank5 3 16 1 2 2 6 46 2
MSCI World ex USA IMI Index6 0.2 8.9 2.2 7.0 — — — —
Index Percentile Rank5 29 44 47 58 — — — —
MFS International Value Equity Unrestricted Composite (USD)Peer Universe Rankings as of 31 August 2019
MFS® International Intrinsic Value Equity 30299-I-CT-IIV-02Oct19.30
Please note the composite shown is unrestricted and allows for investment in Emerging Markets and US securities.
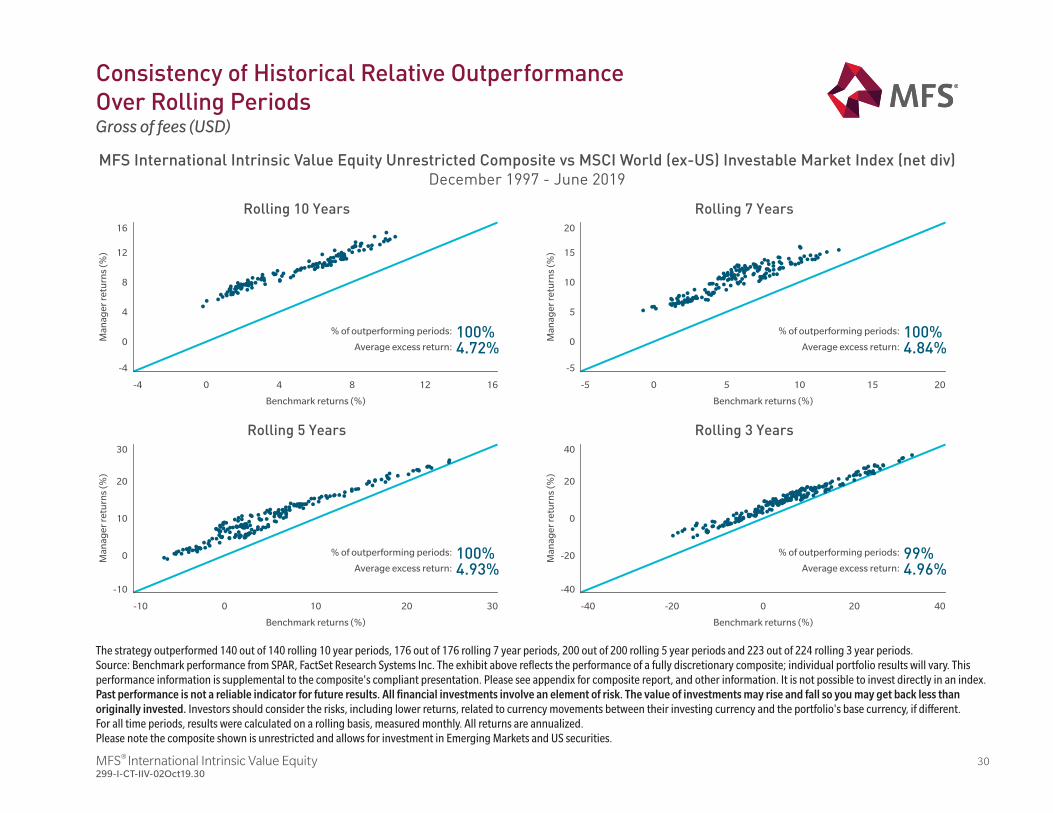
MFS International Intrinsic Value Equity Unrestricted Composite vs MSCI World (ex-US) Investable Market Index (net div)December 1997 - June 2019
Benchmark returns (%)Benchmark returns (%)
Benchmark returns (%)Benchmark returns (%)
Rolling 10 Years
-4 0 4 8 12 16
-4
0
4
8
12
16
Man
ager
ret
urn
s (%
)
Rolling 7 Years
-5 0 5 10 15 20
-5
0
5
10
15
20
Man
ager
ret
urn
s (%
)
Rolling 5 Years
-10 0 10 20 30
-10
0
10
20
30
Man
ager
ret
urn
s (%
)
Rolling 3 Years
-40 -20 0 20 40
-40
-20
0
20
40
Man
ager
ret
urn
s (%
)
% of outperforming periods:
Average excess return:100%4.72%
% of outperforming periods:
Average excess return:100%4.84%
% of outperforming periods:
Average excess return:100%4.93%
% of outperforming periods:
Average excess return:99%4.96%
MFS International Intrinsic Value Equity Composite vs. MSCI World (ex-US) Investable Market Index (net div)December 1997 - June 2019
The strategy outperformed 140 out of 140 rolling 10 year periods, 176 out of 176 rolling 7 year periods, 200 out of 200 rolling 5 year periods and 223 out of 224 rolling 3 year periods.Source: Benchmark performance from SPAR, FactSet Research Systems Inc. The exhibit above reflects the performance of a fully discretionary composite; individual portfolio results will vary. This performance information is supplemental to the composite's compliant presentation. Please see appendix for composite report, and other information. It is not possible to invest directly in an index.Past performance is not a reliable indicator for future results. All financial investments involve an element of risk. The value of investments may rise and fall so you may get back less than originally invested. Investors should consider the risks, including lower returns, related to currency movements between their investing currency and the portfolio's base currency, if different.For all time periods, results were calculated on a rolling basis, measured monthly. All returns are annualized.
Consistency of Historical Relative OutperformanceOver Rolling PeriodsGross of fees (USD)
MFS® International Intrinsic Value Equity 31299-I-CT-IIV-02Oct19.31
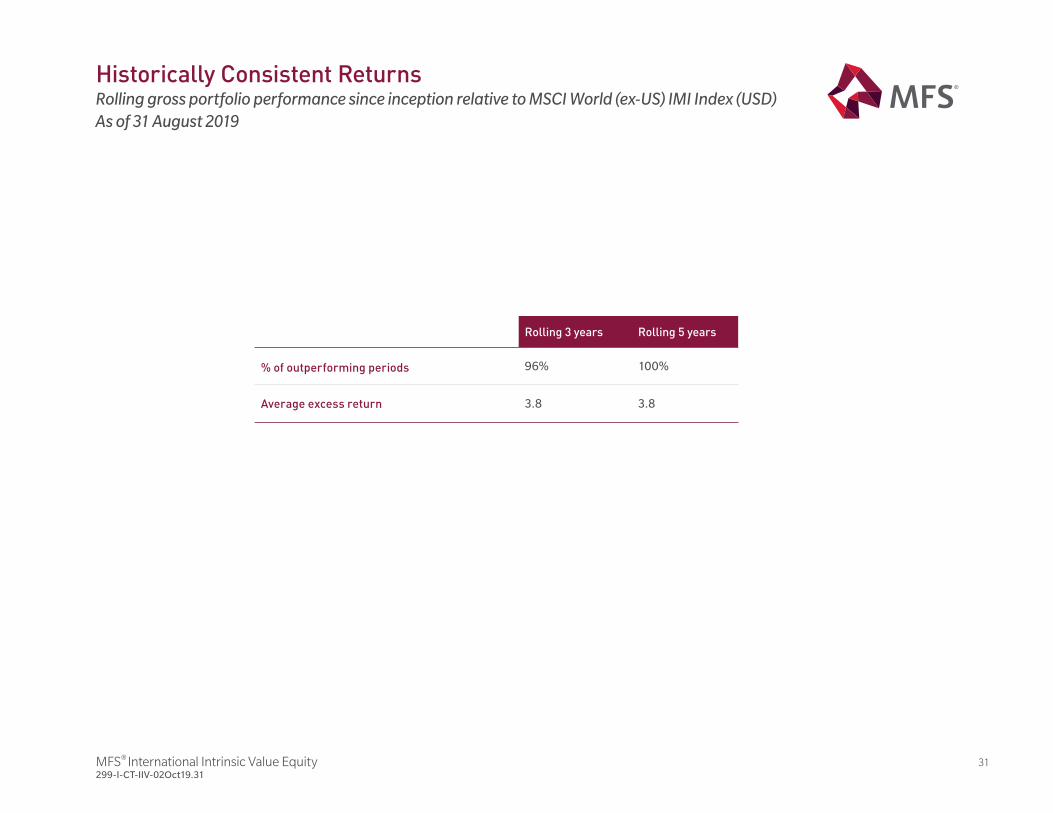
Rolling 3 years Rolling 5 years
% of outperforming periods 96% 100%
Average excess return 3.8 3.8
Historically Consistent ReturnsRolling gross portfolio performance since inception relative to MSCI World (ex-US) IMI Index (USD)As of 31 August 2019
MFS® International Intrinsic Value Equity 32299-I-CT-IIV-02Oct19.32
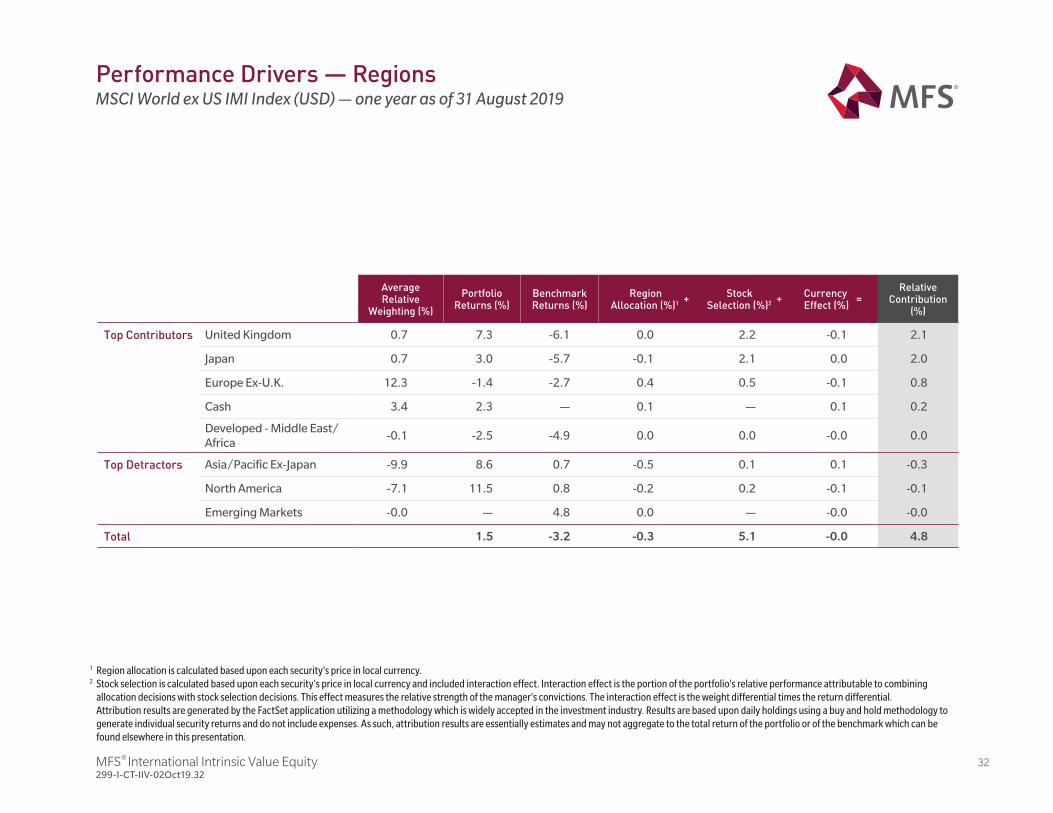
Performance Drivers — RegionsMSCI World ex US IMI Index (USD) — one year as of 31 August 2019
1 Region allocation is calculated based upon each security's price in local currency.2 Stock selection is calculated based upon each security's price in local currency and included interaction effect. Interaction effect is the portion of the portfolio's relative performance attributable to combining
allocation decisions with stock selection decisions. This effect measures the relative strength of the manager's convictions. The interaction effect is the weight differential times the return differential.Attribution results are generated by the FactSet application utilizing a methodology which is widely accepted in the investment industry. Results are based upon daily holdings using a buy and hold methodology to generate individual security returns and do not include expenses. As such, attribution results are essentially estimates and may not aggregate to the total return of the portfolio or of the benchmark which can be found elsewhere in this presentation.
Average Relative
Weighting (%)
Portfolio Returns (%)
Benchmark Returns (%)
Region Allocation (%)1
+ Stock Selection (%)2
+Currency Effect (%)
=Relative
Contribution (%)
Top Contributors United Kingdom 0.7 7.3 -6.1 0.0 2.2 -0.1 2.1
Japan 0.7 3.0 -5.7 -0.1 2.1 0.0 2.0
Europe Ex-U.K. 12.3 -1.4 -2.7 0.4 0.5 -0.1 0.8
Cash 3.4 2.3 — 0.1 — 0.1 0.2
Developed - Middle East/Africa
-0.1 -2.5 -4.9 0.0 0.0 -0.0 0.0
Top Detractors Asia/Pacific Ex-Japan -9.9 8.6 0.7 -0.5 0.1 0.1 -0.3
North America -7.1 11.5 0.8 -0.2 0.2 -0.1 -0.1
Emerging Markets -0.0 — 4.8 0.0 — -0.0 -0.0
Total 1.5 -3.2 -0.3 5.1 -0.0 4.8
MFS® International Intrinsic Value Equity 33299-I-CT-IIV-02Oct19.33
Average Relative
Weighting (%)
Portfolio Returns (%)
Benchmark Returns (%)
Sector Allocation (%)1
+ Stock Selection (%)2
+ Currency Effect (%)
=Relative
Contribution (%)
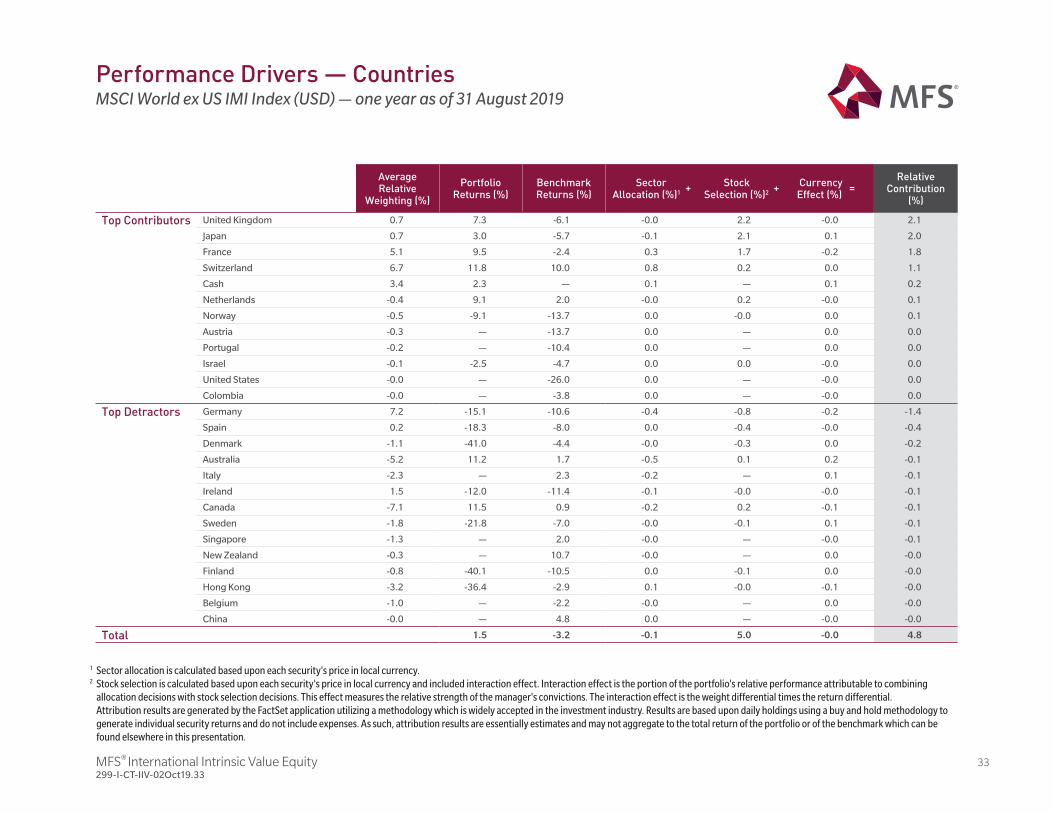
Top Contributors United Kingdom 0.7 7.3 -6.1 -0.0 2.2 -0.0 2.1
Japan 0.7 3.0 -5.7 -0.1 2.1 0.1 2.0
France 5.1 9.5 -2.4 0.3 1.7 -0.2 1.8
Switzerland 6.7 11.8 10.0 0.8 0.2 0.0 1.1
Cash 3.4 2.3 — 0.1 — 0.1 0.2
Netherlands -0.4 9.1 2.0 -0.0 0.2 -0.0 0.1
Norway -0.5 -9.1 -13.7 0.0 -0.0 0.0 0.1
Austria -0.3 — -13.7 0.0 — 0.0 0.0
Portugal -0.2 — -10.4 0.0 — 0.0 0.0
Israel -0.1 -2.5 -4.7 0.0 0.0 -0.0 0.0
United States -0.0 — -26.0 0.0 — -0.0 0.0
Colombia -0.0 — -3.8 0.0 — -0.0 0.0
Top Detractors Germany 7.2 -15.1 -10.6 -0.4 -0.8 -0.2 -1.4
Spain 0.2 -18.3 -8.0 0.0 -0.4 -0.0 -0.4
Denmark -1.1 -41.0 -4.4 -0.0 -0.3 0.0 -0.2
Australia -5.2 11.2 1.7 -0.5 0.1 0.2 -0.1
Italy -2.3 — 2.3 -0.2 — 0.1 -0.1
Ireland 1.5 -12.0 -11.4 -0.1 -0.0 -0.0 -0.1
Canada -7.1 11.5 0.9 -0.2 0.2 -0.1 -0.1
Sweden -1.8 -21.8 -7.0 -0.0 -0.1 0.1 -0.1
Singapore -1.3 — 2.0 -0.0 — -0.0 -0.1
New Zealand -0.3 — 10.7 -0.0 — 0.0 -0.0
Finland -0.8 -40.1 -10.5 0.0 -0.1 0.0 -0.0
Hong Kong -3.2 -36.4 -2.9 0.1 -0.0 -0.1 -0.0
Belgium -1.0 — -2.2 -0.0 — 0.0 -0.0
China -0.0 — 4.8 0.0 — -0.0 -0.0
Total 1.5 -3.2 -0.1 5.0 -0.0 4.8
Performance Drivers — CountriesMSCI World ex US IMI Index (USD) — one year as of 31 August 2019
1 Sector allocation is calculated based upon each security's price in local currency.2 Stock selection is calculated based upon each security's price in local currency and included interaction effect. Interaction effect is the portion of the portfolio's relative performance attributable to combining
allocation decisions with stock selection decisions. This effect measures the relative strength of the manager's convictions. The interaction effect is the weight differential times the return differential.Attribution results are generated by the FactSet application utilizing a methodology which is widely accepted in the investment industry. Results are based upon daily holdings using a buy and hold methodology to generate individual security returns and do not include expenses. As such, attribution results are essentially estimates and may not aggregate to the total return of the portfolio or of the benchmark which can be found elsewhere in this presentation.
MFS® International Intrinsic Value Equity 34299-I-CT-IIV-02Oct19.34
Average Relative
Weighting (%)
Portfolio Returns (%)
Benchmark Returns (%)
Sector Allocation (%)1 +
Stock Selection (%)2 +
Currency Effect (%)
=Relative
Contribution (%)
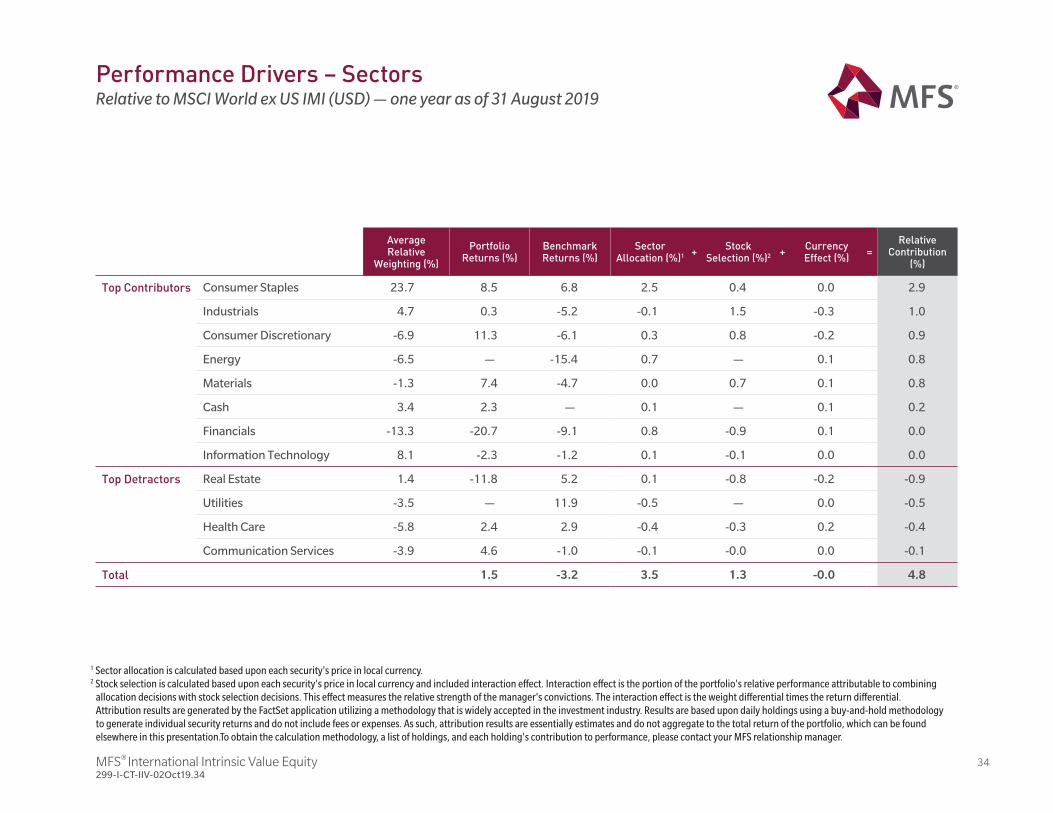
Top Contributors Consumer Staples 23.7 8.5 6.8 2.5 0.4 0.0 2.9
Industrials 4.7 0.3 -5.2 -0.1 1.5 -0.3 1.0
Consumer Discretionary -6.9 11.3 -6.1 0.3 0.8 -0.2 0.9
Energy -6.5 — -15.4 0.7 — 0.1 0.8
Materials -1.3 7.4 -4.7 0.0 0.7 0.1 0.8
Cash 3.4 2.3 — 0.1 — 0.1 0.2
Financials -13.3 -20.7 -9.1 0.8 -0.9 0.1 0.0
Information Technology 8.1 -2.3 -1.2 0.1 -0.1 0.0 0.0
Top Detractors Real Estate 1.4 -11.8 5.2 0.1 -0.8 -0.2 -0.9
Utilities -3.5 — 11.9 -0.5 — 0.0 -0.5
Health Care -5.8 2.4 2.9 -0.4 -0.3 0.2 -0.4
Communication Services -3.9 4.6 -1.0 -0.1 -0.0 0.0 -0.1
Total 1.5 -3.2 3.5 1.3 -0.0 4.8
1 Sector allocation is calculated based upon each security's price in local currency.2 Stock selection is calculated based upon each security's price in local currency and included interaction effect. Interaction effect is the portion of the portfolio's relative performance attributable to combining
allocation decisions with stock selection decisions. This effect measures the relative strength of the manager's convictions. The interaction effect is the weight differential times the return differential.Attribution results are generated by the FactSet application utilizing a methodology that is widely accepted in the investment industry. Results are based upon daily holdings using a buy-and-hold methodology to generate individual security returns and do not include fees or expenses. As such, attribution results are essentially estimates and do not aggregate to the total return of the portfolio, which can be found elsewhere in this presentation.To obtain the calculation methodology, a list of holdings, and each holding's contribution to performance, please contact your MFS relationship manager.
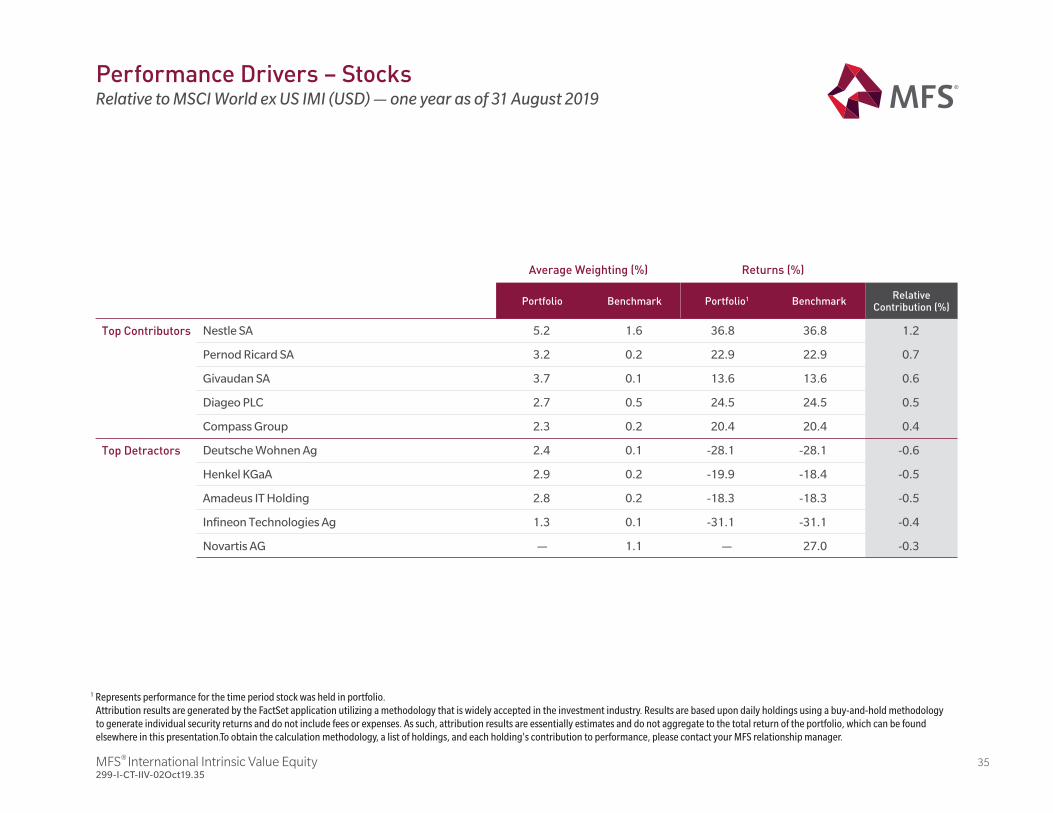
Performance Drivers – SectorsRelative to MSCI World ex US IMI (USD) — one year as of 31 August 2019
MFS® International Intrinsic Value Equity 35299-I-CT-IIV-02Oct19.35
Average Weighting (%) Returns (%)
Portfolio Benchmark Portfolio1 BenchmarkRelative
Contribution (%)
Top Contributors Nestle SA 5.2 1.6 36.8 36.8 1.2
Pernod Ricard SA 3.2 0.2 22.9 22.9 0.7
Givaudan SA 3.7 0.1 13.6 13.6 0.6
Diageo PLC 2.7 0.5 24.5 24.5 0.5
Compass Group 2.3 0.2 20.4 20.4 0.4
Top Detractors Deutsche Wohnen Ag 2.4 0.1 -28.1 -28.1 -0.6
Henkel KGaA 2.9 0.2 -19.9 -18.4 -0.5
Amadeus IT Holding 2.8 0.2 -18.3 -18.3 -0.5
Infineon Technologies Ag 1.3 0.1 -31.1 -31.1 -0.4
Novartis AG — 1.1 — 27.0 -0.3
1 Represents performance for the time period stock was held in portfolio.Attribution results are generated by the FactSet application utilizing a methodology that is widely accepted in the investment industry. Results are based upon daily holdings using a buy-and-hold methodology to generate individual security returns and do not include fees or expenses. As such, attribution results are essentially estimates and do not aggregate to the total return of the portfolio, which can be found elsewhere in this presentation.To obtain the calculation methodology, a list of holdings, and each holding's contribution to performance, please contact your MFS relationship manager.
Performance Drivers – StocksRelative to MSCI World ex US IMI (USD) — one year as of 31 August 2019
Portfolio Review and Characteristics
MFS® International Intrinsic Value Equity 37299-I-CT-IIV-02Oct19.37
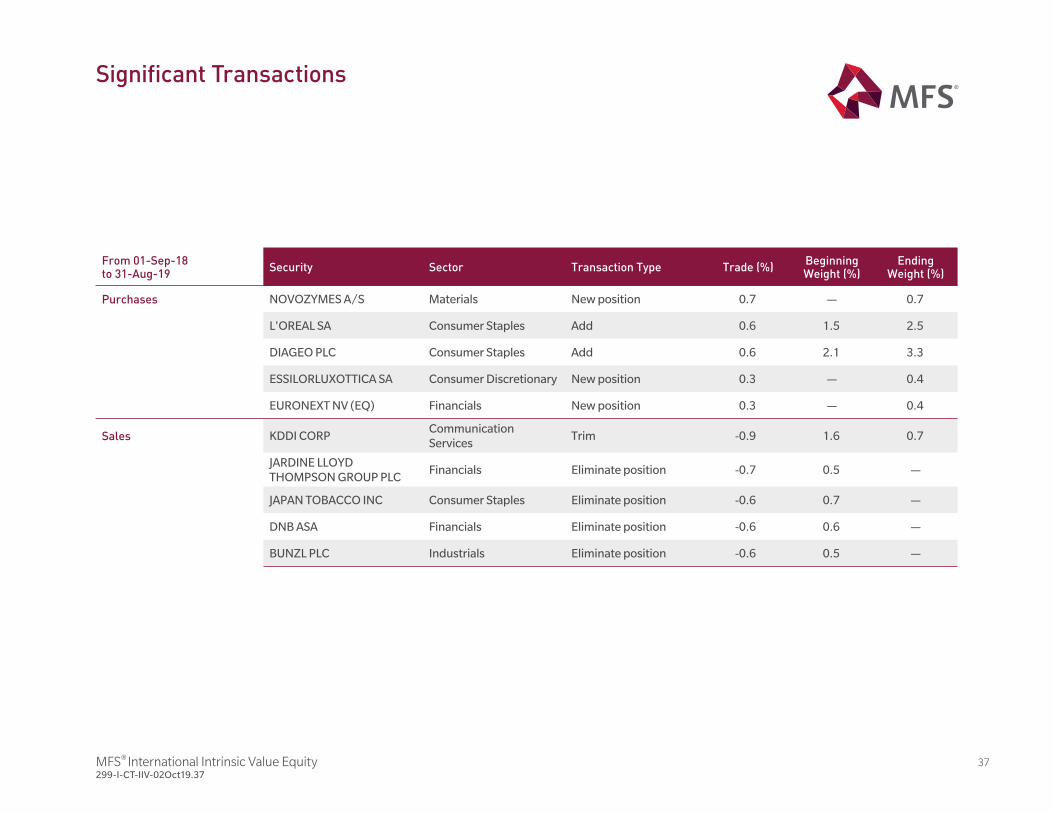
From 01-Sep-18to 31-Aug-19
Security Sector Transaction Type Trade (%)Beginning Weight (%)
Ending Weight (%)
Purchases NOVOZYMES A/S Materials New position 0.7 — 0.7
L'OREAL SA Consumer Staples Add 0.6 1.5 2.5
DIAGEO PLC Consumer Staples Add 0.6 2.1 3.3
ESSILORLUXOTTICA SA Consumer Discretionary New position 0.3 — 0.4
EURONEXT NV (EQ) Financials New position 0.3 — 0.4
Sales KDDI CORPCommunication Services
Trim -0.9 1.6 0.7
JARDINE LLOYD THOMPSON GROUP PLC
Financials Eliminate position -0.7 0.5 —
JAPAN TOBACCO INC Consumer Staples Eliminate position -0.6 0.7 —
DNB ASA Financials Eliminate position -0.6 0.6 —
BUNZL PLC Industrials Eliminate position -0.6 0.5 —
Significant Transactions
MFS® International Intrinsic Value Equity 38299-I-CT-IIV-02Oct19.38
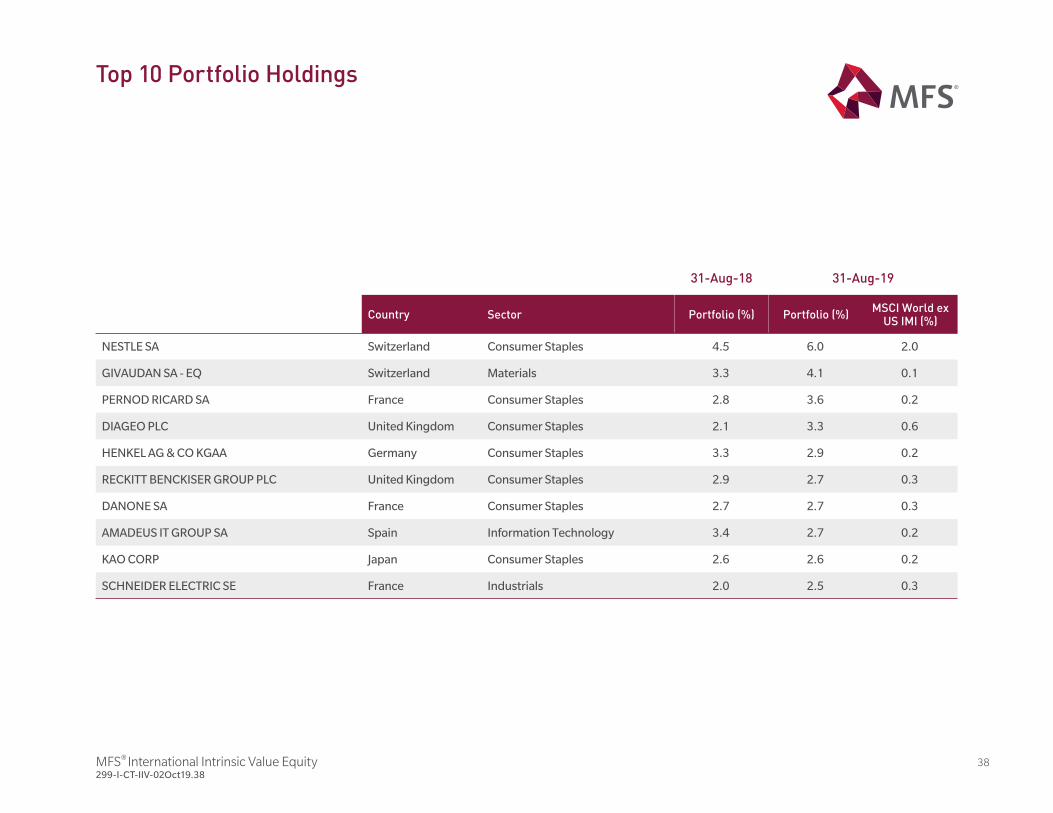
31-Aug-18 31-Aug-19
Country Sector Portfolio (%) Portfolio (%)MSCI World ex
US IMI (%)
NESTLE SA Switzerland Consumer Staples 4.5 6.0 2.0
GIVAUDAN SA - EQ Switzerland Materials 3.3 4.1 0.1
PERNOD RICARD SA France Consumer Staples 2.8 3.6 0.2
DIAGEO PLC United Kingdom Consumer Staples 2.1 3.3 0.6
HENKEL AG & CO KGAA Germany Consumer Staples 3.3 2.9 0.2
RECKITT BENCKISER GROUP PLC United Kingdom Consumer Staples 2.9 2.7 0.3
DANONE SA France Consumer Staples 2.7 2.7 0.3
AMADEUS IT GROUP SA Spain Information Technology 3.4 2.7 0.2
KAO CORP Japan Consumer Staples 2.6 2.6 0.2
SCHNEIDER ELECTRIC SE France Industrials 2.0 2.5 0.3
Top 10 Portfolio Holdings
MFS® International Intrinsic Value Equity 39299-I-CT-IIV-02Oct19.39
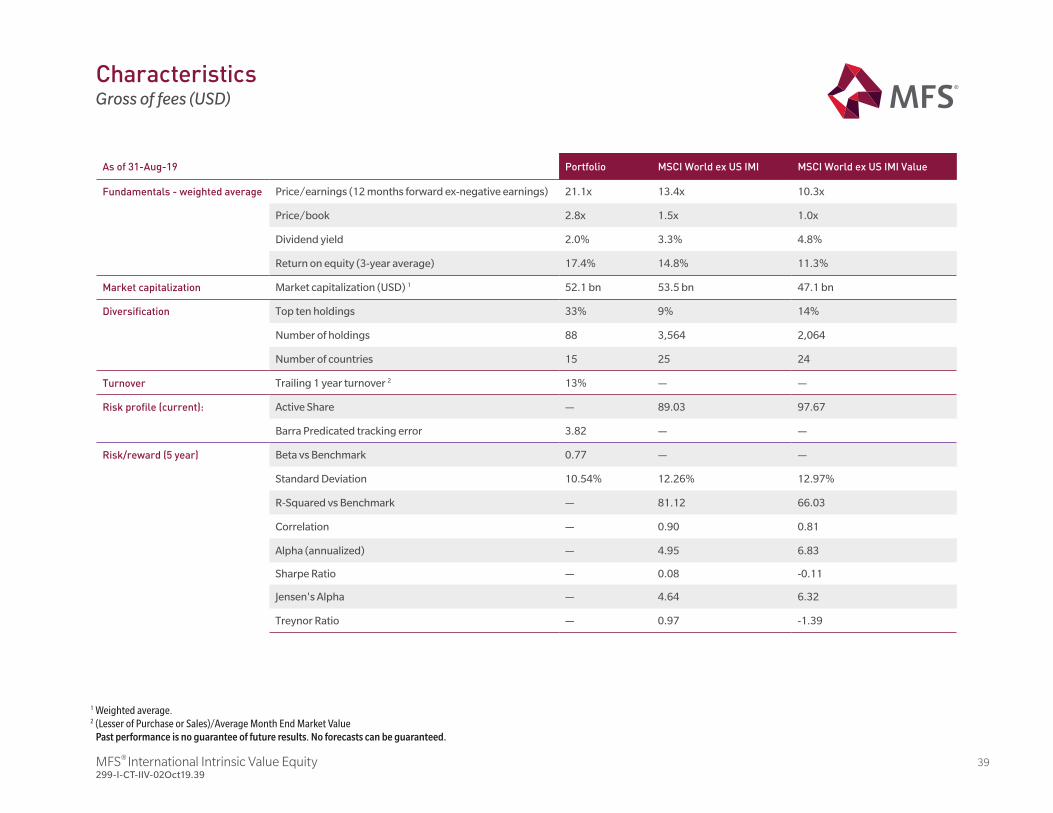
CharacteristicsGross of fees (USD)
1 Weighted average.2 (Lesser of Purchase or Sales)/Average Month End Market Value
Past performance is no guarantee of future results. No forecasts can be guaranteed.
As of 31-Aug-19 Portfolio MSCI World ex US IMI MSCI World ex US IMI Value
Fundamentals - weighted average Price/earnings (12 months forward ex-negative earnings) 21.1x 13.4x 10.3x
Price/book 2.8x 1.5x 1.0x
Dividend yield 2.0% 3.3% 4.8%
Return on equity (3-year average) 17.4% 14.8% 11.3%
Market capitalization Market capitalization (USD) 1 52.1 bn 53.5 bn 47.1 bn
Diversification Top ten holdings 33% 9% 14%
Number of holdings 88 3,564 2,064
Number of countries 15 25 24
Turnover Trailing 1 year turnover 2 13% — —
Risk profile (current): Active Share — 89.03 97.67
Barra Predicated tracking error 3.82 — —
Risk/reward (5 year) Beta vs Benchmark 0.77 — —
Standard Deviation 10.54% 12.26% 12.97%
R-Squared vs Benchmark — 81.12 66.03
Correlation — 0.90 0.81
Alpha (annualized) — 4.95 6.83
Sharpe Ratio — 0.08 -0.11
Jensen's Alpha — 4.64 6.32
Treynor Ratio — 0.97 -1.39
MFS® International Intrinsic Value Equity 40299-I-CT-IIV-02Oct19.40
NorthAmerica
Europeex-U.K.
UnitedKingdom
Developed –Middle East/
Africa
Japan Asia PacificEx-Japan
EmergingMarkets
OtherCountries
Perc
ent (
%)
-7.2
-1.7
12.4
1.3 1.0
-0.7
0.0
-0.2
0.5
3.7
-10.2
-7.6
0.0
4.9
0.00.5
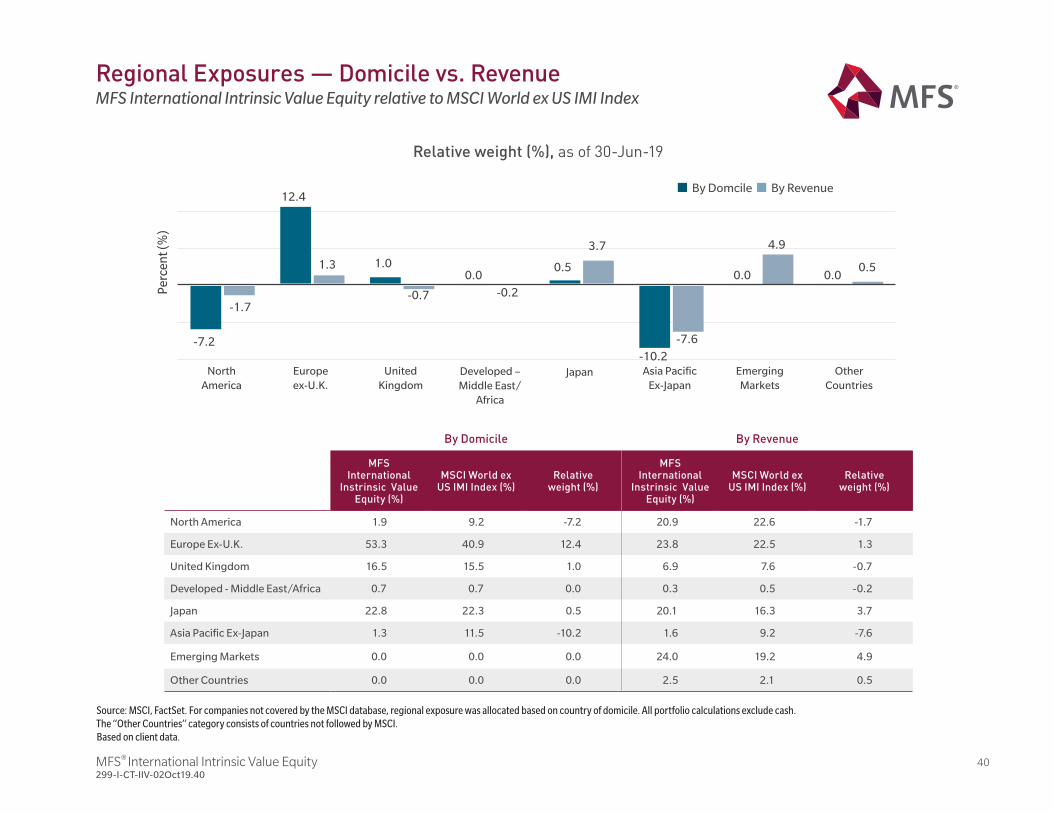
Regional Exposures — Domicile vs. RevenueMFS International Intrinsic Value Equity relative to MSCI World ex US IMI Index
Source: MSCI, FactSet. For companies not covered by the MSCI database, regional exposure was allocated based on country of domicile. All portfolio calculations exclude cash.The “Other Countries” category consists of countries not followed by MSCI.Based on client data.
By Domicile By Revenue
MFS International
Instrinsic Value Equity (%)
MSCI World ex US IMI Index (%)
Relative weight (%)
MFS International
Instrinsic Value Equity (%)
MSCI World ex US IMI Index (%)
Relative weight (%)
North America 1.9 9.2 -7.2 20.9 22.6 -1.7
Europe Ex-U.K. 53.3 40.9 12.4 23.8 22.5 1.3
United Kingdom 16.5 15.5 1.0 6.9 7.6 -0.7
Developed - Middle East/Africa 0.7 0.7 0.0 0.3 0.5 -0.2
Japan 22.8 22.3 0.5 20.1 16.3 3.7
Asia Pacific Ex-Japan 1.3 11.5 -10.2 1.6 9.2 -7.6
Emerging Markets 0.0 0.0 0.0 24.0 19.2 4.9
Other Countries 0.0 0.0 0.0 2.5 2.1 0.5
Relative weight (%), as of 30-Jun-19
By RevenueBy Domcile
MFS® International Intrinsic Value Equity 41299-I-CT-IIV-02Oct19.41
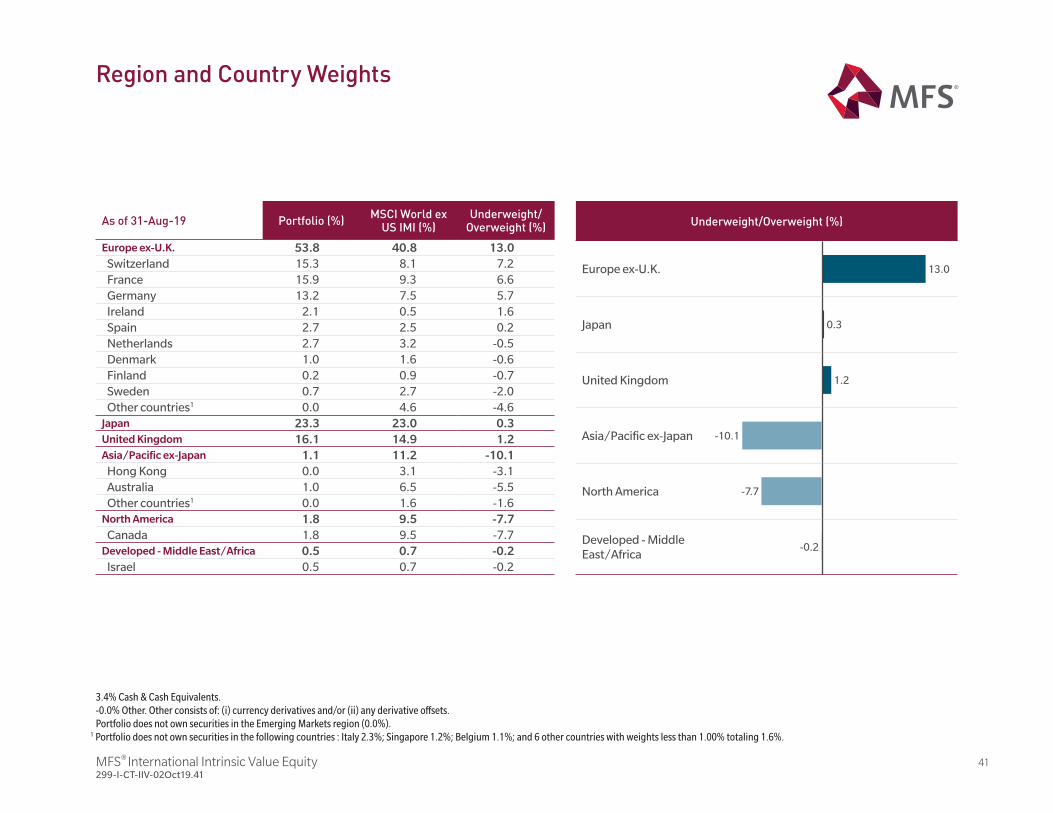
As of 31-Aug-19 Portfolio (%)MSCI World ex
US IMI (%)Underweight/
Overweight (%)
Europe ex-U.K. 53.8 40.8 13.0
Switzerland 15.3 8.1 7.2France 15.9 9.3 6.6Germany 13.2 7.5 5.7Ireland 2.1 0.5 1.6Spain 2.7 2.5 0.2Netherlands 2.7 3.2 -0.5Denmark 1.0 1.6 -0.6Finland 0.2 0.9 -0.7Sweden 0.7 2.7 -2.0Other countries1 0.0 4.6 -4.6
Japan 23.3 23.0 0.3
United Kingdom 16.1 14.9 1.2
Asia/Pacific ex-Japan 1.1 11.2 -10.1
Hong Kong 0.0 3.1 -3.1Australia 1.0 6.5 -5.5Other countries1 0.0 1.6 -1.6
North America 1.8 9.5 -7.7
Canada 1.8 9.5 -7.7Developed - Middle East/Africa 0.5 0.7 -0.2
Israel 0.5 0.7 -0.2
Underweight/Overweight (%)
Europe ex-U.K. 13.0
Japan 0.3
United Kingdom 1.2
Asia/Pacific ex-Japan -10.1
North America -7.7
Developed - Middle East/Africa
-0.2
3.4% Cash & Cash Equivalents.-0.0% Other. Other consists of: (i) currency derivatives and/or (ii) any derivative offsets.Portfolio does not own securities in the Emerging Markets region (0.0%).
1 Portfolio does not own securities in the following countries : Italy 2.3%; Singapore 1.2%; Belgium 1.1%; and 6 other countries with weights less than 1.00% totaling 1.6%.
Region and Country Weights
42
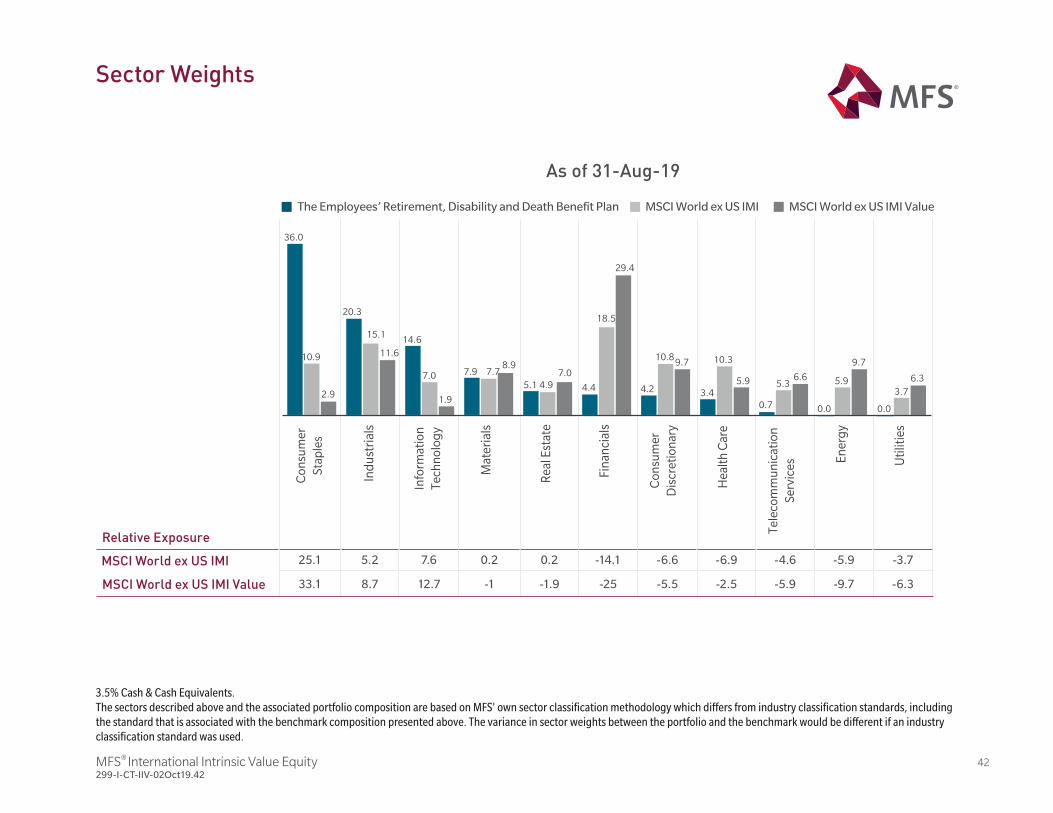
Relative Exposure
MSCI World ex US IMI 25.1 5.2 7.6 0.2 0.2 -14.1 -6.6 -6.9 -4.6 -5.9 -3.7
MSCI World ex US IMI Value 33.1 8.7 12.7 -1 -1.9 -25 -5.5 -2.5 -5.9 -9.7 -6.3
Co
nsu
me
r
Sta
ple
s
Ind
ust
ria
ls
Info
rma
tio
n
Te
ch
no
log
y
Ma
teri
als
Re
al E
sta
te
Fin
an
cia
ls
Co
nsu
me
r
Dis
cre
tio
na
ry
He
alt
h C
are
Te
lec
om
mu
nic
ati
on
Se
rvic
es E
ne
rgy
Uti
litie
s
36.0
10.9
2.9
20.3
15.1
11.6
14.6
7.0
1.9
7.9 7.78.9
5.1 4.9
7.0
4.4
18.5
29.4
4.2
10.89.7
3.4
10.3
5.9
0.7
5.36.6
0.0
5.9
9.7
0.0
3.7
6.3
Sector Weights
3.5% Cash & Cash Equivalents.The sectors described above and the associated portfolio composition are based on MFS own sector classification methodology which differs from industry classification standards, including the standard that is associated with the benchmark composition presented above. The variance in sector weights between the portfolio and the benchmark would be different if an industry classification standard was used.
MFS® International Intrinsic Value Equity 299-I-CT-IIV-02Oct19.42
As of 31-Aug-19
The Employees’ Retirement, Disability and Death Benefit Plan MSCI World ex US IMI MSCI World ex US IMI Value
MFS® International Intrinsic Value Equity 43299-I-CT-IIV-02Oct19.43
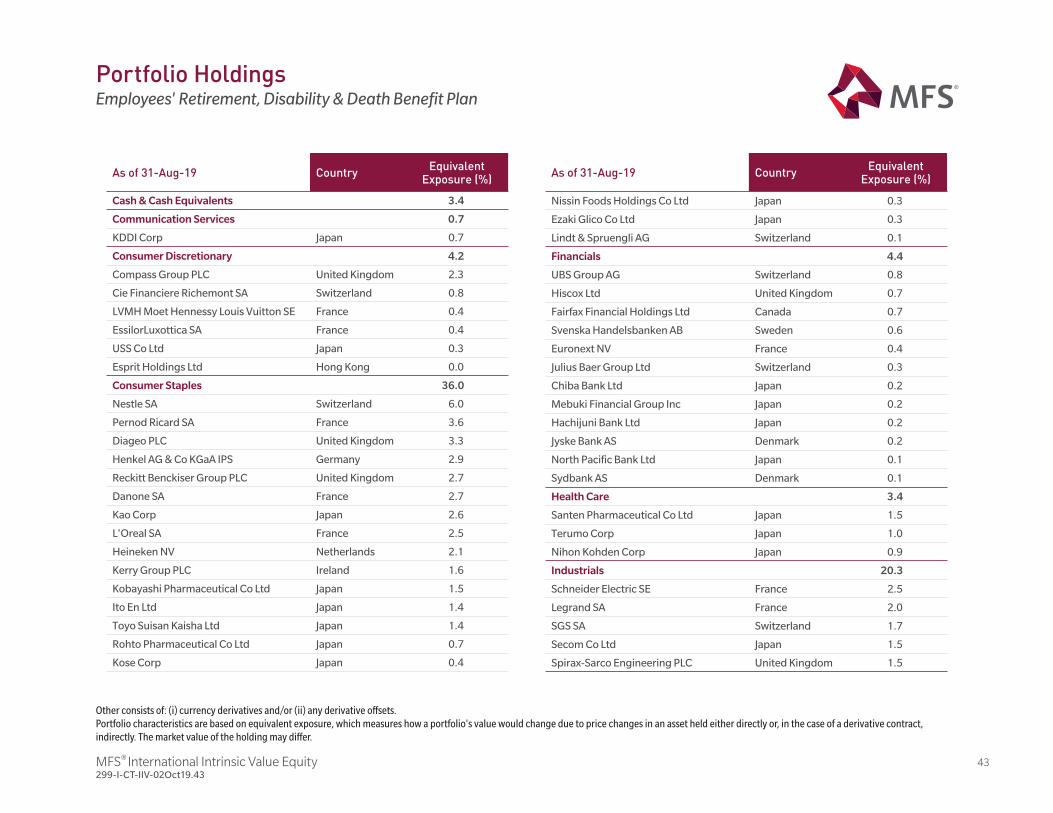
Portfolio Holdings Employees' Retirement, Disability & Death Benefit Plan
As of 31-Aug-19 CountryEquivalent
Exposure (%)
Cash & Cash Equivalents 3.4
Communication Services 0.7
KDDI Corp Japan 0.7
Consumer Discretionary 4.2
Compass Group PLC United Kingdom 2.3
Cie Financiere Richemont SA Switzerland 0.8
LVMH Moet Hennessy Louis Vuitton SE France 0.4
EssilorLuxottica SA France 0.4
USS Co Ltd Japan 0.3
Esprit Holdings Ltd Hong Kong 0.0
Consumer Staples 36.0
Nestle SA Switzerland 6.0
Pernod Ricard SA France 3.6
Diageo PLC United Kingdom 3.3
Henkel AG & Co KGaA IPS Germany 2.9
Reckitt Benckiser Group PLC United Kingdom 2.7
Danone SA France 2.7
Kao Corp Japan 2.6
L'Oreal SA France 2.5
Heineken NV Netherlands 2.1
Kerry Group PLC Ireland 1.6
Kobayashi Pharmaceutical Co Ltd Japan 1.5
Ito En Ltd Japan 1.4
Toyo Suisan Kaisha Ltd Japan 1.4
Rohto Pharmaceutical Co Ltd Japan 0.7
Kose Corp Japan 0.4
As of 31-Aug-19 CountryEquivalent
Exposure (%)
Nissin Foods Holdings Co Ltd Japan 0.3
Ezaki Glico Co Ltd Japan 0.3
Lindt & Spruengli AG Switzerland 0.1
Financials 4.4
UBS Group AG Switzerland 0.8
Hiscox Ltd United Kingdom 0.7
Fairfax Financial Holdings Ltd Canada 0.7
Svenska Handelsbanken AB Sweden 0.6
Euronext NV France 0.4
Julius Baer Group Ltd Switzerland 0.3
Chiba Bank Ltd Japan 0.2
Mebuki Financial Group Inc Japan 0.2
Hachijuni Bank Ltd Japan 0.2
Jyske Bank AS Denmark 0.2
North Pacific Bank Ltd Japan 0.1
Sydbank AS Denmark 0.1
Health Care 3.4
Santen Pharmaceutical Co Ltd Japan 1.5
Terumo Corp Japan 1.0
Nihon Kohden Corp Japan 0.9
Industrials 20.3
Schneider Electric SE France 2.5
Legrand SA France 2.0
SGS SA Switzerland 1.7
Secom Co Ltd Japan 1.5
Spirax-Sarco Engineering PLC United Kingdom 1.5
Other consists of: (i) currency derivatives and/or (ii) any derivative offsets.Portfolio characteristics are based on equivalent exposure, which measures how a portfolio's value would change due to price changes in an asset held either directly or, in the case of a derivative contract, indirectly. The market value of the holding may differ.
MFS® International Intrinsic Value Equity 44299-I-CT-IIV-02Oct19.44
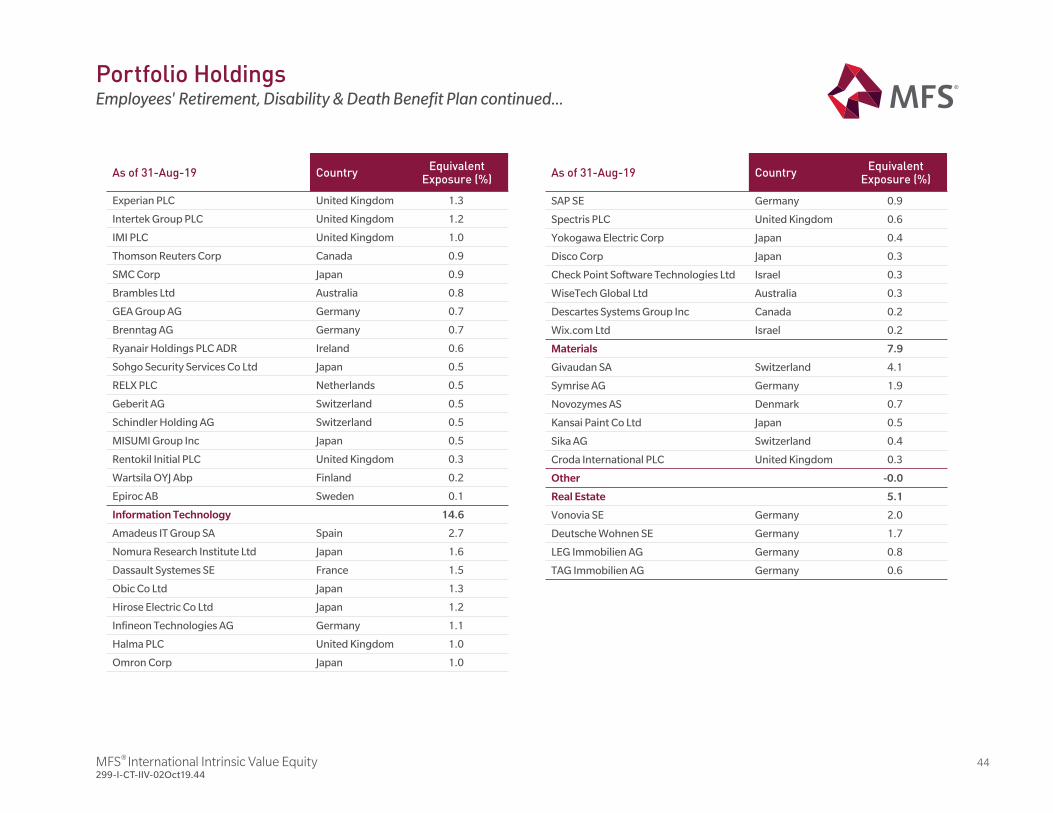
As of 31-Aug-19 CountryEquivalent
Exposure (%)
Experian PLC United Kingdom 1.3
Intertek Group PLC United Kingdom 1.2
IMI PLC United Kingdom 1.0
Thomson Reuters Corp Canada 0.9
SMC Corp Japan 0.9
Brambles Ltd Australia 0.8
GEA Group AG Germany 0.7
Brenntag AG Germany 0.7
Ryanair Holdings PLC ADR Ireland 0.6
Sohgo Security Services Co Ltd Japan 0.5
RELX PLC Netherlands 0.5
Geberit AG Switzerland 0.5
Schindler Holding AG Switzerland 0.5
MISUMI Group Inc Japan 0.5
Rentokil Initial PLC United Kingdom 0.3
Wartsila OYJ Abp Finland 0.2
Epiroc AB Sweden 0.1
Information Technology 14.6
Amadeus IT Group SA Spain 2.7
Nomura Research Institute Ltd Japan 1.6
Dassault Systemes SE France 1.5
Obic Co Ltd Japan 1.3
Hirose Electric Co Ltd Japan 1.2
Infineon Technologies AG Germany 1.1
Halma PLC United Kingdom 1.0
Omron Corp Japan 1.0
As of 31-Aug-19 CountryEquivalent
Exposure (%)
SAP SE Germany 0.9
Spectris PLC United Kingdom 0.6
Yokogawa Electric Corp Japan 0.4
Disco Corp Japan 0.3
Check Point Software Technologies Ltd Israel 0.3
WiseTech Global Ltd Australia 0.3
Descartes Systems Group Inc Canada 0.2
Wix.com Ltd Israel 0.2
Materials 7.9
Givaudan SA Switzerland 4.1
Symrise AG Germany 1.9
Novozymes AS Denmark 0.7
Kansai Paint Co Ltd Japan 0.5
Sika AG Switzerland 0.4
Croda International PLC United Kingdom 0.3
Other -0.0
Real Estate 5.1
Vonovia SE Germany 2.0
Deutsche Wohnen SE Germany 1.7
LEG Immobilien AG Germany 0.8
TAG Immobilien AG Germany 0.6
Portfolio Holdings Employees' Retirement, Disability & Death Benefit Plan continued...
MFS® International Intrinsic Value Equity 45299-I-CT-IIV-02Oct19.45
Other consists of: (i) currency derivatives and/or (ii) any derivative offsets.Portfolio characteristics are based on equivalent exposure, which measures how a portfolio's value would change due to price changes in an asset held either directly or, in the case of a derivative contract, indirectly. The market value of the holding may differ.
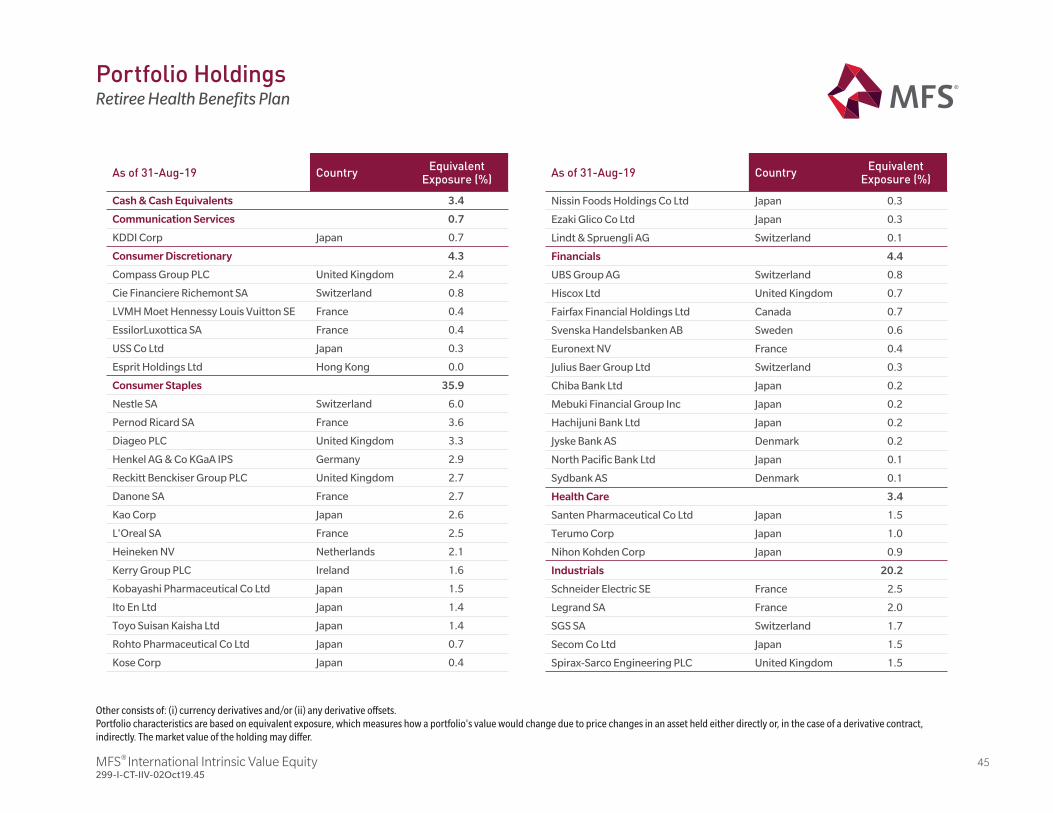
Portfolio HoldingsRetiree Health Benefits Plan
As of 31-Aug-19 CountryEquivalent
Exposure (%)
Cash & Cash Equivalents 3.4
Communication Services 0.7
KDDI Corp Japan 0.7
Consumer Discretionary 4.3
Compass Group PLC United Kingdom 2.4
Cie Financiere Richemont SA Switzerland 0.8
LVMH Moet Hennessy Louis Vuitton SE France 0.4
EssilorLuxottica SA France 0.4
USS Co Ltd Japan 0.3
Esprit Holdings Ltd Hong Kong 0.0
Consumer Staples 35.9
Nestle SA Switzerland 6.0
Pernod Ricard SA France 3.6
Diageo PLC United Kingdom 3.3
Henkel AG & Co KGaA IPS Germany 2.9
Reckitt Benckiser Group PLC United Kingdom 2.7
Danone SA France 2.7
Kao Corp Japan 2.6
L'Oreal SA France 2.5
Heineken NV Netherlands 2.1
Kerry Group PLC Ireland 1.6
Kobayashi Pharmaceutical Co Ltd Japan 1.5
Ito En Ltd Japan 1.4
Toyo Suisan Kaisha Ltd Japan 1.4
Rohto Pharmaceutical Co Ltd Japan 0.7
Kose Corp Japan 0.4
As of 31-Aug-19 CountryEquivalent
Exposure (%)
Nissin Foods Holdings Co Ltd Japan 0.3
Ezaki Glico Co Ltd Japan 0.3
Lindt & Spruengli AG Switzerland 0.1
Financials 4.4
UBS Group AG Switzerland 0.8
Hiscox Ltd United Kingdom 0.7
Fairfax Financial Holdings Ltd Canada 0.7
Svenska Handelsbanken AB Sweden 0.6
Euronext NV France 0.4
Julius Baer Group Ltd Switzerland 0.3
Chiba Bank Ltd Japan 0.2
Mebuki Financial Group Inc Japan 0.2
Hachijuni Bank Ltd Japan 0.2
Jyske Bank AS Denmark 0.2
North Pacific Bank Ltd Japan 0.1
Sydbank AS Denmark 0.1
Health Care 3.4
Santen Pharmaceutical Co Ltd Japan 1.5
Terumo Corp Japan 1.0
Nihon Kohden Corp Japan 0.9
Industrials 20.2
Schneider Electric SE France 2.5
Legrand SA France 2.0
SGS SA Switzerland 1.7
Secom Co Ltd Japan 1.5
Spirax-Sarco Engineering PLC United Kingdom 1.5
MFS® International Intrinsic Value Equity 46299-I-CT-IIV-02Oct19.46
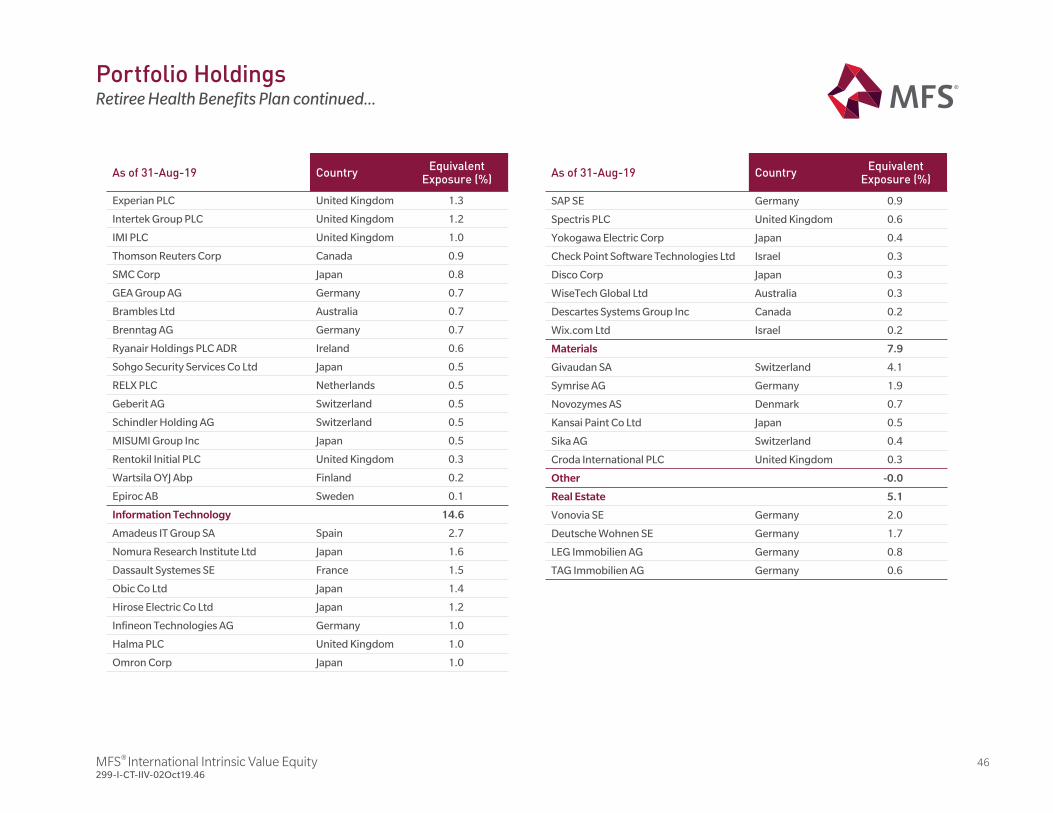
As of 31-Aug-19 CountryEquivalent
Exposure (%)
Experian PLC United Kingdom 1.3
Intertek Group PLC United Kingdom 1.2
IMI PLC United Kingdom 1.0
Thomson Reuters Corp Canada 0.9
SMC Corp Japan 0.8
GEA Group AG Germany 0.7
Brambles Ltd Australia 0.7
Brenntag AG Germany 0.7
Ryanair Holdings PLC ADR Ireland 0.6
Sohgo Security Services Co Ltd Japan 0.5
RELX PLC Netherlands 0.5
Geberit AG Switzerland 0.5
Schindler Holding AG Switzerland 0.5
MISUMI Group Inc Japan 0.5
Rentokil Initial PLC United Kingdom 0.3
Wartsila OYJ Abp Finland 0.2
Epiroc AB Sweden 0.1
Information Technology 14.6
Amadeus IT Group SA Spain 2.7
Nomura Research Institute Ltd Japan 1.6
Dassault Systemes SE France 1.5
Obic Co Ltd Japan 1.4
Hirose Electric Co Ltd Japan 1.2
Infineon Technologies AG Germany 1.0
Halma PLC United Kingdom 1.0
Omron Corp Japan 1.0
As of 31-Aug-19 CountryEquivalent
Exposure (%)
SAP SE Germany 0.9
Spectris PLC United Kingdom 0.6
Yokogawa Electric Corp Japan 0.4
Check Point Software Technologies Ltd Israel 0.3
Disco Corp Japan 0.3
WiseTech Global Ltd Australia 0.3
Descartes Systems Group Inc Canada 0.2
Wix.com Ltd Israel 0.2
Materials 7.9
Givaudan SA Switzerland 4.1
Symrise AG Germany 1.9
Novozymes AS Denmark 0.7
Kansai Paint Co Ltd Japan 0.5
Sika AG Switzerland 0.4
Croda International PLC United Kingdom 0.3
Other -0.0
Real Estate 5.1
Vonovia SE Germany 2.0
Deutsche Wohnen SE Germany 1.7
LEG Immobilien AG Germany 0.8
TAG Immobilien AG Germany 0.6
Portfolio HoldingsRetiree Health Benefits Plan continued...

Fee Schedule
MFS® International Intrinsic Value Equity 48299-I-CT-IIV-02Oct19.48
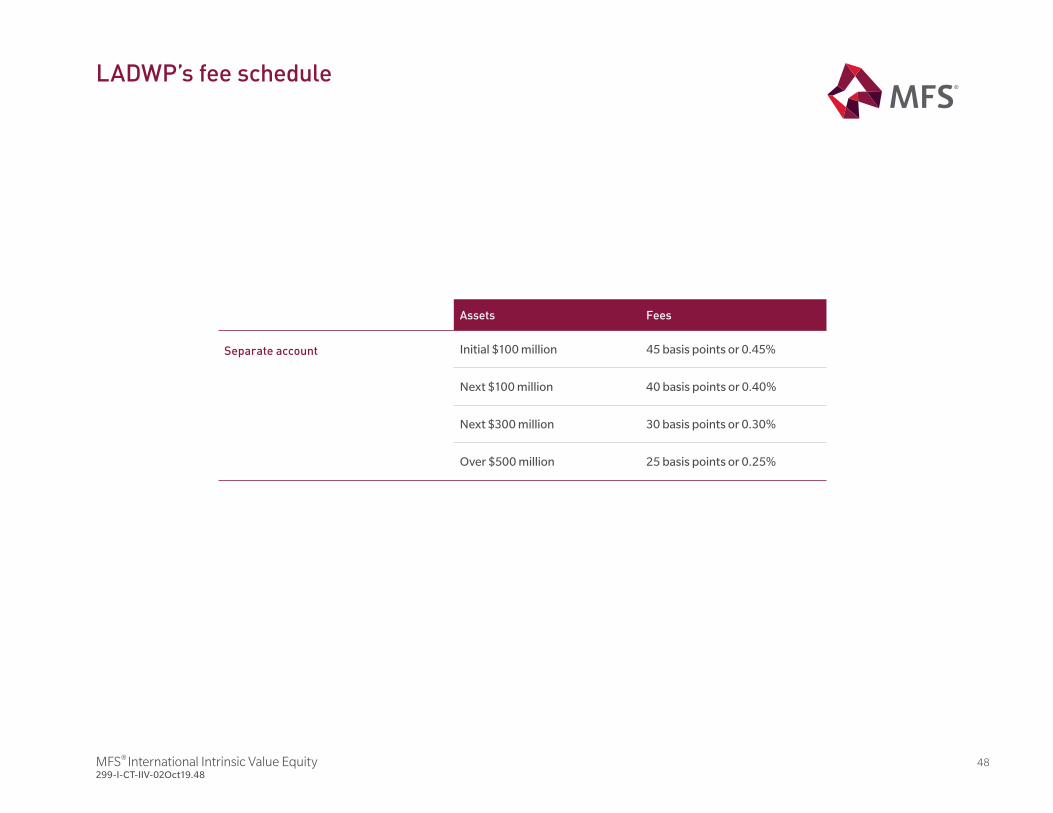
LADWP’s fee schedule
Assets Fees
Separate account Initial $100 million 45 basis points or 0.45%
Next $100 million 40 basis points or 0.40%
Next $300 million 30 basis points or 0.30%
Over $500 million 25 basis points or 0.25%
49
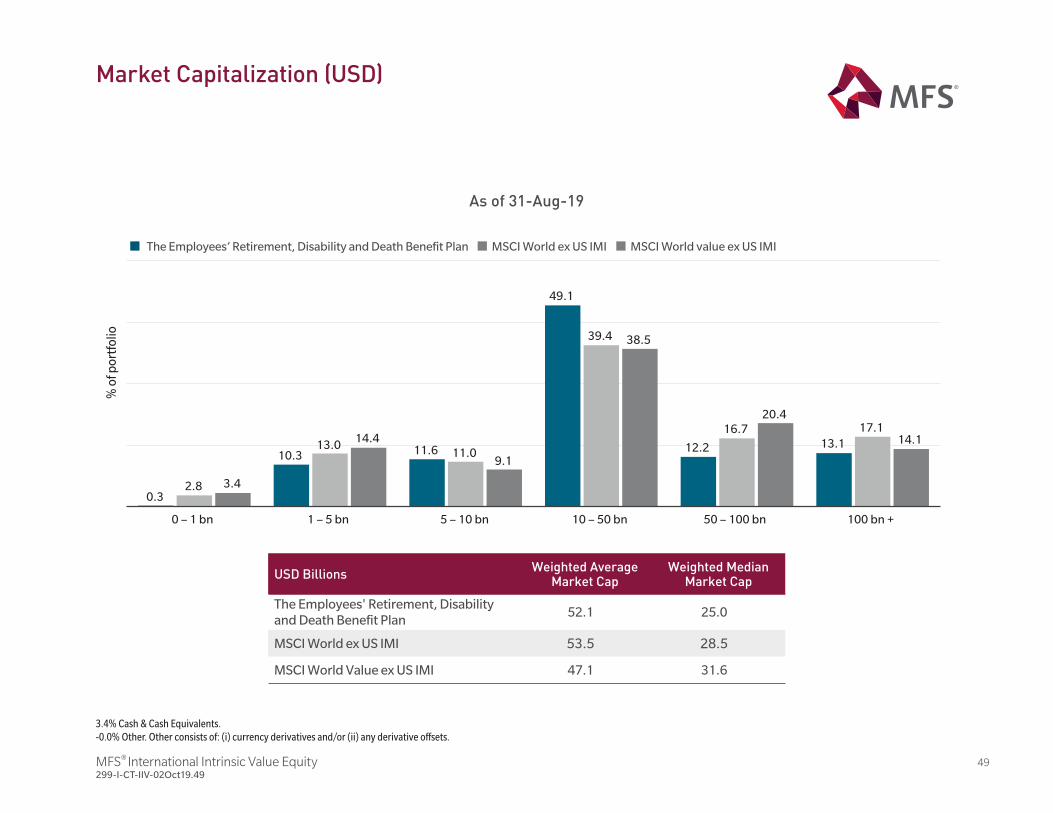
0 – 1 bn 1 – 5 bn 5 – 10 bn 10 – 50 bn 50 – 100 bn 100 bn +
% o
f por
tfol
io
0.32.8 3.4
10.313.0 14.4
11.6 11.09.1
49.1
39.4 38.5
12.2
16.720.4
13.117.1
14.1
As of 31-Aug-19
BillionsWeighted Average
Market CapWeighted Median
Market Cap
The Employees' Retirement, Disability and Death Benefit Plan
52.1 25.0
MSCI World ex US IMI 53.5 28.5
MSCI World Value ex US IMI 47.1 31.6
MFS® International Intrinsic Value Equity 299-I-CT-IIV-02Oct19.49
Market Capitalization (USD)
The Employees’ Retirement, Disability and Death Benefit Plan MSCI World ex US IMI MSCI World value ex US IMI
3.4% Cash & Cash Equivalents.-0.0% Other. Other consists of: (i) currency derivatives and/or (ii) any derivative offsets.

Composite: MFS International Value Equity CompositeBenchmark: MSCI EAFE Value - Net Return
Creation Date: 19-Oct-2005
Inception Date: 01-Dec-1997
Investment Objective: To provide long-term capital appreciation and current income by investing principally in attractively valued equities of companies whose operations lie outside of the U.S. Stock selection is based solely on MFS proprietary research process and therefore excludes assets managed by external parties or non-MFS sub-advisors.
Institutional Separate Accounts Fee ScheduleAsset Breakpoints (USD) FeeFor Assets Up To 50 MM 75 bpFor Assets From 50 MM To 100 MM 60 bpFor Assets Over 100 MM 50 bp
Derivative Exposure DisclosureCertain MFS portfolios in this composite may utilize derivative instruments to manage risk or to achieve timely and cost effective implementation of the investment strategy. As of 31-Dec-2018, the number of accounts in the composite shown below held derivatives with the following average equivalent exposure of total net assets:
Number of Accounts ExposureLong Exposure 11 6.12%Short Exposure 11 -6.09%
Accounts are eligible for inclusion in the composite if they have assets greater than 2 MM USD. Accounts are included as of their first full month of performance.
Accounts in Annualized 3-YearComposite and Benchmark Return % Composite Composite at Standard Deviation Assets in Composite
Period Gross of fees Net of fees Benchmark Dispersion End of Period Composite Benchmark (USD million) %Firm2018 -8.46 -9.15 -14.78 0.27 14 10.20 12.23 $32,892.8 7.7
2017 28.13 27.20 21.44 0.13 14 9.66 12.84 $38,627.0 7.9
2016 4.90 4.12 5.02 0.24 15 10.29 13.51 $31,474.5 7.4
2015 7.51 6.71 -5.68 0.29 18 10.85 13.61 $32,903.4 8.0
2014 2.33 1.56 -5.39 0.23 19 10.87 14.32 $27,757.3 6.5
2013 29.04 28.09 22.95 0.58 20 12.32 17.45 $22,037.3 5.3
2012 17.21 16.34 17.69 0.23 19 14.59 20.56 $12,317.2 3.8
2011 -0.68 -1.43 -12.17 0.10 12 19.87 24.86 $6,494.2 2.9
2010 10.60 9.78 3.25 n/a 9 n/a n/a $5,104.7 2.3
2009 26.50 25.57 34.23 n/a <6 n/a n/a $3,009.2 1.6MFS Investment Management® claims compliance with the Global Investment Performance Standards (GIPS®) and has prepared and presented this report in compliance with the GIPS standards. MFS Investment Management® has been independently verified for the periods 1-Jan-1988 through 31-Dec-2017. Verification assesses whether (1) the firm has complied with all the composite construction requirements of the GIPS standards on a firm-wide basis and (2) the firm's policies and procedures are designed to calculate and present performance in compliance with the GIPS standards. MFS International Value Equity Composite has been examined for the periods 01-Dec-1997 through 31-Dec-2017. The verification and performance examination reports are available upon request.
Total Gross-of-fee returns in USD (includes both capital appreciation and income) are net of transaction costs, withholding taxes and direct expenses, but before management fees, custody and other indirect expenses. Certain institutional accounts hold Canadian trusts subject to custody and other indirect expenses. Certain accounts may be subject to fair valuation as conditions warrant. Typical separate accounts utilize 4:00 PM (London Time) foreign exchange rates; retail products will use rates deemed most appropriate for daily NAV per share calculations. The possibility exists for performance dispersion between otherwise similarly managed accounts and also with the benchmark. Net composite returns are prepared by subtracting from the monthly gross returns one-twelfth of the maximum applicable annual institutional separate account fee. Returns based on actual management fees, including non-separate account fees and performance based fees, would be lower for the following periods - 2009: 25.44.Total returns of the benchmark are provided for each period depicted, expressed in USD. Source of Benchmark Performance: FACTSET ®. Benchmark returns and benchmark annualized 3-year standard deviation are not examined by independent accountants. MSCI EAFE Value - Net Return - a market capitalization-weighted index that is designed to measure equity market performance for value securities in the developed markets, excluding the U.S. and Canada. Composite Dispersion is measured by the asset-weighted standard deviation of account returns for all accounts in the composite for the full period. For composites containing less than six accounts for the full period, dispersion is deemed not meaningful. Prior to 31-Mar-2009 accounts have been eligible for inclusion in the composite if they had assets greater than 5.0 MM USD. Certain accounts in this composite may make tactical allocation to U.S. and Canadian based securities, where each investment is deemed to be consistent with the composite's overall investment objective. For purposes of GIPS compliance, the firm is defined as MFS Investment Management® which is comprised of Massachusetts Financial Services Company (MFS) and MFS Institutional Advisors, Inc. (MFSI), each of which is a registered investment advisor, MFS Heritage Trust Company, a New Hampshire Trust company, and MFS Investment Management Canada Limited. Total firm assets are calculated at market value and include assets managed by MFS, MFSI, MFS Heritage Trust Company and MFS Investment Management Canada Limited as well as assets managed by MFS and MFSI in a sub-advisory capacity on behalf of affiliated investment advisors that are not registered under the United States Investment Advisers Act of 1940, such as MFS International (U.K.), Ltd. (MIL UK) and MFS Investment Management K.K. (MIMKK), MFS International Singapore Pte. Ltd and MFS International Australia Pty Ltd as well as assets managed by MFS and MFSI on behalf of unaffiliated investment advisors that may or may not be registered under the United States Investment Advisers Act of 1940. Total firm assets for GIPS purposes do not include assets of non-discretionary advisory relationships.In November of 2011 MFS acquired McLean Budden Limited (now MFS Investment Management Canada Limited). Total firm assets from 31-Mar-2012 forward include the assets of institutional and pooled MFS Investment Management Canada Limited products. Assets from 31-Dec-2012 forward include the MFS Investment Management Canada Limited PPM product assets. A complete list of firm composites and descriptions, along with additional information regarding policies for valuing portfolios, calculating and reporting performance, and preparing compliant presentations are available upon request. Source: MSCI. MSCI makes no express or implied warranties or representations and shall have no liability whatsoever with respect to any MSCI data contained herein. The MSCI data may not be further redistributed or used as a basis for other indices or any securities or financial products. This report is not approved, reviewed or produced by MSCI.
Run Time: 22-Jan-19 10:23:52 AM AEDIV Page 1 of 1
Performance Presentation Report 2018, Q4
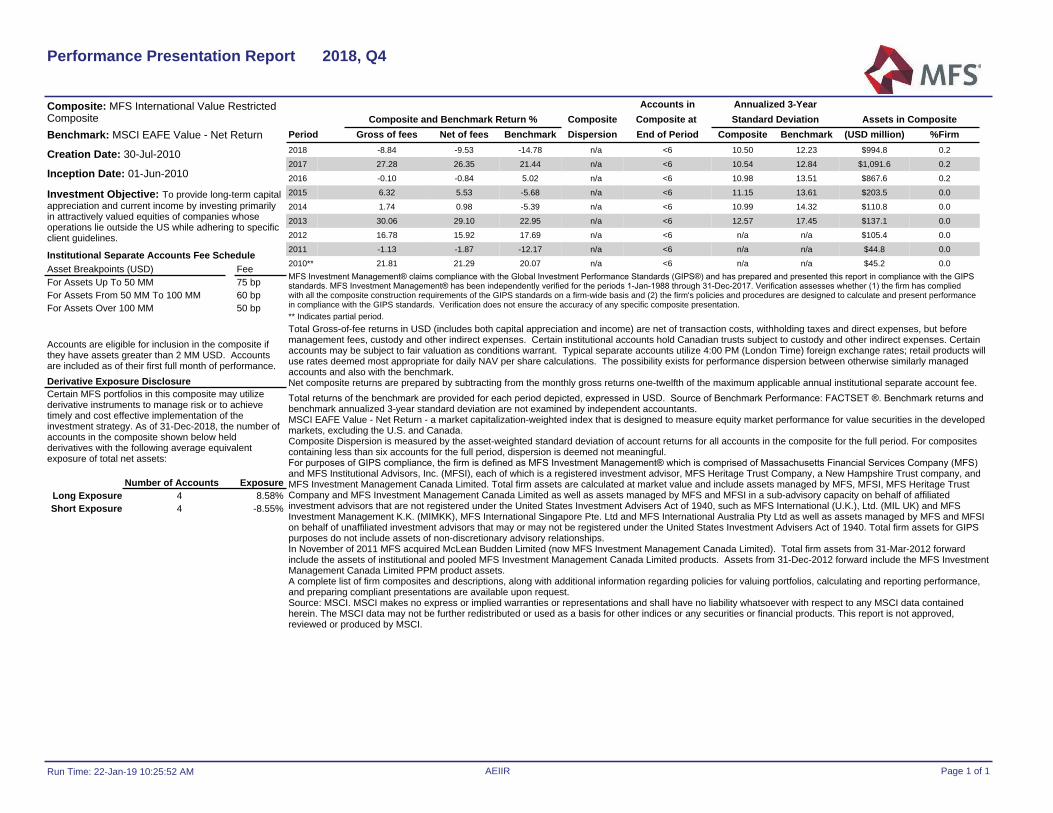
Composite: MFS International Value Restricted CompositeBenchmark: MSCI EAFE Value - Net Return
Creation Date: 30-Jul-2010
Inception Date: 01-Jun-2010
Investment Objective: To provide long-term capital appreciation and current income by investing primarily in attractively valued equities of companies whose operations lie outside the US while adhering to specific client guidelines.
Institutional Separate Accounts Fee ScheduleAsset Breakpoints (USD) FeeFor Assets Up To 50 MM 75 bpFor Assets From 50 MM To 100 MM 60 bpFor Assets Over 100 MM 50 bp
Derivative Exposure DisclosureCertain MFS portfolios in this composite may utilize derivative instruments to manage risk or to achieve timely and cost effective implementation of the investment strategy. As of 31-Dec-2018, the number of accounts in the composite shown below held derivatives with the following average equivalent exposure of total net assets:
Number of Accounts ExposureLong Exposure 4 8.58%Short Exposure 4 -8.55%
Accounts are eligible for inclusion in the composite if they have assets greater than 2 MM USD. Accounts are included as of their first full month of performance.
Accounts in Annualized 3-YearComposite and Benchmark Return % Composite Composite at Standard Deviation Assets in Composite
Period Gross of fees Net of fees Benchmark Dispersion End of Period Composite Benchmark (USD million) %Firm2018 -8.84 -9.53 -14.78 n/a <6 10.50 12.23 $994.8 0.2
2017 27.28 26.35 21.44 n/a <6 10.54 12.84 $1,091.6 0.2
2016 -0.10 -0.84 5.02 n/a <6 10.98 13.51 $867.6 0.2
2015 6.32 5.53 -5.68 n/a <6 11.15 13.61 $203.5 0.0
2014 1.74 0.98 -5.39 n/a <6 10.99 14.32 $110.8 0.0
2013 30.06 29.10 22.95 n/a <6 12.57 17.45 $137.1 0.0
2012 16.78 15.92 17.69 n/a <6 n/a n/a $105.4 0.0
2011 -1.13 -1.87 -12.17 n/a <6 n/a n/a $44.8 0.0
2010** 21.81 21.29 20.07 n/a <6 n/a n/a $45.2 0.0MFS Investment Management® claims compliance with the Global Investment Performance Standards (GIPS®) and has prepared and presented this report in compliance with the GIPS standards. MFS Investment Management® has been independently verified for the periods 1-Jan-1988 through 31-Dec-2017. Verification assesses whether (1) the firm has complied with all the composite construction requirements of the GIPS standards on a firm-wide basis and (2) the firm's policies and procedures are designed to calculate and present performance in compliance with the GIPS standards. Verification does not ensure the accuracy of any specific composite presentation. ** Indicates partial period. Total Gross-of-fee returns in USD (includes both capital appreciation and income) are net of transaction costs, withholding taxes and direct expenses, but before management fees, custody and other indirect expenses. Certain institutional accounts hold Canadian trusts subject to custody and other indirect expenses. Certain accounts may be subject to fair valuation as conditions warrant. Typical separate accounts utilize 4:00 PM (London Time) foreign exchange rates; retail products will use rates deemed most appropriate for daily NAV per share calculations. The possibility exists for performance dispersion between otherwise similarly managed accounts and also with the benchmark. Net composite returns are prepared by subtracting from the monthly gross returns one-twelfth of the maximum applicable annual institutional separate account fee. Total returns of the benchmark are provided for each period depicted, expressed in USD. Source of Benchmark Performance: FACTSET ®. Benchmark returns and benchmark annualized 3-year standard deviation are not examined by independent accountants. MSCI EAFE Value - Net Return - a market capitalization-weighted index that is designed to measure equity market performance for value securities in the developed markets, excluding the U.S. and Canada. Composite Dispersion is measured by the asset-weighted standard deviation of account returns for all accounts in the composite for the full period. For composites containing less than six accounts for the full period, dispersion is deemed not meaningful. For purposes of GIPS compliance, the firm is defined as MFS Investment Management® which is comprised of Massachusetts Financial Services Company (MFS) and MFS Institutional Advisors, Inc. (MFSI), each of which is a registered investment advisor, MFS Heritage Trust Company, a New Hampshire Trust company, and MFS Investment Management Canada Limited. Total firm assets are calculated at market value and include assets managed by MFS, MFSI, MFS Heritage Trust Company and MFS Investment Management Canada Limited as well as assets managed by MFS and MFSI in a sub-advisory capacity on behalf of affiliated investment advisors that are not registered under the United States Investment Advisers Act of 1940, such as MFS International (U.K.), Ltd. (MIL UK) and MFS Investment Management K.K. (MIMKK), MFS International Singapore Pte. Ltd and MFS International Australia Pty Ltd as well as assets managed by MFS and MFSI on behalf of unaffiliated investment advisors that may or may not be registered under the United States Investment Advisers Act of 1940. Total firm assets for GIPS purposes do not include assets of non-discretionary advisory relationships.In November of 2011 MFS acquired McLean Budden Limited (now MFS Investment Management Canada Limited). Total firm assets from 31-Mar-2012 forward include the assets of institutional and pooled MFS Investment Management Canada Limited products. Assets from 31-Dec-2012 forward include the MFS Investment Management Canada Limited PPM product assets. A complete list of firm composites and descriptions, along with additional information regarding policies for valuing portfolios, calculating and reporting performance, and preparing compliant presentations are available upon request. Source: MSCI. MSCI makes no express or implied warranties or representations and shall have no liability whatsoever with respect to any MSCI data contained herein. The MSCI data may not be further redistributed or used as a basis for other indices or any securities or financial products. This report is not approved, reviewed or produced by MSCI.
Run Time: 22-Jan-19 10:25:52 AM AEIIR Page 1 of 1
Performance Presentation Report 2018, Q4
Glossary of Investment Terms
MFS® International Intrinsic Value Equity 53299-I-CT-IIV-02Oct19.53
Alpha is a measure of the difference between a portfolio's actual returns and its expected performance, given its level of risk asmeasured by beta. A positive alpha figure indicates the portfolio has performed better than its beta would predict. In contrast, a negative alpha indicates the portfolio's underperformance, given the expectations established by the fund's beta
Beta is a measure of a portfolio's sensitivity to market movements. The beta of the market is 1.00 by definition. A portfolio with a beta of 0.85 would indicate that the portfolio is expected to perform 15% worse that the market's excess return during up markets and 15% better during down markets , assuming all other factors remain constant
Earnings-per-share (EPS) growth represents the annualized rate of net-income-per-share growth over the trailing three-year period for the stocks held by the portfolio. Earnings-per-share growth gives a good picture of the rate at which a company has grown its profitability per unit of equity
Excess return is defined as the portfolio's achieved rate of return minus the benchmark return over the same period
Information ratio is a measure of risk adjusted performance. Dividing the portfolio active return by portfolio tracking error gives you the information ratio
Predicted tracking error (also called active risk) is a measure of the expected deviation from the benchmark
Price/book ratio of the portfolio is the weighted average of the price/book ratios of all the stocks in the portfolio. Book value is the total assets of a company, less total liabilities. A company's book value is calculated by dividing the market price of its outstanding stock by the company's book value, and then adjusting for the number of shares outstanding (Stocks with negative book values are excluded from this calculation.). The price/book ratio can tell investors approximately how much they're paying for a company's assets, based on historical, rather than current, valuations
Price/cash flow is a stock's current price divided by the trailing 12-month cash flow per share. For the portfolio this number represents the weighted average of the price/cash-flow ratios of the stocks in the portfolio. Price/cash-flow represents the amount an investor is willing to pay for a dollar generated from a particular company's operations. Price/cash-flow shows the ability of a business to generate cash and acts as a gauge of liquidity and solvency
Glossary of Terms
P/E (12 month forward) is a stock's current price divided by the company's trailing 12-month earnings per share. The (P/E) ratio of the portfolio is the weighted average of the price/earnings ratios of the stocks in the portfolio. The P/E ratio of a company, which is a comparison of the cost of the company's stock and its expected next 12-month earnings per share, is calculated by dividing these two figures
Price/sales is a stock's current price divided by the company's trailing 12-month sales per share. For the portfolio this number represents the weighted average of the price/sales ratios of the stocks in the portfolio. Price/sales represents the amount an investor is willing to pay for a dollar generated from a particular company's operations
R-Squared is the measure of correlation between a portfolio and the market (benchmark). Values range between 0 and 1. The higher the value of R-Square, the greater the correlation between the two. R-squared can be used to determine the significance of a particular beta or alpha. Generally, a higher R-squared will indicate a more useful beta figure. If the R-squared is lower, then the beta is less relevant to the fund's performance
Realized tracking error (also called active risk) is a measure of the actual deviation from the benchmark
Return on Equity (ROE) represents the amount of net income returned as a percentage of shareholders equity. Return on equity measures a corporation's profitability by revealing how much profit a company generates with the money shareholders have invested. ROE can be one measure of quality of a company
Sharpe Ratio is calculated by using standard deviation and excess return to determine reward per unit of risk. The higher the Sharpe ratio, the better the portfolio's historical risk-adjusted performance
Standard Deviation is a statistical measurement of dispersion about an average and depicts how widely a portfolio's returns varied over a certain period of time. When a portfoliohas a high standard deviation, the predicted range of performance is wide, implying greater volatility
Glossary of TermsContinued...
MFS® International Intrinsic Value Equity 55299-I-CT-IIV-02Oct19.55
Gross performance does not refl ect the deduction of investment advisory fees. Returns will be reduced by advisory fees and any other expenses incurred in the management of the account. Investment advisory fees are described in Part II of the MFS Institutional Advisors, Inc. Form ADV.
Hypothetical illustration of impact of fees: If USD 1,000,000 was invested and experienced a 10% annual return compounded monthly for ten years, its ending value would be USD 2,707,041.49. If an advisory fee of 1% of net assets was deducted monthly, based upon the initial investment for the fi rst 12 months and the prior year end for every month thereafter, the ending value would be USD 2,461,120.35.
This material is directed at investment professionals for general information use only with no consideration given to the specifi c investment objective, fi nancial situation and particular needs of any specifi c person. Any securities and/or sectors mentioned herein are for illustration purposes and should not be construed as a recommendation for investment. Investment involves risk. Past performance is not indicative of future performance. The information contained herein may not be copied, reproduced or redistributed without the express consent of MFS Investment Management (“MFS”). While the information is believed to be accurate, it may be subject to change without notice. MFS does not warrant or represent that it is free from errors or omissions or that the information is suitable for any particular person’s intended use. Except in so far as any liability under any law cannot be excluded, MFS does not accept liability for any inaccuracy or for the investment decisions or any other actions taken by any person on the basis of the material included. MFS does not authorise distribution to retail investors.
Unless otherwise indicated, logos, product and services names are trademarks of MFS and its affi liates and may be registered in certain countries.
Disclosure