Embed Size (px)
Citation preview

Investment Style Guide
Yardeni Research, Inc.
July 13, 2018
Dr. Edward Yardeni516-972-7683
Joe Abbott732-497-5306
Please visit our sites atwww.yardeni.comblog.yardeni.com
thinking outside the box
Table Of Contents Table Of ContentsTable Of Contents
July 13, 2018 / Investment Style Guide www.yardeni.com
Yardeni Research, Inc.
Index Price Performance: 2018 1Index Price Performance: 2017 2Index Price Performance: 2016 3Index Price Performance: 2015 4S&P 500 Growth/Value Relative Price Performance 5S&P 500 Pure G/V Relative Price Performance 6Growth/Value Relative Forward Revenues & Earnings 7Market Cap: S&P Earnings & Valuation 8Market Cap: S&P 500, 400, 600 9-10Market Cap: Russell 1000 vs. 2000 11Growth vs. Value: Revenue Squiggles 12Growth vs. Value: Earnings Squiggles 13Growth vs. Value: Profit Margins 14Growth vs. Value: Earnings Growth 15Growth vs. Value: S&P Valuation 16-17Growth vs. Value: Market Cap Shares 18Growth vs. Value: Net Revenue Revisions 19Growth vs. Value: Net Earnings Revisions 20Growth vs. Value: Revenue Growth 21Growth vs. Value: Earnings Growth 22Russell Valuation SmallCap, Growth, Value 23

Jan Feb Mar Apr May Jun Jul Aug Sept Oct Nov Dec2018
-6
-4
-2
0
2
4
6
8
10
12
14
-6
-4
-2
0
2
4
6
8
10
12
14LARGECAP & SMIDCAP PERFORMANCE: 2018(percent change ytd)
S&P 500 LargeCap (4.8)S&P 400 MidCap (5.0)S&P 600 SmallCap (11.7)Russell 1000 LargeCap (4.9)Russell 2000 SmallCap (10.1)
Latest data thru: 07/13/18
Source: Frank Russell Company, Haver Analytics, and Standard & Poor’s Corporation.
yardeni.com
Figure 1.
Jan Feb Mar Apr May Jun Jul Aug Sept Oct Nov Dec2018
-8
-6
-4
-2
0
2
4
6
8
10
12
14
16
18
-8
-6
-4
-2
0
2
4
6
8
10
12
14
16
18GROWTH & VALUE PERFORMANCE: 2018(percent change ytd)
S&P 500 LargeCap Growth (10.8)S&P 500 LargeCap Value (-1.6)S&P 400 MidCap Growth (6.8)S&P 400 MidCap Value (3.2)S&P 600 SmallCap Growth (14.9)S&P 600 SmallCap Value (8.6)
Latest data thru: 07/13/18
Source: Frank Russell Company, Haver Analytics, and Standard & Poor’s Corporation.
yardeni.com
Figure 2.
Index Price Performance: 2018
Page 1 / July 13, 2018 / Investment Style Guide www.yardeni.com
Yardeni Research, Inc.

Jan Feb Mar Apr May Jun Jul Aug Sept Oct Nov Dec2017
-5
0
5
10
15
20
25
-5
0
5
10
15
20
25LARGECAP & SMIDCAP PERFORMANCE: 2017(percent change ytd)
S&P 500 LargeCap (19.4)S&P 400 MidCap (14.5)S&P 600 SmallCap (11.7)Russell 1000 LargeCap (19.3)Russell 2000 SmallCap (13.1)
Source: Frank Russell Company, Haver Analytics, and Standard & Poor’s Corporation.
yardeni.com
Figure 3.
Jan Feb Mar Apr May Jun Jul Aug Sept Oct Nov Dec2017
-6
-3
0
3
6
9
12
15
18
21
24
27
30
-6
-3
0
3
6
9
12
15
18
21
24
27
30GROWTH & VALUE PERFORMANCE: 2017(percent change ytd)
S&P 500 LargeCap Growth (25.4)S&P 500 LargeCap Value (12.6)S&P 400 MidCap Growth (18.4)S&P 400 MidCap Value (10.2)S&P 600 SmallCap Growth (13.5)S&P 600 SmallCap Value (9.8)
Source: Frank Russell Company, Haver Analytics, and Standard & Poor’s Corporation.
yardeni.com
Figure 4.
Index Price Performance: 2017
Page 2 / July 13, 2018 / Investment Style Guide www.yardeni.com
Yardeni Research, Inc.

Jan Feb Mar Apr May Jun Jul Aug Sept Oct Nov Dec2016
-20
-10
0
10
20
30
-20
-10
0
10
20
30LARGECAP & SMIDCAP PERFORMANCE: 2016(percent change ytd)
S&P 500 LargeCap (9.5)S&P 400 MidCap (18.7)S&P 600 SmallCap (24.7)Russell 1000 LargeCap (9.7)Russell 2000 SmallCap (19.5)
Source: Frank Russell Company, Haver Analytics, and Standard & Poor’s Corporation.
yardeni.com
Figure 5.
Jan Feb Mar Apr May Jun Jul Aug Sept Oct Nov Dec2016
-20
-10
0
10
20
30
40
-20
-10
0
10
20
30
40GROWTH & VALUE PERFORMANCE: 2016(percent change ytd)
S&P 500 LargeCap Growth (5.1)S&P 500 LargeCap Value (14.3)S&P 400 MidCap Growth (13.3)S&P 400 MidCap Value (24.0)S&P 600 SmallCap Growth (20.7)S&P 600 SmallCap Value (29.1)
Source: Frank Russell Company, Haver Analytics, and Standard & Poor’s Corporation.
yardeni.com
Figure 6.
Index Price Performance: 2016
Page 3 / July 13, 2018 / Investment Style Guide www.yardeni.com
Yardeni Research, Inc.
Jan Feb Mar Apr May Jun Jul Aug Sept Oct Nov Dec2015
-15
-10
-5
0
5
10
-15
-10
-5
0
5
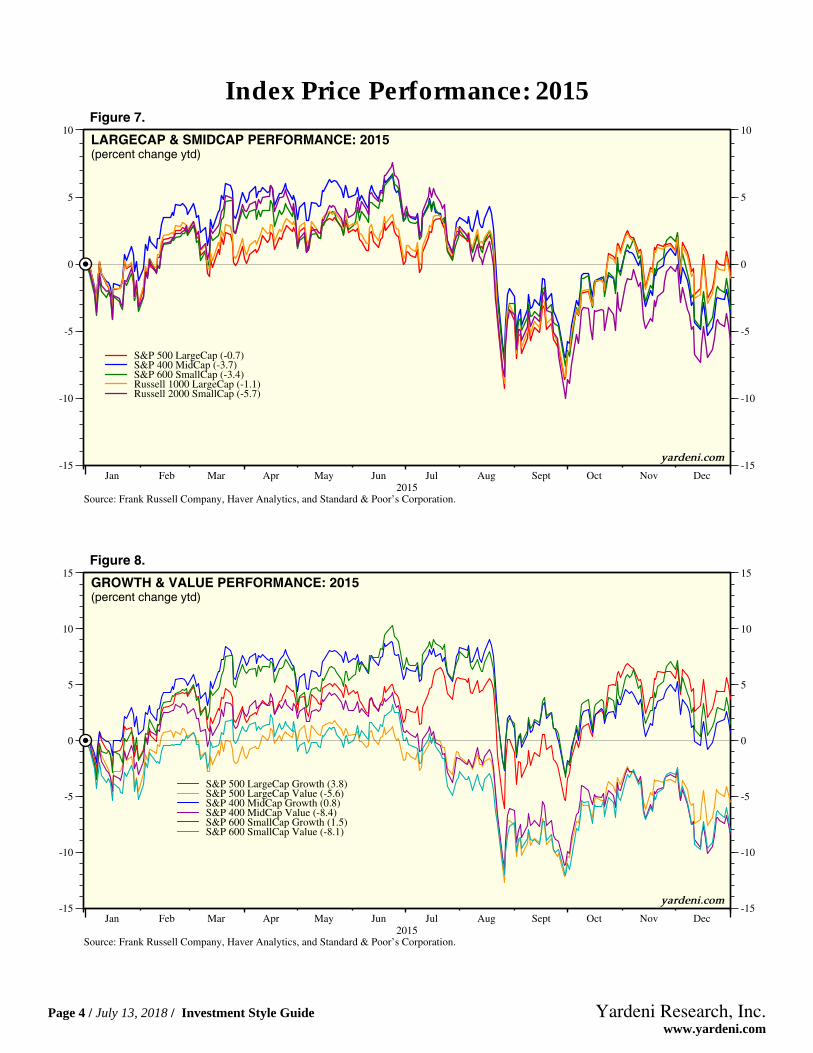
10LARGECAP & SMIDCAP PERFORMANCE: 2015(percent change ytd)
S&P 500 LargeCap (-0.7)S&P 400 MidCap (-3.7)S&P 600 SmallCap (-3.4)Russell 1000 LargeCap (-1.1)Russell 2000 SmallCap (-5.7)
Source: Frank Russell Company, Haver Analytics, and Standard & Poor’s Corporation.
yardeni.com
Figure 7.
Jan Feb Mar Apr May Jun Jul Aug Sept Oct Nov Dec2015
-15
-10
-5
0
5
10
15
-15
-10
-5
0
5
10
15GROWTH & VALUE PERFORMANCE: 2015(percent change ytd)
S&P 500 LargeCap Growth (3.8)S&P 500 LargeCap Value (-5.6)S&P 400 MidCap Growth (0.8)S&P 400 MidCap Value (-8.4)S&P 600 SmallCap Growth (1.5)S&P 600 SmallCap Value (-8.1)
Source: Frank Russell Company, Haver Analytics, and Standard & Poor’s Corporation.
yardeni.com
Figure 8.
Index Price Performance: 2015
Page 4 / July 13, 2018 / Investment Style Guide www.yardeni.com
Yardeni Research, Inc.

95 96 97 98 99 00 01 02 03 04 05 06 07 08 09 10 11 12 13 14 15 16 17 18 19 20.35
.40
.45
.50
.55
.60
.65
.70
.35
.40
.45
.50
.55
.60
.65
.70
7/13
7/13
S&P 500 GROWTH vs VALUE RELATIVE TO S&P 500
Relative to S&P 500*GrowthValue
yardeni.com
* Rising (falling) line indicates that the index is outperforming (underperforming) the S&P 500.Source: Standard & Poor’s and Haver Analytics.
Figure 9.
1995 1996 1997 1998 1999 2000 2001 2002 2003 2004 2005 2006 2007 2008 2009 2010 2011 2012 2013 2014 2015 2016 2017 2018 2019.8
.9
1.0
1.1
1.2
1.3
1.4
1.5
1.6
1.7
1.8
1.9
.8
.9
1.0
1.1
1.2
1.3
1.4
1.5
1.6
1.7
1.8
1.9
7/13
RELATIVE PRICE INDEX: S&P 500 GROWTH & VALUE(Growth price index relative to Value price index)
Rising line indicates thatGrowth is outperforming Value
yardeni.com
Source: Standard & Poor’s Corporation and Haver Analytics.
Figure 10.
S&P 500 Growth/Value Relative Price Performance
Page 5 / July 13, 2018 / Investment Style Guide www.yardeni.com
Yardeni Research, Inc.

1995 1996 1997 1998 1999 2000 2001 2002 2003 2004 2005 2006 2007 2008 2009 2010 2011 2012 2013 2014 2015 2016 2017 2018 2019.5
1.0
1.5
2.0
2.5
3.0
3.5
4.0
4.5
.5
1.0
1.5
2.0
2.5
3.0
3.5
4.0
4.5
7/13
7/13
RELATIVE PRICE INDEX: S&P 500 PURE GROWTH & PURE VALUE(relative to S&P 500)
Pure Growth relative to S&P 500Pure Value relative to S&P 500
Rising line indicates thatthe index is outperforming the S&P 500
yardeni.com
Source: Standard & Poor’s Corporation and Haver Analytics.
Figure 11.
1995 1996 1997 1998 1999 2000 2001 2002 2003 2004 2005 2006 2007 2008 2009 2010 2011 2012 2013 2014 2015 2016 2017 2018 2019.75
1.00
1.25
1.50
1.75
2.00
2.25
2.50
2.75
3.00
3.25
3.50
.75
1.00
1.25
1.50
1.75
2.00
2.25
2.50
2.75
3.00
3.25
3.50
7/13
RELATIVE PRICE INDEX: S&P 500 PURE GROWTH & PURE VALUE(Pure Growth price index relative to Pure Value price index)
Rising line indicates thatPure Growth is outperforming Pure Value
yardeni.com
Source: Standard & Poor’s Corporation and Haver Analytics.
Figure 12.
S&P 500 Pure G/V Relative Price Performance
Page 6 / July 13, 2018 / Investment Style Guide www.yardeni.com
Yardeni Research, Inc.

2004 2005 2006 2007 2008 2009 2010 2011 2012 2013 2014 2015 2016 2017 2018 2019.35
.40
.45
.50
.55
.60
.65
.70
.75
.80
.35
.40
.45
.50
.55
.60
.65
.70
.75
.80
7/5
RELATIVE FORWARD REVENUES: S&P 500 GROWTH & VALUE INDEX
Rising line indicates thatGrowth is outperforming Value
yardeni.com
Source: Thomson Reuters I/B/E/S.
Figure 13.
1995 1996 1997 1998 1999 2000 2001 2002 2003 2004 2005 2006 2007 2008 2009 2010 2011 2012 2013 2014 2015 2016 2017 2018 2019.6
.7
.8
.9
1.0
1.1
1.2
.6
.7
.8
.9
1.0
1.1
1.2
7/5
RELATIVE FORWARD EARNINGS: S&P 500 GROWTH & VALUE INDEX
Rising line indicates thatGrowth is outperforming Value
yardeni.com
Source: Thomson Reuters I/B/E/S.
Figure 14.
Growth/Value Relative Forward Revenues & Earnings
Page 7 / July 13, 2018 / Investment Style Guide www.yardeni.com
Yardeni Research, Inc.

1999 2001 2003 2005 2007 2009 2011 2013 2015 2017 201950
100
150
200
250
300
350
400
450
500
550
600
50
100
150
200
250
300
350
400
450
500
550
600
7/5
S&P FORWARD EARNINGS PER SHARE(weekly, Jan 1999=100)
Forward Earnings*S&P 500 LargeCap (328.6)S&P 400 MidCap (559.7)S&P 600 SmallCap (587.5)
* 52-week forward consensus expected operating earnings per share. Time-weighted average of the current year’s and next year’s consensus forecast.Source: Thomson Reuters I/B/E/S.
yardeni.com
Figure 15.
1999 2001 2003 2005 2007 2009 2011 2013 2015 2017 20198
10
12
14
16
18
20
22
24
26
28
8
10
12
14
16
18
20
22
24
26
28
7/6
P/E RATIOS FOR S&P INDEXES*(weekly)
S&P 500 LargeCap (16.3)
S&P 400 MidCap (16.6)
S&P 600 SmallCap (17.8)
* Price divided by 52-week forward consensus expected operating earnings per share.Source: Thomson Reuters I/B/E/S.
yardeni.com
Figure 16.
Market Cap: S&P Earnings & Valuation
Page 8 / July 13, 2018 / Investment Style Guide www.yardeni.com
Yardeni Research, Inc.

1999 2001 2003 2005 2007 2009 2011 2013 2015 2017 2019100
400
700
1000
1300
1600
1900
2200
2500
2800
3100
100
400
700
1000
1300
1600
1900
2200
2500
2800
3100
7/13
S&P INDEXES(weekly)
S&P 500 LargeCap (2801.3)
S&P 400 MidCap (1996.4)
S&P 600 SmallCap (1045.8)
Source: Standard & Poor’s Corporation and Haver Analytics.
yardeni.com
Figure 17.
2005 2006 2007 2008 2009 2010 2011 2012 2013 2014 2015 2016 2017 2018 2019-50
-25
0
25
50
75
100
-50
-25
0
25
50
75
100
7/13
S&P INDEXES(weekly, yearly percent change) S&P 500 LargeCap (13.9)
S&P 400 MidCap (13.1)
S&P 600 SmallCap (21.2)
Source: Standard & Poor’s Corporation and Haver Analytics.
yardeni.com
Figure 18.
Market Cap: S&P 500, 400, 600
Page 9 / July 13, 2018 / Investment Style Guide www.yardeni.com
Yardeni Research, Inc.
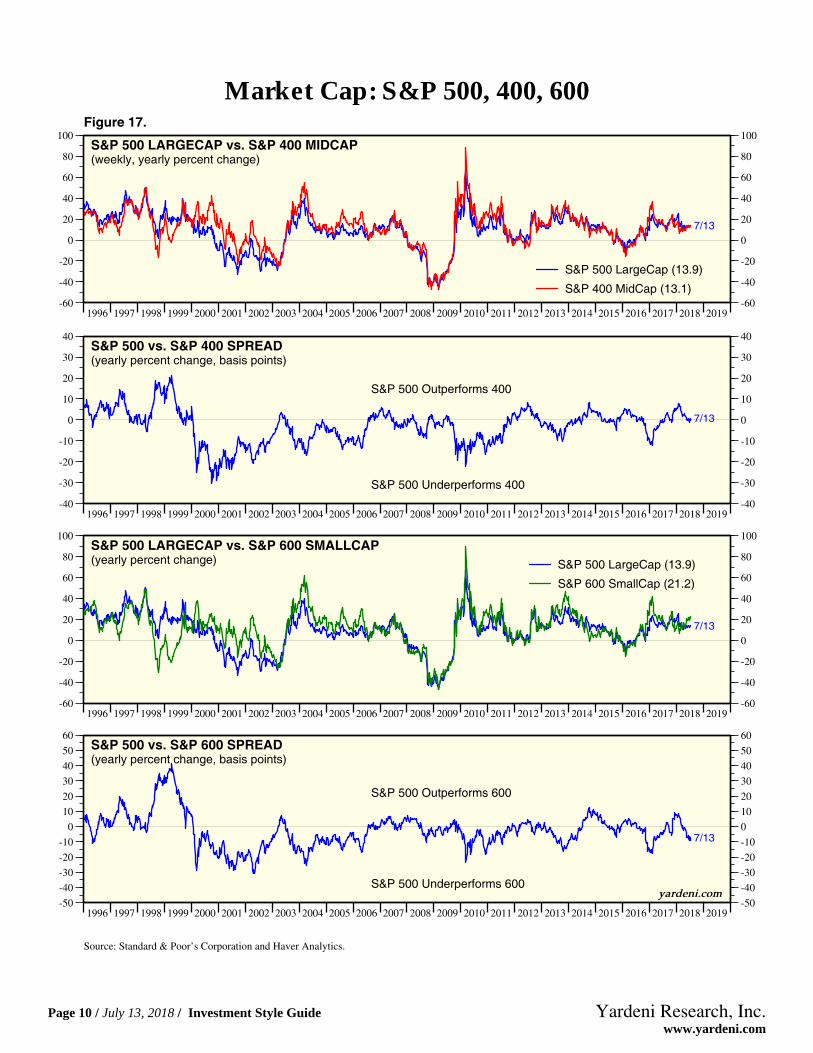
Figure 17.
1996 1997 1998 1999 2000 2001 2002 2003 2004 2005 2006 2007 2008 2009 2010 2011 2012 2013 2014 2015 2016 2017 2018 2019-60
-40
-20
0
20
40
60
80
100
-60
-40
-20
0
20
40
60
80
100
7/13
S&P 500 LARGECAP vs. S&P 400 MIDCAP(weekly, yearly percent change)
S&P 500 LargeCap (13.9)
S&P 400 MidCap (13.1)
1996 1997 1998 1999 2000 2001 2002 2003 2004 2005 2006 2007 2008 2009 2010 2011 2012 2013 2014 2015 2016 2017 2018 2019-40
-30
-20
-10
0
10
20
30
40
-40
-30
-20
-10
0
10
20
30
40
7/13
S&P 500 vs. S&P 400 SPREAD(yearly percent change, basis points)
S&P 500 Outperforms 400
S&P 500 Underperforms 400
1996 1997 1998 1999 2000 2001 2002 2003 2004 2005 2006 2007 2008 2009 2010 2011 2012 2013 2014 2015 2016 2017 2018 2019-60
-40
-20
0
20
40
60
80
100
-60
-40
-20
0
20
40
60
80
100
7/13
S&P 500 LARGECAP vs. S&P 600 SMALLCAP(yearly percent change) S&P 500 LargeCap (13.9)
S&P 600 SmallCap (21.2)
1996 1997 1998 1999 2000 2001 2002 2003 2004 2005 2006 2007 2008 2009 2010 2011 2012 2013 2014 2015 2016 2017 2018 2019-50
-40
-30
-20
-10
0
10
20
30
40
50
60
-50
-40
-30
-20
-10
0
10
20
30
40
50
60
7/13
S&P 500 vs. S&P 600 SPREAD(yearly percent change, basis points)
S&P 500 Outperforms 600
S&P 500 Underperforms 600
Source: Standard & Poor’s Corporation and Haver Analytics.
yardeni.com
Market Cap: S&P 500, 400, 600
Page 10 / July 13, 2018 / Investment Style Guide www.yardeni.com
Yardeni Research, Inc.

Figure 18.
90 91 92 93 94 95 96 97 98 99 00 01 02 03 04 05 06 07 08 09 10 11 12 13 14 15 16 17 18 19100
400
700
1000
1300
16001900
100
400
700
1000
1300
16001900
7/6RUSSELL 1000 vs. RUSSELL 2000(weekly, ratio scale)
Russell 1000 LargeCap (1533.6)
Russell 2000 SmallCap (1694.1)
90 91 92 93 94 95 96 97 98 99 00 01 02 03 04 05 06 07 08 09 10 11 12 13 14 15 16 17 18 19-60
-40
-20
0
20
40
60
80
100
-60
-40
-20
0
20
40
60
80
100
7/6
RUSSELL 1000 vs. RUSSELL 2000(yearly percent change)
Russell 1000 LargeCap (14.1)Russell 2000 SmallCap (19.6)
90 91 92 93 94 95 96 97 98 99 00 01 02 03 04 05 06 07 08 09 10 11 12 13 14 15 16 17 18 19-50
-40
-30
-20
-10
0
10
20
30
40
50
-50
-40
-30
-20
-10
0
10
20
30
40
50
7/6
RUSSELL 1000 vs. RUSSELL 2000 SPREAD(yearly percent change, basis points)
Russell 1000Outperforms 2000
Russell 1000Underperforms 2000
Source: Frank Russell Company and Haver Analytics.
yardeni.com
Market Cap: Russell 1000 vs. 2000
Page 11 / July 13, 2018 / Investment Style Guide www.yardeni.com
Yardeni Research, Inc.

2004 2005 2006 2007 2008 2009 2010 2011 2012 2013 2014 2015 2016 2017 2018 2019300
350
400
450
500
550
600
300
350
400
450
500
550
600
17
18 197/5
yardeni.com
* Time-weighted average of consensus estimates for current year and next year. Monthly through December 2005, then weekly.Source: Thomson Reuters I/B/E/S.
S&P 500 CITIGROUP GROWTH REVENUES PER SHARE(analysts’ average forecasts, ratio scale)
Consensus ForecastsAnnual estimates
Forward revenues*
Figure 19.
2004 2005 2006 2007 2008 2009 2010 2011 2012 2013 2014 2015 2016 2017 2018 2019500
550
600
650
700
750
800
850
500
550
600
650
700
750
800
850
18
19 7/5
17
yardeni.com
* Time-weighted average of consensus estimates for current year and next year. Monthly through December 2005, then weekly.Source: Thomson Reuters I/B/E/S.
S&P 500 CITIGROUP VALUE REVENUES PER SHARE(analysts’ average forecasts, ratio scale)
Consensus ForecastsAnnual estimates
Forward revenues*
Figure 20.
Growth vs. Value: Revenue Squiggles
Page 12 / July 13, 2018 / Investment Style Guide www.yardeni.com
Yardeni Research, Inc.

1995 1996 1997 1998 1999 2000 2001 2002 2003 2004 2005 2006 2007 2008 2009 2010 2011 2012 2013 2014 2015 2016 2017 2018 201915
25
35
45
55
65
75
85
95
15
25
35
45
55
65
75
85
95
1819
7/5
17
yardeni.com
* Time-weighted average of consensus estimates for current year and next year. Monthly through December 2005, then weekly.Source: Thomson Reuters I/B/E/S.
S&P 500 CITIGROUP GROWTH INDEX OPERATING EPS(analysts’ average forecasts, ratio scale)
Consensus ForecastsAnnual estimates
Forward earnings*
Figure 21.
1995 1996 1997 1998 1999 2000 2001 2002 2003 2004 2005 2006 2007 2008 2009 2010 2011 2012 2013 2014 2015 2016 2017 2018 201922
37
52
67
82
97
22
37
52
67
82
97
18
197/5
17
yardeni.com
* Time-weighted average of consensus estimates for current year and next year. Monthly through December 2005, then weekly.Source: Thomson Reuters I/B/E/S.
S&P 500 CITIGROUP VALUE INDEX OPERATING EPS(analysts’ average forecasts, ratio scale)
Consensus ForecastsAnnual estimates
Forward earnings*
Figure 22.
Growth vs. Value: Earnings Squiggles
Page 13 / July 13, 2018 / Investment Style Guide www.yardeni.com
Yardeni Research, Inc.

2004 2005 2006 2007 2008 2009 2010 2011 2012 2013 2014 2015 2016 2017 2018 20198
9
10
11
12
13
14
15
16
17
18
8
9
10
11
12
13
14
15
16
17
18
17
18
19
7/5
yardeni.com
(using analysts’ average earnings and revenues forecasts)
* Time-weighted average of the consensus estimates for current year and next year. Monthly through December 2005, weekly thereafter.Source: Thomson Reuters I/B/E/S.
S&P 500 CITIGROUP GROWTH PROJECTED PROFIT MARGIN
Consensus ForecastsAnnual estimates
Forward profit margin* (16.5)
Figure 23.
2004 2005 2006 2007 2008 2009 2010 2011 2012 2013 2014 2015 2016 2017 2018 20195
6
7
8
9
10
11
5
6
7
8
9
10
11
1819
7/5
17
yardeni.com
(using analysts’ average earnings and revenues forecasts)
* Time-weighted average of the consensus estimates for current year and next year. Monthly through December 2005, weekly thereafter.Source: Thomson Reuters I/B/E/S.
S&P 500 CITIGROUP VALUE PROJECTED PROFIT MARGIN
Consensus ForecastsAnnual estimates
Forward profit margin* (10.1)
Figure 24.
Growth vs. Value: Profit Margins
Page 14 / July 13, 2018 / Investment Style Guide www.yardeni.com
Yardeni Research, Inc.

Figure 25.
1995 1996 1997 1998 1999 2000 2001 2002 2003 2004 2005 2006 2007 2008 2009 2010 2011 2012 2013 2014 2015 2016 2017 2018 2019-20
-10
0
10
20
30
40
50
-20
-10
0
10
20
30
40
50
7/5
S&P 500 CITIGROUP GROWTH vs. VALUESTEG*
Growth (14.6)Value (13.2)
1995 1996 1997 1998 1999 2000 2001 2002 2003 2004 2005 2006 2007 2008 2009 2010 2011 2012 2013 2014 2015 2016 2017 2018 20195
10
15
20
25
5
10
15
20
25
7/5
LTEG*Growth (16.7)Value (15.3)
1995 1996 1997 1998 1999 2000 2001 2002 2003 2004 2005 2006 2007 2008 2009 2010 2011 2012 2013 2014 2015 2016 2017 2018 2019-20
-10
0
10
20
30
-20
-10
0
10
20
30
7/5
GrowthSTEG* (14.6)LTEG* (16.7)
1995 1996 1997 1998 1999 2000 2001 2002 2003 2004 2005 2006 2007 2008 2009 2010 2011 2012 2013 2014 2015 2016 2017 2018 2019-10
0
10
20
30
40
50
-10
0
10
20
30
40
50
7/5
ValueSTEG* (13.2)LTEG* (15.3)
* STEG: 12-month forward consensus expected earnings growth. LTEG: 5-year forward consensus expected earnings growth.
Source: Thomson Reuters I/B/E/S.
yardeni.com
Growth vs. Value: Earnings Growth
Page 15 / July 13, 2018 / Investment Style Guide www.yardeni.com
Yardeni Research, Inc.
1995 1996 1997 1998 1999 2000 2001 2002 2003 2004 2005 2006 2007 2008 2009 2010 2011 2012 2013 2014 2015 2016 2017 2018 20195
10
15
20
25
30
35
40
45
5
10
15
20
25
30
35
40
45
7/13
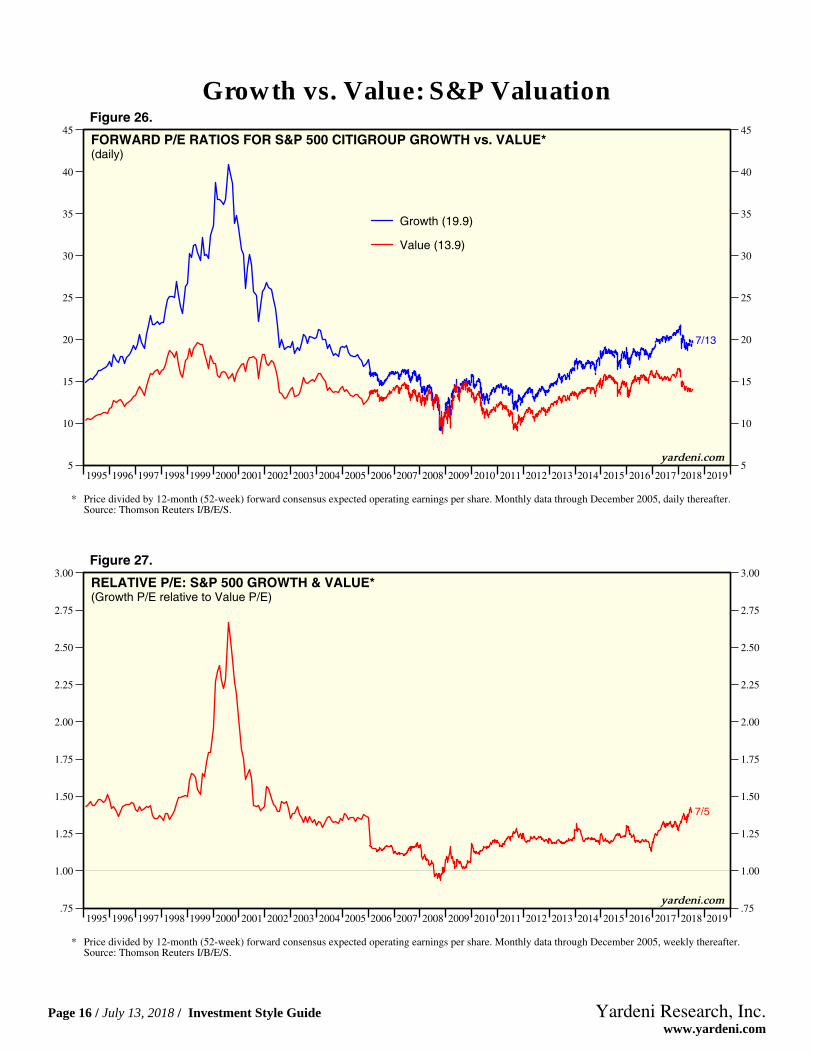
FORWARD P/E RATIOS FOR S&P 500 CITIGROUP GROWTH vs. VALUE*(daily)
Growth (19.9)
Value (13.9)
* Price divided by 12-month (52-week) forward consensus expected operating earnings per share. Monthly data through December 2005, daily thereafter.Source: Thomson Reuters I/B/E/S.
yardeni.com
Figure 26.
1995 1996 1997 1998 1999 2000 2001 2002 2003 2004 2005 2006 2007 2008 2009 2010 2011 2012 2013 2014 2015 2016 2017 2018 2019.75
1.00
1.25
1.50
1.75
2.00
2.25
2.50
2.75
3.00
.75
1.00
1.25
1.50
1.75
2.00
2.25
2.50
2.75
3.00
7/5
RELATIVE P/E: S&P 500 GROWTH & VALUE*(Growth P/E relative to Value P/E)
* Price divided by 12-month (52-week) forward consensus expected operating earnings per share. Monthly data through December 2005, weekly thereafter.Source: Thomson Reuters I/B/E/S.
yardeni.com
Figure 27.
Growth vs. Value: S&P Valuation
Page 16 / July 13, 2018 / Investment Style Guide www.yardeni.com
Yardeni Research, Inc.

1995 1996 1997 1998 1999 2000 2001 2002 2003 2004 2005 2006 2007 2008 2009 2010 2011 2012 2013 2014 2015 2016 2017 2018 2019.6
.8
1.0
1.2
1.4
1.6
1.8
2.0
2.2
2.4
2.6
2.8
.6
.8
1.0
1.2
1.4
1.6
1.8
2.0
2.2
2.4
2.6
2.8
7/5
PEG RATIOS FOR S&P 500 CITIGROUP GROWTH vs. VALUE*
Growth (1.14)Value (0.90)
* Using 5-year forward consensus expected earnings growth and price divided by 12-month (52-week) forward consensus expected operating earnings per share.Monthly data through December 2005, weekly thereafter.Source: Thomson Reuters I/B/E/S.
yardeni.com
Figure 28.
1995 1996 1997 1998 1999 2000 2001 2002 2003 2004 2005 2006 2007 2008 2009 2010 2011 2012 2013 2014 2015 2016 2017 2018 2019.25
.50
.75
1.00
1.25
1.50
1.75
2.00
.25
.50
.75
1.00
1.25
1.50
1.75
2.00
7/5
RELATIVE PEG: S&P 500 GROWTH & VALUE*(Growth PEG relative to Value PEG)
* Price divided by 12-month (52-week) forward consensus expected operating earnings per share. Monthly data through December 2005, weekly thereafter.Source: Thomson Reuters I/B/E/S.
yardeni.com
Figure 29.
Growth vs. Value: S&P Valuation
Page 17 / July 13, 2018 / Investment Style Guide www.yardeni.com
Yardeni Research, Inc.
1995 1996 1997 1998 1999 2000 2001 2002 2003 2004 2005 2006 2007 2008 2009 2010 2011 2012 2013 2014 2015 2016 2017 2018 201930
35
40
45
50
55
60
30
35
40
45
50
55
60
7/5
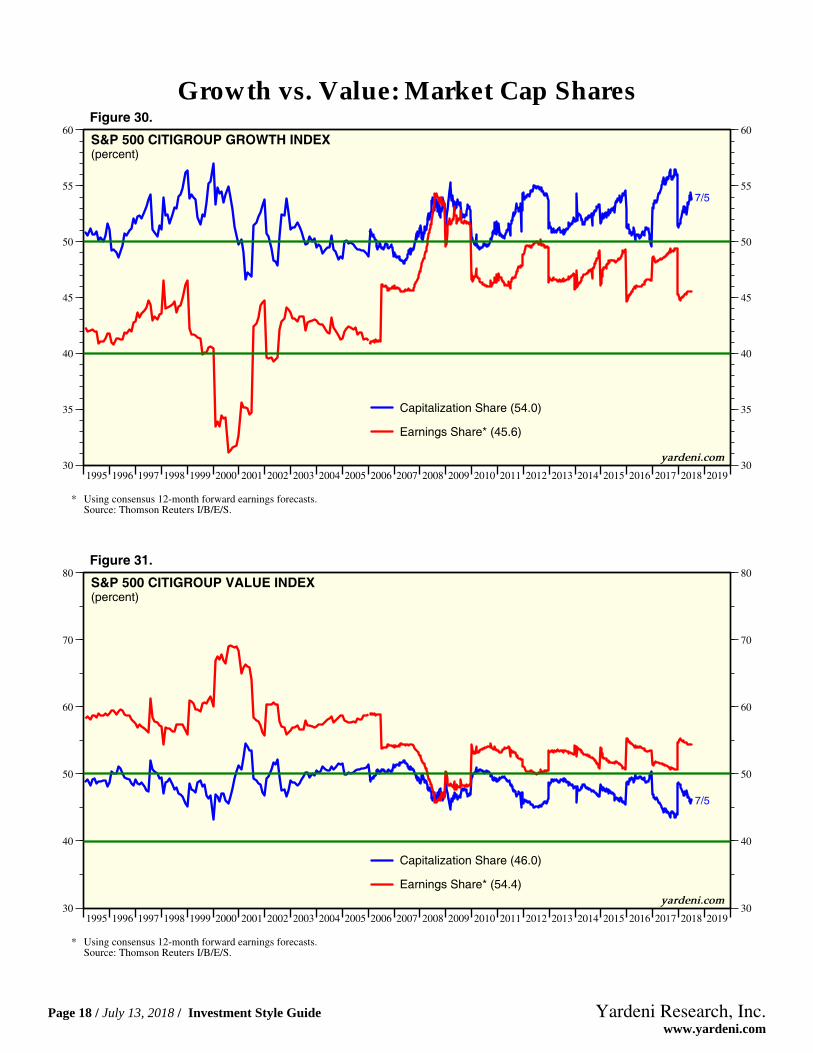
S&P 500 CITIGROUP GROWTH INDEX(percent)
Capitalization Share (54.0)
Earnings Share* (45.6)
* Using consensus 12-month forward earnings forecasts.Source: Thomson Reuters I/B/E/S.
yardeni.com
Figure 30.
1995 1996 1997 1998 1999 2000 2001 2002 2003 2004 2005 2006 2007 2008 2009 2010 2011 2012 2013 2014 2015 2016 2017 2018 201930
40
50
60
70
80
30
40
50
60
70
80
7/5
S&P 500 CITIGROUP VALUE INDEX(percent)
Capitalization Share (46.0)
Earnings Share* (54.4)
* Using consensus 12-month forward earnings forecasts.Source: Thomson Reuters I/B/E/S.
yardeni.com
Figure 31.
Growth vs. Value: Market Cap Shares
Page 18 / July 13, 2018 / Investment Style Guide www.yardeni.com
Yardeni Research, Inc.
1995 1996 1997 1998 1999 2000 2001 2002 2003 2004 2005 2006 2007 2008 2009 2010 2011 2012 2013 2014 2015 2016 2017 2018 2019-50
-40
-30
-20
-10
0
10
20
30
-50
-40
-30
-20
-10
0
10
20
30
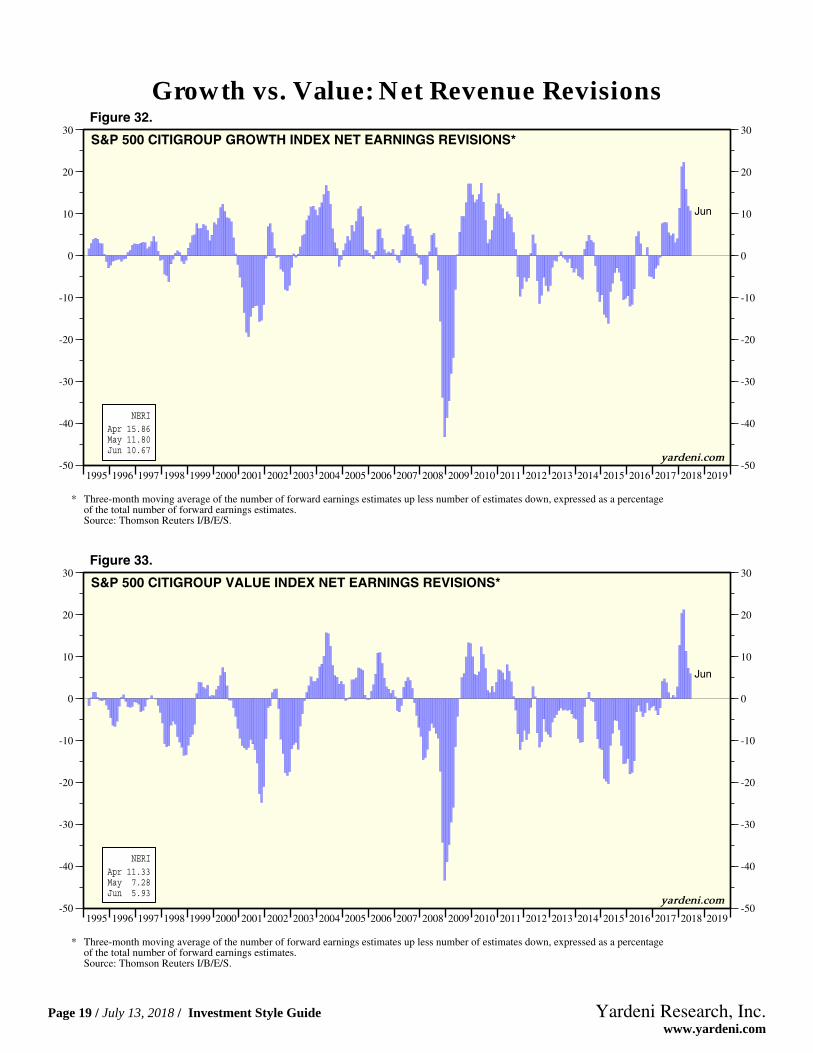
NERI Apr 15.86 May 11.80 Jun 10.67
Jun
yardeni.com
* Three-month moving average of the number of forward earnings estimates up less number of estimates down, expressed as a percentageof the total number of forward earnings estimates.Source: Thomson Reuters I/B/E/S.
S&P 500 CITIGROUP GROWTH INDEX NET EARNINGS REVISIONS*
Figure 32.
1995 1996 1997 1998 1999 2000 2001 2002 2003 2004 2005 2006 2007 2008 2009 2010 2011 2012 2013 2014 2015 2016 2017 2018 2019-50
-40
-30
-20
-10
0
10
20
30
-50
-40
-30
-20
-10
0
10
20
30
NERI Apr 11.33 May 7.28 Jun 5.93
Jun
yardeni.com
* Three-month moving average of the number of forward earnings estimates up less number of estimates down, expressed as a percentageof the total number of forward earnings estimates.Source: Thomson Reuters I/B/E/S.
S&P 500 CITIGROUP VALUE INDEX NET EARNINGS REVISIONS*
Figure 33.
Growth vs. Value: Net Revenue Revisions
Page 19 / July 13, 2018 / Investment Style Guide www.yardeni.com
Yardeni Research, Inc.

1995 1996 1997 1998 1999 2000 2001 2002 2003 2004 2005 2006 2007 2008 2009 2010 2011 2012 2013 2014 2015 2016 2017 2018 2019-50
-40
-30
-20
-10
0
10
20
30
-50
-40
-30
-20
-10
0
10
20
30
NERI Apr 15.86 May 11.80 Jun 10.67
Jun
yardeni.com
* Three-month moving average of the number of forward earnings estimates up less number of estimates down, expressed as a percentageof the total number of forward earnings estimates.Source: Thomson Reuters I/B/E/S.
S&P 500 CITIGROUP GROWTH INDEX NET EARNINGS REVISIONS*
Figure 34.
1995 1996 1997 1998 1999 2000 2001 2002 2003 2004 2005 2006 2007 2008 2009 2010 2011 2012 2013 2014 2015 2016 2017 2018 2019-50
-40
-30
-20
-10
0
10
20
30
-50
-40
-30
-20
-10
0
10
20
30
NERI Apr 11.33 May 7.28 Jun 5.93
Jun
yardeni.com
* Three-month moving average of the number of forward earnings estimates up less number of estimates down, expressed as a percentageof the total number of forward earnings estimates.Source: Thomson Reuters I/B/E/S.
S&P 500 CITIGROUP VALUE INDEX NET EARNINGS REVISIONS*
Figure 35.
Growth vs. Value: Net Earnings Revisions
Page 20 / July 13, 2018 / Investment Style Guide www.yardeni.com
Yardeni Research, Inc.

2008 2009 2010 2011 2012 2013 2014 2015 2016 2017 2018 2019-20
-15
-10
-5
0
5
10
15
20
25
30
-20
-15
-10
-5
0
5
10
15
20
25
30
7/508
09
10
11
12
13
14
15 16
17
18
19
yardeni.com
Source: Thomson Reuters I/B/E/S.
S&P 500 CITIGROUP GROWTH REVENUE GROWTH(analysts’ average forecasts, ratio scale)
Consensus ForecastsAnnual estimates
Forward revenues*
2008 (9.6)2009 (-8.7)2010 (11.4)2011 (14.2)2012 (6.6)2013 (4.2)
2014 (8.5)2015 (5.1)2016 (4.9)2017 (9.1)2018 (11.7)2019 (7.9)Fwrd (9.0)
Figure 36.
2008 2009 2010 2011 2012 2013 2014 2015 2016 2017 2018 2019-10
-5
0
5
10
15
-10
-5
0
5
10
15
7/5
08
09
10 11
12
13 14
15
16
1718
19
yardeni.com
Source: Thomson Reuters I/B/E/S.
S&P 500 CITIGROUP VALUE REVENUE GROWTH(analysts’ average forecasts, ratio scale)
Consensus ForecastsAnnual estimates
Forward revenues*
2008 (2.6)2009 (-5.9)2010 (7.7)2011 (7.4)2012 (-2.2)2013 (0.4)
2014 (0.6)2015 (-7.9)2016 (0.2)2017 (5.2)2018 (6.2)2019 (3.7)Fwrd (4.6)
Figure 37.
Growth vs. Value: Revenue Growth
Page 21 / July 13, 2018 / Investment Style Guide www.yardeni.com
Yardeni Research, Inc.

2008 2009 2010 2011 2012 2013 2014 2015 2016 2017 2018 2019-30
-25
-20
-15
-10
-5
0
5
10
15
20
25
30
35
-30
-25
-20
-15
-10
-5
0
5
10
15
20
25
30
35
08
10
11
1213
14
15
18
19
7/5
09
16
17
yardeni.com
Source: Thomson Reuters I/B/E/S.
S&P 500 CITIGROUP GROWTH EARNINGS GROWTH(percent)
Consensus ForecastsAnnual estimates
Forward revenues*
2008 (7.9)2009 (-12.6)2010 (29.1)2011 (20.5)2012 (11.8)2013 (9.1)
2014 (14.5)2015 (9.8)2016 (7.1)2017 (14.6)2018 (23.6)2019 (11.4)Fwrd (14.6)
Figure 38.
2008 2009 2010 2011 2012 2013 2014 2015 2016 2017 2018 2019-40
-30
-20
-10
0
10
20
30
40
50
60
70
-40
-30
-20
-10
0
10
20
30
40
50
60
70
08
10
11
1213
14
15
18
197/5
09
16
17
yardeni.com
Source: Thomson Reuters I/B/E/S.
S&P 500 CITIGROUP VALUE EARNINGS GROWTH(percent)
Consensus ForecastsAnnual estimates
Forward revenues*
2008 (-35.0)2009 (23.5)2010 (60.3)2011 (10.0)2012 (1.5)2013 (3.7)
2014 (1.5)2015 (-5.6)2016 (-3.3)2017 (8.6)2018 (21.3)2019 (8.8)Fwrd (13.2)
Figure 39.
Growth vs. Value: Earnings Growth
Page 22 / July 13, 2018 / Investment Style Guide www.yardeni.com
Yardeni Research, Inc.

2003 2004 2005 2006 2007 2008 2009 2010 2011 2012 2013 2014 2015 2016 2017 2018 2019 202010
15
20
25
30
35
40
10
15
20
25
30
35
40
7/5
FORWARD P/E RATIOS FOR RUSSELL 2000*(weekly)
Russell 2000 (23.1)Russell 2000 Growth (35.0)Russell 2000 Value (17.0)
* Price divided by 12-month (52-week) forward consensus expected operating earnings per share. Monthly data through December 2005, weekly thereafter.Source: Thomson Reuters I/B/E/S.
yardeni.com
Figure 40.
1999 2000 2001 2002 2003 2004 2005 2006 2007 2008 2009 2010 2011 2012 2013 2014 2015 2016 2017 2018 201910
15
20
25
30
35
10
15
20
25
30
35
7/5
FORWARD P/E RATIOS FOR US SMALLCAP *
P/E capped at 35 due to extreme values. Russell 2000 (23.1)S&P 600 SmallCap (17.8)
* Price divided by 12-month (52-week) forward consensus expected operating earnings per share. Monthly data through December 2005, weekly thereafter.Source: Thomson Reuters I/B/E/S.
yardeni.com
Figure 41.
Russell Valuation SmallCap, Growth, Value
Page 23 / July 13, 2018 / Investment Style Guide www.yardeni.com
Yardeni Research, Inc.

http://blog.yardeni.com
http://blog.yardeni.com
Copyright (c) Yardeni Research, Inc. 2018. All rights reserved. The informationcontained herein has been obtained from sources believed to be reliable, but is notnecessarily complete and its accuracy cannot be guaranteed. No representation orwarranty, express or implied, is made as to the fairness, accuracy, completeness, orcorrectness of the information and opinions contained herein. The views and the otherinformation provided are subject to change without notice. All reports posted onwww.yardeni.com, blog.yardeni.com, and YRI’s Apps for iPads and iPhones are issuedwithout regard to the specific investment objectives, financial situation, or particular needsof any specific recipient and are not to be construed as a solicitation or an offer to buy or sellany securities or related financial instruments. Past performance is not necessarily a guideto future results. Company fundamentals and earnings may be mentioned occasionally, butshould not be construed as a recommendation to buy, sell, or hold the company’s stock.Predictions, forecasts, and estimates for any and all markets should not be construed asrecommendations to buy, sell, or hold any security--including mutual funds, futurescontracts, and exchange traded funds, or any similar instruments.
The text, images, and other materials contained or displayed on any Yardeni Research, Inc.product, service, report, email or website are proprietary to Yardeni Research, Inc. andconstitute valuable intellectual property. No material from any part of www.yardeni.com, blog.yardeni.com, and YRI’s Apps for iPads and iPhones may be downloaded, transmitted,broadcast, transferred, assigned, reproduced or in any other way used or otherwisedisseminated in any form to any person or entity, without the explicit written consent ofYardeni Research, Inc. All unauthorized reproduction or other use of material from YardeniResearch, Inc. shall be deemed willful infringement(s) of this copyright and other proprietaryand intellectual property rights, including but not limited to, rights of privacy. YardeniResearch, Inc. expressly reserves all rights in connection with its intellectual property,including without limitation the right to block the transfer of its products and services and/orto track usage thereof, through electronic tracking technology, and all other lawful means,now known or hereafter devised. Yardeni Research, Inc. reserves the right, without furthernotice, to pursue to the fullest extent allowed by the law any and all criminal and civilremedies for the violation of its rights.
The recipient should check any email and any attachments for the presence of viruses.Yardeni Research, Inc. accepts no liability for any damage caused by any virus transmittedby this company’s emails, website, blog and Apps. Additional information available onrequest.