Embed Size (px)
Citation preview

Investor PresentationOctober 2020

DISCLAIMERForward-Looking StatementsThis presentation contains forward-looking statements within the meaning of the Private Securities Litigation Reform Act of 1995. All statements other than statements of historicalfact included in this presentation are forward-looking statements. Forward-looking statements discuss our current expectations and projections relating to our financial condition,results of operations, plans, objectives, future performance and business. These statements may be preceded by, followed by or include the words “may,” “might,” “will,”“objective,” “intend,” “should,” “could,” “can,” “would,” “expect,” “believe,” “design,” “estimate,” “predict,” “potential,” “plan” or the negatives thereof and other words and termsof similar meaning. These statements are not guarantees of future performance and involve a number of known and unknown risks, assumptions, trends, uncertainties and factorsthat are beyond our control, including without limitation, those identified in our annual report on Form 10-K for the fiscal year ended December 31, 2019 filed on February 26,2020 and our quarterly reports on Form 10-Q, under the sections titled “Risk Factors,” “Cautionary Note Regarding Forward-Looking Statements,” and “Management's Discussionand Analysis of Financial Condition and Results of Operations.” Should one or more of these risks or uncertainties materialize or should underlying assumptions prove incorrect,actual results may vary materially from those anticipated, estimated or projected. You should not place undue reliance on these statements. We have based these forward-lookingstatements on our current expectations and projections about future events. Although Noodles & Company ("we" or the "Company") believes that our assumptions made inconnection with the forward-looking statements are reasonable, we cannot assure you that the assumptions and expectations will prove to be correct. All forward-lookingstatements speak only as of the date of this document. We undertake no obligations to update or revise publicly any forward-looking statements in this presentation, whether as aresult of new information, future events or otherwise other than as required under the federal securities laws.
Note Regarding Non-GAAP MeasuresIn this presentation, we include certain supplemental financial measures, including EBITDA, Adjusted EBITDA, restaurant contribution, and restaurant contribution margin, whichare neither required by nor presented in accordance with generally accepted accounting principles in the U.S. (“GAAP”). The presentation of this financial information is notintended to be considered in isolation or as a substitute for, or to be superior to, the financial information prepared and presented in accordance with GAAP. We use these non-GAAP financial measures for financial and operational decision making and as a means to evaluate period-to-period comparisons. We believe that they provide useful informationabout operating results, enhance the overall understanding of past financial performance and future prospects and allow for greater transparency with respect to key metrics usedby management in its financial and operational decision making. You are cautioned, however, that these measures, as we calculate them, are not necessarily comparable tosimilarly titled measures reported by other companies. In addition, these measures have limitations as analytical tools and should be considered only in conjunction with ourfinancial results reported under GAAP, and not in isolation. See the Appendix for a reconciliation of each non-GAAP financial measure included in this presentation to its directlycomparable GAAP measurement. For more information on why management considers these non-GAAP financial measures to be important indicators of our operational strengthand performance, as well as the limitations on these measures as an analytical tool, please see our annual report on Form 10-K for the fiscal year ended December 31, 2019 filedon February 26, 2020 and our quarterly reports on Form 10-Q, under the sections titled “Key Measures We Use to Evaluate Our Performance.”
2

COMPANY SNAPSHOTBRAND OVERVIEW 456 RESTAURANTS, ACROSS 30 STATES (1)
Founded: 1995
Headquarters: Broomfield, Colorado
2019 Total Revenue $462 million
2019 Adjusted EBITDA (2): $38 million
Systemwide Restaurants (1):
456 fast casual restaurants across 30 states
– 380 Company-owned (83%)
– 76 franchised (17%)
Per Person Spend (3): $9.53
2019 Average Unit Volume: $1.16 million
58% off-premise, 42% dine-inPre-Covid Channel Mix (4):
Company-Operated / Franchised
3(1) As of June 30, 2020 (end of second fiscal quarter). States includes D.C.(2) See appendix for Adjusted EBITDA calculation and reconciliation to GAAP metric.(3) For the fiscal year ending December 31, 2019.(4) For the fourth quarter ended December 31, 2019.
INVESTMENT HIGHLIGHTS

INVESTMENT HIGHLIGHTS
Differentiated ConceptUnique advantage to appeal to a broad range of lifestyle, convenience and dietary needs.
• Strong momentum before COVID• Unique, differentiated menu• Attractive target market• Best-in-class convenience

17
SYSTEMWIDE SAME STORE SALES GROWTH(1)
(1) First quarter of 2020 data through the second fiscal period ending February 25th 2020
(0.2%)
5.4% 5.5%
4.0%
3.0%
4.6%
2.1% 1.5%
5.8%
Q1'18 Q2'18 Q3'18 Q4'18 Q1'19 Q2'19 Q3'19 Q4 '19 Pre-Covid QTDQ1 '20
SALES MOMENTUM BEFORE COVID

LTM RESTAURANT-LEVEL MARGIN EXPANSION(1)
Quarterly Margin:
(1) Represents rolling LTM restaurant-level contribution margin.
Improved Restaurant Level Margin
- Leverage on sales growth
- Effective cost management
Additional Margin Expansion Opportunity
- Supply chain discipline
- Distribution optimization
- Kitchen labor efficiency
18
13.3%
14.2%
14.7%14.8%
15.0% 15.0% 15.0%
15.4%
15.6%
16.1%
15.6% 15.1% 12.9% 15.5% 16.4% 15.2% 17.1%
200 bps Quarter-over-Quarter Improvement
12.6% 17.1% 17.2%
MARGIN EXPANSION BEFORE COVID

UNIQUE, DIFFERENTIATED MENU
6
Only national chain delivering world flavors through noodles and pasta
Favorites from Kids to Adults, Healthy to Indulgent, Familiar to New
Variety particularly relevant to current consumer environment

7
DIETARY FRIENDLY PERFECT BOWLS
ENHANCED DIGITAL CUSTOMIZATION
VALUE-PRICED FAMILY MEALS
FOCUS ON CORE MENU DURING COVID
7
LOW-CARB, PLANT-BASED INNOVATION

Over-index on:
- Millennials and Generation Z
- Young families
- Higher educated and higher income
ATTRACTIVE TARGET MARKET
8
31%
18% 15%
36%
23%15% 12%
50%
0%
10%
20%
30%
40%
50%
60%
<$50k $50k-$75k $75k-$100k $100k+
Household Income
Fast Casual Average Noodles Guest Average
Source: Coca Cola Dine360 Aug ‘20
11%
33%25% 22%
9%13%
40%
28%
14%5%
0%
10%
20%
30%
40%
50%
13-18 19-34 35-49 50-64 65+
Age
Fast Casual Average Noodles Guest Average
17%
83%
53%
38%
14%
87%
62%
47%
0%
20%
40%
60%
80%
100%
1 person 2+ person No Children 1+ Child in HH
Household Size & Children in HH
Fast Casual Average Noodles Guest Average

BEST-IN-CLASS CONVENIENCE
9
58% OF SALES PRE-COVID OFF-PREMISE – Q4 2019
Uniquely positioned to meet need for convenience
- Menu variety
- Menu items travel well
- Favorable price point and speed

INVESTMENT HIGHLIGHTS
Brand Activation Effective strategy to navigate COVID and post-COVID world.
• Return to Positive SSS• Digital sales growth• Effectively utilizing rewards program data• Commitment to safety strengthening
brand reputation

COMPARABLE RESTAURANT SALES BY FISCAL PERIOD (2)
RETURN TO POSITIVE SAME STORE SALES
13
2.4% Average Unit Volume (AUV)(1) growth versus prior year during Fiscal September
(1) Average Unit Volumes annualize volumes during each respective period. (2) Comparable restaurant sales for company-owned locations

GROWTH IN DIGITAL SALES & REWARDS MEMBER BASE
13
Q2 2020 SALES BY ORDER METHODQ4 2019 SALES BY ORDER METHOD
2,400,000
2,800,000
3,200,000
3,600,000
Sep-19 Sep-20
18% Rewards Membership Growth
Digital Sales grew +135% Yr/Yr in Q2 2020

EFFECTIVELY ENGAGING WITH GUESTS
13
Digital Channel
Highlights
Email - Strengthened email engagement resulting in open rates improving +5% vs Pre-COVID
Media - Increased media attributable revenue +64%, with (40%) decrease in Cost Per Acquisition (CPA)
Social - Changed media mix and content approach resulting in video content outperforming other paid ads by 212%
App - Over 400k app downloads with a 4.8 rating in the app stores

RELENTLESS FOCUS ON SAFETY
9
An industry leader in ensuring safety and health of team members and guests
Source: Noodles & Company Brand Awareness Tracker Sept ‘20

INVESTMENT HIGHLIGHTS
Unit Growth AccelerationOpportunity for significant acceleration in new unit growth
• Operating model perfectly suited for post-COVID world
• Disciplined, proven development process
• Strong foundation to support accelerated growth

UNIT GROWTH OPPORTUNITY
15
7%+ Long-Term Annual Unit Growth Target- Positioned for acceleration- Industry disruption- More favorable development environment
CURRENT FOOTPRINT INDICATES INFILL & NEW MARKET OPPORTUNITY
Company-Operated / Franchised(CURRENT LOCATIONS)
30%+ Targeted Cash-On-Cash Return- Reduced square footage, off-premise oriented- More efficient kitchen layout- Target 70%+ of units to include order ahead drive-
thru window
Non-Traditional Opportunity- Recent success shows opportunity to succeed in
locations with limited/no dining room- Exploring non-traditional opportunities
- E.g. “Ghost Kitchen”, “Virtual Kitchen”
PROVEN DEVELOPMENT STRATEGY
15
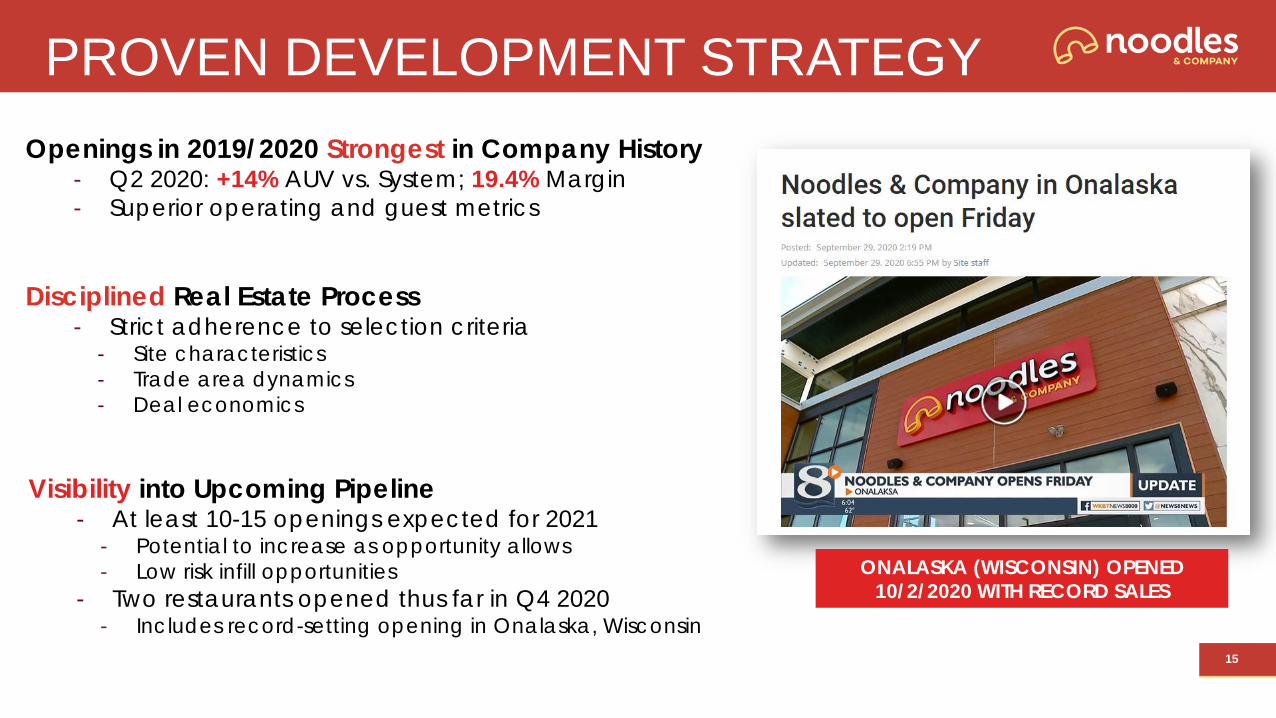
Openings in 2019/2020 Strongest in Company History- Q2 2020: +14% AUV vs. System; 19.4% Margin- Superior operating and guest metrics
Disciplined Real Estate Process- Strict adherence to selection criteria
- Site characteristics- Trade area dynamics- Deal economics
Visibility into Upcoming Pipeline- At least 10-15 openings expected for 2021
- Potential to increase as opportunity allows- Low risk infill opportunities
- Two restaurants opened thus far in Q4 2020- Includes record-setting opening in Onalaska, Wisconsin
ONALASKA (WISCONSIN) OPENED 10/2/2020 WITH RECORD SALES

FOUNDATION SET FOR ACCELERATED GROWTH
15
Strengthened Internal Development Team- Experience from well established growth brands
Franchise Growth Opportunity
Strong Balance Sheet - Net Debt at Pre-Covid Levels
GENERAL MANAGER TENURE WITH COMPANY (YRS)
4.1
4.4
4.6
5.3
2017 Q2 2018 Q2 2019 Q2 2020 Q2
Bench Strength to Support Unit Growth- Commitment to best in class culture and
team development- Unique industry leading approach to
relevant, differentiated benefits

INVESTMENT HIGHLIGHTS
Unit Growth AccelerationOpportunity for significant acceleration in new unit growth
• Operating model perfectly suited for post-COVID world• Disciplined, proven development process• Strong foundation to support accelerated growth
Brand Activation Effective strategy to navigate COVID and post-COVID world.
• Return to Positive SSS• Digital sales growth• Effectively utilizing rewards program data• Commitment to safety strengthening brand reputation
Differentiated ConceptUnique advantage to appeal to a broad range of lifestyle, convenience and dietary needs.
• Strong momentum before COVID• Unique, differentiated menu• Attractive target market• Best-in-class convenience

APPENDIX

RESTAURANT CONTRIBUTION RECONCILIATION
22
Note: Restaurant contribution and restaurant contribution margin are non-GAAP measures that are neither required by, nor presented in accordance with GAAP. Restaurant contribution represents restaurant revenue less restaurant operating costs which are cost of sales, labor, occupancy and other restaurant operating costs. Restaurant contribution margin represents restaurant contribution as a percentage of restaurant revenue. The calculation of these measures may not be comparable to similar measures reported by other companies. The presentation of restaurant contribution and restaurant contribution margin is not intended to be considered in isolation or as a substitute for, or to be superior to, the financial information prepared and presented in accordance with GAAP. Management believes that restaurant contribution and restaurant contribution margin are important tools for investors and other interested parties because they are widely-used metrics within the restaurant industry to evaluate restaurant-level productivity, efficiency and performance. Management also uses restaurant contribution and restaurant contribution margin as metrics to evaluate the profitability of incremental sales at our restaurants, restaurant performance across periods and restaurant financial performance compared with competitors.
Q 4 '19 Q 3 '19 Q 2 '19 Q 1 '19 Q 4 '18 Q 3 '18 Q 2 '18 Q 1 '18 Q 4 '17 Q 3 '17 Q 2 '17 Q 1 '17
Income (Loss) from operations $ 247 $ 5,044 $ 1,238 $ (1,090) $ 950 $ 2,132 (4,162) (2,678) 87 $ (7,483) (808) (25,646)
Less: Franchising royalties and fees 1,582 1,545 1,332 1,281 1,138 1,175 944 913 1,350 1,191 1,164 1,188
Plus: General and administrative 11,022 10,436 11,848 10,140 10,612 10,399 14,813 10,268 9,880 9,807 9,393 10,666
Depreciation and amortization 5,460 5,458 5,661 5,507 5,465 5,790 5,797 5,820 5,884 6,183 6,279 6,267
Pre-opening 71 266 65 - - - 3 47 75 69 246 545
Restaurant impairments, closure costs and asset disposals 4,107 336 2,884 420 1,190 1,792 2,580 1,580 2,299 10,263 2,830 22,054
Restaurant contribution $ 19,325 $ 19,995 $ 20,364 $ 13,696 $ 17,079 $ 18,938 $ 18,087 $ 14,124 $ 16,875 $ 17,648 $ 16,776 $ 12,698
Restaurant contribution margin 17.2% 17.1% 17.1% 12.6% 15.2% 16.4% 16.6% 12.9% 15.1% 15.6% 15.0% 11.0%
Quarter Ended

ADJUSTED EBITDA RECONCILIATION
23
Note: EBITDA and adjusted EBITDA are non-GAAP measures that are neither required by, nor presented in accordance with GAAP. We define EBITDA as net income (loss) before interest expense, provision (benefit) for income taxes and depreciation and amortization. We define adjustedEBITDA as net income (loss) before interest expense, provision (benefit) for income taxes, depreciation and amortization, restaurant impairments, closure costs and asset disposals, certain litigation settlements, non-recurring registration and related transaction costs, severance costs andstock-based compensation. The calculation of these measures may not be comparable to similar measures reported by other companies. The presentation of EBITDA and adjusted EBITDA is not intended to be considered in isolation or as a substitute for, or to be superior to, the financialinformation prepared and presented in accordance with GAAP. Management believes EBITDA and adjusted EBITDA provide clear pictures of our operating results by eliminating certain non-recurring and non-cash expenses that may vary widely from period to period and are not reflective ofthe underlying business performance.
December 31, 2019 January 1, 2019 January 2, 2018
Net income (loss) $ 1,647 $ (8,441) $ (37,482)
Depreciation and amortization 22,086 22,872 24,613
Interest expense, net 2,942 4,305 3,839
Provision (benefit) for income taxes 104 (248) (207)
EBITDA $ 26,779 $ 18,488 $ (9,237)
Restaurant impairments, closure costs and asset disposals 7,747 7,142 37,446
Litigation settlements and data breach assessments - 3,796 (401)
Fees and costs related to the registration statement and related transactions 190 53 679
Loss on extinguishment of debt 746 626 -
Severance costs 522 278 581
Stock-based compensation expense 2,443 2,979 1,513Adjusted EBITDA $ 38,427 $ 33,362 $ 30,581
(in thousands)
Fiscal Year Ended