Embed Size (px)
Citation preview
IOTC–2015–WPEB11–43 Rev_1
Page 1 of 18
Preliminary study of cetacean depredation on pelagic longline fisheries using passive
acoustic monitoring off Reunion Island.
Loïc LE FOULGOC(1), Emilie RICHARD(1), Marion CONDET(2), Jean-Sébastien. PHILIPPE(2), Erwan. ROUSSEL(2), Justine CHOMPRET(3), Dominique CLORENNEC(3)
(1) CAP RUN (Centre Technique d’Appui à la Pêche Réunionnaise) – HYDRÔ REUNION , Magasin n°10 – Port Ouest, 97420 Le Port, Île de la Réunion, France..
(2) BIOTOPE Réunion-910 Chemin Lagourgue 97440 Saint André, Île de la Réunion, France.
(3) QUIETOCEANS, 65 Place Nicolas Copernic, 29280 Plouzané, France
ABSTRACT
Depredation can be defined as the predation of caught fish or bait by free-ranging
animals. Since the 1900s, depredation of Reunion’s longline fishery by toothed whales is
known to contribute significantly to reduced commercial catch (sometimes destroying
100% of the catch). Describing depredation by cetaceans is a key driver in helping
implement non-destructive adaptive fishing solutions. With fishing mainly occurring at
night and over long distances, passive acoustic monitoring is a promising method. A
preliminary study was launched to determine the technical feasibility accompanied by
acoustic analysis of associated with depredation. Over two months (November-
December 2014), 3 autonomous hydrophones (HTI-96-MIN) were attached at the
extremities and central section of a 30 km longline for 9 fishing operations, 30 miles off
Reunion Island. A total of 387 hrs of sound were recorded and analyzed. Biological sounds
(clicks and whistles) and physical sounds were quantified over time with two automatic-
methods in relation to recorder locations. Whistle samples allowed species identification
using a semi-automatic method (ROCCA classifier). Catch data were correlated with
cetaceans’ presence. Engagement and support from local fishers resulted in a final
protocol demonstrating good quality acoustic measurements with reduced physical noise.
Whistles and clicks represented 34% of all detections (~12% for clicks). Cetacean sounds
were detected during all trials with variable detection rates (between 2.5 to 66% of the
recorded duration). Distances between hydrophones enabled the drawing of possible
trajectories of groups along longlines. On four fishing trials, cetaceans were detected
immediately after the line deployment. Six different species of toothed whales were
identified with a predominance of false killer whales (Pseudorca crassidens). The presence
of the pilot whales (Globicephala macrorhynchus) was probably underestimated due to its
similarity with Pseudorca emissions and the paucity of studied samples. Since few signs of
depredation were visible on catches, no obvious correlation was determined between the
presence of cetaceans and depredation rates. Further investigations are thus required to
build on these preliminary results.
Keywords: Indian Ocean, Passive acoustic, Cetacean depredation, longline fisheries

IOTC–2015–WPEB11–43 Rev_1
Page 2 of 18
Introduction
Depredation attracts broad international attention during recent decades with worldwide
expansion of fishing by passive gears, in particular pelagic and bottom longlines.
Presumed steady increase of depredation level from the early years of fisheries to present
(IOTC, 2000a, Donoghue et al., 2003, Gilman et al., 2007) and economic losses associated
with this type of interaction (IOTC, 1999, 2000a, Bargain, 2000, 2001; Nishida, Tanio,
2001, Rabearisoa, 2012) were major concerns (Romanov et al., 2013). Depredation is
usually defined as 'the partial or complete removal of hooked fish or bait from fishing
gear... by predators likes cetaceans, sharks, bone fish, birds, squids, crustaceans and
others' distinguishing it from predation, i.e. 'the taking of free swimming fish (or others
organism) ...' (Donoghue et al. , 2003 ; Gilman et al. , 2006, 2007). As Romanov et al.
(2013) suggests ‘Depredation observed mostly in stationary (passive) gears like pelagic
and bottom longlines (Kock et al., 1996; Gilman et al., 2006, 2008), gillnets (Read et al.,
2003), traps, line fisheries (de Stephanis 2004; Navarro, 2007, Bearzi, 2007) and within
aquaculture facilities (Stickley et al., 1992; Coon, 1996; Glahn et al., 1999; Fenech et al.,
2004; Kloskowski, 2005). Longline fishing operations probably most suffer from
depredation due to its worldwide distribution, stationary nature, long exposure (hours) in
the environment, easy access to animal caught and gear fragility. Depredation facts and
respective losses of catch are usually not reported in the fishery statistics and are source
of 'cryptic mortality' not accounted in the current stock assessment studies, therefore
affecting directly fisheries management decision. Economic losses due to catch and gear
damage are brought serious concerns for fishers (Yano, Dahlheim, 1994; Nishida, Tanio,
2001; Donoghue et al., 2003; Rabearisoa, 2012) while harm to marine megafauna either
through interactions with fishing gears or with fishermen who attempts to protect their
catch (Gulland, 1986; Read, 2008) rising conservation issues. There is obvious urgent need
for close monitoring of the depredation phenomenon, its quantification, incorporation
into the fisheries management schemes and development of mitigation measures.’
Describing and understanding of depredation modus operandi by cetaceans is a key driver
in helping implement non-destructive adaptive fishing solutions. With fishing mainly
occurring at night and over long distances, passive acoustic monitoring is a promising
method. A preliminary study was launched to determine the technical feasibility of the
method accompanied by acoustic analysis of marine animals sounds associated with
depredation.
Fleet and operations mode
The pelagic longline fishery of Reunion Island uses horizontal drifting longlines that are
set at night with 300 to 1600 baited hooks to target primarily swordfish. Longlines are
hauled in the morning just after the sunrise in attempts to catch – in addition to swordfish
– other commercial species such as tunas, marlins and dolphinfish. Reunion's longliners
operate in the southwest Indian Ocean mostly between Reunion Island and the east coast
of Madagascar. This fishery started in 1991 with a single vessel operating off the coast of
IOTC–2015–WPEB11–43 Rev_1
Page 3 of 18
Reunion Island. The fishing fleet grew fast until 2000 with 38 active longliners at that time
(Bourjea et al., 2009). By 2014, the number of active longliners was similar (~36) but ratio
of small vessels (LOA<12m) to large unities (LOA>12m) increase. During recent years
some kind of evolution in the fishing strategy was observed with attempts to target tuna
by increasing soaking time: deploying longline earlier and retrieving later in order to
overlap tuna late evening/early morning feeding activity at the surface are widely used, in
particulars in the areas of tuna aggregations (east coast of Madagascar). Depredation is
important issue in local longline fishery. There is common believe among fishermen that
attacks level are steadily increasing. Some captains reported associations between their
vessels and cetaceans who following the boat in successive fishing operations spread
from east coast of Madagascar to Mayotte and back (Romanov et al., 2013). There is
common opinion that ‘globicephales’ (i.e. Globicephala macrorhynchus) are mostly
responsible on depredation on fish caught, while interactions with other predators, in
particular cetaceans (false killer whale Pseudorca crassidens, dolphins: Risso dolphin
Grampus griseus, bottlenose dolphin Tursiops truncatus), sharks, squids and seabirds are
also observed. Depredation combined with overall low CPUE observed during several
consecutive months of the 2013 provoked a “depredation crisis” that jeopardize longline
fishery of Reunion Island. Some vessels ceased operations for several weeks waiting for
improvement of the situation. Overall impact related with catch losses and suspension of
fishing operations resulted in serious economic losses of the longline fleet based in
Reunion Island. In the same one should keep in mind that quantification of overall level of
depredation and depredation impact is very difficult. Despite overall detrimental impact
of depredation on the fishery and fishery economics there is no system to collect
information on depredation on routine basis. Observer coverage is of local fleet is
relatively low (~5% of operations) (Romanov et al., 2013).
Passive acoustic monitoring : promising method
To develop an approach to reduce depredation, we need to characterize the
phenomenon and know: which species are present in the pelagic environment and
implicated in depredation? If presence of certain cetacean species is associated with
depredation and lower catches?
Several observation methods have been developed to study biology and understand
behaviour of marine mammals. Visual observation is commonly used. However, this
method is difficult to use in pelagic environment, with drifting longlines (long soak time,
wary species, night-time activity, and longlines drifting for a long distances...).
Another potential method of cetaceans monitoring is tagging. Used for biggest species
(humpback whales in Reunion Island), this method is costly, time-consuming, and is
difficult to implement on rapid and active toothed whales.
Third complementary monitoring method is passive acoustic monitoring. This method is
widely used by scientist more than 20 years for biologic marine studies, in oceans

IOTC–2015–WPEB11–43 Rev_1
Page 4 of 18
geophysics, and marine engineering. Data collection tool is submerged hydrophones,
recording sounds under water. There is a several various types of hydrophones, used in
many scientific, military and commercial applications. Marine bioacoustics studies (study
of animal sounds) are used in various studies, such as communication and related
behaviour, sound production, hearing, environmental monitoring, identification
techniques and applications, impact of noise…Studies focused on several groups of
marine animals like fishes, crustaceans, pinnipeds, and cetaceans. Biologic sounds
detection tools, species automatic recognising, species classifiers and algorithms used to
determinate relative abundances or appreciate trajectories turn it into an indispensable
tool to observe marine megafauna. Acoustic data are highly useful for creation of a
database in order to improve our knowledge on species, their communication system,
behaviour, social codes.
Recent studies use bioacoustics to identify presence/absence of marine mammals near
infrastructures to be built, for monitoring migratory species (humpback whales, sperm
whales), or determination of coastal dolphins habitat. At large scale (South West Indian
Ocean basin coupled with year-long monitoring) hydrophone based records may provide
a complementary data to ones collected by other methods (visual and telemetric),
identify migratory patterns and apply sustainable management measures on pelagic
ecosystems. Finally, listening cetaceans is a way to better understanding the poorly
known cetacean live patterns in pelagic environment and is a potential key to interpret
interaction between longline fisheries and depredation.
This short study has several level of objectives:
The first one is defined like a ‘listening potentiality’. It focused on feasibility to
collect data aboard a longline boat using hydrophone without constraints to
fishing operations.
The second one is defined like a ‘listening quality’. It focused on the development
of an evolutive protocol in hydrophone deployment to obtain an optimal listening
quality during successive campaigns.
The third objective is defined like an ‘discriminative listening’. Starting from an
optimal listening quality, our aim is to test an ability to differentiate abiotic and
biotic sounds by applying two comparative methods and isolate whistles and clicks
of cetaceans encountered along longline gear.
The final objective is defined like a ‘listening to understanding’: testing a potential
to identify cetacean species involved in depredation and to set up objective
interpretation criteria between presence of cetacean and depredation.
Materials and methods

IOTC–2015–WPEB11–43 Rev_1
Page 5 of 18
The study consisted of 9 opportunistic fishing trips carried out between November and
December 2014 onboard local fishing vessels. Vessels were selected among voluntary
fishermen that accepted to embark acoustic equipment and a scientific observer (Fig.1).
Figure 1: Study area
The autonomous hydrophones (hermetic boxes + recorders) used was constructed by
Wildlife Acoustics Inc. Company. Boxes have positive buoyancy, weighing about 8 kg in
the air (with 32 batteries) and a length of 80 cm and can be used securely down to 120 m
depth. The SM2M recorders have high energetic autonomy (up to two months of
continuous recording). They were equipped with SD memory cards (4x32 or 1x128Go)
and a microphone “HTI-96-MIN” with a sensitivity of -165 dB re 1V / μPa. It able to record
includes a frequency range between 40 Hz and 48 kHz. For each cruise, three
hydrophones were attached at even intervals to cover the entire longline. The
hydrophones were fixed under a balloon buoy. The hydrophones were set at a depth of
25 m along a rope of 30 m long. This depth was chosen to limit the surface noises. The
attachment of hydrophones has evolved constantly to a simplified device to reduce noise.
Protection cover of the recorder and handles have been removed, ballast of 6kg to ensure
neutral buoyancy were separated. Likewise, the recording settings were adjusted (12dB
gain and high-pass filter at 180Hz). Autonomous hydrophones were programmed for
recording continuously between 12:00 UTC and 6:00 UTC. Recording rate was adjusted to
96 kHz; bandwidth was 0-48 kHz and the programmed recording time was 3 X 1 min.
Recording format was WACO type. In addition to acoustics data collection, supplementary
operational data were collected during cruises by scientific observer such as fishing
activity, catches, depredation events and other interactions. The acoustics data
processing was carried out automatically and manually by means of two analysis
methods. The first method relies on energy sounds analysis. For each campaign and each
recorder, sound reception was calculated for each third octave band values on duration
of a hydrophone signal of 21.8 seconds. This spectral decomposition allows inferring
typical sounds level trends such as grinding, shipping, environmental sounds, Ping, bump,
whistle and click. A 21.8 second analysis smooth out brief and intensive sound events
because the purpose of this study is to obtain trends on a fishing operation scale and to
estimate way to improve acoustic records quality towards modifications on hydrophone
deployment. To validate this method, a first visual and auditory analysis was carried out

IOTC–2015–WPEB11–43 Rev_1
Page 6 of 18
on one of three recorders data during the third cruise. The first three minutes on each 10
minutes time recording were systematically analysed, classified and compared with
curves of sounds level detection for each typical sound. Concordance between visual
results and energy sounds method allows detecting biological impulsive signals and
“whistle” signals. The second method is based on a real-time odontocete call detection
and classification algorithm. Bioacoustics signal treatment was realized with PAMguard
software. PAMguard was developed by the University of St. Andrews, Scotland. Software
detects whistles using spectrogram signal (FFT transformation) and differentiate from
background noise. Then, whistles are compared with a data stored in reference collection.
Detectors and classifiers are specific on dolphin signal encounters and are configured
according to environmental conditions of recording. In this study, PAMguard was set up
as an automatized detector of whistles and calibrated on 2.7 kHz to 30 kHz sound
detection. Detector doesn't work efficiently because of background noises. To validate
this method, a visual analysis was carried out on ten minute representative samples.
Species identification was realized using a real-time odontocete call classification
algorithm (ROCCA) available as a module in PAMguard. ROCCA measures 50 different
features from the extracted whistle contour, including duration, frequencies, slopes and
variable describing the shape of the whistle. ROCCA distinguishes 7 odontocete species
based on data collection from the East Pacific ocean: Globicephala macrorynchus,
Pseudorca crassidens, Stenella attenuata, Stenella longirostris, Steno brendanensis,
Delphinus sp., and Tursiops sp. All those species are theoretically present off Reunion
Island coasts and study area. ROCCA model was used manually, focusing on high
frequentation on odontocetes detected by PAMguard. Ten samples were thus classified.
The results of the classification were supported by bibliographical knowledge.
Results
To respond to “listening potentiality” objectives, installation of hydrophones on the
longline, their deployment and manipulation, were considered as successful. No damage
or loss was reported during the nine cruises with odontocete and shark presence around
listening devices. Thanks to an adjusted programming and high energy autonomy, data
were recorded along the nine cruises.
Weight and volume of hydrophones used was principal obstacle during manipulations
onboard fishing vessels and during deployment operations.. To respond to “listening
quality” objectives, we analysed the two automatic detection methods. Capacity of the
first method based on energy sounds analysis to estimate presence/absence of animal
patterns (impulsive signal and whistles) is globally optimized. It was confirmed by
spontaneous visual and auditory verification. Results are presented in table 1.
Environmental signal detected and others typical sounds recorded such as « ping » should
be further developed because falses alarms were constantly recognized. It was difficult to
differentiate environmental sounds from sound emitted by attachment system. This

IOTC–2015–WPEB11–43 Rev_1
Page 7 of 18
method doesn’t allow discriminating the two typical sounds. Concerning the second
method, quality of the whistle detector was validated manually. Overall, 2305 ten minute
time samples were identified and detected. 298 samples were checked visually, whether
12.9 % of total data collected. Periods of whistles time were well detected with 42.6% of
true positive. Detector is mid-quality with 15% of false negative opposite to 31% of false
positive. The software appears to overestimate presence of odontocetes, which can be
explained by the presence of background noises. Note that the capacity of the detection
is increasing on the sixth campaign with a better definition of presence/absence of
whistles. We also note that the capacity to detect absence depends on real number of
absence, which had not been the case on our study where the presence of odontocetes
was revealed in many campaigns. Generally, capacity of methods to detect presence/
absence was mid to high with an average of 58% of successful. (Table 2).
We note that the detector is more specific in its quantification of the number of whistles
from the campaign 6 due to a positive evolution of attachment and recording parameters.
During the study, recording parameters were optimized to environmental conditions. Two
parameters were changed (Gain and Filter during experimentation. All changes are
synthetized in the Table 3.

IOTC–2015–WPEB11–43 Rev_1
Page 8 of 18
Table 1: Spontaneous auditory and visual verification from the first detection method by curves of sounds level, by
typical sounds level trends, by campaign and by recorder.
Cruise Type of noise
Hydrophone BIO Hydrophone ENR-004 Hydrophone ENR-005
Présence / absence
Confirmée Non
confirmée Confirmée
Non confirmée
Confirmée Non
confirmée
Campagne01
Environmental 2 instants
Whistle 4 instants 2 instants
Click 6 instants 5 instants 6 instants
Campagne02
Whistle 3 instants
Ping 1 instant
Click 3 instants 2 instants
Campagne03
Whistle 30 % de la
donnée 2 instants
Click 30 % de la
donnée 3 instants 4 instants
Campagne04
Environmental 3 instants
Whistle 3 instants
Click 4 instants 5 instants 2 instants
Campagne05
Environmental 2 instants
Whistle 1 instant
(19:30:04) 2 instants
Clicks 1 instant
(19:30:04) 2 instants
Campagne06
Environmental 2 instants 2 instants
Whistle 2 instants
Click 2 instants 2 instants
Campagne07
Environmental 1 instant
(19:30:04)
Whistle 2 instants 6 instants
Clicks 6 instants 6 instants 4 instants
Campagne08 Clicks 6 instants 4 instants 2 instants 3 instants
Campagne09
Whistle 5 instants 2 instants 3 instants 3 instants
Clicks 5 instants 3 instants 5 instants 1 instant 3 instants 2 instants
IOTC–2015–WPEB11–43 Rev_1
Page 9 of 18
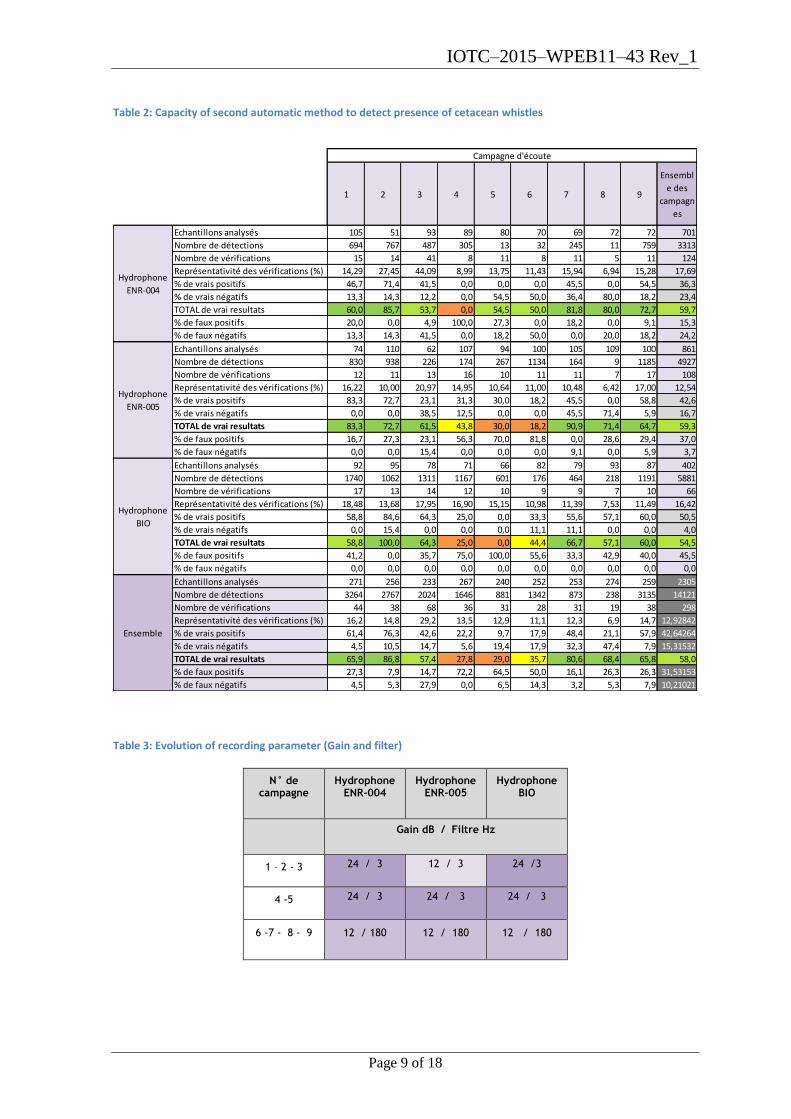
Table 2: Capacity of second automatic method to detect presence of cetacean whistles
Table 3: Evolution of recording parameter (Gain and filter)
N° de campagne
Hydrophone ENR-004
Hydrophone ENR-005
Hydrophone BIO
Gain dB / Filtre Hz
1 – 2 - 3 24 / 3 12 / 3 24 /3
4 -5 24 / 3 24 / 3 24 / 3
6 -7 - 8 - 9 12 / 180 12 / 180 12 / 180
1 2 3 4 5 6 7 8 9
Ensembl
e des
campagn
es
Echantillons analysés 105 51 93 89 80 70 69 72 72 701
Nombre de détections 694 767 487 305 13 32 245 11 759 3313
Nombre de vérifications 15 14 41 8 11 8 11 5 11 124
Représentativité des vérifications (%) 14,29 27,45 44,09 8,99 13,75 11,43 15,94 6,94 15,28 17,69
% de vrais positifs 46,7 71,4 41,5 0,0 0,0 0,0 45,5 0,0 54,5 36,3
% de vrais négatifs 13,3 14,3 12,2 0,0 54,5 50,0 36,4 80,0 18,2 23,4
TOTAL de vrai resultats 60,0 85,7 53,7 0,0 54,5 50,0 81,8 80,0 72,7 59,7
% de faux positifs 20,0 0,0 4,9 100,0 27,3 0,0 18,2 0,0 9,1 15,3
% de faux négatifs 13,3 14,3 41,5 0,0 18,2 50,0 0,0 20,0 18,2 24,2
Echantillons analysés 74 110 62 107 94 100 105 109 100 861
Nombre de détections 830 938 226 174 267 1134 164 9 1185 4927
Nombre de vérifications 12 11 13 16 10 11 11 7 17 108
Représentativité des vérifications (%) 16,22 10,00 20,97 14,95 10,64 11,00 10,48 6,42 17,00 12,54
% de vrais positifs 83,3 72,7 23,1 31,3 30,0 18,2 45,5 0,0 58,8 42,6
% de vrais négatifs 0,0 0,0 38,5 12,5 0,0 0,0 45,5 71,4 5,9 16,7
TOTAL de vrai resultats 83,3 72,7 61,5 43,8 30,0 18,2 90,9 71,4 64,7 59,3
% de faux positifs 16,7 27,3 23,1 56,3 70,0 81,8 0,0 28,6 29,4 37,0
% de faux négatifs 0,0 0,0 15,4 0,0 0,0 0,0 9,1 0,0 5,9 3,7
Echantillons analysés 92 95 78 71 66 82 79 93 87 402
Nombre de détections 1740 1062 1311 1167 601 176 464 218 1191 5881
Nombre de vérifications 17 13 14 12 10 9 9 7 10 66
Représentativité des vérifications (%) 18,48 13,68 17,95 16,90 15,15 10,98 11,39 7,53 11,49 16,42
% de vrais positifs 58,8 84,6 64,3 25,0 0,0 33,3 55,6 57,1 60,0 50,5
% de vrais négatifs 0,0 15,4 0,0 0,0 0,0 11,1 11,1 0,0 0,0 4,0
TOTAL de vrai resultats 58,8 100,0 64,3 25,0 0,0 44,4 66,7 57,1 60,0 54,5
% de faux positifs 41,2 0,0 35,7 75,0 100,0 55,6 33,3 42,9 40,0 45,5
% de faux négatifs 0,0 0,0 0,0 0,0 0,0 0,0 0,0 0,0 0,0 0,0
Echantillons analysés 271 256 233 267 240 252 253 274 259 2305
Nombre de détections 3264 2767 2024 1646 881 1342 873 238 3135 14121
Nombre de vérifications 44 38 68 36 31 28 31 19 38 298
Représentativité des vérifications (%) 16,2 14,8 29,2 13,5 12,9 11,1 12,3 6,9 14,7 12,92842
% de vrais positifs 61,4 76,3 42,6 22,2 9,7 17,9 48,4 21,1 57,9 42,64264
% de vrais négatifs 4,5 10,5 14,7 5,6 19,4 17,9 32,3 47,4 7,9 15,31532
TOTAL de vrai resultats 65,9 86,8 57,4 27,8 29,0 35,7 80,6 68,4 65,8 58,0
% de faux positifs 27,3 7,9 14,7 72,2 64,5 50,0 16,1 26,3 26,3 31,53153
% de faux négatifs 4,5 5,3 27,9 0,0 6,5 14,3 3,2 5,3 7,9 10,21021
Campagne d'écoute
Hydrophone
ENR-004
Hydrophone
ENR-005
Hydrophone
BIO
Ensemble
IOTC–2015–WPEB11–43 Rev_1
Page 10 of 18
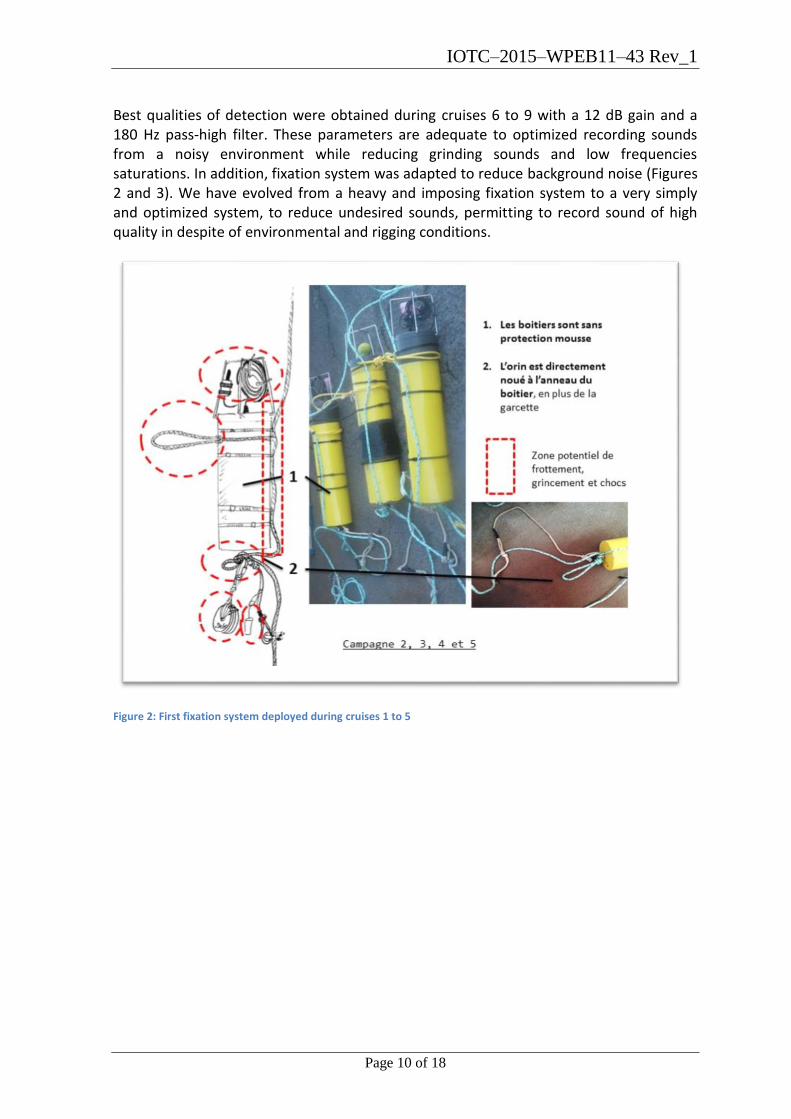
Best qualities of detection were obtained during cruises 6 to 9 with a 12 dB gain and a 180 Hz pass-high filter. These parameters are adequate to optimized recording sounds from a noisy environment while reducing grinding sounds and low frequencies saturations. In addition, fixation system was adapted to reduce background noise (Figures 2 and 3). We have evolved from a heavy and imposing fixation system to a very simply and optimized system, to reduce undesired sounds, permitting to record sound of high quality in despite of environmental and rigging conditions.
Figure 2: First fixation system deployed during cruises 1 to 5

IOTC–2015–WPEB11–43 Rev_1
Page 11 of 18
Figure 3 : Attachment optimization of system deployed during cruises 6 to 9
An estimation of the quantity of sound saturated was calculated by campaign and by recorder. (Table 4) Saturated sounds are principally due to bump sound detected on contact with hydrophone.
Table 4: Example of evolution of level environmental sound for the first hydrophone for each cruise
Campaign 1 2 3 4 5 6 7 8 9
Indicator
of
environm
ental
sounds

IOTC–2015–WPEB11–43 Rev_1
Page 12 of 18
1 2 3 4 5 6 7 8 90
5
10
15x 10
4
N° de Campagne
Nb
re to
tal d
e S
atu
ratio
n
BIO
ENR-004
ENR-005
With the modification of the hydrophone attachment and the configuration parameters, saturated sounds decrease in number along the cruises. In addition to modification, the
parameters recording (gain and filter) reduce significantly saturation. The late modifications seem to be adapted to this type of measure. Finally, synthesis of saturating sounds is presented at the Figure 4. Saturated sounds produced by bump sounds on the rigging are decreased along the campaigns.
To respond to “discriminative listening” objectives, we focused on dissociating abiotic sounds from biotic sounds corresponding to whistles and clicks. The evaluation of sound decibel level associates to whistles occurs in signal emission with frequency range 3550 to 11000
Hz. In many cruises, these types of signal were detected with late afternoon recording activity, but not necessarily continue during fishing operation.
More than 50% of the cruises, no whistle has been detected (cruises 3, 4, 5, 6, 8). The evaluation of sound decibel level associates to clicks occurs in signal emission with frequency range 18000 to 44500 Hz. important presence of impulsive biologic signal was detected in 5 cruises (1, 2, 3, 7 et 9), with maximum detection on cruise 2 (entire fishing operation). For the other fourth cruises, results are difficult to use (false alerts on cruises 6 and 8, noise from attachment on cruise 4 and 5). Presence of cetaceans was detected during all cruises. It takes place in two different ways: some short duration presence along longline or long stays. Most of the time marine mammals were detected by all three hydrophones. Presence/absence was evaluated, integrating all clicks and whistles
Figure 4: Evolution of the number of total saturated sounds recorded by campaign and by recorder
IOTC–2015–WPEB11–43 Rev_1
Page 13 of 18
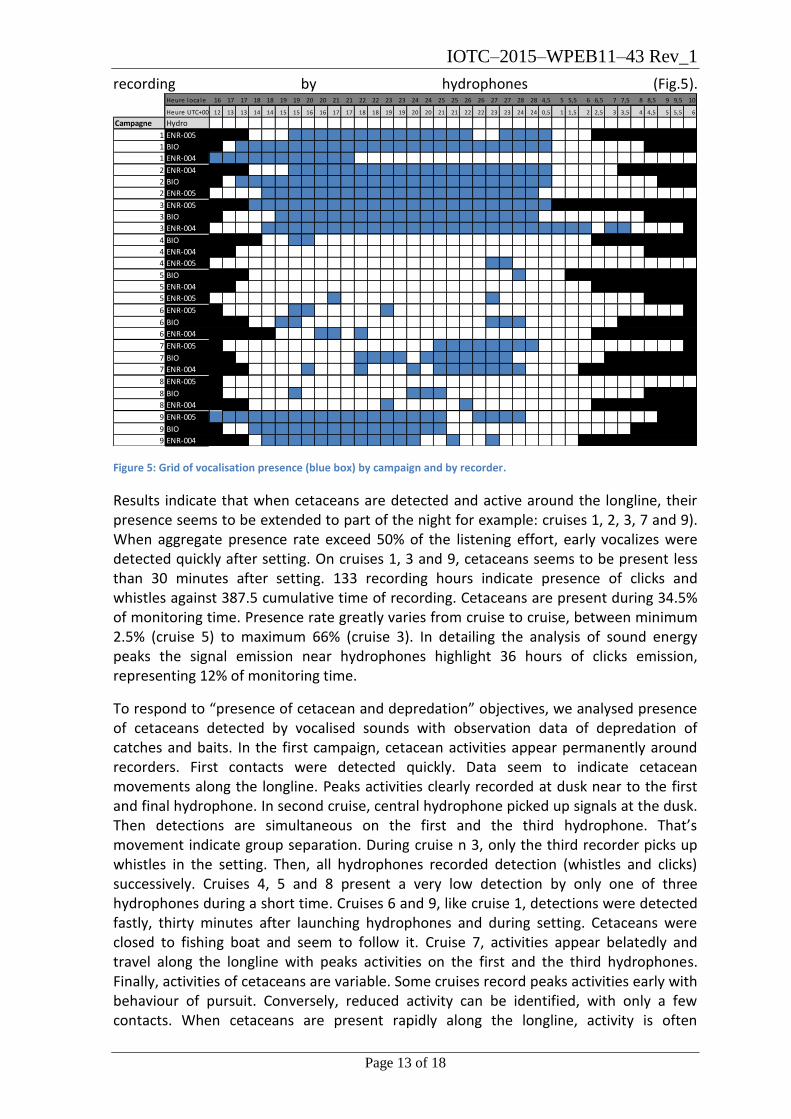
recording by hydrophones (Fig.5).
Figure 5: Grid of vocalisation presence (blue box) by campaign and by recorder.
Results indicate that when cetaceans are detected and active around the longline, their presence seems to be extended to part of the night for example: cruises 1, 2, 3, 7 and 9). When aggregate presence rate exceed 50% of the listening effort, early vocalizes were detected quickly after setting. On cruises 1, 3 and 9, cetaceans seems to be present less than 30 minutes after setting. 133 recording hours indicate presence of clicks and whistles against 387.5 cumulative time of recording. Cetaceans are present during 34.5% of monitoring time. Presence rate greatly varies from cruise to cruise, between minimum 2.5% (cruise 5) to maximum 66% (cruise 3). In detailing the analysis of sound energy peaks the signal emission near hydrophones highlight 36 hours of clicks emission, representing 12% of monitoring time.
To respond to “presence of cetacean and depredation” objectives, we analysed presence of cetaceans detected by vocalised sounds with observation data of depredation of catches and baits. In the first campaign, cetacean activities appear permanently around recorders. First contacts were detected quickly. Data seem to indicate cetacean movements along the longline. Peaks activities clearly recorded at dusk near to the first and final hydrophone. In second cruise, central hydrophone picked up signals at the dusk. Then detections are simultaneous on the first and the third hydrophone. That’s movement indicate group separation. During cruise n 3, only the third recorder picks up whistles in the setting. Then, all hydrophones recorded detection (whistles and clicks) successively. Cruises 4, 5 and 8 present a very low detection by only one of three hydrophones during a short time. Cruises 6 and 9, like cruise 1, detections were detected fastly, thirty minutes after launching hydrophones and during setting. Cetaceans were closed to fishing boat and seem to follow it. Cruise 7, activities appear belatedly and travel along the longline with peaks activities on the first and the third hydrophones. Finally, activities of cetaceans are variable. Some cruises record peaks activities early with behaviour of pursuit. Conversely, reduced activity can be identified, with only a few contacts. When cetaceans are present rapidly along the longline, activity is often
Heure loca le 16 17 17 18 18 19 19 20 20 21 21 22 22 23 23 24 24 25 25 26 26 27 27 28 28 4,5 5 5,5 6 6,5 7 7,5 8 8,5 9 9,5 10
Heure UTC+00 12 13 13 14 14 15 15 16 16 17 17 18 18 19 19 20 20 21 21 22 22 23 23 24 24 0,5 1 1,5 2 2,5 3 3,5 4 4,5 5 5,5 6
Campagne Hydro
1 ENR-005
1 BIO
1 ENR-004
2 ENR-004
2 BIO
2 ENR-005
3 ENR-005
3 BIO
3 ENR-004
4 BIO
4 ENR-004
4 ENR-005
5 BIO
5 ENR-004
5 ENR-005
6 ENR-005
6 BIO
6 ENR-004
7 ENR-005
7 BIO
7 ENR-004
8 ENR-005
8 BIO
8 ENR-004
9 ENR-005
9 BIO
9 ENR-004
IOTC–2015–WPEB11–43 Rev_1
Page 14 of 18
sustained and long lasting. Successive detection of vocalizations by the hydrophones indicates a movement along the longline (generally the first to the last hydrophone), ending with random movements. Some campaigns seem to indicate arrival through the center of the line with a separation of the group to prospect the entire longline. 5 species were detected by ROCCA method as Pseudorca crassidens (False killer whale), Globicephala macrorynchus (short-finned pilot whale), Steno brendanensis (rough-toothed dolphin), Delphinus capensis (long-beaked saddle-back dolphin) Stenella coreoleoalba (blue-white dolphin) and 1 species was detected by auditory verification: Peponocephala electra (melon-headed whale). We note that Grampus griseus (Risso’s dolphin) and Feresa attenuata (pygmy killer whale) are potentially present in the area but doesn’t include in ROCCA classification. Clicks are not considered in this identification analysis limiting identification species. Optimization in clicks analysis is expected to broaden the spectrum of species and the associated level of activity.
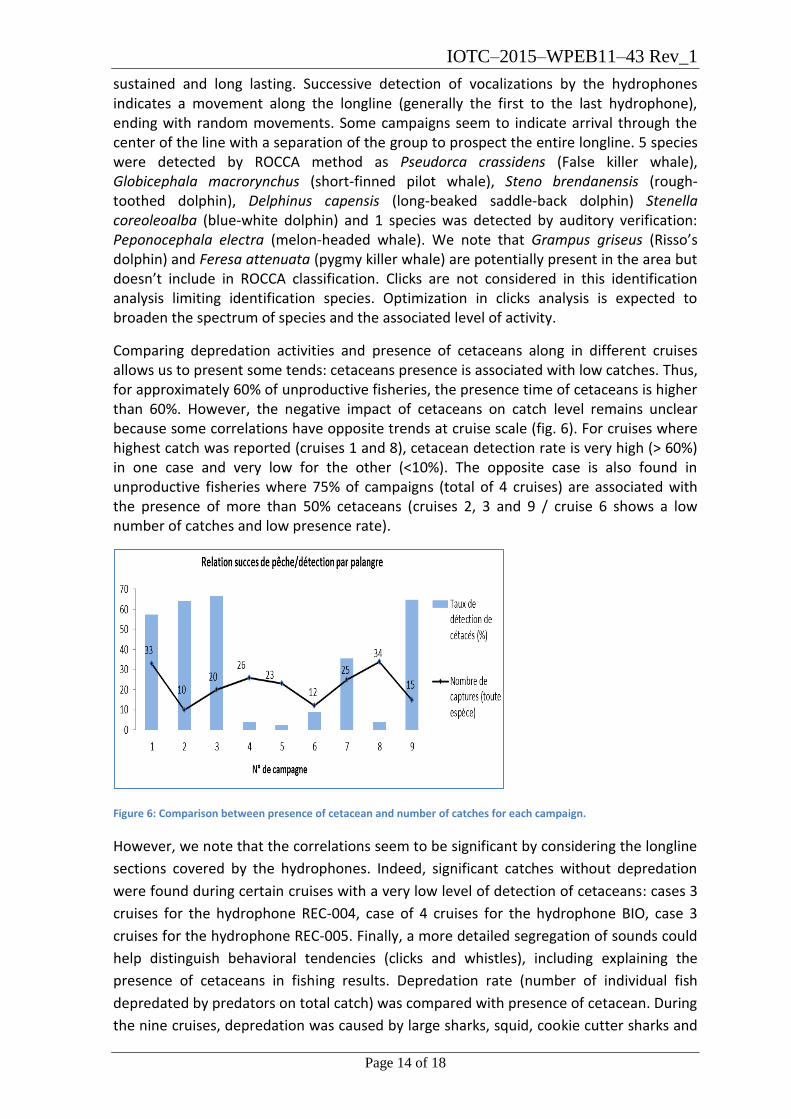
Comparing depredation activities and presence of cetaceans along in different cruises allows us to present some tends: cetaceans presence is associated with low catches. Thus, for approximately 60% of unproductive fisheries, the presence time of cetaceans is higher than 60%. However, the negative impact of cetaceans on catch level remains unclear because some correlations have opposite trends at cruise scale (fig. 6). For cruises where highest catch was reported (cruises 1 and 8), cetacean detection rate is very high (> 60%) in one case and very low for the other (<10%). The opposite case is also found in unproductive fisheries where 75% of campaigns (total of 4 cruises) are associated with the presence of more than 50% cetaceans (cruises 2, 3 and 9 / cruise 6 shows a low number of catches and low presence rate).
Figure 6: Comparison between presence of cetacean and number of catches for each campaign.
However, we note that the correlations seem to be significant by considering the longline
sections covered by the hydrophones. Indeed, significant catches without depredation
were found during certain cruises with a very low level of detection of cetaceans: cases 3
cruises for the hydrophone REC-004, case of 4 cruises for the hydrophone BIO, case 3
cruises for the hydrophone REC-005. Finally, a more detailed segregation of sounds could
help distinguish behavioral tendencies (clicks and whistles), including explaining the
presence of cetaceans in fishing results. Depredation rate (number of individual fish
depredated by predators on total catch) was compared with presence of cetacean. During
the nine cruises, depredation was caused by large sharks, squid, cookie cutter sharks and
IOTC–2015–WPEB11–43 Rev_1
Page 15 of 18
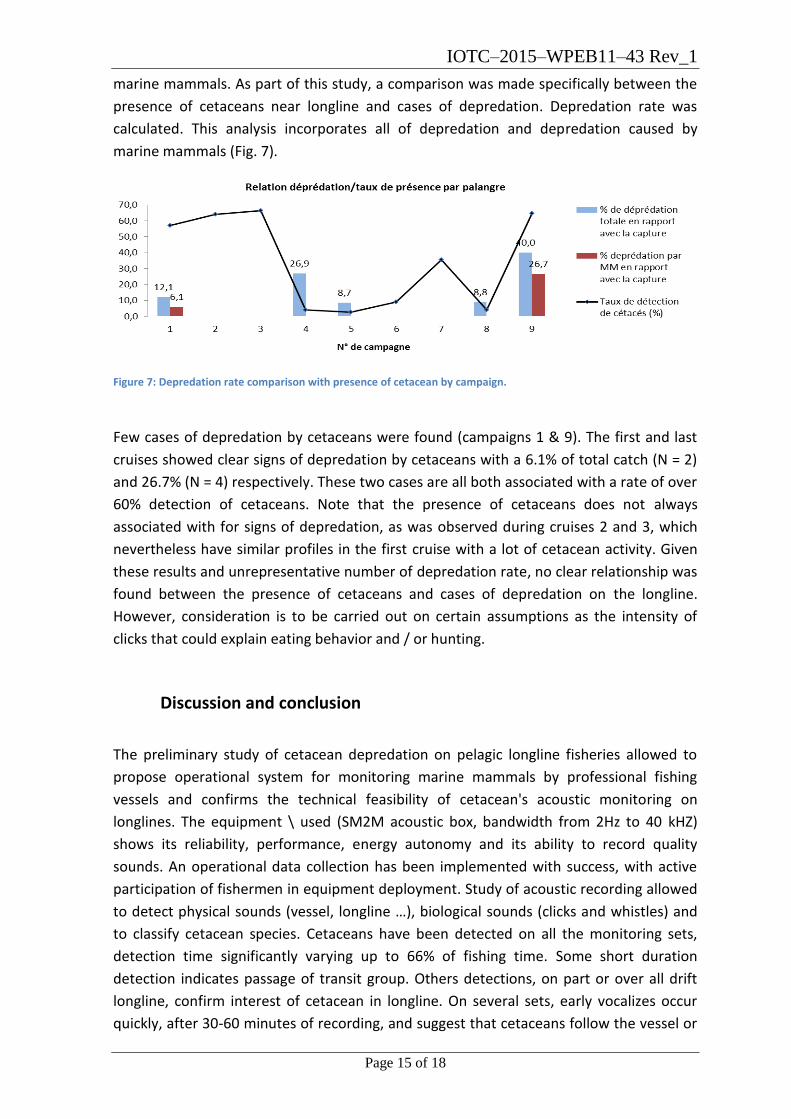
marine mammals. As part of this study, a comparison was made specifically between the
presence of cetaceans near longline and cases of depredation. Depredation rate was
calculated. This analysis incorporates all of depredation and depredation caused by
marine mammals (Fig. 7).
Figure 7: Depredation rate comparison with presence of cetacean by campaign.
Few cases of depredation by cetaceans were found (campaigns 1 & 9). The first and last
cruises showed clear signs of depredation by cetaceans with a 6.1% of total catch (N = 2)
and 26.7% (N = 4) respectively. These two cases are all both associated with a rate of over
60% detection of cetaceans. Note that the presence of cetaceans does not always
associated with for signs of depredation, as was observed during cruises 2 and 3, which
nevertheless have similar profiles in the first cruise with a lot of cetacean activity. Given
these results and unrepresentative number of depredation rate, no clear relationship was
found between the presence of cetaceans and cases of depredation on the longline.
However, consideration is to be carried out on certain assumptions as the intensity of
clicks that could explain eating behavior and / or hunting.
Discussion and conclusion
The preliminary study of cetacean depredation on pelagic longline fisheries allowed to
propose operational system for monitoring marine mammals by professional fishing
vessels and confirms the technical feasibility of cetacean's acoustic monitoring on
longlines. The equipment \ used (SM2M acoustic box, bandwidth from 2Hz to 40 kHZ)
shows its reliability, performance, energy autonomy and its ability to record quality
sounds. An operational data collection has been implemented with success, with active
participation of fishermen in equipment deployment. Study of acoustic recording allowed
to detect physical sounds (vessel, longline …), biological sounds (clicks and whistles) and
to classify cetacean species. Cetaceans have been detected on all the monitoring sets,
detection time significantly varying up to 66% of fishing time. Some short duration
detection indicates passage of transit group. Others detections, on part or over all drift
longline, confirm interest of cetacean in longline. On several sets, early vocalizes occur
quickly, after 30-60 minutes of recording, and suggest that cetaceans follow the vessel or
IOTC–2015–WPEB11–43 Rev_1
Page 16 of 18
locate the area on its approach. If study demonstrates efficiency of acoustic recording
methods, detection and classification of cetacean species, there is a need to deepen
relationship between fishing efficiency and cetacean occurrence. The sampling size is not
sufficient to develop the correlation between depredation and presence of cetaceans.
A large-scale study must be done to have a sufficient size sampling, to demonstrate link
between cetaceans presence and depredation on baits or catches. In addition to the
results, the study highlights technical difficulties of instrumentation at sea. It encourages
a longer study to be done to obtain a relevant data sampling to develop simple trends
into significant results.
IOTC–2015–WPEB11–43 Rev_1
Page 17 of 18
References
Amundin M. (1998). Sound production and hearing in marine animals[Abstract]. Bioacoustics 9(3): 213-214
Bargain, R.-M., (2000). Trends in the Seychelles tuna fishery. In: Ardill, D. (ed.),
Proceedings of the Expert Consultation on Indian Ocean Tunas, 7th Session. IOTC, Victoria, Seychelles, 9-14 November, 1998. IOTC Proceedings No. 1, IOTC/SP/00/01, pp. 65-75.
Bargain, R.-M., (2001). Trends in the Seychelles semi-industrial longline fishery.
IOTC Proceedings No. 4 (2001) WPB01-04. pp. 110-119.
Bourjea, J., Evano, H., and Le Ru, L. (2009). Up-date of the La Réunion longline and coastal fisheries data with special focus on billfishes. Paper presented at the IOTC Working Party on Billfish (WPB). Technical Report IOTC-2009-WPB-07, Victoria, Mahé, Seychelles.
Coon, R.A., Simonton, C.E., Bowers, F., Trapp, J.L., (1996). Migratory bird depredation
permits issued to southeast aquaculture facilities. Proceedings of the Annual Conference of the Southeastern Association of Fish and Wildlife Agencies, 287-293.
de Stephanis R. (2004). Interactions between killer whales and the bluefin tuna fishery in
the Strait of Gibraltar. FINS, the Newsletter of ACCOBAMS 1, 6-7 (available at http://www.accobams.org/newsletter/index.htm).
Donoghue, M., Reeves, R.R., Stone, G.S., (2003) (Eds.). Report of the workshop on interactions between cetaceans and longline fisheries, Apia, Samoa: November 2002. New England Aquarium Aquatic Forum Series Report 03-1. 45 p.
Fenech AS, Lochmann SE, Radomski AA, (2004). Seasonal Diets of Male and Female
Double-crested Cormorants from an Oxbow Lake in Arkansas, USA. Waterbirds 27:170–176.
Gilman, E., Brothers, N., McPherson, G., Dalzell, P., (2006). A review of cetacean
interactions with longline gear. J. Cetacean Res. Manage. 8, 215–223. Gilman, E., Clarke, S., Brothers, N., Alfaro-Shigueto, J., Mandelman, J., Mangel, J.,
Petersen, S., Piovano, S., Thomson, N., Dalzell, P., Donoso, M., Goren, M., and Werner, T. (2007). Shark Depredation and Unwanted Bycatch in Pelagic Longline Fisheries: Industry Practices and Attitudes, and Shark Avoidance Strategies. Western Pacific Regional Fishery Management Council, Honolulu, USA.
Gilman, E., Clarke, S., Brothers, N., Alfaro-Shigueto, J., Mandelman, J., Mangel, J.,
Petersen, S., Piovano, S., Thomson, N., Dalzell, P., et al., (2008). Shark interactions in pelagic longline fisheries. Mar. Policy 32, 1–18.
IOTC–2015–WPEB11–43 Rev_1
Page 18 of 18
Glahn JF, Reinhold DS, Smith P, (1999). Wading bird depredations on channel catfish Ictalurus punctatus in Northwest Mississippi. Journal of the World Aquaculture Society 30:107-114.
Gulland JA, (1986). Marine mammal: fisheries interactions. Ambio. 15:152-154.
IOTC, (1999). Report of the Third Session of the Indian Ocean Tuna Commission. Mahé, Seychelles, 9-12 December 1998. IOTC/S/03/98/R[E]. Victoria, IOTC. 44 pp.
IOTC, (2000a). IOTC. Report of the Fourth Session of the Indian Ocean Tuna Commission.
Kyoto, Japan, 13-16 December 1999. IOTC/S/04/99/R[E]. Victoria, IOTC. 56 pp. Kloskowski, J. (2005). Otter Lutra lutra damage at farmed fisheries in southeastern Poland, I: an interview survey. Wildlife Biology 11:201-206.
Kock. K.-H., Purves, M.G., Duhamel, G., (2006). Interactions between cetacean and fisheries in the Southern Ocean. Polar Biol., 29, pp. 379-388.
Navarro, M.O., Bearzi, M., (2007). Effects of marine mammals on the sport fishery in
Santa Monica Bay, California. Bulletin of the Southern California Academy of Science. 106:215-217.
Nishida, T., Tanio, M., (2001). Summary of the predation surveys for the tuna longline
catch in the Indian and the Pacific Ocean based on the Japanese investigation cruises (1954, 1958 and 1966-81). IOTC Proceedings, No 4: 442-460. WPTT-01-17.
Rabearisoa, N., Bach, P., Tixier, P., and Guinet, C. (2012). Pelagic longline _shing trials to
shape a mitigation device of the depredation by toothed whales. Journal of Experimental Marine Biology and Ecology, 432- 433:55{63.
Read, A. J. (2008). The looming crisis: interactions between marine mammals and
fisheries. Journal of Mammalogy, 89(3):541{548. Read AJ, Waples DM, Urian KW, Swanner D (2003). Fine-scale behaviour of bottlenose
dolphins around gillnets. Proceedings of the Royal Society B 270:90-92. Romanov EV, Sabarros PS; Le Foulgoc L, Richard E, Lamoureux J-P, Rabearisoa N, Bach P,
2013. Assessment of depredation level in Reunion Island pelagic longline fishery based on information from self-reporting data collection programme. IOTC Working Party on Ecosystems and Bycatch (WPEB), Reunion Island, 12-16 September 2013. IOTC-2013-WPEB09-47. 21 p.
Stickley, A.R. Jr., Warrick, G.L., Glahn, J.F., (1992). Impact of double-crested cormorant
depredations on channel catfish farms. Journal of the World Aquaculture Society 23:192-198.
Yano K, Dahlheim ME (1995). Killer whale, Orcinus orca, depredation on longline catches
of bottomfish in the southeastern Bering Sea and adjacent waters. Fishery Bulletin 93:355–372.

![IOTC-2015-CoC12-07[F] CONCERNANT LA LISTE CTOI DE …€¦ · IOTC-2015-CoC12-07[F] _____ Douzième session du CdA, Busan, République de Corée, 20-22 avril 2015 IOTC-2015-CoC12-07[F]](https://img.pdfslide.net/doc/110x75/5f956270bbbe6a4e8916fdd8/iotc-2015-coc12-07f-concernant-la-liste-ctoi-de-iotc-2015-coc12-07f-douzime.jpg)


![IOTC-2021-CoC18-CR21 [E/F] IOTC Compliance Report for](https://img.pdfslide.net/doc/110x75/62a7be2f9c8c834c435cf593/iotc-2021-coc18-cr21-ef-iotc-compliance-report-for-.jpg)


![IOTC-2014-CoC11-IR09[E] Received: 02 May, 2014](https://img.pdfslide.net/doc/110x75/61bd505261276e740b118ab8/iotc-2014-coc11-ir09e-received-02-may-2014.jpg)
![IOTC-2010-S14-CoC17-Add1[E] -FLEET DEVELOPMENT PLANS](https://img.pdfslide.net/doc/110x75/6256a751b3b41667710c2012/iotc-2010-s14-coc17-add1e-fleet-development-plans.jpg)
![IOTC-2019-S23-PropC[E] PROPOSAL ON ESTABLISHING A](https://img.pdfslide.net/doc/110x75/61eb4489da85421c764a71bd/iotc-2019-s23-propce-proposal-on-establishing-a-.jpg)


![IOTC-2013-CoC10-09[E] - Summary report on Compliance](https://img.pdfslide.net/doc/110x75/61c1040e8e517a15db6ce0a1/iotc-2013-coc10-09e-summary-report-on-compliance-.jpg)