Embed Size (px)
Citation preview
21 December, 2009
Administration Guide
IPS Event Analysis
R70.20
More Information
The latest version of this document is at: http://supportcontent.checkpoint.com/documentation_download?ID=10506
For additional technical information about Check Point visit Check Point Support Center (http://support.checkpoint.com).
Feedback
Check Point is engaged in a continuous effort to improve its documentation. Please help us by sending your comments to us (mailto:[email protected]?subject=Feedback on IPS Event Analysis R70.20 Administration Guide).
© 2009 Check Point Software Technologies Ltd.
All rights reserved. This product and related documentation are protected by copyright and distributed under licensing restricting their use, copying, distribution, and decompilation. No part of this product or related documentation may be reproduced in any form or by any means without prior written authorization of Check Point. While every precaution has been taken in the preparation of this book, Check Point assumes no responsibility for errors or omissions. This publication and features described herein are subject to change without notice.
RESTRICTED RIGHTS LEGEND:
Use, duplication, or disclosure by the government is subject to restrictions as set forth in subparagraph (c)(1)(ii) of the Rights in Technical Data and Computer Software clause at DFARS 252.227-7013 and FAR 52.227-19.
TRADEMARKS:
Please refer to our Copyright page (http://www.checkpoint.com/copyright.html) for a list of our trademarks.
Please refer to our Third Party copyright notices (http://www.checkpoint.com/3rd_party_copyright.html) for a list of relevant copyrights.
Contents
Introducing IPS Event Analysis .............................................................................. 5 The Check Point Solution — IPS Event Analysis .................................................. 5
Scalable, Distributed Architecture ..................................................................... 5 Easy Deployment .............................................................................................. 5 Event Investigation Tracking ............................................................................. 6
IPS Event Analysis Architecture ............................................................................ 6 Data Analysis and Event Identification .............................................................. 7 Interoperability with Security Management ....................................................... 7 IPS Event Analysis Client .................................................................................. 7
Basic Concepts and Terminology .......................................................................... 8 Initial Configuration ................................................................................................. 9
Check Point Licenses ............................................................................................ 9 Initial Configuration of the IPS Event Analysis Client .......................................... 10
Define the Internal Network for IPS Event Analysis ........................................ 10 Defining Correlation Units and Log Servers for IPS Event Analysis ............... 10
Enabling Connectivity with Provider-1 ................................................................. 10 Installing the Network Objects in the IPS Event Analysis Database ............... 11 Configuring IPS Event Analysis to work with Provider-1 ................................. 11
Analyzing Events.................................................................................................... 12 Event Queries ...................................................................................................... 12
Predefined Queries ......................................................................................... 12 Custom Queries .............................................................................................. 12
Event Query Results ............................................................................................ 14 Event Log ........................................................................................................ 15 Event Statistics Pane ...................................................................................... 18 Event Details ................................................................................................... 19
Presenting Event Data ......................................................................................... 19 Overview Tab .................................................................................................. 19 Timeline Tab ................................................................................................... 21 Charts Tab ...................................................................................................... 22 Maps Tab ........................................................................................................ 24
Administrator Permission Profiles - Events and Reports ..................................... 26 Provider-1 ....................................................................................................... 26
Investigating Events .............................................................................................. 27 Tracking Event Resolution using Tickets ............................................................. 27 Accessing IPS Protection Details ........................................................................ 27 Displaying an Event's Original Log Information ................................................... 27 Using Custom Commands ................................................................................... 28
System Administration .......................................................................................... 29 Adding Exclusions ............................................................................................... 29 Modifying the System's General Settings ............................................................ 30
Adding Network and Host Objects .................................................................. 30 Defining Correlation Units and Log Servers .................................................... 30 Defining the Internal Network .......................................................................... 31 Offline Log Files .............................................................................................. 31 Configuring Custom Commands ..................................................................... 32 Creating an External Script ............................................................................. 32
Managing the Event Database ............................................................................ 33 Backup and Restore of the Database ............................................................. 33 Adjusting the Database Size ........................................................................... 34
Dynamic Updates ................................................................................................ 34

Perform a Dynamic Update ............................................................................. 34 View Updated Events ...................................................................................... 35 Revert the Dynamic Update to a Previous Version ......................................... 35
Administrator Permissions Profile - Policy ........................................................... 35 Provider-1 ....................................................................................................... 36
Index ........................................................................................................................ 37

Page 5
Chapter 1
Introducing IPS Event Analysis Today's complex multi layered security architecture consists of many devices to ensure that servers, hosts, and applications running on the network are protected from harmful activity. These devices all generate voluminous logs that are difficult and time-consuming to interpret. In a typical enterprise, an intrusion detection system can produce more than 500,000 messages per day and firewalls can generate millions of log records a day. In addition, the logged data may contain information that appears to reflect normal activity when viewed on its own, but reveal evidence of abnormal events, attacks, viruses, or worms when raw data is correlated and analyzed.
Enterprises need control over and practical value from the deluge of data generated by network and security devices.
In This Chapter
The Check Point Solution — IPS Event Analysis 5
IPS Event Analysis Architecture 6
Basic Concepts and Terminology 8
The Check Point Solution — IPS Event Analysis
IPS Event Analysis provides all of the tools necessary for translating your IPS logs into a complete picture of your security state - automatically prioritizing security events for decisive, intelligent action. By automating the aggregation and correlation of raw log data, IPS Event Analysis not only minimizes the amount of data that needs to be reviewed but also isolates and prioritizes the real security threats. These threats may not have been otherwise detected when viewed in isolation, but pattern anomalies appear when data is correlated over time.
With IPS Event Analysis, you no longer need to comb through the massive amount of data generated by IPS devices in their environment. Instead, you can focus on understanding the impact on your business and concentrate on mitigating the threats that pose the greatest risk to their business.
Scalable, Distributed Architecture IPS Event Analysis delivers a flexible, scalable platform capable of managing millions of logs per day per correlation unit in large enterprise networks. Through its distributed architecture, IPS Event Analysis can be installed on a single server but has the flexibility to spread processing load across multiple correlation units and reduce network load.
Easy Deployment IPS Event Analysis is preconfigured for tight integration with the Security Management server architecture, allowing it to interface with existing Security Management log servers and eliminating the need to configure each device log server separately for log collection and analysis. In addition, all objects defined in the Security Management server are automatically accessed and used by the IPS Event Analysis server for event correlation. An enterprise can easily install and have IPS Event Analysis detecting threats in a matter of hours.
Chapter 1 Introducing IPS Event Analysis Page 6
Event Investigation Tracking IPS Event Analysis enables administrators to investigate threats using flexible data queries which are presented in timelines or charts. Once suspect traffic is identified, actions taken to resolve the threats are tracked using work tickets, allowing you to keep a record of progress made using statuses and comments.
In addition, daily or weekly events reports can be distributed automatically for incident management and decision support.
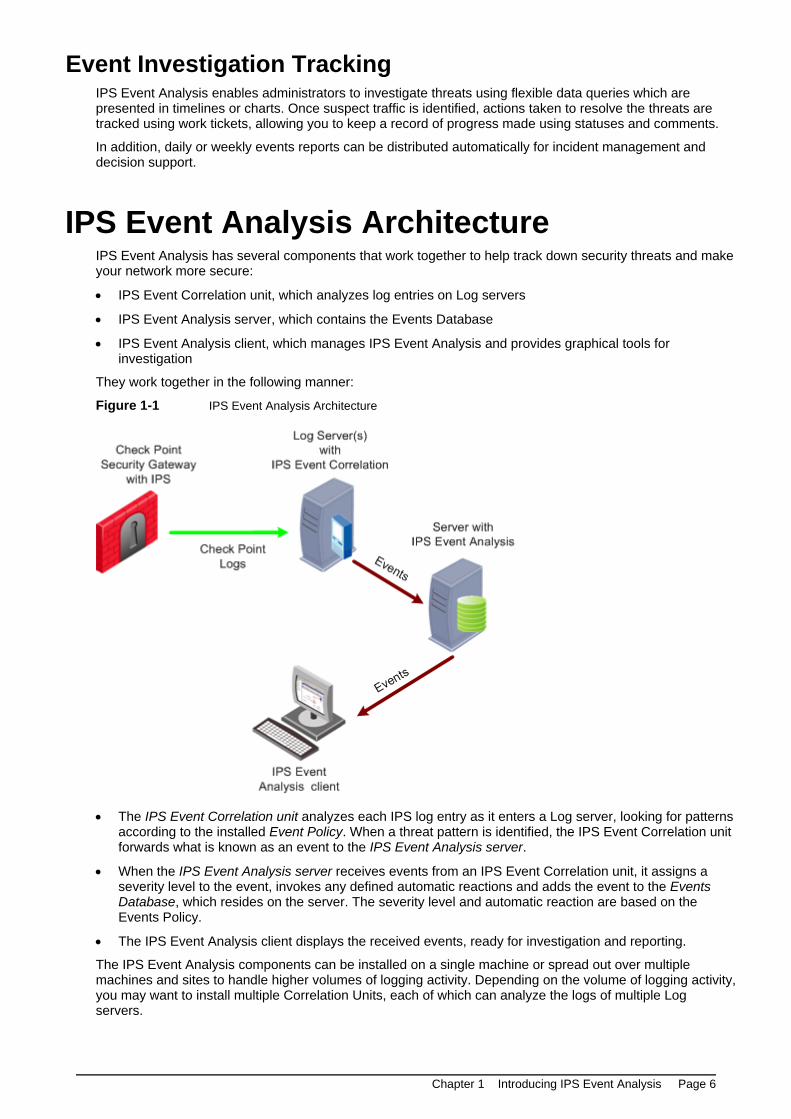
IPS Event Analysis Architecture IPS Event Analysis has several components that work together to help track down security threats and make your network more secure:
IPS Event Correlation unit, which analyzes log entries on Log servers
IPS Event Analysis server, which contains the Events Database
IPS Event Analysis client, which manages IPS Event Analysis and provides graphical tools for investigation
They work together in the following manner:
Figure 1-1 IPS Event Analysis Architecture
The IPS Event Correlation unit analyzes each IPS log entry as it enters a Log server, looking for patterns
according to the installed Event Policy. When a threat pattern is identified, the IPS Event Correlation unit forwards what is known as an event to the IPS Event Analysis server.
When the IPS Event Analysis server receives events from an IPS Event Correlation unit, it assigns a severity level to the event, invokes any defined automatic reactions and adds the event to the Events Database, which resides on the server. The severity level and automatic reaction are based on the Events Policy.
The IPS Event Analysis client displays the received events, ready for investigation and reporting.
The IPS Event Analysis components can be installed on a single machine or spread out over multiple machines and sites to handle higher volumes of logging activity. Depending on the volume of logging activity, you may want to install multiple Correlation Units, each of which can analyze the logs of multiple Log servers.
Chapter 1 Introducing IPS Event Analysis Page 7
Data Analysis and Event Identification The Correlation Unit is responsible for analyzing the log entries and identifying events from them. When analyzing a log entry, the Correlation Unit does one of the following:
Marks log entries that by themselves are not events, but may be part of a larger pattern to be identified in the near future.
Takes a log entry that meets one of the criteria set in the Events Policy and generates an event.
Takes a log entry that is part of a group of items that depict a security event together. New log entries may be added to ongoing events.
Discards all log entries that do not meet event criteria.
Interoperability with Security Management IPS Event Analysis imports certain objects from the Security Management server without having to recreate the objects in the IPS Event Analysis client. Changes made to the objects on the Security Management server are reflected in the IPS Event Analysis client.
IPS Event Analysis Client The IPS Event Analysis client provides all of the tools necessary for configuring definitions which will recognize security-related issues in your network infrastructure. It also provides a wide variety of methods for you to view the resulting data, including timelines, reports and charts which allow you to drill down into the underlying data.
What can I do with the IPS Event Analysis client?
Real-time Monitoring - The IPS Event Analysis Overview presents all of the critical information that you need for ongoing monitoring of security events and security updates. This view can be displayed in a Network Operations Center to provide engineers with a clear understanding of the network's current status.
Event Investigation - The timelines, charts and events lists are all customizable to allow you to restructure the events data in a way that will assist you to accurately understand the security of your environment and drive your security decisions.
Resolution Tracking - Actions taken by administrators to investigate and resolve issues can be tracked in event tickets and comments.
Security Status Reporting - The event reports reveal the who is attacking your network, how they are attacking and where the attacks originate. These reports, either generated from default definitions or customized in Eventia Reporter, are a compelling way to present the organization's security status to management.
What tools are included in the IPS Event Analysis client?
The IPS Event Analysis client is divided into seven sections:
The Overview tab contains the latest information about top sources, top destinations and top events over time and differentiated by severity.
The Events tab is where you can review Events, either according to pre-configured queries or according to queries that you define.
The Policy tab contains the event definitions and other system configuration parameters.
The Reports tab displays the output of reports that are defined and generated from Eventia Reporter.
The Timeline tab is where you can investigate security issues using a ground-breaking, customizable view of the number of events that occur over a period of time and how serious they are.
The Charts tab is where you can investigate security issues using pie or bar charts which present event data over time or based on any other event characteristic.
The Maps tab is where you can view the source and destination countries for the event data on a map.

Chapter 1 Introducing IPS Event Analysis Page 8
Basic Concepts and Terminology Event Policy - the rules and behavior of IPS Event Analysis
Event - activity that is perceived as a threat and is classified as such by the Event Policy
Log Server - receives log messages from Check Point IPS
IPS Event Correlation - component that analyzes logs on Log servers and detects events
Event Database - stores all detected events
IPS Event Analysis Server - houses the Event Database, receives events from Correlation Units, and reacts to events as they occur
IPS Event Analysis Client - Graphic User Interface where the Event Policy is configured and events are displayed
Management Server - Security Management server or, in a Provider-1 environment, Customer Management Add-on (CMA)

Page 9
Chapter 2
Initial Configuration The Eventia Suite components require secure internal communication (SIC) with the Management server, either a Security Management server or a Provider-1 CMA (see "Enabling Connectivity with Provider-1" on page 10).
Once connectivity is established, install the Eventia Suite and perform the initial configuration.
In This Chapter
Check Point Licenses 9
Initial Configuration of the IPS Event Analysis Client 10
Enabling Connectivity with Provider-1 10
Check Point Licenses Check Point software is activated with a License Key. You can obtain this License Key by registering the Certificate Key that appears on the back of the software media pack, in the Check Point User Center.
The Certificate Key is used in order to receive a License Key for products that you are evaluating.
In order to purchase the required Check Point products, contact your reseller.
Check Point software that has not yet been purchased will work for a period of 15 days. You are required to go through the User Center in order to register this software.
1. Activate the Certificate Key shown on the back of the media pack via Check Point User Center (http://usercenter.checkpoint.com).
The Certificate Key activation process consists of:
Adding the Certificate Key
Activating the products
Choosing the type of license
Entering the software details
Once this process is complete, a License Key is created and made available to you.
2. Once you have a new License Key, you can start the installation and configuration process. During this process, you will be required to:
Read the End Users License Agreement and if you accept it, select Yes.
Import the license that you obtained from the User Center for the product that you are installing.
Licenses are imported via the Check Point Configuration Tool.
The License Keys tie the product license to the IP address of the IPS Event Analysis server. This means that:
Only one IP address is needed for all licenses.
All licenses are installed on the IPS Event Analysis server.
Correlation Units are licensed by the number of units that are attached to the IPS Event Analysis server.

Chapter 2 Initial Configuration Page 10
Initial Configuration of the IPS Event Analysis Client
The final stage of getting started with IPS Event Analysis is the initial configuration of the IPS Event Analysis clients. The IPS Event Analysis client is part of the Check Point SmartConsole.
Define the Internal Network and Correlation Units
Install the Event Policy
Events will begin to appear in the IPS Event Analysis client.
Define the Internal Network for IPS Event Analysis To help IPS Event Analysis determine whether events have originated internally or externally, the Internal Network must be defined. Certain network objects are copied from the Management server to the IPS Event Analysis server during the initial sync and updated afterwards periodically. Define the Internal Network from these objects.
To define the Internal Network, do the following:
1. Start the IPS Event Analysis client.
2. From the Policy view, select General Settings > Initial Settings > Internal Network.
3. Add internal objects.
Note - It is recommended to add all internal Network objects, and not Host objects.
Defining Correlation Units and Log Servers for IPS Event Analysis
1. From the Policy view of the IPS Event Analysis client, select General Settings > Initial Settings > Correlation Units.
2. Select Add.
3. Click the [...] symbol and select a Correlation Unit from the displayed window.
4. Select OK.
5. Click Add and select the Log servers available as data sources to the Correlation Unit from the displayed window.
6. Select Save.
7. From the Actions menu, select Install Events policy.
Once the Correlation Units and Log servers are defined, and the Events Policy installed, IPS Event Analysis will begin reading logs and detecting events.
To learn to manage and fine-tune the system through the IPS Event Analysis client, see IPS Event Analysis client.
Enabling Connectivity with Provider-1 In a Provider-1 environment, the IPS Event Analysis server can be configured to analyze the log information for any or all of the CMAs on the MDS. In order to do this, the IPS Event Analysis server's database must contain all of the network objects from each of the CMAs and then be configured to gather logs from the selected log servers.
Chapter 2 Initial Configuration Page 11
Installing the Network Objects in the IPS Event Analysis Database
1. From the Provider-1 MDG, open the Global SmartDashboard.
2. In the Global SmartDashboard, create a Host object for the IPS Event Analysis server.
3. Configure the object as an IPS Event Analysis server and Log server.
4. Save the Global Policy.
5. Close the Global SmartDashboard.
6. In the Provider-1 client, assign the Global Policy to the customers with which you will use IPS Event Analysis.
Configuring IPS Event Analysis to work with Provider-1 1. In the IPS Event Analysis client, select Policy > General Settings > Objects > Customers and add all
of the Customers with whom you will be working.
Objects will be synchronized from the CMAs – this may take some time.
2. Select Policy > General Settings > Objects > Network Objects, and add networks and hosts that are not defined in the CMAs.
3. Select Policy > General Settings > Initial Settings > Internal Network, and add the networks and hosts that are part of the Internal Network.
4. Select Policy > General Settings > Initial Settings > Correlation Units, click Add and select the Correlation Unit and its Log servers. For traffic logs, select the relevant CLM or MLM Log server; for audit logs, select the relevant CMA.
5. Install the Event Policy.

Page 12
Chapter 3
Analyzing Events The IPS Event Analysis client provides a wide variety of tools for reviewing security events and pinpointing the traffic which threatens your security environment. Using pre-defined and custom queries you can filter the events generated from the Log server's database to find events and event patterns that you can then use to improve the security of your network. Once you have found threats, you can identify characteristics of the traffic from events, raw logs or packet captures and use that information to change your Security Policy or IPS protection settings to prevent the threats from damaging your network.
IPS Event Analysis also includes an assortment of methods to graphically represent the event data for reviewing the bigger picture, drilling-down to the details, or presenting event data in an intuitive and informative display.
In This Chapter
Event Queries 12
Event Query Results 14
Presenting Event Data 19
Administrator Permission Profiles - Events and Reports 26
Event Queries Eventia Analyzer uses filtered event views, called queries, to allow you to precisely define the types of events you want to view. Located in the Queries Tree, these queries filter and organize event data for display in the Events, Charts and Maps tabs. Queries are defined by filter properties and charts properties. Filter properties allow you to define what type of events to display and how they should be organized. Charts properties allow you to define how the filtered event data should be displayed in chart form.
Predefined Queries IPS Event Analysis provides a thorough set of predefined queries, which are appropriate for many scenarios.
Queries are organized by combinations of event properties, for example:
IPS, which includes queries of IPS events
Direction, such as Incoming, Internal, and Outgoing
Direction is determined by the Internal Network (see "Defining the Internal Network" on page 31) settings.
IP, either the Source or Destination IP address
Ticketing, such as ticket State or Owner
Severity, such as Critical, High, and Medium
Custom Queries IPS Event Analysis offers the flexibility to define your own queries for investigating events. This provides you with the ability to create query definitions that return the events that interest you the most. Once you have defined custom queries, you can organize them into folders so that they are easy to find and use.
Your queries can then be used to:
Generate lists of events with specific characteristics in the Events tab

Chapter 3 Analyzing Events Page 13
Display event count and severity trends in the Timelines tab
Present event data in easy to read charts in the Charts tab
View events by source or destination country in the Maps tab
Creating Custom Queries
You can create a custom query from the Custom folder or from an existing query.
To create a custom query based on the default query:
In the Selector tree, right-click on the Custom folder, select New, and name the customized query.
To create a custom query based on an existing query:
1. Right-click on a query you want to use as the basis of your custom query and select Save As.
2. Provide a name for the new query.
You can save the query with the Time frame setting from the Events list by clicking More and selecting the Save time frame option.
3. Click Save.
Customizing Query Filters
To change the filter values of your custom query:
1. Right-click the new query and select Properties > Events Query Properties.
The Events Query Properties window appears.
Use Add and Remove to include the fields that you would like to use in the query. To help you find a specific field, enter text in Search Fields and the fields that contain that text will be highlighted in both lists.
Place check marks in the Show column for the fields you want to appear in the Event Log.
If desired, select fields and use Group and Ungroup to use those fields to group the results of the query.
If desired, select fields and use Up and Down to sort the order in which the fields will display in the Event Log.
1. To specify criteria for a filter, click on the a value in the Filter column. A filter relevant to the type of data in this field opens. Enter values for the filter and click OK.
2. If desired, select Prompt for and choose a filter from the drop-down list.
By enabling When running the query prompt for, the query presents a Filter window and prompts the user to add criteria to the selected filter. This makes the query more dynamic, enabling the user to specify values each time the query is run.
Note - The Time Frame and # of Events parameters of a custom query are only saved if Save As is selected and the user explicitly requests to Save Time Frame information.
3. Click OK.
Other settings that you can define for the query are:
Query Properties and Auto refresh every 60 seconds sets this query to automatically update the Event Log with the latest detected events every 60 seconds.
Run query on OK displays the results of the query in the Event Log when you finish setting the click OK.
Use existing value from the toolbar retrieves the number of events specified by Show up to # in the toolbar.
Return maximum of X events per query retrieves the specified number of events irrespective of the Show up to # in the toolbar.
To clear filter values from your custom query:
Right-click on the value in the Filter column. Select Clear Filter to change the current filter to the value Any, or select Clear All Filters to change all filters to the value Any.
Chapter 3 Analyzing Events Page 14
Customizing Query Charts
To change the way your custom query will display as a chart:
1. Right-click the new query and select Properties > Events Query Properties.
The Events Query Properties window appears.
2. Add fields to the column on the right side of the window to make them available in the Split-By menu on the chart. Selecting a field from the Split-By menu displays the event data divided according to the selected event characteristic.
3. In Show top, select the number of top values to show from the chosen Split-By field.
4. Select to display the query by default as a Pie chart or on a Time axis.
If you want to display on a Time axis using a pre-defined Time Resolution, choose the Time Resolution you want.
Organizing Queries in Folders
You can create custom folders to organize your custom queries, as well as subfolders nested within folders.
To create a custom folder:
1. Right-click on Custom (or any other custom folder you have created previously) and select New Folder.
2. Name the folder.
When you create a new query, you can save it to this new folder by selecting it before selecting Save in the Save to Tree window.
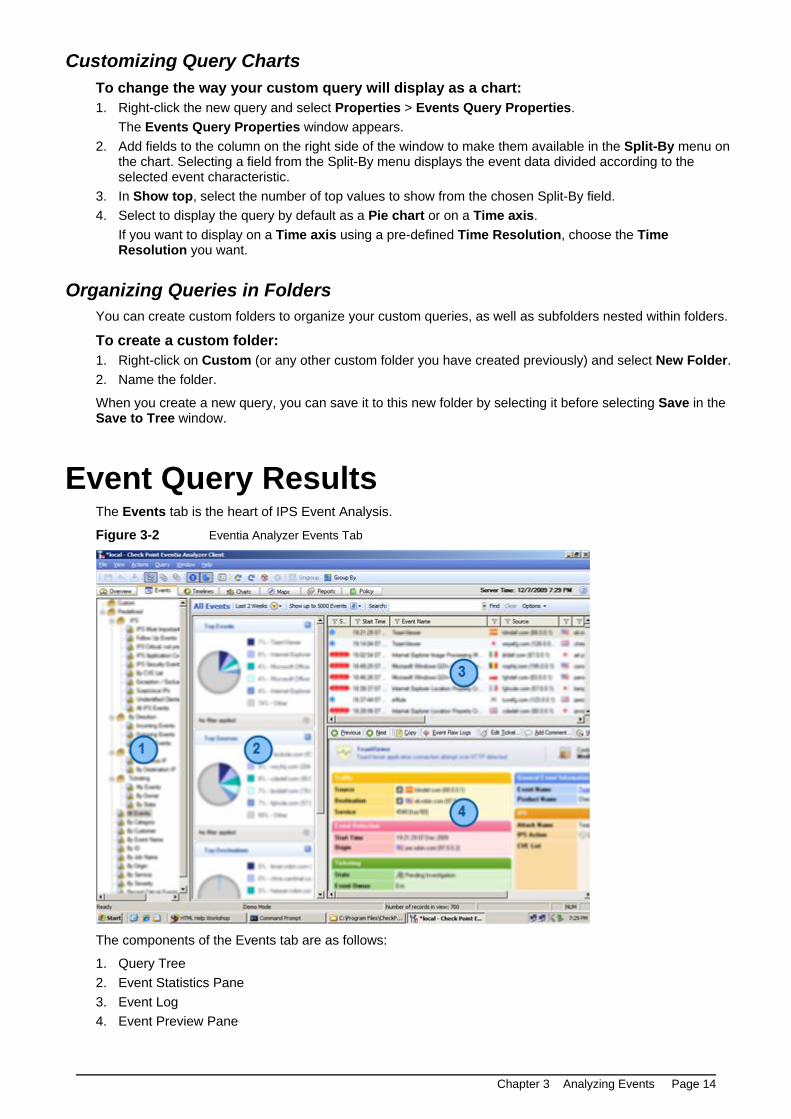
Event Query Results The Events tab is the heart of IPS Event Analysis.
Figure 3-2 Eventia Analyzer Events Tab
The components of the Events tab are as follows:
1. Query Tree
2. Event Statistics Pane
3. Event Log
4. Event Preview Pane
Chapter 3 Analyzing Events Page 15
The primary focus of the Events tab is the Event Log which displays the events resulting from running a query. In addition, the Events tab contains the Query Tree, the Event Preview Pane and the Event Statistics Pane. Double-clicking on a query from the Query Tree runs the query and the results are presented in the Event Log. The top Events, Destinations, Sources and Users of the query results are displayed in the Event Statistics Pane, either as a chart or in a tallied list. The details of the selected event are displayed in the Event Preview Pane.
Event Log IPS Event Analysis's Event Log can display up to 30,000 events. The events displayed are the result of a query having been run on the Event Database. To run a different query, double-click on a query in the Selector tree. The Event Log will display the events that match the criteria of the query.
The Event Log is where detected events can be filtered, sorted, grouped, sent for review and exported to a file to allow you to understand your network security status. Event details, such as Start and End Time, Event Name and Severity, are displayed in a grid. In the Status bar at the bottom of the IPS Event Analysis client window, Number of records in view displays a count of new events. Refresh retrieves the data from the database according the active query's filter. AutoRefresh can be selected to continuously monitor for new events.
The details of an event provide important specifics about the event, including type of event, origin, service, and number of connections. You can access event details by double-clicking the event or by displaying the Event Preview Pane.
Queries are built with certain default settings that can be changed directly in the Events tab to provide more specific or more comprehensive results.
1. The Time Frame selection allows you to choose the period of time for which events should be displayed (default is 2 weeks).
2. The Show up to _ Events selection sets the number of events that should be displayed from the query (default is 1,000 events). Up to 30,000 events can be displayed and managed at one time.
3. The Group By selection is particularly useful here to quickly divide the data by specific criteria and immediately show the number of events per grouping.
Filtering Events
After running a query, you can further filter the event data by right-clicking any column and defining the filter parameters. This will temporarily include the filter in the active query and run the query again against the database to return the matching values.
A green filter icon at the top of a column indicates that a filter is applied to that field. You can then choose to save the new set of filters as a custom query by selecting Save from the File menu. Running the query again will discard the filters that have not been saved.
To use filters with query results:
To change the filter's criteria, right-click on a column header and select Edit Filter.
To remove events that have any specific field value, right-click on the value and select Filter out.
To include only events that have a specific field value, right-click on the value and select Follow.
To remove the extra conditions you have applied, right-click the filter and select Clear Filter.
Sorting and Searching Events
Running a query could return thousands of matching events. To help you organize the events that have already been returned by the query, you can sort them by clicking on any of the column headers.

Chapter 3 Analyzing Events Page 16
You can also look for events which have specific values by entering values in the Search field. Searching for multiple values, using commas to separate the values, will return the events that contain all of the search values, although the values can be in any of the event's fields. The search can be made case-sensitive or limited to visible columns by selecting those options from the Options menu to the right of the Search field.
Grouping Events
One of the most powerful ways to analyze event data is by grouping the data based on the specific columns using the Group By button on the toolbar. Here you can group the events by one or more columns and the Event Log shows the number of matching events in those groups, presented in descending order.
You can also specify the default grouping that a query should use by selecting marking fields as Grouped in the Events Query Properties ("Customizing Query Filters" on page 13) window.
To group events by one or more fields, perform one of the following:
1. Click on Group By in the toolbar and select the field to use for grouping events.
2. Click on Group By in the toolbar and select More Fields. Then in the Group By window select one or more field to use for grouping events.
3. Right-click on the column in the Event Log you want to use for grouping events and select Group By This Column.
Once you have already grouped by a column, you can add another column to use for grouping by right-clicking on the column in the Event Log you want to use for grouping events and select Add this Column to the Group.
To remove fields from the grouping, perform one of the following:
1. Click on Ungroup in the toolbar to remove all grouping.
2. Click on Group By in the toolbar and select More Fields. Then in the Group By window remove one or more field from grouping.
3. Right-click on the column in the Event Log you want to remove from the grouping and select Remove Column from Group.
Sending an Event
In some circumstances, event information can be used to show evidence of a security attack or vulnerability that needs to be resolved. For example, you may decide that another member of your security team should review an event as evidence of an attack. Also, reporting events to Check Point can help Check Point improve the IPS technology to detect new threats in an ever-changing security environment. From the Event Log, you can choose to send event details as an email using your default email client, or you can choose to send the event details to Check Point over a secure SSL connection.
Chapter 3 Analyzing Events Page 17
To send an event using email:
1. Select the event in the Event Log.
2. Right-click on the event and select Send event by Email.
A new email opens using your default email client and the event information is included in the body of the email.
To report an event to Check Point:
1. Select the event in the Event Log.
2. Right-click on the event, select Report Event to Check Point and choose whether you want to include just the Event Details or to also include the Packet Capture associated with the event.
Only the event information will be sent to Check Point over a secure SSL connection. The data is kept confidential and Check Point only uses the information to improve IPS.
Exporting Events to a File
The Event Log can contain thousands of events. You can export the events from the IPS Event Analysis client into a text file to allow you to review or manipulate the data using external applications, such as a spreadsheet or text editor.
You can export events from the Overview tab, Events tab or Events window. When exported, the list of events will be saved exactly as it appears in the Event Log, including the visible columns and any sorting, filtering or grouping that is applied to the events.
To export events to a comma-delimited (csv) file:
1. In the Overview tab, Events tab or Events window, organize the events as you would like them to be saved.
Hide/show columns to display the information you want to save.
Apply sorting, filtering and grouping to produce a list of events in the format you want.
2. From the File menu, select Export Events to csv File.
3. Name the file, navigate to the location where you want the file saved and click Save.
Checking Client Vulnerability
To maintain a high level of security, organizations must install the latest security patches on network computers. Many of the security patches are designed to prevent threats from exploiting known vulnerabilities. If you are consistent with implementing software patches, your network computers will not be vulnerable to some of the attacks that are identified by IPS Event Analysis. Eventia ClientInfo helps you determine whether an attack related to Microsoft software is likely to affect the target machine. If the target machine is patched, you can stop the events from being generated by choosing to exclude the target machine from the event definition or from the specific IPS protection.
Eventia ClientInfo connects to the computer whose IP address listed in the event. After you enter credentials with administrator privileges on the target computer, ClientInfo reads the list of Microsoft patches installed on the computer as well as other information about the installed hardware and software. ClientInfo also retrieves the Microsoft Knowledge Base article related to the vulnerability reported in the event and checks to see if the patches listed in the article are installed on the target computer. If ClientInfo finds that the matching patch is installed, it is likely that the attack will have no affect on the target computer and you can choose to create an exception so that IPS or IPS Event Analysis stops recognizing the attack as a threat.
Once the computer information is loaded in ClientInfo, you can perform the following functions:
Save the information in the active tab to a .csv file
Enter new credentials for accessing the computer information
Copy the contents of the selected cell
Run Google.com search using the contents of the selected cell
Search field Filter the contents of the active tab for rows containing the search text

Chapter 3 Analyzing Events Page 18
Filter the contents of the active tab for rows containing the KB number
Connect to the specified IP address to gather the computer's information
To check that a computer is not vulnerable to an attack:
1. In the Events tab, right-click on the event you want to investigate and select Eventia ClientInfo.
2. Enter user credentials that allow administrator privileges on the target computer or select Use Windows Logon Account to login with your current credentials. You can also save your credentials to avoid having to enter them again.
ClientInfo retrieves the software and hardware information from the target computer, as well as the details of the Knowledge Base article associated with the vulnerability identified in the event.
3. Check the result. ClientInfo returns one of the following results:
Installed fix / Computer is not vulnerable - In this instance, ClientInfo found that the patch recommended by Microsoft for protecting against the vulnerability is installed on the target computer.
Based on this, you can decide to modify the associated IPS protection or event definitions to prevent these events from displaying in the future.
Unfound fix / Derived fixes exist -In this instance, ClientInfo found that a patch is installed that is related to the Security Bulletin, but found that the main patch that is recommended by Microsoft for protecting against the vulnerability is not installed on the target computer. The installed fix may not cover all of the affected software.
Click on the KB numbers specified to open the associated Knowledge Base articles. Review the recommended remediation steps, which may include installing a patch on the target computer.
Missing Fix / Computer may be vulnerable - In this instance, ClientInfo found that the patch recommended by Microsoft for protecting against the vulnerability is not installed on the target computer.
Click on the KB number specified to open the associated Knowledge Base article. Review the recommended remediation steps, which may include installing a patch on the target computer.
Note - If ClientInfo finds that the patch in the KB article is not installed on the remote computer, it may indicate one of the following:
The vulnerability does not affect or is not relevant to the target computer’s Operating System OR Service Pack version. If so, the computer is not vulnerable.
The article is relatively old and you may have installed Service Pack that includes the patch for the vulnerability. If so, you should check the installed Service Pack to see if it was released after KB article and may include the associated patch.
Event Statistics Pane The Event Log is accompanied by charts displaying the Top Events, Top Sources, Top Destinations and Top Users for the active query. These statistics are automatically updated as filters are applied to the Event Log.
You can toggle between viewing the statistics as a chart or a list by clicking on the arrow in the top-right corner of each of the boxes and selecting Show Pie Chart.
You can filter in or out any value in the Event Statistics Pane to focus the query results on the data that is most important to you. Filtering in the Event Statistics Pane is also reflected in the Event Log, and clearing filters from the Event Statistics Pane clears all filters that have been applied to the query.
To remove events that have any specific field value, right-click on the value and select Filter out.
To include only events that have a specific field value, right-click on the value and select Follow.
To remove the extra conditions you have applied, click on the Clear Filter icon.

Chapter 3 Analyzing Events Page 19
Event Details The details of an event can be viewed from the Preview Pane in the Events tab or by double-clicking on the event in the Event Log. The Event Details window presents basic details of the selected event in a single, easy to read window, whereas clicking on the Show More link displays a more comprehensive set of information about the event. From the Event Details window you can also for track event investigation and respond to IPS activity (see "Investigating Events" on page 27).
The following options are available from the Event Details view:
Previous displays the event that appears before the current event in the Event Log.
Next displays the event that appears after the current event in the Event Log.
Copy copies the event's details to the Windows Clipboard.
Raw data launches SmartView Tracker and displays the log entries upon which the event is based.
Edit Ticket allows you to set the state of the event, assign an owner and add a comment.
Add Comment allows you to add a quick comment about the event without changing the state or owner.
View History allows you to view the ticket activity on the event, including changed to the state, owner or comments.
IPS menu present actions that are specific to IPS events. These actions include:
Go to Protection opens the SmartDashboard to the IPS protection which triggered the event.
Go to Advisory opens the Check Point Advisory article which provides background information about the IPS protection.
Protection description opens a detailed description of the IPS protection.
Presenting Event Data IPS Event Analysis provides a wide-variety of methods for graphically presenting event data so that you can find the events and the event patterns that are most important to maintaining a high level of security in your environment.
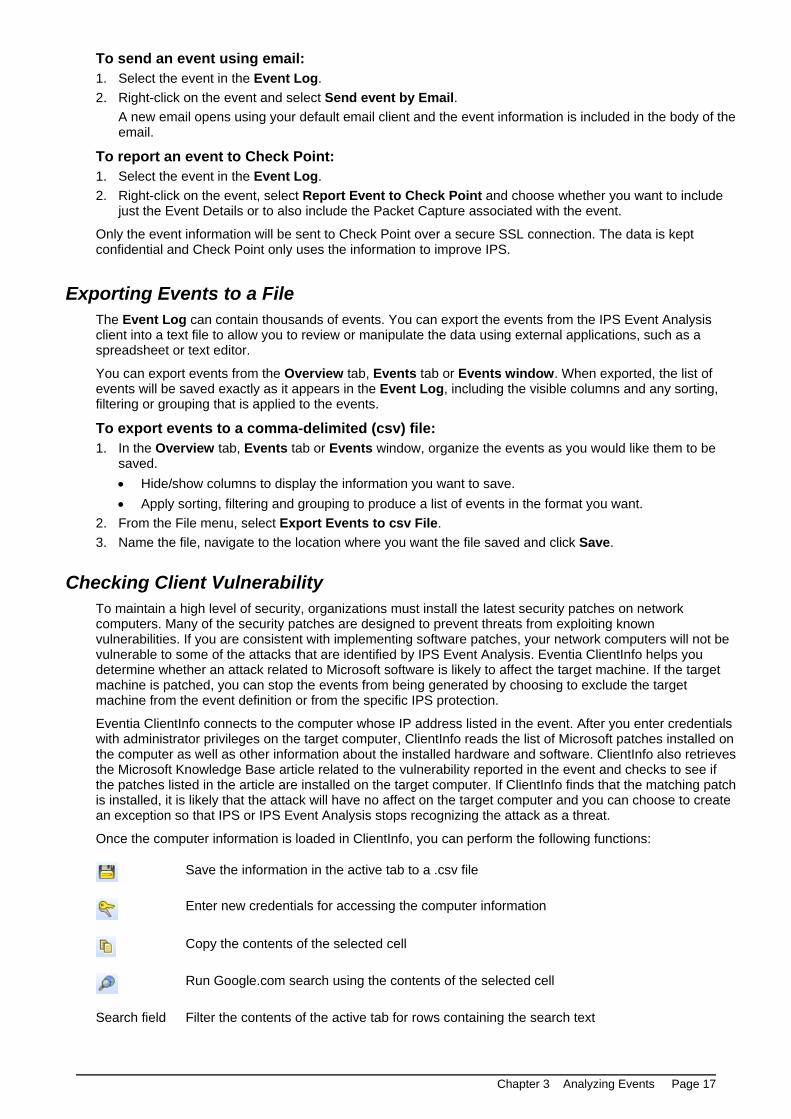
Overview Tab 2The IPS Event Analysis Overview tab combines the most critical information for monitoring security in your environment. Its main focus is presenting a quick view of the recent events data using the Timeline View, Recent Critical Events, and Top tables and chart. These interactive sections report on the events based on the Time Frame setting to allow you to display event data from a specific latest period of time.
The Time Frame defines the period of time for which events should be presented. Each query can have a time period defined as part of its Events Query Properties; however, when multiple queries or timelines are displayed on a page, the Time Frame is used to display data for all queries.
Chapter 3 Analyzing Events Page 20
Double-clicking on data in any of the sections in the Overview tab opens the associated list of events so that you can continue investigating issues all the way down to the individual event level.
Figure 3-3 Eventia Analyzer Overview Tab
The Overview tab sections include:
1. Timeline View - Timelines allow you to graphically view the most important queries of recent events grouped together according to a configured time interval. Each timeline displays up to one million events for a particular query over the specified Time Frame. The events are grouped into time wheels according to the selected Time Resolution. The colors in each time wheel represent the breakdown of events in that time period according to severity levels. You can add, modify or remove timelines from this view just as you would in the Timeline Tab (on page 21).
2. Recent Critical Events - This section lists the critical events that occurred in the specified Time Frame. You can search, sort, filter and group events using the same methods as in the Events tab ("Event Query Results" on page 14).
3. Security Center - When connected to the Internet, the Security Center displays a dynamic ticker tape of available protections against new vulnerabilities. The Open link of a Security Center item takes you to the Check Point Advisories.
4. Top Sources and Top Destinations - These tables display the top ten source and destination IP addresses for events based on the specified Time Frame. Double-clicking on an entry opens the Event Log with events matching the selected IP address.
5. Top Events - This pie chart displays the top event names based on the specified Time Frame. Double-clicking on an event name opens the Event Log with all events matching the selected event name.
6. Status - The Status section contains system information including:
Eventia Components
Status - This indicator reports the current status of the Event Analysis system, including problems connectivity to Correlation Units and Log servers and when the allocated disk space is full. Click on the link for more information.
Object Sync - This indicator reports on the synchronization of objects between the management servers (either Security Management or Provider-1 CMA) and the IPS Event Analysis server (see "Interoperability with Security Management" on page 7). Click on the link for more information.
Config - This indicator will appear if components are not configured, including Internal Network settings (see "Defining the Internal Network" on page 31) and Correlation Units. Click on the link for more information.
Events received in the - These statistics show the number of events received by the IPS Event Analysis server in the last minute, hour and 24-hour period. This information gives a quick glance at

Chapter 3 Analyzing Events Page 21
the traffic load on the IPS Event Analysis server. Unusual data in these fields may indicate connectivity problems between the components of the Event Analysis system.
Timeline Tab Timelines allow you to graphically view the most important queries of recent events grouped together according to a configured time interval. Each timeline displays up to one million events for a particular query over the specified Time Frame. The events are grouped into time wheels according to the selected Time Resolution. The colors in each time wheel represent the breakdown of events in that time period according to severity levels.
Figure 3-4 Eventia Analyzer Timeline Tab
You can either modify these timelines or add new timelines with pre-defined query definitions or your own. Timelines can also be removed, renamed and moved up or down in the view from the Manage menu.
To add a new timeline:
1. Select Manage > Add Line.
2. In the Add Line window, do one of the following:
a) Use a Predefined Query: Choose one of the queries that exists and click OK.
b) Modify a Predefined Query:
(i) Select an existing query and click Configure.
(ii) In the Events Query properties window, configure the query to filter for the events that you want to track and click OK.
(iii) Enter a name for the new custom query. You can choose to save the time frame for the query.
(iv) Click Save.
c) Create a new Custom Query:
(i) Click New to create a custom query which you can use for the new timeline.
(ii) In the Events Query properties window, configure the query to filter for the events that you want to track and click OK.
(iii) In the Add Line window, enter a name for the custom query.
3. In the Add Line window, click OK.
You can now see the configured timelines and you can modify the Time Frame and Time Line Resolution to help you analyze the event data.
Chapter 3 Analyzing Events Page 22
To modify an existing timeline:
1. Select a timeline and select Manage > Configure.
2. In the Events Query properties window, configure the query to filter for the events that you want to track.
3. Click OK.
The selected timeline now displays the event data based on the modified query.
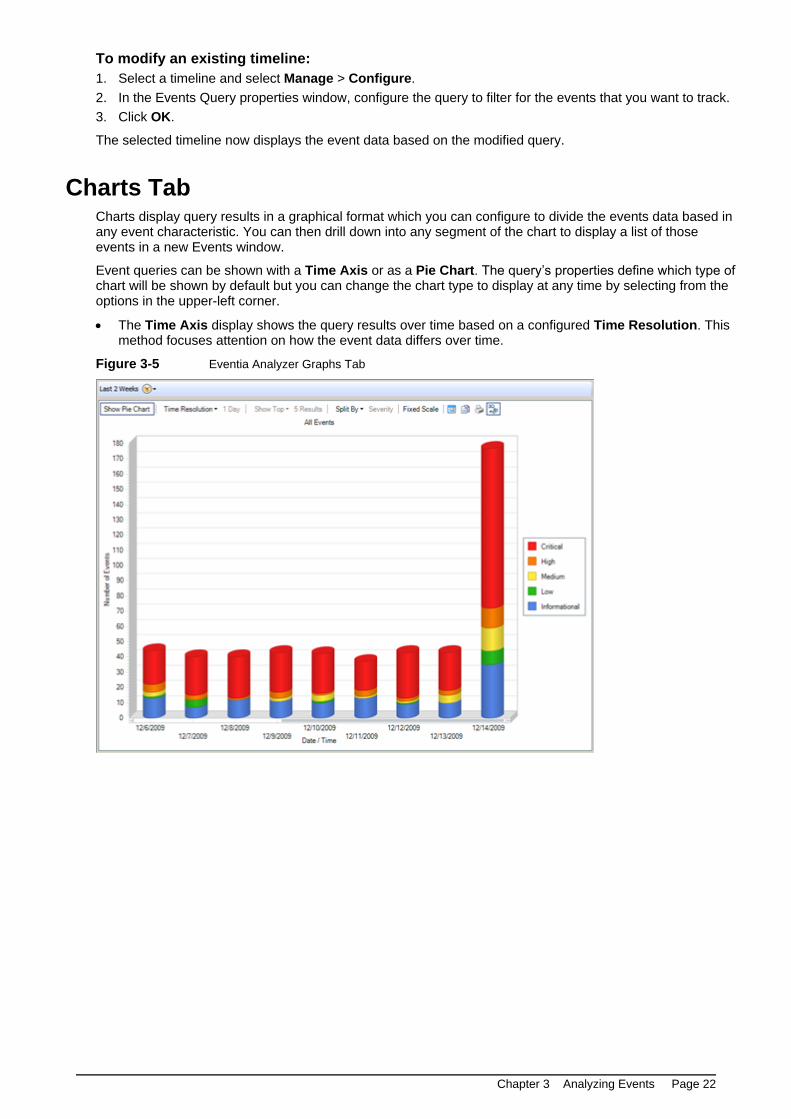
Charts Tab Charts display query results in a graphical format which you can configure to divide the events data based in any event characteristic. You can then drill down into any segment of the chart to display a list of those events in a new Events window.
Event queries can be shown with a Time Axis or as a Pie Chart. The query’s properties define which type of chart will be shown by default but you can change the chart type to display at any time by selecting from the options in the upper-left corner.
The Time Axis display shows the query results over time based on a configured Time Resolution. This method focuses attention on how the event data differs over time.
Figure 3-5 Eventia Analyzer Graphs Tab

Chapter 3 Analyzing Events Page 23
The Pie Chart is the best way to show Top N data such as By Source (top sources), By Destination (top destinations), and By Service (top services). This method focuses attention on the number of events with specific properties.
Figure 3-6 Eventia Analyzer Graphs Tab
Event Data Options
The following are settings that can be set from the Toolbar to change the event data that is displayed in the chart:
Time frame - Click on the Change time frame menu, to choose a specific time frame for which events are displayed. For example, you can choose to show only events during the last 24 hours, the last 30 days, or a custom time frame.
Time Resolution - This field determines how events are grouped in charts and timelines. For example, when the time frame is set to one hour, all events that match the query's filter properties and occurred within the period of one hour will be displayed together. The colors of the time wheel indicate the breakdown of events by category within the selected period of time.
Split By - This field determines which dimension will be used to analyze the events. In the query's Chart Properties, you can choose which dimensions to make available for displaying in the charts.
Show Top - This field determines how many of dimensions results will be displayed in the chart. In the query's Chart Properties, you can set the default number.
You can also set a particular chart to be displayed by default in the Charts tab by right-clicking on the query and selecting Run on Start.
Display Options
The following are options that can be changed from the Toolbar to present the chart data in a more informative and appealing manner:
Fixed Scale - By default, the scale of the number of events will change based on the results displayed in the chart. By selecting Fixed Scale, you can choose for the scale of the number of events to remain constant as you scroll through the chart.
Data Grid - You can choose to show a data grid next to the chart. The data grid provides a table which shows a summary of all of the data points in the query. When you move the cursor over any part of the chart or grid, the associated data will be highlighted in the other area.
Copying Data - Click on the Copy icon to access the options for copying the event statistics to your computer's Clipboard for external use. You can copy the image itself, or you can the copy raw event counts represented by the image that is currently displayed and then paste that data into another application.

Chapter 3 Analyzing Events Page 24
Copying the image - Click the As a Bitmap icon to copy the image that is currently displayed.
Copying the event count data - Click the As Text (data only) icon to copy the raw event counts represented by the image that is currently displayed.
Printing - Click on the Print icon to print the image that is currently displayed.
3D/2D Display - Click on the 3D/2D icon to choose whether to display the chart as flat (2D) or with depth (3D).
The following are elements of the chart display that can be changed by right-clicking on the chart to customize the presentation of the chart:
Toolbar - The Toolbar can be hidden, which is particularly useful before copying or printing a chart.
Legend Box - You can choose to show or hide the Legend Box. The Legend Box is a key which indicates what the colors of the chart represent. Change the location and font of the Legend Box by right-clicking on it.
Background Color - You can select a background color for the chart.
You can modify the display options for the data grid, legend box, axis labels or axis scales. Right-clicking any of the elements allows you to change the font, text color, display location and other graphical options.
To view a chart:
1. Run a query by double-clicking the query in the Query Tree.
You can also open your chart in a new window by right-clicking the query and selecting Run in New Window. This allows you to keep multiple charts open at the same time.
2. Decide whether you want the chart to be based on time (Time Axis) or based on other event properties (Pie Chart).
When using Time Axis, choose a Chart Time Resolution to group the events by a specific time range.
3. The chart will display all events. You can choose to show only a number of the top query results by selecting a number from the Show Top menu.
Maps Tab Source and Destination information are frequently critical when determining the potential threat of traffic. Some companies need to block traffic from certain countries based on security, political, or legal reasons whereas other companies may see identifying traffic by country of origin or destination simply as a way to limit the amount of traffic passing through the network.

Chapter 3 Analyzing Events Page 25
In the Maps tab, IPS Event Analysis presents source and destination countries for the active query on an interactive world map. Countries are color-coded to indicate levels of event activity. You can define the number of countries to include in the top tier of countries (Top N) and in the second tier of countries (Next Top N) to change how countries are grouped in the map.
Figure 3-7 Maps Tab
By double-clicking on a country, you can drill-down to see a detailed list of events for that country. By default the map shows the results of the All Events query; however, you can populate the map with information from any of the available queries by double-clicking on a query in the Query Tree. You can also choose to view continents individually in order to see countries more clearly.
Statistics information about the active query is displayed below the interactive map. The five countries with the highest number of events matching the query filter are shown with the number of events for each, as well as the total number of countries matching the query.
Interact with the map using the following actions:
To see the number of events that correspond to a country, move the mouse over that country.
To view query results for a country in an Events window, double-click on the country.
To change between viewing the entire world map and viewing maps for individual continents, choose from the Map menu.
Activity Level - In the bottom right corner of the map is the Activity Level key. Countries are colored according to four tiers:
Top - By default, the Top 3 countries are colored Red. Choose the number of countries to include in the top tier by changing this setting.
Next Top - By default, the Next Top 5 countries are colored Yellow. Choose the number of countries to include in the second tier by changing this setting.
Others - All countries with events, but are not included in the Top or Next Top tiers, are colored Blue.
No Activity - All countries without events are colored White.
Moving the mouse over a tier in the Activity Level key will highlight the Countries in that tier.
In addition, in the bottom left corner of the map is a summary of event statistics which includes the number of events for the top 5 countries and the total number of countries with events.

Chapter 3 Analyzing Events Page 26
Administrator Permission Profiles - Events and Reports
IPS Event Analysis enables you to provide an administrator with a Permission Profile for the IPS Event Analysis database. A Permission Profile is a permission ID card that is assigned to administrators or administrator groups.
The administrator and his Permission Profile are verified during login. When an administrator logs into IPS Event Analysis his user name and password are verified by the IPS Event Analysis server. If the administrator is not defined on the IPS Event Analysis server, the server will attempt the login process with the credentials that are defined on the Security Management server or MDS connected with SIC to the IPS Event Analysis server.
Note - To disable Remote Login run to invoke the following command from the IPS Event Analysis server command line: cpprod_util CPPROD_SetValue FW1 REMOTE_LOGIN 4 1 1
The Permission Profile types for the IPS Event Analysis Events tab are set in the SmartDashboard/MDG (SmartDashboard > Manage > Permissions Profiles > New / Edit) connected to the Security Management server/MDS with the following option:
Events Database enables an administrator to receive permissions for the IPS Event Analysis events that are found on the IPS Event Analysis server.
The following are the three types of Permission Profiles:
No Access indicates that the administrator cannot view the IPS Event Analysis Events and Reports tabs.
Read Only enables the administrator to view IPS Event Analysis Events and Reports tabs.
Read/Write enables the administrator to modify the IPS Event Analysis Events and Reports tabs using the Change State option.
Provider-1 When working with Provider-1, IPS Event Analysis is customer oriented. That is, each Event and Report is associated with a customer.
The administrator can view Events and Reports about customers to which he has permissions. Only locally defined administrators on the IPS Event Analysis server or on the MDS Super User defined on the MDS can view all events including cross-customer events.

Page 27
Chapter 4
Investigating Events Once you have arranged the events as you like in the Event Log, you can begin to investigate their details and evaluate whether they represent a threat.
In This Chapter
Tracking Event Resolution using Tickets 27
Accessing IPS Protection Details 27
Displaying an Event's Original Log Information 27
Using Custom Commands 28
Tracking Event Resolution using Tickets Events can be categorized and assigned to administrators to track their path through the workflow of resolving threats. Once administrators review an event, they can assign it a status, such as Investigation in Progress, Resolved, or False Alarm; add comments that detail the actions that have been taken with respect to the event; and assign an administrator as the owner of the event. This process is called Ticketing.
After editing the ticket, administrators can use queries to track the actions taken to mitigate security threats and produce statistics based on those actions.
To edit an Event Ticket, open the event and click Edit Ticket.
To add a quick comment about the event without changing the state or owner, open the event and click Add Comment.
To view the history of actions that have been taken on an event, open the event and click View History.
Accessing IPS Protection Details When reviewing events generated from the IPS blade, you may want to review the IPS protections and profiles to understand why an event was generated or attempt to change the way the traffic is handled by the IPS blade.
The IPS menu presents actions that are specific to IPS events. These actions include:
Go to Protection which opens the SmartDashboard to the IPS protection which triggered the event.
Go to Advisory which opens the Check Point Advisory article which provides background information about the IPS protection.
Protection description which opens a detailed description of the IPS protection.
Displaying an Event's Original Log Information
To see the log entries that comprise an event, either right-click, or double-click an event, and select Raw data. SmartView Tracker will open and display the various log entries that comprise the event.
Note - If the log data for a certain event exceeds 200Kb, the data is discarded.

Chapter 4 Investigating Events Page 28
If there are any logs that that have associated packet captures, you can open the packet captures in the viewer that is defined in Actions > Packet Capture Configuration.
Note - To view packet captures:
In a Security Management deployment, the server with IPS Event Analysis enabled must also have the Logging and Status Software Blade enabled.
In a Provider-1 deployment, the IPS Event Analysis plug-in must be activated for the CMA.
Using Custom Commands The IPS Event Analysis client provides a convenient way to run common command line executables that can assist you in investigating events. By right-clicking on cells in the Event Log that refer to an IP address, the default list of commands appears in the context-sensitive menu.
The following commands are available by default: ping, whois, nslookup and Telnet. They appear by design only on cells that refer to IP addresses, because the IP address of the active cell is used as the destination of the command when run.
For example, if you right-click a cell containing an IP address and select the default ping command, a window opens and three ICMP packets are sent to that address. This behavior is configurable, and other commands can be added as well. To add your own custom commands, see Configuring Custom Commands (on page 32).

Page 29
Chapter 5
System Administration The following tasks help you maintain your IPS Event Analysis system properly:
Creating objects for use in filters (see "Adding Network and Host Objects" on page 30)
Adding additional IPS Event Correlation Units and Log servers (see "Defining Correlation Units and Log Servers" on page 30)
Adding objects to the Internal Network (see "Defining the Internal Network" on page 31)
Creating or modifying custom commands that can be run from the IPS Event Analysis client (see "Configuring Custom Commands" on page 32)
Creating scripts to run as Automatic Reactions for certain events (see "Creating an External Script" on page 32)
Modify the database settings to fit your disk space and requirements (see "Managing the Event Database" on page 33)
These tasks can be performed from the Policy tab. The Policy tab is hidden by default, but can be revealed by selecting Policy Tab from the View menu.
Modifications to the Event Policy do not take effect until saved on the IPS Event Analysis server and installed to the Correlation Units.
To enable changes made to the Event Policy, proceed as follows:
1. Select File > Save.
2. Select Actions > Install Event Policy.
Changes made to the Event Policy can be undone if the changes have not been saved first. To undo changes made to the policy, select File > Revert Changes.
In This Chapter
Adding Exclusions 29
Modifying the System's General Settings 30
Managing the Event Database 33
Dynamic Updates 34
Administrator Permissions Profile - Policy 35
Adding Exclusions Exclusions filter out the listed sources and services from triggering this type of event. For example, an internal Domain Name server designed to make frequent port scans would be a good candidate for exclusion from the Event Definition. The exclusion can be entered manually, or automatically when accepting Learning Mode recommendations, available in the Event Correlation Software Blade.
To manually add an exclusion, click Add and select either the Source and/or Destination object you want to exclude from the event.
Note - If you do not see the host object listed, you may need to create it in IPS Event Analysis (see "Adding Network and Host Objects" on page 30).
Existing exclusions can be modified or deleted by selecting Edit or Remove, respectively.
Chapter 5 System Administration Page 30
Modifying the System's General Settings The following tasks help you maintain your IPS Event Analysis system:
Creating objects for use in filters, as described in Adding Network and Host Objects (on page 30).
Adding additional IPS Event Correlation Units and Log servers, as detailed in Defining Correlation Units and Log servers (on page 30)
Adding objects to the Internal Network, as described in Defining the Internal Network (on page 31)
Creating or modifying custom commands that can be run from the IPS Event Analysis client, as explained in Configuring Custom Commands (on page 32)
Creating scripts to run as Automatic Reactions for certain events, as detailed in Creating an External Script (on page 32).
These tasks can be performed from the Policy tab. The Policy tab is hidden by default, but can be revealed by selecting Policy Tab from the View menu.
Adding Network and Host Objects Certain objects from the Management server are added during the initial sync with the IPS Event Analysis server and updated at a set interval. However, it may be necessary or useful to add other Network or Host objects, for the following reasons:
If you have devices or networks not represented on the Management server that are important for the purpose of defining your internal network
When adding sources or destinations to exclusions or exceptions in Event Definitions
When selecting sources or destinations in a filter
The following screens are locked until initial sync is complete:
Network Objects
Internal Network
Correlation Units
To make these devices available for use in IPS Event Analysis, proceed as follows:
For a Host object:
1. From the Policy tab, select General Settings > Objects > Network Objects > Add > Host.
2. Give the device a significant Name.
3. Enter its IP Address or select Get Address.
4. Select OK.
For a Network object:
1. From the Policy tab, select General Settings > Objects > Network Objects > Add > Network.
2. Give the network a significant Name.
3. Enter the Network Address and Net Mask.
4. Select OK.
See Defining the Internal Network (on page 31) for information on adding objects to the Internal Network definition.
Defining Correlation Units and Log Servers The IPS Event Analysis system works with correlation units that compile event information from log servers. Additional Correlation Units and their corresponding Log servers should be configured during the initial system setup.
To define Correlation Units or Log servers in IPS Event Analysis:
1. From the Policy tab, select General Settings > Initial Settings > Correlation Units.
2. Select Add.

Chapter 5 System Administration Page 31
3. Select the […] symbol and select a Correlation Unit from the pop-up window.
4. Select OK.
5. Select Add and select a Log server available to the Correlation Unit from the pop-up window.
6. Select Save.
7. From the Actions menu, select Install Event Policy.
Note - The following screens are locked until sync is complete:
Network Objects
Internal Network
Correlation Units
Defining the Internal Network To help IPS Event Analysis determine whether events have originated internally or externally, the Internal Network must be defined. The direction is calculated the as follows:
1. Incoming – all the sources are outside the network and all destinations are inside
2. Outgoing – all sources are inside the network and all destinations are outside
3. Internal – sources and destinations are all inside the network
4. Other – a mixture of and internal and external values makes the result indeterminate
To define the Internal Network:
1. From the Policy tab, select General Settings > Initial Settings > Internal Network.
2. Add internal objects.
Note - It is recommended to add all internal Network objects, and not Host objects
Certain network objects are copied from the Management server to the IPS Event Analysis server during the initial sync and updated afterwards periodically.
The following screens are locked until initial sync is complete:
Network Objects
Internal Network
Correlation Units
Offline Log Files IPS Event Analysis enables an administrator to view existing logs from a previously generated log file. This feature is designed to enable an administrator to review security threats and pattern anomalies that appeared in the past. As a result, an administrator can investigate threats (for example, unauthorized scans targeting vulnerable hosts, unauthorized legions, denial of service attacks, network anomalies, and other host-based activity) before IPS Event Analysis was installed.
In the same respect, an administrator can review logs from a specific time period in the past and focus on deploying resources on threats that have been active for a period of time but may have been missed (for example, new events which may have been dynamically updated can now be processed over the previous period).
The generation of Offline logs are set in the IPS Event Analysis > Policy tab > General Settings > Initial Settings > Offline Jobs, connected to the Security Management server/MDS with the following options:
Add enables you to configure an Offline Log File process.
Name acts as a label that enables you to recognize the specific Offline Line log file for future processing. For example, you can create a query according to the Offline Job's name. This name is used in Event tab queries to search events that have been generated by this job.
Comment contains a description of the Offline Job for edification.
Offline Job Parameters:
Correlation Unit the machine that reads and processes the Offline Logs.

Chapter 5 System Administration Page 32
Log Server the machine that contains the Offline Log files. IPS Event Analysis will query this log server to see which log files are available.
Log File contains a list of available of log files found on the selected Log server to be processed by the correlation unit. In this window you select the log file from which you would like to retrieve historical information.
Edit enables you to modify the parameters of an Offline Log File process.
Remove enables you to delete an Offline Log File process.
Once you Start an Offline Log File process you cannot remove it.
Start runs the Offline Log File process.
The results of this process appear in the Events tab and are accessible by the By Job Name query or filter.
Stop ends the Offline Log Files process.
Stop does not delete the entire process, it only stops the process at the specific point at which it is selected. The information collected up until the process is stopped will appear in the Events tab.
With the IPS Event Analysis Events Tab you can add offline jobs to query events generated by offline jobs. To do this perform the following:
1. Select the Events Tab.
2. Go to Predefined > By Job Name.
3. Double-click By Job Name.
Every job that appears in this window is an offline job except for All online jobs.
4. Select the job you want the By Job Name to query.
5. Click OK.
Configuring Custom Commands To add (or edit) custom commands:
1. Select Actions > Configure Custom Commands.
2. To add a command, select Add…. (To edit an existing command, highlight the command and select Edit.)
3. Enter the text to appear in the right-click context menu.
4. Enter the command to run, and any arguments.
5. Select whether the command should be run in an IPS Event Analysis window or a separate Windows command window.
6. Select whether the command should appear in the context menu only when right-clicking in cells with IP address data.
7. Select OK.
Creating an External Script An external script can be written to receive an Event Definition via standard input. The format of the event content is a name-value set – a structured set of fields that have the form:
(name: value ;* );
where name is a string and value is either free text until a semicolon, or a nested name-value set. The script will be reported as successful if it completes within 10 minutes and its exit status is zero.
The following is a sample event as it is received by an external script:

Chapter 5 System Administration Page 33
(Name: Check Point administrator credential guessing;
RuleID: {F182D6BC-A0AA-444a-9F31-C0C22ACA2114}; Uuid:
<42135c9c,00000000,2e1510ac,131c07b6>; NumOfUpdates: 0;
IsLast: 0; StartTime: 16Feb2005 16:45:45; EndTime: Not
Completed; DetectionTime: 16Feb2005 16:45:48;
LastUpdateTime: 0; TimeInterval: 600; MaxNumOfConnections:
3; TotalNumOfConnections: 3; DetectedBy: 2886735150;
Origin: (IP: 1.2.3.4; repetitions: 3; countryname: United
States; hostname: theHost) ; ProductName: SmartDashboard;
User: XYZ; Source: (hostname: theHost; repetitions: 3; IP:
1.2.3.4; countryname: United States) ; Severity: Critical;
EventNumber: EN00000184; State: 0;
NumOfRejectedConnections: 0; NumOfAcceptedConnections: 0) ;
To add an External Script, proceed as follows:
1. From the Policy tab, select General Settings > Initial Settings > Automatic Reactions > Add > External Script.
2. Give the script a name.
3. In the field Action, enter the name of the file containing the script. The script must be placed in the
directory $RTDIR/bin/ext_commands, and must have execute privileges.
Managing the Event Database The Event Database uses a file-switching scheme, where after the database file grows to a set size, it is closed, compacted, and moved to a separate directory, and a new file is opened in its place. After a number of files have been closed, the earliest file is automatically deleted from the disk. For this reason it is a good idea to back up these files to a backup location. It is also therefore important to be able to restore this data, if necessary.
Backup and Restore of the Database The evs_backup utility backs up the Eventia configuration files and places them in a compressed tar file. In addition, it backs up data files based upon the options selected. The files can be restored using the evs_backup_extractor script. Enclosed are two script versions, one for Windows that has a .bat suffix and one for Solaris, Linux and SecurePlatform that does not have a suffix but should have the executable permissions set.
Usage:
evs_backup [-filename file.tgz] [-EvaDb] [-EvrDb] [-Results] [-Logs] [-
LogoAndScripts] [-All] [-export]
Additional options are:
Option Description
EvaDb Copy the Eventia Analyzer events database
EvrDb Copy the Eventia Reporter consolidation database
Results Copy the Eventia Reports results
Logs Copy the Eventia Suite error logs
LogoAndScripts Copy the logo file and the distribution script
export Runs a evr_addon_export. For a different file name use -filename
All Select all options

Chapter 5 System Administration Page 34
Adjusting the Database Size The size of the Event Database should be set according to the available disk space on your system. The database size is determined by the number of days that records are kept and the number of records.
To adjust the database size, from the Policy tab, select General Settings > Database Maintenance, and adjust the settings for the fields Number of days to keep records in the database and Number of records to keep in the database.
Backing Up Events
To back up all events, do the following from the command line of the IPS Event Analysis server:
1. Enter the command cpstop to stop the IPS Event Analysis server.
2. Locate the folder $FWDIR\distrib and move its contents to a backup location.
3. Do the same for the folder $RTDIR/events_db.
4. Enter the command cpstart to restart the IPS Event Analysis server.
Deleting Events
To clean the system of all events, do the following on the IPS Event Analysis server:
1. Enter the command cpstop to stop the IPS Event Analysis server.
2. Locate the folder $FWDIR\distrib and delete all files there.
3. Do the same for the folder $RTDIR/events_db.
4. Enter the command cpstart to restart the IPS Event Analysis server.
Dynamic Updates IPS Event Analysis provides you with the ability to download updates from the Check Point User Center. These updates are referred to as Dynamic Updates and they include Check Point Event Definitions and third party product parsing. For additional information on Event Definitions refer to Modifying Event Definitions and Creating Event Definitions (User Defined Events).
The update process connects to the User Center and verifies whether or not updates of new event definitions, expanded existing event definitions and/or third party product parsings exist. The administrator has the option of downloading the updates and incorporating them into the Event Policy (a policy that includes events to be detected when connections are made to specific Security Rule Base rules at high rates). Once the Event Policy is installed the administrator must perform an Install Policy in order for the updates to take effect. For additional information about Event Policy refer to Policy Tab.
In the same respect, if the administrator is unsatisfied with the update, it is possible to revert to a revision of the configuration files that is created before the update is executed. There is always only one previous version of the Event Policy since the revision is overwritten each time an update is performed.
Data received as a result of the Dynamic Update process may contain third party syslog and snmpTrap parsing for firewall and IPS Event Analysis parsing. IPS Event Analysis can parse and process third-party syslog and snmpTrap messages. This parsing process extracts relevant log fields from the data and creates a normalized Check Point log which is available for further analysis. The syslog and snmpTrap data is kept in the following directory:
$FWDIR/conf/syslog/CPdefined syslog files
If the administrator wants to modify a file defined by Check Point, the specific file must be copied from the CPdefined Syslog directory and placed in the UserDefined Syslog directory ($FWDIR/conf/syslog/ UserDefined syslog files).
For additional information about new devices and syslog and snmpTrap parsing please refer to Third-Party Device Support.
Perform a Dynamic Update 1. Open IPS Event Analysis.

Chapter 5 System Administration Page 35
2. Select Actions > Dynamic Update.
The Enter Network Password window appears.
3. Enter your User Center password and user name and click OK.
The Dialog window appears.
4. From the Available Updates List select one or more updates.
5. Click Update Now.
At this point the relevant files are fetched from the User Center and the Event Policy and third party product parsing files are updated in IPS Event Analysis and all Log servers installed on Eventia components.
Note - If you have an external log server that parses the third party product data manually copy the fwdir/conf/syslog directory from the IPS Event Analysis Server to the same directory on the log server and invoke cpstop and cpstart.
View Updated Events 1. Open IPS Event Analysis.
2. Select the Policy tab.
3. Select View > View Updated Events.
The updated events appear in blue in the Event tree.
Revert the Dynamic Update to a Previous Version 1. Open IPS Event Analysis.
2. Select Actions > Undo last policy update.
If you select Yes, the process updates the Event Policy to its prior definition.
Undo last policy update only applies to Policy Updates and not all updates.
Administrator Permissions Profile - Policy IPS Event Analysis enables you to provide an administrator with a Permission Profile for the IPS Event Analysis database. A Permission Profile is a permission ID card that is assigned to administrators or administrator groups.
The administrator and his Permission Profile are verified during login. When an administrator logs into IPS Event Analysis his user name and password are verified by the IPS Event Analysis server. If the administrator is not defined on the IPS Event Analysis server, the server will attempt the login process with the credentials that are defined on the Security Management server or MDS connected with SIC to the IPS Event Analysis server.
The Permission Profile types for the IPS Event Analysis Events tab are set in the SmartDashboard/MDG (SmartDashboard > Manage > Permissions Profiles > New / Edit) connected to the Security Management server/MDS with the following option:
The following are the four types of Permission Profiles:
None indicates that the administrator cannot view the IPS Event Analysis Policy tab.
Read Only enables the administrator to view IPS Event Analysis Policy tab.
Read/Write enables the administrator to perform Install Policy and modify the IPS Event Analysis Policy tab.
With Read/Write permissions the administrator can also configure one or both of the following from within the Events tab:
Exclude from Event Definition
Add Exception to Event Definition
Chapter 5 System Administration Page 36
Customized allows user-defined access to the selected Check Point products and select permissions per application.
Provider-1 When working with Provider-1, IPS Event Analysis is customer oriented. That is, in the Policy tab the administrator will only be able to view exceptions and exclusions (see Read/Write above) for customers for which he has permissions.
A Provider-1 Policy administrator can be one of the following:
A locally defined administrator on the Analyzer Server
An MDS Super User defined on the MDS.
An administrator with permissions to all customers selected in IPS Event Analysis (Policy > General Settings > Objects > Customers). Unlike the two above, this type of administrator can install a policy and can view events that are cross-customer (an event created from logs that come from multiple customers).

Index A
Accessing IPS Protection Details • 27 Adding Exclusions • 29 Adding Network and Host Objects • 30 Adjusting the Database Size • 34 Administrator Permission Profiles - Events and
Reports • 26 Administrator Permissions Profile - Policy • 35 Analyzing Events • 12 architecture • 5
Eventia Analyzer • 5
B
Backing Up Events • 34 Backup and Restore of the Database • 33 Basic Concepts and Terminology • 8
C
Charts Tab • 22 Check Point Licenses • 9 Checking Client Vulnerability • 17 Configuring Custom Commands • 32 Configuring IPS Event Analysis to work with
Provider-1 • 11 Correlation Unit • 7
analysis • 7 Creating an External Script • 32 Creating Custom Queries • 13 Custom Queries • 12 Customizing Query Charts • 14 Customizing Query Filters • 13
D
Data Analysis and Event Identification • 7 Define the Internal Network for IPS Event
Analysis • 10 Defining Correlation Units and Log Servers • 30 Defining Correlation Units and Log Servers for
IPS Event Analysis • 10 Defining the Internal Network • 31 Deleting Events • 34 Displaying an Event's Original Log Information •
27 Dynamic Updates • 34
E
Easy Deployment • 5 Enabling Connectivity with Provider-1 • 10 Event Details • 19 Event Investigation Tracking • 6 Event Log • 15 Event Queries • 12 Event Query Results • 14 Event Statistics Pane • 18 Eventia Analyzer • 5
architecture • 5 Exporting Events to a File • 17
F
Filtering Events • 15
G
Grouping Events • 16
I
Initial Configuration • 9 Initial Configuration of the IPS Event Analysis
Client • 10 Installing the Network Objects in the IPS Event
Analysis Database • 11 interoperability • 7
Security Management • 7 Interoperability with Security Management • 7 Introducing IPS Event Analysis • 5 Investigating Events • 27 IPS Event Analysis Architecture • 6 IPS Event Analysis Client • 7
M
Managing the Event Database • 33 Maps Tab • 24 Modifying the System's General Settings • 30
O
Offline Log Files • 31 Organizing Queries in Folders • 14 Overview Tab • 19
P
Perform a Dynamic Update • 34 Predefined Queries • 12 Presenting Event Data • 19 Provider-1 • 26, 36
R
Revert the Dynamic Update to a Previous Version • 35
S
Scalable, Distributed Architecture • 5 Security Management Server • 7
interoperability • 7 objects • 7
Sending an Event • 16 Sorting and Searching Events • 15 System Administration • 29
T
The Check Point Solution — IPS Event Analysis • 5
Timeline Tab • 21 Tracking Event Resolution using Tickets • 27
U
Using Custom Commands • 28
V
View Updated Events • 35