Embed Size (px)
Citation preview
April 2012
Irish-Scottish Links on Energy Study (ISLES)Technology Roadmap Report
www.islesproject.eu
European UnionEuropean RegionalDevelopment FundInvesting in your future
ISLES Technology Roadmap Report
MDR0707Rp0020 i Rev F02
TABLE OF CONTENTS 1 EXECUTIVE SUMMARY............................................................................................................ 1 2 INTRODUCTION........................................................................................................................ 3
2.1 OBJECTIVES..................................................................................................................... 3
2.2 DEVELOPMENT AND STRUCTURE ....................................................................................... 3
3 OFFSHORE NETWORK SYSTEMS.......................................................................................... 5 3.1 INTRODUCTION ................................................................................................................ 5
3.1.1 HVAC................................................................................................................ 5
3.1.2 HVDC ............................................................................................................... 6
3.2 OFFSHORE SUBSTATION PLATFORMS............................................................................... 11
3.2.1 HVAC.............................................................................................................. 11
3.2.2 HVDC ............................................................................................................. 11
3.3 MULTI-TERMINAL OPERATION .......................................................................................... 12
3.3.1 Power Flow Control ........................................................................................ 12
3.3.2 Fault Detection and Clearing.......................................................................... 13
3.3.3 Standardisation and Interoperability............................................................... 13
3.4 ONSHORE NETWORK REQUIREMENTS .............................................................................. 14
3.4.1 Substations..................................................................................................... 15
3.4.2 Transmission Corridors .................................................................................. 15
3.4.3 FACTS............................................................................................................ 16
3.4.4 Security of Supply .......................................................................................... 16
4 NETWORK EQUIPMENT TECHNOLOGY.............................................................................. 18 4.1 INTRODUCTION............................................................................................................... 18
4.2 SUBSTATIONS................................................................................................................ 18
4.2.1 Onshore.......................................................................................................... 18
4.2.2 Offshore.......................................................................................................... 19
4.2.3 Subsea ........................................................................................................... 19
4.3 HVDC CONVERTERS........................................................................................................ 20
4.3.1 HVDC CSC..................................................................................................... 20
4.3.2 HVDC VSC..................................................................................................... 21
4.4 SWITCHGEAR ................................................................................................................. 22
4.4.1 HVAC.............................................................................................................. 22
4.4.2 HVDC ............................................................................................................. 23
4.5 TRANSFORMERS ............................................................................................................ 24
4.5.1 HVAC.............................................................................................................. 24
4.5.2 HVDC ............................................................................................................. 25
4.6 HARMONIC FILTERS........................................................................................................ 26
4.7 CAPACITOR BANKS ......................................................................................................... 27
4.8 REACTORS..................................................................................................................... 28
4.9 FACTS DEVICES.............................................................................................................. 29
ISLES Technology Roadmap Report
MDR0707Rp0020 ii Rev F02
4.9.1 Series Compensation ..................................................................................... 30
4.9.2 Dynamic Shunt Compensation....................................................................... 30
4.9.3 Energy Storage............................................................................................... 31
4.9.4 Special FACTS Devices ................................................................................. 31
4.10 CABLES......................................................................................................................... 32
4.10.1 Onshore AC.................................................................................................... 32
4.10.2 Offshore AC.................................................................................................... 32
4.10.3 Onshore DC.................................................................................................... 34
4.10.4 Offshore DC.................................................................................................... 36
4.10.5 DC Turbine Array ........................................................................................... 36
4.10.6 HVDC High Temperature Superconductors................................................... 37
4.11 OVERHEAD LINES ........................................................................................................... 37
4.11.1 HVAC Overhead Lines ................................................................................... 37
4.11.2 HVDC Overhead Lines................................................................................... 37
4.12 EQUIPMENT RELIABILITY ................................................................................................. 38
4.12.1 Maintenance and Repair ................................................................................ 39
5 DEPLOYMENT AND INSTALLATION .................................................................................... 40 5.1 OFFSHORE CABLES ....................................................................................................... 40
5.1.1 Cable Route Engineering ............................................................................... 40
5.1.2 Laying and Burial............................................................................................ 41
5.1.3 Joints .............................................................................................................. 42
5.1.4 Protection Systems, Cable and Pipeline Crossings....................................... 42
5.1.5 Cable Lay Vessels.......................................................................................... 43
5.1.6 Cable Lay Speed............................................................................................ 46
5.1.7 Trenching and Burial Speed........................................................................... 47
5.1.8 Onshore Connection ...................................................................................... 47
5.2 UNDERGROUND CABLES ................................................................................................ 48
5.2.1 Laying and Burial............................................................................................ 48
5.2.2 Joints .............................................................................................................. 48
5.2.3 Cable Transport.............................................................................................. 48
5.2.4 Cable Lay Speed............................................................................................ 49
5.3 OVERHEAD LINES .......................................................................................................... 49
5.4 OFFSHORE SUBSTATIONS .............................................................................................. 49
5.4.1 Construction ................................................................................................... 49
5.4.2 Deployment .................................................................................................... 50
5.5 WAVE AND TIDAL ENERGY CONVERTER DEPLOYMENT....................................................... 52
6 TECHNOLOGY SUPPLY CHAIN ............................................................................................ 53 6.1 INTRODUCTION............................................................................................................... 53
6.2 SUBSTATIONS................................................................................................................ 53
6.2.1 Onshore.......................................................................................................... 53
ISLES Technology Roadmap Report
MDR0707Rp0020 iii Rev F02
6.2.2 Offshore.......................................................................................................... 53
6.3 HVDC CONVERTERS........................................................................................................ 53
6.4 SWITCHGEAR................................................................................................................. 54
6.5 TRANSFORMERS ............................................................................................................ 54
6.6 HARMONIC FILTERS ........................................................................................................ 54
6.7 CAPACITOR BANKS ......................................................................................................... 54
6.8 REACTORS..................................................................................................................... 55
6.9 FACTS DEVICES.............................................................................................................. 55
6.10 OFFSHORE PLATFORMS .................................................................................................. 55
6.11 CABLES ......................................................................................................................... 55
6.12 OVERHEAD LINES ........................................................................................................... 56
6.12.1 HVAC.............................................................................................................. 56
6.12.2 HVDC ............................................................................................................. 56
6.12.3 Towers and Foundations................................................................................ 56
6.13 RAW MATERIALS............................................................................................................. 56
6.14 DEPLOYMENT AND INSTALLATION .................................................................................... 57
6.14.1 Offshore Platforms ......................................................................................... 57
6.14.2 Cables ............................................................................................................ 57
7 GENERATION TECHNOLOGY ............................................................................................... 59 7.1 INTRODUCTION............................................................................................................... 59
7.2 OFFSHORE WIND TURBINES............................................................................................. 59
7.2.1 Technology History......................................................................................... 59
7.2.2 State of the Art................................................................................................ 60
7.2.3 Future Technology Developments ................................................................. 61
7.2.4 Output Profile.................................................................................................. 61
7.2.5 Future State of the Industry............................................................................ 64
7.2.6 Cost Curves.................................................................................................... 64
7.3 TIDAL TURBINES............................................................................................................. 66
7.3.1 Technology Outline and History ..................................................................... 66
7.3.2 State of the Art................................................................................................ 66
7.3.3 Future Technology Developments ................................................................. 67
7.3.4 Output Profile.................................................................................................. 68
7.3.5 Future State of the Industry............................................................................ 70
7.3.6 Cost Curves.................................................................................................... 71
7.4 WAVE ENERGY CONVERTERS .......................................................................................... 72
7.4.1 Technology Outline and History ..................................................................... 72
7.4.2 State of the Art................................................................................................ 72
7.4.3 Future Technology Developments ................................................................. 74
7.4.4 Output Profile.................................................................................................. 74
7.4.5 Future State of Industry.................................................................................. 76
ISLES Technology Roadmap Report
MDR0707Rp0020 iv Rev F02
7.4.6 Cost Curves.................................................................................................... 77
7.5 GRID CONNECTION REQUIREMENTS ................................................................................. 78
7.5.1 Demand.......................................................................................................... 78
7.5.2 Spinning Reserve ........................................................................................... 79
7.5.3 Energy Storage............................................................................................... 79
7.5.4 Weather Forecasting ...................................................................................... 79
7.5.5 Optimisation of Network Assets ..................................................................... 79
8 OTHER TECHNOLOGY........................................................................................................... 80 8.1 ENERGY STORAGE.......................................................................................................... 80
8.1.1 Pumped Hydro................................................................................................ 80
8.1.2 Compressed Air Energy Storage.................................................................... 80
8.1.3 Chemical Batteries ......................................................................................... 80
8.1.4 Pumped Heat Storage.................................................................................... 81
8.1.5 Hydrogen........................................................................................................ 81
8.1.6 FACTS Storage .............................................................................................. 81
9 INDUSTRY CONSULTATIONS............................................................................................... 82 10 REFERENCES......................................................................................................................... 84 APPENDIX A - HVDC INDUSTRY TRACK RECORD ......................................................................... 91 APPENDIX B - OFFSHORE WIND FARM TRANSMISSION EXAMPLES ......................................... 93 APPENDIX C – ISLES BATHYMETRY DATA..................................................................................... 94 APPENDIX D – IHC ENGINEERING BUSINESS SEATRAC.............................................................. 95
LIST OF FIGURES
Figure 3.1 Maximum lengths with tuned inductive shunt compensation at both ends............................ 6
Figure 3.2 Existing and future planned HVDC subsea installations........................................................ 6
Figure 3.3 HVDC CSC monopole circuit with earth/seawater/low voltage metallic return path.............. 8
Figure 3.4 HVDC CSC bipole circuit in balanced operation.................................................................... 8
Figure 3.5 Twelve pulse thyristor converter bridge ................................................................................. 8
Figure 3.6 Quebec-New England multi-terminal transmission link.......................................................... 9
Figure 3.7 DC Voltage of existing and future planned HVDC VSC transmission links ......................... 14
Figure 4.1 Three-core XLPE HVAC cable............................................................................................. 33
Figure 4.2 Single-core mass impregnated HVDC cable ....................................................................... 35
Figure 4.3 Single-core extruded insulation HVDC cable....................................................................... 35
ISLES Technology Roadmap Report
MDR0707Rp0020 v Rev F02
Figure 5.1 Cable Storage Systems ....................................................................................................... 45
Figure 5.2 Cable lay vessel availability ................................................................................................. 46
Figure 5.3 Offshore substation installation capability............................................................................ 52
Figure 7.1 Power curve for Alstom Grid Wind M5000 offshore wind turbine ........................................ 62
Figure 7.2 Representative annual generation duration curve for a single offshore wind turbine.......... 62
Figure 7.3 Power output for a single offshore wind turbine................................................................... 63
Figure 7.4 Actual and forecast wind generation for Ireland................................................................... 64
Figure 7.5 European predicted offshore wind turbine capacity expansion as compared with actual onshore development ............................................................................................................................ 65
Figure 7.6 Forecast European annual installations to 2030.................................................................. 65
Figure 7.7 UK Offshore wind predicted energy costs............................................................................ 66
Figure 7.8 Example of tidal stream current cycle .................................................................................. 68
Figure 7.9 Representative power curve for tidal turbine ....................................................................... 68
Figure 7.10 Tidal turbine power output for representative tidal resource.............................................. 69
Figure 7.11 Representative annual generation duration curve for a tidal turbine ................................. 69
Figure 7.12 Tidal phase around Ireland, colours represent hours of separation of high tide................ 70
Figure 7.13 Example power output for phased tidal stream devices. ................................................... 70
Figure 7.14 UK tidal stream cost-resource curve.................................................................................. 72
Figure 7.15 Extracted power output for various wave energy devices ................................................. 75
Figure 7.16 Example of output smoothing through use of wave energy device arrays ........................ 75
Figure 7.17 Estimated annual generation duration at a potential wave farm site ................................. 76
Figure 7.18 Monthly distribution of wave energy device power generation from 1998 to 2004 across the Irish Sea .......................................................................................................................................... 76
Figure 7.19 Predicted variation in cost of energy from wave energy devices assuming a learning rate of 15% and initial cost of energy 22p/kWh ............................................................................................ 78
ISLES Technology Roadmap Report
MDR0707Rp0020 vi Rev F02
LIST OF TABLES
Table 4.1 Onshore substation footprint ................................................................................................. 19
Table 4.2 HVDC converter technology.................................................................................................. 22
Table 4.3 Present AIS technology......................................................................................................... 23
Table 4.4 Present GIS technology ........................................................................................................ 23
Table 4.5 Industry track record of transformers .................................................................................... 25
Table 4.6 Industry track record for HVDC converter transformers........................................................ 26
Table 4.7 Industry track record of harmonic filters ................................................................................ 27
Table 4.8 Industry track record for HVDC filters.................................................................................... 27
Table 4.9 Capacitor bank technology.................................................................................................... 28
Table 4.10 Industry track record of stand-alone capacitor banks ......................................................... 28
Table 4.11 Reactor technology ............................................................................................................. 29
Table 4.12 Industry track record of shunt reactors................................................................................ 29
Table 4.13 System ratings and industry track record of Series Compensation .................................... 30
Table 4.14 System ratings and industry track record of SVC and STATCOM...................................... 31
Table 4.15 Underground AC cable technology ..................................................................................... 32
Table 4.16 Submarine AC cable technology......................................................................................... 34
Table 4.17 Underground HVDC cable technology ................................................................................ 35
Table 4.18 Subsea HVDC cable technology......................................................................................... 36
Table 4.19 HVDC overhead line technology ......................................................................................... 37
Table 4.20 Mean time to repair offshore transmission equipment in summer and winter months........ 38
Table 4.21 Indicative reliability of offshore transmission network assets.............................................. 38
Table 5.1 Cable installation and burial contractors ............................................................................... 40
Table 5.2 HVDC VSC cable properties ................................................................................................. 42
ISLES Technology Roadmap Report
MDR0707Rp0020 vii Rev F02
Table 5.3 Cable lay vessels and capacity ............................................................................................. 44
Table 5.4 Cable weight and space constraints for HVDC VSC circuit .................................................. 46
Table 5.5 Maximum HVDC VSC cable length for ST43 steel cable drum ............................................ 48
Table 5.6 Maximum HVAC single-core cable length for ST43 steel cable drum .................................. 49
Table 5.7 Transport vessel availability and capacity............................................................................. 51
Table 5.8 Jack-up barge availability and capacity................................................................................. 51
Table 6.1 Cable burial equipment and owner........................................................................................ 57
Table 6.2 Lead time for new build cable installation equipment............................................................ 58
Table 7.1 Offshore Wind Turbines ........................................................................................................ 60
Table 7.2 Tidal stream energy converters............................................................................................. 67
Table 7.3 Slated and proposed large scale tidal stream converter projects ......................................... 71
Table 7.4 Offshore wave energy converters ......................................................................................... 73
Table 7.5 Slated and proposed large scale wave energy projects........................................................ 77
Table 9.1 Technology Supplier Consultation Participants..................................................................... 83
ISLES Technology Roadmap Report
MDR0707Rp0020 1 Rev F02
1 EXECUTIVE SUMMARY
The design of the ISLES offshore transmission network will depend on available network technology, deployment and installation technology and availability throughout the supply chain. It will also be shaped by the feasible resource and the maturity of generation technologies to capture that resource and convert into usable energy. This report is a technology roadmap that provides insight into the credible technology available within the timescale of ISLES that will influence the design, installation and operation of the offshore transmission network. Key technology manufacturers and providers were engaged throughout the development of the roadmap to provide a view on current status, future advances, limitations, and supply chain issues.
HVDC Voltage Source Conversion (VSC) technology is the most suitable transmission system for the ISLES offshore network based on transmission distances and network requirements. HVDC VSC can efficiently transmit large amounts of power over large distances with relatively low losses. It also has superior power control properties and can improve the stability of weak networks. Although offshore HVDC VSC transmission systems have only been deployed up to ±150 kV and 400 MW, connection of two separate transmission links for 800 MW of offshore wind at ±320 kV and ±300 kV is to be completed by 2013. Transmission links up to 1000 MW and above should be commercially available with some limited operational track record within the timeframe of ISLES. HVDC VSC is well suited to multi-terminal configuration although there are currently no operational examples. For full multi-terminal operation, DC circuit breakers will be required although it is possible to configure multi-terminal networks without DC circuit breakers under some operational restrictions. These devices are actively under development but are not yet available commercially. However, it is credible that DC circuit breakers will be on the market within the next 5 to 10 years.
Given the relative size of the VSC HVDC Converter technology, and the available and viable HVDC Cable options, in contrast to the envisaged resource, the offshore connection system is likely to comprise multiple VSC HVDC links, with some possible interconnection either on the AC or DC side to provide redundancy, security, and operational flexibility. Network configuration concepts are developed further in the ISLES Concept report.
There are presently two commercial suppliers of HVDC VSC technology with a further supplier developing capabilities. Offshore HVDC VSC transmission projects to date have been specified to purpose with limited convergence on a standard design philosophy. Whilst it is important not to stifle innovation for a relatively new technology, lack of standardisation may have implications for future connectivity and flexibility for regional networks and pan European “Super-grids” and is being investigated further by industry bodies such as Cigré.
There are some deployment and installation technology issues relating to the increase in transmission link capacity such as increases in offshore substation size and subsea cabling. This constrains installation vessel options although there is increasing new build and modification activity in this sector which should ease the supply chain. Technology to reduce the weight of offshore platforms such as layout optimisation and the use of specially designed laminates for blast walls have the potential to reduce the cost associated with construction materials, transport and installation significantly. Multiple phased platform solutions also have merit where there is flexibility in offshore network deployment.
A large number of subsea transmission links for offshore wind and interconnection are planned for construction over the timescale of 2013 to 2020 and beyond. There are supply chain concerns, particularly for high voltage transmission export cabling, however manufacturers have indicated that they are ready to respond to market requirements. New build factories and/or upgrade of existing facilities require a significant amount of investment and time to reach full capacity, partnerships or long term agreements between key stakeholders would contribute to market certainty.
The energy resource availability from offshore wind, wave, and tidal stream was assessed for an ISLES Development Zone, presented in the Resource Assessment report, and was based on consideration of generation technology status and trends within the timeframe of ISLES development.

ISLES Technology Roadmap Report
MDR0707Rp0020 2 Rev F02
In terms of technology progression, offshore wind turbines are considered to be a rapidly maturing technology with industry focus on continuing to increase turbine output whilst optimising design, installation and operation to offshore conditions. The objective for most tidal stream energy converters is still aimed at sea-proving part-scale or full-scale prototypes rather than refining already proven designs. No large-scale tidal farms are currently in operation although there are serious plans for the deployment of tidal farms in the order of 100’s of MW in the next five to ten years. For wave energy converters, there is currently little device convergence, with competing devices having very different operating principles and output characteristics. Most devices are still in preliminary stages of sea-testing although several devices are available commercially. Over the next ten years, it is credible that wave farms in the order of 10 to 100 MW will be developed. The management of variable offshore generation to match demand requires further investigation on a development specific basis and by industry.
A number of the technologies assessed are developing rapidly and the supply chain and offshore transmission industry are continually adapting and responding to various new challenges. This technology roadmap is representative of the market towards the end of 2010.
ISLES Technology Roadmap Report
MDR0707Rp0020 3 Rev F02
2 INTRODUCTION
Europe is increasingly moving towards a higher level of transmission grid interconnection and flexibility to meet both demand and enable greater integration of renewables whilst maintaining security of supply. In addition, the next generation of offshore wind farms are located significantly further from the coast than before and will require a fresh approach for connection to the onshore network. The development of large and efficient offshore transmission networks is critical to providing the level of interconnection and integration required.
2.1 OBJECTIVES To build a vision of what an offshore grid network might look like in 2020, 2030 and beyond, it is essential to fully understand technological capabilities and constraints as well as credible future developments. The purpose of this report is to present a technology road map that plots current industry status, key issues, potential limitations to be considered and the path forward.
2.2 DEVELOPMENT AND STRUCTURE The characteristics of various transmission systems are first reviewed in the context of current status and future technology developments. Design and operation including requirements for onshore grid connection such as stability and security of supply are considered for an offshore transmission network similar to an envisaged ISLES topology. Industry track record including projects under construction and proposed projects is presented to demonstrate and quantify the progression of offshore transmission technology. This sets the scene for assessment of transmission system layouts in terms of credibility and suitability for ISLES concepts.
The technology of offshore transmission system building blocks is investigated in detail with a review of equipment design, specifications and mode of operation. This includes substations, HVDC converters, switchgear, transformers, harmonic filters and reactive power compensation and power quality devices such as reactors, capacitors and Flexible AC Transmission Systems (FACTS) devices. The technology of onshore and offshore transmission cables and overhead lines is assessed and device reliability and maintenance requirements are examined. A number of references to operational examples are given to demonstrate technology status and availability for ISLES.
The design and construction of an offshore transmission network is influenced significantly by deployment and installation technology. A review of the engineering challenges associated with offshore cable installation such as cable route design, trenching and laying, cable jointing and protection systems is carried out and the design and capacity of cable installation vessels is investigated. Technology issues associated with the installation of offshore substations, underground cables and overhead lines is also reviewed.
With a large number of offshore wind farms and transmission links proposed in the UK and abroad over the next 10 to 20 years, the supply chain will need to increase capacity rapidly to meet demand. A key component of the technology road map is to accurately identify likely future supply chain bottlenecks and how these will impact the design of offshore transmission systems such as ISLES. The technology supply chain is analysed in detail and consultations with key technology suppliers provide input on how the industry is tackling these issues.
A detailed resource assessment was performed to identify the energy resource availability from offshore wind, wave, and tidal stream within the offshore areas of Republic of Ireland, Northern Ireland, and Scotland and within the credible boundaries for an ISLES Development Zone. This is presented in the Resource Assessment Report. The viable resource potential is dependent on the projected resources that technology developers indicate may be harnessed, tempered by an objective review of technology progression and the typical efficiency trends in comparative technologies as they progress from desk-top to commercialisation. Viable resource may shift significantly over time as parameters such as device output and overall efficiency improve, and offshore installation limitations are reduced.

ISLES Technology Roadmap Report
MDR0707Rp0020 4 Rev F02
Technology for offshore wind turbines is considered to be maturing rapidly although there are still some teething issues for new products coming to market. There are several offshore turbines with an extensive track record and a number of turbines designed specifically for the offshore environment recently installed or coming to market shortly. The design of tidal turbines is progressing although the rate of progress remains considerably slower than that of offshore wind technology. Operational experience is limited to single devices at this stage. The design and operation of wave energy converters is widely varied and there is no leading device in the marketplace yet. A number of devices have been or are being sea tested at full scale at facilities such as EMEC and there is an array of three Pelamis devices off the coast of Portugal but in general, the technology is still relatively immature.
In the Technology Roadmap, the technology status, design and operational characteristics of marine renewable devices are reviewed in relation to the development of an offshore transmission network operating across different jurisdictions and geographic regions, and for the designated resources to be connected. This includes a view on technology developments and progression and cost profiles.
Other technology developments relevant to ISLES include energy storage which can be used to help manage power output variation from renewable to better match generation with demand and transmission constraints. Various technologies for energy storage are assessed in terms of efficiency, maturity and readiness for large-scale deployment.
ISLES Technology Roadmap Report
MDR0707Rp0020 5 Rev F02
3 OFFSHORE NETWORK SYSTEMS
3.1 INTRODUCTION Transmission system design is based on either high voltage alternating current (HVAC) or high voltage direct current (HVDC) power flow. HVAC is the most common system design and is proven for point to point as well as meshed networks, being able to transform voltage levels and split power with relative ease. HVDC is the preferred technology for low-loss bulk power transfer over long distances and has improved power flow control and stability compared to HVAC. A number of high capacity point to point HVDC systems are in operation; however, there is little industry track record for multi-terminal HVDC systems. HVDC systems are subdivided into conventional current source (CSC) or the more recently developed voltage source (VSC) HVDC technology.
For an offshore transmission network such as ISLES, various system characteristics will be required to ensure secure and efficient operation. These include;
o ability to transfer large amounts of power across significant subsea distances with low losses,
o well suited to modular construction phased in parallel with development of offshore renewables generation sites and ease of expandability (plug and play),
o and multi-terminal capabilities for interconnection of offshore renewables sites and connection to multiple points in the onshore transmission network.
The ability to operate across different onshore networks and electricity markets may also be an advantage depending on the final offshore network concepts. The system technology will need to have established reliability operating in an offshore environment and demonstrated economic feasibility in terms of capital costs as well as operational and maintenance costs i.e. bankable.
3.1.1 HVAC
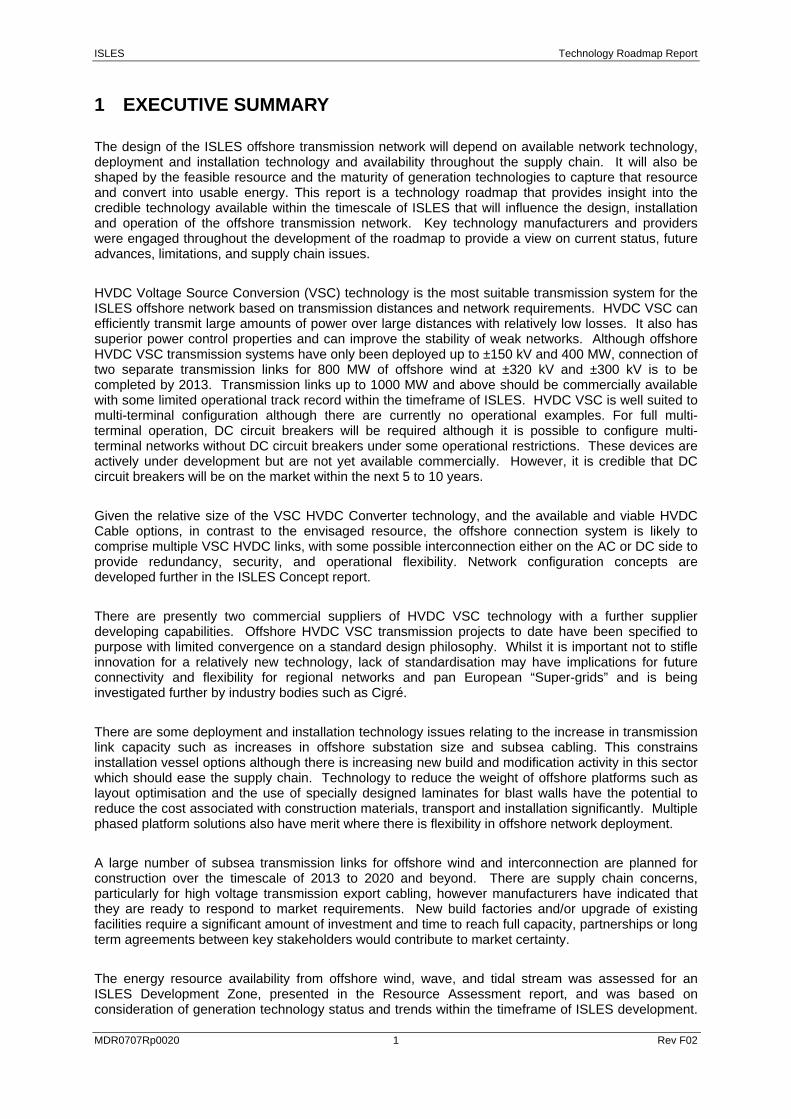
HVAC offshore technology is well established and is currently used to transmit energy ashore for existing offshore wind farms as well as extensively for onshore transmission networks. HVAC systems are easily expandable without the need for large converter stations required for HVDC. However, long distance buried and subsea HVAC cables are associated with large losses due to capacitance between the phase conductor and earth inducing a capacitive charging current. It is possible to offset losses to an extent through reactive power compensation at locations along the cable and/or at cable terminals. This is typically implemented at the point of onshore connection for offshore wind farms when required. Reactive power compensation along subsea cables is not available and is likely to be very complex and expensive if it became available. Once a critical distance (greater than approximately 60 km[1] to 100 km offshore) and cable rating threshold is exceeded, the economics of a HVDC technology solution become more attractive. The impact of HVAC cable capacitance effects on maximum transfer capacity with distance for various voltages is illustrated in Figure 3.1, for a system with reactive compensation.
Industry track record with offshore HVAC is given in Appendix B for a number of representative offshore wind farms. Offshore HVAC transmission is currently point to point and voltages are typically 132 kV with some higher voltage connections planned for the future. The 197.8 MW onshore Wolfe Island wind farm is connected to the Canadian mainland via a single 7.8 km long export cable at 245 kV. However, this is currently the only example of a three-core subsea transmission cable at this voltage level [2].
ISLES Technology Roadmap Report
MDR0707Rp0020 6 Rev F02
Figure 3.1 Maximum lengths with tuned inductive shunt compensation at both ends
(reproduced from [3])
3.1.2 HVDC
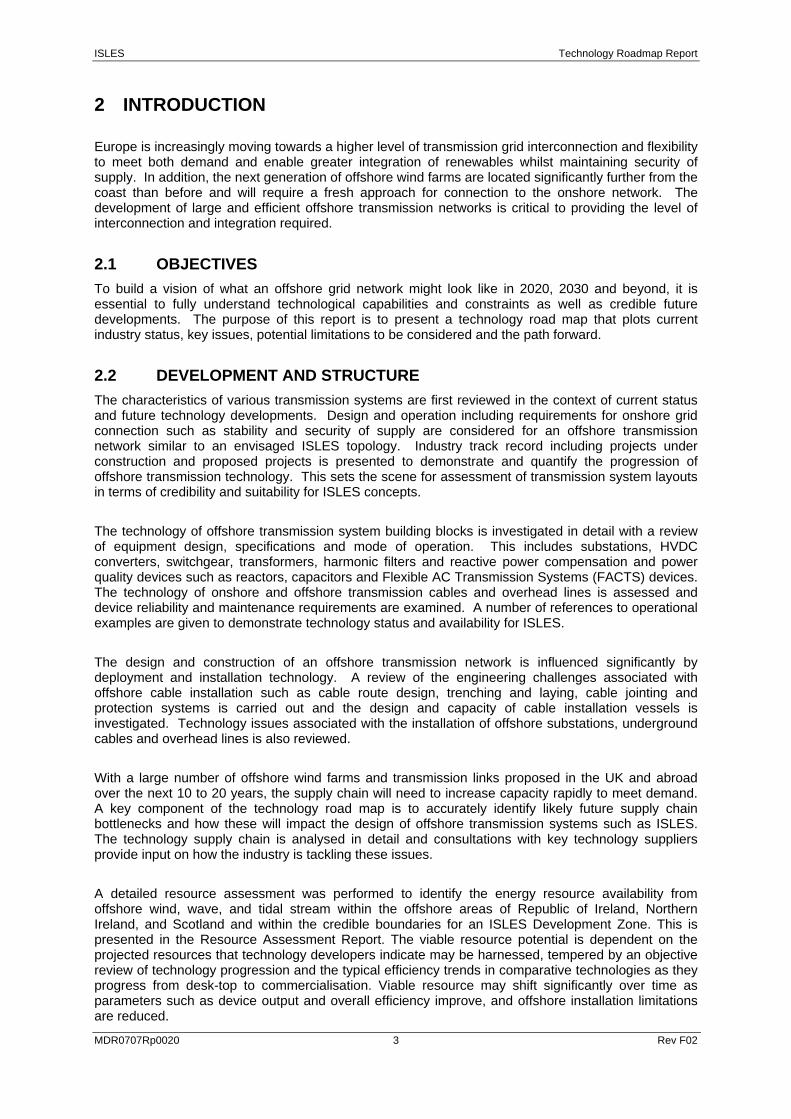
HVDC CSC is a mature transmission method based on solid-state thyristor technology and has an extensive industry track record for high capacity transmission links and reliable, low-loss operation. The recent development of capacitive commutated converters has further improved the performance of traditional converters. HVDC CSC is currently the most economic transmission technology for transfer of large amounts of power over significant distance. HVDC VSC, also commonly known by brand names such as HVDC Light (ABB) and HVDC Plus (Siemens), is a more recent technology development based on Insulated Gate Bi-Polar Transistors (IGBT). Losses for HVDC VSC are higher than for HVDC CSC due largely to high frequency IGBT switching operations, although losses become significantly less than HVAC for a comparable cable distance and capacity once a critical distance of 60 to 100km is exceeded. There are focussed efforts by industry to reduce this through design refinements. Figure 3.2 gives the rating and subsea cable length for operational HVDC installations and HVDC projects currently in construction and proposed and predicted for the future.
600
500
500660
700
500
2000
1000
1000
600
4001300
33084 350
78
400400
500
800
800396
700
1400
600
1400
1800
1800
1200
1100
700
700
0
100
200
300
400
500
600
700
800
900
1000
2000 2005 2010 2015 2020 2025
Leng
th o
f Sub
sea
HVD
C C
able
(km
)
Commissioning Year
HVDC CSC
HVDC VSC
HVDC Concept
Figure 3.2 Existing and future planned HVDC subsea installations
(in MW)
ISLES Technology Roadmap Report
MDR0707Rp0020 7 Rev F02
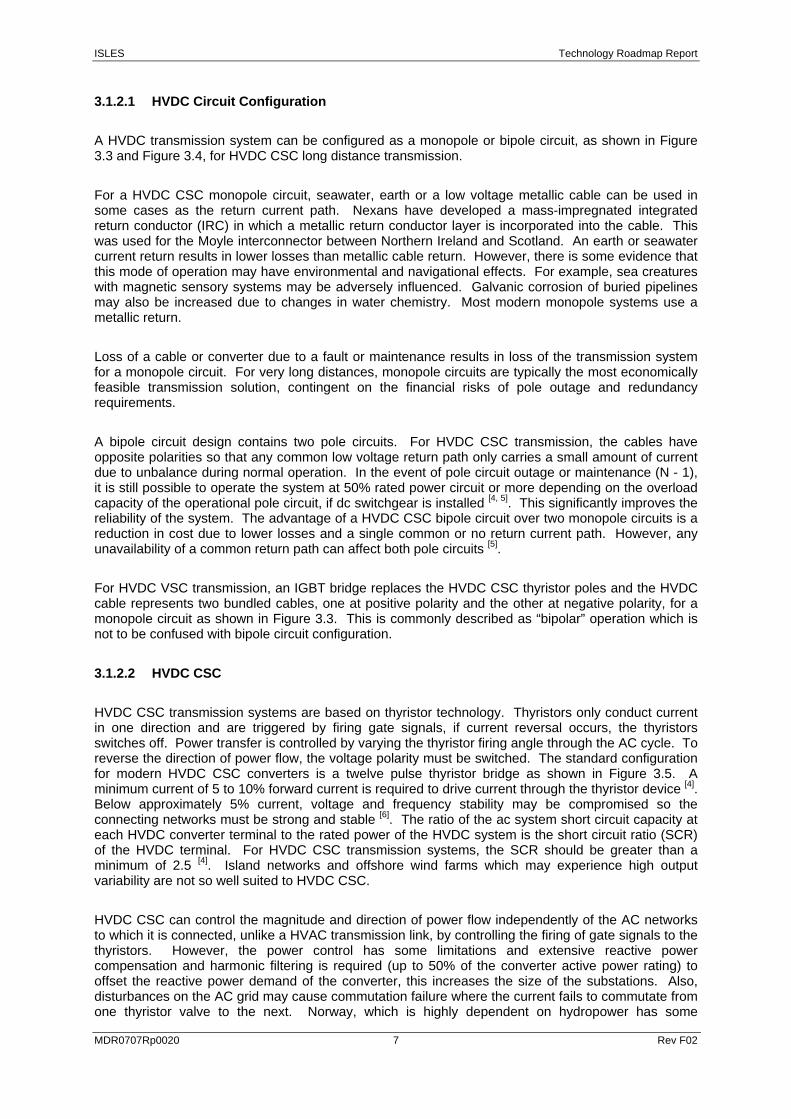
3.1.2.1 HVDC Circuit Configuration
A HVDC transmission system can be configured as a monopole or bipole circuit, as shown in Figure 3.3 and Figure 3.4, for HVDC CSC long distance transmission.
For a HVDC CSC monopole circuit, seawater, earth or a low voltage metallic cable can be used in some cases as the return current path. Nexans have developed a mass-impregnated integrated return conductor (IRC) in which a metallic return conductor layer is incorporated into the cable. This was used for the Moyle interconnector between Northern Ireland and Scotland. An earth or seawater current return results in lower losses than metallic cable return. However, there is some evidence that this mode of operation may have environmental and navigational effects. For example, sea creatures with magnetic sensory systems may be adversely influenced. Galvanic corrosion of buried pipelines may also be increased due to changes in water chemistry. Most modern monopole systems use a metallic return.
Loss of a cable or converter due to a fault or maintenance results in loss of the transmission system for a monopole circuit. For very long distances, monopole circuits are typically the most economically feasible transmission solution, contingent on the financial risks of pole outage and redundancy requirements.
A bipole circuit design contains two pole circuits. For HVDC CSC transmission, the cables have opposite polarities so that any common low voltage return path only carries a small amount of current due to unbalance during normal operation. In the event of pole circuit outage or maintenance (N - 1), it is still possible to operate the system at 50% rated power circuit or more depending on the overload capacity of the operational pole circuit, if dc switchgear is installed [4, 5]. This significantly improves the reliability of the system. The advantage of a HVDC CSC bipole circuit over two monopole circuits is a reduction in cost due to lower losses and a single common or no return current path. However, any unavailability of a common return path can affect both pole circuits [5].
For HVDC VSC transmission, an IGBT bridge replaces the HVDC CSC thyristor poles and the HVDC cable represents two bundled cables, one at positive polarity and the other at negative polarity, for a monopole circuit as shown in Figure 3.3. This is commonly described as “bipolar” operation which is not to be confused with bipole circuit configuration.
3.1.2.2 HVDC CSC
HVDC CSC transmission systems are based on thyristor technology. Thyristors only conduct current in one direction and are triggered by firing gate signals, if current reversal occurs, the thyristors switches off. Power transfer is controlled by varying the thyristor firing angle through the AC cycle. To reverse the direction of power flow, the voltage polarity must be switched. The standard configuration for modern HVDC CSC converters is a twelve pulse thyristor bridge as shown in Figure 3.5. A minimum current of 5 to 10% forward current is required to drive current through the thyristor device [4]. Below approximately 5% current, voltage and frequency stability may be compromised so the connecting networks must be strong and stable [6]. The ratio of the ac system short circuit capacity at each HVDC converter terminal to the rated power of the HVDC system is the short circuit ratio (SCR) of the HVDC terminal. For HVDC CSC transmission systems, the SCR should be greater than a minimum of 2.5 [4]. Island networks and offshore wind farms which may experience high output variability are not so well suited to HVDC CSC.
HVDC CSC can control the magnitude and direction of power flow independently of the AC networks to which it is connected, unlike a HVAC transmission link, by controlling the firing of gate signals to the thyristors. However, the power control has some limitations and extensive reactive power compensation and harmonic filtering is required (up to 50% of the converter active power rating) to offset the reactive power demand of the converter, this increases the size of the substations. Also, disturbances on the AC grid may cause commutation failure where the current fails to commutate from one thyristor valve to the next. Norway, which is highly dependent on hydropower has some
ISLES Technology Roadmap Report
MDR0707Rp0020 8 Rev F02
experience on harmonics and power/voltage stability for multiple HVDC CSC infeeds into a weak grid during dry years [7]. In terms of losses, a HVDC cable does not suffer from cable capacitance effects and will have lower losses than an equivalent HVAC cable. Converter station losses are approximately 0.6 to 0.7% at rated capacity [8].
Figure 3.3 HVDC CSC monopole circuit with earth/seawater/low voltage metallic return path
Figure 3.4 HVDC CSC bipole circuit in balanced operation
Figure 3.5 Twelve pulse thyristor converter bridge
AC system 2
HVDC cable/OHL
AC system 1
AC system 1 AC system 2
HVDC cable/OHL
LV metallic return
HVDC cable/OHL
ISLES Technology Roadmap Report
MDR0707Rp0020 9 Rev F02
The use of commutation capacitors since 1995, connected between the valve bridge and the converter transformers in ABBs concept [9], provides improved performance and stability by reducing the required SCR and thus, risk of commutation failures due to AC grid disturbances. When active power is changed, filter banks or shunt capacitor banks do not need to be switched in and out to compensate for changes in reactive power consumption.
There are many examples of high capacity point to point HVDC CSC systems worldwide, both onshore and subsea transmission links with systems of ±800 kV now operational [10]. Tokyo Electric Power Company (TEPCO) is actively developing a UHVDC transmission system at 1100 kV. Subsea applications are in operation up to 1000 MW (per bipole) and ±500 kV, with larger projects such as the 1400 MW NorGer interconnector between Norway and Germany planned for the near future. Onshore HVDC CSC transmission links, such as the Three Gorges links are used to efficiently transport large amounts of power from generation locations to demand centres or between electricity markets for balancing generation and demand. Appendix A contains a detailed list of current and proposed HVDC CSC project references.
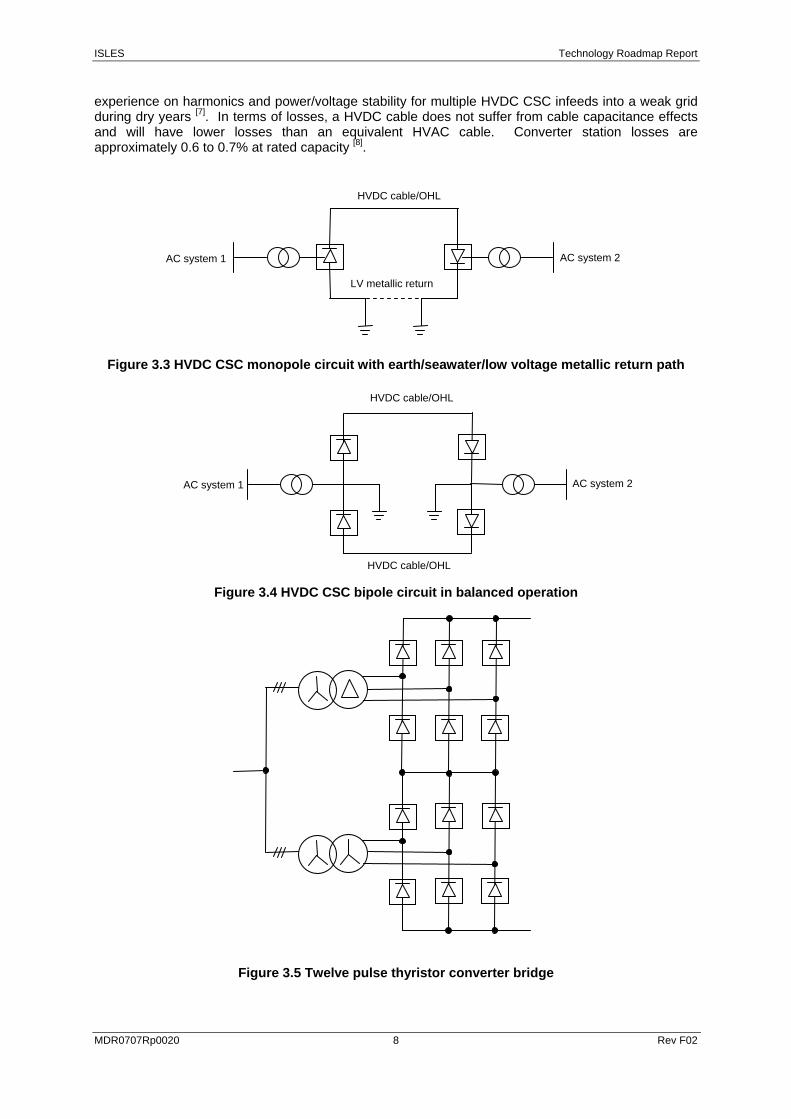
There is only one large-scale multi-terminal HVDC CSC system currently in operation, the 2000 MW Quebec-New England transmission link with a DC voltage of ±450 kV. Hydropower generated in the James Bay area in Canada is transmitted from Radisson along a single link to the load centres in Montreal and Boston. Power can also be exchanged between Boston and Montreal in either direction. The scheme is configured for parallel operation.
Phase 1 of the project was a 690 MW interconnector between Des Cantons in Quebec and Comerford in New Hampshire completed in 1986, connecting the asynchronous networks of Canada and the United States. In Phase 2 (completed 1990), a 2250 MW transmission link was extended 1100 km north to Radisson and a 1800 MW converter terminal was installed at the Sandy Pond substation (Boston) to the south. A 2138 MW terminal in Montreal (Nicolet) was later added in 1992. It was originally planned to integrate the Comerford and Des Cantons terminals into the overall scheme between Radisson and Sandy Pond to allow all five stations to operate simultaneously and provide more flexible operation. However, this was not implemented in the final design due to anticipated performance problems.
Figure 3.6 Quebec-New England multi-terminal transmission link
(Reproduced from [11])
ISLES Technology Roadmap Report
MDR0707Rp0020 10 Rev F02
The 200 kV, 200 MW HVDC Italy-Corsica-Sardinia (SACOI) interconnector is a multi-terminal HVDC CSC system operated since 1965, first as a two terminal monopolar line and then in a bipolar configuration with the addition of a third terminal. It has three overhead lines and two subsea cables connected in series. It is now considered to have limited capacity and has suffered from a number of forced outages resulting in low availability.
HVDC CSC multi-terminal systems require current balancing control systems which increase significantly in complexity with the number of terminals. Also, commutation failure or a dc line fault affects the entire link and power flow direction reversal requires mechanical switching. Very few projects have been commissioned despite market interest. This may be due to complexity of control and performance issues encountered with installed systems. The multi-terminal schemes described above are somewhat different to the operation envisaged for an offshore transmission grid. This specific application is investigated in more detail in Section 2.3.
3.1.2.3 HVDC VSC
HVDC VSC converters are based on IGBTs which are self commutating devices that can be switched on and off using gate signals independent of current. Power transfer is controlled by switching the IGBT valves at high frequency using a pulse width modulation or multi-level topology approach and it is possible to control active and reactive power independently. Because VSC can provide controlled reactive output, reactive power compensation is not required. Also, harmonics generated by VSC converters are of a higher harmonic order than CSC converters so harmonic filters are smaller and are not utilised for reactive power compensation. For large multi-level configurations, harmonic filtering may not even be necessary. This significantly reduces the footprint of converter substations.
HVDC VSC converters are relatively independent of the connecting AC grids and unlike HVDC CSC, do not have minimum current or short circuit ratio requirements. AC grid disturbances do not result in commutation failure for a VSC system although synchronisation between the AC networks connected at either end of the HVDC link may be affected. This means that HVDC VSC systems are suitable for connection to weak networks and can be re-energised in the event of voltage collapse (black-start) on the AC grid. Also, voltage polarity is never changed so power balancing and/or reversal is relatively easy to facilitate. These attributes are particularly beneficial for multi-terminal operation.
Active power losses are higher for HVDC VSC compared to HVDC CSC due primarily to increased frequency of switching operations; there are related cooling requirements for IGBT valves. HVDC VSC converter station losses are given as approximately 1.6% at rated capacity by ABB [12]. There are some indications from industry that HVDC CSC may be overtaken by HVDC VSC as the preferred technology in the future if losses are reduced to a comparable level. The flexibility of HVDC VSC is of particular value for offshore wind applications.
As well as a number of HVDC VSC point to point onshore transmission links, there are seven subsea point to point systems in operation to date with ratings up to 350 MW and maximum subsea cable lengths of 74 km. There is industry experience with HVDC VSC system voltages up to ±150 kV although systems are available with a maximum voltage rating of ±320 kV and power rating of 1100 MW. The East-West interconnector between the Republic of Ireland and Wales is being installed with a voltage of ±200 kV. Installation of the ±150 kV BorWin 1 offshore converter station and subsea cabling to enable connection of the 400 MW Borkum 2 offshore wind farm off the coast of Germany was completed in November 2009 [13]. This HVDC link is the first phase of a regional North Sea offshore transmission network that will have a rating of 6.3 GW on completion [14]. One proposed concept for offshore network expansion is to connect a number of wind farms to an offshore converter station that includes several expansion platforms using a three-phase AC busbar before transmission to shore.
The tender to construct the 800 MW DolWin 1 offshore converter station and transmission link to the onshore German grid at Dörpen/West was recently awarded [15]. This will be the first HVDC VSC transmission project connected at a voltage level of ±320 kV. It will provide an export link for a
ISLES Technology Roadmap Report
MDR0707Rp0020 11 Rev F02
number of wind farms located in the North Sea and should be operational by 2013. Connection of the Veja Mate and Global Tech 1 offshore wind farms to the German mainland using ±300 kV HVDC VSC for 800 MW capacity is also planned to be complete and operational by 2013 [16]. HVDC VSC technology is being considered by various other offshore wind farm developers [1, 17], see Appendix B.
An important issue to highlight is the current lack of standardisation in terms of DC voltages. For example, an intermediate AC grid is required to connect a ±300 kV VSC system to a ±320 kV system. This is reviewed in detail in Section 3.3.3.
3.2 OFFSHORE SUBSTATION PLATFORMS Offshore AC substations collect power generated from offshore renewables and transform from inter array voltage to a higher voltage level suitable for long-distance, low loss transmission to shore. For HVDC transmission, the offshore platform includes a converter to convert from AC to DC before transmission. For BorWin 1, a separate HVAC transformer platform was constructed to collect power from the medium voltage wind turbine array (Borkum 2 wind farm) and transform to a high voltage before conversion to DC at an offshore HVDC converter platform located 1 km away. However, the best approach for offshore platform configuration will depend on the particulars of the development, the transmission topology i.e. level of interconnection, and the transmission regime. Offshore substation platforms also contain switchgear, limited power quality equipment and possibly accommodation for O&M personnel.
3.2.1 HVAC
The collector array voltage level of installed offshore wind farms at present is typically 30 to 36 kV although there is some discussion about going up to higher voltages in the region of 52 to 66 kV. This has the potential to reduce array losses and busbar heating which is becoming a major concern as capacity increases on 33 kV arrays. However, there are potential space and weight issues for the larger turbine and platform switchgear required as well as possible cable limitations.
Collector array voltage is generally stepped up in an offshore substation before transmission to shore to minimise losses and the size and number of cables required. A number of small UK offshore wind farms located only a few kilometres from the coast have been connected directly to an onshore substation at 33 kV. Offshore substations that step up to 132 kV AC or greater are being designed and installed for larger offshore wind farms located further out to sea.
For UK Round 2 and Round 3 offshore wind farms, some proposed connection designs step up to 220 kV AC before transmission to shore. However, there are diminishing returns on increasing transmission voltage as cable capacitive charging current increases with AC voltage and consequently greater reactive compensation is required. Also, equipment costs increases for a 220 kV voltage rating. Transmission details for various operational, in construction and proposed offshore wind farms are given in Appendix B.
3.2.2 HVDC
Relatively large substations are required for HVDC CSC due to converter size, reactive power compensation requirements and specialised converter transformers. To date, no offshore substations have been constructed or are being seriously considered for HVDC CSC.
HVDC VSC does not require reactive power compensation and standard transformers can be used which reduces substation space and weight. For the 400 MW Borkum 2 wind farm, the collector array voltage at 36 kV is stepped up to 154 kV AC on an offshore transformer platform connected to the offshore HVDC VSC BorWin 1 converter station platform. From BorWin 1, generated power is transmitted to an onshore converter station at Diele at a voltage rating of ±150 kV DC [18]. BorWin 1 was recently installed and should be operational in 2010. The BorWin 2 offshore converter station will
ISLES Technology Roadmap Report
MDR0707Rp0020 12 Rev F02
connect the Global Tech 1 and Veja Mate wind farms to the onshore German grid at Diele in 2013. This transmission link will be rated at 800 MW and ±320 kV. Also due to be commissioned in 2013 is the DolWin 1 offshore converter station and transmission link which will connect a number of wind farms in the North Sea to the onshore German grid at Dörpen/West and will have a total capacity of 800 MW at ±320 kV.
An HVDC offshore converter station is proposed for the Nai Kun offshore wind farm in Canada to be constructed in 2014 [19]. HVDC VSC converter stations are also under consideration for UK Round 3 offshore wind farms [1] and the Kriegers Flak development [17] in the Baltic Sea.
3.3 MULTI-TERMINAL OPERATION A number of generic offshore transmission topologies have been proposed for connection of offshore wind farms and other marine renewables such as multiple single connections to shore, a central hub and spoke network and a radial network with permutations of varying degrees of offshore and onshore interconnection. A multi-terminal transmission system design is required for many of these topologies to accept and coordinate multiple generation in-feeds and onshore connection points. A well designed multi-terminal system should be flexible, scalable and enable maximum utilisation of infrastructure such as transmission cables during each construction phase. It should also optimise security by allowing some soft degradation of transmission capacity with minimal impact on supply.
Onshore HVAC meshed (multi-terminal) transmission systems are well proven and understood. A HVAC meshed system may be feasible for an offshore transmission network depending on the transmission distance and capacity required. Multi-terminal HVDC has a minimal track record, with the operation of existing systems not representative of the anticipated operation of a multi-terminal offshore transmission network. There is only one large-scale multi-terminal HVDC CSC system currently in operation and no multi-terminal HVDC VSC systems have been constructed yet.
However, the implementation of HVDC VSC multi-terminal systems is being actively explored by the industry with multi-terminal HVDC VSC identified as a possible option in a number of pre-feasibility offshore transmission studies such as the 1600 MW Kriegers Flak project that will connect wind farms in the Baltic Sea to the Danish, Swedish and German transmission networks [17]. Multi-terminal HVDC VSC is also planned for the onshore SouthWest Link to reinforce the grid between Norway and Sweden, due to be constructed by 2015 [17]. SHETL is planning to construct a HVDC hub 12 miles off the Scottish coast in the Moray Firth to act as a multi-terminal switching station for connection of future offshore wind and increased transmission capacity. Initially, it will connect the proposed Caithness converter station and the existing Keith substation [20].
3.3.1 Power Flow Control
For HVDC CSC, current can only flow in one direction so changing power flow direction requires reversing polarity. For a multi-terminal network with more than two terminals, this becomes increasingly complex and a commutation failure due to disturbances on the AC grid or a DC fault may result in total shutdown of the system [21].
No polarity change is required to reverse power flow for HVDC VSC because current can flow in both directions. Also, IGBT valves minimise the risk of commutation failure and the DC grid is to an extent decoupled from instabilities on the AC grid. A limitation of half-bridge VSC converters is the inability to block a fault on the DC side, faults are cleared by the tripping AC breakers. Second generation, full bridge multi-level VSC converters can block DC side faults but at the cost of increased losses.
HVDC VSC has the capability for very flexible active and reactive power control and can restart independent of an external power source, in the event of a fault. These attributes are all highly advantageous for the efficient operation of a complex multi-terminal system and HVDC VSC solutions are being investigated for a number of multi-terminal offshore transmission schemes although there is no operational experience to date.
ISLES Technology Roadmap Report
MDR0707Rp0020 13 Rev F02
Power control strategies for a multi-terminal HVDC system can be based on a Master/Slaves configuration or a configuration with coordinated control between all terminals. A communication system can be used between terminals for improved stability although it is possible to operate the system with no communication links. The strategy adopted for a particular development will be dependent to an extent on onshore connections and any cross-jurisdictional requirements. Some control schemes currently proposed use voltage droop variants to avoid the need for high speed comms [22].
To minimise risk and demonstrate reliability, multi-terminal HVDC power flow control and protection strategies will need to be proven for network topology and operation similar to envisaged offshore transmission networks. The output from offshore wind farms can vary significantly even when mitigated to an extent by geographic diversity and this can impact network stability. However, demonstration and testing of control and protection methodologies will contribute to design lead time.
3.3.2 Fault Detection and Clearing
On existing two and three terminal HVDC systems, low rated load breakers can be located on the low voltage DC side, and circuit breakers are located on the AC side for fault detection and clearing. In the event of a DC fault, the affected pole is isolated. After a period of time, the pole and converters are restarted and system operation is re-established. For HVDC VSC transmission systems, AC circuit breakers also need to be opened to clear current from the IGBT valves although the use of full bridge VSC converters has the claimed advantage of being able to restrict fault current without requiring AC breaker tripping.
For large, multi-terminal HVDC networks, a protection design such as this would result in the loss of the entire network in the event of a fault and significant disruption to supply and reduction in system reliability.
High rated DC circuit breakers that are able to isolate individual transmission links during a DC fault are not currently available but are under development by HVDC solution providers. However, it is likely that at least initially; devices will be large and costly. Also, there will be an associated lead time for proving operation in the field. Because the impedance of a DC grid is quite low, DC circuit breakers are required to operate very fast, within a few milliseconds [23], much faster than AC circuit breakers because of rapid fault current rise. AC circuit breakers can take advantage of the voltage and current waveforms passing through the zero point twice every cycle. The development of HVDC circuit breakers has been delayed by difficulties in overcoming slow clearing times, large losses and high costs as well as lack of a strong commercial driver.
It may be financially viable to operate a multi-terminal system without DC circuit breakers for smaller networks depending on the network design and capacity. ABB have proposed a differentiation between a “regional” multi-terminal configuration without DC circuit breakers and an “inter-regional” multi-terminal configuration with DC circuit breakers, reflecting different corresponding security requirements.
3.3.3 Standardisation and Interoperability
For multi-terminal operation, a high degree of standardisation will be required across the network on a par with that achieved on the AC transmission system. All connected HVDC converter stations should have interoperable voltage levels, protection and control methodologies. HVDC transmission systems operating at different voltages can technically be connected through a converter station, linking via an AC busbar for example. However, significant additional equipment will be required, increasing cost and losses.
HVDC VSC offshore transmission links currently being designed for German offshore wind farms in the North Sea are rated at ±259, ±300 and ±320 kV, manufactured by two different suppliers. A
ISLES Technology Roadmap Report
MDR0707Rp0020 14 Rev F02
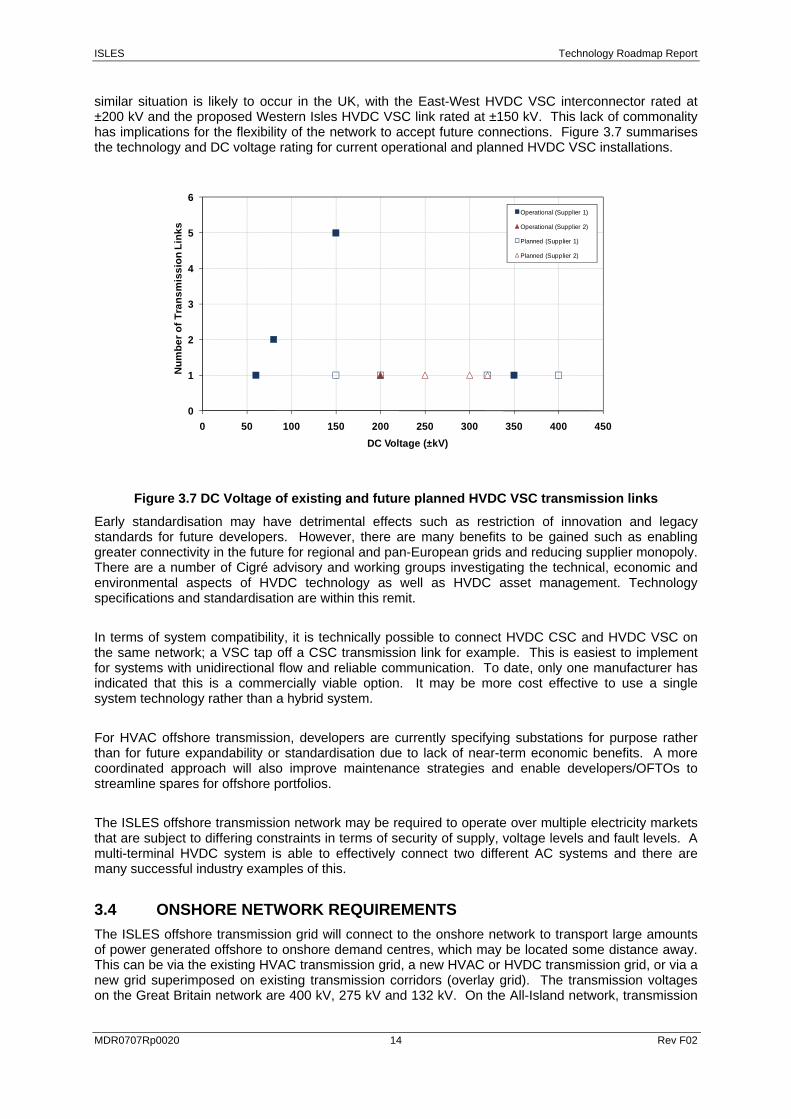
similar situation is likely to occur in the UK, with the East-West HVDC VSC interconnector rated at ±200 kV and the proposed Western Isles HVDC VSC link rated at ±150 kV. This lack of commonality has implications for the flexibility of the network to accept future connections. Figure 3.7 summarises the technology and DC voltage rating for current operational and planned HVDC VSC installations.
0
1
2
3
4
5
6
0 50 100 150 200 250 300 350 400 450
Num
ber o
f Tra
nsm
issi
on L
inks
DC Voltage (±kV)
Operational (Supplier 1)
Operational (Supplier 2)
Planned (Supplier 1)
Planned (Supplier 2)
Figure 3.7 DC Voltage of existing and future planned HVDC VSC transmission links
Early standardisation may have detrimental effects such as restriction of innovation and legacy standards for future developers. However, there are many benefits to be gained such as enabling greater connectivity in the future for regional and pan-European grids and reducing supplier monopoly. There are a number of Cigré advisory and working groups investigating the technical, economic and environmental aspects of HVDC technology as well as HVDC asset management. Technology specifications and standardisation are within this remit.
In terms of system compatibility, it is technically possible to connect HVDC CSC and HVDC VSC on the same network; a VSC tap off a CSC transmission link for example. This is easiest to implement for systems with unidirectional flow and reliable communication. To date, only one manufacturer has indicated that this is a commercially viable option. It may be more cost effective to use a single system technology rather than a hybrid system.
For HVAC offshore transmission, developers are currently specifying substations for purpose rather than for future expandability or standardisation due to lack of near-term economic benefits. A more coordinated approach will also improve maintenance strategies and enable developers/OFTOs to streamline spares for offshore portfolios.
The ISLES offshore transmission network may be required to operate over multiple electricity markets that are subject to differing constraints in terms of security of supply, voltage levels and fault levels. A multi-terminal HVDC system is able to effectively connect two different AC systems and there are many successful industry examples of this.
3.4 ONSHORE NETWORK REQUIREMENTS The ISLES offshore transmission grid will connect to the onshore network to transport large amounts of power generated offshore to onshore demand centres, which may be located some distance away. This can be via the existing HVAC transmission grid, a new HVAC or HVDC transmission grid, or via a new grid superimposed on existing transmission corridors (overlay grid). The transmission voltages on the Great Britain network are 400 kV, 275 kV and 132 kV. On the All-Island network, transmission
ISLES Technology Roadmap Report
MDR0707Rp0020 15 Rev F02
voltages are 400 kV, 220 kV and 110 kV in the Republic of Ireland, and 275 kV and 110 kV in Northern Ireland.
Connection of high capacity offshore generation to the West Coast of Scotland, Northwest Coast of England, Northern Ireland and Republic of Ireland may require both significant reinforcements and upgrades to existing transmission corridors and possibly the construction of new transmission links and subsea interconnectors at a later stage. This is due to insufficient rating and/or heavy loading of some existing lines, distance from large demand centres and high demand for firm generation connections in these regions. The All-Island network has sufficient current and forecast generation to meet demand as well as a high penetration of wind from onshore wind farms. Therefore, an onshore connection is likely to be used to facilitate export to the UK or Europe rather than provide for local demand.
3.4.1 Substations
Onshore substations provide the interface between an offshore transmission network and an onshore transmission grid. An onshore converter station is also required to connect an offshore HVDC network. Converter stations are generally constructed adjacent to existing transmission system substations where possible for ease of connection. These may be located a landfall or further inland depending on the topology and capacity of the local transmission network.
Onshore HVDC VSC converter stations are mostly indoors which reduces visual impact with a total footprint in the order of 100 m squared and 20 to 30 m high. HVDC CSC converter stations are somewhat larger with a footprint in the order of several hectares and a larger outdoor switchyard. Thus, obtaining planning permission is a potential issue.
Woodland and Deeside are having ±200 kV, 500 MW HVDC VSC converter stations constructed for the East-West interconnector between Republic of Ireland and Wales. Planning permission has been granted in both Republic of Ireland and Wales so this should provide some guidance to industry on how to avoid delays in the planning process.
3.4.2 Transmission Corridors
Upgrade and reinforcement of existing transmission corridors is a lengthy and costly process. Construction of new onshore transmission corridors is significantly more so. High capacity overhead transmission lines are not likely to be popular visually and may raise more public concerns over electromagnetic fields compared to underground transmission cables. Also, overhead lines require a large right of way although innovative new overhead pylons (WinTrack) recently installed by TenneT in the Netherlands have a lower magnetic field which should reduce this [24]. Transmission corridors for HVDC overhead lines are lower and narrower as two lines (one line for monopolar HVDC CSC circuit with earth return) are required for a single circuit compared to three for an equivalent AC EHV system. For example, overhead line land use requirements for a given transfer capability and reliability are given as approximately two thirds of that for an AC system [21].
Underground cabling is generally easier to obtain permits for due to smaller right of way requirements and reduced visual impact. Also, cables produce no audible noise and for HVDC cables, have no relevant electromagnetic field in a bipolar configuration (positive and negative polarity cables cancel out magnetic fields). However, the cost of installing underground cable transmission is much higher than an equivalent overhead line system. A 400 kV underground AC cable may cost approximately 23 times more than an equivalent OHL [25]. Also, overhead lines are capable of much higher voltages and capacity. HVAC cables experience large losses as distance and rating increases and as a result, are not well suited to long distance transmission.
There is significant industry experience with onshore HVDC transmission. A number of high capacity overhead HVDC CSC systems are in operation and a 970 km long ±350 kV overhead line has recently
ISLES Technology Roadmap Report
MDR0707Rp0020 16 Rev F02
been commissioned for the 300 MW HVDC VSC Caprivi link between Zambia and Namibia. Long distance HVDC VSC underground cabling is also a reasonably well established technology and has been used for the 220 MW Murraylink project in 2002 (±150 kV, 170 km) and for the onshore cabling of the 350 MW Estlink interconnector in 2006 (±150 kV, 74 km). The cables used for HVDC CSC transmission are generally not used for long distance underground transmission due to more complex jointing operations.
3.4.3 FACTS
Additional onshore control equipment may be required for connection of a high capacity offshore transmission network, particularly if demand centres are not located near landfall. Flexible AC transmission systems (FACTS) based on power electronics such as thyristors and IGBTs are able to improve power transfer and controllability of AC transmission links (both cables and overhead lines) across long distances and the performance of complex, heavily loaded AC grids [26]. Offshore wind can vary considerably and may not follow load requirements, producing voltage fluctuations and other disturbances on the network. FACTS can provide voltage control, reactive power control and power oscillation damping to reduce issues with the operability and performance of weak AC grids and help facilitate the integration of variable energy sources such as offshore wind into the onshore network. The industry has some experience with the installation and operation of FACTS systems for both onshore and offshore wind farms.
Static Var Compensators (SVC) have an extensive track record in improvement of power quality for industry and utilities over a range of voltages and reactive power ratings and are currently being considered by several UK Round 2 offshore wind projects to meet onshore grid code requirements.
STATCOM are a more recent development but have demonstrated the capability to provide highly controllable reactive power and may be able to further boost parallel AC networks by providing dynamic stability enhancement. However, STATCOM have higher losses compared to SVC.
There are a range of other FACTS technologies however there are best suited to the enhancement of the existing transmission network rather than specifically for the ISLES network.
3.4.4 Security of Supply
In Great Britain, the National Electricity Transmission System Security and Quality of Supply Standard (NETS SQSS) gives the Normal Infeed Loss Risk as 1000 MW and the Infrequent Infeed Loss Risk as 1320 MW. These standards may increase to 1320 MW and 1800 MW, respectively in the near future [21] due to the increased unit size of new nuclear reactor stations. These standards are in place to limit the amount of short-term and long-term reserve necessary on the system to cover the loss of a cable or a substation component connecting generation to the grid. The standards as they apply to offshore generation and transmission are summarised below.
3.4.4.1 Generation
For an offshore windfarm connecting to the onshore network using HVAC transmission, if the wind farm is larger than 90 MW, the loss of power infeed for a single AC offshore transmission circuit due to a fault or planned maintenance shall not exceed 50% of the offshore grid entry point capacity or the full normal infeed loss risk, whichever is lowest. For the fault outage of a single AC offshore transmission circuit on the offshore platform during the planned outage of another AC offshore transmission circuit on the offshore platform, the further loss of power infeed shall not exceed the infrequent infeed loss risk.
For an HVDC circuit on an offshore platform, the loss of power infeed due to a fault or planned maintenance on a single DC converter on the offshore platform shall not exceed the normal infeed loss risk. For the fault outage of a single DC converter on an offshore platform during the planned
ISLES Technology Roadmap Report
MDR0707Rp0020 17 Rev F02
outage of another DC converter on the offshore platform, the further loss of power infeed shall not exceed the infrequent infeed loss risk.
For the All-Island system, the largest generation infeed is 400 MW and an informal limitation exists to restrict the connection of a single generation infeed to this size.
3.4.4.2 Transmission
For offshore transmission between offshore platforms or between an offshore platform and the onshore grid connection point, the loss of power infeed due to a fault or planned maintenance on a single cable offshore transmission circuit shall not exceed the infrequent infeed loss risk. For the fault outage of a single cable offshore transmission circuit during the planned outage of another single cable offshore transmission circuit, the further loss of power infeed shall not exceed the infrequent infeed loss risk.
For HVAC transmission, a double circuit is needed to guarantee secure supply although each cable need only be rated at 50% capacity. For HVDC transmission, a fully rated double circuit (2 monopoles) is required or alternatively, the system can be configured as a bipole that can instantaneously switch to operation as a monopole with 50% capacity. It should be noted that most VSC based HVDC is bipolar rather than a true bipole in the conventional sense. This does not have the inherent 50% redundancy as with a HVDC CSC bipolar link.
3.4.4.3 Limitations
The economic decision to build redundancy into the network is a trade off between the potential value of generated energy lost while waiting for equipment to be repaired and the capital cost of building in redundancy. A detailed cost benefit analysis was carried out in [27] that informed the NETS SQSS.
NETS SQSS restricts the maximum substation/converter size (1000MW) and cable capacity and configuration that can be considered for an offshore transmission network in the ISLES region. The All-Island generation infeed guidelines also need to be considered for connection to the all-island grid.
ISLES Technology Roadmap Report
MDR0707Rp0020 18 Rev F02
4 NETWORK EQUIPMENT TECHNOLOGY
4.1 INTRODUCTION To conceptualise credible designs for the ISLES offshore transmission network, it is necessary to evaluate the technology of transmission network building blocks. This includes substation design for various transmission technologies and standard network equipment such as switchgear, transformers, cables and overhead lines as well as specialised FACTS devices and equipment reliability.
4.2 SUBSTATIONS The basic functionality of a substation can be summarised as follows;
o Transformation between voltage levels,
o disconnection and isolation in case of a fault or maintenance,
o and improvement of power and voltage quality.
Modern HVAC substations typically include power transformers to enable voltage step-up or step-down, switchgear, harmonic filter banks and reactors. FACTS devices and capacitor banks may also be installed to condition power and voltage and ensure grid code compliance. Substations may be fully or partially enclosed with outdoor switchyards, which can have a large footprint. HVAC substations are sometimes supplied as a turnkey transmission solution from the likes of ABB, Alstom Grid or Siemens.
A converter station is required at each end of each link for HVDC transmission. This contains AC/DC converters as well as power transformers, switchgear, AC and DC filter banks and equipment to provide reactive power compensation depending on the transmission technology (voltage source or current source). Converters also require significant amounts of cooling for switching operations and incorporate a cooling system. HVDC converter stations are often supplied as a modular prefabricated unit and/or as part of a turnkey transmission solution from ABB, Alstom Grid or Siemens.
4.2.1 Onshore
Onshore HVAC substations of up to 1100 kV have been constructed; substations in the UK and on the All-Island network are rated up to 400 kV. Connection of renewable generation such as wind often requires equipment to provide harmonic filtering and reactive power compensation to satisfy network power quality requirements. Substation equipment specifications depend on factors such as turbine type, wind farm capacity, connection location and AC cabling. UK Round 2 and Round 3 offshore wind farms connected using HVAC transmission technology may require significant amounts of compensation equipment due to distance of wind farms from shore. Table 4.1 gives the typical footprint of a HVAC substation for various applications, the outdoor switchyard accounts for most of the footprint. Underground substations have been proposed to reduce station footprint however, installation and ventilation would be more expensive. Gas Insulated Switchgear (GIS) is utilised in transmission substations both offshore and onshore to reduce substation footprint. Although it is more expensive than Air Insulated Switchgear (AIS), the additional capital cost may be justified in space-limited applications.
Onshore HVDC converter stations up to 800 kV (for CSC technology) are in operation. HVDC VSC converter stations on land are mostly enclosed within a building and have a much smaller outdoor switchyard compared to HVDC CSC converter stations. This is because HVDC VSC converter stations do not require reactive power compensation, have reduced harmonic filtering requirements and can utilise standard transformers. The footprint of a HVDC VSC onshore converter station may be up to 60% smaller than a HVDC CSC converter station. Table 4.1 provides representative converter station footprints for comparison.
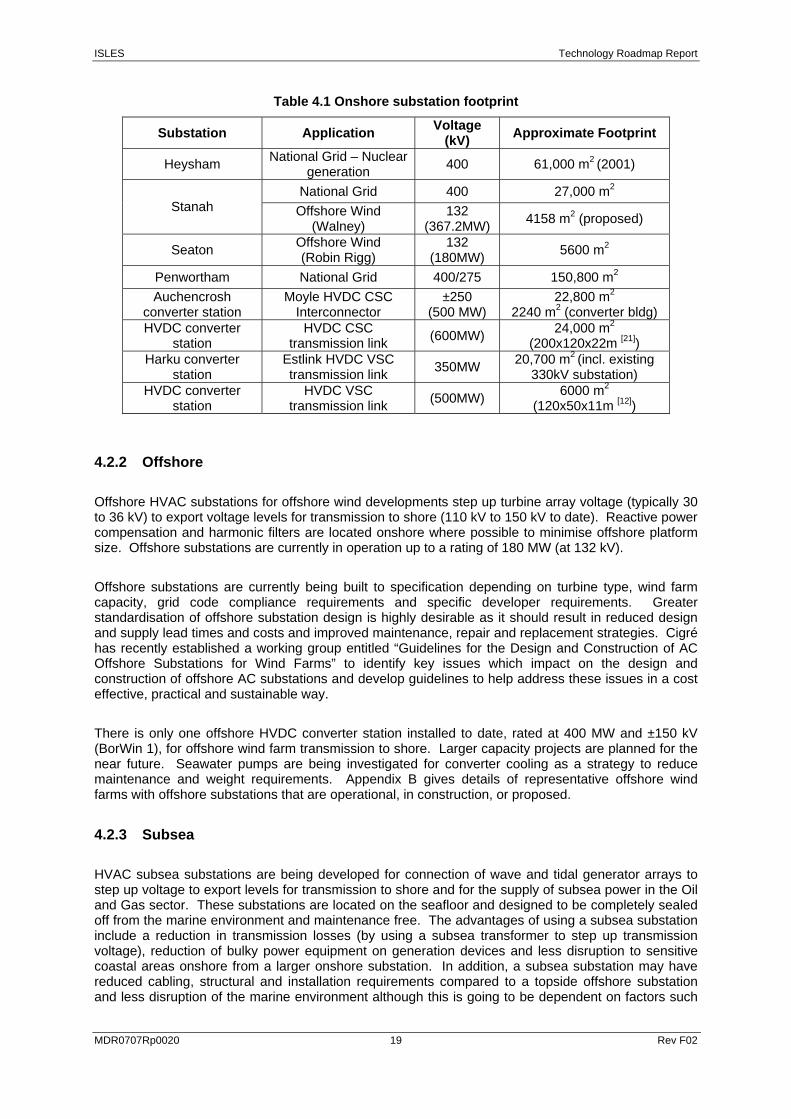
ISLES Technology Roadmap Report
MDR0707Rp0020 19 Rev F02
Table 4.1 Onshore substation footprint
Substation Application Voltage (kV) Approximate Footprint
Heysham National Grid – Nuclear generation 400 61,000 m2 (2001)
National Grid 400 27,000 m2 Stanah Offshore Wind
(Walney) 132
(367.2MW) 4158 m2 (proposed)
Seaton Offshore Wind (Robin Rigg)
132 (180MW) 5600 m2
Penwortham National Grid 400/275 150,800 m2 Auchencrosh
converter station Moyle HVDC CSC
Interconnector ±250
(500 MW) 22,800 m2
2240 m2 (converter bldg) HVDC converter
station HVDC CSC
transmission link (600MW) 24,000 m2 (200x120x22m [21])
Harku converter station
Estlink HVDC VSC transmission link 350MW 20,700 m2 (incl. existing
330kV substation) HVDC converter
station HVDC VSC
transmission link (500MW) 6000 m2 (120x50x11m [12])
4.2.2 Offshore
Offshore HVAC substations for offshore wind developments step up turbine array voltage (typically 30 to 36 kV) to export voltage levels for transmission to shore (110 kV to 150 kV to date). Reactive power compensation and harmonic filters are located onshore where possible to minimise offshore platform size. Offshore substations are currently in operation up to a rating of 180 MW (at 132 kV).
Offshore substations are currently being built to specification depending on turbine type, wind farm capacity, grid code compliance requirements and specific developer requirements. Greater standardisation of offshore substation design is highly desirable as it should result in reduced design and supply lead times and costs and improved maintenance, repair and replacement strategies. Cigré has recently established a working group entitled “Guidelines for the Design and Construction of AC Offshore Substations for Wind Farms” to identify key issues which impact on the design and construction of offshore AC substations and develop guidelines to help address these issues in a cost effective, practical and sustainable way.
There is only one offshore HVDC converter station installed to date, rated at 400 MW and ±150 kV (BorWin 1), for offshore wind farm transmission to shore. Larger capacity projects are planned for the near future. Seawater pumps are being investigated for converter cooling as a strategy to reduce maintenance and weight requirements. Appendix B gives details of representative offshore wind farms with offshore substations that are operational, in construction, or proposed.
4.2.3 Subsea
HVAC subsea substations are being developed for connection of wave and tidal generator arrays to step up voltage to export levels for transmission to shore and for the supply of subsea power in the Oil and Gas sector. These substations are located on the seafloor and designed to be completely sealed off from the marine environment and maintenance free. The advantages of using a subsea substation include a reduction in transmission losses (by using a subsea transformer to step up transmission voltage), reduction of bulky power equipment on generation devices and less disruption to sensitive coastal areas onshore from a larger onshore substation. In addition, a subsea substation may have reduced cabling, structural and installation requirements compared to a topside offshore substation and less disruption of the marine environment although this is going to be dependent on factors such
ISLES Technology Roadmap Report
MDR0707Rp0020 20 Rev F02
as the total rating of the marine generation array, the transmission voltage level and the availability, size and complexity of a suitable subsea substation.
Ocean Power Technologies have developed an Underwater Substation Pod (USP), which is designed to enable up to 10 marine energy converters to be aggregated under water, at depths of up to 50 m. The USP also includes fault protection and SCADA capabilities and can operate at export voltages of 11 kV to 15 kV. A 1.5 MW USP is being built and tested as part of a 1.39 MW wave farm project off the coast of Santoña, Spain [28].
General Electric Company manufactures a range of subsea power equipment capable of operating at depths in excess of 1000 m that is in common use in the oil and gas industry. This includes dry mate connectors rated up 132 kV, 700 A, wet mate connectors rated up to 36 kV, 500 A, switchgear rated for 24 kV, 1250 A and power transformers rated up to 70 MVA [29, 30, 31].
ABB developed a subsea electrical power distribution system (SEPDIS) available commercially since 2001, in conjunction with Shell, Statoil, Norsk Hydro Mobil and Framo Engineering, for the oil and gas industry. SEPDIS acts as a single subsea hub to distribute high voltage power to various seabed installations and contains a frequency converter, transformer and high voltage connector. This has reduced costs associated with the exploration of deepwater and satellite fields and has been utilised for developments such as Ormen Lange.
Subsea equipment is significantly more expensive than topside equipment, budget prices for subsea switchgear with four circuit breakers is 10million US$ [31]. The cost-benefit case for oil and gas applications may be easier to justify than for marine generation. As subsea substation size increases with capacity, installation, sealing and cooling become more complex.
4.3 HVDC CONVERTERS HVDC converters rectify AC input to DC, or invert DC to AC at each link end. The technology of the converter and functionality depends on the type of HVDC transmission system used.
4.3.1 HVDC CSC
The building blocks of HVDC CSC conversion are thyristors; power electronic devices that conduct current in one direction only. Thyristors are triggered by a gate signal and will conduct as long as the external circuit is sufficient to drive the current forward. A thyristor valve consists of a number of thyristors connected in series and reactor modules to limit the rate of current rise when the thyristor is triggered.
A HVDC CSC converter is typically configured as a twelve-pulse bridge which is constructed by connecting one six-pulse (six-valve) thyristor bridge (Graetz bridge) to a YY converter transformer and another six-pulse thyristor bridge to a YD converter transformer. The converters are then connected in series on the DC side and parallel on the AC side. A twelve-pulse bridge produces fewer current harmonics than a six-pulse bridge. Harmonic filtering removes current harmonics generated (11th, 13th, 23rd, 25th, 35th, 37th etc.) on the AC side and a smoothing reactor removes voltage harmonics (12th, 24th, 36th etc.) generated on the DC side. A DC filter is also required for DC overhead lines to prevent disturbances to nearby telephone lines.
A control system varies the thyristor firing angle in the AC cycle to obtain the desired voltage and current. However, this means that the converter operates at lagging power factor, absorbing reactive power and significant reactive power compensation is required to mitigate this. Power flow direction is reversed by switching voltage polarity.
The twelve-pulse bridge converter is typically suspended from the ceiling in a custom-made valve hall building, in a configuration of three adjacent valve structures (quadruple valves). Outdoor valves are
ISLES Technology Roadmap Report
MDR0707Rp0020 21 Rev F02
also available in modular structures with a single valve per unit. Modular units enable greater flexibility for converter station layout and are faster to assemble. Thyristor firing operations produce heat and valves are water cooled with de-ionised water in a closed loop circuit.
Although much of the current industry focus is on HVDC VSC technology, there are a number of recent and continuing developments for HVDC CSC technology. These include;
o improved reliability through use of a standardised valve design based on rigorous design verification tests,
o refinement of control methodology and diagnosis systems that lead to better informed maintenance operations,
o development of design guidelines for valve hall clearances to increase system voltages to greater than ±600 kV DC
o and light fired thyristors although valves are still predominantly electrically fired.
The Xiangjiaba - Shanghai transmission system went into commercial operation in July 2010. This is the first HVDC transmission link to be rated at ±800 kV, significantly higher than ±600 kV previously possible.
4.3.2 HVDC VSC
The key elements of a HVDC VSC converter are the IGBT valves comprised of a number of series connected IGBT cells. Active and reactive power is controlled by switching the IGBT valves at high frequency which produces greater conduction and switching losses than a CSC converter. Two to three level pulse width modulation (PWM) or multi-level valve switching methodologies are used in existing converter designs. The selected switching methodology influences circuit topology design and characteristics.
For a two-level PWM bridge design, the AC voltage waveform is generated by switching between two fixed voltages very rapidly. A low pass filter is then used to extract the fundamental frequency voltage waveform from the high frequency pulse modulated waveform. A disadvantage of this design is that valves are switched at full DC voltage in large steps which can lead to increased harmonics, transient stresses and switching losses. A three-level PWM bridge design based on three different voltage levels was used for the Cross Sound Cable and Murray Link projects. This topology reduces the valve switching frequency required which decreases switching power losses however, this design has not been implemented on more recent HVDC transmission projects. Converter loss for a two-level PWM design is approximately 1.6% of the transmission capacity (per station) at rated load [12]. Contributions to loss are given as >1.1% for the IGBTs, >0.21% for the converter transformers and >0.12% for the converter reactors [32].
For more recently developed multi-level VSC converter designs, a smaller capacitor-controlled voltage step is generated at each level, over multiple levels. A sinusoidal voltage waveform is produced by incrementally controlling each valve level [33]. This results in negligible harmonics and reduced switching losses (which along with conduction losses are the primary loss mechanisms for HVDC VSC) but requires a much more complex control design.
IGBT high frequency switching operations generate heat and a water cooling system is integrated into the IGBT stack. De-ionized water is circulated in a closed system and is cooled in heat exchangers using an air or a secondary water circuit. Electric heaters or glycol can be used to prevent water from freezing in cold climates.
The capability of HVDC converters is summarised in Table 4.2. Industry indicates that HVDC VSC systems with voltage levels of ±500 to 600 kV are likely to be available in the near future. Losses are
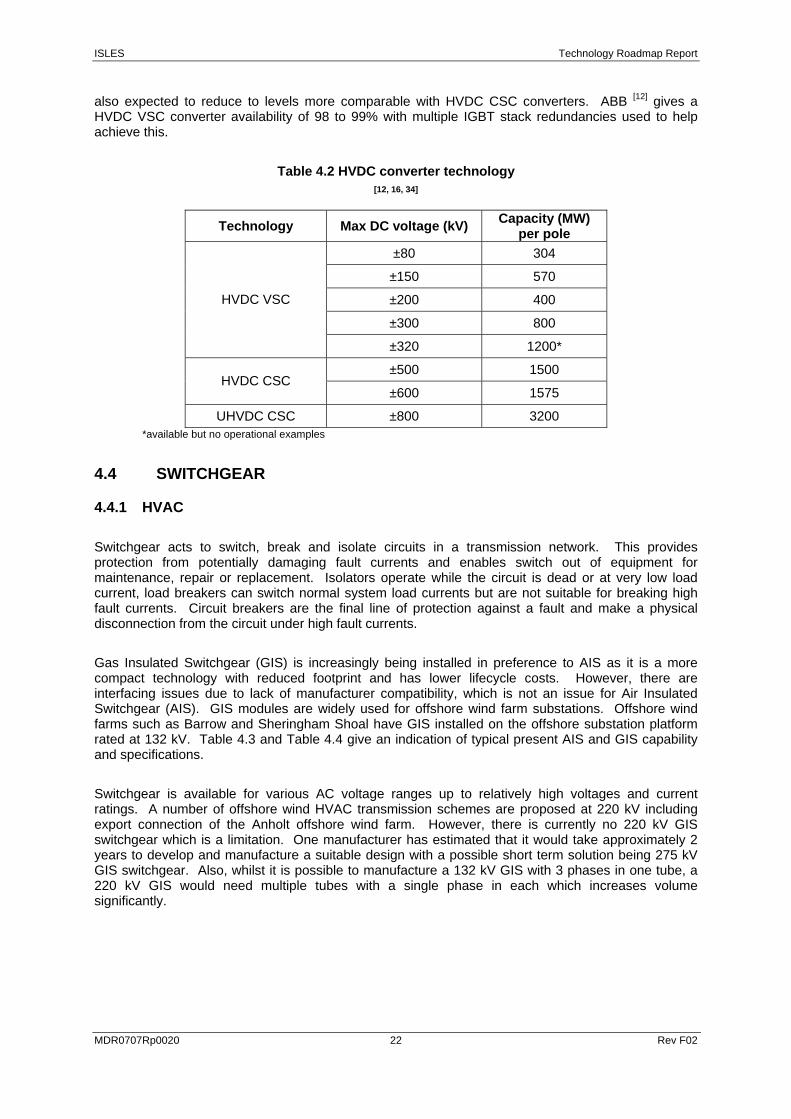
ISLES Technology Roadmap Report
MDR0707Rp0020 22 Rev F02
also expected to reduce to levels more comparable with HVDC CSC converters. ABB [12] gives a HVDC VSC converter availability of 98 to 99% with multiple IGBT stack redundancies used to help achieve this.
Table 4.2 HVDC converter technology [12, 16, 34]
Technology Max DC voltage (kV) Capacity (MW) per pole
±80 304
±150 570
±200 400
±300 800
HVDC VSC
±320 1200*
±500 1500 HVDC CSC
±600 1575
UHVDC CSC ±800 3200 *available but no operational examples
4.4 SWITCHGEAR
4.4.1 HVAC
Switchgear acts to switch, break and isolate circuits in a transmission network. This provides protection from potentially damaging fault currents and enables switch out of equipment for maintenance, repair or replacement. Isolators operate while the circuit is dead or at very low load current, load breakers can switch normal system load currents but are not suitable for breaking high fault currents. Circuit breakers are the final line of protection against a fault and make a physical disconnection from the circuit under high fault currents.
Gas Insulated Switchgear (GIS) is increasingly being installed in preference to AIS as it is a more compact technology with reduced footprint and has lower lifecycle costs. However, there are interfacing issues due to lack of manufacturer compatibility, which is not an issue for Air Insulated Switchgear (AIS). GIS modules are widely used for offshore wind farm substations. Offshore wind farms such as Barrow and Sheringham Shoal have GIS installed on the offshore substation platform rated at 132 kV. Table 4.3 and Table 4.4 give an indication of typical present AIS and GIS capability and specifications.
Switchgear is available for various AC voltage ranges up to relatively high voltages and current ratings. A number of offshore wind HVAC transmission schemes are proposed at 220 kV including export connection of the Anholt offshore wind farm. However, there is currently no 220 kV GIS switchgear which is a limitation. One manufacturer has estimated that it would take approximately 2 years to develop and manufacture a suitable design with a possible short term solution being 275 kV GIS switchgear. Also, whilst it is possible to manufacture a 132 kV GIS with 3 phases in one tube, a 220 kV GIS would need multiple tubes with a single phase in each which increases volume significantly.
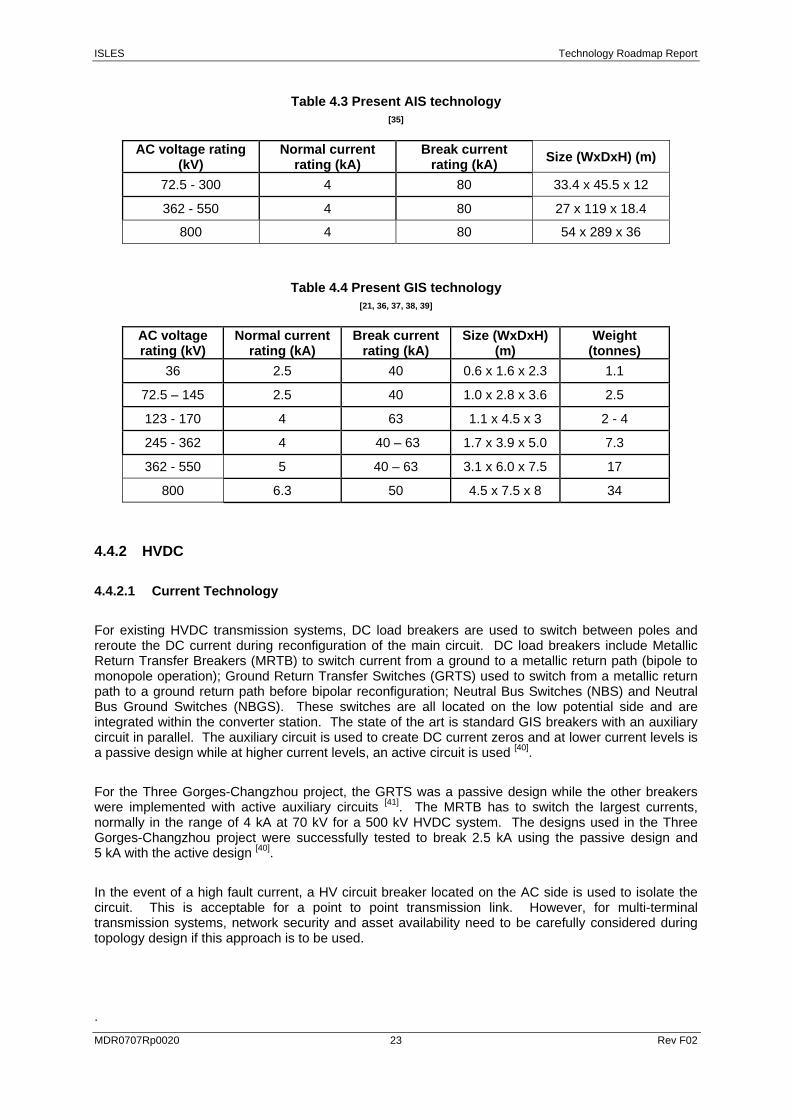
ISLES Technology Roadmap Report
MDR0707Rp0020 23 Rev F02
Table 4.3 Present AIS technology [35]
AC voltage rating (kV)
Normal current rating (kA)
Break current rating (kA) Size (WxDxH) (m)
72.5 - 300 4 80 33.4 x 45.5 x 12
362 - 550 4 80 27 x 119 x 18.4
800 4 80 54 x 289 x 36
Table 4.4 Present GIS technology [21, 36, 37, 38, 39]
AC voltage rating (kV)
Normal current rating (kA)
Break current rating (kA)
Size (WxDxH) (m)
Weight (tonnes)
36 2.5 40 0.6 x 1.6 x 2.3 1.1
72.5 – 145 2.5 40 1.0 x 2.8 x 3.6 2.5
123 - 170 4 63 1.1 x 4.5 x 3 2 - 4
245 - 362 4 40 – 63 1.7 x 3.9 x 5.0 7.3
362 - 550 5 40 – 63 3.1 x 6.0 x 7.5 17
800 6.3 50 4.5 x 7.5 x 8 34
4.4.2 HVDC
4.4.2.1 Current Technology
For existing HVDC transmission systems, DC load breakers are used to switch between poles and reroute the DC current during reconfiguration of the main circuit. DC load breakers include Metallic Return Transfer Breakers (MRTB) to switch current from a ground to a metallic return path (bipole to monopole operation); Ground Return Transfer Switches (GRTS) used to switch from a metallic return path to a ground return path before bipolar reconfiguration; Neutral Bus Switches (NBS) and Neutral Bus Ground Switches (NBGS). These switches are all located on the low potential side and are integrated within the converter station. The state of the art is standard GIS breakers with an auxiliary circuit in parallel. The auxiliary circuit is used to create DC current zeros and at lower current levels is a passive design while at higher current levels, an active circuit is used [40].
For the Three Gorges-Changzhou project, the GRTS was a passive design while the other breakers were implemented with active auxiliary circuits [41]. The MRTB has to switch the largest currents, normally in the range of 4 kA at 70 kV for a 500 kV HVDC system. The designs used in the Three Gorges-Changzhou project were successfully tested to break 2.5 kA using the passive design and 5 kA with the active design [40].
In the event of a high fault current, a HV circuit breaker located on the AC side is used to isolate the circuit. This is acceptable for a point to point transmission link. However, for multi-terminal transmission systems, network security and asset availability need to be carefully considered during topology design if this approach is to be used.
.
ISLES Technology Roadmap Report
MDR0707Rp0020 24 Rev F02
4.4.2.2 Future Technology
High power DC circuit breakers, operating on the high potential DC side of a converter are not yet available commercially. Electronic and mechanical solutions have been proposed [42]. Electronic solutions are based on IGBTs with devices capable of breaking 5 kA at 640 kV in 1 μs reported. The main challenges for electronic solutions are the high cost and power losses. Mechanical solutions are also proposed using similar designs to those used on the low potential site. The difficulty for these designs is the time taken to clear a fault, currently around 60ms [42]. One supplier indicated recently that DC circuit breakers fit for purpose in an offshore grid network will soon be available. However, these are likely to be heavy and costly, at least initially.
High rated DC circuit breakers will be required to implement future flexible multi-terminal HVDC networks. Using the current technology solution of AC circuit breakers on the AC side, the entire DC network must be switched out in order to isolate a fault occurring in a single DC transmission link which may significantly reduce reliability and compromise security for a fully meshed, multi-link network. One HVDC system provider has indicated that with full bridge converters, it would be possible to isolate only the faulted cable using DC load breakers. Until these products come to market, it is difficult to carry out an accurate cost-benefit analysis which would provide some insights into optimal system topology versus risk of generation loss.
4.5 TRANSFORMERS
4.5.1 HVAC
HVAC power transformers are a mature technology used extensively in the onshore transmission grid and in offshore wind farm substations located both offshore and at the onshore point of connection. Offshore power transformers step up the voltage level from wind turbine arrays (typically operated at 30 to 36 kV) to the export transmission voltage. At onshore substations, transformers step up or down for connection of offshore generation to the onshore transmission network.
Power transformers for offshore transmission applications are currently designed and manufactured to meet individual project specifications with little standardisation. For offshore wind platforms, transformers are generally two or three winding with one winding connected in a star configuration and another in a delta configuration to minimise harmonics. A typical offshore specification is 100 to 240 MVA based on existing and proposed designs; increasing roughly in parallel with offshore wind farm size. Relevant industry track record for power transformers is given in Table 4.5 and indicates that transformer electrical specifications are not expected to be a technology constraint for ISLES. Standardised, “off the shelf” 400 kV transformers are supplied to National Grid for the transmission network. Offshore transformer design could benefit from greater standardisation which would help improve spares strategies.
Transformers are the heaviest components on an offshore substation platform (up to a third of the total weight). A 90 MVA three-phase transformer typically weighs 150-160 tonnes for example and two transformers are required for redundancy for offshore wind farms larger than 90 MW according to NETS SQSS. Transformer weight scales roughly linearly with rated power and is a critical factor in offshore platform structural design and cost. Offshore transformers are usually slightly over-rated so that in the event of a fault or planned maintenance on one transformer, the other transformer can continue to operate at greater than 50% of the wind farm rating. It is also possible to overload the transformer to increase capacity further, however this reduces transformer lifetime.
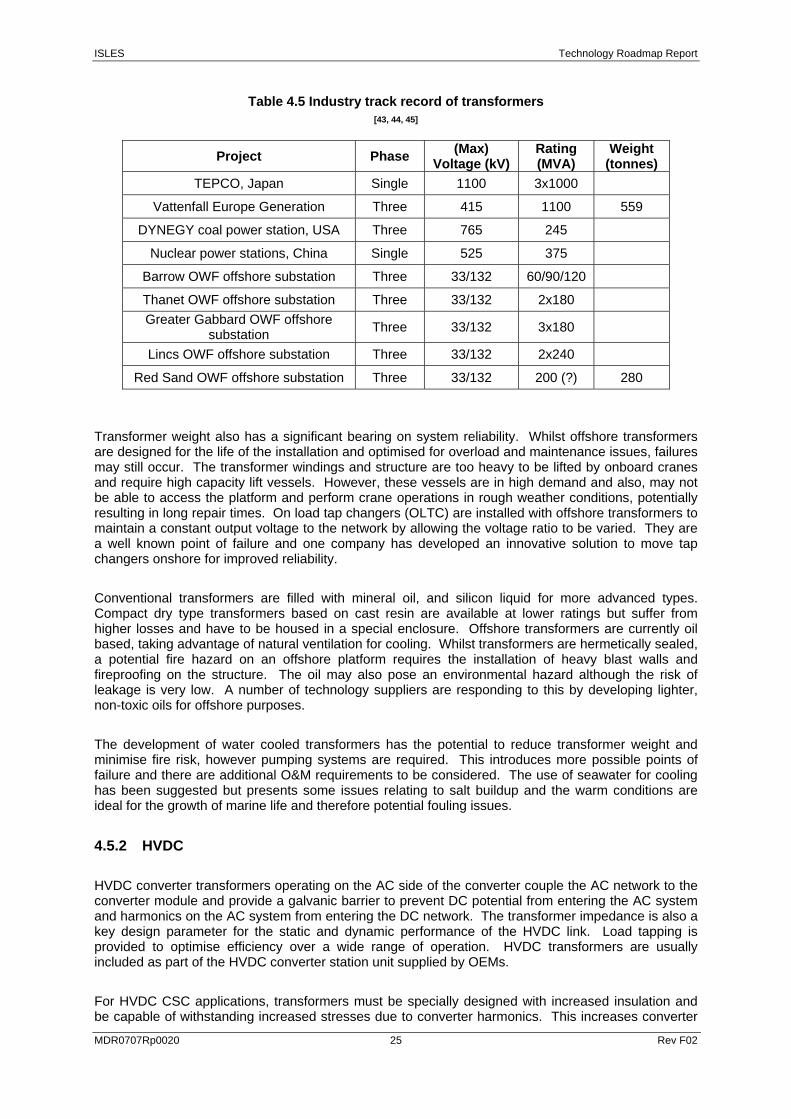
ISLES Technology Roadmap Report
MDR0707Rp0020 25 Rev F02
Table 4.5 Industry track record of transformers [43, 44, 45]
Project Phase (Max) Voltage (kV)
Rating (MVA)
Weight (tonnes)
TEPCO, Japan Single 1100 3x1000
Vattenfall Europe Generation Three 415 1100 559
DYNEGY coal power station, USA Three 765 245
Nuclear power stations, China Single 525 375
Barrow OWF offshore substation Three 33/132 60/90/120
Thanet OWF offshore substation Three 33/132 2x180 Greater Gabbard OWF offshore
substation Three 33/132 3x180
Lincs OWF offshore substation Three 33/132 2x240
Red Sand OWF offshore substation Three 33/132 200 (?) 280
Transformer weight also has a significant bearing on system reliability. Whilst offshore transformers are designed for the life of the installation and optimised for overload and maintenance issues, failures may still occur. The transformer windings and structure are too heavy to be lifted by onboard cranes and require high capacity lift vessels. However, these vessels are in high demand and also, may not be able to access the platform and perform crane operations in rough weather conditions, potentially resulting in long repair times. On load tap changers (OLTC) are installed with offshore transformers to maintain a constant output voltage to the network by allowing the voltage ratio to be varied. They are a well known point of failure and one company has developed an innovative solution to move tap changers onshore for improved reliability.
Conventional transformers are filled with mineral oil, and silicon liquid for more advanced types. Compact dry type transformers based on cast resin are available at lower ratings but suffer from higher losses and have to be housed in a special enclosure. Offshore transformers are currently oil based, taking advantage of natural ventilation for cooling. Whilst transformers are hermetically sealed, a potential fire hazard on an offshore platform requires the installation of heavy blast walls and fireproofing on the structure. The oil may also pose an environmental hazard although the risk of leakage is very low. A number of technology suppliers are responding to this by developing lighter, non-toxic oils for offshore purposes.
The development of water cooled transformers has the potential to reduce transformer weight and minimise fire risk, however pumping systems are required. This introduces more possible points of failure and there are additional O&M requirements to be considered. The use of seawater for cooling has been suggested but presents some issues relating to salt buildup and the warm conditions are ideal for the growth of marine life and therefore potential fouling issues.
4.5.2 HVDC
HVDC converter transformers operating on the AC side of the converter couple the AC network to the converter module and provide a galvanic barrier to prevent DC potential from entering the AC system and harmonics on the AC system from entering the DC network. The transformer impedance is also a key design parameter for the static and dynamic performance of the HVDC link. Load tapping is provided to optimise efficiency over a wide range of operation. HVDC transformers are usually included as part of the HVDC converter station unit supplied by OEMs.
For HVDC CSC applications, transformers must be specially designed with increased insulation and be capable of withstanding increased stresses due to converter harmonics. This increases converter
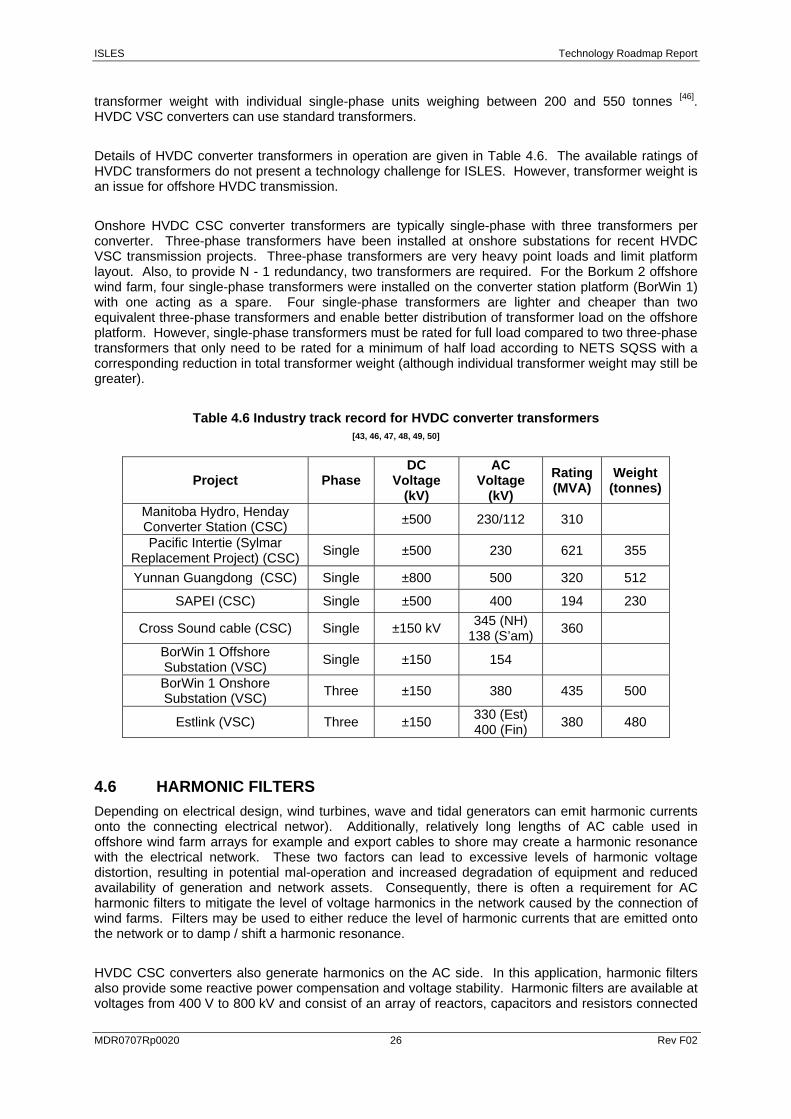
ISLES Technology Roadmap Report
MDR0707Rp0020 26 Rev F02
transformer weight with individual single-phase units weighing between 200 and 550 tonnes [46]. HVDC VSC converters can use standard transformers.
Details of HVDC converter transformers in operation are given in Table 4.6. The available ratings of HVDC transformers do not present a technology challenge for ISLES. However, transformer weight is an issue for offshore HVDC transmission.
Onshore HVDC CSC converter transformers are typically single-phase with three transformers per converter. Three-phase transformers have been installed at onshore substations for recent HVDC VSC transmission projects. Three-phase transformers are very heavy point loads and limit platform layout. Also, to provide N - 1 redundancy, two transformers are required. For the Borkum 2 offshore wind farm, four single-phase transformers were installed on the converter station platform (BorWin 1) with one acting as a spare. Four single-phase transformers are lighter and cheaper than two equivalent three-phase transformers and enable better distribution of transformer load on the offshore platform. However, single-phase transformers must be rated for full load compared to two three-phase transformers that only need to be rated for a minimum of half load according to NETS SQSS with a corresponding reduction in total transformer weight (although individual transformer weight may still be greater).
Table 4.6 Industry track record for HVDC converter transformers [43, 46, 47, 48, 49, 50]
Project Phase DC
Voltage (kV)
AC Voltage
(kV) Rating (MVA)
Weight (tonnes)
Manitoba Hydro, Henday Converter Station (CSC) ±500 230/112 310
Pacific Intertie (Sylmar Replacement Project) (CSC) Single ±500 230 621 355
Yunnan Guangdong (CSC) Single ±800 500 320 512
SAPEI (CSC) Single ±500 400 194 230
Cross Sound cable (CSC) Single ±150 kV 345 (NH) 138 (S’am) 360
BorWin 1 Offshore Substation (VSC) Single ±150 154
BorWin 1 Onshore Substation (VSC) Three ±150 380 435 500
Estlink (VSC) Three ±150 330 (Est) 400 (Fin) 380 480
4.6 HARMONIC FILTERS Depending on electrical design, wind turbines, wave and tidal generators can emit harmonic currents onto the connecting electrical networ). Additionally, relatively long lengths of AC cable used in offshore wind farm arrays for example and export cables to shore may create a harmonic resonance with the electrical network. These two factors can lead to excessive levels of harmonic voltage distortion, resulting in potential mal-operation and increased degradation of equipment and reduced availability of generation and network assets. Consequently, there is often a requirement for AC harmonic filters to mitigate the level of voltage harmonics in the network caused by the connection of wind farms. Filters may be used to either reduce the level of harmonic currents that are emitted onto the network or to damp / shift a harmonic resonance.
HVDC CSC converters also generate harmonics on the AC side. In this application, harmonic filters also provide some reactive power compensation and voltage stability. Harmonic filters are available at voltages from 400 V to 800 kV and consist of an array of reactors, capacitors and resistors connected
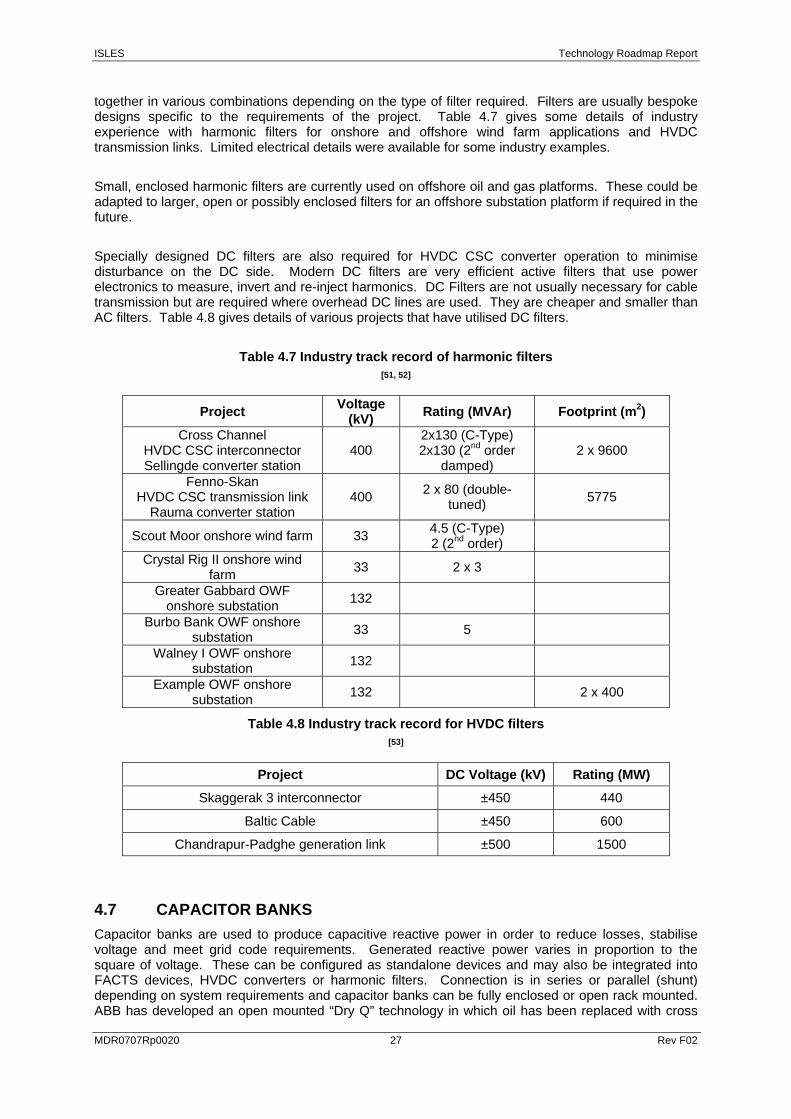
ISLES Technology Roadmap Report
MDR0707Rp0020 27 Rev F02
together in various combinations depending on the type of filter required. Filters are usually bespoke designs specific to the requirements of the project. Table 4.7 gives some details of industry experience with harmonic filters for onshore and offshore wind farm applications and HVDC transmission links. Limited electrical details were available for some industry examples.
Small, enclosed harmonic filters are currently used on offshore oil and gas platforms. These could be adapted to larger, open or possibly enclosed filters for an offshore substation platform if required in the future.
Specially designed DC filters are also required for HVDC CSC converter operation to minimise disturbance on the DC side. Modern DC filters are very efficient active filters that use power electronics to measure, invert and re-inject harmonics. DC Filters are not usually necessary for cable transmission but are required where overhead DC lines are used. They are cheaper and smaller than AC filters. Table 4.8 gives details of various projects that have utilised DC filters.
Table 4.7 Industry track record of harmonic filters [51, 52]
Project Voltage (kV) Rating (MVAr) Footprint (m2)
Cross Channel HVDC CSC interconnector Sellingde converter station
400 2x130 (C-Type) 2x130 (2nd order
damped) 2 x 9600
Fenno-Skan HVDC CSC transmission link
Rauma converter station 400 2 x 80 (double-
tuned) 5775
Scout Moor onshore wind farm 33 4.5 (C-Type) 2 (2nd order)
Crystal Rig II onshore wind farm 33 2 x 3
Greater Gabbard OWF onshore substation 132
Burbo Bank OWF onshore substation 33 5
Walney I OWF onshore substation 132
Example OWF onshore substation 132 2 x 400
Table 4.8 Industry track record for HVDC filters [53]
Project DC Voltage (kV) Rating (MW)
Skaggerak 3 interconnector ±450 440
Baltic Cable ±450 600
Chandrapur-Padghe generation link ±500 1500
4.7 CAPACITOR BANKS Capacitor banks are used to produce capacitive reactive power in order to reduce losses, stabilise voltage and meet grid code requirements. Generated reactive power varies in proportion to the square of voltage. These can be configured as standalone devices and may also be integrated into FACTS devices, HVDC converters or harmonic filters. Connection is in series or parallel (shunt) depending on system requirements and capacitor banks can be fully enclosed or open rack mounted. ABB has developed an open mounted “Dry Q” technology in which oil has been replaced with cross
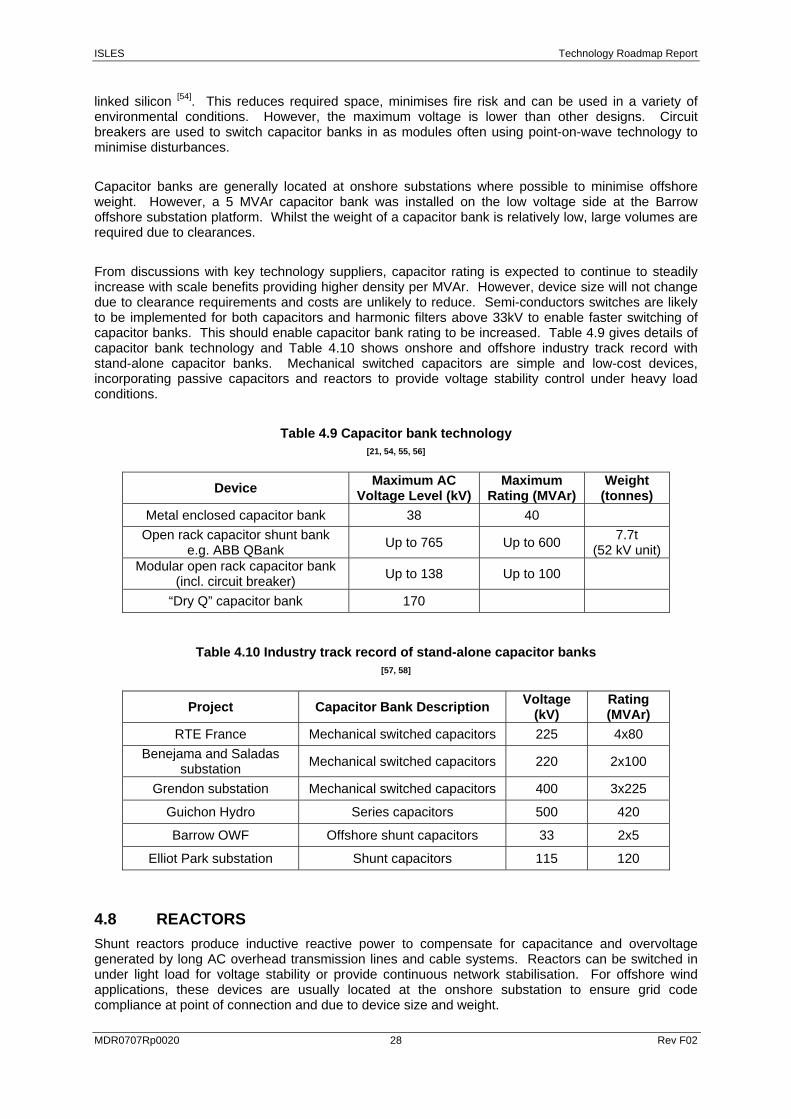
ISLES Technology Roadmap Report
MDR0707Rp0020 28 Rev F02
linked silicon [54]. This reduces required space, minimises fire risk and can be used in a variety of environmental conditions. However, the maximum voltage is lower than other designs. Circuit breakers are used to switch capacitor banks in as modules often using point-on-wave technology to minimise disturbances.
Capacitor banks are generally located at onshore substations where possible to minimise offshore weight. However, a 5 MVAr capacitor bank was installed on the low voltage side at the Barrow offshore substation platform. Whilst the weight of a capacitor bank is relatively low, large volumes are required due to clearances.
From discussions with key technology suppliers, capacitor rating is expected to continue to steadily increase with scale benefits providing higher density per MVAr. However, device size will not change due to clearance requirements and costs are unlikely to reduce. Semi-conductors switches are likely to be implemented for both capacitors and harmonic filters above 33kV to enable faster switching of capacitor banks. This should enable capacitor bank rating to be increased. Table 4.9 gives details of capacitor bank technology and Table 4.10 shows onshore and offshore industry track record with stand-alone capacitor banks. Mechanical switched capacitors are simple and low-cost devices, incorporating passive capacitors and reactors to provide voltage stability control under heavy load conditions.
Table 4.9 Capacitor bank technology [21, 54, 55, 56]
Device Maximum AC Voltage Level (kV)
Maximum Rating (MVAr)
Weight (tonnes)
Metal enclosed capacitor bank 38 40 Open rack capacitor shunt bank
e.g. ABB QBank Up to 765 Up to 600 7.7t (52 kV unit)
Modular open rack capacitor bank (incl. circuit breaker) Up to 138 Up to 100
“Dry Q” capacitor bank 170
Table 4.10 Industry track record of stand-alone capacitor banks [57, 58]
Project Capacitor Bank Description Voltage (kV)
Rating (MVAr)
RTE France Mechanical switched capacitors 225 4x80 Benejama and Saladas
substation Mechanical switched capacitors 220 2x100
Grendon substation Mechanical switched capacitors 400 3x225
Guichon Hydro Series capacitors 500 420
Barrow OWF Offshore shunt capacitors 33 2x5
Elliot Park substation Shunt capacitors 115 120
4.8 REACTORS Shunt reactors produce inductive reactive power to compensate for capacitance and overvoltage generated by long AC overhead transmission lines and cable systems. Reactors can be switched in under light load for voltage stability or provide continuous network stabilisation. For offshore wind applications, these devices are usually located at the onshore substation to ensure grid code compliance at point of connection and due to device size and weight.
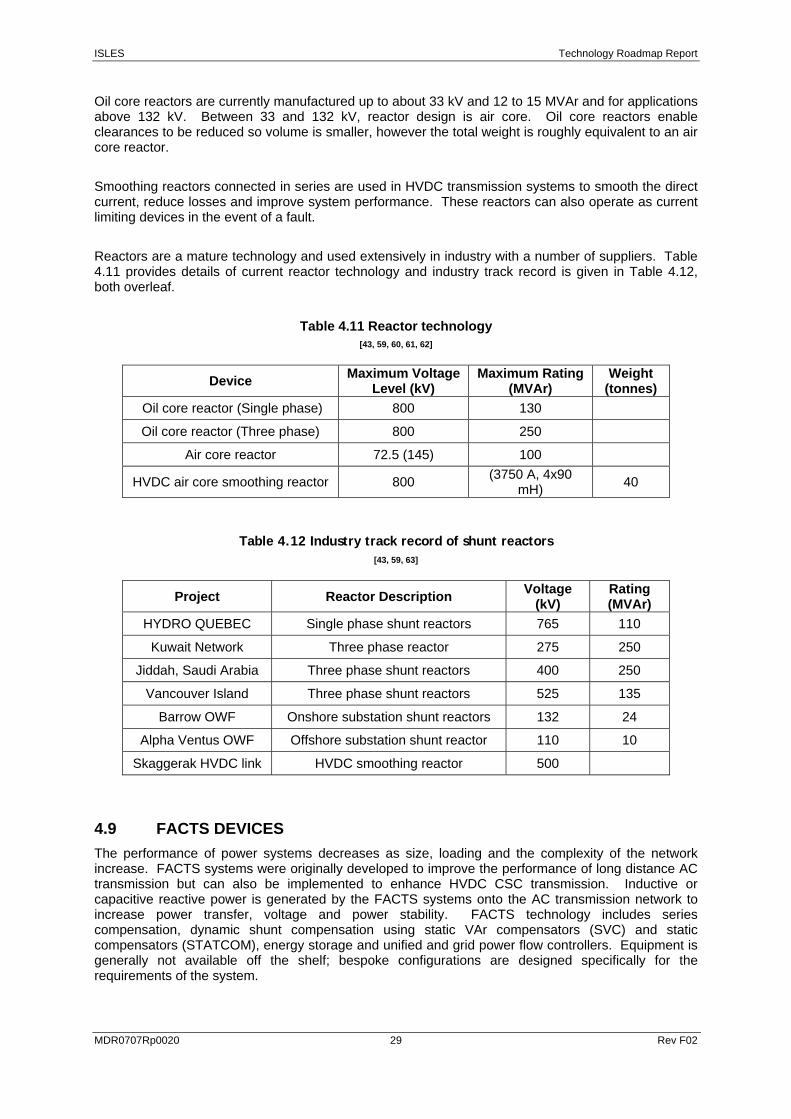
ISLES Technology Roadmap Report
MDR0707Rp0020 29 Rev F02
Oil core reactors are currently manufactured up to about 33 kV and 12 to 15 MVAr and for applications above 132 kV. Between 33 and 132 kV, reactor design is air core. Oil core reactors enable clearances to be reduced so volume is smaller, however the total weight is roughly equivalent to an air core reactor.
Smoothing reactors connected in series are used in HVDC transmission systems to smooth the direct current, reduce losses and improve system performance. These reactors can also operate as current limiting devices in the event of a fault.
Reactors are a mature technology and used extensively in industry with a number of suppliers. Table 4.11 provides details of current reactor technology and industry track record is given in Table 4.12, both overleaf.
Table 4.11 Reactor technology [43, 59, 60, 61, 62]
Device Maximum Voltage Level (kV)
Maximum Rating (MVAr)
Weight (tonnes)
Oil core reactor (Single phase) 800 130
Oil core reactor (Three phase) 800 250
Air core reactor 72.5 (145) 100
HVDC air core smoothing reactor 800 (3750 A, 4x90 mH) 40
Table 4.12 Industry track record of shunt reactors [43, 59, 63]
Project Reactor Description Voltage (kV)
Rating (MVAr)
HYDRO QUEBEC Single phase shunt reactors 765 110
Kuwait Network Three phase reactor 275 250
Jiddah, Saudi Arabia Three phase shunt reactors 400 250
Vancouver Island Three phase shunt reactors 525 135
Barrow OWF Onshore substation shunt reactors 132 24
Alpha Ventus OWF Offshore substation shunt reactor 110 10
Skaggerak HVDC link HVDC smoothing reactor 500
4.9 FACTS DEVICES The performance of power systems decreases as size, loading and the complexity of the network increase. FACTS systems were originally developed to improve the performance of long distance AC transmission but can also be implemented to enhance HVDC CSC transmission. Inductive or capacitive reactive power is generated by the FACTS systems onto the AC transmission network to increase power transfer, voltage and power stability. FACTS technology includes series compensation, dynamic shunt compensation using static VAr compensators (SVC) and static compensators (STATCOM), energy storage and unified and grid power flow controllers. Equipment is generally not available off the shelf; bespoke configurations are designed specifically for the requirements of the system.
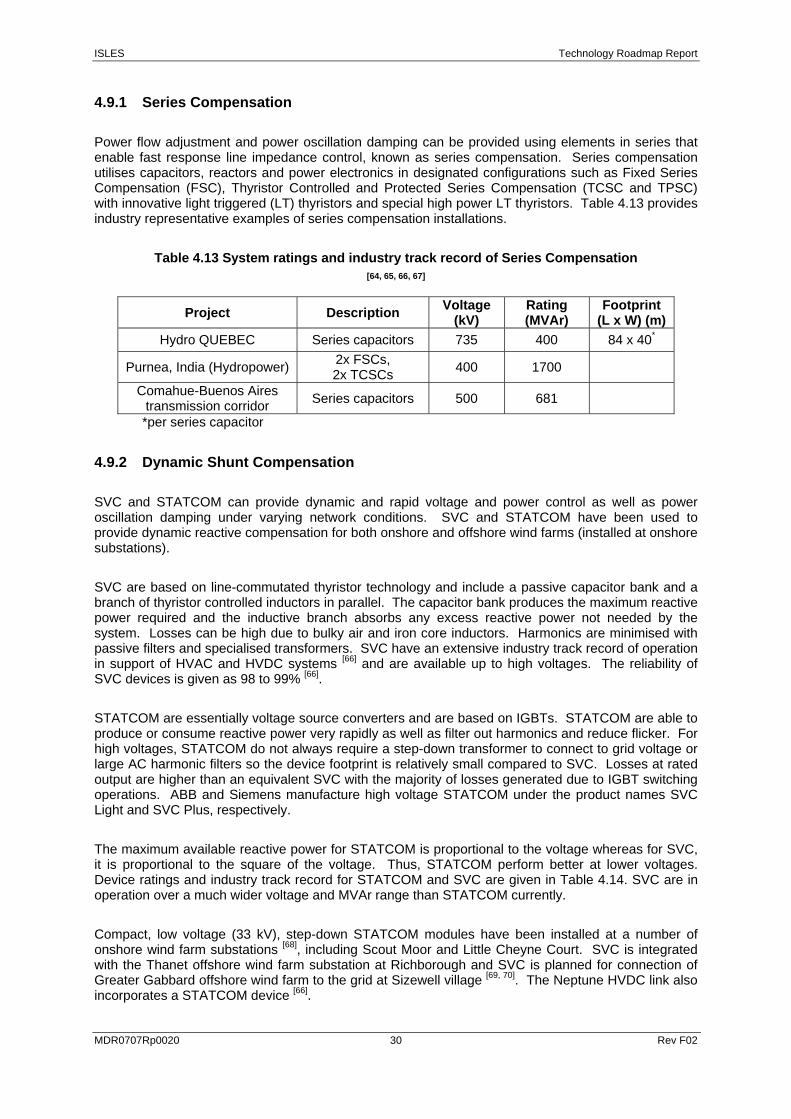
ISLES Technology Roadmap Report
MDR0707Rp0020 30 Rev F02
4.9.1 Series Compensation
Power flow adjustment and power oscillation damping can be provided using elements in series that enable fast response line impedance control, known as series compensation. Series compensation utilises capacitors, reactors and power electronics in designated configurations such as Fixed Series Compensation (FSC), Thyristor Controlled and Protected Series Compensation (TCSC and TPSC) with innovative light triggered (LT) thyristors and special high power LT thyristors. Table 4.13 provides industry representative examples of series compensation installations.
Table 4.13 System ratings and industry track record of Series Compensation [64, 65, 66, 67]
Project Description Voltage (kV)
Rating (MVAr)
Footprint (L x W) (m)
Hydro QUEBEC Series capacitors 735 400 84 x 40*
Purnea, India (Hydropower) 2x FSCs, 2x TCSCs 400 1700
Comahue-Buenos Aires transmission corridor Series capacitors 500 681
*per series capacitor
4.9.2 Dynamic Shunt Compensation
SVC and STATCOM can provide dynamic and rapid voltage and power control as well as power oscillation damping under varying network conditions. SVC and STATCOM have been used to provide dynamic reactive compensation for both onshore and offshore wind farms (installed at onshore substations).
SVC are based on line-commutated thyristor technology and include a passive capacitor bank and a branch of thyristor controlled inductors in parallel. The capacitor bank produces the maximum reactive power required and the inductive branch absorbs any excess reactive power not needed by the system. Losses can be high due to bulky air and iron core inductors. Harmonics are minimised with passive filters and specialised transformers. SVC have an extensive industry track record of operation in support of HVAC and HVDC systems [66] and are available up to high voltages. The reliability of SVC devices is given as 98 to 99% [66].
STATCOM are essentially voltage source converters and are based on IGBTs. STATCOM are able to produce or consume reactive power very rapidly as well as filter out harmonics and reduce flicker. For high voltages, STATCOM do not always require a step-down transformer to connect to grid voltage or large AC harmonic filters so the device footprint is relatively small compared to SVC. Losses at rated output are higher than an equivalent SVC with the majority of losses generated due to IGBT switching operations. ABB and Siemens manufacture high voltage STATCOM under the product names SVC Light and SVC Plus, respectively.
The maximum available reactive power for STATCOM is proportional to the voltage whereas for SVC, it is proportional to the square of the voltage. Thus, STATCOM perform better at lower voltages. Device ratings and industry track record for STATCOM and SVC are given in Table 4.14. SVC are in operation over a much wider voltage and MVAr range than STATCOM currently.
Compact, low voltage (33 kV), step-down STATCOM modules have been installed at a number of onshore wind farm substations [68], including Scout Moor and Little Cheyne Court. SVC is integrated with the Thanet offshore wind farm substation at Richborough and SVC is planned for connection of Greater Gabbard offshore wind farm to the grid at Sizewell village [69, 70]. The Neptune HVDC link also incorporates a STATCOM device [66].
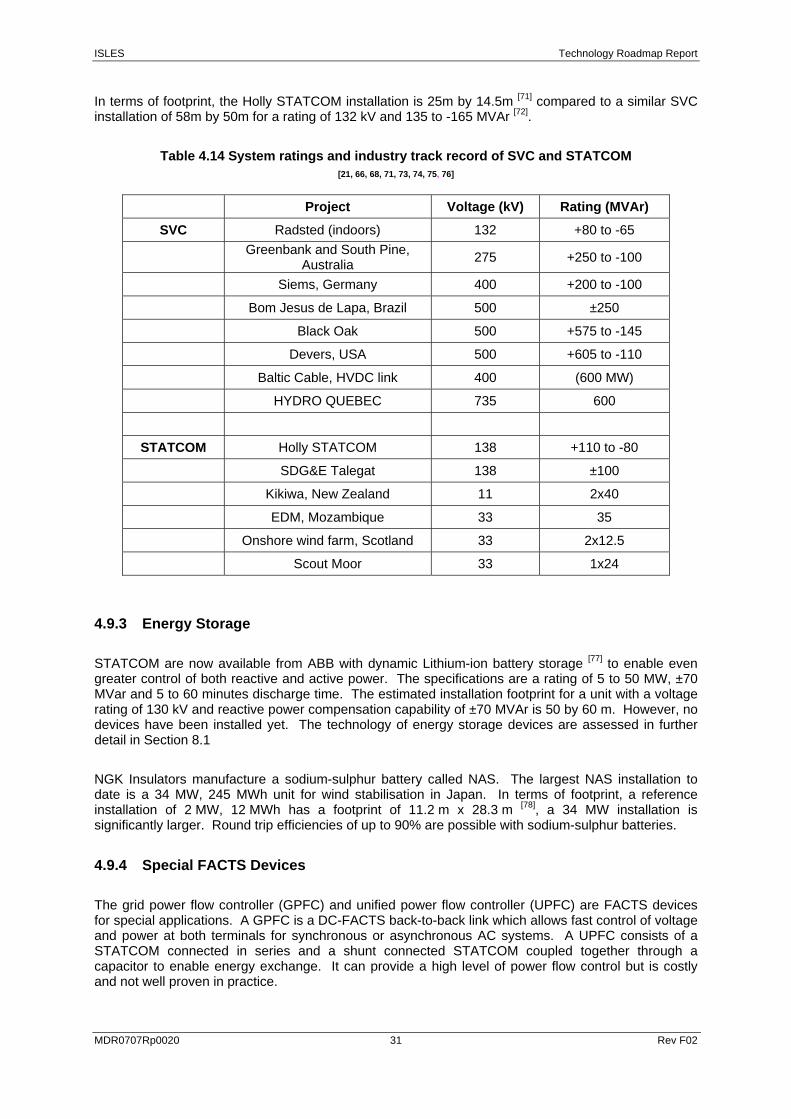
ISLES Technology Roadmap Report
MDR0707Rp0020 31 Rev F02
In terms of footprint, the Holly STATCOM installation is 25m by 14.5m [71] compared to a similar SVC installation of 58m by 50m for a rating of 132 kV and 135 to -165 MVAr [72].
Table 4.14 System ratings and industry track record of SVC and STATCOM [21, 66, 68, 71, 73, 74, 75, 76]
Project Voltage (kV) Rating (MVAr)
SVC Radsted (indoors) 132 +80 to -65
Greenbank and South Pine, Australia 275 +250 to -100
Siems, Germany 400 +200 to -100
Bom Jesus de Lapa, Brazil 500 ±250
Black Oak 500 +575 to -145
Devers, USA 500 +605 to -110
Baltic Cable, HVDC link 400 (600 MW)
HYDRO QUEBEC 735 600
STATCOM Holly STATCOM 138 +110 to -80
SDG&E Talegat 138 ±100
Kikiwa, New Zealand 11 2x40
EDM, Mozambique 33 35
Onshore wind farm, Scotland 33 2x12.5
Scout Moor 33 1x24
4.9.3 Energy Storage
STATCOM are now available from ABB with dynamic Lithium-ion battery storage [77] to enable even greater control of both reactive and active power. The specifications are a rating of 5 to 50 MW, ±70 MVar and 5 to 60 minutes discharge time. The estimated installation footprint for a unit with a voltage rating of 130 kV and reactive power compensation capability of ±70 MVAr is 50 by 60 m. However, no devices have been installed yet. The technology of energy storage devices are assessed in further detail in Section 8.1
NGK Insulators manufacture a sodium-sulphur battery called NAS. The largest NAS installation to date is a 34 MW, 245 MWh unit for wind stabilisation in Japan. In terms of footprint, a reference installation of 2 MW, 12 MWh has a footprint of 11.2 m x 28.3 m [78], a 34 MW installation is significantly larger. Round trip efficiencies of up to 90% are possible with sodium-sulphur batteries.
4.9.4 Special FACTS Devices
The grid power flow controller (GPFC) and unified power flow controller (UPFC) are FACTS devices for special applications. A GPFC is a DC-FACTS back-to-back link which allows fast control of voltage and power at both terminals for synchronous or asynchronous AC systems. A UPFC consists of a STATCOM connected in series and a shunt connected STATCOM coupled together through a capacitor to enable energy exchange. It can provide a high level of power flow control but is costly and not well proven in practice.
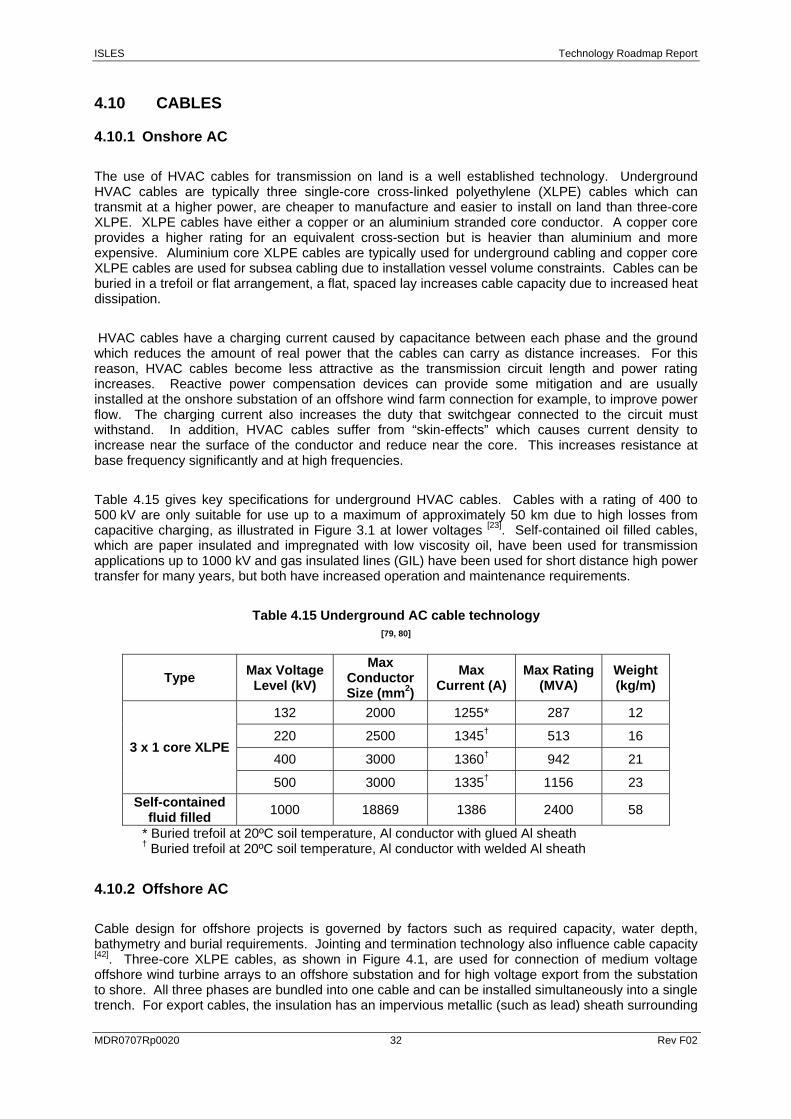
ISLES Technology Roadmap Report
MDR0707Rp0020 32 Rev F02
4.10 CABLES
4.10.1 Onshore AC
The use of HVAC cables for transmission on land is a well established technology. Underground HVAC cables are typically three single-core cross-linked polyethylene (XLPE) cables which can transmit at a higher power, are cheaper to manufacture and easier to install on land than three-core XLPE. XLPE cables have either a copper or an aluminium stranded core conductor. A copper core provides a higher rating for an equivalent cross-section but is heavier than aluminium and more expensive. Aluminium core XLPE cables are typically used for underground cabling and copper core XLPE cables are used for subsea cabling due to installation vessel volume constraints. Cables can be buried in a trefoil or flat arrangement, a flat, spaced lay increases cable capacity due to increased heat dissipation.
HVAC cables have a charging current caused by capacitance between each phase and the ground which reduces the amount of real power that the cables can carry as distance increases. For this reason, HVAC cables become less attractive as the transmission circuit length and power rating increases. Reactive power compensation devices can provide some mitigation and are usually installed at the onshore substation of an offshore wind farm connection for example, to improve power flow. The charging current also increases the duty that switchgear connected to the circuit must withstand. In addition, HVAC cables suffer from “skin-effects” which causes current density to increase near the surface of the conductor and reduce near the core. This increases resistance at base frequency significantly and at high frequencies.
Table 4.15 gives key specifications for underground HVAC cables. Cables with a rating of 400 to 500 kV are only suitable for use up to a maximum of approximately 50 km due to high losses from capacitive charging, as illustrated in Figure 3.1 at lower voltages [23]. Self-contained oil filled cables, which are paper insulated and impregnated with low viscosity oil, have been used for transmission applications up to 1000 kV and gas insulated lines (GIL) have been used for short distance high power transfer for many years, but both have increased operation and maintenance requirements.
Table 4.15 Underground AC cable technology [79, 80]
Type Max Voltage Level (kV)
Max Conductor Size (mm2)
Max Current (A)
Max Rating (MVA)
Weight (kg/m)
132 2000 1255* 287 12
220 2500 1345† 513 16
400 3000 1360† 942 21 3 x 1 core XLPE
500 3000 1335† 1156 23 Self-contained
fluid filled 1000 18869 1386 2400 58
* Buried trefoil at 20ºC soil temperature, Al conductor with glued Al sheath
† Buried trefoil at 20ºC soil temperature, Al conductor with welded Al sheath
4.10.2 Offshore AC
Cable design for offshore projects is governed by factors such as required capacity, water depth, bathymetry and burial requirements. Jointing and termination technology also influence cable capacity [42]. Three-core XLPE cables, as shown in Figure 4.1, are used for connection of medium voltage offshore wind turbine arrays to an offshore substation and for high voltage export from the substation to shore. All three phases are bundled into one cable and can be installed simultaneously into a single trench. For export cables, the insulation has an impervious metallic (such as lead) sheath surrounding
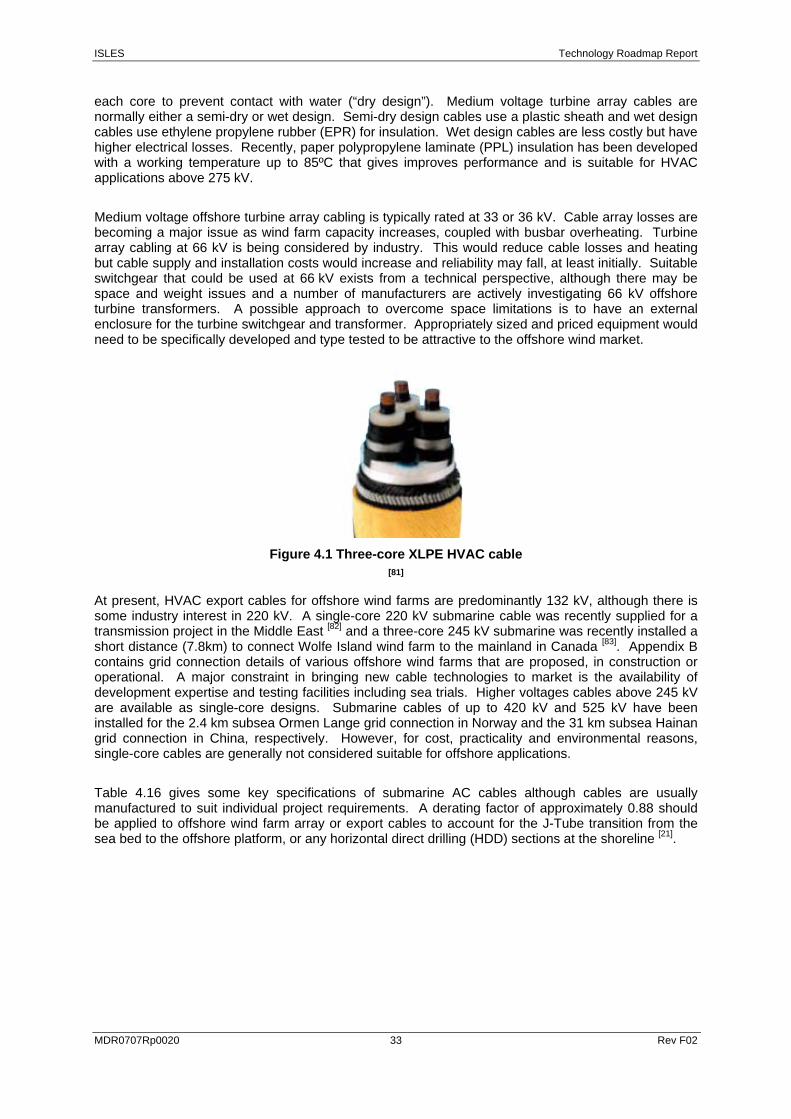
ISLES Technology Roadmap Report
MDR0707Rp0020 33 Rev F02
each core to prevent contact with water (“dry design”). Medium voltage turbine array cables are normally either a semi-dry or wet design. Semi-dry design cables use a plastic sheath and wet design cables use ethylene propylene rubber (EPR) for insulation. Wet design cables are less costly but have higher electrical losses. Recently, paper polypropylene laminate (PPL) insulation has been developed with a working temperature up to 85ºC that gives improves performance and is suitable for HVAC applications above 275 kV.
Medium voltage offshore turbine array cabling is typically rated at 33 or 36 kV. Cable array losses are becoming a major issue as wind farm capacity increases, coupled with busbar overheating. Turbine array cabling at 66 kV is being considered by industry. This would reduce cable losses and heating but cable supply and installation costs would increase and reliability may fall, at least initially. Suitable switchgear that could be used at 66 kV exists from a technical perspective, although there may be space and weight issues and a number of manufacturers are actively investigating 66 kV offshore turbine transformers. A possible approach to overcome space limitations is to have an external enclosure for the turbine switchgear and transformer. Appropriately sized and priced equipment would need to be specifically developed and type tested to be attractive to the offshore wind market.
Figure 4.1 Three-core XLPE HVAC cable [81]
At present, HVAC export cables for offshore wind farms are predominantly 132 kV, although there is some industry interest in 220 kV. A single-core 220 kV submarine cable was recently supplied for a transmission project in the Middle East [82] and a three-core 245 kV submarine was recently installed a short distance (7.8km) to connect Wolfe Island wind farm to the mainland in Canada [83]. Appendix B contains grid connection details of various offshore wind farms that are proposed, in construction or operational. A major constraint in bringing new cable technologies to market is the availability of development expertise and testing facilities including sea trials. Higher voltages cables above 245 kV are available as single-core designs. Submarine cables of up to 420 kV and 525 kV have been installed for the 2.4 km subsea Ormen Lange grid connection in Norway and the 31 km subsea Hainan grid connection in China, respectively. However, for cost, practicality and environmental reasons, single-core cables are generally not considered suitable for offshore applications.
Table 4.16 gives some key specifications of submarine AC cables although cables are usually manufactured to suit individual project requirements. A derating factor of approximately 0.88 should be applied to offshore wind farm array or export cables to account for the J-Tube transition from the sea bed to the offshore platform, or any horizontal direct drilling (HDD) sections at the shoreline [21].
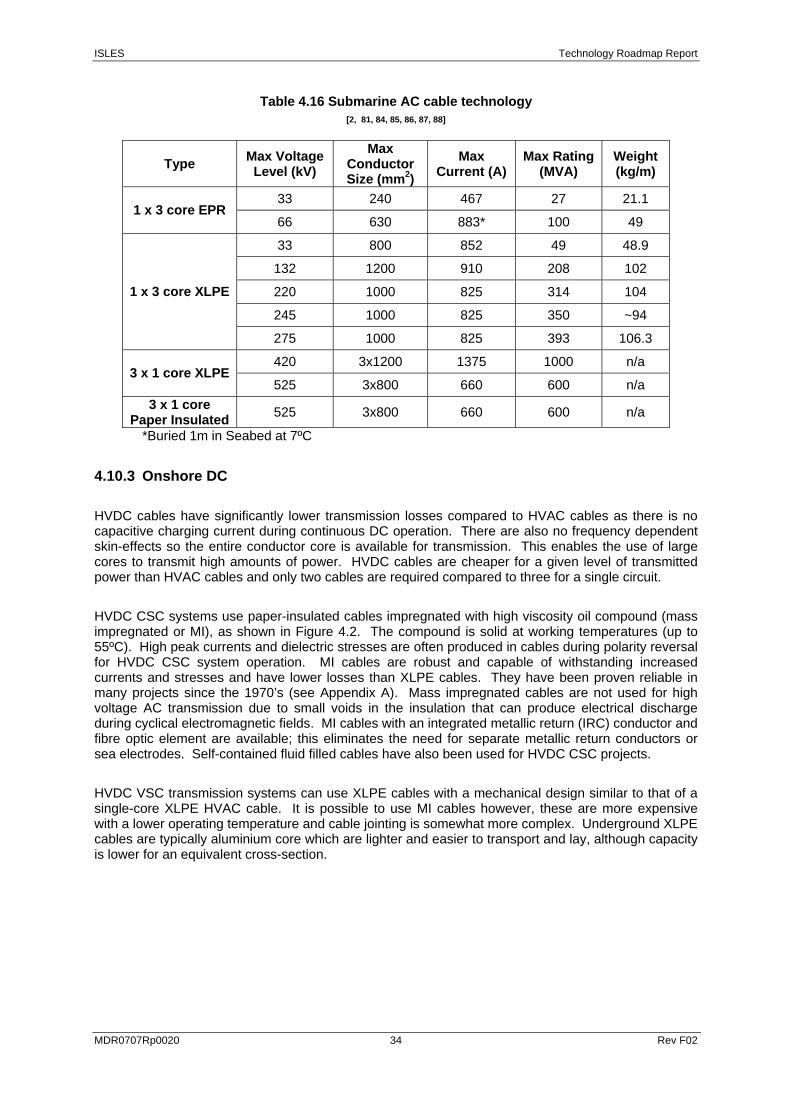
ISLES Technology Roadmap Report
MDR0707Rp0020 34 Rev F02
Table 4.16 Submarine AC cable technology [2, 81, 84, 85, 86, 87, 88]
Type Max Voltage Level (kV)
Max Conductor Size (mm2)
Max Current (A)
Max Rating (MVA)
Weight (kg/m)
33 240 467 27 21.1 1 x 3 core EPR
66 630 883* 100 49
33 800 852 49 48.9
132 1200 910 208 102
220 1000 825 314 104
245 1000 825 350 ~94
1 x 3 core XLPE
275 1000 825 393 106.3
420 3x1200 1375 1000 n/a 3 x 1 core XLPE
525 3x800 660 600 n/a 3 x 1 core
Paper Insulated 525 3x800 660 600 n/a
*Buried 1m in Seabed at 7ºC
4.10.3 Onshore DC
HVDC cables have significantly lower transmission losses compared to HVAC cables as there is no capacitive charging current during continuous DC operation. There are also no frequency dependent skin-effects so the entire conductor core is available for transmission. This enables the use of large cores to transmit high amounts of power. HVDC cables are cheaper for a given level of transmitted power than HVAC cables and only two cables are required compared to three for a single circuit.
HVDC CSC systems use paper-insulated cables impregnated with high viscosity oil compound (mass impregnated or MI), as shown in Figure 4.2. The compound is solid at working temperatures (up to 55ºC). High peak currents and dielectric stresses are often produced in cables during polarity reversal for HVDC CSC system operation. MI cables are robust and capable of withstanding increased currents and stresses and have lower losses than XLPE cables. They have been proven reliable in many projects since the 1970’s (see Appendix A). Mass impregnated cables are not used for high voltage AC transmission due to small voids in the insulation that can produce electrical discharge during cyclical electromagnetic fields. MI cables with an integrated metallic return (IRC) conductor and fibre optic element are available; this eliminates the need for separate metallic return conductors or sea electrodes. Self-contained fluid filled cables have also been used for HVDC CSC projects.
HVDC VSC transmission systems can use XLPE cables with a mechanical design similar to that of a single-core XLPE HVAC cable. It is possible to use MI cables however, these are more expensive with a lower operating temperature and cable jointing is somewhat more complex. Underground XLPE cables are typically aluminium core which are lighter and easier to transport and lay, although capacity is lower for an equivalent cross-section.
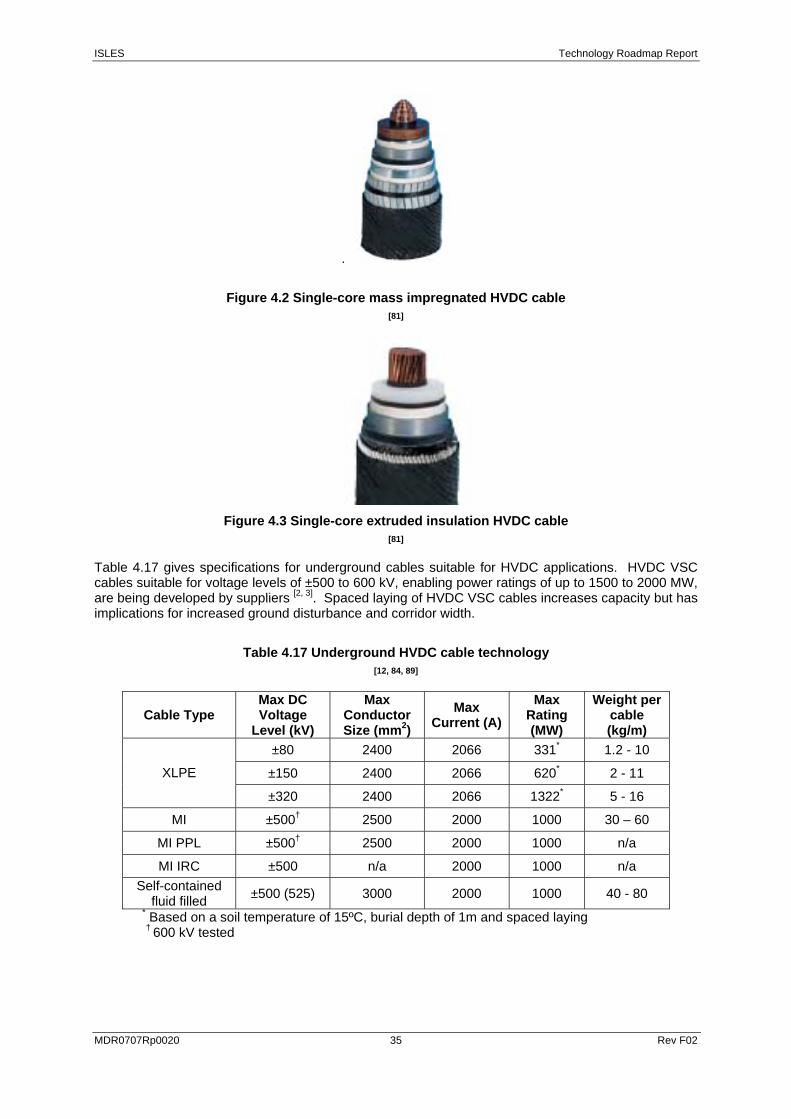
ISLES Technology Roadmap Report
MDR0707Rp0020 35 Rev F02
.
Figure 4.2 Single-core mass impregnated HVDC cable [81]
Figure 4.3 Single-core extruded insulation HVDC cable [81]
Table 4.17 gives specifications for underground cables suitable for HVDC applications. HVDC VSC cables suitable for voltage levels of ±500 to 600 kV, enabling power ratings of up to 1500 to 2000 MW, are being developed by suppliers [2, 3]. Spaced laying of HVDC VSC cables increases capacity but has implications for increased ground disturbance and corridor width.
Table 4.17 Underground HVDC cable technology [12, 84, 89]
Cable Type Max DC Voltage
Level (kV)
Max Conductor Size (mm2)
Max Current (A)
Max Rating (MW)
Weight per cable (kg/m)
±80 2400 2066 331* 1.2 - 10
±150 2400 2066 620* 2 - 11 XLPE
±320 2400 2066 1322* 5 - 16
MI ±500† 2500 2000 1000 30 – 60
MI PPL ±500† 2500 2000 1000 n/a
MI IRC ±500 n/a 2000 1000 n/a Self-contained
fluid filled ±500 (525) 3000 2000 1000 40 - 80 * Based on a soil temperature of 15ºC, burial depth of 1m and spaced laying
† 600 kV tested
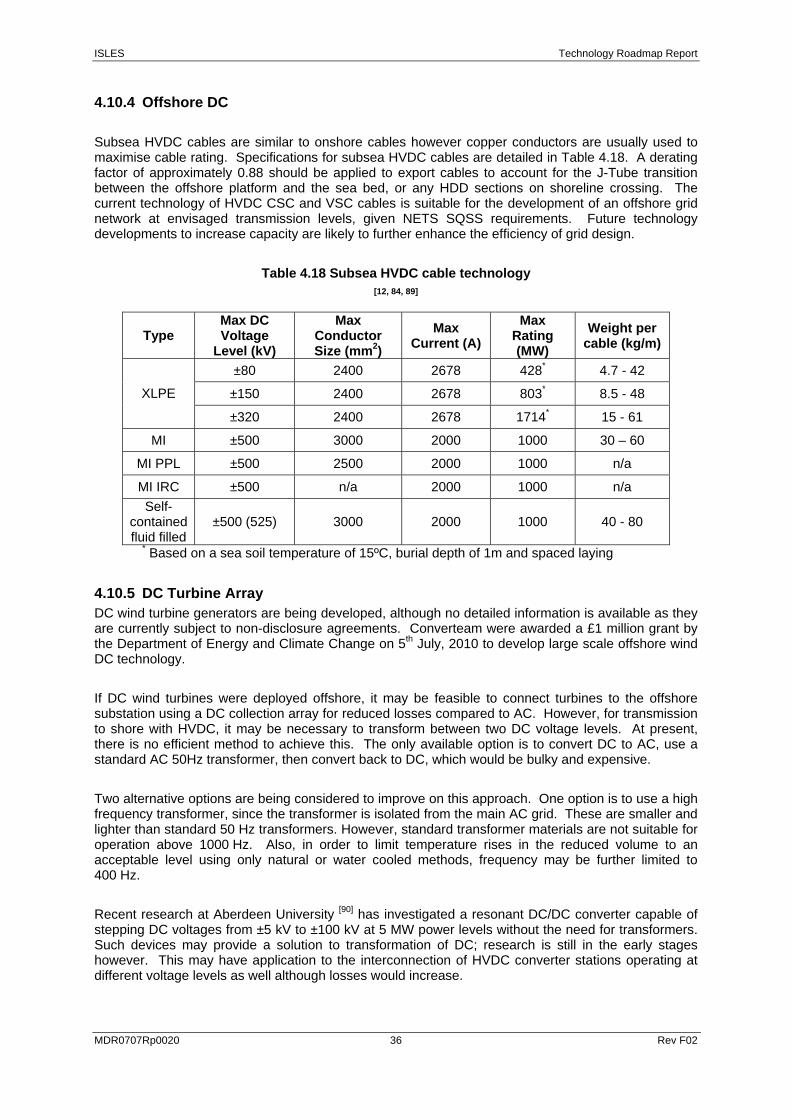
ISLES Technology Roadmap Report
MDR0707Rp0020 36 Rev F02
4.10.4 Offshore DC
Subsea HVDC cables are similar to onshore cables however copper conductors are usually used to maximise cable rating. Specifications for subsea HVDC cables are detailed in Table 4.18. A derating factor of approximately 0.88 should be applied to export cables to account for the J-Tube transition between the offshore platform and the sea bed, or any HDD sections on shoreline crossing. The current technology of HVDC CSC and VSC cables is suitable for the development of an offshore grid network at envisaged transmission levels, given NETS SQSS requirements. Future technology developments to increase capacity are likely to further enhance the efficiency of grid design.
Table 4.18 Subsea HVDC cable technology [12, 84, 89]
Type Max DC Voltage
Level (kV)
Max Conductor Size (mm2)
Max Current (A)
Max Rating (MW)
Weight per cable (kg/m)
±80 2400 2678 428* 4.7 - 42
±150 2400 2678 803* 8.5 - 48 XLPE
±320 2400 2678 1714* 15 - 61
MI ±500 3000 2000 1000 30 – 60
MI PPL ±500 2500 2000 1000 n/a
MI IRC ±500 n/a 2000 1000 n/a Self-
contained fluid filled
±500 (525) 3000 2000 1000 40 - 80
* Based on a sea soil temperature of 15ºC, burial depth of 1m and spaced laying
4.10.5 DC Turbine Array DC wind turbine generators are being developed, although no detailed information is available as they are currently subject to non-disclosure agreements. Converteam were awarded a £1 million grant by the Department of Energy and Climate Change on 5th July, 2010 to develop large scale offshore wind DC technology.
If DC wind turbines were deployed offshore, it may be feasible to connect turbines to the offshore substation using a DC collection array for reduced losses compared to AC. However, for transmission to shore with HVDC, it may be necessary to transform between two DC voltage levels. At present, there is no efficient method to achieve this. The only available option is to convert DC to AC, use a standard AC 50Hz transformer, then convert back to DC, which would be bulky and expensive.
Two alternative options are being considered to improve on this approach. One option is to use a high frequency transformer, since the transformer is isolated from the main AC grid. These are smaller and lighter than standard 50 Hz transformers. However, standard transformer materials are not suitable for operation above 1000 Hz. Also, in order to limit temperature rises in the reduced volume to an acceptable level using only natural or water cooled methods, frequency may be further limited to 400 Hz.
Recent research at Aberdeen University [90] has investigated a resonant DC/DC converter capable of stepping DC voltages from ±5 kV to ±100 kV at 5 MW power levels without the need for transformers. Such devices may provide a solution to transformation of DC; research is still in the early stages however. This may have application to the interconnection of HVDC converter stations operating at different voltage levels as well although losses would increase.
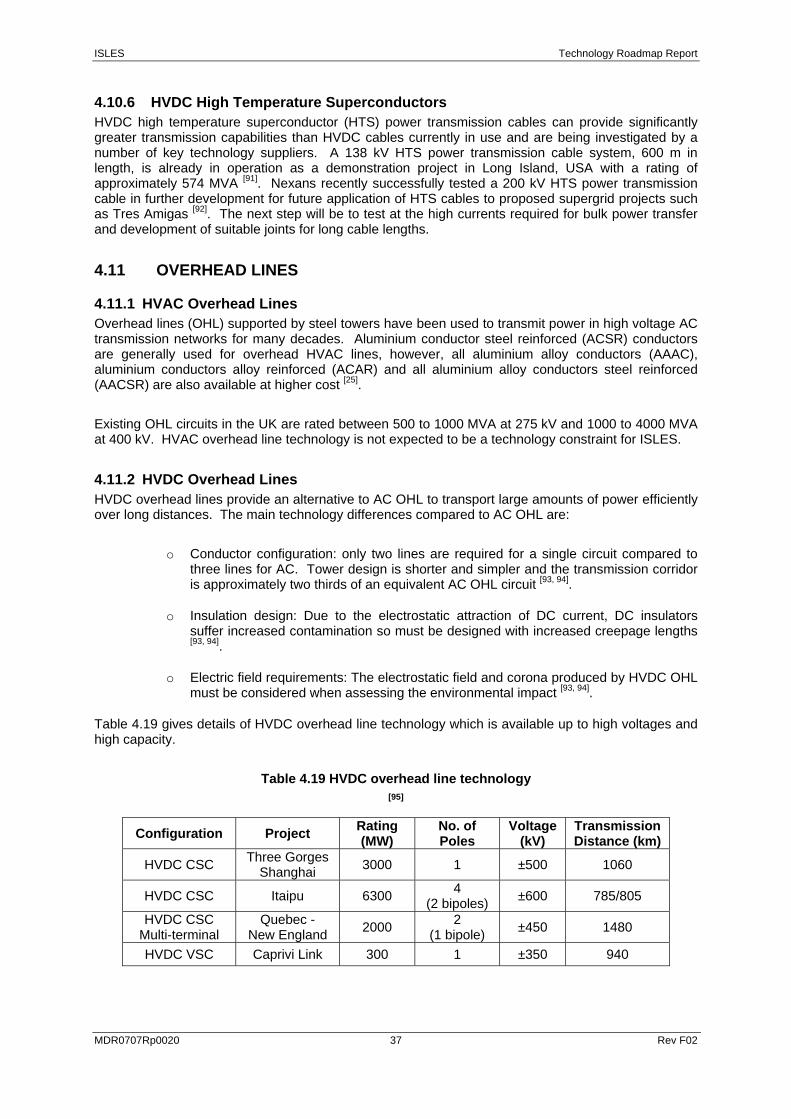
ISLES Technology Roadmap Report
MDR0707Rp0020 37 Rev F02
4.10.6 HVDC High Temperature Superconductors HVDC high temperature superconductor (HTS) power transmission cables can provide significantly greater transmission capabilities than HVDC cables currently in use and are being investigated by a number of key technology suppliers. A 138 kV HTS power transmission cable system, 600 m in length, is already in operation as a demonstration project in Long Island, USA with a rating of approximately 574 MVA [91]. Nexans recently successfully tested a 200 kV HTS power transmission cable in further development for future application of HTS cables to proposed supergrid projects such as Tres Amigas [92]. The next step will be to test at the high currents required for bulk power transfer and development of suitable joints for long cable lengths.
4.11 OVERHEAD LINES
4.11.1 HVAC Overhead Lines Overhead lines (OHL) supported by steel towers have been used to transmit power in high voltage AC transmission networks for many decades. Aluminium conductor steel reinforced (ACSR) conductors are generally used for overhead HVAC lines, however, all aluminium alloy conductors (AAAC), aluminium conductors alloy reinforced (ACAR) and all aluminium alloy conductors steel reinforced (AACSR) are also available at higher cost [25].
Existing OHL circuits in the UK are rated between 500 to 1000 MVA at 275 kV and 1000 to 4000 MVA at 400 kV. HVAC overhead line technology is not expected to be a technology constraint for ISLES.
4.11.2 HVDC Overhead Lines HVDC overhead lines provide an alternative to AC OHL to transport large amounts of power efficiently over long distances. The main technology differences compared to AC OHL are:
o Conductor configuration: only two lines are required for a single circuit compared to three lines for AC. Tower design is shorter and simpler and the transmission corridor is approximately two thirds of an equivalent AC OHL circuit [93, 94].
o Insulation design: Due to the electrostatic attraction of DC current, DC insulators suffer increased contamination so must be designed with increased creepage lengths [93, 94].
o Electric field requirements: The electrostatic field and corona produced by HVDC OHL must be considered when assessing the environmental impact [93, 94].
Table 4.19 gives details of HVDC overhead line technology which is available up to high voltages and high capacity.
Table 4.19 HVDC overhead line technology [95]
Configuration Project Rating (MW)
No. of Poles
Voltage (kV)
Transmission Distance (km)
HVDC CSC Three Gorges Shanghai 3000 1 ±500 1060
HVDC CSC Itaipu 6300 4 (2 bipoles) ±600 785/805
HVDC CSC Multi-terminal
Quebec - New England 2000 2
(1 bipole) ±450 1480
HVDC VSC Caprivi Link 300 1 ±350 940
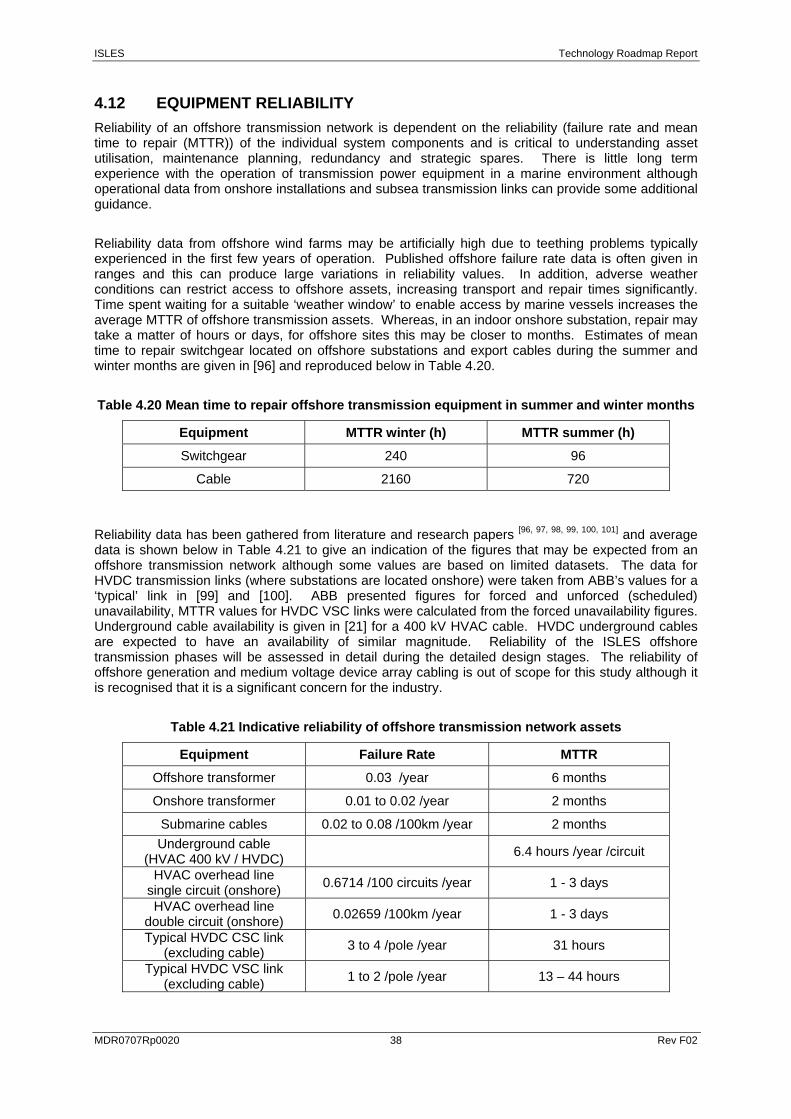
ISLES Technology Roadmap Report
MDR0707Rp0020 38 Rev F02
4.12 EQUIPMENT RELIABILITY Reliability of an offshore transmission network is dependent on the reliability (failure rate and mean time to repair (MTTR)) of the individual system components and is critical to understanding asset utilisation, maintenance planning, redundancy and strategic spares. There is little long term experience with the operation of transmission power equipment in a marine environment although operational data from onshore installations and subsea transmission links can provide some additional guidance.
Reliability data from offshore wind farms may be artificially high due to teething problems typically experienced in the first few years of operation. Published offshore failure rate data is often given in ranges and this can produce large variations in reliability values. In addition, adverse weather conditions can restrict access to offshore assets, increasing transport and repair times significantly. Time spent waiting for a suitable ‘weather window’ to enable access by marine vessels increases the average MTTR of offshore transmission assets. Whereas, in an indoor onshore substation, repair may take a matter of hours or days, for offshore sites this may be closer to months. Estimates of mean time to repair switchgear located on offshore substations and export cables during the summer and winter months are given in [96] and reproduced below in Table 4.20.
Table 4.20 Mean time to repair offshore transmission equipment in summer and winter months
Equipment MTTR winter (h) MTTR summer (h)
Switchgear 240 96
Cable 2160 720
Reliability data has been gathered from literature and research papers [96, 97, 98, 99, 100, 101] and average data is shown below in Table 4.21 to give an indication of the figures that may be expected from an offshore transmission network although some values are based on limited datasets. The data for HVDC transmission links (where substations are located onshore) were taken from ABB’s values for a ‘typical’ link in [99] and [100]. ABB presented figures for forced and unforced (scheduled) unavailability, MTTR values for HVDC VSC links were calculated from the forced unavailability figures. Underground cable availability is given in [21] for a 400 kV HVAC cable. HVDC underground cables are expected to have an availability of similar magnitude. Reliability of the ISLES offshore transmission phases will be assessed in detail during the detailed design stages. The reliability of offshore generation and medium voltage device array cabling is out of scope for this study although it is recognised that it is a significant concern for the industry.
Table 4.21 Indicative reliability of offshore transmission network assets
Equipment Failure Rate MTTR
Offshore transformer 0.03 /year 6 months
Onshore transformer 0.01 to 0.02 /year 2 months
Submarine cables 0.02 to 0.08 /100km /year 2 months Underground cable
(HVAC 400 kV / HVDC) 6.4 hours /year /circuit
HVAC overhead line single circuit (onshore) 0.6714 /100 circuits /year 1 - 3 days
HVAC overhead line double circuit (onshore) 0.02659 /100km /year 1 - 3 days
Typical HVDC CSC link (excluding cable) 3 to 4 /pole /year 31 hours
Typical HVDC VSC link (excluding cable) 1 to 2 /pole /year 13 – 44 hours
ISLES Technology Roadmap Report
MDR0707Rp0020 39 Rev F02
4.12.1 Maintenance and Repair Typically, maintenance costs for offshore substations are significantly higher than onshore and inability to access equipment for maintenance and repair/replacement in bad weather has major implications for offshore transmission system reliability. Therefore, it is important to design an offshore transmission network such as ISLES for minimal and cost-effective maintenance by;
o Keeping offshore platform equipment to a minimum through detailed engineering design at front-end. There are significant financial incentives to keeping the platform as light as possible.
o Eliminating or reducing the requirement for maintenance where possible by using maintenance free XLPE cables and natural ventilation, for example.
o Avoiding the requirement for specialised heavy lift crane vessels where possible (with the exception of transformers which are the heaviest equipment on an offshore platform).
o Maintaining an onboard or portside stock of strategic spares.
o Design to enable maintenance and repair to be carried out as quickly, safely and easily as possible. It may not be possible to deactivate all offshore substation circuits during maintenance and repair and safe live repair working procedures may need to be applied.
o Utilising remote condition monitoring for surveillance and informing maintenance schedule.
There is currently only short term refuge accommodation on offshore platforms for personnel caught in the event of a storm. As platforms move further offshore and boat transit times increase, installation of more permanent accommodation and heli-decks will allow personnel to remain on the platform for longer, resulting in more efficient maintenance programmes.
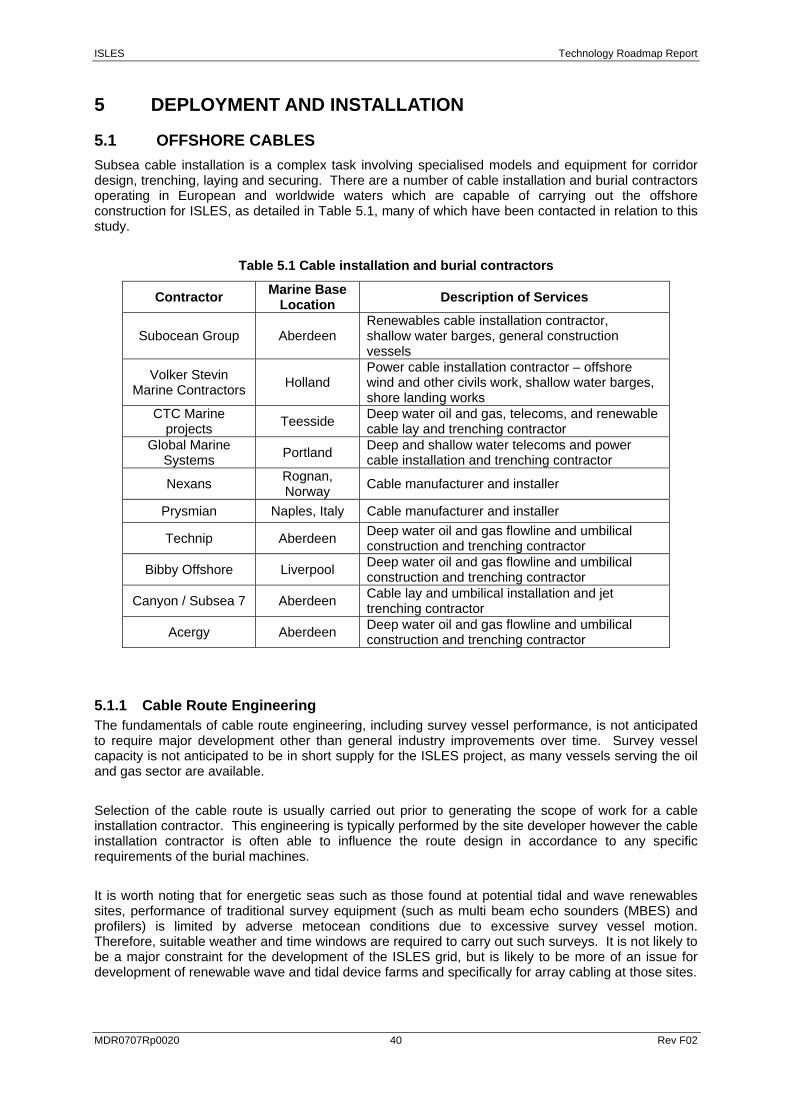
ISLES Technology Roadmap Report
MDR0707Rp0020 40 Rev F02
5 DEPLOYMENT AND INSTALLATION
5.1 OFFSHORE CABLES Subsea cable installation is a complex task involving specialised models and equipment for corridor design, trenching, laying and securing. There are a number of cable installation and burial contractors operating in European and worldwide waters which are capable of carrying out the offshore construction for ISLES, as detailed in Table 5.1, many of which have been contacted in relation to this study.
Table 5.1 Cable installation and burial contractors
Contractor Marine Base Location Description of Services
Subocean Group Aberdeen Renewables cable installation contractor, shallow water barges, general construction vessels
Volker Stevin Marine Contractors Holland
Power cable installation contractor – offshore wind and other civils work, shallow water barges, shore landing works
CTC Marine projects Teesside Deep water oil and gas, telecoms, and renewable
cable lay and trenching contractor Global Marine
Systems Portland Deep and shallow water telecoms and power cable installation and trenching contractor
Nexans Rognan, Norway Cable manufacturer and installer
Prysmian Naples, Italy Cable manufacturer and installer
Technip Aberdeen Deep water oil and gas flowline and umbilical construction and trenching contractor
Bibby Offshore Liverpool Deep water oil and gas flowline and umbilical construction and trenching contractor
Canyon / Subsea 7 Aberdeen Cable lay and umbilical installation and jet trenching contractor
Acergy Aberdeen Deep water oil and gas flowline and umbilical construction and trenching contractor
5.1.1 Cable Route Engineering The fundamentals of cable route engineering, including survey vessel performance, is not anticipated to require major development other than general industry improvements over time. Survey vessel capacity is not anticipated to be in short supply for the ISLES project, as many vessels serving the oil and gas sector are available.
Selection of the cable route is usually carried out prior to generating the scope of work for a cable installation contractor. This engineering is typically performed by the site developer however the cable installation contractor is often able to influence the route design in accordance to any specific requirements of the burial machines.
It is worth noting that for energetic seas such as those found at potential tidal and wave renewables sites, performance of traditional survey equipment (such as multi beam echo sounders (MBES) and profilers) is limited by adverse metocean conditions due to excessive survey vessel motion. Therefore, suitable weather and time windows are required to carry out such surveys. It is not likely to be a major constraint for the development of the ISLES grid, but is likely to be more of an issue for development of renewable wave and tidal device farms and specifically for array cabling at those sites.
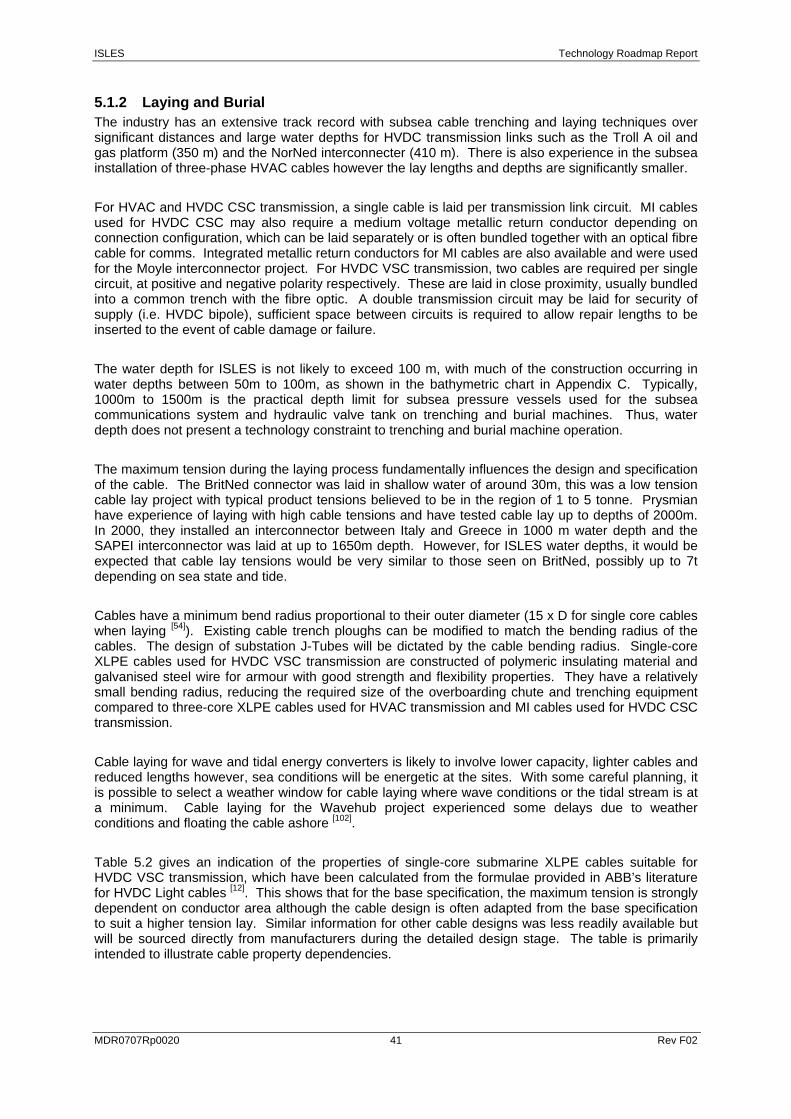
ISLES Technology Roadmap Report
MDR0707Rp0020 41 Rev F02
5.1.2 Laying and Burial The industry has an extensive track record with subsea cable trenching and laying techniques over significant distances and large water depths for HVDC transmission links such as the Troll A oil and gas platform (350 m) and the NorNed interconnecter (410 m). There is also experience in the subsea installation of three-phase HVAC cables however the lay lengths and depths are significantly smaller.
For HVAC and HVDC CSC transmission, a single cable is laid per transmission link circuit. MI cables used for HVDC CSC may also require a medium voltage metallic return conductor depending on connection configuration, which can be laid separately or is often bundled together with an optical fibre cable for comms. Integrated metallic return conductors for MI cables are also available and were used for the Moyle interconnector project. For HVDC VSC transmission, two cables are required per single circuit, at positive and negative polarity respectively. These are laid in close proximity, usually bundled into a common trench with the fibre optic. A double transmission circuit may be laid for security of supply (i.e. HVDC bipole), sufficient space between circuits is required to allow repair lengths to be inserted to the event of cable damage or failure.
The water depth for ISLES is not likely to exceed 100 m, with much of the construction occurring in water depths between 50m to 100m, as shown in the bathymetric chart in Appendix C. Typically, 1000m to 1500m is the practical depth limit for subsea pressure vessels used for the subsea communications system and hydraulic valve tank on trenching and burial machines. Thus, water depth does not present a technology constraint to trenching and burial machine operation.
The maximum tension during the laying process fundamentally influences the design and specification of the cable. The BritNed connector was laid in shallow water of around 30m, this was a low tension cable lay project with typical product tensions believed to be in the region of 1 to 5 tonne. Prysmian have experience of laying with high cable tensions and have tested cable lay up to depths of 2000m. In 2000, they installed an interconnector between Italy and Greece in 1000 m water depth and the SAPEI interconnector was laid at up to 1650m depth. However, for ISLES water depths, it would be expected that cable lay tensions would be very similar to those seen on BritNed, possibly up to 7t depending on sea state and tide.
Cables have a minimum bend radius proportional to their outer diameter (15 x D for single core cables when laying [54]). Existing cable trench ploughs can be modified to match the bending radius of the cables. The design of substation J-Tubes will be dictated by the cable bending radius. Single-core XLPE cables used for HVDC VSC transmission are constructed of polymeric insulating material and galvanised steel wire for armour with good strength and flexibility properties. They have a relatively small bending radius, reducing the required size of the overboarding chute and trenching equipment compared to three-core XLPE cables used for HVAC transmission and MI cables used for HVDC CSC transmission.
Cable laying for wave and tidal energy converters is likely to involve lower capacity, lighter cables and reduced lengths however, sea conditions will be energetic at the sites. With some careful planning, it is possible to select a weather window for cable laying where wave conditions or the tidal stream is at a minimum. Cable laying for the Wavehub project experienced some delays due to weather conditions and floating the cable ashore [102].
Table 5.2 gives an indication of the properties of single-core submarine XLPE cables suitable for HVDC VSC transmission, which have been calculated from the formulae provided in ABB’s literature for HVDC Light cables [12]. This shows that for the base specification, the maximum tension is strongly dependent on conductor area although the cable design is often adapted from the base specification to suit a higher tension lay. Similar information for other cable designs was less readily available but will be sourced directly from manufacturers during the detailed design stage. The table is primarily intended to illustrate cable property dependencies.
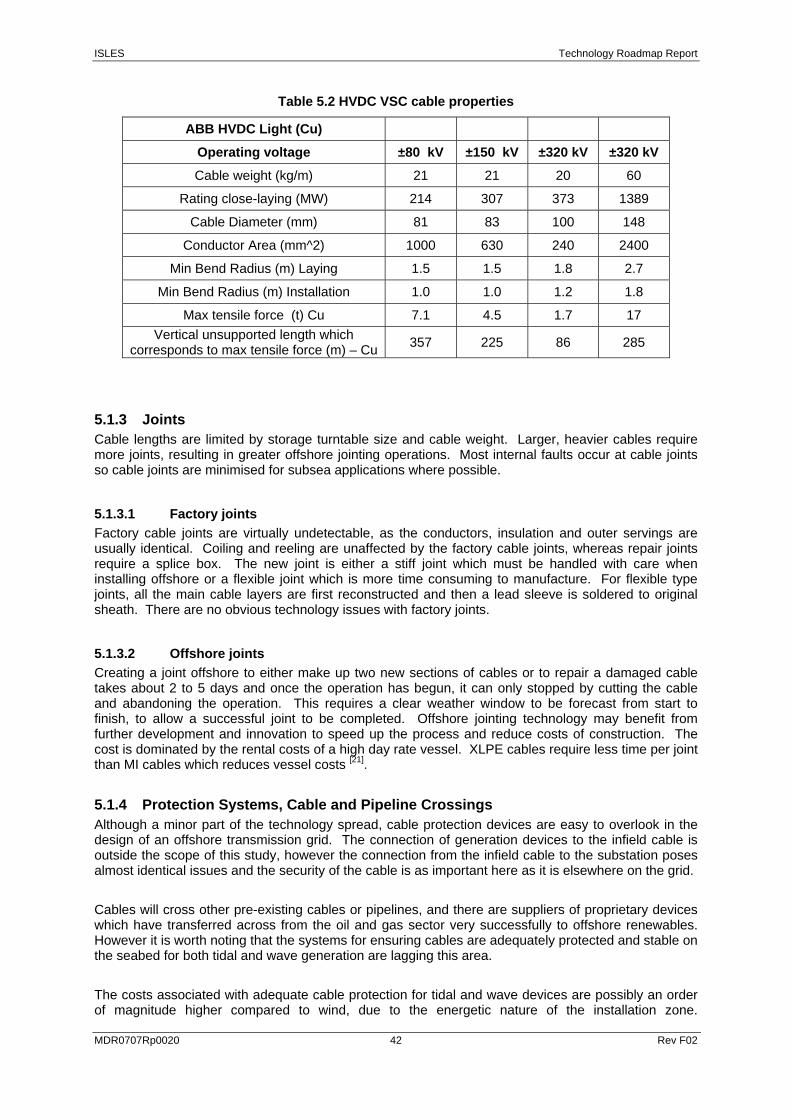
ISLES Technology Roadmap Report
MDR0707Rp0020 42 Rev F02
Table 5.2 HVDC VSC cable properties
ABB HVDC Light (Cu)
Operating voltage ±80 kV ±150 kV ±320 kV ±320 kV Cable weight (kg/m) 21 21 20 60
Rating close-laying (MW) 214 307 373 1389
Cable Diameter (mm) 81 83 100 148 Conductor Area (mm^2) 1000 630 240 2400
Min Bend Radius (m) Laying 1.5 1.5 1.8 2.7 Min Bend Radius (m) Installation 1.0 1.0 1.2 1.8
Max tensile force (t) Cu 7.1 4.5 1.7 17 Vertical unsupported length which
corresponds to max tensile force (m) – Cu 357 225 86 285
5.1.3 Joints Cable lengths are limited by storage turntable size and cable weight. Larger, heavier cables require more joints, resulting in greater offshore jointing operations. Most internal faults occur at cable joints so cable joints are minimised for subsea applications where possible.
5.1.3.1 Factory joints Factory cable joints are virtually undetectable, as the conductors, insulation and outer servings are usually identical. Coiling and reeling are unaffected by the factory cable joints, whereas repair joints require a splice box. The new joint is either a stiff joint which must be handled with care when installing offshore or a flexible joint which is more time consuming to manufacture. For flexible type joints, all the main cable layers are first reconstructed and then a lead sleeve is soldered to original sheath. There are no obvious technology issues with factory joints.
5.1.3.2 Offshore joints Creating a joint offshore to either make up two new sections of cables or to repair a damaged cable takes about 2 to 5 days and once the operation has begun, it can only stopped by cutting the cable and abandoning the operation. This requires a clear weather window to be forecast from start to finish, to allow a successful joint to be completed. Offshore jointing technology may benefit from further development and innovation to speed up the process and reduce costs of construction. The cost is dominated by the rental costs of a high day rate vessel. XLPE cables require less time per joint than MI cables which reduces vessel costs [21].
5.1.4 Protection Systems, Cable and Pipeline Crossings Although a minor part of the technology spread, cable protection devices are easy to overlook in the design of an offshore transmission grid. The connection of generation devices to the infield cable is outside the scope of this study, however the connection from the infield cable to the substation poses almost identical issues and the security of the cable is as important here as it is elsewhere on the grid.
Cables will cross other pre-existing cables or pipelines, and there are suppliers of proprietary devices which have transferred across from the oil and gas sector very successfully to offshore renewables. However it is worth noting that the systems for ensuring cables are adequately protected and stable on the seabed for both tidal and wave generation are lagging this area.
The costs associated with adequate cable protection for tidal and wave devices are possibly an order of magnitude higher compared to wind, due to the energetic nature of the installation zone.
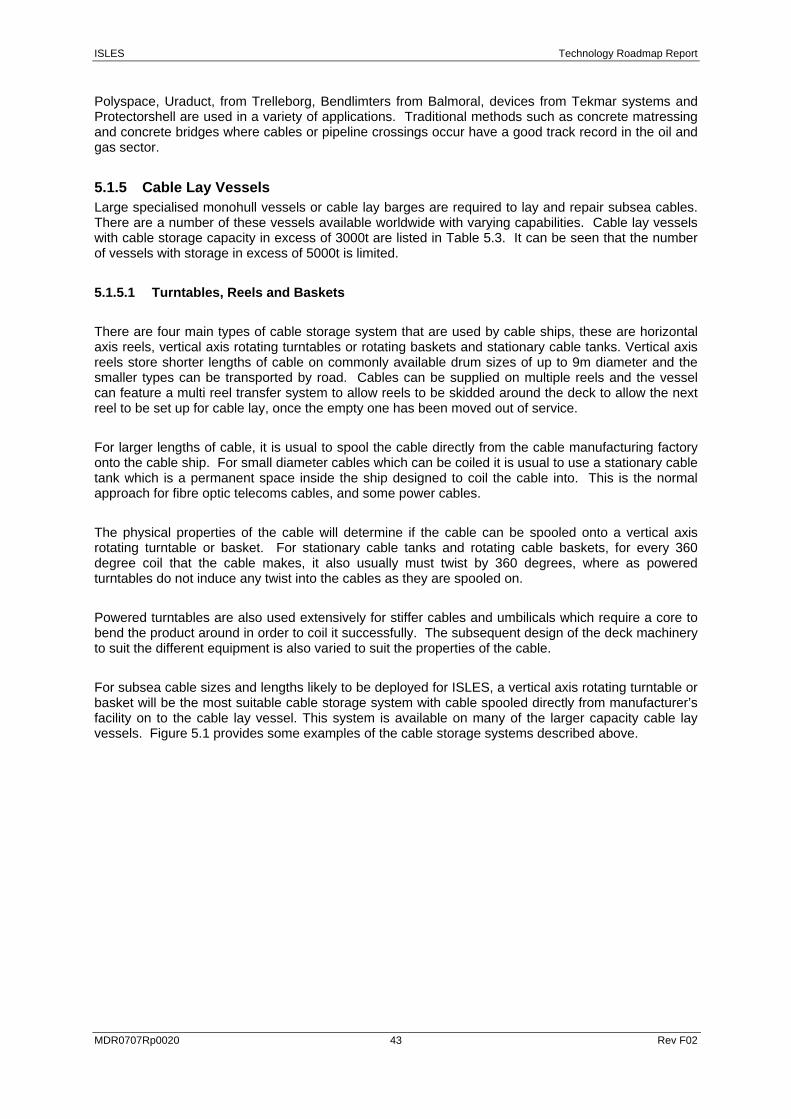
ISLES Technology Roadmap Report
MDR0707Rp0020 43 Rev F02
Polyspace, Uraduct, from Trelleborg, Bendlimters from Balmoral, devices from Tekmar systems and Protectorshell are used in a variety of applications. Traditional methods such as concrete matressing and concrete bridges where cables or pipeline crossings occur have a good track record in the oil and gas sector.
5.1.5 Cable Lay Vessels Large specialised monohull vessels or cable lay barges are required to lay and repair subsea cables. There are a number of these vessels available worldwide with varying capabilities. Cable lay vessels with cable storage capacity in excess of 3000t are listed in Table 5.3. It can be seen that the number of vessels with storage in excess of 5000t is limited.
5.1.5.1 Turntables, Reels and Baskets
There are four main types of cable storage system that are used by cable ships, these are horizontal axis reels, vertical axis rotating turntables or rotating baskets and stationary cable tanks. Vertical axis reels store shorter lengths of cable on commonly available drum sizes of up to 9m diameter and the smaller types can be transported by road. Cables can be supplied on multiple reels and the vessel can feature a multi reel transfer system to allow reels to be skidded around the deck to allow the next reel to be set up for cable lay, once the empty one has been moved out of service.
For larger lengths of cable, it is usual to spool the cable directly from the cable manufacturing factory onto the cable ship. For small diameter cables which can be coiled it is usual to use a stationary cable tank which is a permanent space inside the ship designed to coil the cable into. This is the normal approach for fibre optic telecoms cables, and some power cables.
The physical properties of the cable will determine if the cable can be spooled onto a vertical axis rotating turntable or basket. For stationary cable tanks and rotating cable baskets, for every 360 degree coil that the cable makes, it also usually must twist by 360 degrees, where as powered turntables do not induce any twist into the cables as they are spooled on.
Powered turntables are also used extensively for stiffer cables and umbilicals which require a core to bend the product around in order to coil it successfully. The subsequent design of the deck machinery to suit the different equipment is also varied to suit the properties of the cable.
For subsea cable sizes and lengths likely to be deployed for ISLES, a vertical axis rotating turntable or basket will be the most suitable cable storage system with cable spooled directly from manufacturer’s facility on to the cable lay vessel. This system is available on many of the larger capacity cable lay vessels. Figure 5.1 provides some examples of the cable storage systems described above.
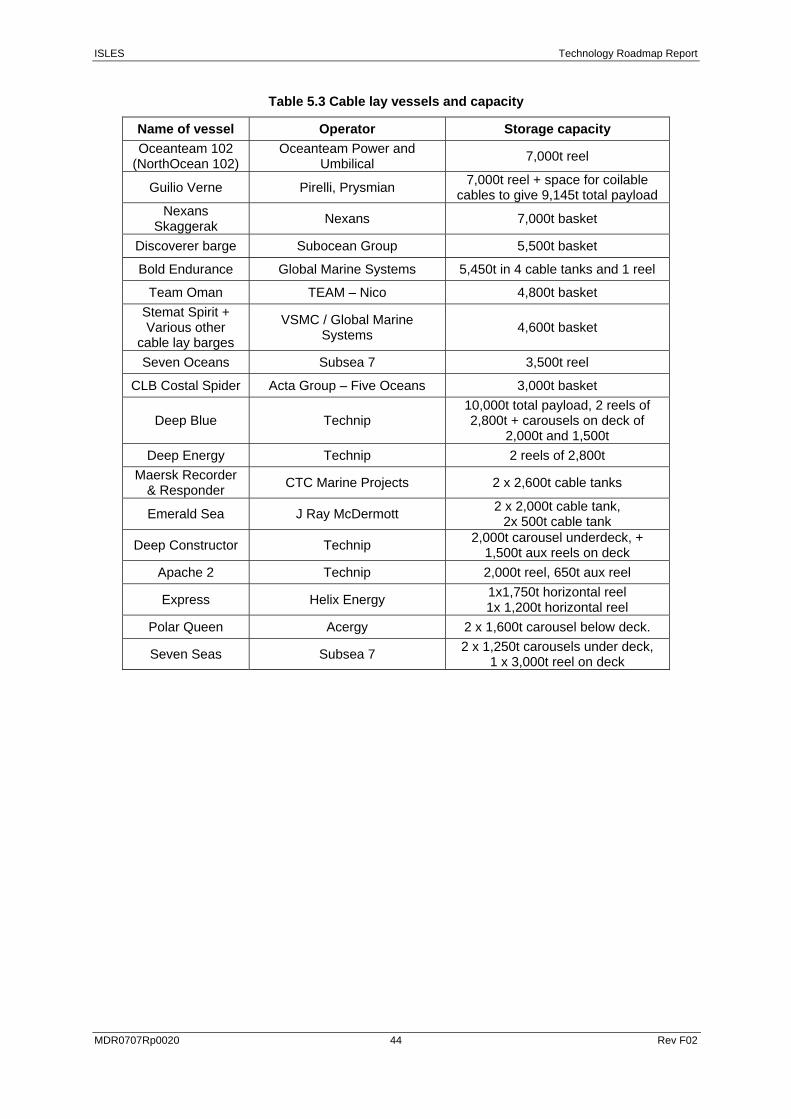
ISLES Technology Roadmap Report
MDR0707Rp0020 44 Rev F02
Table 5.3 Cable lay vessels and capacity
Name of vessel Operator Storage capacity Oceanteam 102
(NorthOcean 102) Oceanteam Power and
Umbilical 7,000t reel
Guilio Verne Pirelli, Prysmian 7,000t reel + space for coilable cables to give 9,145t total payload
Nexans Skaggerak Nexans 7,000t basket
Discoverer barge Subocean Group 5,500t basket
Bold Endurance Global Marine Systems 5,450t in 4 cable tanks and 1 reel
Team Oman TEAM – Nico 4,800t basket Stemat Spirit + Various other
cable lay barges
VSMC / Global Marine Systems 4,600t basket
Seven Oceans Subsea 7 3,500t reel
CLB Costal Spider Acta Group – Five Oceans 3,000t basket
Deep Blue Technip 10,000t total payload, 2 reels of 2,800t + carousels on deck of
2,000t and 1,500t Deep Energy Technip 2 reels of 2,800t
Maersk Recorder & Responder CTC Marine Projects 2 x 2,600t cable tanks
Emerald Sea J Ray McDermott 2 x 2,000t cable tank, 2x 500t cable tank
Deep Constructor Technip 2,000t carousel underdeck, + 1,500t aux reels on deck
Apache 2 Technip 2,000t reel, 650t aux reel
Express Helix Energy 1x1,750t horizontal reel 1x 1,200t horizontal reel
Polar Queen Acergy 2 x 1,600t carousel below deck.
Seven Seas Subsea 7 2 x 1,250t carousels under deck, 1 x 3,000t reel on deck
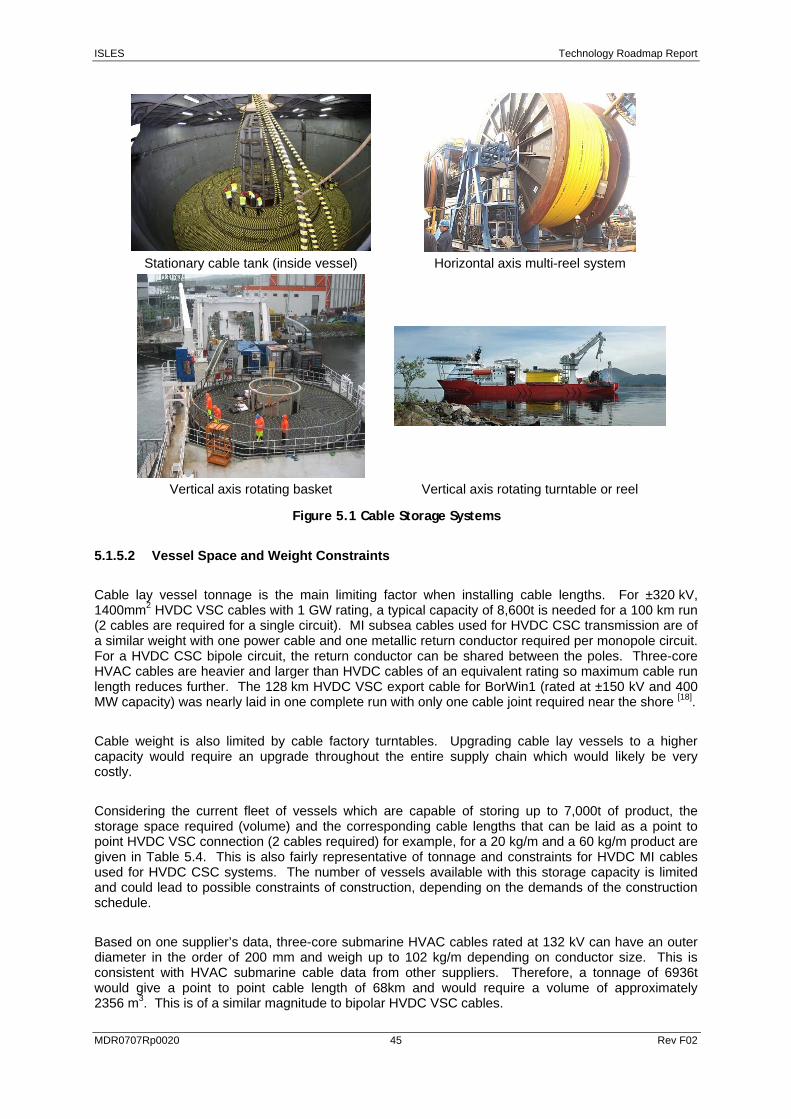
ISLES Technology Roadmap Report
MDR0707Rp0020 45 Rev F02
Stationary cable tank (inside vessel) Horizontal axis multi-reel system
Vertical axis rotating basket Vertical axis rotating turntable or reel
Figure 5.1 Cable Storage Systems
5.1.5.2 Vessel Space and Weight Constraints
Cable lay vessel tonnage is the main limiting factor when installing cable lengths. For ±320 kV, 1400mm2 HVDC VSC cables with 1 GW rating, a typical capacity of 8,600t is needed for a 100 km run (2 cables are required for a single circuit). MI subsea cables used for HVDC CSC transmission are of a similar weight with one power cable and one metallic return conductor required per monopole circuit. For a HVDC CSC bipole circuit, the return conductor can be shared between the poles. Three-core HVAC cables are heavier and larger than HVDC cables of an equivalent rating so maximum cable run length reduces further. The 128 km HVDC VSC export cable for BorWin1 (rated at ±150 kV and 400 MW capacity) was nearly laid in one complete run with only one cable joint required near the shore [18].
Cable weight is also limited by cable factory turntables. Upgrading cable lay vessels to a higher capacity would require an upgrade throughout the entire supply chain which would likely be very costly.
Considering the current fleet of vessels which are capable of storing up to 7,000t of product, the storage space required (volume) and the corresponding cable lengths that can be laid as a point to point HVDC VSC connection (2 cables required) for example, for a 20 kg/m and a 60 kg/m product are given in Table 5.4. This is also fairly representative of tonnage and constraints for HVDC MI cables used for HVDC CSC systems. The number of vessels available with this storage capacity is limited and could lead to possible constraints of construction, depending on the demands of the construction schedule.
Based on one supplier’s data, three-core submarine HVAC cables rated at 132 kV can have an outer diameter in the order of 200 mm and weigh up to 102 kg/m depending on conductor size. This is consistent with HVAC submarine cable data from other suppliers. Therefore, a tonnage of 6936t would give a point to point cable length of 68km and would require a volume of approximately 2356 m3. This is of a similar magnitude to bipolar HVDC VSC cables.
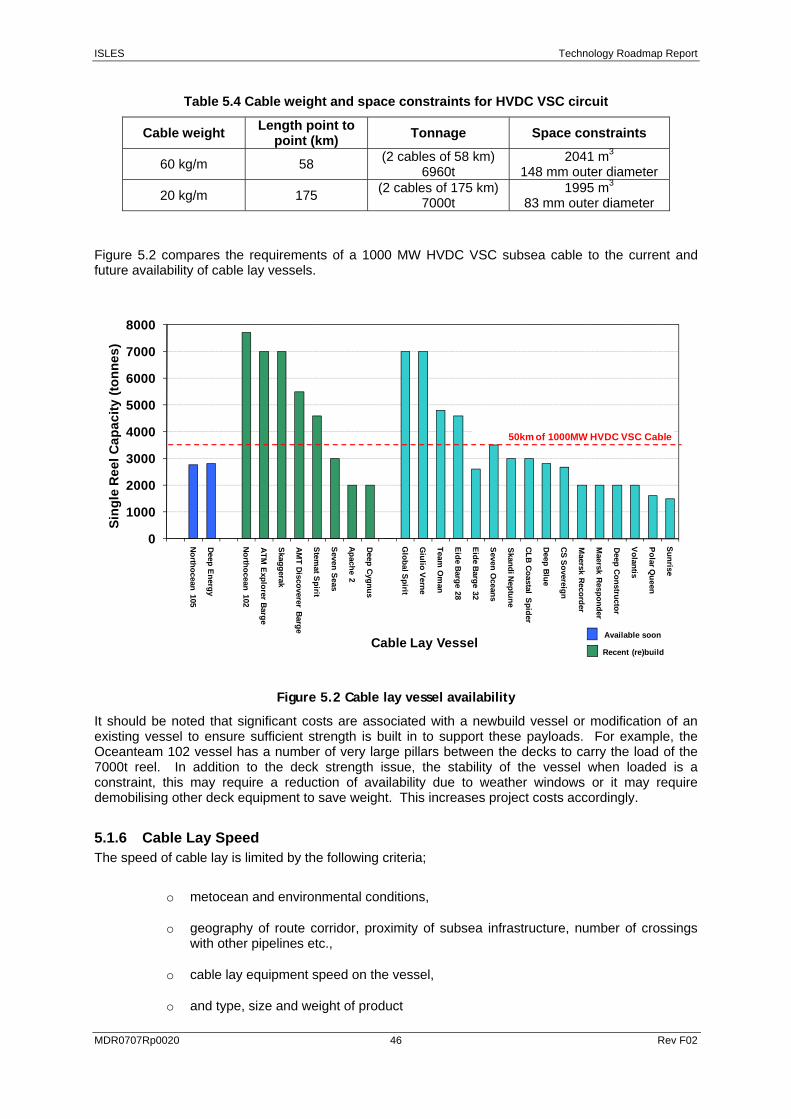
ISLES Technology Roadmap Report
MDR0707Rp0020 46 Rev F02
Table 5.4 Cable weight and space constraints for HVDC VSC circuit
Cable weight Length point to point (km) Tonnage Space constraints
60 kg/m 58 (2 cables of 58 km) 6960t
2041 m3
148 mm outer diameter
20 kg/m 175 (2 cables of 175 km) 7000t
1995 m3
83 mm outer diameter
Figure 5.2 compares the requirements of a 1000 MW HVDC VSC subsea cable to the current and future availability of cable lay vessels.
0
1000
2000
3000
4000
5000
6000
7000
8000
Northocean 105
Deep Energy
Northocean 102
ATM
Explorer B
arge
Skaggerak
AMT Discoverer Barge
Stemat S
pirit
Seven Seas
Apache 2
Deep Cygnus
Global S
pirit
Giulio Verne
Team O
man
Eide Barge 28
Eide Barge 32
Seven O
ceans
Skandi N
eptune
CLB C
oastal Spider
Deep Blue
CS S
overeign
Maersk R
ecorder
Maersk R
esponder
Deep C
onstructor
Volantis
Polar Q
ueen
SunriseSi
ngle
Ree
l Cap
acity
(ton
nes)
Cable Lay Vessel
50km of 1000MW HVDC VSC Cable
Recent (re)build
Available soon
Figure 5.2 Cable lay vessel availability
It should be noted that significant costs are associated with a newbuild vessel or modification of an existing vessel to ensure sufficient strength is built in to support these payloads. For example, the Oceanteam 102 vessel has a number of very large pillars between the decks to carry the load of the 7000t reel. In addition to the deck strength issue, the stability of the vessel when loaded is a constraint, this may require a reduction of availability due to weather windows or it may require demobilising other deck equipment to save weight. This increases project costs accordingly.
5.1.6 Cable Lay Speed The speed of cable lay is limited by the following criteria;
o metocean and environmental conditions,
o geography of route corridor, proximity of subsea infrastructure, number of crossings with other pipelines etc.,
o cable lay equipment speed on the vessel,
o and type, size and weight of product
ISLES Technology Roadmap Report
MDR0707Rp0020 47 Rev F02
Cable lay equipment in common usage is able to lay cable at a maximum rate of up to 1200 m/hr excluding burial.
Econnect estimate that 1200 km of HVAC subsea three-core and single-core cable and 5200 km of HVDC subsea and underground cables would be required for grid connection of UK Round 3 wind farms alone. This equates to a total of 222 days of cable lay assuming 24 hour operation. However, no consideration is given to suitable weather conditions or vessel travel time between developments or consecutive / co-ordinated programming of cable lays across the portfolio of developments.
5.1.7 Trenching and Burial Speed The selection of the preferred burial machine is strongly linked to the soil conditions and seabed topography. Soils range from soft mud with a strength of 5 kPa which may not support a heavy trenching machine, to rock which may require cutting or fracturing or it could be too hard to do either. Soil and rock types are extremely variable. Seabed soil types can include boulders, cemented sand, hard clays.
Burial depths typically range from 1 to 3m for submarine power cables, depending on factors such as soil type, burial penetration, depth of water, fishing activity, thermal resistivity. In areas of shipping anchorage, a burial depth of between 5 to 10m may be required.
The speed of trenching and burial is directly linked to the above factors, along with:
o the depth of trench required, i.e. the volume of soil to be removed,
o the type of product to be buried,
o the final selection of type of trenching machine.
Typical speeds for trenching and burial machines can range from 50 m/hr to 750 m/hr. In addition to the speed of trenching, the burial machines require planned maintenance during the offshore campaign. It is normal for soil cutting machines and jet trenchers to accrue maintenance time at a typical rate of 2 hrs in every 24hrs. Ploughs require less maintenance during offshore operations due to their comparative lack of complexity.
5.1.8 Onshore Connection The technology involved in the construction of landfalls is predominantly civil engineering work, with a variety of tools and technology currently in existence. Directional drilling techniques are well developed and are able to suit a variety of shore and seabed conditions, and length of bore can be adequately achieved up to 600m with commonly available horizontal drill rigs (HDD). HDD technology is available to drill over 1 mile [103]. For landfalls where a cofferdam approach is favoured, land based civil engineering work prevails. This is not deemed an area with technology constraints.
Details such as the shore approach require careful consideration. The most direct route from an offshore site to the onshore grid node may not be the most suitable for construction. Long shallow beach approaches will inhibit cable lay ships that typically require draughts of around 10m and this may require the use of shallower cable lay barges instead. This technology is available from several marine cable installation contractors, however it may limit the techniques proposed. Design of the cable routes close to shore to give a deeper and shorter shore approach prior to landfall may save considerable costs of construction of the landfall and offer a wider selection of burial tools.
Burial tools such as jet trenching machines often require a positive head of water above their pumps of up to 10m, depending on the type of machine and pumps used, and so the split in construction between offshore and onshore may actually occur not at the shore line, but at around 20m water depth.
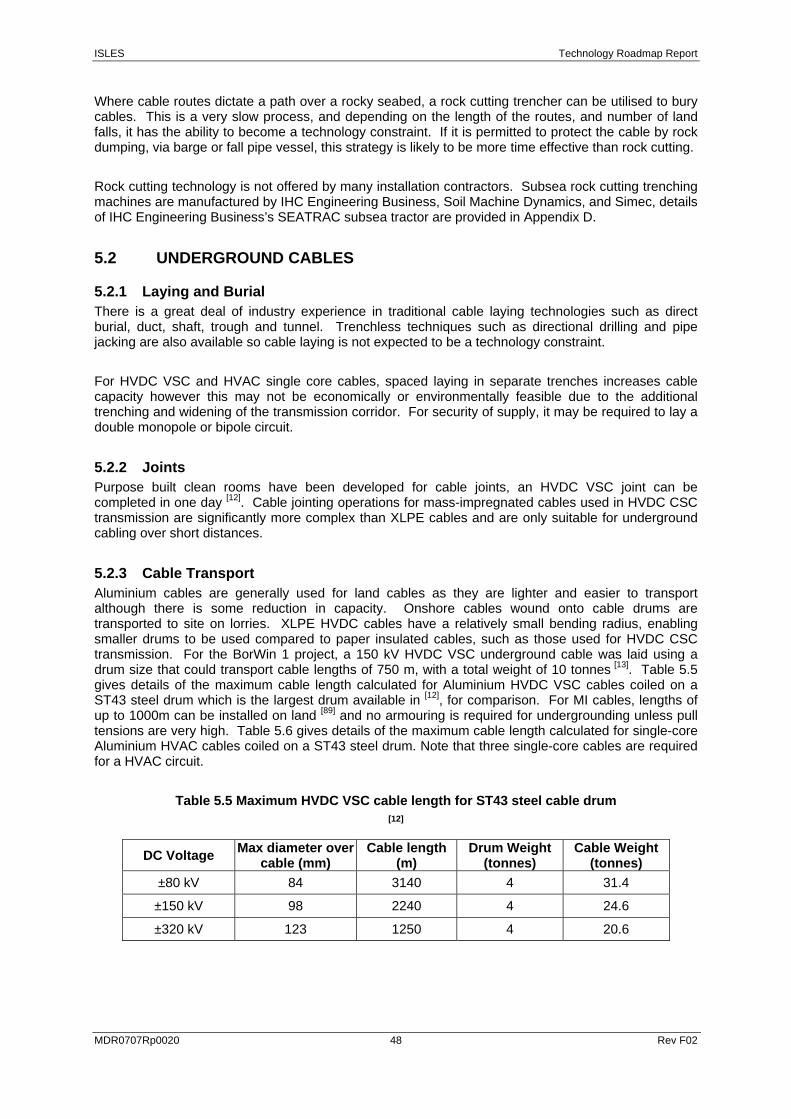
ISLES Technology Roadmap Report
MDR0707Rp0020 48 Rev F02
Where cable routes dictate a path over a rocky seabed, a rock cutting trencher can be utilised to bury cables. This is a very slow process, and depending on the length of the routes, and number of land falls, it has the ability to become a technology constraint. If it is permitted to protect the cable by rock dumping, via barge or fall pipe vessel, this strategy is likely to be more time effective than rock cutting.
Rock cutting technology is not offered by many installation contractors. Subsea rock cutting trenching machines are manufactured by IHC Engineering Business, Soil Machine Dynamics, and Simec, details of IHC Engineering Business’s SEATRAC subsea tractor are provided in Appendix D.
5.2 UNDERGROUND CABLES
5.2.1 Laying and Burial There is a great deal of industry experience in traditional cable laying technologies such as direct burial, duct, shaft, trough and tunnel. Trenchless techniques such as directional drilling and pipe jacking are also available so cable laying is not expected to be a technology constraint.
For HVDC VSC and HVAC single core cables, spaced laying in separate trenches increases cable capacity however this may not be economically or environmentally feasible due to the additional trenching and widening of the transmission corridor. For security of supply, it may be required to lay a double monopole or bipole circuit.
5.2.2 Joints Purpose built clean rooms have been developed for cable joints, an HVDC VSC joint can be completed in one day [12]. Cable jointing operations for mass-impregnated cables used in HVDC CSC transmission are significantly more complex than XLPE cables and are only suitable for underground cabling over short distances.
5.2.3 Cable Transport Aluminium cables are generally used for land cables as they are lighter and easier to transport although there is some reduction in capacity. Onshore cables wound onto cable drums are transported to site on lorries. XLPE HVDC cables have a relatively small bending radius, enabling smaller drums to be used compared to paper insulated cables, such as those used for HVDC CSC transmission. For the BorWin 1 project, a 150 kV HVDC VSC underground cable was laid using a drum size that could transport cable lengths of 750 m, with a total weight of 10 tonnes [13]. Table 5.5 gives details of the maximum cable length calculated for Aluminium HVDC VSC cables coiled on a ST43 steel drum which is the largest drum available in [12], for comparison. For MI cables, lengths of up to 1000m can be installed on land [89] and no armouring is required for undergrounding unless pull tensions are very high. Table 5.6 gives details of the maximum cable length calculated for single-core Aluminium HVAC cables coiled on a ST43 steel drum. Note that three single-core cables are required for a HVAC circuit.
Table 5.5 Maximum HVDC VSC cable length for ST43 steel cable drum [12]
DC Voltage Max diameter over cable (mm)
Cable length (m)
Drum Weight (tonnes)
Cable Weight (tonnes)
±80 kV 84 3140 4 31.4
±150 kV 98 2240 4 24.6
±320 kV 123 1250 4 20.6
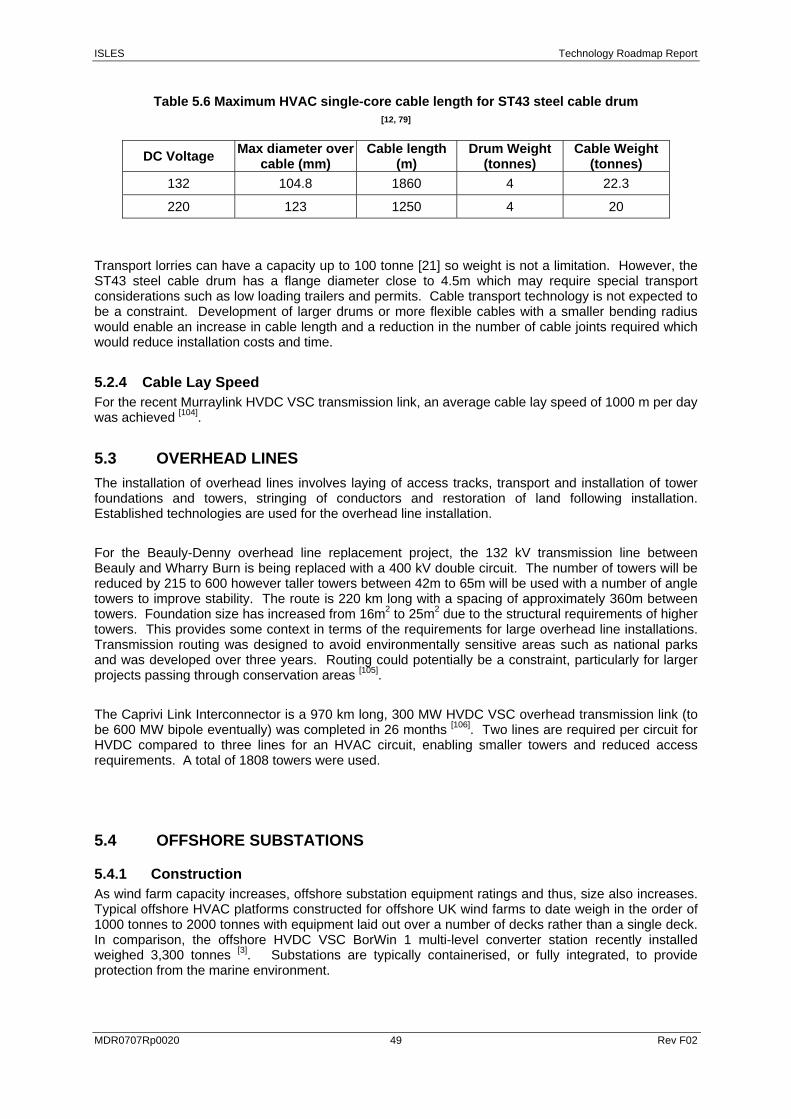
ISLES Technology Roadmap Report
MDR0707Rp0020 49 Rev F02
Table 5.6 Maximum HVAC single-core cable length for ST43 steel cable drum [12, 79]
DC Voltage Max diameter over cable (mm)
Cable length (m)
Drum Weight (tonnes)
Cable Weight (tonnes)
132 104.8 1860 4 22.3
220 123 1250 4 20
Transport lorries can have a capacity up to 100 tonne [21] so weight is not a limitation. However, the ST43 steel cable drum has a flange diameter close to 4.5m which may require special transport considerations such as low loading trailers and permits. Cable transport technology is not expected to be a constraint. Development of larger drums or more flexible cables with a smaller bending radius would enable an increase in cable length and a reduction in the number of cable joints required which would reduce installation costs and time.
5.2.4 Cable Lay Speed For the recent Murraylink HVDC VSC transmission link, an average cable lay speed of 1000 m per day was achieved [104].
5.3 OVERHEAD LINES The installation of overhead lines involves laying of access tracks, transport and installation of tower foundations and towers, stringing of conductors and restoration of land following installation. Established technologies are used for the overhead line installation.
For the Beauly-Denny overhead line replacement project, the 132 kV transmission line between Beauly and Wharry Burn is being replaced with a 400 kV double circuit. The number of towers will be reduced by 215 to 600 however taller towers between 42m to 65m will be used with a number of angle towers to improve stability. The route is 220 km long with a spacing of approximately 360m between towers. Foundation size has increased from 16m2 to 25m2 due to the structural requirements of higher towers. This provides some context in terms of the requirements for large overhead line installations. Transmission routing was designed to avoid environmentally sensitive areas such as national parks and was developed over three years. Routing could potentially be a constraint, particularly for larger projects passing through conservation areas [105].
The Caprivi Link Interconnector is a 970 km long, 300 MW HVDC VSC overhead transmission link (to be 600 MW bipole eventually) was completed in 26 months [106]. Two lines are required per circuit for HVDC compared to three lines for an HVAC circuit, enabling smaller towers and reduced access requirements. A total of 1808 towers were used.
5.4 OFFSHORE SUBSTATIONS
5.4.1 Construction As wind farm capacity increases, offshore substation equipment ratings and thus, size also increases. Typical offshore HVAC platforms constructed for offshore UK wind farms to date weigh in the order of 1000 tonnes to 2000 tonnes with equipment laid out over a number of decks rather than a single deck. In comparison, the offshore HVDC VSC BorWin 1 multi-level converter station recently installed weighed 3,300 tonnes [3]. Substations are typically containerised, or fully integrated, to provide protection from the marine environment.
ISLES Technology Roadmap Report
MDR0707Rp0020 50 Rev F02
Because the platform structural steel is a major cost contributor, minimising offshore equipment and optimising layout can have significant benefits. For example, multi-deck platforms can reduce structural steel usage however, a drawback is that equipment maintenance becomes more complex. The installation of specially designed laminates is a future possibility for transformer blast walls which are traditionally constructed from thick, heavy steel. Also, the viability of open loop seawater coolant is being investigated for HVDC converters which have higher cooling requirements compared to HVAC substations.
5.4.2 Deployment Technology to deploy and install offshore HVAC substations is well established in the UK with the recent installation of the 1250 tonne substation for the 300 MW Thanet offshore wind farm. However, the 630 MW London Array offshore wind farm substations will weigh around 1400 tonnes each and other UK Round 2 offshore wind farm substations may be even larger. The offshore HVDC VSC BorWin 1 substation was installed successfully in 2009 [3]. The substation is 50 x 33.5 x 22 m and weighs 3,300 tonnes with the jacket weighing 1,500 tonnes and was installed in waters of 30 m depth. It was floated out and installed using standard techniques from the oil and gas industry [3].
Currently, platform size is significantly less than platforms that have been installed for the oil and gas industry although it is expected that substations for UK Round 3 offshore wind farms and similar will be somewhat larger due to the increased capacity. Also, an increase in the use of HVDC VSC as a transmission technology and implementation of multi-terminal systems will require offshore converter stations which are demonstrably larger than HVAC offshore platforms for an equivalent rating. No offshore HVDC CSC substations are being considered currently due to the size and weight of substations for the ratings required.
Offshore transport to site is via heavy lift ships with capacities in the order of 10,000 tonnes. Floatover topside technology is available where heavy lift ships are not readily available, although this is more suited for relatively benign marine conditions. A self-floating, self-installing substation is being developed for the Global Tech 1 offshore wind farm off the German coast. Offshore transport vessels suitable for the transport of heavy bulky loads such as offshore platforms can be summarised as;
o Transport Barge with shear leg crane, typically shear leg cranes have capacities of up to 5000t
o Transport Barge with floating crane vessel of 3000t to 14000t capacity
o Transport Ship with deadweights range from 27,000t to 76,000t. Transport only, not lifting but these ships have variable draught to float the payload into position.
Further details of worldwide capabilities are provided in Table 5.7.
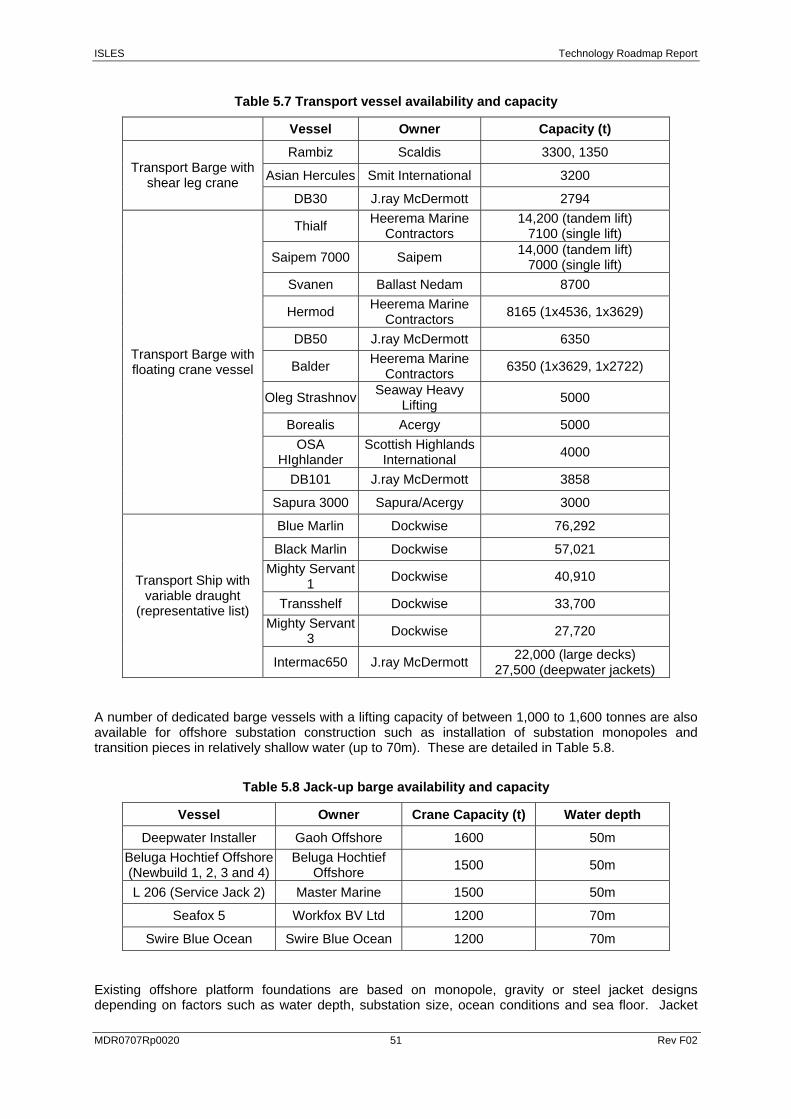
ISLES Technology Roadmap Report
MDR0707Rp0020 51 Rev F02
Table 5.7 Transport vessel availability and capacity
Vessel Owner Capacity (t)
Rambiz Scaldis 3300, 1350
Asian Hercules Smit International 3200 Transport Barge with shear leg crane
DB30 J.ray McDermott 2794
Thialf Heerema Marine Contractors
14,200 (tandem lift) 7100 (single lift)
Saipem 7000 Saipem 14,000 (tandem lift) 7000 (single lift)
Svanen Ballast Nedam 8700
Hermod Heerema Marine Contractors 8165 (1x4536, 1x3629)
DB50 J.ray McDermott 6350
Balder Heerema Marine Contractors 6350 (1x3629, 1x2722)
Oleg Strashnov Seaway Heavy Lifting 5000
Borealis Acergy 5000 OSA
HIghlander Scottish Highlands
International 4000
DB101 J.ray McDermott 3858
Transport Barge with floating crane vessel
Sapura 3000 Sapura/Acergy 3000
Blue Marlin Dockwise 76,292
Black Marlin Dockwise 57,021 Mighty Servant
1 Dockwise 40,910
Transshelf Dockwise 33,700 Mighty Servant
3 Dockwise 27,720
Transport Ship with variable draught
(representative list)
Intermac650 J.ray McDermott 22,000 (large decks) 27,500 (deepwater jackets)
A number of dedicated barge vessels with a lifting capacity of between 1,000 to 1,600 tonnes are also available for offshore substation construction such as installation of substation monopoles and transition pieces in relatively shallow water (up to 70m). These are detailed in Table 5.8.
Table 5.8 Jack-up barge availability and capacity
Vessel Owner Crane Capacity (t) Water depth
Deepwater Installer Gaoh Offshore 1600 50m Beluga Hochtief Offshore (Newbuild 1, 2, 3 and 4)
Beluga Hochtief Offshore 1500 50m
L 206 (Service Jack 2) Master Marine 1500 50m
Seafox 5 Workfox BV Ltd 1200 70m
Swire Blue Ocean Swire Blue Ocean 1200 70m
Existing offshore platform foundations are based on monopole, gravity or steel jacket designs depending on factors such as water depth, substation size, ocean conditions and sea floor. Jacket
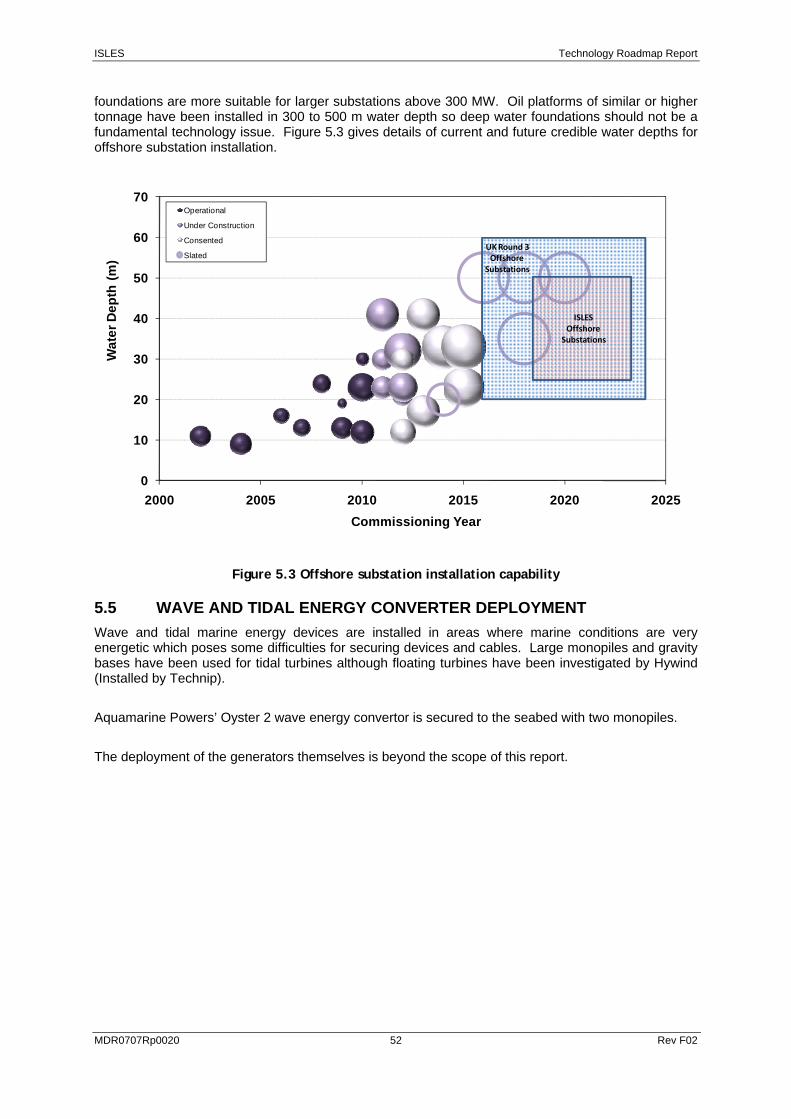
ISLES Technology Roadmap Report
MDR0707Rp0020 52 Rev F02
foundations are more suitable for larger substations above 300 MW. Oil platforms of similar or higher tonnage have been installed in 300 to 500 m water depth so deep water foundations should not be a fundamental technology issue. Figure 5.3 gives details of current and future credible water depths for offshore substation installation.
0
10
20
30
40
50
60
70
2000 2005 2010 2015 2020 2025
Wat
er D
epth
(m)
Commissioning Year
Operational
Under Construction
Consented
Slated
ISLES Offshore
Substations
UK Round 3 Offshore
Substations
Figure 5.3 Offshore substation installation capability
5.5 WAVE AND TIDAL ENERGY CONVERTER DEPLOYMENT Wave and tidal marine energy devices are installed in areas where marine conditions are very energetic which poses some difficulties for securing devices and cables. Large monopiles and gravity bases have been used for tidal turbines although floating turbines have been investigated by Hywind (Installed by Technip).
Aquamarine Powers’ Oyster 2 wave energy convertor is secured to the seabed with two monopiles.
The deployment of the generators themselves is beyond the scope of this report.
ISLES Technology Roadmap Report
MDR0707Rp0020 53 Rev F02
6 TECHNOLOGY SUPPLY CHAIN
6.1 INTRODUCTION The construction of the early ISLES offshore transmission network may coincide with UK Round 3 offshore wind farms and a general boom period for offshore wind farms worldwide. A number of high capacity point to point and multi-terminal HVDC transmission projects located both onshore and offshore are also proposed within this timeframe. The existing supply chain does not have sufficient capacity to meet anticipated future demand. Even with planned increases in capacity, the technology supply chain is likely to be heavily loaded with manufacturing and equipment availability bottlenecks.
Standardisation of transmission and installation equipment for offshore networks should reduce design and manufacturing time. Simplification of design, greater utilisation of off-the-shelf components and reduction of raw materials will also help to ease supply chain limitations.
6.2 SUBSTATIONS
6.2.1 Onshore Onshore substations are generally provided as an integrated package designed to meet specific project requirements. Turnkey suppliers typically manufacture some of the equipment in-house and source the remainder from other suppliers.
Most onshore substations for integration of offshore generation or transmission have been constructed next to existing transmission network substations to date. This reduces costs and planning and environmental constraints in some cases. Onshore substations for offshore wind farms take approximately 18 months to 3 years to complete based on previous installations and estimated delivery times for substations currently in construction. Timescales are similar for upgrading or constructing new transmission network substations.
6.2.2 Offshore Offshore substations are also provided as turnkey integrated packages designed for purpose. Turnkey suppliers typically manufacture some of the equipment in-house and source the remaining from other suppliers. Offshore platforms are fabricated by a third party heavy engineering contractor.
Based on recent projects, design, construction and commissioning of an offshore HVAC substation takes about 2 years. This includes equipment manufacture and integration into the steel platform during fabrication. Delivery times for HVDC subsea transmission systems, including converter substations and cable installation, are currently approximately 18 months to 2 years depending on project complexity [13, 107]. Lead time is expected to increase though as demand rises in the future. The supply chain for substation components is described in more detail below.
6.3 HVDC CONVERTERS HVDC CSC converters are supplied by ABB, Alstom Grid and Siemens. HVDC VSC converters are currently supplied by ABB and Siemens, however Alstom Grid is nearing completion of a large-scale demonstrator unit to facilitate market entry in the near future. HVDC converter stations do not represent a large proportion of business for turnkey suppliers and there is little competition [109] which can impact upon cost and availability. A very large level of investment would likely be required for other manufacturers to enter the market.
Future technology developments such as higher capacity converters and multi-terminal HVDC VSC systems are likely to initially have higher costs and longer lead times compared to more established converter/system designs.
ISLES Technology Roadmap Report
MDR0707Rp0020 54 Rev F02
6.4 SWITCHGEAR Suppliers of HVAC AIS and GIS switchgear include ABB, Alstom Grid, Crompton Greaves and Siemens. Ormazabal, Hyosung, Hyundai and Mitsubishi also supply medium voltage GIS switchgear. Any step change in offshore turbine array voltage and/or export voltage will require development of more suitable GIS switchgear products which will increase lead time.
HVDC switchgear is supplied by ABB, Alstom Grid and Siemens and integrated with converter stations. DC circuit breakers suitable for HVDC multi-terminal transmission networks are currently being developed by several manufacturers and should be available on a commercial basis before early ISLES and UK Round 3.
6.5 TRANSFORMERS Major suppliers of HVAC power transformers include ABB, Alstom Grid, Crompton Greaves, Hyosung, Hyundai, Mitsubishi, GE Energy, Siemens, Tironi and SMIT-SGB. ABB, Alstom Grid, Siemens, Crompton Greaves and Tironi have supplied transformers for offshore substation platforms. A number of other manufacturers are in the process of developing power transformers specifically for the offshore wind market.
Current lead time from order to delivery of a power transformer can range from 12 to 30 months [21] depending on the complexity of design and backlog of orders. Due to the long lead time, some offshore wind farm developers are opting to keep a spare transformer onshore to reduce any potential downtime due to failure, although power transformers should not fail during their operational lifetime. Greater electrical standardisation of offshore transmission schemes should enable a reduction in design time and overall lead time for manufacture of power transformers for offshore applications. It should also improve offshore transformer spares strategies.
Recent reports have suggested that the current global manufacturing capacity for power transformers is less than expected future demand [108, 109]. High volumes of transformers will be required for future large onshore and offshore wind farms and HVDC interconnectors proposed. There is also an expansion of the market for specialised transformers for baseload from customers such as National Grid (replacement, new nuclear build). Key technology suppliers have provided mixed responses, some responding positively to the market’s ability to meet future demand and others suggesting that future high volumes required may lead to a supply bottleneck. Manufacturing capacity is being increased by several suppliers to meet increasing orders.
6.6 HARMONIC FILTERS Indications from suppliers are that the market for harmonic filters is increasing steadily with the development of large onshore wind farms, particularly in the US market, and offshore wind farms. Filtering requirements for grid compliance will be greater for offshore wind farms, in late UK Round 2 and Round 3 for example, due to issues with voltage rise and harmonic resonances for long HVAC subsea export cables. In addition, proposed HVDC CSC interconnectors will need to include harmonic filtering at converter stations.
Suppliers for harmonic filters include ABB, Alstom Grid, Enspec Power and Siemens. According to one supplier, typical lead time for medium voltage harmonic filters from order placement to delivery is 20 weeks, for high voltage harmonic filters it is likely to be 9 to 12 months. One supplier is currently increasing manufacturing capacity by expanding premises and installing larger craneage to meet current and future anticipated demand.
6.7 CAPACITOR BANKS Suppliers for capacitor banks include ABB, Alstom Grid, Cooper Power Systems, Crompton Greaves, Enspec, GE Power, NEPSI Phaseco, SDC Industries and Siemens. Capacitor bank lead time from order placement to delivery has been given as approximately 20 weeks by one supplier. One supplier
ISLES Technology Roadmap Report
MDR0707Rp0020 55 Rev F02
is currently expanding capacity and installing larger craneage to meet current and anticipated future demand.
6.8 REACTORS Suppliers for reactors include ABB, Alstom Grid, Crompton Greaves, Enspec, GE Energy, Hyosung, Hyundai, Mitsubishi, Siemens and Trench. Lead times for large shunt reactors from order placement can be up to 1 to 2 years [21].
6.9 FACTS DEVICES Suppliers of FACTS devices include ABB, AMSC, Alstom Grid, Mitsubishi and Siemens. Lead times for FACTS devices from order placement can be up to 1 to 2 years [21].
6.10 OFFSHORE PLATFORMS Capability to construct offshore platforms and foundations exists both within the UK from companies such as Burnt Island Fabrications (BiFab), Harland and Wolff, Heerema, McNulty and SLP Engineering and in Europe from companies such as Bladt, MT Højgaard, SIF/Smulder and Weserwind. Experience from the offshore oil and gas sector is also being leveraged for offshore platform design.
Platforms currently take approximately 12 to 18 months to design and manufacture [21] and it has been estimated that 47 such platforms will be required to connect the UK round 3 wind farms alone. Fabrication capacity could be increased if more heavy engineering companies with experience in manufacturing topsides and jackets for the offshore oil and gas industry enter or extend their activity in the offshore wind market. However, if there is increased demand from the oil and gas sector due to discovery of new fields or ability to extract from previously inaccessible fields, this could reduce available manufacturing slots. Other factors which may affect offshore platform construction are volatile steel prices on the world markets and the availability of suitable port locations for new-build manufacturing facilities.
6.11 CABLES HV subsea cables are only manufactured by a small number of specialist cable suppliers and generally do not make up a significant proportion of their overall market at present [109]. Underground cables have a larger supplier base. HV subsea cable supply chain capacity has been identified by industry as potentially a major constraint to the deployment of UK Round 3 offshore wind farms and high capacity interconnectors.
For grid connection of UK Round 3 wind farms for example, Econnect estimate that 1200 km of HVAC subsea three-core and single-core cable and 5200 km of HVDC subsea and underground cables would be required. This compares with an estimated annual worldwide manufacturing capacity in the region of 1500 to 2000 km [110] for extruded (XLPE) cables by 2015 based on existing manufacturing capacity and manufacturing capacity currently being built. This is equivalent to approximately 700 km of three-core HVAC cable or 1000 km of HVDC cable (in a bipole configuration). This estimate is consistent with cable supplier consultations. There is concern that this will be a peaky demand concentrated over a relatively short period of time.
Three manufacturers in Europe currently supply the majority of subsea transmission HVAC cables and all HVDC cables (Nexans, Prysmian and ABB) with a lead time of approximately 2 to 3 years. Other European suppliers of subsea HVAC transmission cables include JDR Cable Systems in the UK, NKT Cables and NSW Cables. JDR Cable Systems Ltd was recently awarded a £2 million grant towards developing HVAC cables at their UK Hartlepool facility in time for UK Round 3 offshore wind. LS Cables have supplied high voltage AC and DC cables for a number of onshore and offshore transmission projects predominantly in Asia, America and the Middle East. They recently completed a
ISLES Technology Roadmap Report
MDR0707Rp0020 56 Rev F02
new submarine cable factory in Korea in 2009 to meet current and future predicted demand for subsea transmission.
Suppliers have indicated that there is adequate capacity to meet current demand and that they are responding to future increases in market demand through expansion of manufacturing capacity. In order to justify the large investment involved in increasing manufacturing capacity further with expansion of existing or new-build facilities, a partnership or long term agreement with developers would need to be established as many projects are still in conceptual or early design phases and subject to potential holdups. A new factory has been estimated to cost approximately £35 million to build [111] and can take two to four years to bring up to full capacity. Another limitation for new-build factories is that HV subsea cables need to be loaded directly onto installation vessels so any new facility must be built at a suitable port location.
Cable price is very reliant on the cost of raw materials, with metals being the most volatile factor. Some representative prices for supplied subsea cable (excluding installation) are €100 to 200/m for HVAC 33 kV three-core cable (from smallest to largest conductor) and €200 to 600/m for HVAC 132kV three-core cable. The price for supply of HVDC 300 kV XLPE single-core cable is approximately €150 to €400/m (from smallest to largest conductor). Costs for subsea mass-impregnated cables used in HVDC CSC transmission systems are comparable to subsea XLPE cables. As cable volumes increase, prices are reduced due to manufacturing scale effects.
6.12 OVERHEAD LINES There are several components to an overhead line circuit that will each have separate suppliers, such as tower fabrication, conductors, insulators and site civil works. Various factors relating to planning consents, transmission circuit design, cost and supply chain for cables and overhead line components will dictate the use of overhead lines or cables for connection of an offshore transmission network
6.12.1 HVAC Local manufacturers of HVAC OHL and associated insulation components include Eve Group, LSTC, Nexans and Pfisterer. Isoelectric, NGK Insulators and OTDS manufacture a range of high voltage insulators. A number of manufacturers are also located in Asia and the Middle East. Overhead line manufacture is significantly less complex than cable manufacture and requires less material. The supply chain is not expected to be a technology constraint for ISLES.
6.12.2 HVDC It is anticipated that a number of HVDC overhead lines (OHL) may be constructed for ISLES. No HVDC OHL have been built in the United Kingdom to date. Overhead line conductors utilised for HVAC transmission can also be used for HVDC transmission. HVDC overhead lines generally utilise polymer suspension insulators.
6.12.3 Towers and Foundations Towers are fabricated as required by specialist manufacturers in the UK and Europe and are generally based on design templates which are modified for project specifications. Overhead lines can be attached to the tower using a suspension or angled configuration, this influences tower loading and thus, design.
Foundations are designed to correspond to tower specifications, based on standard templates. Foundation installation and other site civil works are supplied by local contractors such as Eve Group. HVDC transmission has reduced tower and foundation requirements.
6.13 RAW MATERIALS The availability of raw materials such as steel and copper has a large impact on the cost and manufacturing lead time of cables, substation equipment and structure. For example, raw materials
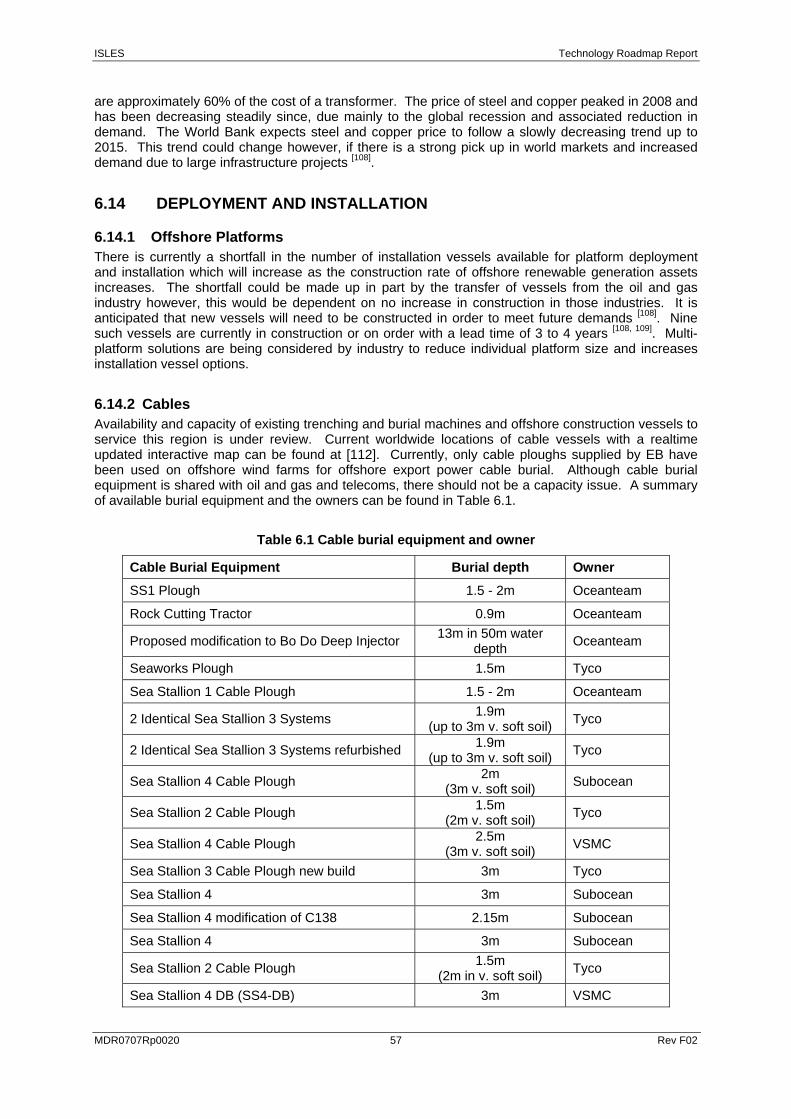
ISLES Technology Roadmap Report
MDR0707Rp0020 57 Rev F02
are approximately 60% of the cost of a transformer. The price of steel and copper peaked in 2008 and has been decreasing steadily since, due mainly to the global recession and associated reduction in demand. The World Bank expects steel and copper price to follow a slowly decreasing trend up to 2015. This trend could change however, if there is a strong pick up in world markets and increased demand due to large infrastructure projects [108].
6.14 DEPLOYMENT AND INSTALLATION
6.14.1 Offshore Platforms There is currently a shortfall in the number of installation vessels available for platform deployment and installation which will increase as the construction rate of offshore renewable generation assets increases. The shortfall could be made up in part by the transfer of vessels from the oil and gas industry however, this would be dependent on no increase in construction in those industries. It is anticipated that new vessels will need to be constructed in order to meet future demands [108]. Nine such vessels are currently in construction or on order with a lead time of 3 to 4 years [108, 109]. Multi-platform solutions are being considered by industry to reduce individual platform size and increases installation vessel options.
6.14.2 Cables Availability and capacity of existing trenching and burial machines and offshore construction vessels to service this region is under review. Current worldwide locations of cable vessels with a realtime updated interactive map can be found at [112]. Currently, only cable ploughs supplied by EB have been used on offshore wind farms for offshore export power cable burial. Although cable burial equipment is shared with oil and gas and telecoms, there should not be a capacity issue. A summary of available burial equipment and the owners can be found in Table 6.1.
Table 6.1 Cable burial equipment and owner
Cable Burial Equipment Burial depth Owner
SS1 Plough 1.5 - 2m Oceanteam
Rock Cutting Tractor 0.9m Oceanteam
Proposed modification to Bo Do Deep Injector 13m in 50m water depth Oceanteam
Seaworks Plough 1.5m Tyco
Sea Stallion 1 Cable Plough 1.5 - 2m Oceanteam
2 Identical Sea Stallion 3 Systems 1.9m (up to 3m v. soft soil) Tyco
2 Identical Sea Stallion 3 Systems refurbished 1.9m (up to 3m v. soft soil) Tyco
Sea Stallion 4 Cable Plough 2m (3m v. soft soil) Subocean
Sea Stallion 2 Cable Plough 1.5m (2m v. soft soil) Tyco
Sea Stallion 4 Cable Plough 2.5m (3m v. soft soil) VSMC
Sea Stallion 3 Cable Plough new build 3m Tyco
Sea Stallion 4 3m Subocean
Sea Stallion 4 modification of C138 2.15m Subocean
Sea Stallion 4 3m Subocean
Sea Stallion 2 Cable Plough 1.5m (2m in v. soft soil) Tyco
Sea Stallion 4 DB (SS4-DB) 3m VSMC

ISLES Technology Roadmap Report
MDR0707Rp0020 58 Rev F02
If new build equipment is required, the lead times given in Table 6.2 are typical.
Table 6.2 Lead time for new build cable installation equipment
Type of work Lead time
New-build cable plough 4 – 6 months
New-build trenching machine ( jetting & cutting ) 6 – 8 months
New-build cable turntable 8 - 12 months New-build cable laying vessel or vessel conversion
12 – 24 months (depending on extent of modification)
ISLES Technology Roadmap Report
MDR0707Rp0020 59 Rev F02
7 GENERATION TECHNOLOGY
7.1 INTRODUCTION A detailed resource assessment was carried out for the offshore areas of Republic of Ireland, Northern Ireland, and Scotland and within the credible boundaries for an ISLES Development Zone and is presented in a separate Resource Assessment report. This utilises generation technology status and trends for offshore wind, wave and tidal energy devices to define credible offshore energy development areas for connection to the ISLES offshore transmission network.
Generation technology is assessed in depth here, with a review of design and operational characteristics, industry maturity and progression, and cost profiles. This provides some further insight into the selection of viable resources for ISLES and how such a network might operate most effectively across different geographic regions and jurisdictions based on the generation technology types.
Theoretical development of wave and tidal stream energy converters has been discussed since the 1970s. Despite this, relatively few concepts have been successfully demonstrated at anything like full scale and fewer still have been grid connected. In the UK, the first commercial offshore wind farm at North Hoyle was commissioned in 2003 and since then the UK’s capacity has grown steadily. Arklow Bank offshore wind farm is the first commercial offshore wind farm for the Republic of Ireland.
The commercial development of offshore windfarms, wave and tidal generation technologies is reviewed here in relation to the development of ISLES. Other marine generation technology is available that utilises thermal/salinity gradients, however these devices do not appear to be close to market and are not applicable to the current study. The maturity of offshore renewable generation technology is categorised in the following way;
Commercial: Device technology has been operating commercially for some time.
Pre-commercial: Plans for commercial deployment are underway and installation is expected in the next couple of years.
Full-scale: A full-scale demonstration device has undergone extensive sea (or land for offshore wind turbines) trials.
In development: A device is under development for full-scale trials.
Part-scale (Sea): Scale model of the prototype or prototype system components have undergone sea trials to verify proof of concept.
Part-scale (Tank): Scale model of the prototype or prototype system components have undergone tank testing to assess proof of concept.
Concept: Academic or similar research have identified the concept as feasible and noteworthy.
7.2 OFFSHORE WIND TURBINES
7.2.1 Technology History As economic utility scale onshore wind farm sites become exhausted in the UK and Western Europe, the focus of the wind industry is on re-powering existing sites and development of offshore sites. Major manufacturers are developing multi MW turbines to take full advantage of the offshore market. Although relatively mature compared to wave and tidal technology, the offshore wind turbine sector is

ISLES Technology Roadmap Report
MDR0707Rp0020 60 Rev F02
still an emerging market. The technology is predominantly leveraged off the onshore market, with additional opportunities and limitations resulting from the offshore environment. Restricted maintenance schedules, increased load factors, reduced noise and visual constraints and transport by sea have resulted in specific (larger) offshore models being developed. Turbine gearboxes in Horns Rev and Scroby Sands offshore wind farms had to be replaced or repaired early in their lifetime partially due to an underestimation of the challenges of marinising onshore designs.
The UK’s first offshore wind installation, consisting of two 2 MW units was commissioned in 2000. In 2003, the first commercial offshore wind farms came on stream, followed in 2007 by the first deep water site, Beatrice. In 2010, there is over 1 GW of installed offshore capacity in the UK with an almost equal amount under construction [113]. In the Republic of Ireland, there is a total current offshore capacity of 25 MW.
7.2.2 State of the Art Offshore turbines of 3 MW are the current standard, with manufacturers continually developing larger turbines. Current development suggests that units of 5 MW could soon become standard with the recent installation of six REpower 5M units and six Alstom Grid Multibrid M5000 units at the Alpha Ventus offshore wind farm and large orders for a number of other developments. REpower have three commercial 6 MW machines operating onshore and Enercon has developed a 7.5 MW design, although the Enercon model is developed for onshore wind farms. In 2008, Clipper announced the Britannia project that aims to develop a 10MW wind turbine for deployment in 2012/13 [114].
Table 7.1 gives details of offshore wind turbines available and in development. There are presently five manufacturers operating at scale in the offshore market; Siemens, Sinovel, REpower, Alstom Grid and Vestas with a number of other players developing large offshore models. There is currently a great deal of investment in the Chinese offshore wind market which is growing rapidly.
Table 7.1 Offshore Wind Turbines
Turbine Development status Rated power
Vestas V90 Commercial 3 MW
Vestas Commercial 7 MW
Sinovel Commercial 3 MW
Sinovel In development 5 MW
GE Energy 3.6sl Commercial 3.6 MW
GE Power and Water 4.0-110 Commercial 4 MW
Siemens PMG SWT-3.6 Commercial 3.6 MW
REPower 5M Commercial 5 MW
REPower 6M Pre-commercial 6 MW
Alstom Grid Multibrid M5000 Commercial 5 MW
Darwind In development (launch 2011) 5 MW
Bard (Gamesa) Pre-commercial 5 MW
Bard (Gamesa) In development 6.5 MW
Clipper WindPower In development 10 MW
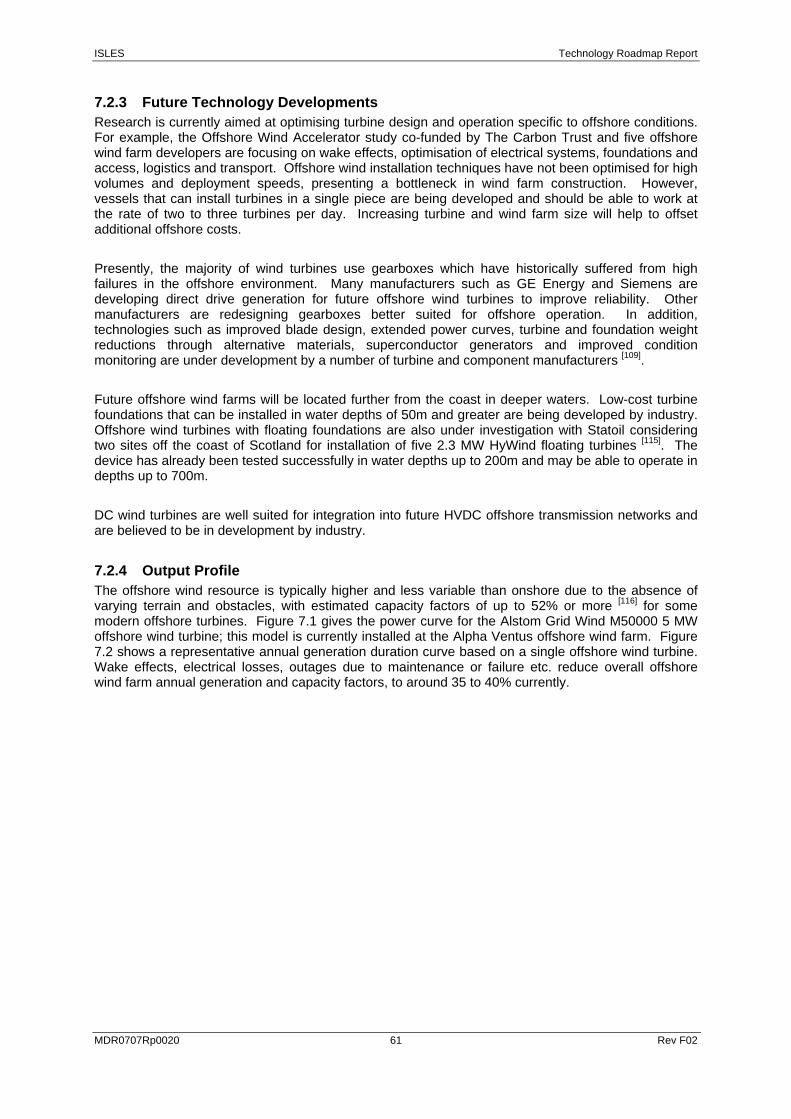
ISLES Technology Roadmap Report
MDR0707Rp0020 61 Rev F02
7.2.3 Future Technology Developments Research is currently aimed at optimising turbine design and operation specific to offshore conditions. For example, the Offshore Wind Accelerator study co-funded by The Carbon Trust and five offshore wind farm developers are focusing on wake effects, optimisation of electrical systems, foundations and access, logistics and transport. Offshore wind installation techniques have not been optimised for high volumes and deployment speeds, presenting a bottleneck in wind farm construction. However, vessels that can install turbines in a single piece are being developed and should be able to work at the rate of two to three turbines per day. Increasing turbine and wind farm size will help to offset additional offshore costs.
Presently, the majority of wind turbines use gearboxes which have historically suffered from high failures in the offshore environment. Many manufacturers such as GE Energy and Siemens are developing direct drive generation for future offshore wind turbines to improve reliability. Other manufacturers are redesigning gearboxes better suited for offshore operation. In addition, technologies such as improved blade design, extended power curves, turbine and foundation weight reductions through alternative materials, superconductor generators and improved condition monitoring are under development by a number of turbine and component manufacturers [109].
Future offshore wind farms will be located further from the coast in deeper waters. Low-cost turbine foundations that can be installed in water depths of 50m and greater are being developed by industry. Offshore wind turbines with floating foundations are also under investigation with Statoil considering two sites off the coast of Scotland for installation of five 2.3 MW HyWind floating turbines [115]. The device has already been tested successfully in water depths up to 200m and may be able to operate in depths up to 700m.
DC wind turbines are well suited for integration into future HVDC offshore transmission networks and are believed to be in development by industry.
7.2.4 Output Profile The offshore wind resource is typically higher and less variable than onshore due to the absence of varying terrain and obstacles, with estimated capacity factors of up to 52% or more [116] for some modern offshore turbines. Figure 7.1 gives the power curve for the Alstom Grid Wind M50000 5 MW offshore wind turbine; this model is currently installed at the Alpha Ventus offshore wind farm. Figure 7.2 shows a representative annual generation duration curve based on a single offshore wind turbine. Wake effects, electrical losses, outages due to maintenance or failure etc. reduce overall offshore wind farm annual generation and capacity factors, to around 35 to 40% currently.
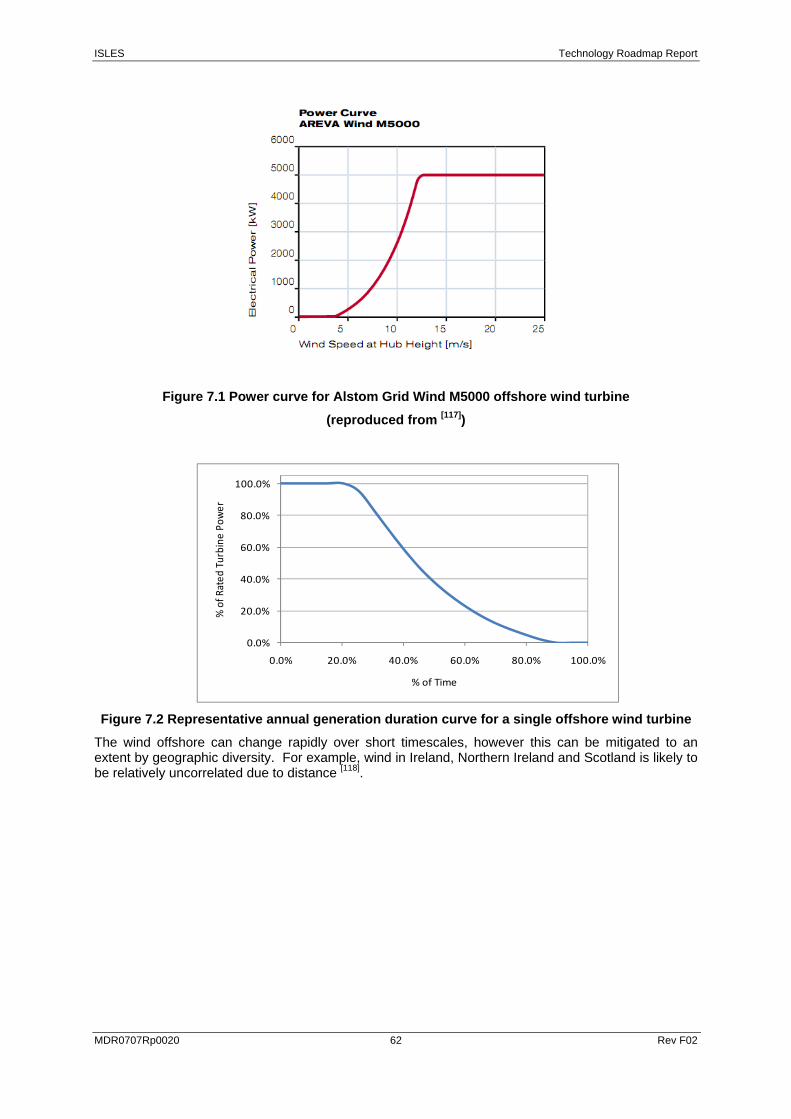
ISLES Technology Roadmap Report
MDR0707Rp0020 62 Rev F02
Figure 7.1 Power curve for Alstom Grid Wind M5000 offshore wind turbine
(reproduced from [117])
0.0%
20.0%
40.0%
60.0%
80.0%
100.0%
0.0% 20.0% 40.0% 60.0% 80.0% 100.0%
% of R
ated
Turbine
Pow
er
% of Time
Figure 7.2 Representative annual generation duration curve for a single offshore wind turbine
The wind offshore can change rapidly over short timescales, however this can be mitigated to an extent by geographic diversity. For example, wind in Ireland, Northern Ireland and Scotland is likely to be relatively uncorrelated due to distance [118].
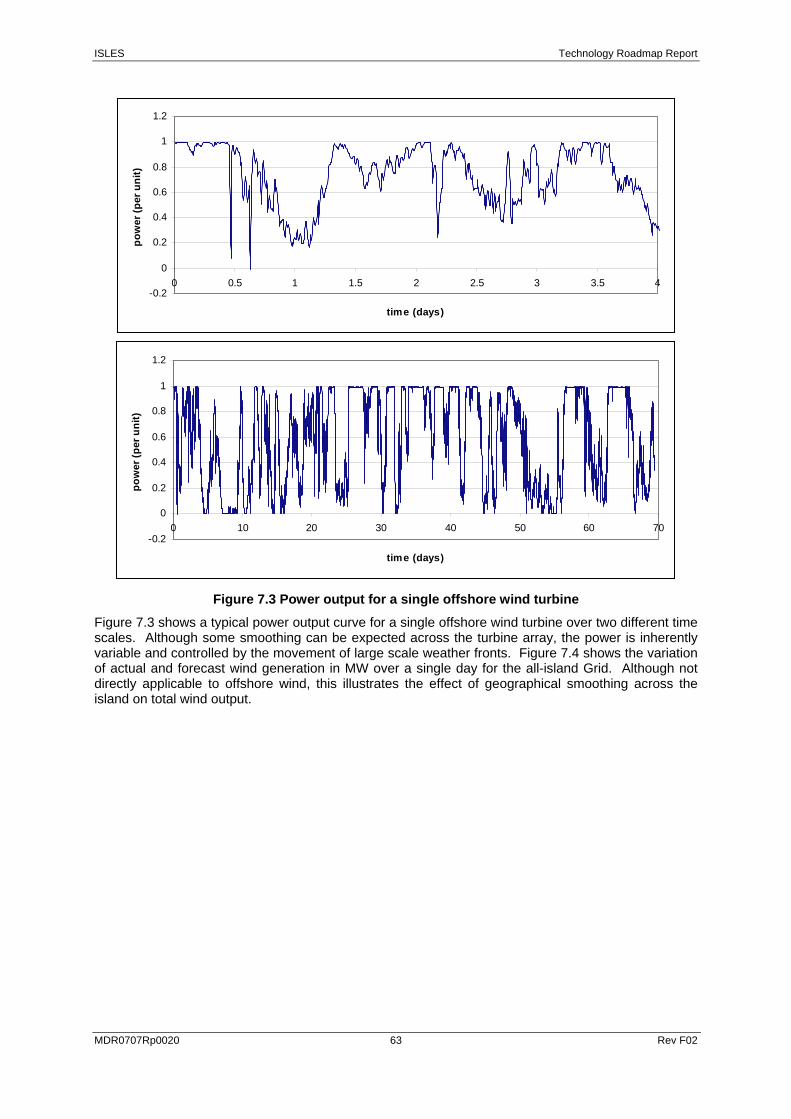
ISLES Technology Roadmap Report
MDR0707Rp0020 63 Rev F02
-0.2
0
0.2
0.4
0.6
0.8
1
1.2
0 0.5 1 1.5 2 2.5 3 3.5 4
time (days)
pow
er (p
er u
nit)
-0.2
0
0.2
0.4
0.6
0.8
1
1.2
0 10 20 30 40 50 60 70
time (days)
pow
er (p
er u
nit)
Figure 7.3 Power output for a single offshore wind turbine
Figure 7.3 shows a typical power output curve for a single offshore wind turbine over two different time scales. Although some smoothing can be expected across the turbine array, the power is inherently variable and controlled by the movement of large scale weather fronts. Figure 7.4 shows the variation of actual and forecast wind generation in MW over a single day for the all-island Grid. Although not directly applicable to offshore wind, this illustrates the effect of geographical smoothing across the island on total wind output.
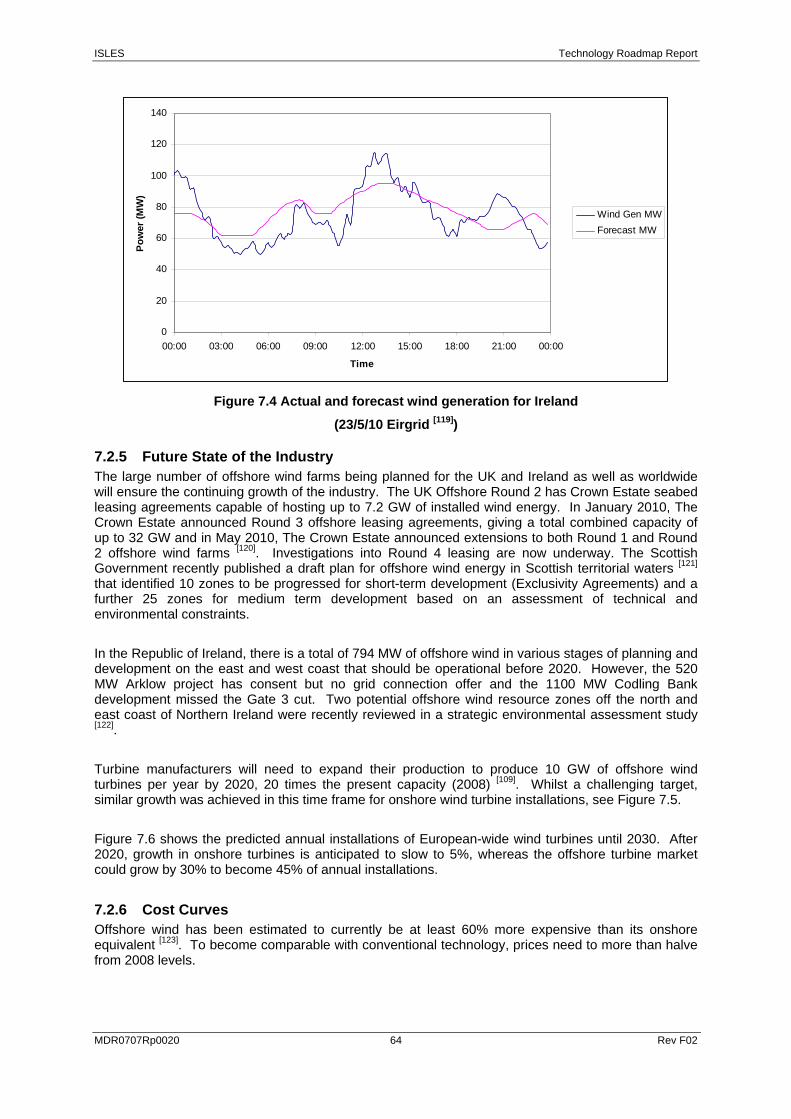
ISLES Technology Roadmap Report
MDR0707Rp0020 64 Rev F02
0
20
40
60
80
100
120
140
00:00 03:00 06:00 09:00 12:00 15:00 18:00 21:00 00:00
Time
Pow
er (M
W)
Wind Gen MWForecast MW
Figure 7.4 Actual and forecast wind generation for Ireland
(23/5/10 Eirgrid [119])
7.2.5 Future State of the Industry The large number of offshore wind farms being planned for the UK and Ireland as well as worldwide will ensure the continuing growth of the industry. The UK Offshore Round 2 has Crown Estate seabed leasing agreements capable of hosting up to 7.2 GW of installed wind energy. In January 2010, The Crown Estate announced Round 3 offshore leasing agreements, giving a total combined capacity of up to 32 GW and in May 2010, The Crown Estate announced extensions to both Round 1 and Round 2 offshore wind farms [120]. Investigations into Round 4 leasing are now underway. The Scottish Government recently published a draft plan for offshore wind energy in Scottish territorial waters [121] that identified 10 zones to be progressed for short-term development (Exclusivity Agreements) and a further 25 zones for medium term development based on an assessment of technical and environmental constraints.
In the Republic of Ireland, there is a total of 794 MW of offshore wind in various stages of planning and development on the east and west coast that should be operational before 2020. However, the 520 MW Arklow project has consent but no grid connection offer and the 1100 MW Codling Bank development missed the Gate 3 cut. Two potential offshore wind resource zones off the north and east coast of Northern Ireland were recently reviewed in a strategic environmental assessment study [122].
Turbine manufacturers will need to expand their production to produce 10 GW of offshore wind turbines per year by 2020, 20 times the present capacity (2008) [109]. Whilst a challenging target, similar growth was achieved in this time frame for onshore wind turbine installations, see Figure 7.5.
Figure 7.6 shows the predicted annual installations of European-wide wind turbines until 2030. After 2020, growth in onshore turbines is anticipated to slow to 5%, whereas the offshore turbine market could grow by 30% to become 45% of annual installations.
7.2.6 Cost Curves Offshore wind has been estimated to currently be at least 60% more expensive than its onshore equivalent [123]. To become comparable with conventional technology, prices need to more than halve from 2008 levels.
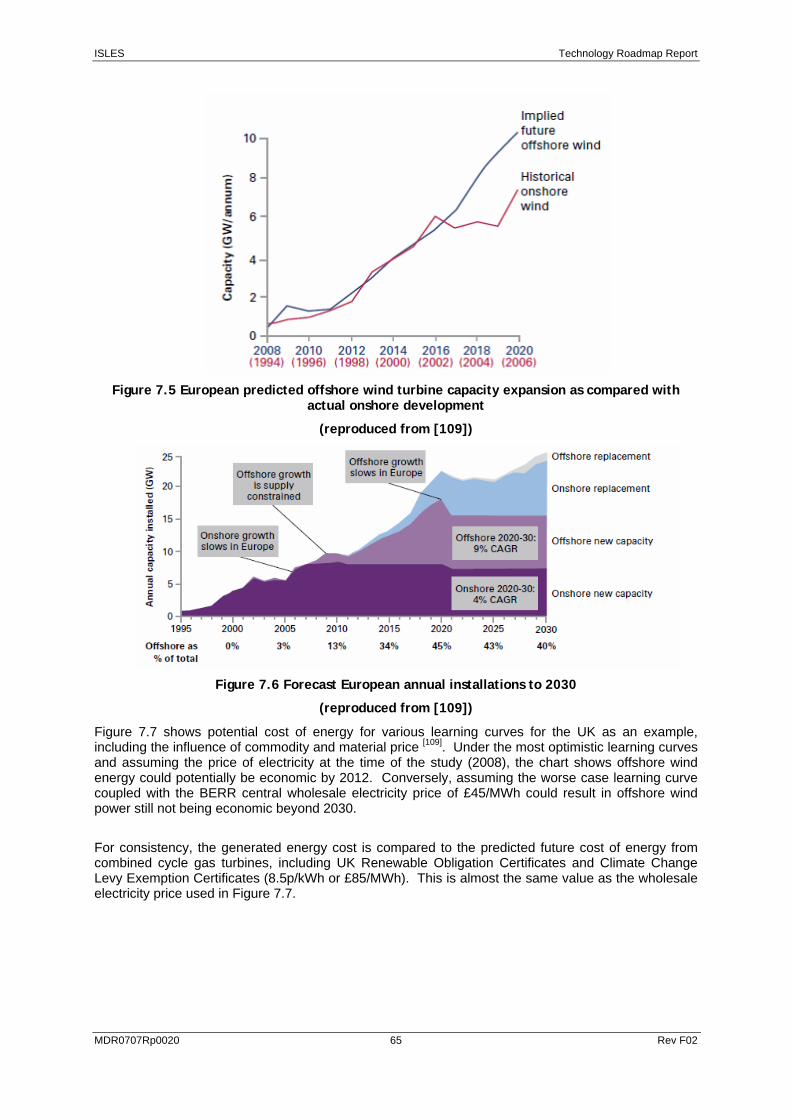
ISLES Technology Roadmap Report
MDR0707Rp0020 65 Rev F02
Figure 7.5 European predicted offshore wind turbine capacity expansion as compared with
actual onshore development
(reproduced from [109])
Figure 7.6 Forecast European annual installations to 2030
(reproduced from [109])
Figure 7.7 shows potential cost of energy for various learning curves for the UK as an example, including the influence of commodity and material price [109]. Under the most optimistic learning curves and assuming the price of electricity at the time of the study (2008), the chart shows offshore wind energy could potentially be economic by 2012. Conversely, assuming the worse case learning curve coupled with the BERR central wholesale electricity price of £45/MWh could result in offshore wind power still not being economic beyond 2030.
For consistency, the generated energy cost is compared to the predicted future cost of energy from combined cycle gas turbines, including UK Renewable Obligation Certificates and Climate Change Levy Exemption Certificates (8.5p/kWh or £85/MWh). This is almost the same value as the wholesale electricity price used in Figure 7.7.
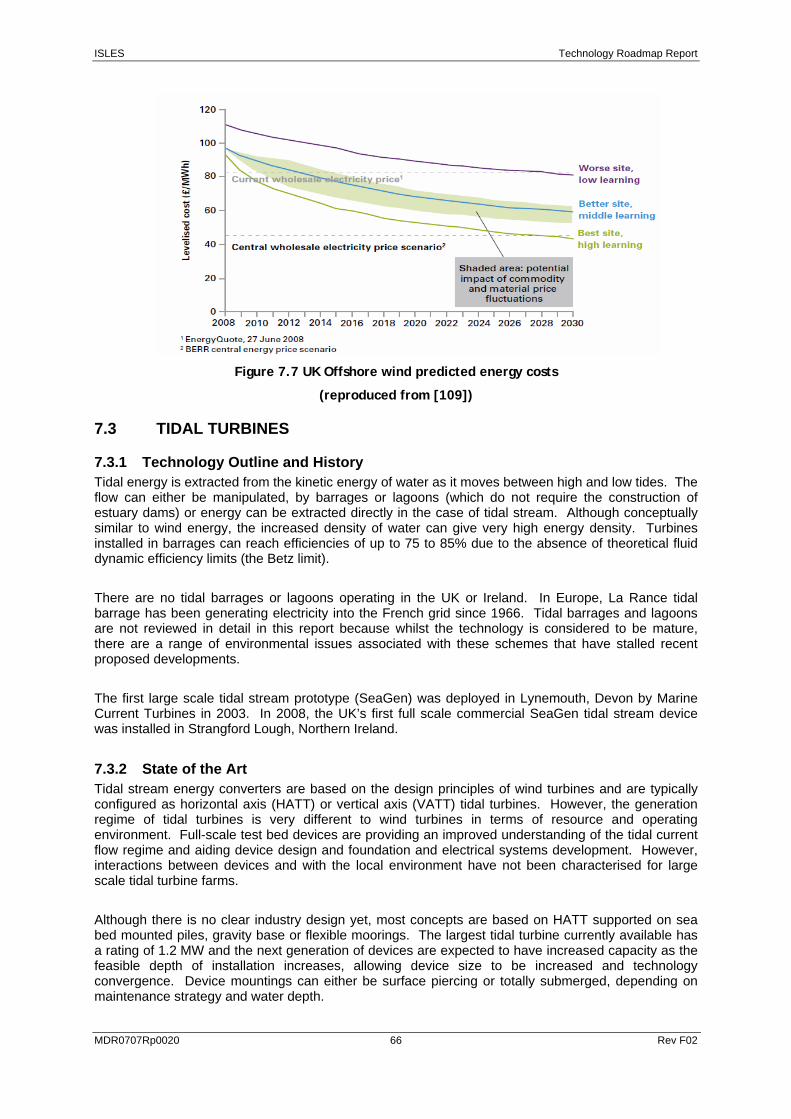
ISLES Technology Roadmap Report
MDR0707Rp0020 66 Rev F02
Figure 7.7 UK Offshore wind predicted energy costs
(reproduced from [109])
7.3 TIDAL TURBINES
7.3.1 Technology Outline and History Tidal energy is extracted from the kinetic energy of water as it moves between high and low tides. The flow can either be manipulated, by barrages or lagoons (which do not require the construction of estuary dams) or energy can be extracted directly in the case of tidal stream. Although conceptually similar to wind energy, the increased density of water can give very high energy density. Turbines installed in barrages can reach efficiencies of up to 75 to 85% due to the absence of theoretical fluid dynamic efficiency limits (the Betz limit).
There are no tidal barrages or lagoons operating in the UK or Ireland. In Europe, La Rance tidal barrage has been generating electricity into the French grid since 1966. Tidal barrages and lagoons are not reviewed in detail in this report because whilst the technology is considered to be mature, there are a range of environmental issues associated with these schemes that have stalled recent proposed developments.
The first large scale tidal stream prototype (SeaGen) was deployed in Lynemouth, Devon by Marine Current Turbines in 2003. In 2008, the UK’s first full scale commercial SeaGen tidal stream device was installed in Strangford Lough, Northern Ireland.
7.3.2 State of the Art Tidal stream energy converters are based on the design principles of wind turbines and are typically configured as horizontal axis (HATT) or vertical axis (VATT) tidal turbines. However, the generation regime of tidal turbines is very different to wind turbines in terms of resource and operating environment. Full-scale test bed devices are providing an improved understanding of the tidal current flow regime and aiding device design and foundation and electrical systems development. However, interactions between devices and with the local environment have not been characterised for large scale tidal turbine farms.
Although there is no clear industry design yet, most concepts are based on HATT supported on sea bed mounted piles, gravity base or flexible moorings. The largest tidal turbine currently available has a rating of 1.2 MW and the next generation of devices are expected to have increased capacity as the feasible depth of installation increases, allowing device size to be increased and technology convergence. Device mountings can either be surface piercing or totally submerged, depending on maintenance strategy and water depth.
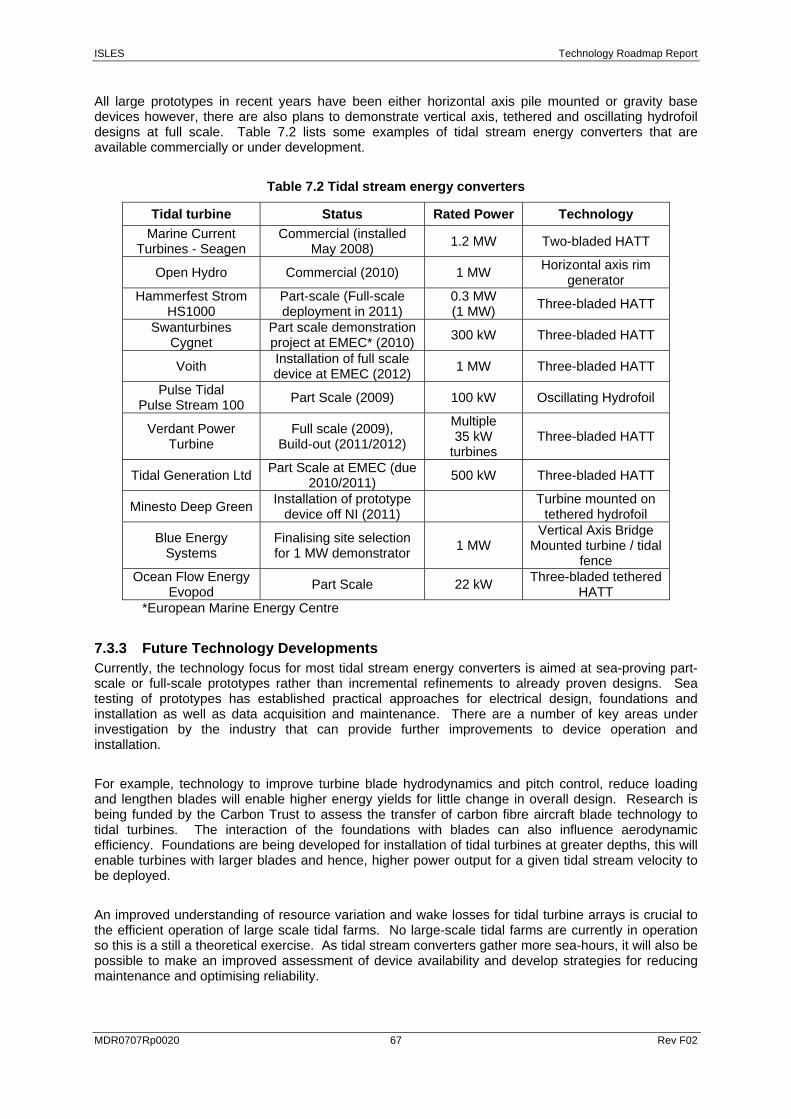
ISLES Technology Roadmap Report
MDR0707Rp0020 67 Rev F02
All large prototypes in recent years have been either horizontal axis pile mounted or gravity base devices however, there are also plans to demonstrate vertical axis, tethered and oscillating hydrofoil designs at full scale. Table 7.2 lists some examples of tidal stream energy converters that are available commercially or under development.
Table 7.2 Tidal stream energy converters
Tidal turbine Status Rated Power Technology Marine Current
Turbines - Seagen Commercial (installed
May 2008) 1.2 MW Two-bladed HATT
Open Hydro Commercial (2010) 1 MW Horizontal axis rim generator
Hammerfest Strom HS1000
Part-scale (Full-scale deployment in 2011)
0.3 MW (1 MW) Three-bladed HATT
Swanturbines Cygnet
Part scale demonstration project at EMEC* (2010) 300 kW Three-bladed HATT
Voith Installation of full scale device at EMEC (2012) 1 MW Three-bladed HATT
Pulse Tidal Pulse Stream 100 Part Scale (2009) 100 kW Oscillating Hydrofoil
Verdant Power Turbine
Full scale (2009), Build-out (2011/2012)
Multiple 35 kW
turbines Three-bladed HATT
Tidal Generation Ltd Part Scale at EMEC (due 2010/2011) 500 kW Three-bladed HATT
Minesto Deep Green Installation of prototype device off NI (2011) Turbine mounted on
tethered hydrofoil
Blue Energy Systems
Finalising site selection for 1 MW demonstrator 1 MW
Vertical Axis Bridge Mounted turbine / tidal
fence Ocean Flow Energy
Evopod Part Scale 22 kW Three-bladed tethered HATT
*European Marine Energy Centre
7.3.3 Future Technology Developments Currently, the technology focus for most tidal stream energy converters is aimed at sea-proving part-scale or full-scale prototypes rather than incremental refinements to already proven designs. Sea testing of prototypes has established practical approaches for electrical design, foundations and installation as well as data acquisition and maintenance. There are a number of key areas under investigation by the industry that can provide further improvements to device operation and installation.
For example, technology to improve turbine blade hydrodynamics and pitch control, reduce loading and lengthen blades will enable higher energy yields for little change in overall design. Research is being funded by the Carbon Trust to assess the transfer of carbon fibre aircraft blade technology to tidal turbines. The interaction of the foundations with blades can also influence aerodynamic efficiency. Foundations are being developed for installation of tidal turbines at greater depths, this will enable turbines with larger blades and hence, higher power output for a given tidal stream velocity to be deployed.
An improved understanding of resource variation and wake losses for tidal turbine arrays is crucial to the efficient operation of large scale tidal farms. No large-scale tidal farms are currently in operation so this is a still a theoretical exercise. As tidal stream converters gather more sea-hours, it will also be possible to make an improved assessment of device availability and develop strategies for reducing maintenance and optimising reliability.
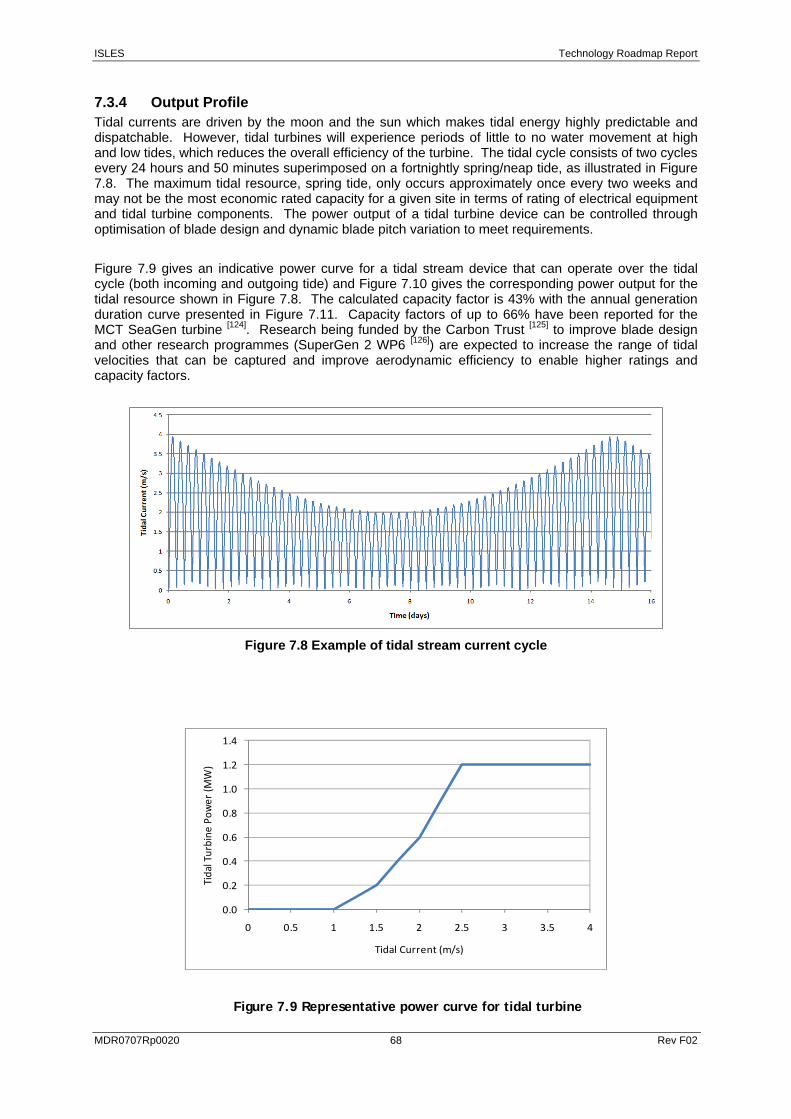
ISLES Technology Roadmap Report
MDR0707Rp0020 68 Rev F02
7.3.4 Output Profile Tidal currents are driven by the moon and the sun which makes tidal energy highly predictable and dispatchable. However, tidal turbines will experience periods of little to no water movement at high and low tides, which reduces the overall efficiency of the turbine. The tidal cycle consists of two cycles every 24 hours and 50 minutes superimposed on a fortnightly spring/neap tide, as illustrated in Figure 7.8. The maximum tidal resource, spring tide, only occurs approximately once every two weeks and may not be the most economic rated capacity for a given site in terms of rating of electrical equipment and tidal turbine components. The power output of a tidal turbine device can be controlled through optimisation of blade design and dynamic blade pitch variation to meet requirements.
Figure 7.9 gives an indicative power curve for a tidal stream device that can operate over the tidal cycle (both incoming and outgoing tide) and Figure 7.10 gives the corresponding power output for the tidal resource shown in Figure 7.8. The calculated capacity factor is 43% with the annual generation duration curve presented in Figure 7.11. Capacity factors of up to 66% have been reported for the MCT SeaGen turbine [124]. Research being funded by the Carbon Trust [125] to improve blade design and other research programmes (SuperGen 2 WP6 [126]) are expected to increase the range of tidal velocities that can be captured and improve aerodynamic efficiency to enable higher ratings and capacity factors.
Figure 7.8 Example of tidal stream current cycle
0.0
0.2
0.4
0.6
0.8
1.0
1.2
1.4
0 0.5 1 1.5 2 2.5 3 3.5 4
Tidal Turbine
Pow
er (M
W)
Tidal Current (m/s)
Figure 7.9 Representative power curve for tidal turbine
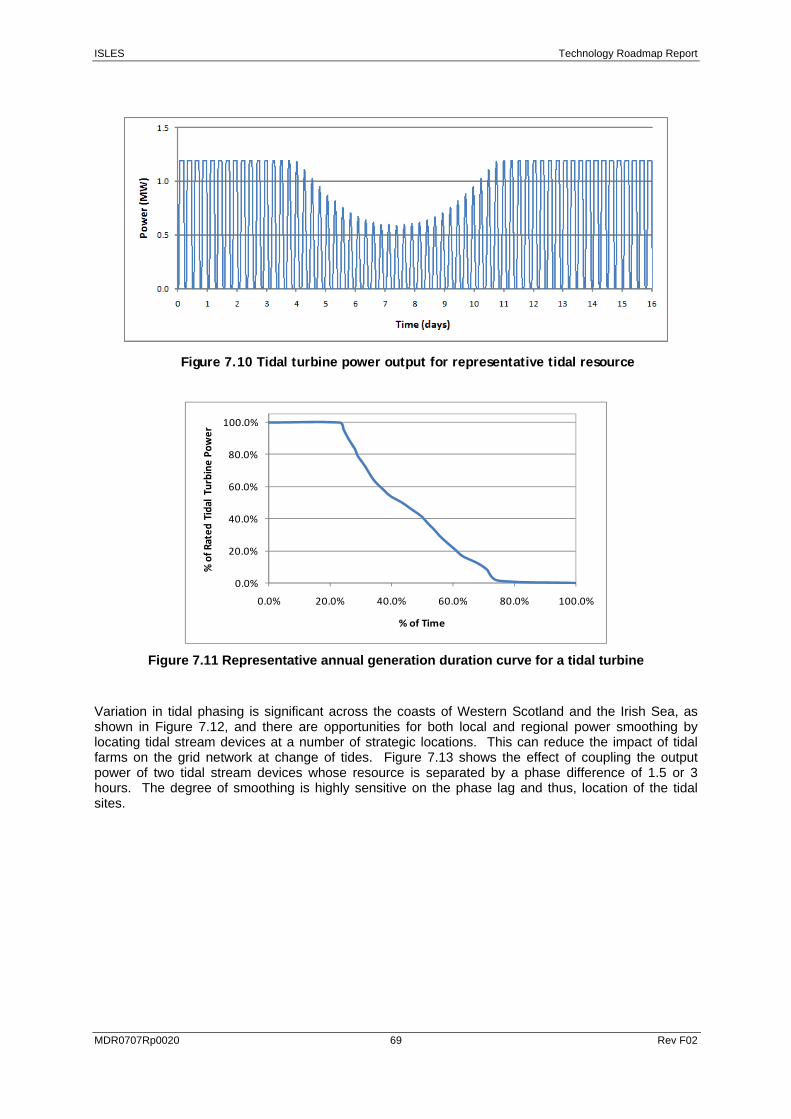
ISLES Technology Roadmap Report
MDR0707Rp0020 69 Rev F02
Figure 7.10 Tidal turbine power output for representative tidal resource
0.0%
20.0%
40.0%
60.0%
80.0%
100.0%
0.0% 20.0% 40.0% 60.0% 80.0% 100.0%
% of R
ated
Tidal Turbine
Pow
er
% of Time
Figure 7.11 Representative annual generation duration curve for a tidal turbine
Variation in tidal phasing is significant across the coasts of Western Scotland and the Irish Sea, as shown in Figure 7.12, and there are opportunities for both local and regional power smoothing by locating tidal stream devices at a number of strategic locations. This can reduce the impact of tidal farms on the grid network at change of tides. Figure 7.13 shows the effect of coupling the output power of two tidal stream devices whose resource is separated by a phase difference of 1.5 or 3 hours. The degree of smoothing is highly sensitive on the phase lag and thus, location of the tidal sites.
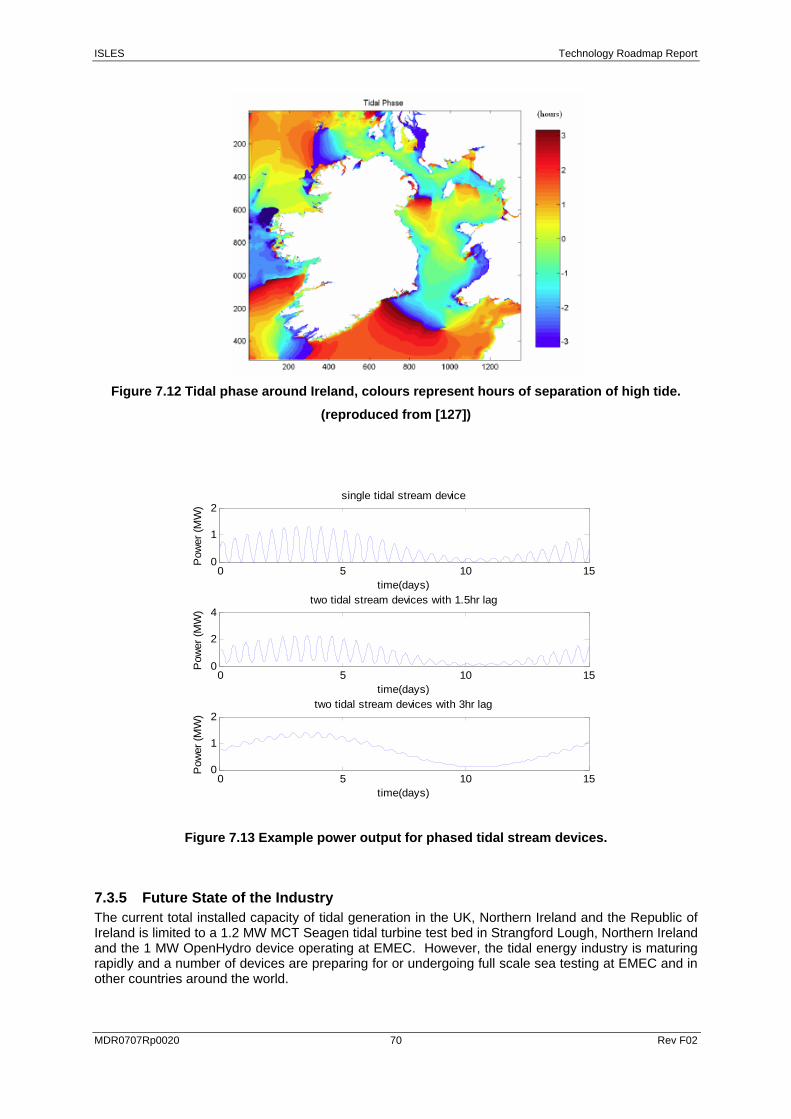
ISLES Technology Roadmap Report
MDR0707Rp0020 70 Rev F02
Figure 7.12 Tidal phase around Ireland, colours represent hours of separation of high tide.
(reproduced from [127])
0 5 10 150
1
2single tidal stream device
time(days)
Pow
er (M
W)
0 5 10 150
2
4
time(days)
Pow
er (M
W)
two tidal stream devices with 1.5hr lag
0 5 10 150
1
2
time(days)
Pow
er (M
W)
two tidal stream devices with 3hr lag
Figure 7.13 Example power output for phased tidal stream devices.
7.3.5 Future State of the Industry The current total installed capacity of tidal generation in the UK, Northern Ireland and the Republic of Ireland is limited to a 1.2 MW MCT Seagen tidal turbine test bed in Strangford Lough, Northern Ireland and the 1 MW OpenHydro device operating at EMEC. However, the tidal energy industry is maturing rapidly and a number of devices are preparing for or undergoing full scale sea testing at EMEC and in other countries around the world.
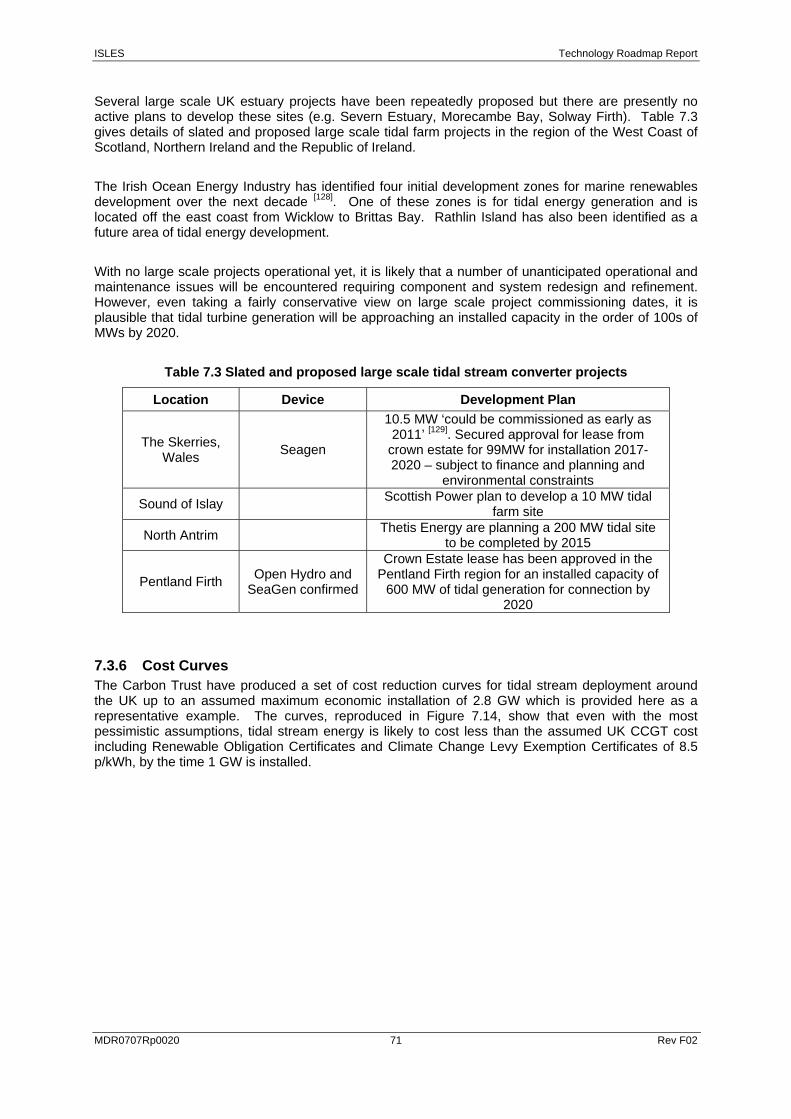
ISLES Technology Roadmap Report
MDR0707Rp0020 71 Rev F02
Several large scale UK estuary projects have been repeatedly proposed but there are presently no active plans to develop these sites (e.g. Severn Estuary, Morecambe Bay, Solway Firth). Table 7.3 gives details of slated and proposed large scale tidal farm projects in the region of the West Coast of Scotland, Northern Ireland and the Republic of Ireland.
The Irish Ocean Energy Industry has identified four initial development zones for marine renewables development over the next decade [128]. One of these zones is for tidal energy generation and is located off the east coast from Wicklow to Brittas Bay. Rathlin Island has also been identified as a future area of tidal energy development.
With no large scale projects operational yet, it is likely that a number of unanticipated operational and maintenance issues will be encountered requiring component and system redesign and refinement. However, even taking a fairly conservative view on large scale project commissioning dates, it is plausible that tidal turbine generation will be approaching an installed capacity in the order of 100s of MWs by 2020.
Table 7.3 Slated and proposed large scale tidal stream converter projects
Location Device Development Plan
The Skerries, Wales Seagen
10.5 MW ‘could be commissioned as early as 2011’ [129]. Secured approval for lease from
crown estate for 99MW for installation 2017-2020 – subject to finance and planning and
environmental constraints
Sound of Islay Scottish Power plan to develop a 10 MW tidal farm site
North Antrim Thetis Energy are planning a 200 MW tidal site to be completed by 2015
Pentland Firth Open Hydro and SeaGen confirmed
Crown Estate lease has been approved in the Pentland Firth region for an installed capacity of
600 MW of tidal generation for connection by 2020
7.3.6 Cost Curves The Carbon Trust have produced a set of cost reduction curves for tidal stream deployment around the UK up to an assumed maximum economic installation of 2.8 GW which is provided here as a representative example. The curves, reproduced in Figure 7.14, show that even with the most pessimistic assumptions, tidal stream energy is likely to cost less than the assumed UK CCGT cost including Renewable Obligation Certificates and Climate Change Levy Exemption Certificates of 8.5 p/kWh, by the time 1 GW is installed.
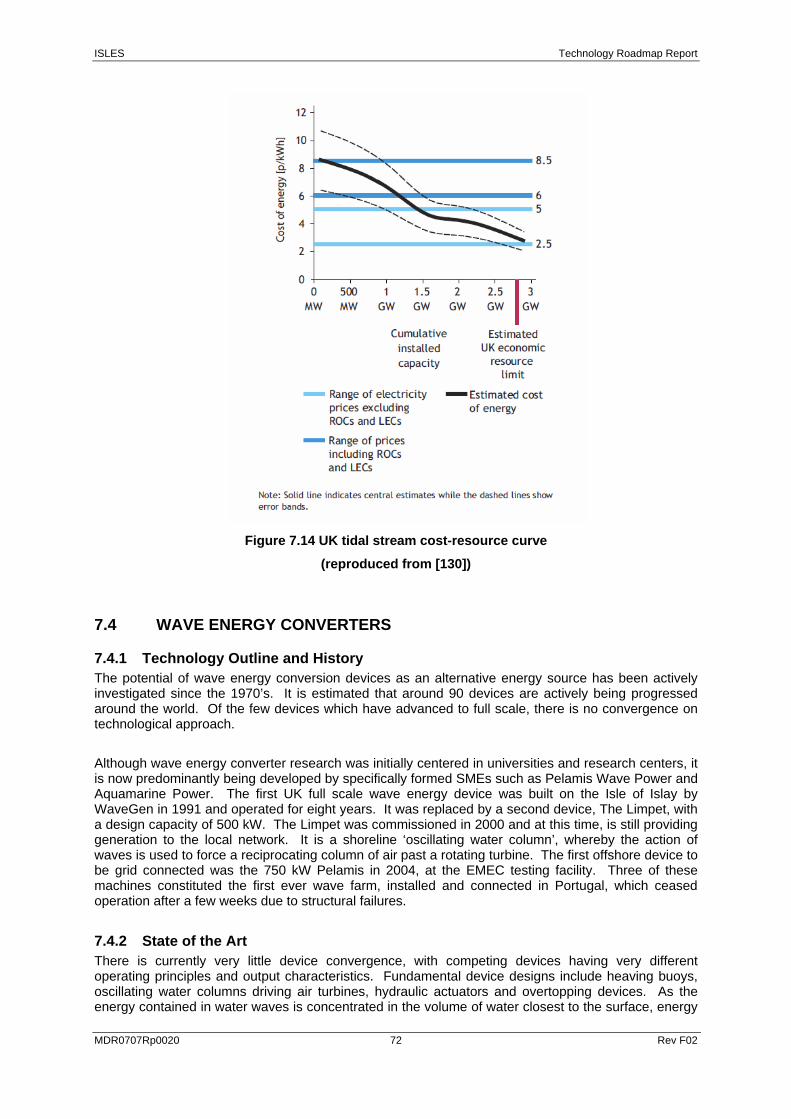
ISLES Technology Roadmap Report
MDR0707Rp0020 72 Rev F02
Figure 7.14 UK tidal stream cost-resource curve
(reproduced from [130])
7.4 WAVE ENERGY CONVERTERS
7.4.1 Technology Outline and History The potential of wave energy conversion devices as an alternative energy source has been actively investigated since the 1970’s. It is estimated that around 90 devices are actively being progressed around the world. Of the few devices which have advanced to full scale, there is no convergence on technological approach.
Although wave energy converter research was initially centered in universities and research centers, it is now predominantly being developed by specifically formed SMEs such as Pelamis Wave Power and Aquamarine Power. The first UK full scale wave energy device was built on the Isle of Islay by WaveGen in 1991 and operated for eight years. It was replaced by a second device, The Limpet, with a design capacity of 500 kW. The Limpet was commissioned in 2000 and at this time, is still providing generation to the local network. It is a shoreline ‘oscillating water column’, whereby the action of waves is used to force a reciprocating column of air past a rotating turbine. The first offshore device to be grid connected was the 750 kW Pelamis in 2004, at the EMEC testing facility. Three of these machines constituted the first ever wave farm, installed and connected in Portugal, which ceased operation after a few weeks due to structural failures.
7.4.2 State of the Art There is currently very little device convergence, with competing devices having very different operating principles and output characteristics. Fundamental device designs include heaving buoys, oscillating water columns driving air turbines, hydraulic actuators and overtopping devices. As the energy contained in water waves is concentrated in the volume of water closest to the surface, energy
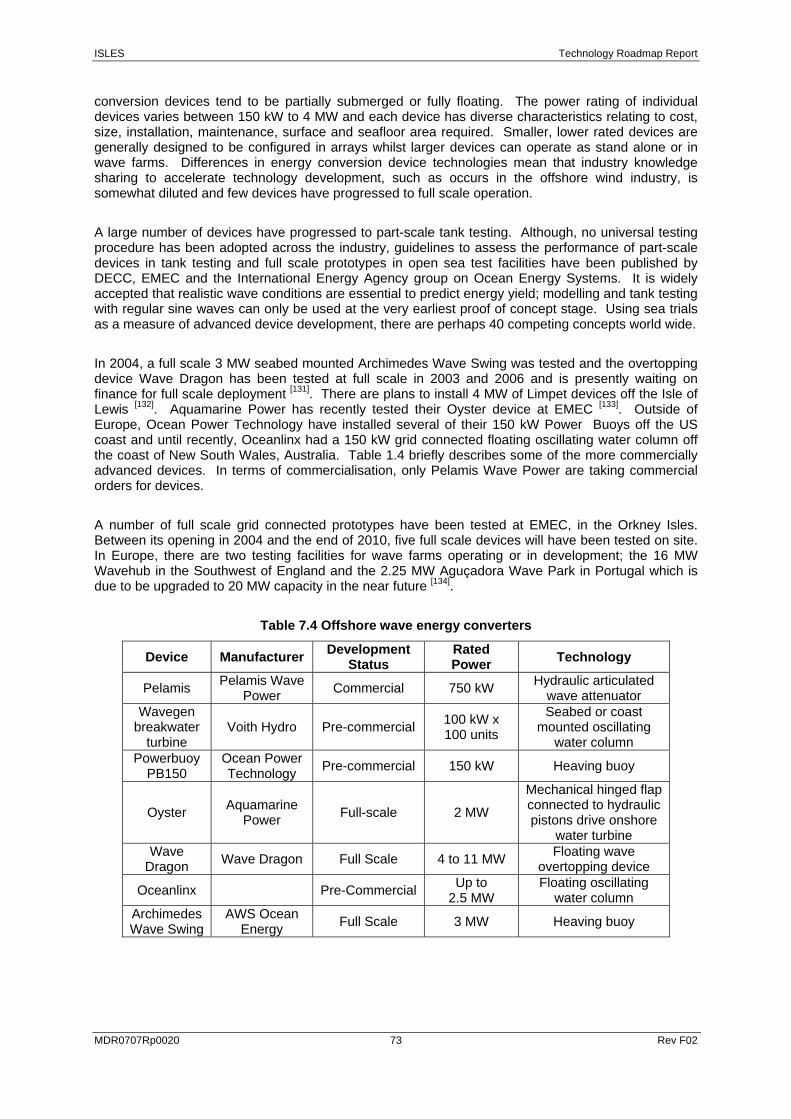
ISLES Technology Roadmap Report
MDR0707Rp0020 73 Rev F02
conversion devices tend to be partially submerged or fully floating. The power rating of individual devices varies between 150 kW to 4 MW and each device has diverse characteristics relating to cost, size, installation, maintenance, surface and seafloor area required. Smaller, lower rated devices are generally designed to be configured in arrays whilst larger devices can operate as stand alone or in wave farms. Differences in energy conversion device technologies mean that industry knowledge sharing to accelerate technology development, such as occurs in the offshore wind industry, is somewhat diluted and few devices have progressed to full scale operation.
A large number of devices have progressed to part-scale tank testing. Although, no universal testing procedure has been adopted across the industry, guidelines to assess the performance of part-scale devices in tank testing and full scale prototypes in open sea test facilities have been published by DECC, EMEC and the International Energy Agency group on Ocean Energy Systems. It is widely accepted that realistic wave conditions are essential to predict energy yield; modelling and tank testing with regular sine waves can only be used at the very earliest proof of concept stage. Using sea trials as a measure of advanced device development, there are perhaps 40 competing concepts world wide.
In 2004, a full scale 3 MW seabed mounted Archimedes Wave Swing was tested and the overtopping device Wave Dragon has been tested at full scale in 2003 and 2006 and is presently waiting on finance for full scale deployment [131]. There are plans to install 4 MW of Limpet devices off the Isle of Lewis [132]. Aquamarine Power has recently tested their Oyster device at EMEC [133]. Outside of Europe, Ocean Power Technology have installed several of their 150 kW Power Buoys off the US coast and until recently, Oceanlinx had a 150 kW grid connected floating oscillating water column off the coast of New South Wales, Australia. Table 1.4 briefly describes some of the more commercially advanced devices. In terms of commercialisation, only Pelamis Wave Power are taking commercial orders for devices.
A number of full scale grid connected prototypes have been tested at EMEC, in the Orkney Isles. Between its opening in 2004 and the end of 2010, five full scale devices will have been tested on site. In Europe, there are two testing facilities for wave farms operating or in development; the 16 MW Wavehub in the Southwest of England and the 2.25 MW Aguçadora Wave Park in Portugal which is due to be upgraded to 20 MW capacity in the near future [134].
Table 7.4 Offshore wave energy converters
Device Manufacturer Development Status
Rated Power Technology
Pelamis Pelamis Wave Power Commercial 750 kW Hydraulic articulated
wave attenuator Wavegen
breakwater turbine
Voith Hydro Pre-commercial 100 kW x 100 units
Seabed or coast mounted oscillating
water column Powerbuoy
PB150 Ocean Power Technology Pre-commercial 150 kW Heaving buoy
Oyster Aquamarine Power Full-scale 2 MW
Mechanical hinged flap connected to hydraulic pistons drive onshore
water turbine Wave
Dragon Wave Dragon Full Scale 4 to 11 MW Floating wave overtopping device
Oceanlinx Pre-Commercial Up to 2.5 MW
Floating oscillating water column
Archimedes Wave Swing
AWS Ocean Energy Full Scale 3 MW Heaving buoy
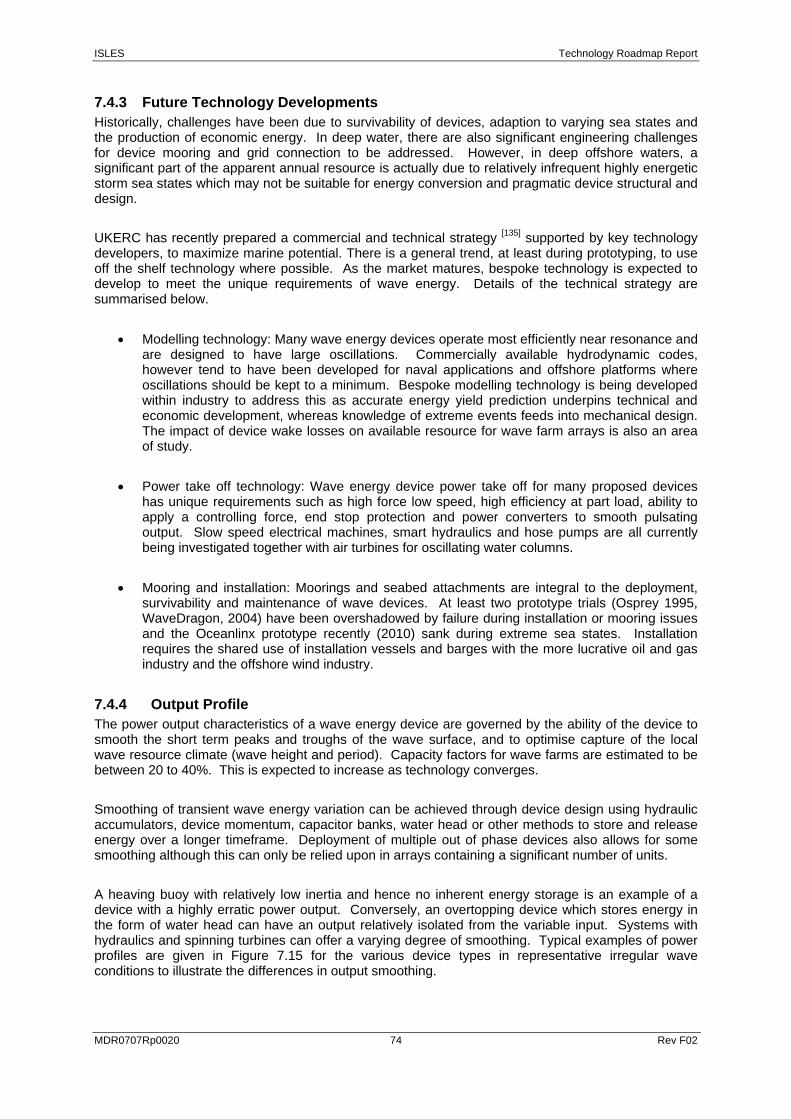
ISLES Technology Roadmap Report
MDR0707Rp0020 74 Rev F02
7.4.3 Future Technology Developments Historically, challenges have been due to survivability of devices, adaption to varying sea states and the production of economic energy. In deep water, there are also significant engineering challenges for device mooring and grid connection to be addressed. However, in deep offshore waters, a significant part of the apparent annual resource is actually due to relatively infrequent highly energetic storm sea states which may not be suitable for energy conversion and pragmatic device structural and design.
UKERC has recently prepared a commercial and technical strategy [135] supported by key technology developers, to maximize marine potential. There is a general trend, at least during prototyping, to use off the shelf technology where possible. As the market matures, bespoke technology is expected to develop to meet the unique requirements of wave energy. Details of the technical strategy are summarised below.
• Modelling technology: Many wave energy devices operate most efficiently near resonance and are designed to have large oscillations. Commercially available hydrodynamic codes, however tend to have been developed for naval applications and offshore platforms where oscillations should be kept to a minimum. Bespoke modelling technology is being developed within industry to address this as accurate energy yield prediction underpins technical and economic development, whereas knowledge of extreme events feeds into mechanical design. The impact of device wake losses on available resource for wave farm arrays is also an area of study.
• Power take off technology: Wave energy device power take off for many proposed devices has unique requirements such as high force low speed, high efficiency at part load, ability to apply a controlling force, end stop protection and power converters to smooth pulsating output. Slow speed electrical machines, smart hydraulics and hose pumps are all currently being investigated together with air turbines for oscillating water columns.
• Mooring and installation: Moorings and seabed attachments are integral to the deployment, survivability and maintenance of wave devices. At least two prototype trials (Osprey 1995, WaveDragon, 2004) have been overshadowed by failure during installation or mooring issues and the Oceanlinx prototype recently (2010) sank during extreme sea states. Installation requires the shared use of installation vessels and barges with the more lucrative oil and gas industry and the offshore wind industry.
7.4.4 Output Profile The power output characteristics of a wave energy device are governed by the ability of the device to smooth the short term peaks and troughs of the wave surface, and to optimise capture of the local wave resource climate (wave height and period). Capacity factors for wave farms are estimated to be between 20 to 40%. This is expected to increase as technology converges.
Smoothing of transient wave energy variation can be achieved through device design using hydraulic accumulators, device momentum, capacitor banks, water head or other methods to store and release energy over a longer timeframe. Deployment of multiple out of phase devices also allows for some smoothing although this can only be relied upon in arrays containing a significant number of units.
A heaving buoy with relatively low inertia and hence no inherent energy storage is an example of a device with a highly erratic power output. Conversely, an overtopping device which stores energy in the form of water head can have an output relatively isolated from the variable input. Systems with hydraulics and spinning turbines can offer a varying degree of smoothing. Typical examples of power profiles are given in Figure 7.15 for the various device types in representative irregular wave conditions to illustrate the differences in output smoothing.
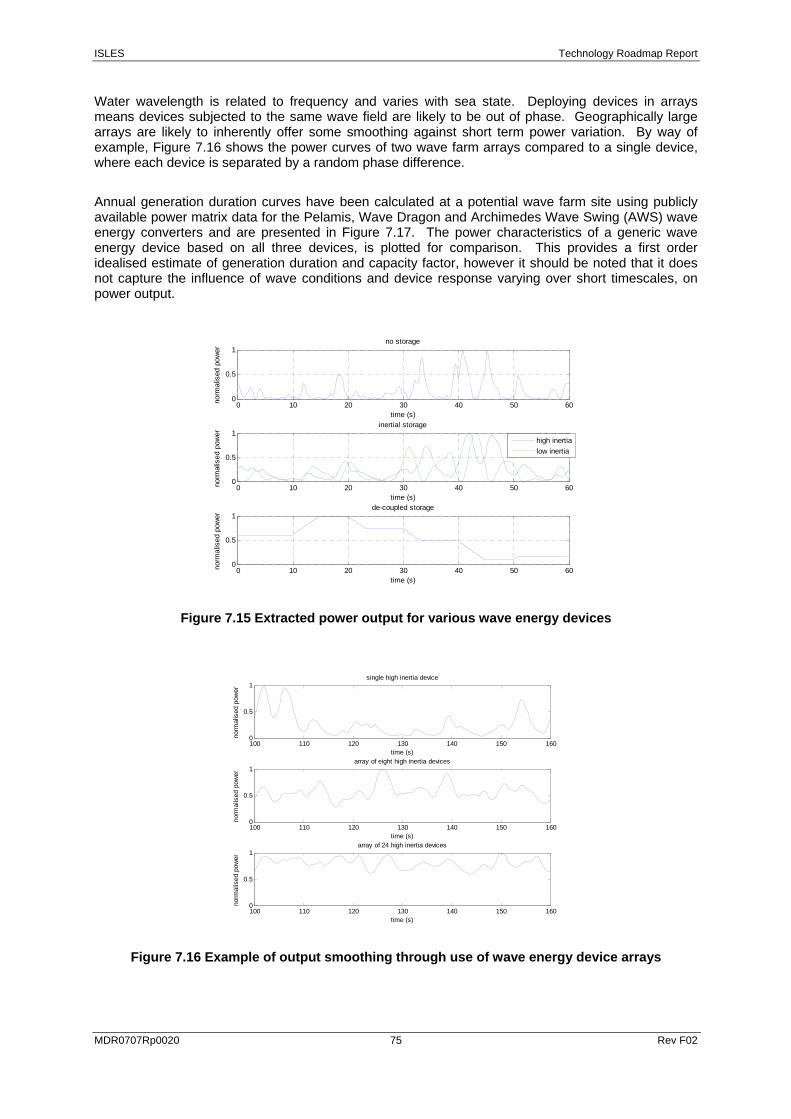
ISLES Technology Roadmap Report
MDR0707Rp0020 75 Rev F02
Water wavelength is related to frequency and varies with sea state. Deploying devices in arrays means devices subjected to the same wave field are likely to be out of phase. Geographically large arrays are likely to inherently offer some smoothing against short term power variation. By way of example, Figure 7.16 shows the power curves of two wave farm arrays compared to a single device, where each device is separated by a random phase difference.
Annual generation duration curves have been calculated at a potential wave farm site using publicly available power matrix data for the Pelamis, Wave Dragon and Archimedes Wave Swing (AWS) wave energy converters and are presented in Figure 7.17. The power characteristics of a generic wave energy device based on all three devices, is plotted for comparison. This provides a first order idealised estimate of generation duration and capacity factor, however it should be noted that it does not capture the influence of wave conditions and device response varying over short timescales, on power output.
0 10 20 30 40 50 600
0.5
1no storage
time (s)
norm
alis
ed p
ower
0 10 20 30 40 50 600
0.5
1inertial storage
time (s)
norm
alis
ed p
ower
high inertialow inertia
0 10 20 30 40 50 600
0.5
1de-coupled storage
time (s)
norm
alis
ed p
ower
Figure 7.15 Extracted power output for various wave energy devices
100 110 120 130 140 150 1600
0.5
1
time (s)
norm
alis
ed p
ower
single high inertia device
100 110 120 130 140 150 1600
0.5
1
time (s)
norm
alis
ed p
ower
array of eight high inertia devices
100 110 120 130 140 150 1600
0.5
1
time (s)
norm
alis
ed p
ower
array of 24 high inertia devices
Figure 7.16 Example of output smoothing through use of wave energy device arrays
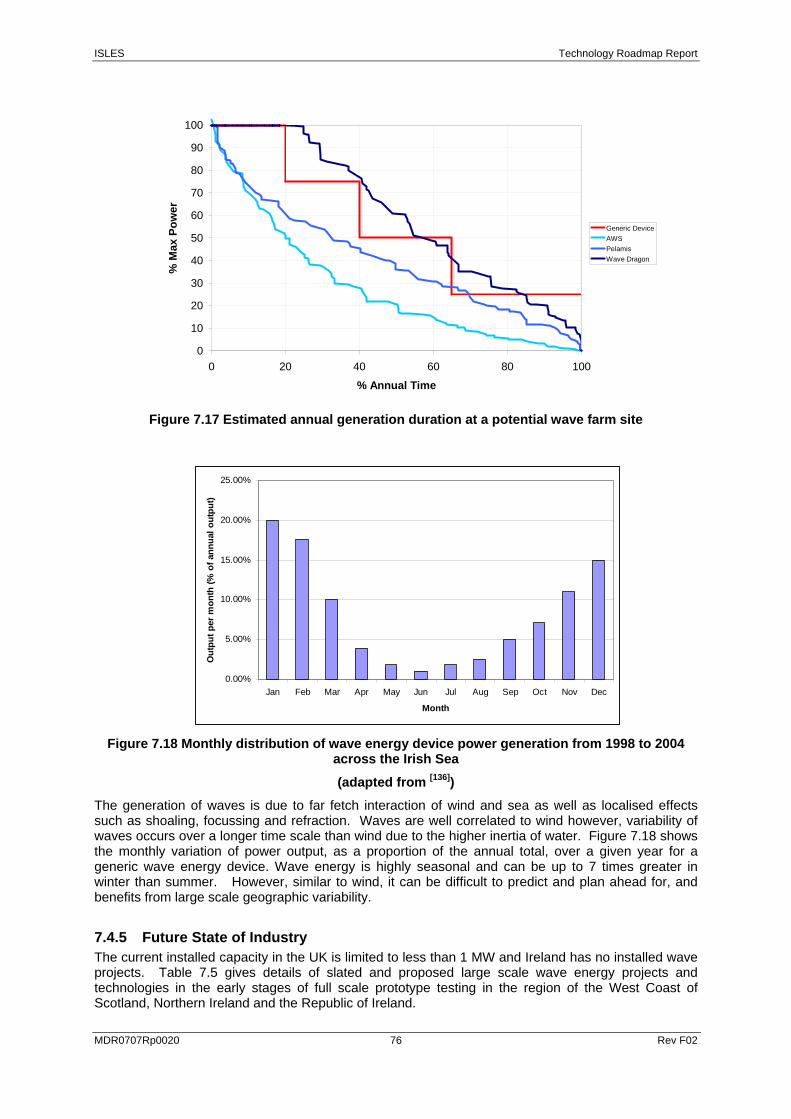
ISLES Technology Roadmap Report
MDR0707Rp0020 76 Rev F02
0
10
20
30
40
50
60
70
80
90
100
0 20 40 60 80 100
% Annual Time
% M
ax P
ower
Generic DeviceAWSPelamisWave Dragon
Figure 7.17 Estimated annual generation duration at a potential wave farm site
0.00%
5.00%
10.00%
15.00%
20.00%
25.00%
Jan Feb Mar Apr May Jun Jul Aug Sep Oct Nov Dec
Month
Out
put p
er m
onth
(% o
f ann
ual o
utpu
t)
Figure 7.18 Monthly distribution of wave energy device power generation from 1998 to 2004 across the Irish Sea
(adapted from [136])
The generation of waves is due to far fetch interaction of wind and sea as well as localised effects such as shoaling, focussing and refraction. Waves are well correlated to wind however, variability of waves occurs over a longer time scale than wind due to the higher inertia of water. Figure 7.18 shows the monthly variation of power output, as a proportion of the annual total, over a given year for a generic wave energy device. Wave energy is highly seasonal and can be up to 7 times greater in winter than summer. However, similar to wind, it can be difficult to predict and plan ahead for, and benefits from large scale geographic variability.
7.4.5 Future State of Industry The current installed capacity in the UK is limited to less than 1 MW and Ireland has no installed wave projects. Table 7.5 gives details of slated and proposed large scale wave energy projects and technologies in the early stages of full scale prototype testing in the region of the West Coast of Scotland, Northern Ireland and the Republic of Ireland.
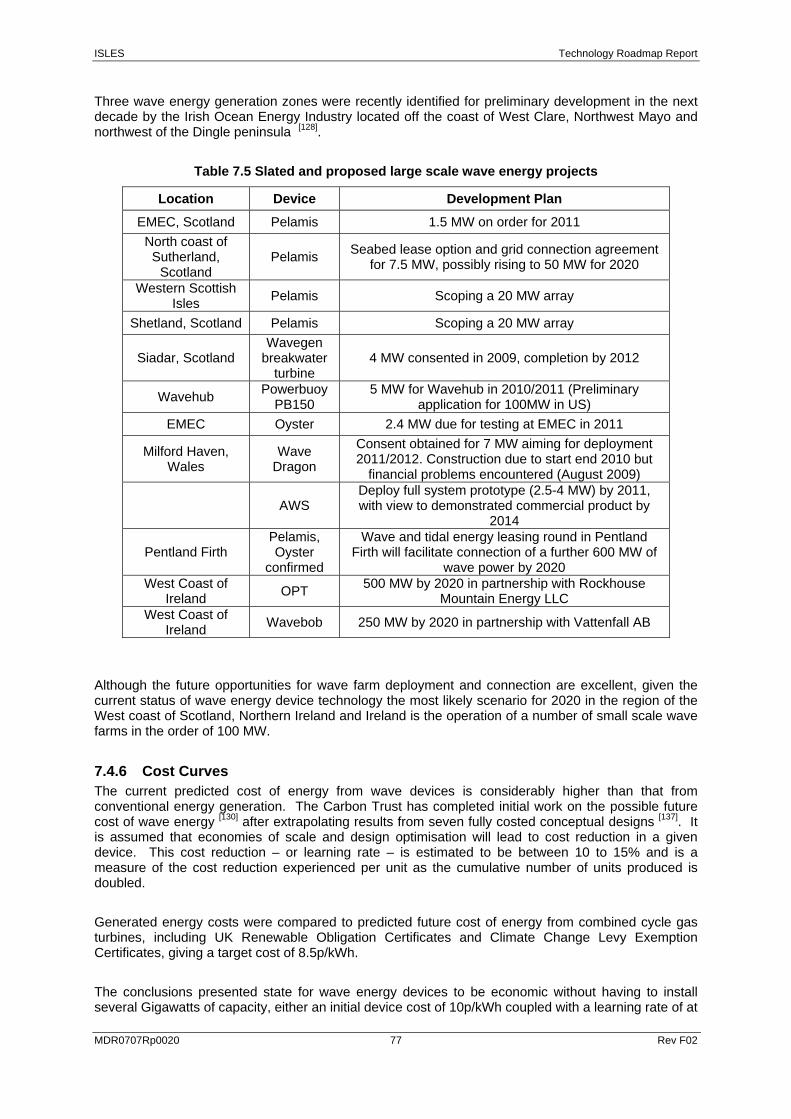
ISLES Technology Roadmap Report
MDR0707Rp0020 77 Rev F02
Three wave energy generation zones were recently identified for preliminary development in the next decade by the Irish Ocean Energy Industry located off the coast of West Clare, Northwest Mayo and northwest of the Dingle peninsula [128].
Table 7.5 Slated and proposed large scale wave energy projects
Location Device Development Plan
EMEC, Scotland Pelamis 1.5 MW on order for 2011 North coast of Sutherland,
Scotland Pelamis Seabed lease option and grid connection agreement
for 7.5 MW, possibly rising to 50 MW for 2020
Western Scottish Isles Pelamis Scoping a 20 MW array
Shetland, Scotland Pelamis Scoping a 20 MW array
Siadar, Scotland Wavegen
breakwater turbine
4 MW consented in 2009, completion by 2012
Wavehub Powerbuoy PB150
5 MW for Wavehub in 2010/2011 (Preliminary application for 100MW in US)
EMEC Oyster 2.4 MW due for testing at EMEC in 2011
Milford Haven, Wales
Wave Dragon
Consent obtained for 7 MW aiming for deployment 2011/2012. Construction due to start end 2010 but
financial problems encountered (August 2009)
AWS Deploy full system prototype (2.5-4 MW) by 2011, with view to demonstrated commercial product by
2014
Pentland Firth Pelamis, Oyster
confirmed
Wave and tidal energy leasing round in Pentland Firth will facilitate connection of a further 600 MW of
wave power by 2020 West Coast of
Ireland OPT 500 MW by 2020 in partnership with Rockhouse Mountain Energy LLC
West Coast of Ireland Wavebob 250 MW by 2020 in partnership with Vattenfall AB
Although the future opportunities for wave farm deployment and connection are excellent, given the current status of wave energy device technology the most likely scenario for 2020 in the region of the West coast of Scotland, Northern Ireland and Ireland is the operation of a number of small scale wave farms in the order of 100 MW.
7.4.6 Cost Curves The current predicted cost of energy from wave devices is considerably higher than that from conventional energy generation. The Carbon Trust has completed initial work on the possible future cost of wave energy [130] after extrapolating results from seven fully costed conceptual designs [137]. It is assumed that economies of scale and design optimisation will lead to cost reduction in a given device. This cost reduction – or learning rate – is estimated to be between 10 to 15% and is a measure of the cost reduction experienced per unit as the cumulative number of units produced is doubled.
Generated energy costs were compared to predicted future cost of energy from combined cycle gas turbines, including UK Renewable Obligation Certificates and Climate Change Levy Exemption Certificates, giving a target cost of 8.5p/kWh.
The conclusions presented state for wave energy devices to be economic without having to install several Gigawatts of capacity, either an initial device cost of 10p/kWh coupled with a learning rate of at
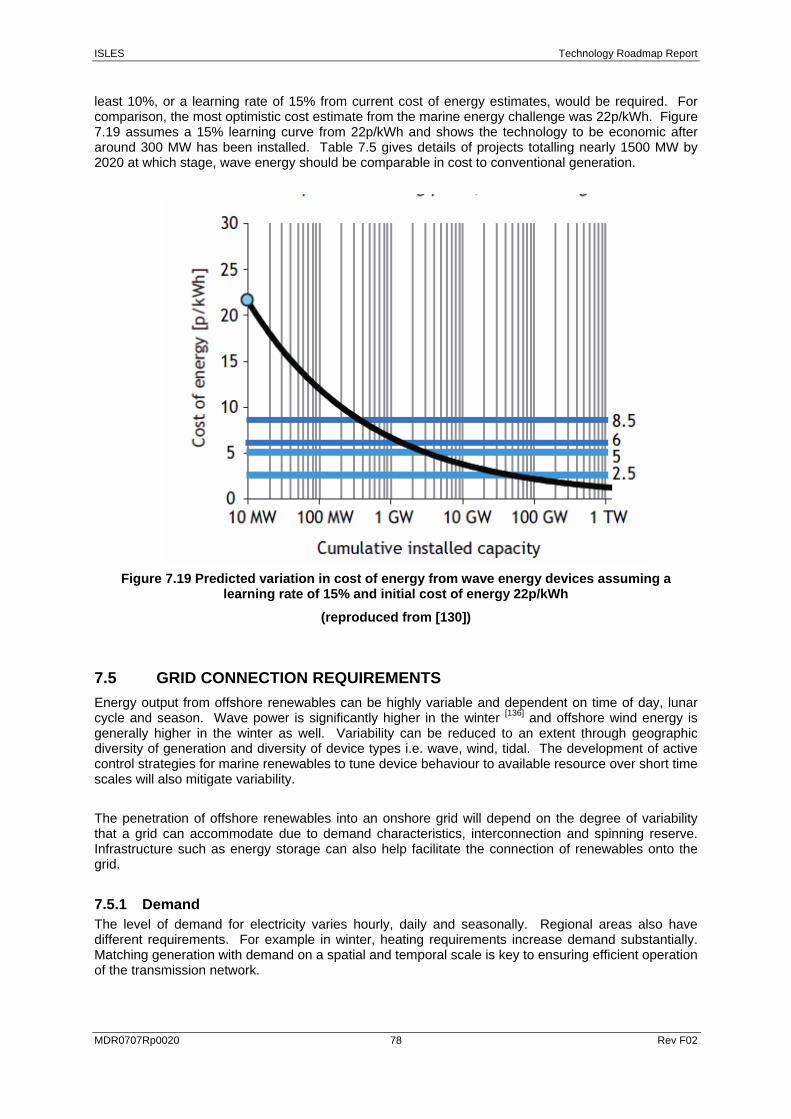
ISLES Technology Roadmap Report
MDR0707Rp0020 78 Rev F02
least 10%, or a learning rate of 15% from current cost of energy estimates, would be required. For comparison, the most optimistic cost estimate from the marine energy challenge was 22p/kWh. Figure 7.19 assumes a 15% learning curve from 22p/kWh and shows the technology to be economic after around 300 MW has been installed. Table 7.5 gives details of projects totalling nearly 1500 MW by 2020 at which stage, wave energy should be comparable in cost to conventional generation.
Figure 7.19 Predicted variation in cost of energy from wave energy devices assuming a learning rate of 15% and initial cost of energy 22p/kWh
(reproduced from [130])
7.5 GRID CONNECTION REQUIREMENTS Energy output from offshore renewables can be highly variable and dependent on time of day, lunar cycle and season. Wave power is significantly higher in the winter [136] and offshore wind energy is generally higher in the winter as well. Variability can be reduced to an extent through geographic diversity of generation and diversity of device types i.e. wave, wind, tidal. The development of active control strategies for marine renewables to tune device behaviour to available resource over short time scales will also mitigate variability.
The penetration of offshore renewables into an onshore grid will depend on the degree of variability that a grid can accommodate due to demand characteristics, interconnection and spinning reserve. Infrastructure such as energy storage can also help facilitate the connection of renewables onto the grid.
7.5.1 Demand The level of demand for electricity varies hourly, daily and seasonally. Regional areas also have different requirements. For example in winter, heating requirements increase demand substantially. Matching generation with demand on a spatial and temporal scale is key to ensuring efficient operation of the transmission network.
ISLES Technology Roadmap Report
MDR0707Rp0020 79 Rev F02
7.5.2 Spinning Reserve The transmission grid needs sufficient capacity to meet demand, regardless of sources being intermittent or variable. For the network to be reliable, generation capacity must be greater than peak demand. Spinning reserve, often coal-fired, CCGT or hydro, is generation that can be rapidly deployed to meet shortfall in capacity. For an intermittent supply, such as wind or wave, the contribution to reliable capacity is less than rated its capacity and more spinning reserve in required in the system.
7.5.3 Energy Storage Energy storage can be used to smooth variations in power output from offshore renewables; improving generation match with demand and manage transmission constraints. Devices for energy storage can be stand alone or fully integrated into the offshore and onshore transmission networks.
7.5.4 Weather Forecasting Robust weather forecasting models will enable prediction of offshore resource from a few minutes to days ahead, allowing contingency plans to be put in place. The forecasting of sophisticated short and medium term offshore wind and wave conditions is a technology that is being developed due partly to large financial incentives to be gained in trading energy.
7.5.5 Optimisation of Network Assets Substation and cable ratings are often not fully utilised due to the variable nature of power output from wave, wind and tidal energy converters. Modular construction of an offshore transmission network will need to be well designed in order to optimise infrastructure utilisation whilst ensuring that it will be able to meet final design ratings. This can often be difficult to justify due to short-term economic drivers.
ISLES Technology Roadmap Report
MDR0707Rp0020 80 Rev F02
8 OTHER TECHNOLOGY
8.1 ENERGY STORAGE Energy storage can be used to smooth variations in power output from offshore renewables; improving generation match with demand and manage transmission constraints. Devices for energy storage can be stand alone or fully integrated into the offshore and onshore transmission networks.
When considering energy storage strategies, key considerations are the intended application, round trip (charge/discharge cycle) efficiency of the energy storage device, response rate and total storage capacity. Various methods of energy storage including conventional and novel are reviewed below.
8.1.1 Pumped Hydro Large scale pumped hydro is already utilised in the National Grid network with a number of pumped hydro power stations located in Scotland and Wales such as Dinorwig and in the Republic of Ireland at Turlough Hill (although currently not operating at this location). During periods of low demand (and thus, lower electricity prices) and high electricity generation, water is pumped into a reservoir and then released when required. This technology has the ability to store and release large quantities of energy over an extended period in the order of days or with a fast generation response, if necessary. For example, Dinorwig can deliver 1.7 GW for 5 hours [138] and can ramp up from 0 MW to 1320 MW in 12 seconds. Pumped hydro has a round trip efficiency in the region of 70%.
Pumped hydro availability and capacity is limited to an extent by the physical geography of the network location. However, a number of existing and potential large pumped hydro schemes are located on the West coast of Wales and Scotland and accessible for an ISLES offshore transmission grid. Also, in recent times there have been a number of high profile feasibility studies completed into Pumped Storage in Ireland and Northern Ireland with a number of parties now examining in earnest the technical and business case for these projects. While significant market and technical factors (including environmental and planning) would seem to significantly constrain any prospective projects in the short to medium term, the development of large-scale pumped-hydro projects could ultimately become an environmental/enterprise factor for the ISLES business case.
8.1.2 Compressed Air Energy Storage Similar in operation to pumped hydro, during periods of low demand and high electricity generation, air is compressed into a storage vessel and then released when required. The compressed air is used for natural gas combustion to improve the efficiency of electricity generation in gas turbine power stations. Two hybrid plants are currently in operation; Alabama Electric Corporation’s 110 MW plant in Alabama, USA which has been operational since 1991 and E.N. Kraftwerke’s 290 MW plant in Huntdorf, Germany, operational since 1978. A 2700 MW commercial hybrid plant is currently planned for construction in Ohio, USA. Round trip efficiencies are approximately 70% [139].
These facilities require a suitable geological formation since large caverns are generally used as the air storage vessel. Some of the exploratory work being completed at Larne in Northern Ireland could lead to compressed energy storage being considered, however, it is likely that the current focus of the research will remain on gas storage.
8.1.3 Chemical Batteries Batteries are often used to stabilise a dedicated power distribution, many small ‘off-grid’ systems rely on battery storage. A number of different battery technologies are available, ranging from nickel-cadmium batteries with a discharge time of up to 15 minutes and advanced lead acid with a discharge time of up to 1 hour to sodium-sulphur and redox-flow batteries that have a discharge time of up to 6 hours.
These technologies have yet to be demonstrated at a large scale, the largest example of a nickel-cadmium battery based storage facility is at Golden Valley Electrical Installation in Alaska and can
ISLES Technology Roadmap Report
MDR0707Rp0020 81 Rev F02
produce 40 MW for 15 minutes. It weights 1,400t and occupies a space measuring 940 m2. Zinc-bromide flow batteries are available with unit capacities of 1 MW and 3 MWh for utility scale applications. NGK Insulators manufacture a sodium-sulphur battery called NAS and have a number of installations with ratings up to 34 MW and storage capacities of up to 245 MWh, as reported earlier in Section 4.9.3. Round trip efficiencies of 70 to 90% and higher have been demonstrated for battery storage technologies.
Costs for battery storage facilities were estimated by the Sandia National Laboratory in a 2008 report on Solar Energy Grid Integration systems and range from 150 USD/kWh for lead acid batteries to 1333 USD/kWh for lithium-ion batteries [140]. Based on TNEI’s experience, capital cost is in the order of millions of pounds for large scale batteries suitable for medium size wind farm applications. There are currently major technology constraints for use of battery technology in transmission applications due to cost and footprint.
8.1.4 Pumped Heat Storage The UK company Isentropic have developed an innovative pumped heat electricity storage scheme using a heat pump with two gravel stores. During periods of excess electricity generation, the pump compresses air in one store to a temperature of 500 ºC and expands it in the other store to -150 ºC. As the air passes through the system, it transfers heat to the gravel. The process is reversed to operate as a heat engine and generate electricity. Isentropic claim that the system has a round trip efficiency of 72 to 80% with costs of only 10 to 55 USD/kWh, due to the low cost of the components. However, this system has yet to be demonstrated [141].
8.1.5 Hydrogen Hydrogen may be generated through electrolysis, stored and then converted back to electricity using a fuel cell or combustion engine. However, only a few hydrogen storage demonstration projects are in operation. The Hydrogen Mini Grid System at the Innovation Technology Centre in South Yorkshire is the first such large scale system in the UK combining a 225 kW wind turbine and 30 kW electrolyser and fuel cell [142].
Hydrogen storage has a round trip efficiency of approximately 25% which combined with high capital costs, make a large scale system less economically attractive at present.
8.1.6 FACTS Storage FACTS devices are available which include energy storage using batteries, although none have been installed yet. ABB can supply a STATCOM (SVC Light) device incorporating energy storage using Li-ion batteries. These devices are rated to provide active power in the range 5 to 50 MW for a period of 5 to 60 minutes, while also providing reactive power up to ±70 MVAr [77].
ISLES Technology Roadmap Report
MDR0707Rp0020 82 Rev F02
9 INDUSTRY CONSULTATIONS
Confidential consultations were carried out with a number of key transmission technology suppliers to incorporate their views on present technological capabilities and constraints, supply chain issues and predicted future trends for offshore transmission networks into the technology roadmap. This provided guidance on credible future technology developments that will be available for ISLES.
Technology suppliers were engaged through face-to-face meetings or teleconferences generally lasting one to three hours with details of participants and meeting dates given in Table 9.1. Meeting notes were subsequently summarised and agreed with suppliers. Information collected was presented in the technology roadmap report in a generic format where not publicly available so as not to jeopardise confidentiality. TNEI emphasised the value of input from suppliers, as key stakeholders, for the ISLES technology roadmap. Most suppliers were keen to participate on that basis and the consultations provided much valuable information.
The meeting agenda included the following discussion items as well as a more general discussion of the offshore renewables and transmission industry;
• Description of technology supplier’s role and market size within the transmission industry and who they typically work for and with through joint ventures or consortium for example.
• Discussion of key equipment and/or system description and specifications such as size, rating, voltage and current capacity, current unit cost and predicted unit cost in the future for equipment that is applicable to an offshore transmission network.
• Plans for further development of equipment technology over the next 10-20 years such as increased rating or reduced weight for example.
• Details of transport, deployment and installation requirements and future technology developments. Also, equipment operation and maintenance technology.
• View on current market capacity and demands and how these are likely to change over the next 20 years. How is the supplier looking to address any potential supply chain issues?
• Forward outlook on industry wide technology constraints and bottlenecks for offshore transmission networks.
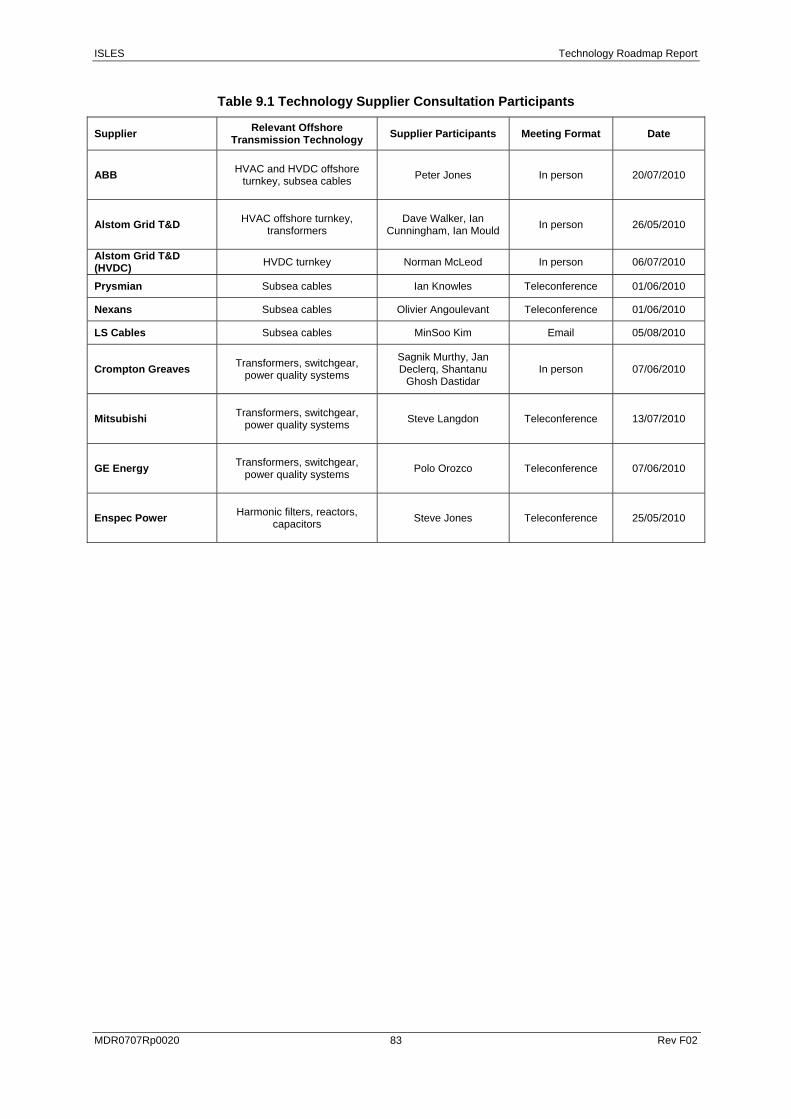
ISLES Technology Roadmap Report
MDR0707Rp0020 83 Rev F02
Table 9.1 Technology Supplier Consultation Participants
Supplier Relevant Offshore Transmission Technology Supplier Participants Meeting Format Date
ABB
HVAC and HVDC offshore turnkey, subsea cables
Peter Jones In person 20/07/2010
Alstom Grid T&D
HVAC offshore turnkey, transformers
Dave Walker, Ian Cunningham, Ian Mould In person 26/05/2010
Alstom Grid T&D (HVDC) HVDC turnkey Norman McLeod In person 06/07/2010
Prysmian Subsea cables Ian Knowles Teleconference 01/06/2010
Nexans Subsea cables Olivier Angoulevant Teleconference 01/06/2010
LS Cables Subsea cables MinSoo Kim Email 05/08/2010
Crompton Greaves
Transformers, switchgear, power quality systems
Sagnik Murthy, Jan Declerq, Shantanu
Ghosh Dastidar In person 07/06/2010
Mitsubishi
Transformers, switchgear, power quality systems
Steve Langdon Teleconference 13/07/2010
GE Energy
Transformers, switchgear, power quality systems
Polo Orozco Teleconference 07/06/2010
Enspec Power
Harmonic filters, reactors, capacitors
Steve Jones Teleconference 25/05/2010

ISLES Technology Roadmap Report
MDR0707Rp0020 84 Rev F02
10 REFERENCES
1 National Grid and Econnect. “Round 3 Offshore Wind Farm Connection Study”. Prepared for The Crown Estate. December 2008. 2 Nexans Norway AS. “Offshore Wind China 2010” [document from the Internet]. March. 2010. [cited June 2010]. Available from: http://www.norway.cn/PageFiles/391359/Nexans%20-%20Olivier%20Angoulevant.pdf 3 K. Johannesson, A. Gustafsson, J. Karlstrand and M. Jeroense. “HVDC Light Cables for long distance grid connection”. European Offshore Wind Conference 2009. Stockholm, Sweden. 14th - 16th September, 2009. 4 Cigré Working Group B4.39. “Integration of Large Scale Wind Generation Using HVDC and Power Electronics”. Cigré. February 2009. 5 Siemens. “High Voltage Direct Current Transmission – Proven Technology for Power Exchange” [document on the Internet]. [cited July 2010]. (&) 6 ABB. Differences between HVDC Light and classic HVDC [webpage]. [cited May 2010]. (*) 7 J.B. Davies, I.T. Fernando, K.L. Kent, E.K. Bård and K.H. Søbrink. “HVDC Multiinfeed Considerations in Denmark and Norway”. CIGRÉ SC B4 2009 Bergen Colloquium. Bergen, Norway 2009. Paper 309. 8 ABB. HVDC Classic Transmission Losses [webpage]. [cited June 2010]. (*) 9 ABB. CCC – Capacitor Commutated Converters [document on the Internet]. [cited August 2010]. (*) 10 D. Zhang, M. Haeusler, H. Rao, C. Shang, T. Shang. “Converter Station Design of the ±800 kV UHVDC Project Yunnan-Guangdong”. The 17th Conference of Electric Power Supply Industry. Macau, China. October 2008. 11 ABB. The HVDC Transmission Québec New England [image on the Internet]. [cited May 2011]. (*) 12 ABB. “It’s time to connect - Technical description of HVDC Light technology” [document on the Internet]. March 2008. [cited June 2010]. (*) 13 P. Jones. “Offshore HVDC Platforms to connect the next generation of offshore wind and establish the foundations of European Supergrid”. Presented at IET lecture on Offshore HVDC Platforms. Warrington, UK. April 2010. 14 ABB. “ABB Review 4/2008: The future is now” [document on the Internet]. 2008. [cited June 2010]. (*) 15 ABB. DolWin1 HVDC Light [webpage]. [cited August 2010]. (*) 16 Prysmian. “News” [webpage]. 11th June 2010. [cited June 2010]. Available from: http://www.prysmian.com/communication/news.html?newsLink=/archive/news/2010/news024.news 17 Energinet.dk, Svenska Kraftnät and Vattenfall Europe Transmission. “An Analysis of Offshore Grid Connection at Kriegers Flak in the Baltic Sea”. Joint Pre-feasibility Study, May 2009. 18 ABB. BorWin 1 [webpage]. [cited June 2010]. (*) 19 NaiKun Wind Energy Group Inc. “NaiKun Offshore Wind Project” [document on the Internet]. 2008. [cited June 2010]. Available from: http://www.seconference.org/pdf/FY09Presentations_AM/Energy_Presentations/Margolick_Michael_FY09AM.pdf 20 SSE. Caithness HVDC Connection [webpage]. [August 2010]. [cited September 2010]. Available from: http://www.scottish-southern.com/SSEInternet/index.aspx?rightColHeader=30&id=23090&TierSlicer1_TSMenuTargetID=23090&TierSlicer1_TSMenuTargetType=1&TierSlicer1_TSMenuID=6

ISLES Technology Roadmap Report
MDR0707Rp0020 85 Rev F02
21 National Grid. “Transmission Networks Offshore Development Information Statement”. December 2009. 22 G.P. Adam, S.J. Finney, B.W. Williams, K. Bell, G.M. Burt. “Control of Multi-Terminal DC Transmission System Based on Voltage Source Converters”. ACDC 2010, the 9th International Conference on AC and DC Power Transmission. London. 19th - 21st October, 2010. 23 G. Asplund. “HVDC grids – possibilities and challenges”. CIGRÉ SC B4 2009 Bergen Colloquium. Bergen, Norway 2009. Paper 403. 24 Transmission and Distribution World. First European Grid Company Installs New Type of High-Voltage Pylon [webpage]. [13 May 2010]. [cited [August 2010]. Available from: http://tdworld.com/projects_in_progress/announcements/european-grid-pylon-0510/ 25 C.R. Bayliss and B.J. Hardy. “Transmission and Distribution Electrical Engineering”. 3rd Edition. Newnes. 2007. 26 Siemens. “Siemens’ FACTS and HVDC systems” [document on the Internet]. [cited June 2010]. Available from: http://www.ptd.siemens.de/artikel0711.pdf 27 P. Djapic and G. Strbac. “Cost Benefit Methodology for Optimal Design of Offshore Transmission Systems”. Centre for Sustainable Electricity and Distributed Generation, Funded by BERR. URN 08/1144. 28 Ocean Power Technologies. Underwater Substation Pod [webpage]. [cited June 2010]. Available from: http://www.oceanpowertechnologies.com/pod.htm 29 General Electric Company. “Subsea Processing and Power Systems” [document from the Internet]. [cited June 2010]. Available from: http://www.gepower.com/businesses/ge_oilandgas/en/prod_serv/systems/downloads/sspps.pdf 30 General Electric Company. “Subsea Switchgear Module” [document from the Internet]. [cited June 2010]. Available from: http://www.gepower.com/businesses/ge_oilandgas/en/prod_serv/systems/downloads/subsea_switchgear.pdf 31 Email from GE to TNEI, August 2009. 32 ABB. HVDC Light transmission losses [webpage]. [cited August 2010]. (*) 33 Siemens. HVDC Plus (VSC Technology) Modular Multilevel Converter [webpage]. [cited June 2010]. (&) 34 ABB. ABB HVDC Reference Projects [webpage]. [cited August 2010]. (*) 35 ABB. “High Voltage Circuit Breakers for applications up to 800 kV” [document from the Internet]. [cited June 2010]. (*) 36 ABB. “Overview Gas Insulated Switchgear Modular and flexible, 52 – 1100 kV” [document from the Internet]. [cited June 2010]. (*) 37 ABB. “GIS Product Overview” [document from the Internet]. [cited June 2010]. (*) 38 Hyosung. “(GIS) Gas Insulated Switchgear” [document from the Internet]. [cited June 2010]. Available from: http://www.hicoamerica.com/Files/HICO.GIS.pdf 39 ABB. “ABB Switchgear Manual”. 11th Edition. 40 D. Andersson and A. Henriksson. “Passive and Active DC Breakers in the Three Gorges-Changzhou HVDC Project” [document from the Internet]. ABB Sweden. [cited June 2010]. (*) 41 A. Kumar, M. Lagerkvist, M. Eklund and Y.Q. Yun. “Three Gorges-Changzhou HVDC: Ready to Bring Bulk Power to East”. The 4th International Conference on Power Transmission and Distribution Technology. Changsha. 14th – 16th October, 2003 42 K.E. Koldby and M. Hyttinen. “Challenges on the Road to an Offshore Grid”. Nordic Wind Power Conference 2009. Bornholm, Denmark. 10th – 11th September, 2009.

ISLES Technology Roadmap Report
MDR0707Rp0020 86 Rev F02
43 Areva. “Power Transformers and Reactors for Power Generation and Transmission Networks” [document from the Internet]. [cited June 2010]. Available from: http://www.areva-td.com/solutions/liblocal/docs/PTR_Overview_Eng.pdf 44 Siemens. Grid Access Solutions – References [webpage]. [cited June 2010]. (&) 45 B. Valov. “Transformers for Offshore Wind Platforms: Expected Problems and Possible Approaches”. 8th International Workshop on Large-Scale Integration of Wind Power into Power Systems as well as on Transmission Networks for Offshore Wind Farms. 14th – 15th October, 2009. pp 574 – 578. 46 ABB. HVDC Converter Transformers [webpage]. [cited June 2010]. (*) 47 Siemens. “Transforming distance into daily life HVDC transformers ensure efficient energy flow” [document from the Internet]. [cited June 2010]. (&) 48 J. Dorn; D. Retzmann, C. Schimpf and D. Soerangr. "HVDC Solutions for System Interconnection and Advanced Grid Access". EPRI HVDC conference. 13th - 14th September, 2007. 49 B.D. Railing, J.J. Miller, P. Steckley, G. Moreau, P.Bard, L. Ronstrom and J.Lindberg. “Cross Sound Cable Project Second Generation VSC Technology for HVDC”. Cigre Conference. Paris, France. 29th August – 3rd September, 2004. 50 L. Ronström, M.L.Hoffstein, R. Pajo, M. Lahtinen. “The Estlink HVDC Light Transmission System”. Security and Reliability of Electric Power Systems. Cigré Regional Meetings. Tallin, Estonia. June 2007. 51 Areva. “Anglo – French HVDC Link” [document from the Internet]. [cited June 2010]. Available from: http://www.areva-td.com/solutions/liblocal/docs/Success stories/Anglo French HVDC Link Cross Channel Scheme.pdf 52 FINGRID OYJ. FENNO-SKAN HVDC LINK [document from the Internet]. [cited September 2010]. Available from: http://www.fingrid.fi/uploads/ConstructionSiteMap/attachments/esite.pdf 53 S. Gunnarsson, L. Jiang, A. Peterssen. “Active Filters in HVDC Transmission” [document from the Internet]. [cited June 2010]. (*) 54 ABB. “Dry Q” [document from the Internet]. 2004. [cited June 2010]. (*) 55 ABB. Open Rack Shunt Bank [webpage]. [cited June 2010]. (*) 56 ABB. Modular Capacitor Bank [webpage]. [cited June 2010]. (*) 57 Siemens. “Mechanical Switched Capacitors (MSC/MSCDN) – Reference List”. [document from the Internet]. [cited June 2010]. (&) 58 L. Yao. “Experience on Technical Solutions for Grid Integration of Offshore Windfarms”. IEA Wind Workshop/Roundtable Discussion on Grid Integration of Offshore Wind. London, UK. June 2007. 59 Siemens. “Shunt Reactors for Medium and High Voltage Networks” [document from the Internet]. [cited June 2010]. (&) 60 Siemens. “HVDC Solutions for System Interconnection and Advanced Grid Access”. EPRI HVDC conference. September 2007. 61 Areva. “Shunt Reactors in Power Systems” [document from the Internet]. [cited June 2010]. Available from: http://www.arevausitr.com/pdf/TECH%20NEWS_SHUNT_71665.PDF. 62 ABB. “Power Transformers” [document from the Internet]. [cited June 2010]. (*) 63 Areva. “Offshore Wind Farm “Alpha Ventus” 110/30 kV transformer station on an offshore platform” [document from the Internet]. [cited June 2010]. Available from: http://www.areva-td.com/solutions/liblocal/docs/Industry%20solutions/Power%20Gen/Alpha_ventus%20Offshore%20Wind%20farm_LR.pdf 64 ABB. “Improved availability of 735kV transmission system by means of series compensation” [document from the Internet]. [cited June 2010]. (*)

ISLES Technology Roadmap Report
MDR0707Rp0020 87 Rev F02
65 ABB. “Series compensation 500 kV power transmission corridor in Argentina” [document from the Internet]. [cited June 2010]. (*) 66 Siemens. “Prospects of FACTS Technology for Power Transmission Enhancement”. EPRI HVDC Conference. September 2007. 67 Siemens. “The biggest FACTS project worldwide – The FSC and TCSC Purnea Gorakhupur Project in India was put into commercial operation in 2006”. HVDC/FACTS Newsletter. Vol. 6.06. (&) 68 ABB. “ABB Advanced Power Electronics” [document from the Internet]. [cited June 2010]. (*) 69 Siemens. SVC References [webpage]. [cited June 2010]. (&) 70 ABB. “Nordex to install ABB STATCOMS at two of the UK’s largest new wind farms”. [webpage]. [cited June 2010]. (*) 71 A. Oskoui, B. Mathew, J.P. Hasler, M. Oliveira, T. Larsson, Å. Petersson, E. John. “Holly STATCOM – FACTS to replace critical generation, operational experience”. Transmission and Distribution Conference and Exhibition 2005/2006 IEEE PES. pp. 1393 – 1398. 72 ABB. “SVC for dynamic voltage stabilization of 132 kV system in western Canada” [document from the Internet]. [cited August 2010]. (*) 73 Siemens. “Reactive Power Compensation – Reference List” [document from the Internet]. [cited June 2010]. (&) 74 ABB. “SVC to Increase Reliability and Reduce Congestion over Multiple 500 kV Lines”. [document from the Internet]. [cited June 2010]. (*) 75 ABB. “Advanced Power Electronics – STATCOM solutions” [document from the Internet]. [cited June 2010]. (*) 76 ABB. “ABB SVC and SVC Light projects Worldwide” [document from the Internet]. [31 August 2010]. [cited September 2010]. (*) 77 ABB. “SVC Light with Energy Storage” [document from the Internet]. March 2010. [cited June 2010]. (*) 78 NGK. Principle of the NAS Battery [webpage]. [cited June 2010]. Available from: http://www.ngk.co.jp/english/products/power/nas/principle/index.html 79 Nexans. HV Underground Power Cables XLPE Insulated [webpage]. [cited August 2010]. Available from: http://www.nexans.co.uk/eservice/UK-en_GB/navigate_10837/XLPE_insulated.html 80 Transmission and Distribution World. ENEL Invests 20 Years in Underground Cable Project [webpage]. [1 July 1997]. [cited August 2010]. Available from: http://tdworld.com/mag/power_enel_invests_years/ 81 Prysmian Cables and Systems. “Submarine Energy Systems” [document from the Internet]. 2009. [cited June 2010]. Available from: http://www.prysmian.com/our-products/energy/power-transmission/submarine_energy_systems.html 82 Prysmian. “News” [webpage]. 8th September 2008. [cited June 2010]. Available from: http://www.prysmian.co.uk/about-us/press_area/news.html?newsLink=/archive/news/2008/news028.news&newsCurrentFolder=2008&newsInterval=2&newsPerPage=5 83 Ontario Power Authority. Wolfe Island Wind Power Project (197.8 MW) - Wolfe Island [webpage]. [cited August 2010]. Available from: http://www.powerauthority.on.ca/Page.asp?PageID=924&ContentID=5109 84 ABB. “Submarine Power Cables” [document from the Internet]. August 2009. [cited June 2010]. (*) 85 ABB. “Cables for Offshore Wind Farms” [document from the Internet]. October 2006. [cited June 2010]. (*)
ISLES Technology Roadmap Report
MDR0707Rp0020 88 Rev F02
86 Prysmian. “Technical Data Table 66 kV EPR Insulated, 3 core XLPE Insulated submarine cable datasheet”. Supplied by Prysmian. 2009. 87 Prysmian. “132 kV, 3 Core XLPE Insulated, SWA, Submarine Cable”. Supplied by Prysmian. 2009. 88 Nexans. “Submarine Power Cables” [document from the Internet]. [May 2008]. [cited September 2010]. Available from: http://www.nexans.co.uk/Germany/2008/Hann_SubmPowCables_mai08_1.pdf 89 E. Zaccone. “HVDC Transmission Cable Systems”. Prysmian Powerlink. Spring 2009 ICC Subcommittee C-Cable Systems. Orlando, USA. May 2009. 90 D. Jovic. “Step-up DC-DC converter for MW size Applications”. IET Power Electronics. PEL-2008-0101.R1. August 2008. 91 Amercian Superconductor. “Superconductor Power Cables” [document from the Internet]. 2009. [cited June 2010]. Available from: http://www.amsc.com/pdf/HTSC_AN_0109_A 4_FINAL.pdf 92 HVDC superconducting power transmission success for Nexans [webpage]. [27 July 2010]. [cited August 2010]. Available from:
http://www.powergenworldwide.com/index/display/articledisplay/1223776383/articles/powergenworldwide/t-and-d/t-and-d-infrastructure/2010/07/hvdc-superconducting.html 93 Siemens. “High Voltage Direct Current Transmission – Proven Technology for Power Exchange” [document from the Internet]. [cited June 2010]. (&) 94 L.A. Koshcheev. “Environmental Characteristics of HVDC Overhead Transmission Lines”. Third Workshop on Power Grid Interconnection in Northeast Asia. Vladivostock, Russia. 2003. 95 ABB. HVDC Reference Projects [webpage]. [cited June 2010]. (*) 96 A. Sannino, H. Breder and E.K. Nielson. "Reliability of Collection Grids for Large Offshore Wind Parks". 9th International Conference on Probabilisitic Methods Applied to Power Systems. KTH, Stockholm. 11th – 15th June, 2006. 97 A. Underbrink, J. Hanson, A. Osterholt and W. Zimmermann. "Probabilisitic Reliability Calculations for the Grid Connection of an Offshore Wind Farm". 9th International Conference on Probabilistic Methods Applied to Power Systems. KTH, Sweden. 11th – 15th June, 2006 98 H.E. Ying. "Reliability of distribution network components". 20th International Conference on Electricity Distribution. Prague. 8th - 11th June, 2009 99 ABB. HVDC Classic reliability and availability [webpage]. [cited June 2010]. (*) 100 ABB. HVDC Light reliability and availability [webpage]. [cited June 2010]. (*) 101 I. Vancers, D.J. Christofersen, A. Leirbukt, M.G. Bennett. “A survey of the reliability of HVDC systems throughout the world during 2005 – 2006”. CIGRE 2008. B4-119. 102 BBC News Cornwall. Cornwall Wave Hub cable laying halted [webpage]. 13 August 2010. [cited August 2010]. Available from: http://www.bbc.co.uk/news/uk-england-cornwall-10968890 103 W.D. Ensor et al. “Directionally drilled river crossing breaks mile barrier, 1991”. Pipe Line Industry. 1993. 104 I. Mattson, B.D. Railing, B. Williams, G. Moreau, C.D. Clarke, A. Ericsson, J.J. Miller. “Murraylink, The Longest Underground HVDC Cable in the World”. CIGRE Session 2004. B4-103. 105 Power-Technology.com. Beauly-Denny Overhead Power Transmission Line Replacement Project, Scotland, United Kingdom [webpage]. [cited September 2010]. Available from: http://www.power-technology.com/projects/beaulydenny/ 106 ABB. “Caprivi Link Interconnector. A step further in HVDC Light technology”. IEEE/PES General Meeting. Calgary, Canada. 26th – 29th July, 2009.

ISLES Technology Roadmap Report
MDR0707Rp0020 89 Rev F02
107 ABB. Estlink HVDC Light link [webpage]. [cited August 2010]. (*) 108 BWEA. “UK Offshore Wind: Charting the Right Course, Scenarios for offshore capital costs for the next five years”. June 2009. 109 The Carbon Trust. “Offshore wind power: big challenge, big opportunity”. October 2008. 110 BVG Associates. “Towards Round 3: Building the Offshore Wind Supply Chain” [document from the Internet]. [cited June 2010]. Available from: http://www.thecrownestate.co.uk/round3_supply_chain_gap_analysis.pdf 111 SKM. “Quantification of Constraints on the Growth of UK Renewable Capacity”. June 2008. Available from the Department for Business Innovation and Skills webpage. 112 Cableships World Overview. [webpage]. [cited August 2010]. http://www.subtelforum.com/articles/?page_id=704. 113 Renewable UK. UKWED Statistics [webpage]. [cited June 2010]. Available from: http://www.bwea.com/statistics/ 114 Clipper Windpower. [webpage]. [cited June 2010]. Available from: http://www.clipperwind.com/pr_051509.html 115 Bloomberg. Statoil Considers Sites in Scotland for World’s First Floating Wind Farm [webpage]. [17 August 2010]. [cited September 2010]. Available from: http://www.bloomberg.com/news/2010-08-17/statoil-considers-sites-in-scotland-for-world-s-first-floating-wind-farm.html 116 GE Power and Water. “4.0 – 110 Offshore Wind Turbine” [document from the Internet]. 2010. [cited June 2010]. Available from: http://www.gepower.com/prod_serv/products/wind_turbines/en/downloads/Offshore%20Brochure_GEA18111_wind4.0broch_LR.pdf 117 AREVA Wind GmbH. M5000 Technical Data [document from the Internet]. July 2010. [cited November 2010]. Available from: http://www.areva-wind.com/fileadmin/infomaterial/AREVAwind_TechnicalData.pdf 118 G. Sinden. “Characteristics of the UK wind resource: Long term patterns and relationship to electricity demand”. Energy Policy Journal. Vol. 35 (1). January 2007. pp 112 – 127. 119 Eirgrid. “Wind Generation” [webpage]. [cited June 2010]. Available from: http://www.eirgrid.com/operations/systemperformancedata/windgeneration/ 120 The Crown Estate. “Round 1 and 2 extensions to power 1.4 millions homes” [webpage]. May 2010. [cited June 2010]. Available from: http://www.thecrownestate.co.uk/newscontent/92-r1-r2-extentions.htm 121 Marine Scotland for The Scottish Government. “Draft Plan for Offshore Wind Energy in Scottish Territorial Waters”. Marine Scotland. Edinburgh. May 2010. 122 AECOM and Metoc. “Offshore Wind and Marine Renewable Energy in Northern Ireland. Strategic Environmental Assessment (SEA). Non-Technical Summary”. December 2009. 123 Cambridge Energy Research Associates: Power Capital Costs Index 2008. Cited in [109]. 124 Marine Current Turbines. “UK Energy Minister applauds SeaGen tidal project” [webpage]. March 2010. [cited June 2010]. Available from: http://www.marineturbines.com/3/news/article/32/uk_energy_minister_applauds_seagen_tidal_project/ 125 The Carbon Trust. “Developing blades for tidal turbines” [document from the Internet]. December 2008. [cited June 2010]. Available from: http://www.carbontrust.co.uk/SiteCollectionDocuments/Various/Emerging%20technologies/Current%20Focus%20Areas/Marine%20Energy%20Accelerator/Aviation%20Enterprises%20case%20study.pdf 126 SuperGen Marine Energy Research Consortium. SuperGen Marine [webpage]. [cited June 2010]. Available from: http://www.supergen-marine.org.uk

ISLES Technology Roadmap Report
MDR0707Rp0020 90 Rev F02
127 A.G. Bryans. “Impacts of Tidal Stream Devices on Electrical Power Systems”. PhD thesis. Queen’s University Belfast. September 2006. 128 “Four marine energy zones proposed”. Irish Times. 9 August 2010. 129 Marine Current Turbines. “The Skerries” [webpage]. [cited June 2010]. Available from: http://www.marineturbines.com/18/projects/20/the_skerries/ 130 The Carbon Trust. “Future Marine Energy”. UK. January 2006. 131 Wave Dragon. “Latest News” [webpage]. August 2009. [cited June 2010]. Available from: http://www.wavedragon.net/index.php?option=com_content&task=view&id=42&Itemid=67 132 Voith Hydro. “World’s Largest Wave Power Project Wins Approval” [webpage]. [cited June 2010]. Available from: http://www.wavegen.com/news-npower-siadar-planningok%20jan%2009.htm 133 Aquamarine Power. “Oyster Wave Power Technology Oyster 1”. [webpage]. [cited June 2010]. Available from: http://www.aquamarinepower.com/technologies/oyster-1/ 134 Pelamis Wave Power. “Aguçadoura” [webpage]. [cited June 2010]. Available from: http://www.pelamiswave.com/our-projects/agucadoura 135 UKERC. UKERC Marine (Wave and Tidal Current) Renewable Energy Technology Road Map. University of Edinburgh. March 2008. 136 Environmental Change Institute, University of Oxford. “Variability of UK marine resources”. The Carbon Trust. UK. July 2005. 137 The Carbon Trust. Marine Energy Challenge [webpage]. [cited June 2010]. Available from: http://www.carbontrust.co.uk/emerging-technologies/current-focus-areas/Pages/marine-energy-challenge.aspx 138 First Hydro Company. Dinorwig Power Station [webpage]. [cited June 2010]. Available from: http://www.fhc.co.uk/dinorwig.htm 139 F. Crotogino, K.-U Mohmeyer, and R. Scharf. “Huntorf CAES: More than 20 years of successful operation” SMRI Spring Meeting 2001, Orlando, 23rd – 24th April, 2001. pp. 351 – 357. 140 D. T. Ton, U.S. Department of Energy. C.J. Hanley, G. H. Peek and J.D. Boyes, Sandia National Laboratories. “Solar Energy Grid Integration Systems – Energy Storage (SEGIS-ES)”. Sandia Report SAND2008-4247. July, 2008. 141 Isentropic Ltd. Pumped Heat Electricity Storage [webpage]. [cited June 2010]. Available from: http://www.isentropic.co.uk/ 142 Hydrogen Mini Grid System. Hydrogen Mini Grid System Technology [webpage]. [cited June 2010]. Available from: http://www.hydrogen-yorkshire.co.uk/hmgs.asp
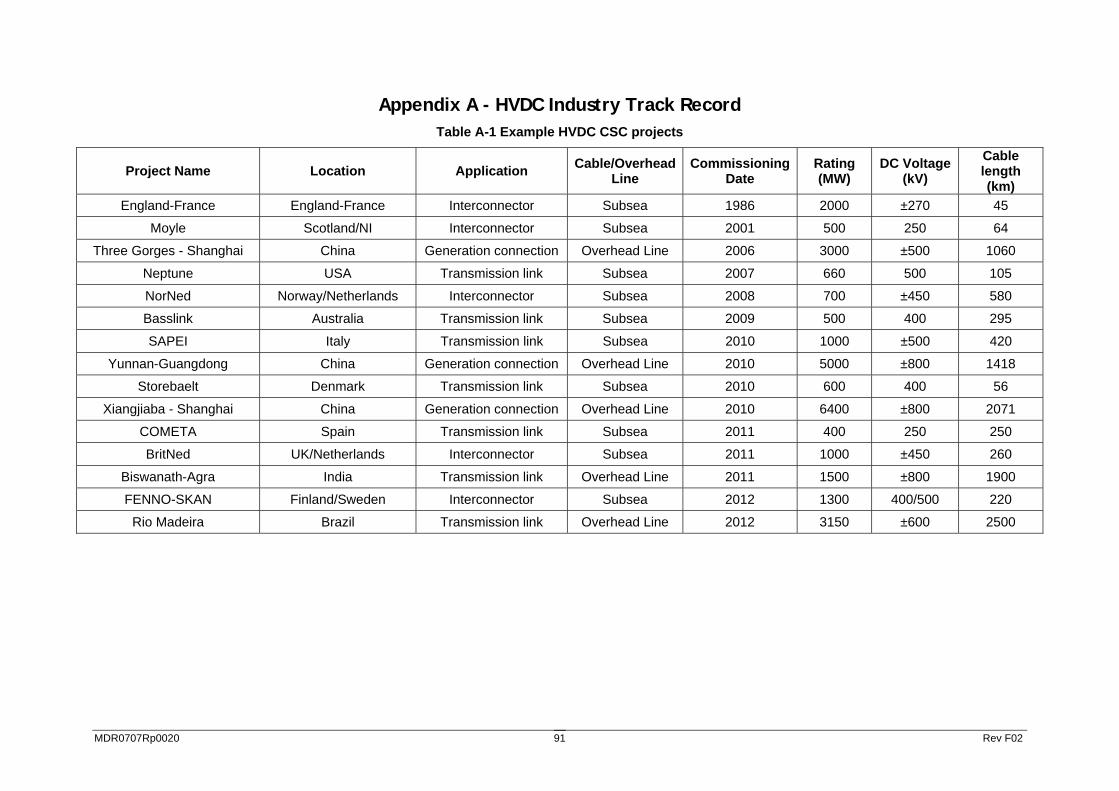
MDR0707Rp0020 Rev F02 91
Appendix A - HVDC Industry Track Record Table A-1 Example HVDC CSC projects
Project Name Location Application Cable/Overhead Line
Commissioning Date
Rating (MW)
DC Voltage (kV)
Cable length (km)
England-France England-France Interconnector Subsea 1986 2000 ±270 45
Moyle Scotland/NI Interconnector Subsea 2001 500 250 64
Three Gorges - Shanghai China Generation connection Overhead Line 2006 3000 ±500 1060
Neptune USA Transmission link Subsea 2007 660 500 105
NorNed Norway/Netherlands Interconnector Subsea 2008 700 ±450 580
Basslink Australia Transmission link Subsea 2009 500 400 295
SAPEI Italy Transmission link Subsea 2010 1000 ±500 420
Yunnan-Guangdong China Generation connection Overhead Line 2010 5000 ±800 1418
Storebaelt Denmark Transmission link Subsea 2010 600 400 56
Xiangjiaba - Shanghai China Generation connection Overhead Line 2010 6400 ±800 2071
COMETA Spain Transmission link Subsea 2011 400 250 250
BritNed UK/Netherlands Interconnector Subsea 2011 1000 ±450 260
Biswanath-Agra India Transmission link Overhead Line 2011 1500 ±800 1900
FENNO-SKAN Finland/Sweden Interconnector Subsea 2012 1300 400/500 220
Rio Madeira Brazil Transmission link Overhead Line 2012 3150 ±600 2500
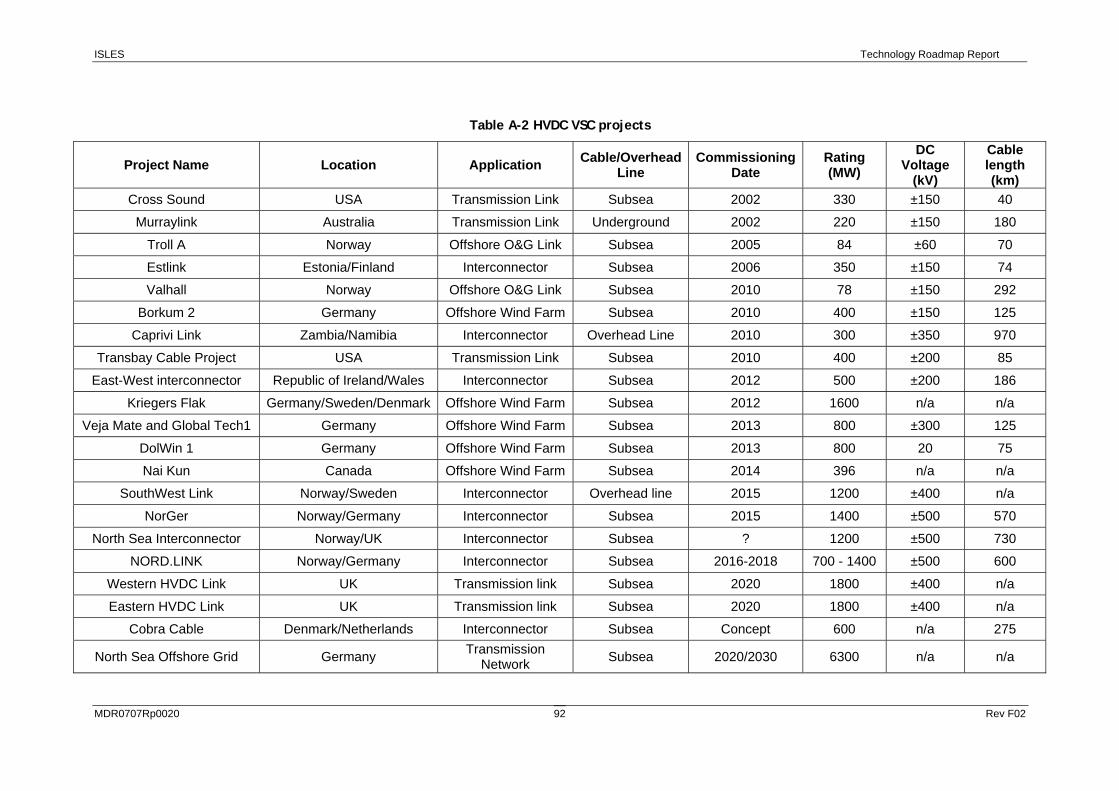
ISLES Technology Roadmap Report
MDR0707Rp0020 Rev F02
92
Table A-2 HVDC VSC projects
Project Name Location Application Cable/Overhead Line
Commissioning Date
Rating (MW)
DC Voltage
(kV)
Cable length (km)
Cross Sound USA Transmission Link Subsea 2002 330 ±150 40
Murraylink Australia Transmission Link Underground 2002 220 ±150 180
Troll A Norway Offshore O&G Link Subsea 2005 84 ±60 70
Estlink Estonia/Finland Interconnector Subsea 2006 350 ±150 74
Valhall Norway Offshore O&G Link Subsea 2010 78 ±150 292
Borkum 2 Germany Offshore Wind Farm Subsea 2010 400 ±150 125
Caprivi Link Zambia/Namibia Interconnector Overhead Line 2010 300 ±350 970
Transbay Cable Project USA Transmission Link Subsea 2010 400 ±200 85
East-West interconnector Republic of Ireland/Wales Interconnector Subsea 2012 500 ±200 186
Kriegers Flak Germany/Sweden/Denmark Offshore Wind Farm Subsea 2012 1600 n/a n/a
Veja Mate and Global Tech1 Germany Offshore Wind Farm Subsea 2013 800 ±300 125
DolWin 1 Germany Offshore Wind Farm Subsea 2013 800 20 75
Nai Kun Canada Offshore Wind Farm Subsea 2014 396 n/a n/a
SouthWest Link Norway/Sweden Interconnector Overhead line 2015 1200 ±400 n/a
NorGer Norway/Germany Interconnector Subsea 2015 1400 ±500 570
North Sea Interconnector Norway/UK Interconnector Subsea ? 1200 ±500 730
NORD.LINK Norway/Germany Interconnector Subsea 2016-2018 700 - 1400 ±500 600
Western HVDC Link UK Transmission link Subsea 2020 1800 ±400 n/a
Eastern HVDC Link UK Transmission link Subsea 2020 1800 ±400 n/a
Cobra Cable Denmark/Netherlands Interconnector Subsea Concept 600 n/a 275
North Sea Offshore Grid Germany Transmission Network Subsea 2020/2030 6300 n/a n/a
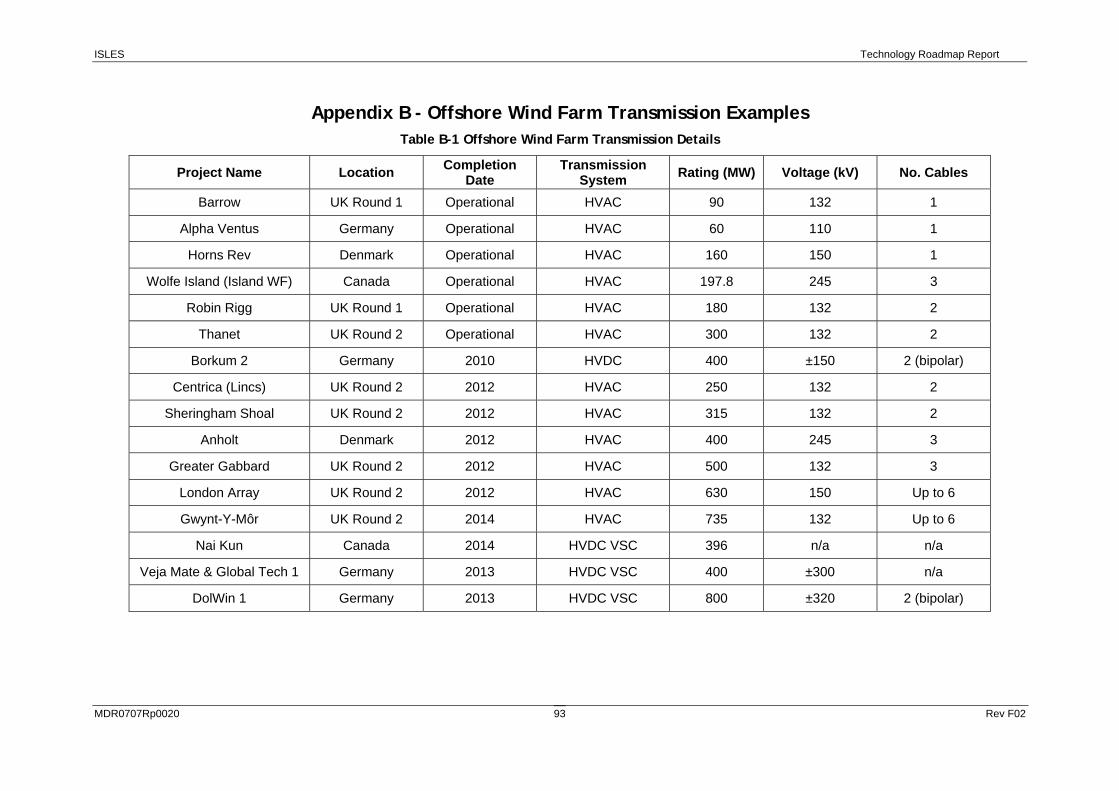
ISLES Technology Roadmap Report
MDR0707Rp0020 Rev F02
93
Appendix B - Offshore Wind Farm Transmission Examples Table B-1 Offshore Wind Farm Transmission Details
Project Name Location Completion Date
Transmission System Rating (MW) Voltage (kV) No. Cables
Barrow UK Round 1 Operational HVAC 90 132 1
Alpha Ventus Germany Operational HVAC 60 110 1
Horns Rev Denmark Operational HVAC 160 150 1
Wolfe Island (Island WF) Canada Operational HVAC 197.8 245 3
Robin Rigg UK Round 1 Operational HVAC 180 132 2
Thanet UK Round 2 Operational HVAC 300 132 2
Borkum 2 Germany 2010 HVDC 400 ±150 2 (bipolar)
Centrica (Lincs) UK Round 2 2012 HVAC 250 132 2
Sheringham Shoal UK Round 2 2012 HVAC 315 132 2
Anholt Denmark 2012 HVAC 400 245 3
Greater Gabbard UK Round 2 2012 HVAC 500 132 3
London Array UK Round 2 2012 HVAC 630 150 Up to 6
Gwynt-Y-Môr UK Round 2 2014 HVAC 735 132 Up to 6
Nai Kun Canada 2014 HVDC VSC 396 n/a n/a
Veja Mate & Global Tech 1 Germany 2013 HVDC VSC 400 ±300 n/a
DolWin 1 Germany 2013 HVDC VSC 800 ±320 2 (bipolar)
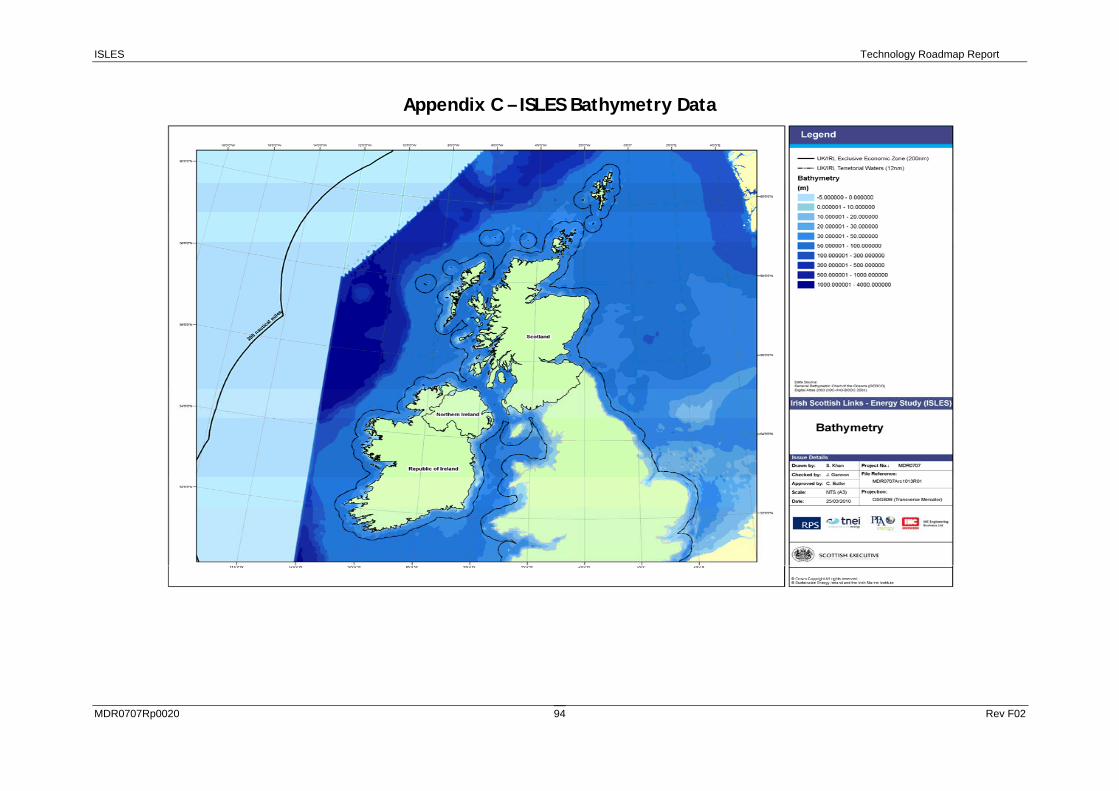
ISLES Technology Roadmap Report
MDR0707Rp0020 Rev F02
94
Appendix C – ISLES Bathymetry Data
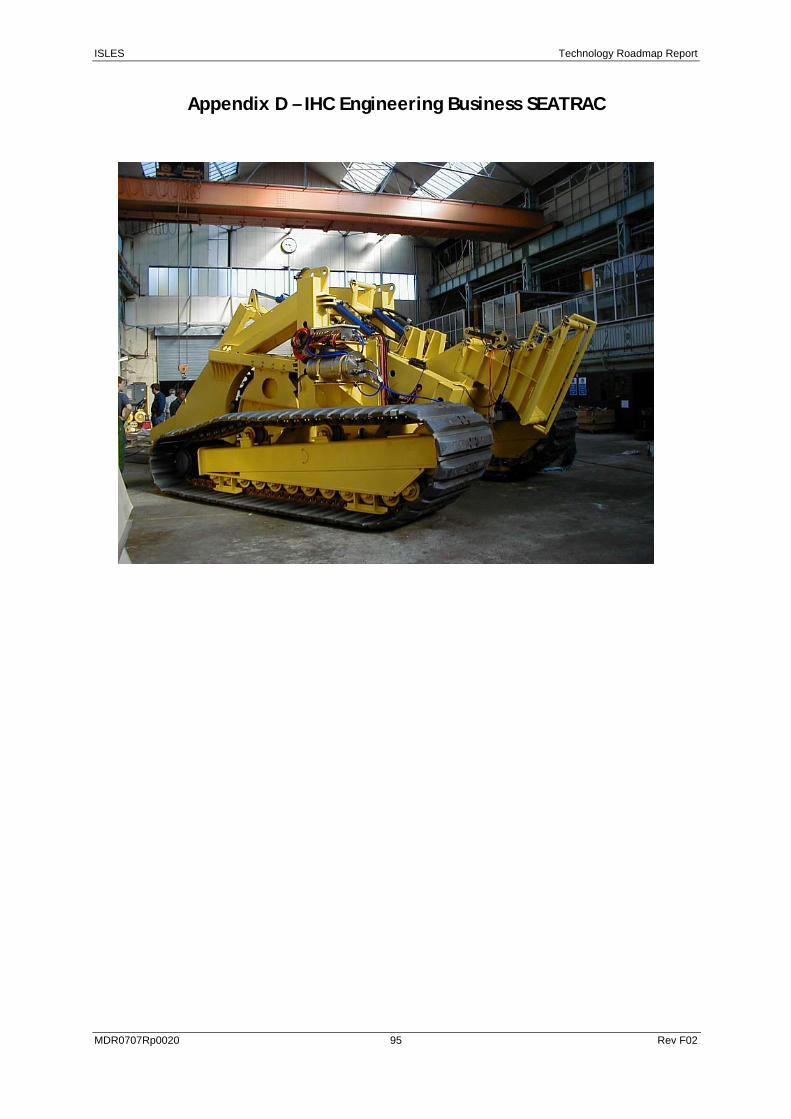
ISLES Technology Roadmap Report
MDR0707Rp0020 95 Rev F02
Appendix D – IHC Engineering Business SEATRAC