Embed Size (px)
Citation preview

IZA DP No. 1838
Is There a Link between Economic Outcomes andGenetic Evolution? Cross-Country Evidence fromthe Major Histocompatibility Complex
José A. M. BorghansLex BorghansBas ter Weel
DI
SC
US
SI
ON
PA
PE
R S
ER
IE
S
Forschungsinstitutzur Zukunft der ArbeitInstitute for the Studyof Labor
November 2005
Is There a Link between Economic Outcomes and Genetic Evolution? Cross-Country Evidence from the Major Histocompatibility Complex
José A. M. Borghans Wilhelmina Children’s Hospital, UMC Utrecht
Lex Borghans
ROA, Maastricht University and IZA Bonn
Bas ter Weel
MERIT, Maastricht University and IZA Bonn
Discussion Paper No. 1838 November 2005
IZA
P.O. Box 7240 53072 Bonn
Germany
Phone: +49-228-3894-0 Fax: +49-228-3894-180
Email: [email protected]
Any opinions expressed here are those of the author(s) and not those of the institute. Research disseminated by IZA may include views on policy, but the institute itself takes no institutional policy positions. The Institute for the Study of Labor (IZA) in Bonn is a local and virtual international research center and a place of communication between science, politics and business. IZA is an independent nonprofit company supported by Deutsche Post World Net. The center is associated with the University of Bonn and offers a stimulating research environment through its research networks, research support, and visitors and doctoral programs. IZA engages in (i) original and internationally competitive research in all fields of labor economics, (ii) development of policy concepts, and (iii) dissemination of research results and concepts to the interested public. IZA Discussion Papers often represent preliminary work and are circulated to encourage discussion. Citation of such a paper should account for its provisional character. A revised version may be available directly from the author.

IZA Discussion Paper No. 1838 November 2005
ABSTRACT
Is There a Link between Economic Outcomes and Genetic Evolution? Cross-Country Evidence from the Major Histocompatibility Complex*
This research develops a theory and presents empirical evidence of a link between economic outcomes and genetic evolution. Important properties for successful analysis of such a link are found in the adaptive immune system and particularly in the major histocompatibility complex (MHC), a genetically encoded complex involved in the defence against infections. The theory incorporates properties of the MHC in a model of mutual dependence and exhibits a trade-off in which every agent who is better off having an immune response different from that of others is also part of the protecting belt of others in a population, in which mounting similar immune responses is optimal. The data are based on large numbers of blood samples from 63 different populations. The cross-country estimates show a robust negative association between economic and health outcomes and MHC diversity and between average offers in ultimatum and trust games and MHC diversity. The analyses suggest that societies incorporating externalities from mutual dependence are economically more successful, and that the incorporation of such externalities is evident at the gene level. JEL Classification: O10, I10, C90 Keywords: genetic evolution, human cooperation, economic outcomes Corresponding author: Bas ter Weel MERIT University of Maastricht P.O. Box 616 6200 MD Maastricht The Netherlands Email: [email protected]
* We would like to thank Loes van Driel for excellent research assistance. We wish to thank seminar participants at De Nederlandsche Bank, the Evolution and Behavior Workshop in Maastricht, the Growth Conference in Lucca, Hebrew University, IZA, MERIT, the NBER Summer Institute, and Daron Acemoglu, Philippe Aghion, Josh Angrist, Rob de Boer, Arnaud Dupuy, Oded Galor, Moshe Hazan, Francis Kramarz, Nils-Petter Lagerlöf, Erzo Luttmer, Omer Moav, Ido Pen, Gilles Saint-Paul, Mathias Thoenig, Adriaan van Zon, Simon Verhulst, David Weil, Franjo Weissing, and Thomas Ziesemer for useful comments, and Ella van den Berg-Loonen and Christina Voorter of the Tissue Typing Laboratory at the University Hospital in Maastricht for clarifying measurement issues. We are grateful to the Netherlands Organisation for Scientific Research (NWO) for financial support.

1 Introduction
This paper develops a theory and presents evidence of a link between economic achieve-
ment and genetic evolution. We argue that economic conditions are a crucial determinant
of genetic evolution and give an explanation of how evolutionary forces have favored hu-
man characteristics that are well-adapted to economic circumstances. When populations
are exposed to distinct economic conditions, they develop in dissimilar ways, so genetic
differences can reveal divergent economic circumstances in a population. If these economic
conditions also affect economic outcomes a link can be established. The main obstacle to
investigate the link between genetic evolution and economic outcomes is to select genes
for which a relationship with economic circumstances can be obtained.1 There are three
crucial conditions for this research to be successful: (i) the genes studied have to be of
eminent importance for evolutionary success; (ii) the genes’ fitness has to change with
economic circumstances; and (iii) the genes’ evolution has to keep abreast of changes in
economic circumstances.2
We investigate genes that encode the major histocompatibility complex (MHC), in
humans defined as the human leukocyte antigen (HLA), and argue that these genes satisfy
the three conditions mentioned above. First, the MHC encodes a set of closely linked
genetic loci that play a crucial role in the adaptive immune system. The basic role of
the MHC is to help control infectious diseases.3 Because of its crucial role in the immune
system it is subject to strong evolutionary pressure.
Second, the MHC is the most polymorphic gene known. Despite the strong evolu-
tionary pressure different MHC molecules do not outperform each other, which suggests
frequency dependent selection in which agents benefit from having rare molecules. How-
ever, MHC diversity turns out to be limited because the distribution of MHC molecules
is far from uniform and a small number of MHC molecules are observed at a relatively
high frequency. In addition, the observed frequency distributions differ strongly between
different populations. We argue that these frequency distributions reflect economic cir-
cumstances with two forces working in opposite directions. On the one hand, since agents
are most likely infected through contact with others, individuals expressing a rare type
of MHC molecule have a selective advantage. On the other hand, we show that simi-
1Research has only pointed to a theoretical link between economic and evolutionary forces. The economic literaturehas studied a number of human characteristics important for economic behavior and success, which are potentially subjectto evolutionary selection (e.g., altruism and reciprocity). Also differences in preferences (e.g., discount rates and quantity-quality trade-offs for children) have been linked to genetic evolution. However, empirical linkages of these theoretical notionsare hampered by a lack of knowledge about the actual genes related to these human characteristics and economic outcomes.
2There are two recent fields of empirical literature using biological information to understand human behavior ineconomic environments, but these studies do not study genetic evolution. There is recent literature on neuroeconomics(e.g., Dolan [2002] and Camerer [2003] for reviews) mainly studying economic rationality; and Kosfeld et al. [2005] haveshown that oxytocin increases an agent’s willingness to accept social risks in trust games.
3Basically the MHC presents pathogen parts to the cell membrane, which triggers the growth of T cells which eliminatethe infection. See Hansen and Sachs [1989] for an overview study of the role of the MHC in the adaptive immune system.
1
larity of the adaptive immune system is advantageous from the perspective of a group
of agents. This trade-off between the individual’s and society’s optimum level of genetic
diversity presents an externality suggesting that the equilibrium with the maximum level
of diversity is not necessarily optimal.
Third, a change in the observed frequency of existing MHC molecules in a population
suffices to change the population’s genetic diversity. The advantage of this property is that
only a fraction of the population with certain MHC molecules needs to change to induce
changes in diversity. In addition, the characteristics that need to change are already
present in the population and do not require mutation and suppression of previously
dominant genes. Rapid evolutionary processes are observed and simulated, requiring
only a couple of generations for substantial adjustments in the level of MHC diversity of
populations.
To understand the link between economic performance and the MHC we model the
role of MHC in the protection against pathogens. First we analyze the evolutionary
stable equilibrium with selfish agents, and then analyze the equilibrium when agents
cooperate. We define cooperation as mutual dependence resulting from working together
in small groups in which agents equally share the resulting output from joint production.
We model this in terms of a public-good game in which defection is punished. Agents
contracting a disease are out of the production process for some time to recover. A key
feature of the model is that income depends more on the performance of others if the
agent cooperates more. Assuming that evolutionary success is positively correlated with
income, agents in more cooperative societies have more interest in the health of the agents
they cooperate with. If agents are not interested in cooperation they do not care about the
health of others and benefit from a deviant immune system. The resulting distribution of
MHC molecules will be uniform. If the risk of transmitting a disease depends sufficiently
on the MHC molecule of an agent, and the size of the groups in which agents are working
cooperatively is large enough, the social optimum (in which the number of infectious
diseases in a population is minimized) does not equal the evolutionary stable equilibrium.
In such cases a lower level of MHC diversity is more beneficial for the health outcomes of
a population. Finally, we show that when people are more cooperative the evolutionary
stable equilibrium will be closer to the the social optimum. In such an equilibrium the
more agents depend on joint production the more selective advantages they will experience
from molecules that reduce the number of infections of group members. In this cooperative
setting the model is able to generate frequency distributions that correspond to the actual
observed distributions within populations.
Assuming that there are persistent differences in cooperative behavior between popu-
lations4 those with higher levels of cooperation exhibit lower equilibrium levels of MHC
4See e.g., Roth et al. [1991], Henrich et al. [2001], Charness and Rabin [2002], and Fehr and Fishbacher [2003] for
2

diversity which improves the health status of the population. As a consequence, if coop-
eration also enhances economic performance, there will be a negative correlation between
economic performance and MHC diversity.5
In the empirical analysis we use information about HLA-A and HLA-B molecules be-
cause these are the HLA types for which most data are available from different populations
(details about the advantages of using A and B molecules are given below).6 Based on
HLA data from a large number of individuals from different populations we construct a
sample of 63 populations to investigate three different relationships. First, cooperation
leads to mutual dependence and the health of others will be internalized, so we expect a
negative correlation between measures of cooperation and MHC diversity. We correlate
MHC diversity with the offer rates in ultimatum games and amounts of money sent in
trust games, collected from a number of studies conducted for different countries, and
find a strong negative relationship between MHC diversity and these measures of cooper-
ation. This is consistent with the prediction of the model that in more trusting societies
the adaptive immune system is more homogenous. Second, a discrepancy between the
selfish stable evolutionary equilibrium and the social optimum should be associated with
a negative correlation between MHC diversity and health outcomes. The main reason for
this is that in societies with higher levels of mutual dependence MHC diversity is lower
and the health status of agents better. Using life expectancy at birth and the fraction
of people dying from viral infections as indicators of health we find a robust negative
correlation between HLA-A and HLA-B diversity and health outcomes. Finally, societies
that are better able to cope with public-good dilemmas will be economically more suc-
cessful. More cooperation induces lower optimal levels of MHC diversity, so we expect a
negative correlation between MHC diversity and economic performance. The estimates
show a robust negative correlation between HLA-A and HLA-B diversity and economic
outcomes.
The paper proceeds as follows. Section 2 presents the MHC properties important for
economic outcomes and the data. Section 3 presents the model and the evolutionary
equilibrium outcomes. Section 4 presents the empirical results of the correlation between
measures of human cooperation and MHC diversity, the relationship between life ex-
pectancy and MHC diversity, and the relationship between economic outcomes and MHC
diversity. Section 5 discusses a number of alternative explanations. Section 6 concludes.
studies obtaining differences in ultimatum game offer rates across populations, cities and countries.5Saint-Paul [2003] and Galor and Moav [2004] also explicitly model genetic differences. Saint-Paul develops a theory
of comparative advantage to show that under trade less fit humans are able to survive and to be as productive as fitterhumans. Galor and Moav argue that increased pathogen pressure, worsened living conditions and environmental hazardsin the movement from hunter-gatherer societies to agricultural societies reduced life expectancy initially, but at the sametime selected individuals who were less vulnerable to this movement, which eventually increased life expectancy. However,these contributions do not offer empirical support for a direct link between economic performance and genetic evolution.
6There are six different types of HLA molecules. For the other HLA types (HLA-C, HLA-DP, HLA-DQ and HLA-DR)much less data are available from many populations.
3

2 The Major Histocompatibility Complex
Immunology is concerned with the means by which a host tries to control infectious
diseases caused by pathogens.7 Protection against pathogens operates at three different
levels. First, external defences, such as the skin, hamper the intrusion of pathogens.
Second, if pathogens nevertheless manage to enter the host, the innate immune system
rapidly tries to eliminate them using a large variety of cells and molecules. Finally, if
pathogens are not captured and disposed by the innate immune system, the adaptive
immune system, consisting of a huge diversity of lymphocytes, eliminates the pathogen
(whenever possible) and retains immunological memory to be protected against future
infections with the same pathogen.
In mammalians and many other species a set of closely linked genetic loci is of funda-
mental importance for the adaptive immune system. This set of genes encodes the major
histocompatibility complex (MHC). MHC molecules play a crucial role in the induction
of T lymphocytes of the adaptive immune system.8 Its basic role is to present pathogens
to the adaptive immune system.9
2.1 The Basic Role of MHC in the Immune System
A pathogen that has managed to infect a host, and has escaped the external defence and
the innate immune system, may be harmful to the host. In case of a viral infection, in-
fected cells become the producers of new pathogens. The cell decomposes its intracellular
proteins, including the viral proteins, into short peptides.10 The primary role of MHC
molecules is to take small samples from these large collections of peptides and present
these peptides on the cell membrane. In response to the presentation of foreign peptides
on the cell membrane, the activity and proliferation of specialist T cells is triggered, which
ultimately leads to killing of the infected cell. Thus, the presence of a foreign peptide
bound to an MHC molecule signals the presence of a foreign pathogen inside the cell.
After a while the proliferation of T cells stops and most T cells die. About 5-10 percent
of the specific T cells survive and form a population of “memory cells” responsible for
future protection.11
7Pathogens are defined as infectious agents that cause diseases. Microbiologists generally distinguish six classes ofpathogens: viruses (e.g., pox, and influenza), bacteria (e.g., syphilis and tuberculosis), fungi (e.g., ringworm and yeast),protozoa (e.g., trypanosome), helminths (e.g., hookworm and tapeworm) and ectoparasites (insects).
8The adaptive immune system itself consists of B lymphocytes, which produce antibodies, and T lymphocytes. Thereare two major types of T lymphocytes: cytotoxic T lymphocytes (CTL), which kill pathogens, and helper T lymphocytes,which play a central role in the induction of B and T lymphocyte responses.
9Playfair and Bancroft [2004] review the study of infection and immunity at great length.10For class I MHC molecules short means that these peptides consist of 8-11 amino acids only.11T cells have similarities with B cells, which produce antibodies, but there are important differences. While B cells can
directly recognize extracellular pathogens, T cells only recognize peptides that are being presented by MHC molecules onthe surface of cells. T cells can be thought of as hands reaching out to feel the surface of neighboring cells, with some fingerscontacting the MHC molecules and others probing for the peptide bound to them. Pathogens that survive inside host cellsare thus effectively protected against recognition by B cells, but the MHC molecules betray their presence to T cells.
4

Figure Ia provides a schematic representation of an MHC molecule. The polymorphic
pair at the top of the molecule (α1 and α2) forms a groove to which peptides are bound.
The specific binding properties of different MHC molecules determine which peptides are
presented to the T cells and, as a result, which parts of a pathogen are recognized by
the immune system. This means that different individuals with different MHC molecules
sample different peptides from the same set of proteins to initiate an immunological
response to an infection. This can explain differences in disease progression between
individuals, as has been shown for HIV (Carrington and O’Brien [2003]) and malaria
(Hill et al. [1991]).
Figure Ib illustrates how T cells cooperate with MHC molecules to kill a virally infected
cell. Once the cell has been infected, the MHC molecules on the cell surface present
peptides, which can be recognized as foreign by specialist T cells. If a T cell recognizes a
peptide-MHC complex it is able to respond effectively to the infection and to eventually
kill the virally infected cell.
In humans, human leukocyte antigens (HLA) are encoded by genes located on chro-
mosome 6. Six different types of HLA molecules are distinguished: HLA-A, HLA-B, and
HLA-C are class I MHC molecules and are found on the membrane of every body cell,
while HLA-DP, HLA-DQ, and HLA-DR are class II MHC molecules and are present only
on the membrane of certain cells of the immune system. HLA-A, HLA-B, and HLA-C
are especially important for immune responses against intracellular pathogens (such as
viruses), while HLA-DP, HLA-DQ, and HLA-DR are mainly deployed to control extracel-
lular infections (such as many bacterial infections). MHC class I molecules trigger so-called
cytotoxic T lymphocytes, while MHC class II molecules induce T helper responses.
The MHC is known for its remarkable degree of polymorphism. In mammalians MHC
genes are the most polymorphic genes present, so that within a population many different
alleles per MHC locus exist.12 Since MHC molecules fulfil a crucial role in the host’s
immune response to pathogens, there is strong evolutionary selection of MHC alleles. If
one specific MHC molecule outperforms the others, this molecule is expected to become
dominant in the population. For this reason, the large degree of observed polymorphism
points to a frequency-dependent selection process of MHC molecules in populations. Since
every agent has two sets of chromosomes, maximally two different MHC molecules at each
MHC locus are present (one inherited from the mother and one from the father). Due
12For this reason it is common among anthropologists to use information about the frequency of different MHC moleculesto trace ethnic origins of populations and to study the cultural mechanisms that can help explain why genes and culture maycoincide [Durham 1992]. One allele typically dominates within a population, but rare variants are known to survive easily.The existence of a specific allele that is rare within one population but dominant in another reveals ethnic bonds betweenboth populations in the past. Cavalli-Sforza et al. [1994] have contributed to the understanding of the ethnic origins ofdifferent groups and populations, also revealing similarities with the diffusion of linguistic elements over the world. Hewlettet al. [2002] have used genes and language as tools for interpreting the genetic diversity among a large number of Africanethnic groups. We investigate the diversity of alleles per locus within a population, leaving aside possible ethnic tracesrevealed by specific or individual MHC alleles.
5

to the high degree of MHC polymorphism in the population, there is a high probability
of MHC heterozygosity (i.e., the presence of different alleles at the two chromosomes).
Although the evolutionary advantage of MHC heterozygotes could explain the occurrence
of polymorphism, a number of studies suggest a direct evolutionary advantage of rare
alleles to be the main factor explaining the large degree of polymorphism of the MHC in
populations.13 Such a direct advantage of rare alleles is present, because pathogens tend
to adapt to the most common MHC molecules in the host population.
Several empirical studies suggest that MHC polymorphism also directly affects mating
processes.14 Fish, mice and other animals turn out to prefer sexual partners with dissimilar
MHC molecules. In addition, embryos with a large MHC similarity with their mother face
a higher risk of preferential abortion. Experiments have shown that humans prefer the
body odor of potential partners embodying a dissimilar MHC genotype, which increases
the degree of polymorphism in a population.15 Both phenomena support the hypothesis
that MHC diversity is important for evolutionary success.
Since class I MHC molecules are expressed by virtually all body cells, HLA alleles in
humans can be traced by analysis of blood samples. There are two types of tests that
are frequently used: serological tests, typing the specific HLA molecules expressed by a
cell, and DNA tests, reading the structure of the genes that encode the HLA molecules.
DNA typing is more expensive, but has the advantage that no fresh blood is needed,
and that its resolution can be higher than that of serological tests. As a result of new
DNA techniques the knowledge about subtle differences between HLA molecules is still
increasing. At present there are still many questions regarding the specific role of HLA-A
versus HLA-B.16
Originally, using serological tests, both HLA-A and HLA-B alleles have been classified
according to a two-digit system, distinguishing 19 different HLA-A alleles varying from
A01 to A43, and 42 HLA-B alleles, ranging from B07 to B78. More refined DNA methods
enabled researchers to find differences within many two-digit groups. For that reason
the classification has changed to a four-digit level. The first two digits indicate the old
classification, while the last two digits include information about the particular subtype.
At the same time, researchers recognized that many subtypes are actually almost func-
tionally identical in the sense that they share similar peptide binding properties. Based
on these binding properties Sette and Sidney [1999] and Lund et al. [2004] propose new
13 See e.g., De Boer et al. [2004] and Borghans et al. [2004] who argue that the MHC is polymorphic as a consequence offrequency dependent selection due to host-pathogen co-evolution, and not merely because of MHC heterozygote advantage.In addition, MHC polymorphism allows hosts to draw small and different samples from a pathogen’s genome to induce animmune response.
14Penn [2002] provides an overview study addressing the relationship between sexual selection and MHC diversity.15See e.g., Wedekind and Furi [1997] and Milinski and Wedekind [2001]. Reusch et al. [2001] provide interesting evidence
on the stickleback mating behavior, which seems to be driven by odor as well.16Kiepiela et al. [2004] provide evidence that HLA-B is dominant in the co-evolutionary process of the immune system
and pathogens.
6

groups of HLA “supertypes” of molecules that are functionally similar. For HLA-A these
supertypes coincide to a large extent with the original two-digit grouping, but for HLA-B
many molecules associated with different two-digit groups turn out to be functionally
very similar. The knowledge about HLA-C is more limited, the available frequency tables
contain many unknowns, and the number of populations for which HLA-C is available is
relatively low. With respect to class II molecules, information for a representative sample
of countries is currently not available.
2.2 Data and Sample Construction
Appendix A.I provides details about the data and its sources. Here we only discuss the
most salient details. We have collected data from several sources about the frequency of
HLA molecules in different populations. We have selected all known (two-digit) HLA-A
and HLA-B alleles within many different populations.
Our primary data source has been the collection of HLA frequencies following the
Eleventh International Histocompatibility Workshop and Conference. At this conference
the results of identical HLA typing for a large number of ethnic groups were presented. In
this way consistent information about allele frequencies within many populations could
be identified. We use several secondary data sources to test the consistency of the data
and to add a number of populations to our sample. For some populations HLA typing
is obtained from regular tests because of tissue, organ or stem cell donations.17 To avoid
selectivity and non-random sampling, only genetic information from healthy agents has
been used, including only one observation when information of several siblings or parents
within one family is present in the data.
The data on ethnic groups have been matched to countries to obtain information about
macroeconomic indicators, such as GDP per capita. In some cases the link between
ethnic groups and countries is not trivial. Whenever possible, we matched economic
data of a country with information about HLA of the economic dominant ethnic group.
Furthermore, for some ethnic groups no economic indicators were present, whereas for
some countries no HLA information was available. Altogether, we obtained a sample of
63 countries.
2.3 Frequency Dependence and Evolution of MHC Diversity
MHC polymorphism points to a process of frequency-dependent selection with respect to
these molecules. Interestingly, however, the observed frequency distribution of different
17Originally, the name MHC was given to a large genetic region containing genes that determine the success or failure ofgraft transplantation. If two agents share the same set of MHC molecules, transplantation has the largest chance of beingsuccessful. The larger the difference, the higher the probability of rejection of the transplant.
7
molecules within a population does not appear to be a uniform distribution. Another
observation is that the dominant allele differs between populations.18
Figure II shows the average frequency distribution of the 19 different HLA-A molecules
and 42 HLA-B molecules in a population. Because different molecules are dominant in
different populations, we rank-ordered the frequencies before taking averages over all
populations. The graph in the first panel illustrates that in most populations there is
one HLA-A molecule with a high frequency, of on average 26.9 percent. The average
frequency of the second most-frequent molecule equals 17.0 percent. The relatively high
presence of some molecules is more prominent for HLA-A than for HLA-B which is most
likely due to the fact that there are 42 B-molecules compared to only 19 A-molecules,
and because of the disagreement in the classification of HLA-B molecules, which only
recently advanced to the formation of so-called supertypes (e.g., Lund et al. [2004]).
The observed frequency-distributions of molecules suggest that, along with an individual
selective pressure for a large variety of rare MHC alleles, there seems to be a selective
pressure at work favoring the homogeneity of MHC alleles within populations.
As a measure of diversity we use 1−∑k F 2k where Fk is the frequency of type k in the
population. Fk is known in genetics as the degree of heterozygosity (see Cavalli-Sforza
et al. [1994]) and as the Herfindahl index in economics.19 The index equals 1− the
probability that two persons in a population share the same molecule.20 When applied
to small samples, a plain calculation of the sample diversity underestimates the diversity
within the whole population. For that reason we corrected the estimator by subtracting
the expected bias (Fk(1−Fk)/n) from each component F 2k . We present details about this
approach in Appendix A.II. Simulation of the resulting measure of diversity suggests that
for the smallest samples in our set (n = 100) the bias is reduced from approximately 0.010
(28.6 percent of a standard deviation) to 0.0005 (1.4 percent of one standard deviation)
on a diversity scale ranging from 0.700 to 0.900 (with a standard deviation of 0.035).
Figure III shows how the frequency of the five most frequent HLA-A and HLA-B
molecules is related to the measure of diversity. The horizontal axis is defined as the level
of diversity within a population and the vertical axis shows the frequency of appearance
of particular molecules. We observe a consistent relationship between the overall level of
MHC diversity and the specific form of the distribution within populations. Especially
the frequency of the most frequent MHC molecule is large when MHC diversity is low.
18The heterogeneity of MHC is unrelated to other aspects of human diversity. For example, Blood type O is knownto be present in about 90 percent of the South-American population and traditionally the continental Western Europeanpopulations are characterized by higher proportions of type A. The lowest frequency of O is found in Eastern Europe andCentral Asia, where B is relatively common. There is no significant correlation between blood type dominance and MHCmolecule dominance in our cross-section of populations. Also the degree of heterogeneity is unrelated.
19Our empirical results are robust to using different powers in this index.20As a measure of polymorphism the “degree of heterozygosity” seems to be a misnomer. Based on Mendelian expecta-
tions, both measures of diversity will be identical however. Since there are reasons why the Mendelian rules do not hold forMHC (e.g., as a result of disassortative mating and preferential abortion), this measure reflects the degree of polymorphismrather than the degree of heterozygosity.
8

The frequency of the second molecule also increases as MHC diversity decreases, but at
a much lower pace. The frequency of the fifth molecule remains almost constant between
a level of diversity of 0.754 (0.873) and 0.929 (0.959) for HLA-A (HLA-B) molecules but
decreases when diversity falls below this level. Again the pattern is more pronounced for
HLA-A molecules than it is for HLA-B molecules.
A link between the economic and biological domain only materializes if time horizons
are comparable, which implies that economic circumstances have to remain stable for some
time for an evolutionary equilibrium to emerge. Evolution of the diversity of MHC alleles
in a population can be rapid for two reasons. First, there is a large evolutionary pressure
on the MHC. Second, changes in diversity require only changes in MHC frequencies. A
change in a distribution, such as presented in Figure II, only requires the characteristics
of a fraction of the population to change. Importantly, the characteristics that need to
increase in terms of frequency can already be present at high frequency in a population
before the evolutionary change starts. We show below that a sufficient change in MHC
diversity within a population can occur in four to ten generations.21
2.4 Transmission of Pathogens and Immune Responses
Infectious diseases spread in a number of ways between individual hosts. Most skin
infections spread by direct skin contact (e.g., pox) or via the water (e.g., hookworm),
while most respiratory infections spread by coughing and sneezing, and most intestinal
infections by faeces and diarrhoea. Other pathogens spread as a result of sexual contacts
(e.g., herpes, HIV and syphilis) and via blood or blood products (e.g., hepatitis B and
C and malaria). Finally, insect and animal bites spread pathogens causing for example
yellow fever, malaria and rabies.
Some pathogens spread more easily than others.22 In addition, when a pathogen
spreads through a population, some hosts may contract the disease while others do not.
These differences between hosts are largely caused by differences in HLA background.
Some hosts manage to present a larger variety of pathogen peptides to their immune
system than others, or happen to present peptides that the pathogen cannot mutate.
Hosts may even get infected, transmit the virus, but fail to contract the disease because
of immune control. Other infected hosts might contract the disease because of less effective
immune responses. These cases can occur because time between infection and induction
of an effective immune response can be used by a pathogen to infect other hosts.
21In contrast, for many other evolutionary changes a new and improved gene has to occur through mutation and suppressthe previously dominant one, which (if successful at all) takes much longer. Aoki [1991] shows that lactose tolerance amongEuropeans increased from 5 to 70 percent in a period of about 5,000 years. Similarly, the establishment of the sickle cellgene that protects African farmers against malaria took around 10,000 years to materialize.
22In other words, the degree of contact between the host and the pathogen matters. This depends on the number ofpathogens in the environment and the means by which they typically spread.
9

Transmission of infectious diseases explains why agents with an adaptive immune
system that differs from neighboring agents have a selective advantage. If this would
be the only factor, the expected distribution of MHC molecules in populations would be
uniform to ensure a maximum level of MHC diversity between hosts. The non-uniform
shape of the frequency-dependent distribution of the MHC described above thus suggests
that there are additional forces influencing MHC diversity within populations.
A prominent reason for the observed frequency distribution to be non-uniform is that
properties of the immune system of one agent affect the health outcomes of other agents.
If a host becomes infected but the adaptive immune system deals effectively with the
infection, and thereby avoids infection of other individuals, this agent reduces the inci-
dence of the disease in a population. In addition, the prevalence and reproduction rate
of this infection in a particular environment will be lower if the proportion of agents with
an adequate immune response in the population is higher.23 This is especially true for
endemic diseases and for periodically returning (modified) pathogens with relatively high
reproduction rates, such as the influenza virus.
One specific agent in a group can be infected by all others. The immune responses of
all other individuals in the group therefore act as a protecting belt to any specific agent. If
every agent has different MHC molecules, which are effective against different pathogens,
every pathogen has ample opportunities to get through this protective belt, using the
weakest link as host. For this specific agent it is optimal when the others share the
same MHC molecules. Conditional on the MHC molecules of the other agents, however,
it is advantageous to have a different MHC. When a new pathogen breaks through a
protective wall, having a different MHC molecule provides the best opportunities for an
effective immune response. The trade-off is that every agent who is better off in being
different from the others is also part of the protecting belt of others, in which a lower level
of MHC diversity is optimal. The optimal distribution of molecules for the group depends
on the relative magnitude of both effects. A selfish agent will however only optimize its
own benefits. Being similar is beneficial to the others, while being different is beneficial
to any specific agent, so a prisoners dilemma occurs, which will lead to a higher level of
MHC diversity than is optimal for the group as a whole.
In economic terms this means that there exists an externality in the immune responses
of single agents to build resistance at the level of the population. As a result, there is no
reason to assume an equilibrium in which a maximum level of MHC diversity is optimal.
In case of a discrepancy between the individual equilibrium and the population’s (social)
optimum, any change in the degree to which agents internalize this externality affects the
frequency distribution of MHC molecules in that population. For populations in which
mutual dependence between agents in terms of production and economic outcomes is more
23The reproduction rate refers to the average number of susceptible agents infected by a single host; R0 in epidemiology.
10

important, the social optimum with lower levels of MHC diversity and a high prevalence of
specific MHC types is more likely to be the observed immune system outcome, compared
to populations in which mutual dependence is lower.
3 Model
3.1 Modelling the MHC
Consider a population with generations of Ng agents. In each generation random and
small groups of agents of size n + 1 are formed. Every agent has n randomly selected
contemporary agents in close vicinity. These people are together because they cooperate
in their work. This increases the probability of an agent to infect other members of the
cooperative group. Further on we will also investigate the implications of their cooperative
behavior for the immune system. Each period, agents have one unit of time available to
work. After having contracted a disease a fraction 1− ti is needed to recover, so a fraction
ti ≤ 1 of this time can be used to produce. Let there be m different MHC molecules
(indexed k or l) and m types of pathogens (indexed v or w). The immune responses
induced by different MHC molecules differ in the capacity to prevent contraction and
transmission of the disease. Each pathogen is assumed to have equal probability to be
active in a certain (sub)period. Upon exposure to the pathogen, each of the n agents have
equal probability (α) of direct infection. When a person is infected, there is a probability
pkv of transmission to all the others in his group. This probability of transmission depends
on the combination of the pathogen (v), and the MHC molecules (k) of the infected donor.
Combined with the initial probability of infection pkv = αpkv describes the probability
that a host infects others. Once infected, a host contracts the disease with probability
qkv. We distinguish between pkv and qkv because hosts may transmit an infection without
contracting the disease, and vice versa, contract an infectious disease without transmitting
it. There are two interesting specific cases. If pkv = qkv everyone who transmits contracts
the disease and vice versa. If qkv = 1, everyone infected contracts the disease. In case an
individual contracts a disease, production stops for a fixed period of time, until recovery.
For our purposes the most interesting case is when each MHC molecule confers an
advantage to tackle a specific pathogen, while MHC molecules do not differ in their pro-
tective effect against other pathogens. The scheme below gives the values of pkv and qkv
for this case. The schedule shows that MHC 1 is good for fighting disease 1 and so on.
We use this scheme to illustrate the results of the model and refer to it as the symmetric
case, i.e., the probability of transmission p and contraction of disease q are correlated. In
addition, without loss of generality, we assume that phigh > plow and qhigh > qlow.
11

Transmission Disease
Disease 1 Disease 2 Disease 3 Disease 1 Disease 2 Disease 3
MHC 1 p11 = plow p12 = phigh p13 = phigh q11 = qlow q12 = qhigh q13 = qhigh
MHC 2 p11 = phigh p22 = plow p23 = phigh q21 = qhigh q22 = qlow q23 = qhigh
MHC 3 p11 = phigh p32 = phigh p33 = plow q31 = qhigh q32 = qhigh q33 = qlow
The probability that an agent with MHC type k contracts disease type v depends on
the probability of direct infection from outside the group (α) or infection through in-
fection and transmission from at least one other agent in the group, multiplied by the
probability of actually contracting the disease when infected, i.e.
P (k, v) =
(1− (1− α)
∏l
(1− plv)nπl
)qkv, (1)
where πk is the fraction in the population with MHC type k, with∑
k πk = 1.
A social planner, who aims to minimize the number of infections in a population and
who could set the distribution of MHC molecules in a population, would want to maximize
income Y , which is equivalent to maximizing the time actually worked in a population.
Hence, the social welfare function, S, equals
S = Ng (1−∑v
∑k P (k, v))
= Ng (1−∑v ((1− (1− α)∏
l(1− plv)nπl)
∑k(πkqkv))) .
(2)
3.2 The Evolutionary Equilibrium
Assuming that the evolutionary success of i (ESi) depends positively on his economic
performance (as lower output lowers the revenues and subsequently lowers the possibilities
to use resources for reproduction and health), evolutionary success is negatively affected
by the fraction of time the agent is recovering from a disease. More formally, evolutionary
success of i equals: ESi = f(1 − ti), with f ′ > 0. If f can be approximated by a linear
function, the expected value of the evolutionary pressure equals by approximation
E(ESi) = f(1− E(ti)). (3)
An evolutionary stable equilibrium has to satisfy the equilibrium condition and the sta-
bility condition.24 The equilibrium condition implies that ESi = C (C > 0) for all genetic
characteristics of i with a positive frequency in the population, while the stability condi-
tion implies that the evolutionary success of every characteristic with zero probability is
less or equal to this level (ESi ≤ C).
24See e.g., Maynard Smith and Price [1973] and Van Damme [1991] for definitions of these equilibria.
12

Individual evolutionary selection increases the frequency of MHC molecules that lead
to higher evolutionary success. This implies that in an evolutionary stable equilibrium
either the evolutionary success of molecule k equals the evolutionary success of molecule
k, or that the molecule with lower fate has frequency 0.
For each combination of molecules k and k with non-zero frequency, the equilibrium
condition for mixed distributions equals
∑v
(1− (1− α)
∏l
(1− plv)nπl
)qkv =
∑v
(1− (1− α)
∏l
(1− plv)nπl
)qkv. (4)
The expected number of agents who contract the disease upon exposure to virus v if agent
i expresses MHC type k, equals1− (1− α)(1− pkv)(n−1)πk+1
∏l 6=k
(1− plv)(n−1)πl
n∑
l
πlqlv. (5)
The condition for an evolutionary stable equilibrium, for each combination of k and k
with non-zero frequency, equals∑v (1− (1− α)
∏l(1− plv)
nπl) qkv+
γ(1− (1− α)(1− pkv)
(n−1)πk+1∏l 6=k(1− plv)
(n−1)πl
)n∑
l πlqlv
=∑v (1− (1− α)
∏l(1− plv)
nπl) qkv+
γ(1− (1− α)(1− pkv)
(n−1)πk+1∏l 6=k(1− plv)
(n−1)πl
)n∑
l πlqlv.
(6)
In the symmetric case two results can be derived from the social welfare function (2) and
the two conditions (4) and (5). We derive and proof these results in the theorems below.
Theorem 1 (Evolutionary Equilibrium without Cooperation): In the symmetric
case when evolutionary selection depends only on individual health, and phigh 6= plow and
qhigh 6= qlow, the only evolutionary stable equilibrium equals πk = 1/m for every k
Proof: Using the symmetric parametrization equation (11) can be written as(1− (1− α)(1− plow)nπk(1− phigh)
nπk(1− phigh)n(1−πk−πk)
)(qlow − qhigh)+(
1− (1− α)(1− phigh)nπk(1− plow)nπk(1− phigh)
n(1−πk−πk))
(qhigh − qlow) = 0(7)
Because qhigh 6= qlow this can be rewritten as(1− plow
1− phigh
)n(πk−πk)
= 1. (8)
Now phigh 6= plow yields πk = πk, and thus πk = 1/m. It is easily verified that the second
order condition in this equilibrium holds.
13

QED
Theorem 1 shows that when evolutionary success depends on individual health only,
the distribution of MHC molecules in the population in an evolutionary stable equilibrium
is always uniform and thus fully diverse. This observation, however, seems inconsistent
with the observed distribution of MHC molecules in populations.
Theorem 2 (Difference Between Social Optimum and Evolutionary Stable
Equilibrium without Cooperation): πk = 1/m, for all k, is not a socially opti-
mal distribution of MHC molecules, if n log(
1−plow
1−phigh
)> 2
qhigh−qlow1m
qhigh+m−1m
qlow.
Proof: Consider the situation in which the frequency of MHC molecule k, πk, can be
increased at the expense of molecule k, with frequency πk, keeping the frequency of the
other MHC molecules constant. Denoting π =∑
l 6=k,k πl, implies that πk = π − πk. The
social welfare function (2) then reads
S = Ng −(1− (1− α)(1− plow)nπk(1− phigh)
n(π−πk)∏l 6=k,k(1− plow)nπl
)Ng(πkqlow + (1− πkqhigh))
−(1− (1− α)(1− phigh)
nπk(1− plow)n(π−πk)∏l 6=k,k(1− plow)nπl
)Ng((1− π − πk)qlow + (π + πk)qhigh))
−∑v 6=k,k
(1− (1− α)(1− plow)n(1−π)∏
l 6=k,k(1− plv)nπl
)Ng(πkqlow + (1− πkqhigh)).
(9)
It is easily verified that the derivative with respect to πk of this function, if πl = 1/m
for all l, equals 0. Therefore, the social welfare function always has an optimum in the
distribution (1/m, 1/m, ..., 1/m) of MHC molecules in the symmetric case.
This optimum is not a maximum if the second derivative of the welfare function is
positive in (1/m, 1/m, ..., 1/m). The second derivative in this point equals:
d2Sdπ2
k
∣∣∣∣(1/m,1/m,...,1/m)
= 2m(qlow − qhigh)−
n(qlow + (m− 1)qhigh) log(1− phigh) + n(qlow + (m− 1)qhigh) log(1− plow)(10)
This expression is positive if
n log
(1− plow
1− phigh
)> 2
qhigh − qlow1m
qhigh + m−1m
qlow
. (11)
QED
Theorem 2 shows that for certain parameter values of the model the social optimum is
equal to the evolutionary stable equilibrium, but for other parameters the social optimum
is a different one. In the latter case there is a discrepancy between the outcome of the
14
individual evolutionary selection process and the social optimum. This implies that MHC
diversity in the social optimum is lower than in the evolutionary stable equilibrium. This
discrepancy will occur when n is sufficiently large, phigh − plow is sufficiently large, or
qhigh − qlow is sufficiently low. Increasing m also shifts the balance in the advantage of a
discrepancy between the social optimum and the individual equilibrium.
3.3 Cooperation
The question is how the selfish evolutionary equilibrium will change once people become
mutually dependent because of cooperation. Following the structure of a linear public
goods game, each agent can decide to spend a fraction of time (γi) to a joint project and
(1− γi) to solo activities. Remember that agents are part of a small group of n+1 agents
in which infectious diseases easily spread. Total output of a cooperative project equals
Q∑
j γjtj, where Q is the return to the public good investments. Output will be shared
among the agents, so every agent receives Qn+1
∑j γjtj. The marginal per capita return
equals Qn+1
. The output of a solo project equals (1− γi)ti.
If Q < 1 cooperation is not beneficial and if Q > n + 1, agents voluntarily cooperate
completely (in a Nash equilibrium): γi = ti. The interesting case is 1 < Q < n + 1, where
the Nash equilibrium induces solo activities only (γi = 0), since d(1−γi)
dγi> dQγi/n+1
dγi. In
cases where individual optimization does not lead to social optimality, rules, altruism,
social pressure or reciprocal punishment can lead to higher levels of cooperation.
We assume that groups of agents expect a target level of cooperation γ. Agents who
put less effort in this joint project are punished, while those who invest more are rewarded.
The punishment function is defined as ρti
(e
γ−γiγ − 1
), with ρ ≥ 0. Now, the income of
agent i equals
Yi = (1− γi)ti +∑j
Q
n + 1γjtj − ρti
(e
γ−γiγ − 1
), (12)
where the first term on the left-hand side is solo production, the second term joint pro-
duction and the final term punishment. The optimal value of γi can be derived from the
first order condition and equals
dYi
dγi
= ti
(−1 +
Q
n + 1+
ρ
γti
(e
γ−γiγ − 1
)), (13)
which implies that
γ − γi
γ= ln
n+1−Qn+1
γ
ρ
. (14)
So every target level of cooperation (γ) is related to actual cooperative behavior (γi). We
impose that in every population a long-run equilibrium of the social norm will be settled
15
in which the target value of cooperation is equal to the actual degree of cooperation.
Then, the socially expected behavior equals the usual behavior of the agents, i.e.,
γ = ρn + 1
n + 1−Q, (15)
which reveals that γ is increasing with the level of punishment and with Q, and decreasing
with the size of the group n + 1. Agent i’s income in this equilibrium then equals
Yi =
((n + 1)(1− γ) + Qγ
n + 1
)ti +
∑j 6=i
(1
n + 1Qγ
)tj, (16)
which exists of an individual and a group component (of course agent i contributes to the
group income too). Using the symmetry of the model it can be derived that the expected
income per worker equals
E(Yi) = ((1− γ) + Qγ)E(ti), (17)
which shows that income rises from ti to Qti when γ shifts from 0 to 1. If the variation
between countries in terms of E(ti) is smaller relative to the variation in Q, differences in
cooperation between individuals are the main determinant of income.
Crucial for the model, however, is that differences in the degree of cooperation change
evolutionary pressure regarding the immune system. Defining
γ =Qγ
(n+1)(1−γ)+Qγn+1
(18)
to normalize agent i’s own contribution to one the participation by other agents con-
tributes with weight γ to the performance of i. Consequently, the overall income of i
depends more on the health status of others, when cooperation γ increases. This result
shows that cooperation leads to mutual dependence among agents cooperating in small
groups.
Extending now the definition of evolutionary success of i (ESi) also incorporating the
influence on economic performance of i through the productivity of others, i.e. the time
the other agents are recovering, gives: ESi = f(1− ti + γ∑
j 6=i 1− tj), with f ′ > 0. If f
can again be approximated by a linear function, the expected value of the evolutionary
pressure equals by approximation
E(ESi) = f(1− E(ti) + γn(1− E(tj)). (19)
Theorem 3 (Evolutionary Stable Equilibrium with Cooperation): If evolutionary
selection depends on individual and co-worker health (i.e., γ > 0), there is a value of γ
for which the evolutionary stable equilibrium equals the social optimum. If phigh and plow
are small, the value of γ for which this equality holds, is close to unity.
16
Proof: We need to show that for a certain value of γ the condition for an evolution-
ary stable equilibrium equals the first-order condition for a social optimum. Again, as in
(9), consider the situation in which in the social welfare function the frequency of k is
changed at the cost of k. The condition for an Evolutionary Stable Equilibrium equals:(1− (1− α)(1− pkk)
nπk(1− pkk)nπk
∏l 6=k,k(1− plk)
nπl
)(qkk − qkk)
+(1− (1− α)(1− pkk)
nπk(1− pkk)nπk
∏l 6=k,k(1− plk)
nπl
)(qkk − qkk)
+γ(pkk − pkk)(1− (1− α)(1− pkk)
(n−1)πk(1− pkk)(n−1)πk
∏l 6=k,k(1− plk)
(n−1)πl
)n∑
l πlqlk
+γ(pkk − pkk)(1− (1− α)(1− pkk)
(n−1)πk(1− pkk)(n−1)πk
∏l 6=k,k(1− plk)
(n−1)πl
)n∑
l πlqlk = 0.
(20)
The first-order condition for a social optimum equals:(1− (1− α)(1− pkk)
nπk(1− pkk)nπk
∏l 6=k,k(1− plk)
nπl
)(qkk − qkk)
+(1− (1− α)(1− pkk)
nπk(1− pkk)nπk
∏l 6=k,k(1− plk)
nπl
)(qkk − qkk)
+γ(log(1− pkk)− log(1− pkk))(1− (1− α)(1− pkk)
(n−1)πk(1− pkk)(n−1)πk
∏l 6=k,k(1− plk)
(n−1)πl
)n∑
l πlqlk
+γ(log(1− pkk)− log(1− pkk))(1− (1− α)(1− pkk)
(n−1)πk(1− pkk)(n−1)πk
∏l 6=k,k(1− plk)
(n−1)πl
)n∑
l πlqlk = 0.
(21)
In the symmetric case these conditions are equal if
γ =(1− plow)πAk(1− phigh)
πk
phigh − plow
(log(1− phigh)− log(1− plow)). (22)
Suppose now that plow = λphigh. Then
limphigh→0
(1− plow)πk(1− phigh)πk
phigh − plow
(log(1− phigh)− log(1− plow)) = 1. (23)
QED
The core message of Theorems (1-3) is that if the social optimum differs from the
frequency distribution of MHC molecules that results from individual selection, the evo-
lutionary stable equilibrium gets closer to the social optimum when γ − the degree to
which evolutionary success of one agent depends on the health of the other n agents −increases. Figure IVa provides the frequency distribution in an evolutionary stable equi-
librium for different values of γ when m = 2. When γ = 0 the distribution is 1/2,1/2.
When γ rises, the distribution changes gradually to 0,1 (or 1,0), i.e., the social optimum.
Figure IVb illustrates the results for the model with three types of MHC molecules.
The simulation results replicate the typical patterns in the frequency distribution of HLA-
A and HLA-B shown in Figure II in Section 2. In equilibrium the frequencies of MHC
17

molecules is not uniform, but each molecule has a different frequency. Furthermore, with
decreasing levels of diversity (i.e., when γ → 1) one allele becomes more dominant and the
frequency of others decreases, a feature observed in the distribution of HLA molecules.
Taken together, the model shows that under certain circumstances the health status
of a population is better off with low levels of MHC diversity, whereas individual selection
processes tend to increase diversity. In more cooperative populations, evolutionary pres-
sure shifts the immune system from the selfish one with high levels of diversity to the more
efficient social optimum with lower levels of MHC diversity. Consequently, the level of
MHC diversity mirrors a population’s level of cooperative behavior. This finding explains
the typical non-uniform pattern in HLA-A and HLA-B frequencies observed in Figures II
and III. Moreover, the model puts forward three other predictions. First, if there is indeed
a discrepancy between the social optimum and the selfish equilibrium, low levels of MHC
diversity in a population should be associated with better health outcomes. Second, if
such differences between countries reflect differences in the way people cooperate, MHC
diversity should be negatively related to indicators of cooperative behavior. Finally, this
mechanism only works if cooperative behavior has a higher output relative to carrying
out solo projects. Hence, economic performance should correlate negatively with MHC
diversity.
3.4 The Pace of Change of the Evolutionary Process
A crucial requirement for a satisfactory explanation of a relationship between economic
outcomes and genetic evolution is a short time scale of the evolutionary adjustment. To
analyze the pace of adjustment we simulate the model for a certain value of γ until the
frequency distribution converges, and then change γ. Table I shows what happens in
a case with four different MHC molecules, for which we increase the value of γ such
that the equilibrium diversity shifts from 0.700 to 0.600. Column (1) and (2) illustrate
the equilibrium frequency distributions for both situations. In an equilibrium every MHC
molecule has the same fitness, i.e. two agents with different MHC molecules must have the
same expected number of children. When changing γ when the system is in equilibrium,
the fitness of each molecule changes. Column (4) provides the fitness of each MHC
molecule immediately after the shift in γ. Since γ increases, the fitness of relatively
frequent (rare) molecules increases (decreases). At present there is no evidence about
the actual size of fitness differentials and we calibrated the simulation to obtain a 1.050
fitness parameter for the most successful allele. This seems a conservative estimate since it
implies that people with molecule MHC-1 have a five percent higher effective fertility rate
than the average level of reproduction in this population. This is a very small difference
in terms of actual offspring, which would most likely not be observed in reality for a
18

reasonably long period of time. Under these assumptions it takes seven generations to
bridge the half-life of the difference in diversity between the old and new situation. If
people get offspring at the age of 20, this equals a time-span of 140 years.
The numbers in Table I illustrate why the pace of this evolutionary change is relatively
high. In Column (3) we provide information about the frequency differences between
both equilibria. Adding all increases or all decreases shows that only 17.62 percent of the
population has to “change genes” to obtain the new equilibrium. Furthermore, the genes
that need to increase in frequency are already present in the population and need not be
developed. An increase of five percent in population size, increases the fraction of the
population expressing molecule MHC-1 with 0.050 ∗ 35.980 = 1.799 percentage points in
the next generation.
To address the robustness of this process we carried out several simulations, including
different parameter values. Generally, we find that four to ten generations suffice to reduce
half of the gap between the actual MHC diversity in the population and the evolutionary
stable equilibrium. This makes us confident that our measure of human evolution is able
to change with changes in economic circumstances.
4 Empirical Results
4.1 Cooperative Behavior and the MHC
Cooperative behavior leads to higher levels of mutual dependence, which results in agents
being more dependent on the health of agents they cooperate with. Consequently, the
health of others will be “internalized” in the evolution of the individual agent’s immune
system and MHC diversity will be lower in an evolutionary stable equilibrium. To establish
a correlation between levels of cooperative behavior and MHC diversity, we collected
information from a number of experimental studies on offer rates in ultimatum games and
the amounts of money sent in trust games, see Appendix A.IV.25 Most studies include
various forms of games, but also report results from a “standard” experiment. These are
the data we are interested in for the collection of information across countries. Offer rates
in ultimatum games and the money sent in trust games incorporate the agents’ view on
fairness and trust, which are crucial ingredients in shaping cooperation (e.g., Fehr and
Schmidt [1999]), so we expect a negative correlation between these experimental variables
and MHC diversity.
A main finding in ultimatum games is that proposers offer more than backward in-
duction implies. This behavior is interpreted as a taste for fairness and the anticipation
25To collect these studies we have benefitted from the web pages of Alvin Roth and Charles Holt as well as from themeta-analysis carried out by Oosterbeek et al. [2004] in case of ultimatum games.
19

that low offers are likely to be rejected. We restrict our sample to offer rates of standard
ultimatum games, which come in two forms. The most common form is that a player
offers the division of an amount of money to another player, which is either accepted or
rejected. If accepted the money will be split, if not both players receive nothing. The
other form is one in which the responder has to clarify beforehand which split will be
acceptable.26 We include a dummy variable in the regression analysis to control for these
two types of set ups. Another difference when comparing games is the variety of stakes.
We only use studies in which real money is at stake and include the stake in US dollars
relative to GDP per capita in the regression equation.27 Next, there is an issue of learning
in repeating experiments. That is why we only use the offer rates from the first round in
case of multiple rounds and add a dummy variable to make sure these experiments are
not different in other dimensions.28 Finally, it is debated whether it matters if ultimatum
games are played by students or not. To deal with this issue we include a dummy variable
for students in the regression equation. The number of countries for which MHC diversity
and ultimatum game offer rates are available equals 23; see Table A.II in the Appendix
for a listing of these studies.
In trust games an investor and a trustee receive an initial amount of money. The
investor can transfer between zero and one hundred percent of this money to the trustee,
money which is tripled by the experimenter. After the trustee has been informed about
the transfer, the trustee has the option of sending any amount between zero and the
total sum of money available back to the investor. The investor’s outcome equals the
initial endowment, minus the investment, plus the back transfer from the trustee. The
trustee’s payoff equals the initial endowment, plus the tripled transfer from the investor,
minus the back transfer to the investor. The trust between the investor and trustee is
usually measured by the amount of money sent from the investor to the trustee because
the investor faces a dilemma. If he correctly trusts the investor he increases his payoff,
but if his trust is abused he is worse off. Generally, investors are shown to be averse to
such risks.29 In addition, there are likely to be differences in the outcomes of trust games
across social groups and populations.30 We have been able to collect information from 21
countries; see Table A.III in the Appendix for a listing of these studies. The amount of
money sent has been recoded into shares, with higher shares indicating higher amounts
of money that have been sent from the investor to the trustee. The mean (standard
26This latter type of game is typically used to collect a player’s complete strategy instead of a conditional strategy. Guthand Tietz [1990] argue that both games are likely to yield different offer rates because the game in which players have toreveal their strategy is likely to strengthen fairness.
27Slomin and Roth [1998] find that differences in stakes only affect the rejection rate, not the offer rate. Higher stakesyield lower rejection rates. Nevertheless, we take stakes into account to make sure our results are not influenced by differencesin stakes.
28Roth and Erev [1995] show that the offer rates go down when the proposer gains experience.29See e.g., Fehr and Schmidt [1999] and Holt and Laury [2002].30See e.g., Berg et al. [1995], Bohnet and Zeckhauser [2004] and Hong and Bohnet [2004].
20
deviation) share equals 54.224 (11.660), which implies that investors sent about 55 percent
of their endowment to the trustee. In two of the trust games the money that was sent was
doubled, instead of tripled. We include a dummy variable to control for this distinction
between games. In nine games only the investor has been given an initial endowment.
Again we include a dummy variable to control for this feature. Finally, we also include
the stakes and a dummy for whether the subjects are students.
Panels A and B in Figure V present the correlation between HLA-A and HLA-B
diversity and the offer rates in ultimatum games in 23 countries. The relationship indicates
a negative correlation, which is confirmed by the estimates presented in columns (1) and
(3) of Table II. Panels C and D present the same correlations for the amount of money sent
in trust games and MHC diversity. The estimates in columns (6) and (8) of Table II show
that the correlation is also negative but less strong for HLA-B diversity in our sample of 21
countries. In the other columns of Table II we add the above mentioned control variables
to the regression analysis, but the conclusions remain similar. The measure of MHC
diversity includes most likely some measurement error, which could bias its estimates
towards zero. To deal with measurement error in MHC diversity we instrument HLA-A
diversity with HLA-B diversity (the correlation coefficient between HLA-A and HLA-B
diversity is significant and equals 0.508). The estimates are presented in columns (5) and
(10) in Table II. The correlation between the offer rate and HLA-A diversity becomes
stronger, but the correlation with the amount of money sent in trust games does not
improve.
Overall these correlations suggest that populations offering higher rates in ultimatum
games and sending higher amounts of money in trust games are characterized by lower
levels of MHC diversity. These results confirm that measures of cooperative behavior in
a population, based on experimental approaches, are correlated with MHC diversity.
4.2 Health Outcomes
A second implication of our model is that a discrepancy between the individual stable
evolutionary equilibrium and the social optimum, should be associated with a correlation
between MHC diversity and health outcomes. Regarding the central role of class I MHC
molecules in the control of viral infections, there should especially be a lower incidence
of viral infections in populations with low MHC diversity. To assess the relationship
between health outcomes and MHC diversity we use information about life expectancy
to evaluate the effect of MHC diversity on health outcomes in general. The number of
deaths caused by viral infections as a fraction of the total population is used as a more
detailed proxy for health outcomes. Life expectancy at birth is taken from the 2002 World
21

Development Indicators, and refers to the situation in 1990.31 Information on mortality
as a result of viral infections is taken from the 2000 Mortality Database of the World
Health Organization.
Figure VI presents the relationship between health outcomes and MHC diversity by
showing a negative and statistically significant correlation between life expectancy at birth
in 1990 and HLA-A and HLA-B diversity for the sample of 63 countries. The horizontal
axis measures HLA-A diversity and the vertical axis life expectancy at birth in 1990.
The correlation between HLA-A (HLA-B) diversity and life expectancy at birth is −0.265
(−0.228) and significant at the five percent level. The bottom panel presents a positive
correlation between viral infections and HLA-A and HLA-B diversity for a sub-sample of
47 countries for which information on viral infections is available. The correlation between
HLA-A (HLA-B) diversity and viral infections is 0.445 (0.403) and significant at the five
percent level.
Since lower MHC diversity mirrors mutual dependence and will be associated with
higher levels of economic performance, this correlation is likely to include both the direct
effect of a better immune response and the indirect effect of MHC diversity on life ex-
pectancy working through income. Effective treatment and preventive measures are likely
to increase life expectancy. Furthermore, a more advanced health system could change
the observed level of MHC diversity because the threat of pathogens will diminish. We
control for differences in health systems and include the log of health expenditures per
capita in constant 1990 US$ in 1995. In addition, we average two measures of child im-
munization to capture vaccination coverage of children under one year of age: (i) child
immunization against diphtheria, pertussis (or whooping cough), and tetanus (DPT) after
receiving three doses of vaccine; and (ii) child immunization against measles after receiv-
ing one dose of vaccine. Pathogen pressure is known to be different in various parts of the
world, and to be relatively high close to the equator because the incidence of infections
as well as outbreaks of new infections in single areas is higher. Since a higher level of
pathogen pressure in an environment will lead to more diseases, it could induce a higher
equilibrium level of MHC diversity in a population. Since such a relationship between
pathogen pressure and MHC diversity could bias our estimates we use several proxies as
a control for pathogen pressure. From Hall and Jones [1999] we use absolute latitude to
capture the effect of populations residing close to the equator having a higher prevalence
and incidence of infectious diseases. From Gallup et al. [2001] we add the following in-
formation into one variable: (i) the fraction of tropical area of a country, (ii) the fraction
of the population living in tropical areas, and (iii) the tropical climate zone which is an
indicator measuring the extent to which a country is regarded tropical. The variable used
31For 1990 the number of populations for which life expectancy is available is the largest. Using life expectancy at birthin 1995 or 2000 yields similar estimates but lacks information about a number of developing countries.
22

in the regression equation measures the standardized averages of the three indicators.
Table III provides the main results for using life expectancy at birth as the dependent
variable. Column (1) shows the OLS relationship between HLA-A diversity and life
expectancy at birth in 1990 by estimating the following model:
LEc1990 = C + α1MHCc + α2PPc + α3LAc + α4HEc + α5IMMc + α6OECDc + εc, (24)
where LEc1990 is life expectancy at birth in country c in 1990. The main variable of
interest is MHCc, the level of HLA-A or HLA-B diversity in country c; εc is an error
term with the usual properties, capturing all omitted factors. PPc measures the degree of
tropical features in country c and LAc is absolute latitude, which together should capture
the effect of different circumstances with regard to pathogen pressure. HEc is the log of
health expenditures per capita in 1995 and IMMc is country c’s average immunization
rate against DPT and measles, which together form the set of variables capturing possible
differences in the country’s level of health advancement.
Column (1) shows a statistically significant correlation between the level of HLA-A
diversity and life expectancy at birth. The estimate suggests that a one-standard deviation
(i.e., 0.035) increase in MHC diversity reduces equilibrium life expectancy by 0.184 years,
which yields a reduction of life expectancy at birth of 0.521 years when MHC diversity is
increased by 10 percentage points. These seem to be estimates of reasonable magnitude
relative to the mean (standard deviation) of life expectancy at birth in 1990 in the sample,
which is 69.201 (7.691) years. Column (2) presents comparable results when using HLA-B
diversity.
Next, we add the log of GDP per capita in 1960 to the equation (GDPc1960). The
argument for including this covariate is that higher levels of income might have a direct
effect on life expectancy at birth because people are able to acquire, for example, better
food and housing. The estimates for α1 reported in columns (3) and (4) do not look
different from the previous ones. Actually, the estimates on α1 are even slightly higher.
The coefficient on GDP per capita in 1960 is statistically significant, which suggests some
direct causal effect of income on life expectancy.32 The estimates suggest that the effects
of income on life expectancy go through more economic fortunes and higher levels of
mutual dependence, captured by MHC diversity.
The 2SLS estimates, using HLA-B diversity as an instrument for HLA-A diversity,
are reported in Columns (5) and (6) of Table III. The estimates suggest that taking care
of the measurement error increases the estimated coefficients for α1 considerably. The
coefficients suggest that a one-standard deviation increase in MHC diversity reduces life
expectancy at birth by 0.205 and 0.438 years, respectively. We have experimented with a
32Note that Cuba does not report information on income variables, so the sample is reduced to 62 countries.
23

host of different specifications and included different regional indicators into the regression
equations, but the results remain similar.
Because of the specific role of MHC type I molecules, our model predicts that MHC
diversity is especially related to differences in health status related to viral infections.33
Table IV provides the main results for using V Ic, the fraction of the population that
has died from viral infections (multiplied by 1,000), as the dependent variable. Column
(1) and (2) show the OLS relationship between MHC diversity and viral infections by
estimating the same models as for life expectancy. The estimate for α1 recovers the
positive relationship between HLA-A (HLA-B) diversity and the fraction of the population
that has died from viral infections and suggests that a one-standard deviation increase
in HLA-A (HLA-B) diversity increases mortality by 4.93 (4.44) percent. Columns (3)
and (4) reports the estimates for α1 by adding GDPc1960 . Finally, the 2SLS estimates
in columns (5) and (6) suggest a robust positive correlation between MHC diversity and
viral infections.
These estimates suggest that higher levels of MHC class I diversity are correlated with
lower life expectancy and a higher incidence of people dying from viral infections. Our
proxies for health outcomes are related to mortality, while in the model the fact that
diseases prevent agents from working, already generates the results. Ideally we would
want to measure the average days of absence from work due to diseases for our sample
of countries, but such data are not available for a large set of countries. Finally, from
the perspective of our theory, the estimates imply that there is a discrepancy between
the individual evolutionary equilibrium and the social optimum. These conclusions re-
main when we control for observed differences in pathogen pressure and differences in
advancement of health systems and economic fortunes between the populations in the
sample.
4.3 Economic Performance
A final empirical relationship we want to establish is one between economic outcomes and
MHC diversity. Ultimately, the basic idea of the public goods game is that it increases
output and mutual dependence. As a consequence, societies that are better able to cope
with public good dilemmas by means of altruism, social norms or punishment, will be
33The data are taken from the 2000 WHO Mortality Database or the most recent year if 2000 is unavailable. TheAppendix provides more details about the definition of infectious diseases from this data source. Gallup et al. [2001]provide information for the incidence of single (infectious) diseases. We do not use this information since we would aim tocapture the effects of overall pathogen pressure and not the incidence of individual diseases. Information about infectiousdiseases is available for 47 populations only. We do not have information for the following countries: Botswana, Cape Verde,China, the Democratic Republic of Congo, India, Indonesia, Kenya, the Federal Republic of Macedonia, Morocco, Oman,Pakistan, Senegal, Turkey, Uganda, Vietnam, and Zambia. We do not include HIV infections because a number of countrieshave extreme high AIDS death rates while other countries do not report these numbers for political and socioeconomicreasons. In addition, differences in the availability of medication and ways which governments deal with the HIV epidemiccapture effects we do not want to take into account in the empirical analysis.
24

more successful in economic terms and at the same time produce a higher degree of
mutual dependence. This level of mutual dependency is mirrored by the level of MHC
diversity in a population. Figure VII shows a significant negative correlation between
HLA-A and HLA-B diversity and per capital economic growth in the period 1960-2000 of
−0.437 and −0.321, respectively.
Column (1) in the first panel of Table V reports OLS estimates of the following model:
∆GDPc1960−2000 = C + α1GDPc1960 + α2HLA− Ac + α3OECDc + εc, (25)
where ∆GDPc1960−2000 is defined as the log difference between GDP per capita in 2000 and
1960, and GDPc1960 as the log of GDP per capita in 1960. The coefficient of interest is
the one on α2. The estimate of α2 illustrates a strong and negative correlation between
HLA-A diversity and economic growth over this forty year period, which is significant at
the one percent level. Estimates for HLA-B diversity show similar results for all estimates
shown in this section but are suppressed to preserve space. In subsequent columns we
replace ∆GDPc1960−2000 by more recent changes in GDP per capita. Column (2) reports
the estimates for the period 1970-2000 and Column (3) for the period 1980-2000. Finally,
Columns (4)-(6) present the 2SLS estimates, where we use HLA-B as an instrument for
HLA-A diversity. All estimates are statistically significant.
There might be some concern about regional correlation, since the Asian countries
seem to have grown fast and reveal a relatively low level of HLA-A diversity. In addition,
the African countries are generally poor and have been behind in terms of growth as well.
At first site, they seem to reveal relatively high levels of MHC diversity. To control for
these possible continental differences, we present two sets of estimates in Columns (7)-(10).
One set of OLS and 2SLS estimates for the 1960-2000 period excluding Asia and another
set excluding the African countries. The estimates for α2 remain statistically significant
in all these four specifications. In addition, estimating the model using continent dummy
variables instead of OECDc, or excluding certain regions from the regression analysis,
does not alter the conclusions.
Column (1) of Table VI reports the OLS estimation results of estimating the following
model:
∆GDPc1960−2000 = C + α1GDPc1960 + α2HLA− Ac + α3PPc + α4LAc
+α5HEc + α6IMMI + α7FRc + α8OECDcεc.(26)
We added the covariats HEc, IMMc, PPc and LAc because differences in health systems
and pathogen pressure could potentially have an impact on α2. In addition, fractional-
ization (FRc) could potentially have an impact as well (e.g., Alesina et al. [2003]). The
estimate (standard error) for α2 is equal to −5.192(1.749) and significant at the one per-
cent level. Column (2) reports the 2SLS estimate of the same equation. The estimate
25

for α2 equals −8.270(3.633) and is significant at the five percent level. Finally, we have
applied a different measure of economic performance. Using the 2000 log level of GDP
per capita yields a similar negative relationship with MHC diversity, as is illustrated in
Column (3) of Table VI. Estimating the model using continental dummies instead of an
OECD dummy yields similar results.34
The body of literature explaining cross-country differences in economic outcomes sug-
gests a number of additional variables explaining economic growth. We have included the
most often used covariates in a growth regression. In particular we estimate the following
equation
∆GDPc1960−2000 = C + α0GDPc1960 + α1HLA− Ac + α2HCc+
α3LEc1990 + α4OECDc + α5HEc + α6IMMc + α7PPc+
α8LAc + α9FRc + α10OTHc + εc,
(27)
where OTHc is either country c’s trade with others, M2/GDP, growth of the labor force,
fertility, the investment rate, or gross enrolment in primary and secondary education.
Trade is defined as the log difference of imports and exports in 1995 and 1960; M2/GDP
is a financial variable suggested by King and Levine [1993] to capture primary financial
development measured in 1995; growth of the labor force is defined as the log difference
between the population aged 16-65 in 2000 and 1960; fertility is the fertility rate in 1990;
investment rate is the price level of investment goods in 1960; and education is measured
using Barro’s measure of the proportion of eligible students enrolled in secondary and
primary education in 1960 (e.g., Barro [1991]).
The results are shown in Table VII where each of the columns reports the inclusion of
one of the covariates captured by OTHc. The estimate for α1 turns out to be relatively
insensitive to the inclusion of these covariates and remains statistically significant in all
specifications reported.
5 Alternative Explanations
5.1 Different Disease Environments
Potential alternative ways to explain the empirical link between MHC diversity and eco-
nomic performance could be based on differences in disease environments that affect both
the immune system and economic performance. One could think of the distinction between
cities and villages or differences in climate, which affect the survival rate of pathogens.
34Reducing the sample by excluding negatively growing countries, such as Zambia, Congo, Venezuela and Senegal,excluding the high growth countries, such as Singapore, Korea, and Oman, or by excluding the Asian or African countriesdoes not change the main conclusion drawn from Table VI.
26

Regarding the distinction between cities and villages, more people live close to each
other in cities, increasing the probability of infections. Since it is known that cities cause
economic growth, the empirical link between economic performance and MHC diversity
could be explained if evolutionary forces would reduce MHC diversity in cities. The model
shows that with selfish agents pathogen pressure will increase diversity and it is hard to see
how urban circumstances could affect this evolutionary equilibrium. Furthermore, in the
data we find no correlation between MHC diversity and degree of urbanization at different
points in time, while the argument would also require a higher degree of cooperation in
cities.35
The other way around one could argue that in certain areas a warmer and more humid
climate creates an environment that is more favorable to pathogens. For that reason,
populations living in such an area will be more vulnerable to infections, and consequently
be less productive. It is hard to underpin this alternative explanation theoretically, as it
requires an argument that the evolutionary equilibrium of HLA molecules is more diverse
in environments with a higher pathogen pressure, while models that stress the importance
of diversity will predict maximum diversity in all populations. Also the empirical evidence
is not consistent with this explanation, since the link between MHC diversity and economic
outcomes is not affected by the inclusion of variables reflecting the health status of the
population. This suggests that the link between MHC diversity and economic outcomes
is a direct one and not moderated by health outcomes.
5.2 Benefits of Diversity and “Group Selection”
The theoretical prediction and empirical observation that − from a social perspective −a lower level of MHC diversity is beneficial may strike the reader as a counter-intuitive
result. The most likely reason is a general intuitive notion that diversity in general, and
especially genetic diversity, is advantageous. It is important to notice that our finding
about the social planner’s desire to establish a lower level of MHC diversity is related to
the specific properties of the immune system and the role of the MHC in the adaptive
part of the immune system. In economic life their are many examples in which either
diversity or similarity is the preferred equilibrium outcome. The gains from the division
of labor reveal (comparative) advantages of different abilities to perform specific tasks,
but a population speaking the same language has economic gains as well.
The equilibrium in our model and the estimates emphasizing the societal benefits of
lower MHC diversity are consistent with the observation that in immunization programs
the individual risk of being hurt by these programs is larger than the individual benefits
of protection. At the same time, the social benefits of vaccination are much larger than
35We addressed this issue by investigating urbanization from 1960 to 2000, but also by using population density figures(corrected for the amount of arable land) back to 1500.
27
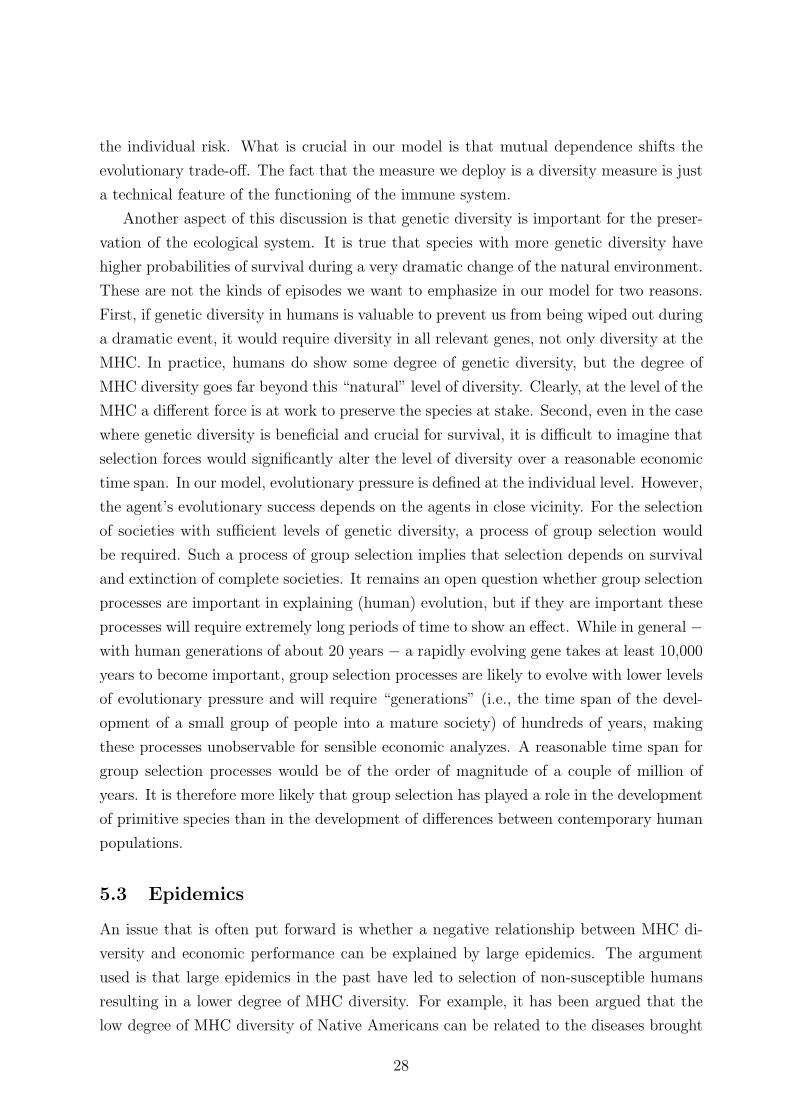
the individual risk. What is crucial in our model is that mutual dependence shifts the
evolutionary trade-off. The fact that the measure we deploy is a diversity measure is just
a technical feature of the functioning of the immune system.
Another aspect of this discussion is that genetic diversity is important for the preser-
vation of the ecological system. It is true that species with more genetic diversity have
higher probabilities of survival during a very dramatic change of the natural environment.
These are not the kinds of episodes we want to emphasize in our model for two reasons.
First, if genetic diversity in humans is valuable to prevent us from being wiped out during
a dramatic event, it would require diversity in all relevant genes, not only diversity at the
MHC. In practice, humans do show some degree of genetic diversity, but the degree of
MHC diversity goes far beyond this “natural” level of diversity. Clearly, at the level of the
MHC a different force is at work to preserve the species at stake. Second, even in the case
where genetic diversity is beneficial and crucial for survival, it is difficult to imagine that
selection forces would significantly alter the level of diversity over a reasonable economic
time span. In our model, evolutionary pressure is defined at the individual level. However,
the agent’s evolutionary success depends on the agents in close vicinity. For the selection
of societies with sufficient levels of genetic diversity, a process of group selection would
be required. Such a process of group selection implies that selection depends on survival
and extinction of complete societies. It remains an open question whether group selection
processes are important in explaining (human) evolution, but if they are important these
processes will require extremely long periods of time to show an effect. While in general −with human generations of about 20 years − a rapidly evolving gene takes at least 10,000
years to become important, group selection processes are likely to evolve with lower levels
of evolutionary pressure and will require “generations” (i.e., the time span of the devel-
opment of a small group of people into a mature society) of hundreds of years, making
these processes unobservable for sensible economic analyzes. A reasonable time span for
group selection processes would be of the order of magnitude of a couple of million of
years. It is therefore more likely that group selection has played a role in the development
of primitive species than in the development of differences between contemporary human
populations.
5.3 Epidemics
An issue that is often put forward is whether a negative relationship between MHC di-
versity and economic performance can be explained by large epidemics. The argument
used is that large epidemics in the past have led to selection of non-susceptible humans
resulting in a lower degree of MHC diversity. For example, it has been argued that the
low degree of MHC diversity of Native Americans can be related to the diseases brought
28

to America by white European immigrants. If epidemic infectious diseases have a direct
negative impact on the economic performance of a population, the expected effect would
be a positive correlation between MHC diversity and economic performance. If epidemic
diseases result in selection, economic performance might improve since the fraction of
strong people will increase. However, there is no empirical evidence that populations
that suffered large losses in the past due to epidemics are the ones with a higher level of
economic performance. In case of a pandemic infectious disease a particular allele should
have become dominant in all populations. This is not the case.
5.4 Migration
Different populations tend to consist of people with dissimilar forefathers. When a country
faces an inflow of many immigrants from countries with different alleles, the degree of
MHC diversity in this country will rise. In that case MHC diversity is a reflection of group
heterogeneity. A negative relationship between MHC diversity and economic performance
would be found if economic performance benefits from homogeneity. The most interesting
country to investigate from this perspective is the United States because it has experienced
the most dramatic inflow of people from different European countries. The most obvious
comparison is between the white U.S. population and people from Western European
countries, such as England, France and Italy. Since the ancestors of U.S. whites are from
these countries, the MHC frequencies in the United States should reflect these diverse
origins, and MHC diversity in the United States should substantially exceed diversity
in these European populations. However, the reverse turns out to be the case: HLA-
A diversity among the white U.S. population is equal to 0.855, whereas it is equal to
0.893 in France, 0.874 in Italy, and 0.875 in the United Kingdom, which are significant
differences given the 0.035 standard deviation of HLA-A diversity. A similar argument
applies to HLA-A diversity in Australia, which equals 0.838.36 This observation about
diversity in the United States and Australia is consistent with our simulation results that
the frequency dependent nature of MHC diversity makes the diversity change relatively
fast.
6 Conclusions and Future Research
In this paper we have shown that there exists an empirical link between economic circum-
stances and genetic evolution. We have argued that properties of the MHC turn out to be
valid for analyzing such a link. Based on an evolutionary theory of the main properties of
36The levels of HLA-B diversity in the United States and Australia are comparable to the levels for the continentalEuropean countries.
29

the adaptive immune system, we predict that low levels of MHC diversity minimize the
incidence of infectious diseases in a population, while the evolutionary equilibrium with
selfish agents leads to maximum levels of diversity. Assuming that populations differ in
their degree of cooperation, three important predictions have been made. First, if there
exists a discrepancy between the social optimum and the selfish equilibrium, lower levels
of MHC diversity in a population should be associated with better health outcomes. Sec-
ond, if differences in MHC diversity between countries reflect differences in the way people
cooperate, MHC diversity should be negatively related to indicators of fairness and trust
behavior. Finally, this mechanism only works if cooperative behavior has a higher output
relative to carrying out individual projects, so economic performance should correlate
negatively with MHC diversity. The model is able to replicate the crucial properties of
the observed MHC distribution and based on data of MHC frequencies in 63 populations
we find a significant negative correlation between health outcomes and MHC diversity,
and between MHC diversity and indicators of fairness and trust collected from several ex-
periments carried out for different countries. Finally, we find a robust negative correlation
between MHC diversity and several measures of economic performance.
The findings presented in this paper are of general interest for the following reasons.
In biology the role of HLA has been analyzed at the individual human level in relation
to sexual selection and the progression of diseases. The main consensus seems to be that
people with rare MHC alleles are better protected against diseases because rare MHC
molecules complement the protection already provided by the MHC molecules of others.
Furthermore, rare MHC molecules seem to be an individually optimal answer to the dan-
ger of host pathogen co-evolution. We have shown that taking into account economic
externalities implies that the equilibrium level of MHC diversity runs counter to poly-
morphism and promotes homogeneity. This is important because it offers an explanation
for the observed non-uniform frequencies of HLA alleles within populations, which has to
date been unexplained by biologists. In anthropology, researchers have focused on HLA
polymorphism to explain linguistic and cultural similarities and disparities between pop-
ulations. We have added to this that economic conditions are likely to lead to relatively
rapid changes in the frequency distribution of the HLA and its degree of population di-
versity. From the viewpoint of behavioral ecology and behavioral economics (which have
focused on the issue of human cooperation by means of communication, monitoring and
enforcement of norms) we add that differences in experimental outcomes on trust and
cooperation reflect long-term structural differences between populations. Finally, we add
to the economics discipline that differences in (long-term) economic performance are at
least to some extent structural and related to differences in cooperative behavior.
There are several avenues for future research. First, investigating the human immune
system from the perspective of differences between individual and social benefits might
30

shed light on the biological question why the level of diversity of HLA-A is generally
lower than the level of diversity of HLA-B and why HLA diversity between populations
is associated with the existence of one dominant type which differs between different
populations. One possible reason could be that the types of diseases HLA-A is protecting
against are related to larger externalities than the ones HLA-B is taking care of. Relating
the existence of infectious diseases, e.g. the several mutants of HIV, to HLA diversity
would be an obvious avenue to proceed.37 Second, we have used genetic information
for the dominant groups in a country. Comparison of levels of HLA diversity within and
between different populations living in the same country or region could reveal information
about the level of human cooperation within and between different groups in a society,
which could for example complement the study of Henrich et al. [2001] in explaining
differences in cooperation. Third, MHC diversity in animals is related to sexual selection
and disassortive mating (Reusch et al. [2001]). From economic studies concerning sexual
selection we know that economic circumstances such as income inequality affect the sexual
selection process significantly (Fernandez and Rogerson [2001]). An interesting question
to explore is whether or not these external influences also affect MHC polymorphism and
a population’s long-term health status.
Appendix
A.I. MHC Data Sources
In 1991, the organizers of the Eleventh International Histocompatibility Workshop andConference asked participating laboratories from countries all over the world to collectblood samples from representative samples of populations. Each laboratory received a setof sera to type the various HLA antigens.38 Juji et al. [1992] provide detailed informationabout the sera used, the distribution of the sera to the laboratories, and the proceduresfor testing blood samples. In this way unique and consistent information about allelefrequencies of many ethnic groups has been brought together and carefully documented.We have selected individuals from 72 populations that could potentially be matched tocountries based on blood samples of 10,394 persons. The major advantage of this un-dertaking is that we are able to use data about HLA types of a representative group of(healthy) people in each population, collected using identical typing procedures. To thebest of our knowledge there are three alternative sources of HLA frequencies for differenthuman populations. First, Cavalli-Sforza et al. [1994] provide tables for HLA-A andHLA-B frequencies. The main limitation of these data is that only frequencies of allelesfound consistently in all populations in the world are reported, because these have been
37Trachtenberg et al. [2003] and Scherer et al. [2004] − analyzing the association of HLA super-types with HIV diseaseprogression rates in a population of HIV-infected men − have suggested that HIV adapts to the most frequent alleles ina population, providing a selective advantage for those who express rare alleles. Kalinkovich et al. [1998] analyze theactivation of particular T cells in recent Ethiopian immigrants in Israel relative to earlier immigrants and find a process ofadaptation within humans.
38Because reliability of the sera was regarded crucial for this project, a couple of WHO approved antigens could not beidentified by this procedure.
31
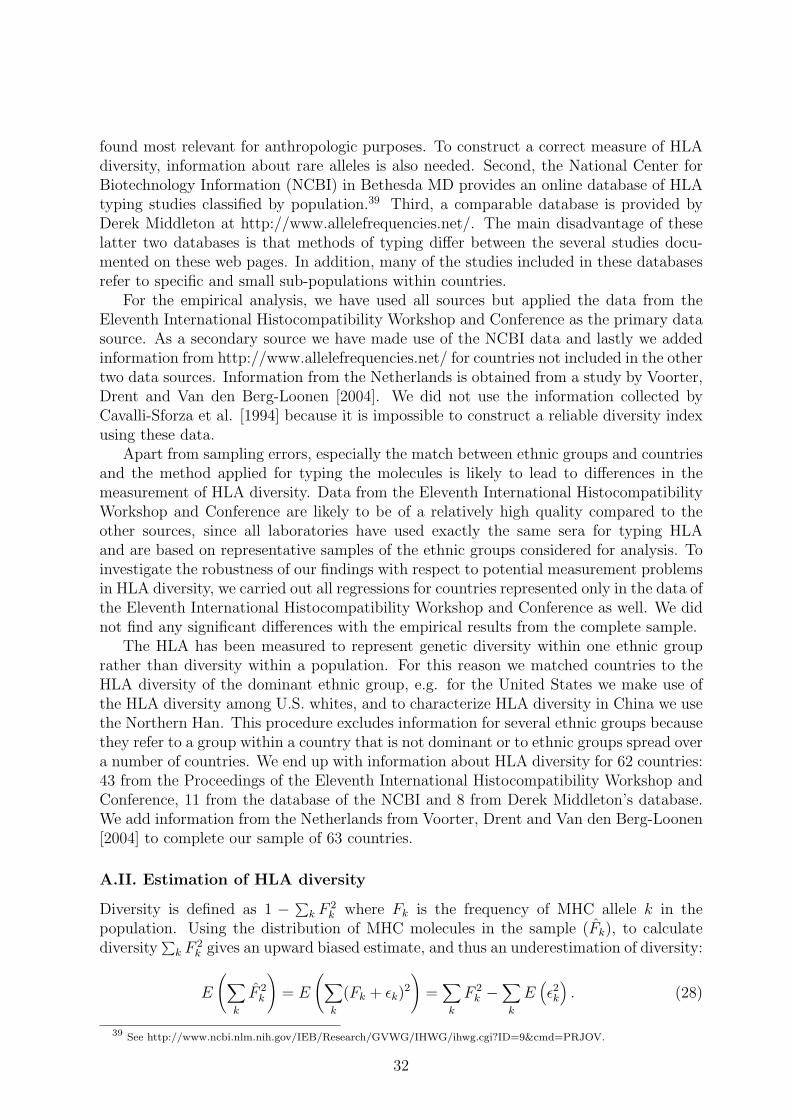
found most relevant for anthropologic purposes. To construct a correct measure of HLAdiversity, information about rare alleles is also needed. Second, the National Center forBiotechnology Information (NCBI) in Bethesda MD provides an online database of HLAtyping studies classified by population.39 Third, a comparable database is provided byDerek Middleton at http://www.allelefrequencies.net/. The main disadvantage of theselatter two databases is that methods of typing differ between the several studies docu-mented on these web pages. In addition, many of the studies included in these databasesrefer to specific and small sub-populations within countries.
For the empirical analysis, we have used all sources but applied the data from theEleventh International Histocompatibility Workshop and Conference as the primary datasource. As a secondary source we have made use of the NCBI data and lastly we addedinformation from http://www.allelefrequencies.net/ for countries not included in the othertwo data sources. Information from the Netherlands is obtained from a study by Voorter,Drent and Van den Berg-Loonen [2004]. We did not use the information collected byCavalli-Sforza et al. [1994] because it is impossible to construct a reliable diversity indexusing these data.
Apart from sampling errors, especially the match between ethnic groups and countriesand the method applied for typing the molecules is likely to lead to differences in themeasurement of HLA diversity. Data from the Eleventh International HistocompatibilityWorkshop and Conference are likely to be of a relatively high quality compared to theother sources, since all laboratories have used exactly the same sera for typing HLAand are based on representative samples of the ethnic groups considered for analysis. Toinvestigate the robustness of our findings with respect to potential measurement problemsin HLA diversity, we carried out all regressions for countries represented only in the data ofthe Eleventh International Histocompatibility Workshop and Conference as well. We didnot find any significant differences with the empirical results from the complete sample.
The HLA has been measured to represent genetic diversity within one ethnic grouprather than diversity within a population. For this reason we matched countries to theHLA diversity of the dominant ethnic group, e.g. for the United States we make use ofthe HLA diversity among U.S. whites, and to characterize HLA diversity in China we usethe Northern Han. This procedure excludes information for several ethnic groups becausethey refer to a group within a country that is not dominant or to ethnic groups spread overa number of countries. We end up with information about HLA diversity for 62 countries:43 from the Proceedings of the Eleventh International Histocompatibility Workshop andConference, 11 from the database of the NCBI and 8 from Derek Middleton’s database.We add information from the Netherlands from Voorter, Drent and Van den Berg-Loonen[2004] to complete our sample of 63 countries.
A.II. Estimation of HLA diversity
Diversity is defined as 1 − ∑k F 2
k where Fk is the frequency of MHC allele k in thepopulation. Using the distribution of MHC molecules in the sample (Fk), to calculatediversity
∑k F 2
k gives an upward biased estimate, and thus an underestimation of diversity:
E
(∑k
F 2k
)= E
(∑k
(Fk + εk)2
)=∑k
F 2k −
∑k
E(ε2k
). (28)
39 See http://www.ncbi.nlm.nih.gov/IEB/Research/GVWG/IHWG/ihwg.cgi?ID=9&cmd=PRJOV.
32
We approximate
E(ε2k
)=
Fk(1− Fk)
n(29)
with
Fk(1− Fk)
n(30)
and subtract this expected bias from the diversity in the sample to obtain an estimateof the diversity in the population. Simulation for distributions of HLA-A and HLA-Bmolecules similar to those observed in the data reveals that this procedure reduces thebias almost completely.
A.III. Data Definitions and Sources
Table AI presents an overview of the variables, the sources and definitions used in thepaper. Measures of MHC diversity are described and defined above.
A.IV. Information from the Games
Tables AII and AIII provide the studies we have used to construct the sample of offerrates in ultimatum games and the amounts of money sent in trust games.
References
Alesina, Alberto, Arnaud Devleeschauwer, William Easterly, Sergio Kurlat, and RomainWacziarg, “Fractionalization,” Journal of Economic Growth, VIII (2003), 155-194.
Aoki, Kenichi, “Time Required for Gene Frequency Change in a Deterministic Model ofGene Culture Coevolution, With Special Reference to the Lactose Absorption Problem,”Theoretical Population Biology, XL (1991), 354-368.
Barro, Robert J., “Economic Growth in a Cross-Section of Nations,” Quarterly Journalof Economics, CVI (1991), 407-443.
Berg, Joyce, John Dickhaut, and Kevin McCabe, “Trust, Reciprocity and Social History,”Games and Economic Behavior, X (1995), 122-142.
Bohnet, Iris, and Richard Zeckhauser, “Turst, Risk and Betrayal,” Journal of EconomicBehavior & Organization, LV (2004), 467-484.
Borghans, Jose A. M., Joost B. Beltman, and Rob J. de Boer, “MHC PolymorphismUnder Host-Pathogen Coevolution,” Immunogenetics, LV (2004), 732-739.
Camerer, Colin F., “Strategizing in the Brain,” Science, CCC (2003), 1673-1675.
33

Carrington, Mary, and Stephen J. O’Brien,“The Influence of HLA Genotype on AIDS,”Annual Review of Medicine, LIV (2003), 535-551.
Cavalli-Sforza, Luigi Luca, Paolo Menozzi, and Alberto Piazza, The History and Geogra-phy of Human Genes (Princeton University Press, Princeton NJ, 1994).
Charness, Gary, and Matthew Rabin, “Understanding Social Preferences with SimpleTests,” Quarterly Journal of Economics, CXVII (2002), 817-869.
de Boer, Rob J., Jose A.M. Borghans, Michiel van Boven, Can Kesmir, and Franz J.Weissing, “Heterozygote Advantage Fails to Explain the High Degree of Polymorphismof the MHC,” Immunogenetics, LV (2004), 725-731.
Dolan, Raymond J., “Emotion, Cognition, and Behavior,” Science, CCXCVIII (2002),1191-1194.
Durham, William H., Coevolution: Genes, Culture, and Human Diversity (Stanford Uni-versity Press, San Francisco CA, 1992).
Fehr, Ernst, and Urs Fischbacher, “The Nature of Human Altruism,” Nature, CDXXV(2003), 785-791.
Fehr, Ernst, and Klaus M. Schmidt, “A Theory of Fairness, Competition, and Coopera-tion,” Quarterly Journal of Economics, CXIV (1999), 817-868.
Fernandez, Raquel, and Richard D. Rogerson, “Sorting and Long-Run Inequality,” Quar-terly Journal of Economics, CXVI (2001), 1305-1341.
Gallup, John L., Mellinger, Andrew, and Sachs, Jeffrey D., “Geography Datasets,” Centerfor International Development, Harvard University, 2001.
Galor, Oded, and Omer Moav, “Natural Selection and the Evolution of Life Expectancy,”Working Paper Brown/Hebrew University, August 2004.
Gutz, Werner, and Reinhard Tietz, “Ultimatum Bargaining Behavior: A Survey andComparison of Experimental Results,” Journal of Economic Psychology, XI (1990), 417-449.
Hall, Robert E., and Charles I. Jones, “Why Do Some Countries Produce So Much MoreOutput per Worker than Others?” Quarterly Journal of Economics, CXIV (1999), 83-116.
Hansen, Ted H., and David H. Sachs, “The Major Histocompatibility Complex,” in:William E. Paul (ed.), Fundamental Immunology, Second Edition (Raven Press Ltd., NewYork NY, 1989), 445-487.
Henrich, Joseph, Robert Boyd, Samuel Bowles, Colin F. Camerer, Ernst Fehr, HerbertGintis, and Richard McElreath, “In Search of Homo Economicus: Behavioral Experiments
34

in 15 Small-Scale Societies,” American Economic Review, XCI (2001), 73-78.
Hewlett, Barry S., Annalisa De Silvestri, and C. Rosalba Guglielmino, “Semes and Genesin Africa,” Current Anthropology, XLIII (2002), 313-321.
Hill, Adrian V.S., Catherine E.M. Allsopp, Dominic Kwiatkowski, Nicholas M. Anstey,Patrick Twumasi, Pamela A. Rowe, Stephen Bennett, David Brewster, Andrew J. McMichael,and Brian M. Greenwood, “Common West African HLA Antigens Are Associated withProtection from Severe Malaria,” Nature, CCCLII (1991), 595-600.
Holt, Charles A. and Susan K. Laury, “Risk Aversion and Incentive Effects,” AmericanEconomic Review, XCII (2002), 1644-1655.
Hong, Kessely, and Iris Bohnet, “Status and Distrust: The Relevance of Inequality andBetrayal Aversion,” Working Paper, JFK School of Government, September 2004.
Juji, Takeo, Tatsuya Akaza, Katsushi Tokunaga, Hiromi Miyoshi, and Kouichi Kashiwase,“The Serology Studies of the Eleventh International Histocompatability Workshop: AnOverview,” in: Kimiyoshi Tsuji, Miki Aizawa, and Takehiko Sasazuki (eds.), Proceedingsof the Eleventh International Histocompatibility Workshop and Conference, (Oxford: Ox-ford University Press, 1992), 83-108.
Kalinkovich, A., Z. Weisman, Z. Greenberg, J. Nahmia, S. Eitan, M. Stein, and R. Ben-twich, “Decreased CD4 and Increased CD8 Counts with Cell Activation Is Associatedwith Chronic Helminth Infection,” Clinical Experimental Immunology, CXIV (1998), 414-421.
Kiepiela, Photini, Alasdair J. Leslie, Isobella Honeyborne, Danni Ramduth, ChristinaThobakgale, Senica Chetty, Prinisha Rathnavalu, Corey Moore, Katja J. Pfafferott, LouiseHilton, Peter Zimbwa, Sarah Moore, Todd Allen, Christian Brander, Marylyn M. Addo,Marcus Altfeld, Ian James, Simon Mallal, Michael Bunce, Linda D. Barber, James Szinger,Cheryl Day, Paul Klenerman, James Mullins, Bette Korber, Hoosen M. Coovadia, BruceD. Walker, and Philip J.R. Goulder (2004), “Dominant Influence of HLA-B in Mediatingthe Potential Co-Evolution of HIV and HLA,” Nature, CDXXXII (2004), 769-774.
King, Robert G., and Ross Levine, “Finance and Growth: Schumpeter Might Be Right,”Quarterly Journal of Economics, CVIII (1993), 717-737.
Kosfeld, Michael, Markus Heinrichs, Paul J. Zak, Urs Fischbacher, and Ernst Fehr, “Oxy-tocin Increases Trust in Humans,” Nature, CDXXXV (2005), 673-676.
Lund, Ole, Morten Nielsen, Can Kesmir, Anders Gorm Petersen, Claus Lundegaard, PeterWorning, Christina Sylverster-Hvid, Kasper Lamberth, Gustav Rder, Sune Justesen, SrenBuus, and Sren Brunak, “Definition of Supertypes for HLA Molecules Using Clusteringof Specificity Matrices,” Immunogenetics, LV (2004), 797-810.
Maynard Smith, John, and George R. Price, “The Logic of Animal Conflict,” Nature,
35

CCXLVI (1973), 15-18.
Milinski, Manfred, and Claus Wedekind, “Evidence for MHC-Correlated Perfume Prefer-ences in Humans,” Behavioral Ecology, XII (2001), 140-149.
Oosterbeek, Hessel, Randolph Sloof, and Gijs van de Kuilen, “Cultural Differences in Ul-timatum Game Experiments: Evidence from a Meta-Analysis,” Experimental Economics,VII (2004), 171-188.
Penn, Dustin J., “The Scent of Genetic Compatibility: Sexual Selection and the MajorHistocompatibility Complex,” Ethology, CVIII (2002), 1-21.
Playfair, John H.L., and Gregory J. Bancroft, Infection and Immunity (Oxford UniversityPress, Oxford, 2004).
Reusch, Thorsten B.H., Michael A. Haberli, Peter B. Aeschlimann, and Manfred Milinski,“Female Sticklebacks Count Alleles in a Strategy of Selection Explaining MHC Polymor-phism,” Nature, CDXIV (2001), 300-302.
Robinson, Mary Ann, and Thomas J. Kindt, “Major Histocompatibility Complex andGenes,” in: William E. Paul (ed.), Fundamental Immunology, Second Edition (RavenPress Ltd., New York NY, 1989), 489-539.
Roth, Alvin E., and Ido Erev, “Learning in Extensive-Form Games: Experimental Dataand Simple Dynamic Models in the Intermediate Term,” Games and Economic Behavior,VIII (1995), 164-212.
Roth, Alvin E., Vesna Prasnikar, Masahiro Okuno-Fujiwara, and Shmuel Zamir, “Bar-gaining and Market Behavior in Jerusalem, Ljubljana, Pittsburgh, and Tokyo: An Ex-perimental Study,” American Economic Review, CXXXI (1991), 1068-1095.
Scherer, Almut, John Frater, Annette Oxenius, Juliet Agudelo, David A. Price, HuldrychF. Gunthard, Martin Barnardo, Luc Perrin, Bernard Hirschel, Rodney E. Phillips, An-gela R. McLean, and the Swiss HIV Cohort Study, “Quantifiable Cytotoxic T LymphocyteResponses and HLA-Related Risk of Progression to AIDS,” Proceedings of the NationalAcademy of Sciences USA, CI (2004), 12266-12270.
Saint-Paul, Gilles, “On Market Forces and Human Evolution,” Working Paper, Toulouse,July 2003.
Sette, Alessandro, and John Sidney, “Nine Major HLA Class I Supertypes Account forthe Vast Preponderance of HLA-A and -B Polymorphism,” Immunogenetics, L (1999),201-212.
Slonim, Robert L., and Alvin E. Roth, “Learning in High Stakes Ultimatum Games: AnExperiment in the Slovak Republic,” Econometrica, CXVI (1998), 569-596.
36

Trachtenberg, Elizabeth, Bette Korber, Cristina Sollars, Thomas B. Kepler, Peter T.Hraber, Elizabeth Hayes, Robert Funkhouser, Michael Fugate, James Theiler, Yen S.Hsu, Kevin Kunstman, Samuel Wu, John Phair, Henry Erlich, and Steven Wolinsky,“Advantage of Rare HLA Supertype in HIV Disease Progression,” Nature Medicine, IX(2003), 928-935.
Van Damme, Eric, Stability and Perfection of Nash Equilibria (Springer Verlag, Berlin,1991).
Voorter, Cristina E.M., Marjolein Drent, and Ella M. van den Berg-Loonen, “SeverePulmonary Sarcoidosis is Strongly Associated with HLA-DQB1*0602,” Working Paper,Maastricht University, 2004.
Wedekind, Claus, and S. Furi, “Body Odor Preferences in Men and Women: Do TheyAim for Specific MHC Combinations or Simple Heterogeneity?,” Proceedings of the RoyalSociety of London, Series B, CCLXIV (1997), 1471-1479.
37
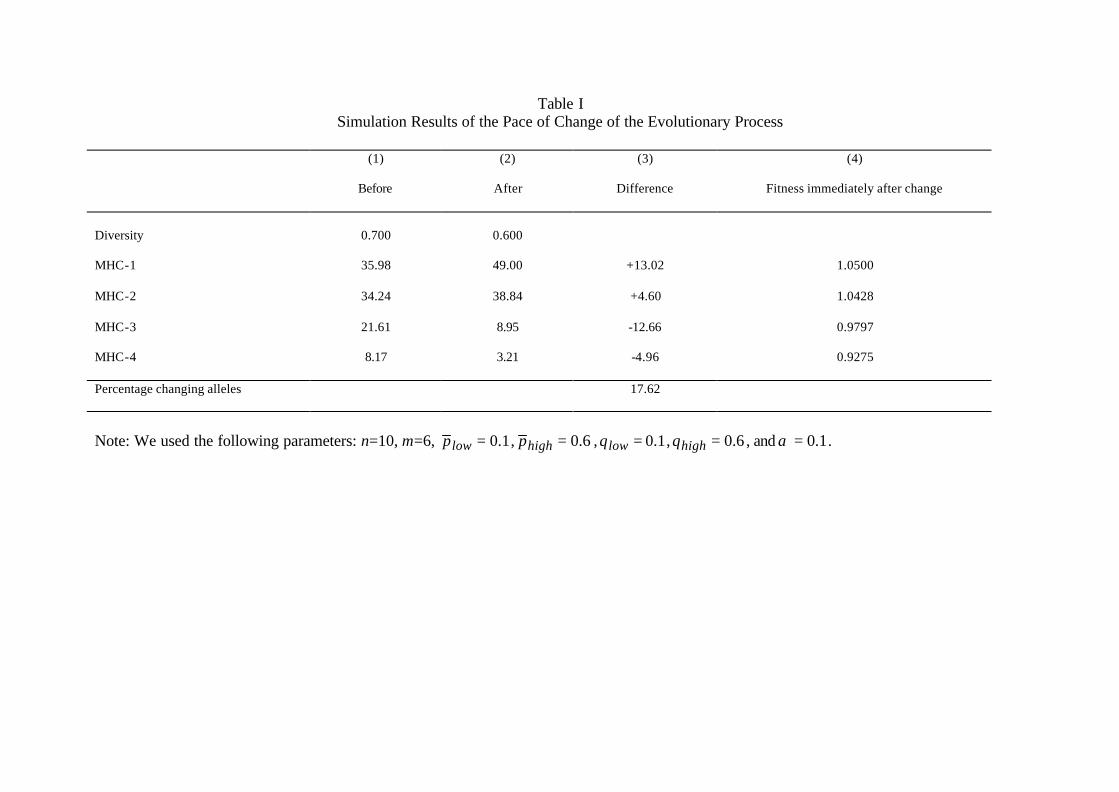
Table I Simulation Results of the Pace of Change of the Evolutionary Process
(1)
Before
(2)
After
(3)
Difference
(4)
Fitness immediately after change
Diversity
0.700 0.600
MHC-1
35.98 49.00 +13.02 1.0500
MHC-2
34.24 38.84 +4.60 1.0428
MHC-3
21.61 8.95 -12.66 0.9797
MHC-4
8.17 3.21 -4.96 0.9275
Percentage changing alleles
17.62
Note: We used the following parameters: n=10, m=6, 1.0=lowp , 6.0=highp , 1.0=lowq , 6.0=highq , and 1.0=α .

Table II The Relationship between Offer Rates from Ultimatum and Sent Money in Trust Games and MHC Diversity
(Dependent Variables: Offer and Sent Rates) Offer Rates in Ultimatum Games Sent Money in Trust Games (1) (2) (3) (4) (5) (6) (7) (8) (9) (10)
OLS OLS OLS OLS 2SLS OLS OLS OLS OLS 2SLS HLA-A HLA-A HLA-B HLA-B HLA-A HLA-A HLA-A HLA-B HLA-B HLA-A MHCi -131.628 -143.895 -137.943 -220.386 -200.727 -227.988 -209.211 -192.587 -241.725 -285.897 (35.124) (41.369) (72.124) (136.165) (100.477) (62.267) (89.662) (154.086) (200.587) (192.587) Controls No Yes No Yes Yes No Yes No Yes Yes Adj. R2 0.272 0.287 0.125 0.089 0.223 0.383 0.437 0.058 0.047 0.078 n 23 23 23 23 23 21 21 21 21 21 Note: Standard errors are reported in brackets. The instrument used for HLA -A diversity in the 2SLS estimates is HLA -B diversity. The control variables in the regressions using the offer rates from ultimatum games as the dependent variable are a dummy variable for the type of game, the stakes relative to GDP per capita, a dummy for students being subjects and an OECD dummy. In the regressions using the sent money in trust games as the dependent variable we included an OECD dummy, the stakes relative to GDP per capita, a dummy for students being subjects, a dummy for the investor and trustee receiving an initial endowment or only the investor, and a dummy for tripling or doubling the sent money.

Table III Health Outcomes and MHC Diversity
(Dependent Variable: Life Expectancy at Birth in 1990) (1) (2) (3) (4) (5) (6) OLS OLS OLS OLS 2SLS 2SLS HLA-A HLA-B HLA-A HLA-B HLA-A HLA-A
MHCi -40.045 -91.208 -47.145 -111.278 -44.795 -95.562 (14.942 (32.744) (14.434) (31.998) (23.562) (30.527)
PPi -5.393 -5.325 -5.085 -5.128 -2.627 -5.274 (1.033) (1.027) (1.029) (1.031) (0.972) (1.138) LAi -0.153 -0.171 -0.132 -0.159 -0.109 -0.137 (0.058) (0.058) (0.058) (0.059) (0.046) (0.064) HEi 3.082 3.063 1.755 1.651 1.847 1.263 (0.668) (0.666) (0.901) (0.911) (0.594) (1.022) IMMi 0.111 0.150 0.105 0.156 0.079 0.105 (0.046) (0.045) (0.046) (0.045) (0.050) (0.055) GDPi1960 1.873 1.942 2.184 (0.818) (0.828) (0.915) OECDi Yes Yes Yes Yes Yes Yes
Adj. R2 0.726 0.728 0.755 0.756 0.582 0.717 n 63 63 62 62 63 62 Predicted effect of a one-standard deviation increase in MHC diversity -0.184 -0.189 -0.216 -0.230 -0.205 -0.438 Predicted effect of 10 point increase in MHC diversity -0.521 -1.186 -0.613 -1.447 -0.582 -1.242 Note: Variables are defined in the Appendix. Standard errors are reported in brackets. The instrument used for HLA -A diversity in the estimates reported in Columns (5) and (6) is HLA -B diversity.

Table IV Infectious Diseases and MHC Diversity
(Dependent Variable: Fraction of the Population Died From Viral Infections in 2000 (Multiplied by 1,000)) (1) (2) (3) (4) (5) (6) OLS OLS OLS OLS 2SLS 2SLS HLA-A HLA-B HLA-A HLA-B HLA-A HLA-A
MHCi 0.326 0.649 0.330 0.620 0.460 0.438 (0.083) (0.182) (0.081) (0.183) (0.130) (0.125)
PPi 0.013 0.011 0.010 0.008 0.015 0.011 (0.006) (0.006) (0.006) (0.007) (0.007) (0.007) LAi 0.000 0.000 0.000 0.000 0.000 0.000 (0.000) (0.000) (0.000) (0.000) (0.000) (0.000) HEi -0.007 -0.008 -0.011 -0.013 -0.005 -0.012 (0.004) (0.004) (0.006) (0.006) (0.004) (0.006) IMMi 0.000 0.001 0.000 0.000 0.000 0.000 (0.001) (0.000) (0.000) (0.000) (0.000) (0.000) GDPi1960 0.007 0.007 0.007 (0.005) (0.006) (0.005) OECDi Yes Yes Yes Yes Yes Yes
Adj. R2 0.391 0.361 0.307 0.387 0.357 0.402 n 47 47 46 46 47 46 Pred. effect of a one-standard deviation increase in MHC diversity 0.493 0.444 0.500 0.424 0.696 0.663 Pred. effect of 10 point increase in MHC diversity 1.400 2.787 1.417 2.663 1.976 1.881
Note: Variables are defined in the Appendix. Standard errors are reported in brackets. The instrument used for HLA -A diversity in the estimates reported in Columns (5) and (6) is HLA -B diversity.

Table V Economic Performance and HLA-A Diversity
(Dependent Variables: GDP per Capita Growth for the Indicated Periods)
Full Sample
Excluding Africa
Excluding Asia
(1) (2) (3) (4) (5) (6) (7) (8) (9) (10) 1960-2000 1970-2000 1980-2000 1960-2000 1970-2000 1980-2000 1960-2000 1960-2000 1960-2000 1960-2000 OLS OLS OLS 2SLS 2SLS 2SLS OLS 2SLS OLS 2SLS MHCi -7.589 -6.412 -4.609 -10.705 -6.180 -5.925 -7.939 -13.030 -5.499 -6.287 (2.011) (1.779) (1.329) (4.133) (3.535) (2.712) (1.808) (4.303) (2.449) (3.818) Initial GDPi -0.093 -0.108 -0.117 -0.095 -0.108 -0.118 -0.118 -0.105 -0.115 -0.113 (0.080) (0.077) (0.053) (0.081) (0.077) (0.053) (0.071) (0.077) (0.084) (0.085) Adj. R2 0.191 0.209 0.212 0.099 0.069 0.128 0.285 0.159 0.151 0.129 n 62 53 61 62 53 61 52 52 53 53 Note: Variables are defined in the Appendix. Standard errors are reported in brackets. The instrument used for HLA -A diversity in the 2SLS estimates is HLA -B diversity.

Table VI Economic Performance and HLA-A Diversity Including Covariates
(Dependent Variables: GDP per Capita (Growth) for the Indicated Periods)
(1) (2) (3) 1960-2000 1960-2000 2000 OLS 2SLS OLS MHCi -5.192 -8.270 -4.971 (1.749) (3.633) (2.323) Initial GDPi -0.425 -0.390 (0.108) (0.116) PPi -0.147 -0.174 -0.079 (0.143) (0.149) (0.176) LAi -0.017 -0.017 -0.013 (0.008) (0.008) (0.010) HEi 0.410 0.376 0.786 (0.111) (0.119) (0.106) IMMi 0.011 0.009 0.005 (0.005) (0.006) (0.007) FRi -0.937 -0.934 -0.901 (0.348) (0.359) (0.341) OECDi Yes Yes Yes Adj. R2 0.489 0.457 0.852 n 60 60 60 Note: Variables are defined in the Appendix. Standard errors are reported in brackets. The instrument used for HLA-A diversity in the 2SLS estimates is HLA -B diversity.

Table VII Robustness to the Inclusion of Other Covariates
(Dependent Variables: GDP per Capita Growth 1960-2000)
(1) (2) (3) (4) (5) (6) OLS OLS OLS OLS OLS OLS MHCi -4.195 -3.888 -6.321 -6.067 -6.308 -5.493 (1.430) (1.808) (1.737) (1.768) (1.669) (1.824) Initial GDPi -0.465 -0.474 -0.505 -0.455 -0.432 -0.470 (0.078) (0.093) (0.108) (0.106) (0.097) (0.099) LEi 0.014 0.003 -0.011 -0.018 -0.012 -0.009 (0.018) (0.015) (0.016) (0.021) (0.015) (0.017) HCi -0.439 -0.099 0.316 0.395 0.347 0.317 (0.347) (0.476) (0.424) (0.430) (0.405) (0.431) HEi 0.240 0.456 0.602 0.550 0.601 0.587 (0.095) (0.107) (0.120) (0.124) (0.110) (0.118) IMMi 0.001 -0.005 -0.003 -0.003 -0.002 -0.002 (0.005) (0.006) (0.006) (0.006) (0.006) (0.006) PPi -0.020 -0.002 -0.128 -0.148 -0.107 -0.125 (0.095) (0.123) (0.128) (0.131) (0.124) (0.130) LAi 0.001 -0.009 -0.012 -0.016 -0.013 -0.014 (0.007) (0.006) (0.008) (0.007) (0.006) (0.007) FRi -0.451 -0.436 -0.777 -0.759 -0.839 -0.729 (0.251) (0.302) (0.297) (0.300) (0.289) (0.308) Trade M2/GDP Lab. For. Fertility Investment Education OTHi -0.137 0.008 0.170 -0.043 -0.208 0.164 (0.149) (0.002) (0.214) (0.109) (0.107) (0.082) OECDi Yes Yes Yes Yes Yes Yes Adj. R2 0.755 0.704 0.565 0.559 0.595 0.561 n 29 39 53 53 53 53
Note: Variables are defined in the Appendix. Standard errors are reported in brackets.

Table AI Definitions of Variables Used
Variable Definition Source
Per capita income measures (GDP)
GDP is the sum of gross value added by all resident producers in the economy plus any product taxes and minus any subsidies not included in the value of the products. It is calculated without making deductions for depreciation of fabricated assets or for depletion and degradation of natural resources. Data are in constant 1995 U.S. $. Dollar figures for GDP are converted from domestic currencies using 1995 official exchange rates. From the GDP per capita data we have computed the growth rates by taking the log differences for the relevant period.
World Bank Development Indicators [2002]
Gross enrolment in education
The total number of pupils enrolled at primary and secondary level in public and private schools.
Barro [1991]
Life expectancy
The number of years a newborn infant would live if prevailing patterns of mortality at the time of its birth were to stay the same throughout its life.
World Bank Development Indicators [2002]
Fertility The number of children that would be born to a woman if she were to live to the end of her childbearing years and bear children in accordance with prevailing age-specific fertility rates.
World Bank Development Indicators [2002]
Fractionali-zation
The fractionalization data are measuring the percentage of foreign population (ethnic), of non-domestic languages and religion in a country in a particular available year (mostly in the 1980s and 1990s). See http://www.stanford.edu/~wacziarg/downloads/ for the data.
Alesina et al. [2003]
Health expenditures
The sum of public and private health expenditures as a percentage of GDP. It covers the provision of health services (preventive and curative), family planning activities, nutrition activities, and emergency aid designated for health but does not include provision of water and sanitation.
World Bank Development Indicators [2002]
Immunization Child immunization measures the rate of vaccination coverage of children under one year of age.
World Bank Development Indicators [2002]
Exports and imports
Exports (Imports) of goods and services represent the value of all goods and other market services exported (received) to (from) the rest of the world. They include the value of merchandise, freight, insurance, transport, travel, royalties, license fees, and other services, such as communication, construction, financial, information, business, personal, and government services. They exclude labor and property income (formerly called factor services) as well as transfer payments.
World Bank Development Indicators [2002]
M2 The sum of currency outside banks, demand deposits other than those of the central government, and the time, savings, and foreign currency deposits of resident sectors other than the central government. It corresponds to lines 34 and 35 in the International Monetary Fund's (IMF) International Financial Statistics (IFS).
World Bank Development Indicators [2002]
Labor force People who meet the International Labour Organization (ILO) definition of the economically active population: all people who supply labor for the production of goods and services during a specified period. It includes both the employed and the unemployed.
World Bank Development Indicators [2002]
Investment Price level of investment goods in 1960. Data are in constant 1995 U.S. $.
World Bank Development Indicators [2002]
Infectious diseases
The disease variables are defined as the number of death through a certain disease as a percentage of the population in a country. See http://www3.who.int/whosis/menu.cfm?path=whosis,mort&language=english.
World Health Organization; Mortality Database
Tropical area information
Proportion of country’s land area within geographical tropics. Proportion of country’s population living in geographical tropics. Fraction tropical climate zone.
Gallup, Mellinger and Sachs [2001]

Table AII Ultimatum Games
Country Reference
Czech Republic Babicky, Vitezslav and Andreas Ortmann, “Fairness in Risky Environments: (Theory and)
Evidence,” Working Paper, Charles University, 2005. Brazil Bianchi, A.M, “Are Brazilian Economists Different?,” Revista Brasileira de Economia, LII
(1998), 427-39. India Boarini, R., J. Laslier, and S. Robin, “Interpersonal Comparison of Utility in Bargaining:
Evidence from a Transcontinental Ultimatum Game,” Working Paper, Ecole Polytechnique, 2002.
Russia Botelho, A., M.A. Hirsh, and E.E. Rutstrom, “Culture, Nationality and Demographics in Ultimatum Games,” Working Paper, Universidade do Minho, 2000.
China
Chuah, S., R. Hoffmann, M. Jones, and G. Williams, “Do Cultures Clash? Evidence from Cross-National Ultimatum Game Experiments,” Working Paper, Nottingham University Business School, 2004.
United Kingdom Chuah, S., R. Hoffmann, M. Jones, and G. Williams, “Do Cultures Clash? Evidence from Cross-National Ultimatum Game Experiments,” Working Paper, Nottingham University Business School, 2004.
Sweden Ellingsen, T., and M. Johannesson, “Sunk Costs, Fairness, and Disagreement,” Working Paper, Stockholm University, 2003.
Netherlands Gneezy, U., and W. Guth, “On Competing Reward Standards: An Experimental Study of Ultimatum Bargaining,” Journal of Socio-Economics, XXXI (2003), 599-607.
Spain Grosskopf, B., “Reinforcement and Directional Learning in the Ultimatum Game with Responder Competition,” Experimental Economics, VI (2003), 141-158.
Indonesia Henrich, J., R. Boyd, S. Bowles, C.F. Camerer, E. Fehr, H. Gintis, R. McElreath, M. Alvard, A. Barr, J. Ensminger, K. Hill, F. Gil-White, M. Gurven, F. Marlowe, J.Q. Patton, N. Smith, and D. Tracer, ““Economic Man” in Cross-Cultural Perspective: Behavioral Experiments in 15 Small-Scale Societies,” Working Paper, Santa Fe Institute, 2001.
Kenya Henrich, J., R. Boyd, S. Bowles, C.F. Camerer, E. Fehr, H. Gintis, R. McElreath, M. Alvard, A. Barr, J. Ensminger, K. Hill, F. Gil-White, M. Gurven, F. Marlowe, J.Q. Patton, N. Smith, and D. Tracer, ““Economic Man” in Cross-Cultural Perspective: Behavioral Experiments in 15 Small-Scale Societies,” Working Paper, Santa Fe Institute, 2001.
Mongolia Henrich, J., R. Boyd, S. Bowles, C.F. Camerer, E. Fehr, H. Gintis, R. McElreath, M. Alvard, A. Barr, J. Ensminger, K. Hill, F. Gil-White, M. Gurven, F. Marlowe, J.Q. Patton, N. Smith, and D. Tracer, ““Economic Man” in Cross-Cultural Perspective: Behavioral Experiments in 15 Small-Scale Societies,” Working Paper, Santa Fe Institute, 2001.
Zinbabwe Henrich, J., R. Boyd, S. Bowles, C.F. Camerer, E. Fehr, H. Gintis, R. McElreath, M. Alvard, A. Barr, J. Ensminger, K. Hill, F. Gil-White, M. Gurven, F. Marlowe, J.Q. Patton, N. Smith, and D. Tracer, ““Economic Man” in Cross-Cultural Perspective: Behavioral Experiments in 15 Small-Scale Societies,” Working Paper, Santa Fe Institute, 2001.
France Munier, B., and C. Zaharia, “High Stakes and Acceptance Behavior in Ultimatum Bargaining: A Contribution from an International Experiment,” Theory and Decision, LIII (2003), 187-207.
Romania Munier, B., and C. Zaharia, “High Stakes and Acceptance Behavior in Ultimatum Bargaining: A Contribution from an International Experiment,” Theory and Decision, LIII (2003), 187-207.
Austria Okada, A., and A. Riedl, “When Culture Does Not Matter: Experimental Evidence from Coalition Formation Ultimatum Games in Austria and Japan,” Working Paper, University of Amsterdam, 1999.
Canada Oxoby, R.J., and K.N. McLeish, “Sequential Decision and Strategy Vector Methods in Ultimatum Bargaining: Evidence on the Strength of Other-Regarding Behavior,” Working Paper, University of Calgary, 2004.
Germany Poulsen, A.U., and J.H.W. Tan, “Can Information Backfire? Experimental Evidence from the Ultimatum Game,” Working Paper, Aarhus School of Business, 2004.
Israel Roth, A.E., V. Prasnikar, M. Okuno-Fujiware, and S. Zamir, “Bargaining and Market Behavior in Jerusalem, Ljubljana, Pittsburgh and Tokyo: An Experimental Study,” American Economic Review, LXXXI (1991), 1068-1095.
Japan Roth, A.E., V. Prasnikar, M. Okuno-Fujiware, and S. Zamir, “Bargaining and Market

Behavior in Jerusalem, Ljubljana, Pittsburgh and Tokyo: An Experimental Study,” American Economic Review, LXXXI (1991), 1068-1095.
United States Roth, A.E., V. Prasnikar, M. Okuno-Fujiware, and S. Zamir, “Bargaining and Market Behavior in Jerusalem, Ljubljana, Pittsburgh and Tokyo: An Experimental Study,” American Economic Review, LXXXI (1991), 1068-1095.
Yugoslavia Roth, A.E., V. Prasnikar, M. Okuno-Fujiware, and S. Zamir, “Bargaining and Market Behavior in Jerusalem, Ljubljana, Pittsburgh and Tokyo: An Experimental Study,” American Economic Review, LXXXI (1991), 1068-1095.
Slovak Republic Slonim, R., and A.E. Roth, “Learning in High Stakes Ultimatum Games: An Experiment in the Slovak Republic,” Econometrica, CXVI (1998), 569-596.

Table AIII Trust Games
Country Reference
South Africa Ashraf, N., I. Bohnet and N. Piankov, “Is Trust a Bad Investment?,” Working Paper, John F.
Kennedy School of Government, Harvard University, 2003. Zimbabwe Barr, A., “Trust and Expected Trustworthiness: Experimental Evidence from Zimbabwean
Villages,” Economic Journal , CXIII (2003), 614-630. Netherlands Bellemare, C., and S. Kroger, “On Representative Trust,” Working Paper, CentER, Tilburg
University, 2003. Belgium Bouckaert, J., and G. Dhaene, “Inter-Ethnic Trust and Reciprocity: Results of an Experiment
with Small Businessmen,” European Journal of Political Economy , XX (2004), 869-886. Turkey Bouckaert, J., and G. Dhaene, “Inter-Ethnic Trust and Reciprocity: Results of an Experiment
with Small Businessmen,” European Journal of Political Economy , XX (2004), 869-886. China Buchan, N.R., E.J. Johnson, and R.T.A. Croson, “Let’s Get Personal: An International
Examination of the Influence of Communication, Culture and Social Distance on Other Regarding Preferences,” Journal of Economic Behavior and Organization, forthcoming.
Japan Buchan, N.R., E.J. Johnson, and R.T.A. Croson, “Let’s Get Personal: An International Examination of the Influence of Communication, Culture and Social Distance on Other Regarding Preferences,” Journal of Economic Behavior and Organization, forthcoming.
Korea Buchan, N.R., E.J. Johnson, and R.T.A. Croson, “Let’s Get Personal: An International Examination of the Influence of Communication, Culture and Social Distance on Other Regarding Preferences,” Journal of Economic Behavior and Organization, forthcoming.
United States Buchan, N.R., E.J. Johnson, and R.T.A. Croson, “Let’s Get Personal: An International Examination of the Influence of Communication, Culture and Social Distance on Other Regarding Preferences,” Journal of Economic Behavior and Organization, forthcoming.
Colombia Cardenas, J.C. (2003). En vos confio: an experimental exploration on the micro-foundations of trust, reciprocity and social distance in Colombia. Working Paper, Universidad de Los Andes, Economics Department.
Brazil Csukás, C., P. Fracalanza, T. Kovács, and M. Willinger, “Stated Trust versus Behavior in an Intercultural Experiment,” Working Paper 2003-25, Technical University of Budapest, 2003.
Greece Csukás, C., P. Fracalanza, T. Kovács, and M. Willinger, “Stated Trust versus Behavior in an Intercultural Experiment,” Working Paper 2003-25, Technical University of Budapest, 2003.
Hungary Csukás, C., P. Fracalanza, T. Kovács, and M. Willinger, “Stated Trust versus Behavior in an Intercultural Experiment,” Working Paper 2003-25, Technical University of Budapest, 2003.
Russia Csukás, C., P. Fracalanza, T. Kovács, and M. Willinger, “Stated Trust versus Behavior in an Intercultural Experiment,” Working Paper 2003-25, Technical University of Budapest, 2003.
Israel Fershtman, C., and U. Gneezy, “Discrimination in a Segmented Society: An Experimental Approach,” Quarterly Journal of Economics, CXVI (2001), 351-377.
Kenya Greig, F., and I. Bohnet, “Is There Reciprocity in a Reciprocal Exchange Economy? Evidence from a Slum in Nairobi, Kenya,” Working Paper, JFK School of Government, 2005.
Sweden Holm, H.J., and A. Danielson, “Tropic Trust versus Nordic Trust: Experimental Evidence from Tanzania and Sweden,” Economic Journal, CXV (2005), 505-532.
Bulgaria Koford, K., “Experiments on Trust and Bargaining in Bulgaria: The Effects of Institutions and Culture,” Working Paper, University of Delaware, 2003.
Uganda Mosley, P., and A. Verschoor, “The Development of Trust and Social Capital in Rural Uganda: An Experimental Approach,” Working Paper, University of Sheffield, 2005.
France Willinger, M., C. Keser, C. Lohmann, and J. Usunier, “A Comparison of Trust and Reciprocity between France and Germany: Experimental Investigation Based on the Investment Game,” Journal of Economic Psychology, XXIV (2003), 447-466.
Germany Willinger, M., C. Keser, C. Lohmann, and J. Usunier, “A Comparison of Trust and Reciprocity between France and Germany: Experimental Investigation Based on the Investment Game,” Journal of Economic Psychology, XXIV (2003), 447-466.

Figure I The Workings of the Immune System and the Role of the MHC
(A)
Schematic Representation of HLA -A02 Showing the Four Domains with the Polymorphic α 1 and α 2 at the Top.
(B) T Cell Response to Viral Infection and the Role of MHC Molecules in Presenting
Peptides
Source: Robinson and Kindt [1989], pp. 512-513.
Source: Adapted from Playfair and Bancroft [2004]

Figure II Rank-Ordered Frequency Distribution of HLA-A and HLA-B in 63 Populations
(A)
HLA-A (B)
HLA-B
0.269
0.170
0.123
0.094
0.0660.056
0.0460.038
0.0320.023
0.0150.006 0.001 0.000
0.000
0.050
0.100
0.150
0.200
0.250
1 2 3 4 5 6 7 8 9 10 11 12 13 14 15 16 17 18 19Rank-Ordered Frequency of HLA-A Molecules
(average of 63 populations)
Freq
uenc
y in
Pop
ulat
ion
0.0460.035
0.0280.022
0.0170.0130.0080.0050.002 0.0000.0000.000 0.0000.001
0.059
0.148
0.119
0.096
0.079
0.000
0.020
0.040
0.060
0.080
0.100
0.120
0.140
0.160
1 3 5 7 9 11 13 15 17 19 21 23 25 27 29 31 33 35 37 39 41
Rank-Ordered Frequency of HLA-B Molecules (average of 63 populations)
Freq
uenc
y in
Pop
ulat
ion

Figure III Frequency of HLA-A and HLA-B Alleles and Levels of Diversity
(A)
Appearance of the Five Most Frequent HLA -A Molecules and Diversity (B)
Appearance of the Five Most Frequent HLA -B Molecules and Diversity
0.000
0.050
0.100
0.150
0.200
0.250
0.300
0.350
0.400
0.75
4
0.79
0
0.81
8
0.83
4
0.84
0
0.84
9
0.85
4
0.85
7
0.86
1
0.87
3
0.87
5
0.87
9
0.88
3
0.88
9
0.89
5
0.90
7
HLA-A Diversity
Freq
uenc
y in
pop
ulat
ion
0.030
0.080
0.130
0.180
0.230
0.280
0.87
3
0.88
8
0.90
8
0.91
1
0.91
8
0.92
4
0.92
7
0.92
8
0.93
1
0.93
3
0.93
6
0.93
9
0.94
0
0.94
2
0.94
3
0.94
9
HLA-B Diversity
Freq
uenc
y in
pop
ulat
ion

Figure IV Simulation Results of Human Cooperation and MHC Diversity
(A)
Results for Two MHC Molecules
(B) Results for Three MHC Molecules
0.0
0.1
0.2
0.3
0.4
0.5
0.6
0.7
0.8
0.9
1.0
0.0 0.1 0.2 0.3 0.4 0.5 0.6 0.7 0.8 0.9 1.0
Gamma
Dis
trib
utio
n
0.0
0.1
0.2
0.3
0.4
0.5
0.6
0.7
0.8
0.9
1.0
0.0 0.1 0.2 0.3 0.4 0.5 0.6 0.7 0.8 0.9 1.0
GammaD
istr
ibut
ion
Note: We used the following parameters: n=10, m=2 (Panel A), m=3 (Panel B), 1.0=lowp , 6.0=highp , 1.0=lowq , 6.0=highq , and 1.0=α .

Figure V Ultimatum and Trust Games
(A)
Offer Rates in Ultimatum Games and HLA -A Diversity (n=23)
(B) Offer Rates in Ultimatum Games and HLA -B
Diversity (n=23)
25.0
30.0
35.0
40.0
45.0
50.0
55.0
60.0
0.770 0.800 0.830 0.860 0.890 0.920
25.0
30.0
35.0
40.0
45.0
50.0
55.0
60.0
0.900 0.910 0.920 0.930 0.940 0.950 0.960
(C)
Shares of Money Sent in Trust Games and HLA -A Diversity (n=22)
(D) Shares of Money Sent in Trust Games and HLA -B
Diversity (n=22)
25.0
35.0
45.0
55.0
65.0
75.0
0.770 0.800 0.830 0.860 0.890 0.920
25.0
35.0
45.0
55.0
65.0
75.0
0.900 0.910 0.920 0.930 0.940 0.950 0.960
Note: The horizontal axis measures HLA -A diversity (Panel A and C) and HLA -B diversity (Panel B and D) and the vertical axis illustrates the offer rates in ultimatum games (Panel A and B) and the shares of money sent in trust games (Panel C and D).

Figure VI Health Outcomes and MHC Diversity
(A)
Life Expectancy and HLA -A Diversity (n=63)
(B) Life Expectancy and HLA -B Diversity
(n=63)
45.00
50.00
55.00
60.00
65.00
70.00
75.00
80.00
0.750 0.800 0.850 0.900 0.950
45.00
50.00
55.00
60.00
65.00
70.00
75.00
80.00
0.8800 0.9000 0.9200 0.9400 0.9600
(C)
Fraction of the Population that Has Died from Infectious Viral Diseases (1,000s) and HLA -A
Diversity (n=47)
(D) Fraction of the Population that Has Died from Infectious Viral Diseases (1,000s) and HLA -B
Diversity (n=47)
0.001
0.011
0.021
0.031
0.041
0.051
0.061
0.071
0.081
0.091
0.750 0.800 0.850 0.900 0.950
0.001
0.011
0.021
0.031
0.041
0.051
0.061
0.071
0.081
0.091
0.8800 0.9000 0.9200 0.9400 0.9600
Note: Variables are defined in the Appendix. The horizontal axis measures HLA -A diversity (Panel A and C) and HLA -B diversity (Panel B and D) and the vertical axis illustrates life expectancy at birth (Panel A and B) and the fraction of the population that has died from viral infections (Panel C and D).

Figure VII HLA-A and HLA-B Diversity and GDP per Capita Growth 1960-2000
TURYUGCAN
MAR
NLDAUSDNK
USASVKDEUBEL
AUT HUNGRC ESP
ITAISR
BRAPAK
INDFRA
MEXCOLGBR
ALBARGKEN
MNGARM
ZAF
CPV
EGYUGA
PRT
ZWERUSKAZMKD
CZEHRV
BGRPOL
VNMPRI
SWE
GEO BWAIRL
OMNKOR
FINIDN
JPNTHA
CHN
SGP
UKR ROM
VENSENZMB
ZAR
-2.00
-1.50
-1.00
-0.50
0.00
0.50
1.00
1.50
2.00
2.50
0.75 0.77 0.79 0.81 0.83 0.85 0.87 0.89 0.91 0.93 0.95
HLA-A Diversity
GD
P pe
r C
apita
Gro
wth
ZAR
ZMBSENVEN
ROM UKR
SGP
CHNTHA
JPN
IDNFIN
KOROMN
IRL BWAGEO
SWE
PRI VNMPOLBGR
HRVCZE
MKD KAZRUSZWE
PRT
UGA EGY
CPV
ZAFARMMNG
KEN ARGALB
GBRCOL MEX
FRAIND
PAKBRA
ISRITA
ESPGRCHUNAUT
BEL DEUSVKUSA
DNKAUSNLD
MARCAN
YUGTUR
-2.00
-1.50
-1.00
-0.50
0.00
0.50
1.00
1.50
2.00
2.50
0.880 0.890 0.900 0.910 0.920 0.930 0.940 0.950 0.960
HLA-B Diversity
GD
P pe
r C
apita
Gro
wth


![Nonlinear FAVO Dispersion Quantification Based on the ...downloads.hindawi.com/journals/geofluids/2020/7616045.pdfand attenuation between poroelastic and viscoelastic media [33–36],](https://img.pdfslide.net/doc/110x75/5f953c26339f3961ed7c80c2/nonlinear-favo-dispersion-quantification-based-on-the-and-attenuation-between.jpg)


![Annexture - 10Annexure 10].pdfand C'.. \..](https://img.pdfslide.net/doc/110x75/5e597f0b322a3b27dd0fba83/-annexture-10-annexure-10pdf-and-c-.jpg)