Embed Size (px)
Citation preview

Iskorištenje vodnih snaga
2
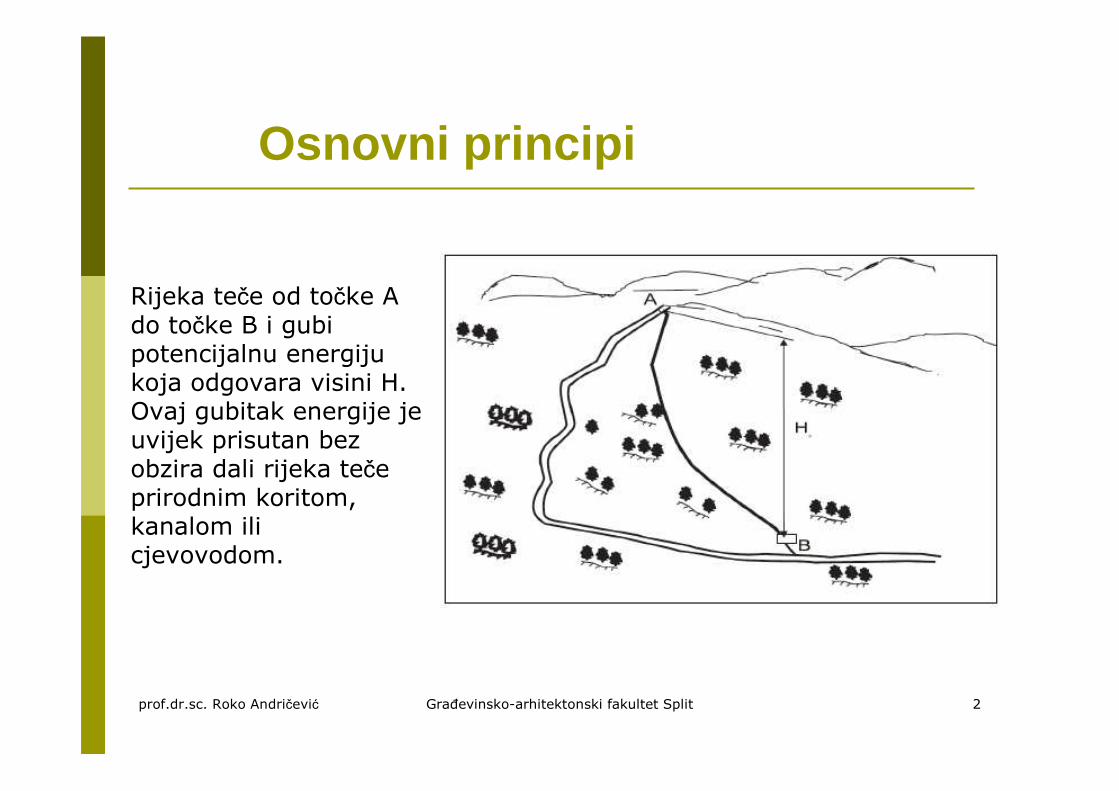
Rijeka teče od točke A do točke B i gubi potencijalnu energiju koja odgovara visini H. Ovaj gubitak energije je uvijek prisutan bez obzira dali rijeka teče prirodnim koritom, kanalom ili cjevovodom.
prof.dr.sc. Roko Andričević Grañevinsko-arhitektonski fakultet Split
Osnovni principi

3
Snaga vode
Izgubljena potencijalna energija može se pretvoriti u snagu prema jednadžbi:
γQHP =P je snaga u KW izgubljena u riječnom toku
Q je protok u m3/s
H je ukupna visina u m (npr. ZAA--ZZBB))
γ je specifična težina vode (9.81 kN/m3)
prof.dr.sc. Roko Andričević Grañevinsko-arhitektonski fakultet Split

4
Energija vode
Ako voda teče od točke A do točke B kroz cjevovod koji ima turbinu na svom donjem kraju, tada se snaga P (umanjena za neke gubitke u trenju i turbulenciji tečenja kroz cjevovod) izgubila na pokretanju turbine koja tu stvorenu mehaničku energiju koristi za rotaciju generatora da bi se proizvela električna energija.
Cilj je izgraditi grañevinu s minimalnim troškovima gradnje uz očuvanje što više snage P za rotaciju generatora. Da bi se procijenio potencijal neke lokacije u riječnom toku potrebno je poznavati varijaciju protoke u toku godine i koliki je raspoloživ pad H.
prof.dr.sc. Roko Andričević Grañevinsko-arhitektonski fakultet Split

5
Efikasnost hidroelektrana
� Hidroenergija je vrlo efikasna� Efikasnost = (električna snaga koja ulazi u mrežu) ÷
(potencijalna energija visine vode)� Tipični gubici su zbog:
� Trenje i turbulencija vode u tečenju kroz cjevovod� Trenje i magnetski gubici u turbinama i generatoru
� Sveukupna efikasnost kod hidroelektrane iznosi imeñu 75-95%
prof.dr.sc. Roko Andričević Grañevinsko-arhitektonski fakultet Split

6
Izračun snage hidroelektrane
� P = snaga u kilovatima (kW)
� g = gravitacijsko ubrzanje (9.81 m/s2)� η= efikasnost turbine i generatora (0<η<1)
� Q = Protoka na turbini (m3/sec)� H = efektivni pad (umanjen za gubitke) (m)
HQP
HQgP
×××≅×××=
ηη
10
prof.dr.sc. Roko Andričević Grañevinsko-arhitektonski fakultet Split

7
Primjer 1aConsider a mountain stream with an effective head of
25 meters (m) and a flow rate of 600 liters (ℓ) per minute. How much power could a hydro plant generate? Assume plant efficiency (η) of 83%.
� H = 25 m
� Q = 600 ℓ/min × 1 m3/1000 ℓ × 1 min/60secQ = 0.01 m3/sec
� η = 0.83
� P = 10ηQH = 10(0.83)(0.01)(25) = 2.075 kW
prof.dr.sc. Roko Andričević Grañevinsko-arhitektonski fakultet Split

8
Primjer 1b
How much energy (E) will the hydro plant generate each year?
� E = P×tE = 2.1 kW × 24 hrs/day × 365 days/yrE = 18,396 kWh annually
About how many people will this energy support (assume approximately 3,000 kWh / person)?
� People = E÷3000 = 18396/3000 = 6.13� About 6 peopleprof.dr.sc. Roko Andričević Grañevinsko-arhitektonski fakultet Split

9
Primjer 2
Consider a second site with an effective head of 100 m and a flow rate of 6,000 cubic meters per second (about that of Niagara Falls). Answer the same questions.
� P ≅ 10ηQH = 10(0.83)(6000)(100)
P = 4.98 million kW = 4.98 GW (gigawatts)
� E = P×t = 4.98GW × 24 hrs/day × 365 days/yrE = 43,625 GWh = 43.6 TWh (terrawatt hours)
� People = E÷3000 = 43.6 TWh / 3,000 kWhPeople = 1.45 million people
� (This assumes maximum power production 24x7)prof.dr.sc. Roko Andričević Grañevinsko-arhitektonski fakultet Split

Economics of Hydropower

11
Production Expense Comparison
Wisconsin Valley Improvement Company, http://www.wvic.com/hydro-facts.htm
prof.dr.sc. Roko Andričević Grañevinsko-arhitektonski fakultet Split

12
Capital Costs of Several Hydro Plants
Note that these are for countries where costs are bound to be lower than for fully industrialized countries
Boyle, Renewable Energy, 2nd edition, Oxford University Press, 2003
prof.dr.sc. Roko Andričević Grañevinsko-arhitektonski fakultet Split
13
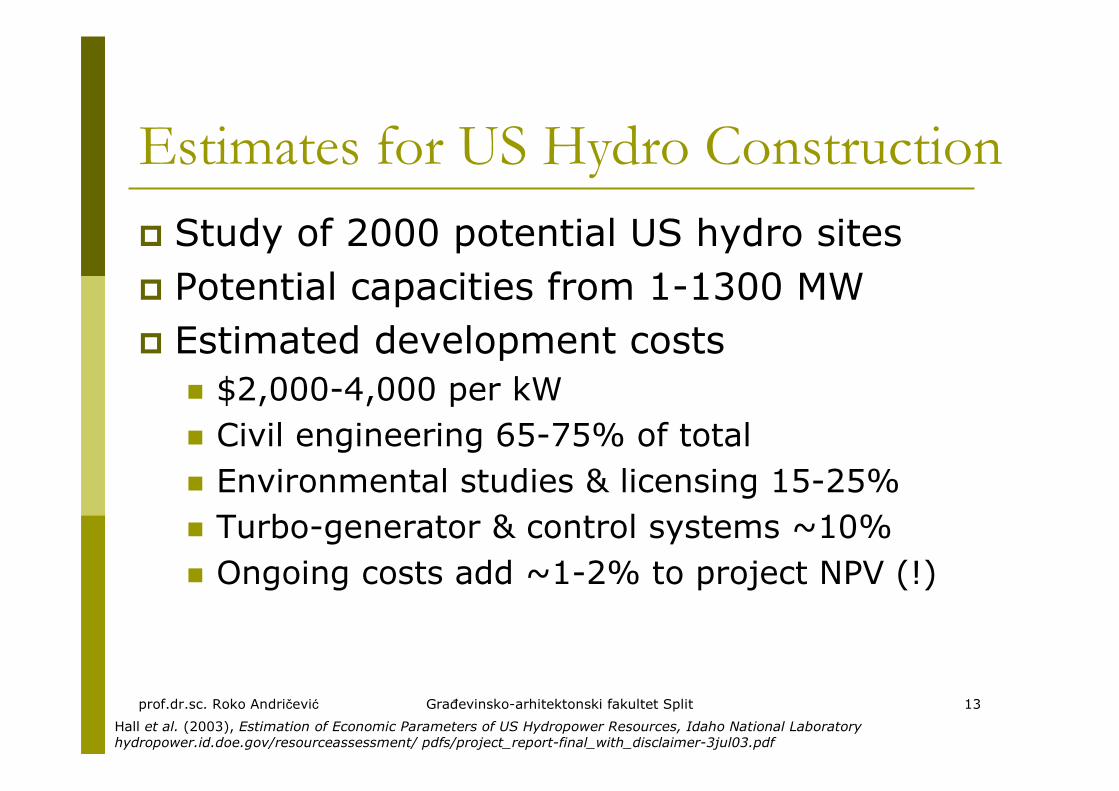
Estimates for US Hydro Construction
� Study of 2000 potential US hydro sites
� Potential capacities from 1-1300 MW
� Estimated development costs� $2,000-4,000 per kW
� Civil engineering 65-75% of total
� Environmental studies & licensing 15-25%
� Turbo-generator & control systems ~10%
� Ongoing costs add ~1-2% to project NPV (!)
Hall et al. (2003), Estimation of Economic Parameters of US Hydropower Resources, Idaho National Laboratoryhydropower.id.doe.gov/resourceassessment/ pdfs/project_report-final_with_disclaimer-3jul03.pdf
prof.dr.sc. Roko Andričević Grañevinsko-arhitektonski fakultet Split

14
Costs of Increased US Hydro Capacity
Hall, Hydropower Capacity Increase Opportunities (presentation), Idaho National Laboratory, 10 May 2005www.epa.gov/cleanenergy/pdf/hall_may10.pdf
prof.dr.sc. Roko Andričević Grañevinsko-arhitektonski fakultet Split

15
Costs of New US Capacity by Site
Hall, Hydropower Capacity Increase Opportunities (presentation), Idaho National Laboratory, 10 May 2005www.epa.gov/cleanenergy/pdf/hall_may10.pdf
prof.dr.sc. Roko Andričević Grañevinsko-arhitektonski fakultet Split

16
High Upfront Capital Expenses
� 5 MW hydro plant with 25 m low head� Construction cost of ~$20 million
� Negligible ongoing costs
� Ancillary benefits from dam � flood control, recreation, irrigation, etc.
� 50 MW combined-cycle gas turbine� ~$20 million purchase cost of equipment
� Significant ongoing fuel costs
� Short-term pressures may favor fossil fuel energy production
Boyle, Renewable Energy, 2nd edition, Oxford University Press, 2003
prof.dr.sc. Roko Andričević Grañevinsko-arhitektonski fakultet Split

Environmental Impacts

18
Impacts of Hydroelectric Dams
prof.dr.sc. Roko Andričević Grañevinsko-arhitektonski fakultet Split

19
Ecological Impacts
� Loss of forests, wildlife habitat, species
� Degradation of upstream catchment areas due to inundation of reservoir area
� Rotting vegetation also emits greenhouse gases
� Loss of aquatic biodiversity, fisheries, other downstream services
� Cumulative impacts on water quality, natural flooding
� Disrupt transfer of energy, sediment, nutrients
� Sedimentation reduces reservoir life, erodes turbines
� Creation of new wetland habitat
� Fishing and recreational opportunities provided by new reservoirs
prof.dr.sc. Roko Andričević Grañevinsko-arhitektonski fakultet Split

20
Environmental and Social Issues
� Land use – inundation and displacement of people
� Impacts on natural hydrology
� Increase evaporative losses
� Altering river flows and natural flooding cycles
� Sedimentation/silting
� Impacts on biodiversity
� Aquatic ecology, fish, plants, mammals
� Water chemistry changes
� Mercury, nitrates, oxygen
� Bacterial and viral infections
� Tropics
� Seismic Risks
� Structural dam failure risks
prof.dr.sc. Roko Andričević Grañevinsko-arhitektonski fakultet Split
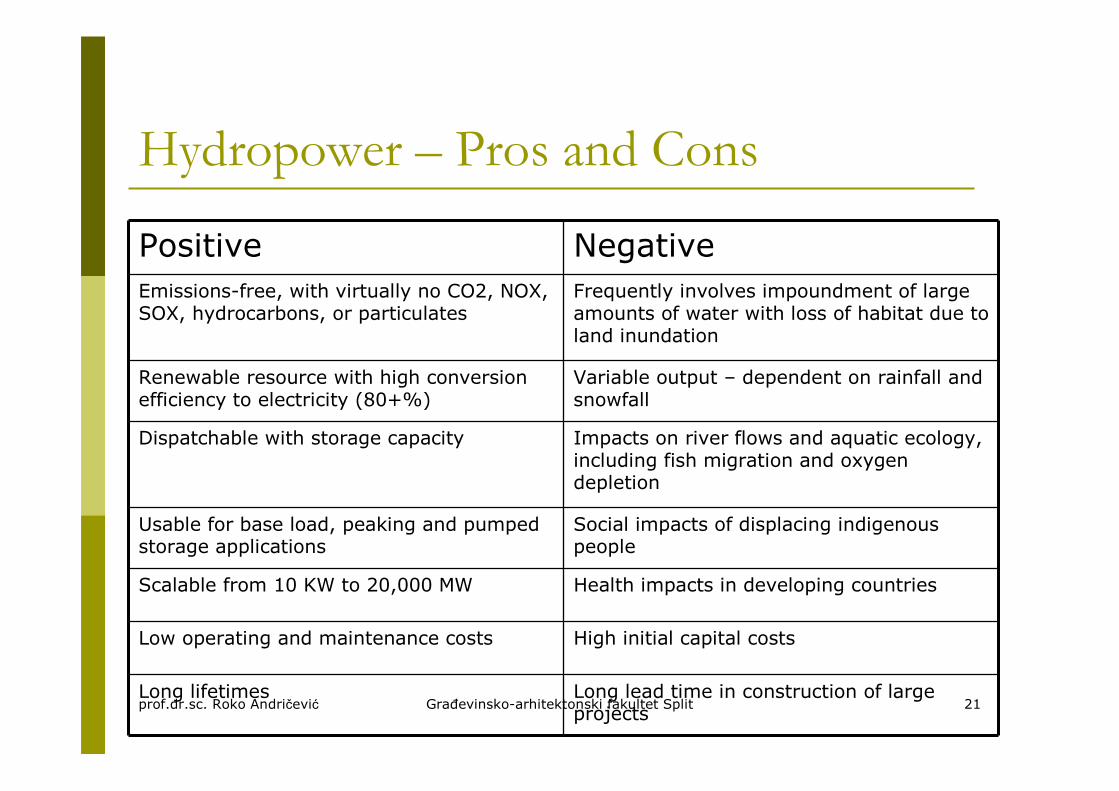
21
Hydropower – Pros and Cons
Positive NegativeEmissions-free, with virtually no CO2, NOX, SOX, hydrocarbons, or particulates
Frequently involves impoundment of large amounts of water with loss of habitat due to land inundation
Renewable resource with high conversion efficiency to electricity (80+%)
Variable output – dependent on rainfall and snowfall
Dispatchable with storage capacity Impacts on river flows and aquatic ecology, including fish migration and oxygen depletion
Usable for base load, peaking and pumped storage applications
Social impacts of displacing indigenous people
Scalable from 10 KW to 20,000 MW Health impacts in developing countries
Low operating and maintenance costs High initial capital costs
Long lifetimes Long lead time in construction of large projects
prof.dr.sc. Roko Andričević Grañevinsko-arhitektonski fakultet Split

22
Three Gorges – Pros and Cons
Boyle, Renewable Energy, 2nd edition, Oxford University Press, 2003
prof.dr.sc. Roko Andričević Grañevinsko-arhitektonski fakultet Split

Regulations and Policy

24
Energy Policy Act of 2005
Hydroelectric Incentives� Production Tax Credit – 1.8 ¢/KWh
� For generation capacity added to an existing facility
� (non-federally owned)
� Adjusted annually for inflation
� 10 year payout, $750,000 maximum/year per facility
� A facility is defined as a single turbine
� Expires 2016
� Efficiency Incentive
� 10% of the cost of capital improvement
� Efficiency hurdle - minimum 3% increase
� Maximum payout - $750,000
� One payment per facility
� Maximum $10M/year
� Expires 2016
� 5.7 MW proposed through June 2006prof.dr.sc. Roko Andričević Grañevinsko-arhitektonski fakultet Split

25
World Commission on Dams
� Established in 1998� Mandates
� Review development effectiveness of large dams and assess alternatives for water resources and energy development; and
� Develop internationally acceptable criteria and guidelines for most aspects of design and operation of dams
� Highly socially aware organization� Concern for indigenous and tribal people
� Seeks to maximize preexisting water and energy systems before making new dams
prof.dr.sc. Roko Andričević Grañevinsko-arhitektonski fakultet Split

26
Other Agencies Involved
� FERC – Federal Energy Regulatory Comm.� Ensures compliance with environmental law
� IWRM – Integrated Water & Rsrc Mgmt� “Social and economic development is inextricably linked to both water and energy. The key challenge for the 21st century is to expand access to both for a rapidly increasing human population, while simultaneously addressing the negative social and environmental impacts.” (IWRM)
prof.dr.sc. Roko Andričević Grañevinsko-arhitektonski fakultet Split

Future of Hydropower

28
Hydro Development Capacity
hydropower.org
prof.dr.sc. Roko Andričević Grañevinsko-arhitektonski fakultet Split

29
Developed Hydropower Capacity
World Atlas of Hydropower and Dams, 2002
prof.dr.sc. Roko Andričević Grañevinsko-arhitektonski fakultet Split

30
Regional Hydropower Potential
Boyle, Renewable Energy, 2nd edition, Oxford University Press, 2003
prof.dr.sc. Roko Andričević Grañevinsko-arhitektonski fakultet Split

31
Opportunities for US Hydropower
Hall, Hydropower Capacity Increase Opportunities (presentation), Idaho National Laboratory, 10 May 2005www.epa.gov/cleanenergy/pdf/hall_may10.pdf
prof.dr.sc. Roko Andričević Grañevinsko-arhitektonski fakultet Split

32
Summary of Future of Hydropower� Untapped U.S. water energy resources are immense� Water energy has superior attributes compared to other
renewables:� Nationwide accessibility to resources with significant power potential� Higher availability = larger capacity factor� Small footprint and low visual impact for same capacity
� Water energy will be more competitive in the future because of:� More streamlined licensing� Higher fuel costs� State tax incentives� State RPSs, green energy mandates, carbon credits� New technologies and innovative deployment configurations
� Significant added capacity is available at competitive unit costs� Relicensing bubble in 2000-2015 will offer opportunities for
capacity increases, but also some decreases� Changing hydropower’s image will be a key predictor of future
development trends
Hall, Hydropower Capacity Increase Opportunities (presentation), Idaho National Laboratory, 10 May 2005www.epa.gov/cleanenergy/pdf/hall_may10.pdf
prof.dr.sc. Roko Andričević Grañevinsko-arhitektonski fakultet Split

Extra Hydropower Slides

34
Hydrologic Cycle
prof.dr.sc. Roko Andričević Grañevinsko-arhitektonski fakultet Split

35
World Hydropower
Boyle, Renewable Energy, 2nd edition, Oxford University Press, 2003
prof.dr.sc. Roko Andričević Grañevinsko-arhitektonski fakultet Split

36
Major Hydropower Producers
� Canada, 341,312 GWh (66,954 MW installed)
� USA, 319,484 GWh (79,511 MW installed)
� Brazil, 285,603 GWh (57,517 MW installed)
� China, 204,300 GWh (65,000 MW installed)
� Russia, 173,500 GWh (44,700 MW installed)
� Norway, 121,824 GWh (27,528 MW installed)
� Japan, 84,500 GWh (27,229 MW installed)
� India, 82,237 GWh (22,083 MW installed)
� France, 77,500 GWh (25,335 MW installed)
1999 figures, including pumped-storage hydroelectricity
“Hydroelectricity,” Wikipedia.org
prof.dr.sc. Roko Andričević Grañevinsko-arhitektonski fakultet Split

37
Types of Water Wheels
prof.dr.sc. Roko Andričević Grañevinsko-arhitektonski fakultet Split

38
World Energy Sources
hydropower.org
prof.dr.sc. Roko Andričević Grañevinsko-arhitektonski fakultet Split

39
iea.org
OECD: most of Europe, Mexico, Japan, Korea, Turkey, New Zealand, UK, US
Evolution of Hydro Production
prof.dr.sc. Roko Andričević Grañevinsko-arhitektonski fakultet Split

40
iea.org
OECD: most of Europe, Mexico, Japan, Korea, Turkey, New Zealand, UK, US
Evolution of Hydro Production
prof.dr.sc. Roko Andričević Grañevinsko-arhitektonski fakultet Split

41
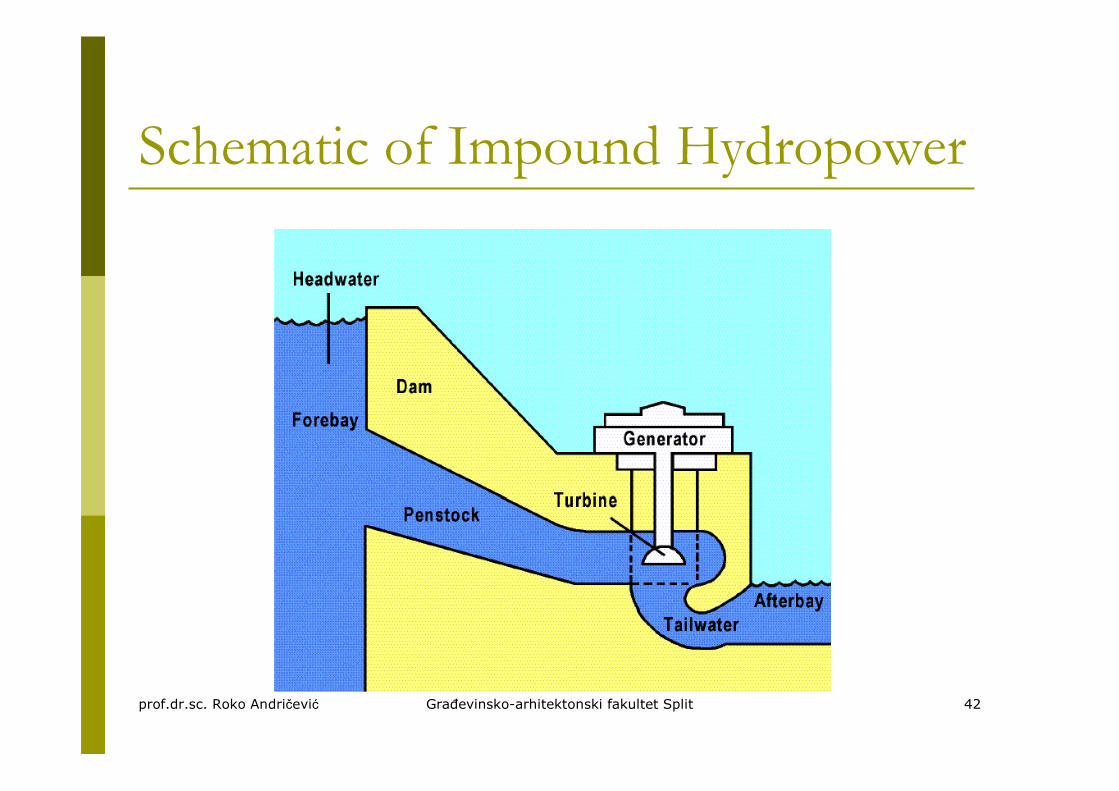
Schematic of Impound Hydropower
prof.dr.sc. Roko Andričević Grañevinsko-arhitektonski fakultet Split
42
Schematic of Impound Hydropower
prof.dr.sc. Roko Andričević Grañevinsko-arhitektonski fakultet Split

43
Cruachan Pumped Storage (Scotland)
prof.dr.sc. Roko Andričević Grañevinsko-arhitektonski fakultet Split

44
Francis Turbine – Grand Coulee
prof.dr.sc. Roko Andričević Grañevinsko-arhitektonski fakultet Split

45
Historically…
� Pumped hydro was first used in Italy and Switzerland in the 1890's.
� By 1933 reversible pump-turbines with motor-generators were available
� Adjustable speed machines now used to improve efficiency� Pumped hydro is availableat almost any scale with discharge times ranging from several hours to a few days.
� Efficiency = 70 – 85%
http://www.electricitystorage.org/tech/technologies_technologies_pumpedhydro.htm
prof.dr.sc. Roko Andričević Grañevinsko-arhitektonski fakultet Split

46
Small Horizontal Francis Turbine
prof.dr.sc. Roko Andričević Grañevinsko-arhitektonski fakultet Split

47
Francis and Turgo Turbine Wheels
prof.dr.sc. Roko Andričević Grañevinsko-arhitektonski fakultet Split

48prof.dr.sc. Roko Andričević Grañevinsko-arhitektonski fakultet Split