Embed Size (px)
Citation preview
This article was published in the above mentioned Springer issue.The material, including all portions thereof, is protected by copyright;all rights are held exclusively by Springer Science + Business Media.
The material is for personal use only;commercial use is not permitted.
Unauthorized reproduction, transfer and/or usemay be a violation of criminal as well as civil law.
ISSN 1432-9840, Volume 13, Number 7
Quantitative Links Between PacificSalmon and Stream Periphyton
Jan J. Verspoor,* Douglas C. Braun, and John D. Reynolds
Earth2Ocean Research Group, Department of Biological Sciences, Simon Fraser University, 8888 University Drive, Burnaby, British
Columbia V5A 1S6, Canada
ABSTRACT
Species’ impacts on primary production can have
strong ecological consequences. In freshwater eco-
systems, Pacific salmon (Oncorhynchus spp.) may
influence stream periphyton through substrate
disturbance during spawning and nutrient subsi-
dies from senescent adults. The shape of relation-
ships between the abundance of spawning salmon
and stream periphyton, as well as interactions with
environmental variables, are incompletely under-
stood and may differ across the geographic range of
salmon. We examined these relationships across 24
sockeye salmon (Oncorhynchus nerka) spawning
streams in north-central British Columbia, Canada.
The influence of salmon abundance and environ-
mental variables (temperature, light, dissolved
nutrients, water velocity, watershed size, and
invertebrate grazer abundance) on post-spawning
periphyton abundance and nitrogen stable isotope
signatures, which can indicate the uptake of sal-
mon nitrogen, was evaluated using linear regres-
sion models and Akaike Information Criterion.
Periphyton nitrogen stable isotope signatures were
best described by a positive log-linear relationship
with an upstream salmon abundance metric that
includes salmon from earlier years. This suggests
the presence of a nutrient legacy. In contrast,
periphyton abundance was negatively related to
the spawning-year salmon density, which likely
results from substrate disturbance during spawn-
ing, and positively related to dissolved soluble
reactive phosphorus prior to spawning, which may
indicate phosphorus limitation in the streams.
These results suggest that enrichment from salmon
nutrients does not always translate into elevated
periphyton abundance. This underscores the need
to directly assess the outcome of salmon impacts on
streams rather than extrapolating from stable iso-
tope evidence for the incorporation of salmon
nutrients into food webs.
Key words: aquatic conservation; food web; eco-
system-based management; ecosystem engineer;
resource subsidy; marine-derived nutrients; nutri-
ent pulse.
INTRODUCTION
Individual species affect primary productivity
through many mechanisms. Herbivory can increase
primary productivity by maintaining plants in a
state of rapid growth (for example, McNaughton
1985) and alter plant community composition (for
example, Howe and others 2006). Species that de-
liver nutrient subsidies can stimulate primary pro-
duction when nutrients are limiting (Polis and
others 1997). The physical modification of habitat
can also have positive or negative consequences for
Received 8 April 2010; accepted 16 July 2010;
published online 17 September 2010
Electronic supplementary material: The online version of this article
(doi:10.1007/s10021-010-9371-0) contains supplementary material,
which is available to authorized users.
Author contributions: JJV and JDR designed the study, JJV and DCB
performed the research, JJV analyzed the data, DCB contributed to the
statistical methods and JJV and JDR wrote the paper.
*Corresponding author; e-mail: [email protected]
Ecosystems (2010) 13: 1020–1034DOI: 10.1007/s10021-010-9371-0
� 2010 Springer Science+Business Media, LLC
1020
Author's personal copy
primary production (Wright and Jones 2004). Such
changes to basal food sources can have ecological
consequences at higher trophic levels. In streams,
internal primary production provides an important
resource for aquatic primary consumers (Minshall
1978; Lamberti 1996) and changes in primary
productivity can affect populations of both inver-
tebrate primary consumers and their predators,
including fish (Lamberti 1996). Primary production
is predominantly by benthic algae found within a
complex assemblage of algae, bacteria, fungi, and
microzoans, called periphyton or biofilm (Steinman
and others 2006).
Across the north Pacific, spawning anadro-
mous salmon (Oncorhynchus spp.) may influence
periphyton growth and abundance, with conse-
quences for freshwater ecosystem structure and
function. With more than 95% of the salmon’s body
mass accumulated in the ocean, their semelparous
life history (dying after spawning) can deliver a large
annual pulse of nitrogen and phosphorus to fresh-
water ecosystems, which could enhance periphyton
growth when nutrients are limiting (Gende and
others 2002; Naiman and others 2002; Schindler and
others 2003). Stable isotope techniques have been
used to detect the contribution of salmon-derived
nitrogen to stream periphyton, an approach that is
possible because the ratio of the heavy nitrogen
isotope (15N) to the light nitrogen isotope (14N) is
higher in salmon, which contain marine-derived
nitrogen, than in natural freshwater or terrestrial
nitrogen sources (for example, Kline and others
1990; Bilby and others 1996; Chaloner and others
2002; Claeson and others 2006). Furthermore, sal-
mon-derived nitrogen and phosphorus may be
retained in watersheds after the spawning period,
which could affect primary production in sub-
sequent years (Naiman and others 2002; Peterson
and Matthews 2009). Salmon may also affect
periphyton through physical disturbance of the
substrate during redd-digging and spawning, which
can export nutrients, transport substrate, and scour
existing periphyton (for example, Moore and others
2004; Moore and others 2007; Hassan and others
2008). Thus, salmon may increase or decrease the
abundance of stream periphyton, depending on the
relative effects of nutrient enrichment and physical
disturbance.
Given the different ways salmon can affect
periphyton, it is perhaps unsurprising that there is
conflicting evidence on relationships between sal-
mon and periphyton. Comparisons between sites
with and without salmon have shown both de-
creases in periphyton abundance, likely from redd-
digging (Minakawa and Gara 1999; Peterson and
Foote 2000), and increases, likely through the
nutrient subsidy (Schuldt and Hershey 1995; Wipfli
and others 1998; Peterson and Foote 2000; Chaloner
and others 2004). A comparison of three streams
over 3 years found that salmon abundance was
positively related to periphyton abundance (John-
ston and others 2004). In contrast, a comparison of
10 streams over multiple years found consistent
decreases in periphyton abundance across a gradient
in salmon abundance (Moore and Schindler 2008).
Experiments in which salmon were excluded
showed increased periphyton abundance when
redd-digging was prevented (Moore and others
2004; Tiegs and others 2009), whereas experimental
carcass additions elevated both dissolved nutrient
levels and periphyton abundance (for example,
Schuldt and Hershey 1995; Wipfli and others 1999;
Kohler and others 2008).
Periphyton abundance is affected by a suite of
variables other than salmon, such as stream dis-
charge, light, temperature, and water chemistry
(Biggs 1996; Borchardt 1996; DeNicola 1996; Hill
1996). Periphyton abundance can also be positively
related to watershed size, a landscape-level metric
that can capture variation in limiting variables such
as temperature and light (Lamberti and Steinman
1997). As well, invertebrates can regulate periphyton
abundance through grazing (Steinman 1996).
Relationships between salmon and periphyton may
be mediated by these variables (Mitchell and
Lamberti 2005; Chaloner and others 2007). For
example, periphyton may only respond to direct
salmon nutrient subsidies when not limited by light
(Rand and others 1992; Ambrose and others 2004).
Further, human land-use activities can change
environmental variables (for example, substrate
size) that affect the link between salmon and
periphyton (Tiegs and others 2008). There is a
need to consider the effect of these environmental
variables on relationships between salmon and
periphyton (Janetski and others 2009).
Relationships between Pacific salmon and
periphyton may also change with salmon abun-
dance, which is relevant as Pacific salmon have
substantially declined in abundance across parts of
their range (Nehlsen and others 1991; Baker and
others 1996; Slaney and others 1996; Gresh and
others 2000). These declines are likely to have
changed the magnitude of the ecosystem influence
of spawning salmon. As management strategies
begin to incorporate the ecological roles of salmon
when setting escapement goals (that is, the number
of fish that managers wish to let ‘‘escape’’ the
fishery and return to the streams), predicting how
changes in salmon abundance affect ecosystem
Quantitative Links Between Pacific Salmon and Stream Periphyton 1021 Author's personal copy
processes such as primary production will become
increasingly relevant (for example, DFO 2005;
Moore and Schindler 2008; Moore and others
2008). Consequently, there is a need to better
understand the shape of relationships between
salmon abundance and stream periphyton across
the geographic range of Pacific salmon.
The overall objective of our study was to under-
stand the role of spawning sockeye salmon (On-
corhynchus nerka) in the ecology of stream
periphyton. Specifically, our study has the following
facets aimed at filling key knowledge gaps: (1) we
studied a large number of streams (24) to quantify
the shape of relationships between salmon abun-
dance and periphyton abundance (measured using
chlorophyll a [chl a] content and ash-free dry mass
[AFDM]) after spawning, (2) we compared these
results to relationships between salmon abundance
and periphyton nitrogen stable isotope signatures,
which show the uptake of salmon nitrogen by
periphyton and explicitly test for the contribution of
salmon nutrients from previous years, and (3) we
incorporated the potential role of environmental
variables known to influence either periphyton
abundance or nitrogen stable isotope signatures.
METHODS
Study Sites
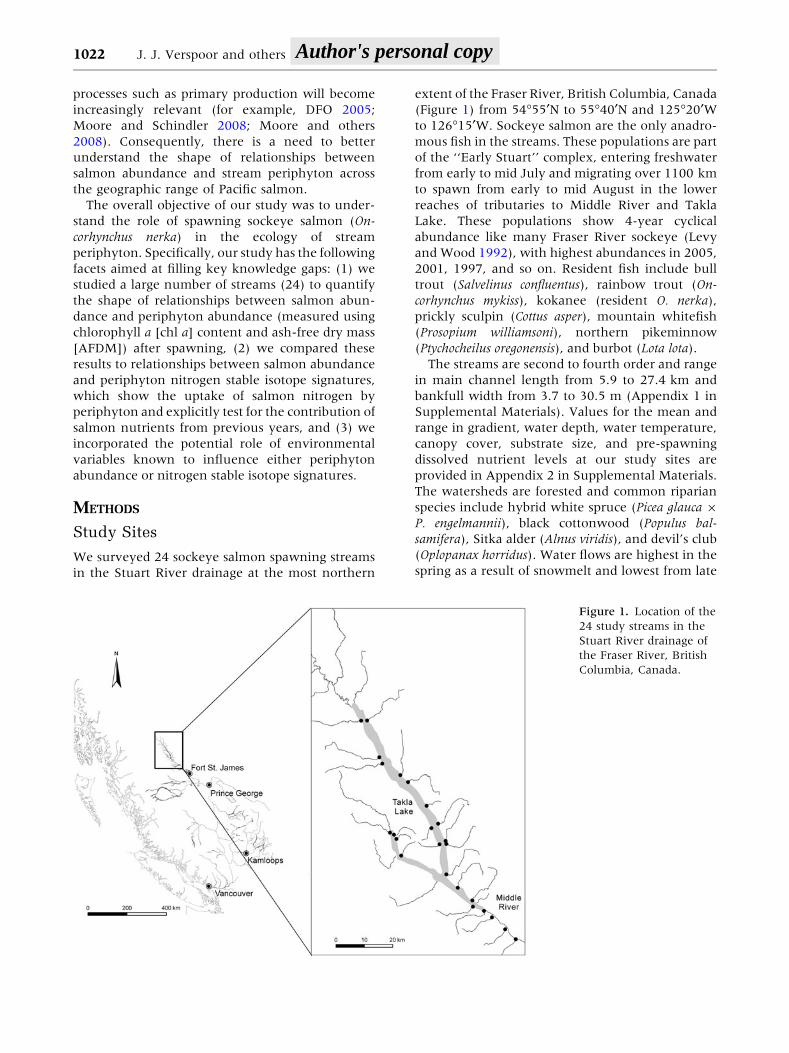
We surveyed 24 sockeye salmon spawning streams
in the Stuart River drainage at the most northern
extent of the Fraser River, British Columbia, Canada
(Figure 1) from 54�55¢N to 55�40¢N and 125�20¢Wto 126�15¢W. Sockeye salmon are the only anadro-
mous fish in the streams. These populations are part
of the ‘‘Early Stuart’’ complex, entering freshwater
from early to mid July and migrating over 1100 km
to spawn from early to mid August in the lower
reaches of tributaries to Middle River and Takla
Lake. These populations show 4-year cyclical
abundance like many Fraser River sockeye (Levy
and Wood 1992), with highest abundances in 2005,
2001, 1997, and so on. Resident fish include bull
trout (Salvelinus confluentus), rainbow trout (On-
corhynchus mykiss), kokanee (resident O. nerka),
prickly sculpin (Cottus asper), mountain whitefish
(Prosopium williamsoni), northern pikeminnow
(Ptychocheilus oregonensis), and burbot (Lota lota).
The streams are second to fourth order and range
in main channel length from 5.9 to 27.4 km and
bankfull width from 3.7 to 30.5 m (Appendix 1 in
Supplemental Materials). Values for the mean and
range in gradient, water depth, water temperature,
canopy cover, substrate size, and pre-spawning
dissolved nutrient levels at our study sites are
provided in Appendix 2 in Supplemental Materials.
The watersheds are forested and common riparian
species include hybrid white spruce (Picea glauca 9
P. engelmannii), black cottonwood (Populus bal-
samifera), Sitka alder (Alnus viridis), and devil’s club
(Oplopanax horridus). Water flows are highest in the
spring as a result of snowmelt and lowest from late
Figure 1. Location of the
24 study streams in the
Stuart River drainage of
the Fraser River, British
Columbia, Canada.
1022 J. J. Verspoor and others Author's personal copy
July to mid September, when salmon spawn, and
also from November to February, when most pre-
cipitation is accumulated as snow. Total annual
precipitation in the region is around 500 mm of
which on average 200 mm is snowfall. For a de-
tailed description of the region and four of the
streams see Macdonald and others (1992).
Salmon Abundance
All salmon abundance metrics were calculated from
data provided by Fisheries and Oceans Canada
(DFO). In each stream, DFO personnel conducted
foot surveys every 4 days during the spawning per-
iod to count the number of live and dead sockeye
across all spawning grounds. Finer scale counts were
recorded for 500 m stream sections that corre-
sponded to where we collected periphyton and
habitat data. DFO personnel estimated the total
number of adult salmon in each stream by multi-
plying the ‘‘peak’’ surveyed abundance of adult
salmon by an expansion factor. The ‘‘peak’’ surveyed
abundance was determined as the highest value
obtained by adding the live count of adult salmon
from a single survey to the total number of dead
salmon summed across all prior surveys. The
expansion factor was determined from data collected
at counting fences on 2–3 streams as the number by
which the peak surveyed abundance for the stream
must be multiplied to equal the total number of
salmon that passed through the counting fence.
We characterized the influence of adult
salmon on periphyton abundance during the 2007
spawning period by two metrics. First, the total
number of adult sockeye salmon upstream of our
study sites (‘‘2007 upstream salmon abundance’’)
was used as a proxy for total salmon nutrient input
to the watershed. Although not all nutrients will be
washed downstream this metric represents the
theoretical maximum exposure. This metric was
calculated by correcting the total number of adult
salmon in a stream at ‘‘peak’’ abundance by the
proportion of fish upstream of where we collected
periphyton. Second, the local adult salmon density
(fish m-2) where periphyton was collected (‘‘2007
salmon density’’) was used as a proxy for both
substrate disturbance and local nutrient input. This
metric assumes no nutrient contribution from up-
stream. The 2007 salmon density (D) was calcu-
lated as follows:
D ¼ F
wl; ð1Þ
where F is the total number of salmon in the sec-
tion where we collected periphyton and habitat
data, w is the section-specific wetted width (m) and
l is the length of the section (m). The two metrics
were highly correlated (r = 0.99) and results did
not differ between them. We report 2007 salmon
density in models of periphyton abundance as it
best characterizes both nutrient input and sub-
strate disturbance. In 2007, spawning populations
were small but represented a gradient of salmon
abundance (2007 salmon density range = 0.0–0.1
fish m-2, Appendix 1).
We characterized the potential influence of sal-
mon abundance on periphyton nitrogen stable
isotope signatures using both single-year (2007),
which are described previously, and multi-year
(2004–2007) metrics. Of the single-year metrics,
we report 2007 salmon abundance in our models of
periphyton nitrogen stable isotope signature as it
best characterizes the theoretical maximum salmon
nutrient exposure. The multi-year metrics repre-
sented the additional contribution of any salmon
nutrients retained in the watershed from previous
years. Mean upstream salmon abundance from
2004 to 2007 ranged from 2 to 2,368 fish (Appen-
dix 1). Both upstream salmon abundance and
local salmon density were summed over 4 years
(2004–2007) with the contribution of earlier years
weighted by a negative exponential function that
described a rate of salmon nutrient loss from the
watershed. These multi-year metrics (X) were
calculated as follows:
X ¼X
Xi � eð�k�tÞ; ð2Þ
where Xi is upstream salmon abundance or salmon
density in year i, k describes the rate of nutrient loss
from the system, and t is the number of years prior
to 2007. Metrics were calculated for values of k that
correspond to a salmon nutrient half-life in the
watershed of 6 months, 1, 2, and 4 years. The
multi-year metrics of upstream salmon abundance
were highly correlated (r > 0.98 in all cases), as
were the multi-year metrics of salmon density
(r > 0.97 in all cases), and results did not differ
between them. As such, we tested for the presence
of a nutrient legacy but could not test its timeframe.
We report 2004–2007 upstream abundance and
2004–2007 salmon density weighted by a 6 month
salmon nutrient half-life in models of periphyton
nitrogen stable isotope signatures. All three
reported salmon abundance metrics were positively
correlated (2007 upstream salmon abundance
versus 2004–2007 upstream salmon abundance,
r = 0.89; 2007 upstream salmon abundance versus
2004–2007 salmon density, r = 0.74; 2004–2007
upstream salmon abundance versus 2004–2007
Quantitative Links Between Pacific Salmon and Stream Periphyton 1023 Author's personal copy
salmon density, r = 0.79). We did not test a multi-
year metric in models of periphyton abundance for
two reasons. First, the influence of a nutrient legacy
on periphyton abundance should be through pre-
spawning dissolved nutrient concentrations, which
we considered as covariates. Second, as single- and
multi-year metrics are highly co-linear they should
not be included in the same model.
Periphyton Collection and Processing
Unglazed ceramic tiles were anchored in each
stream at the bottom of the spawning reach, given
physical access restrictions, to permit maximum
exposure to upstream salmon-derived nutrients.
Tiles were introduced in July of 2007, 2–4 weeks
prior to sockeye spawning. Periphyton were sam-
pled from the tiles 4–6 weeks after spawning in
late September. There were originally eight or
twelve tiles in each stream but losses resulted in a
lesser number for some streams (range = 1–12,
Appendix 1).
We measured two proxies for periphyton abun-
dance: chl a (lg cm-2) and AFDM (mg cm-2).
Samples for chl a and AFDM analyses were scraped
from an area of tile (3.14 cm2 or 1.57 cm2), filtered
onto glass fiber filters (Whatman, 25 mm, 0.7 lm
pore size), and stored in the dark at -20�C. Chl
a was extracted in methanol at 2–4�C for 24 h,
measured fluorometrically (Turner TD-700 Fluo-
rometer), corrected for pheophytin using acidifi-
cation (Holm-Hansen and Riemann 1978), and
then divided by the area sampled (cm2). Linear
regression showed chl a to be strongly related to
total chlorophyll (total chlorophyll = 1.10 chl
a + 0.04, r2 = 0.99), which was calculated as the
sum of pheophytin and chl a. This demonstrates
that degradation products comprised a consistently
small fraction of total chlorophyll. AFDM was
measured according to Steinman and others
(2006). Mean chl a and AFDM were calculated
across all tiles in a stream.
Samples for stable isotope analysis were scraped
from the remainder of the tile area and stored
similarly, until being dried in the lab at 55�C for
more than 24 h and manually ground into a fine
powder. Samples (0.9–2.5 mg dry weight) were
assayed for nitrogen stable isotopes using a PDZ
Europa ANCA-GSL elemental analyzer interfaced
to a PDZ Europa 20-20 isotope ratio mass spec-
trometer (Sercon Ltd., Cheshire, UK) at the Uni-
versity of California Davis Stable Isotope Facility
(http://stableisotopefacility.ucdavis.edu/). Stable
isotope signatures are expressed in delta notation
(d) as ratios relative to the standard of atmospheric
N2 (nitrogen). This is expressed in ‘‘parts per
thousand’’ (&) according to
d15NðÞ ¼Rsample
Rstandard� 1
� �� 1000; ð3Þ
where R is the ratio of heavy isotope (15N) to light
isotope (14N) in the sample and standard. Finally,
d15N was averaged across all tiles in a stream.
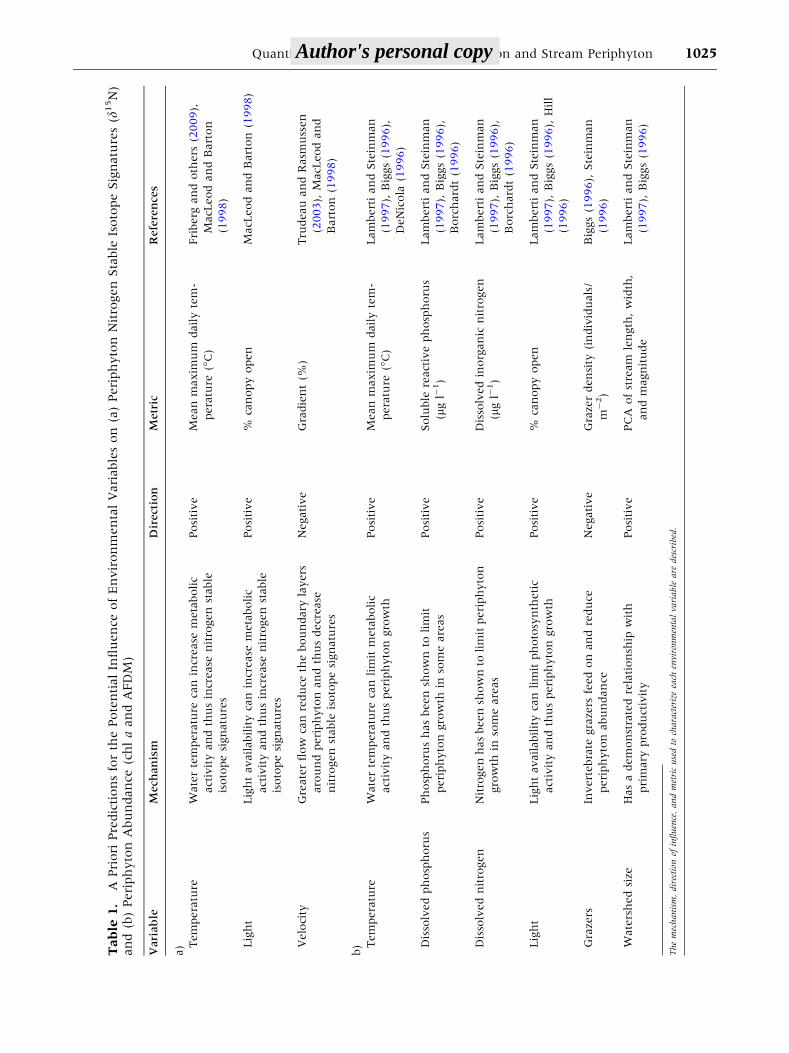
Environmental Variables
A literature search showed that periphyton abun-
dance can be influenced by water temperature,
dissolved nitrogen and phosphorus concentrations,
light availability, watershed size, and grazer abun-
dance (Table 1b). Water temperature, light avail-
ability, and water velocity have been shown to
influence periphyton nitrogen stable isotope sig-
natures (Table 1a). We also considered the number
of days the tiles were in the stream (soak time) as
an explanatory variable of periphyton abundance
(range = 53–76 days).
We characterized water temperature as the mean
maximum daily temperature across the spawning
period (August 5th–21st). Stream temperature was
measured using waterproofed ibutton (DS1922L)
temperature loggers programmed to record tem-
peratures every 2 h and attached to iron rods
imbedded in the stream. As equipment failure led
to missing temperature data for two streams, we
first performed our analyses with this reduced
dataset of 22 streams. As temperature proved not to
be a significant explanatory variable of d15N, chl a,
or AFDM, we excluded it and repeated the analyses
across all 24 streams, which led to the same con-
clusions as with temperature included.
Dissolved phosphorus, characterized as soluble
reactive phosphorus (SRP), and dissolved inorganic
nitrogen, calculated as the sum of total ammonia
(NH4–N) and nitrite nitrogen (NO3–N), were sam-
pled two or three times at one location in each
stream over 2 months prior to spawning. Samples
were analyzed at DFO’s Cultus Lake Laboratory
according to American Public Health Association
methods (APHA 1989). Briefly, SRP was deter-
mined by the automated ascorbic acid method,
NO3–N by the automated cadmium reduction
method, and NH4–N by the automated phenate
method.
As a proxy for water velocity, stream gradient
was measured across the length of stream in which
the tiles were situated using a 59 Abney hand le-
vel. Percent open canopy was measured at each tile
location using a spherical densitometer and the
mean value from tile placement and collection used
1024 J. J. Verspoor and others Author's personal copy
Tab
le1.
APri
ori
Pre
dic
tion
sfo
rth
ePote
nti
al
Infl
uen
ceof
En
vir
on
men
tal
Vari
able
son
(a)
Peri
ph
yto
nN
itro
gen
Sta
ble
Isoto
pe
Sig
natu
res
(d15N
)an
d(b
)Peri
ph
yto
nA
bu
ndan
ce(c
hl
aan
dA
FD
M)
Vari
ab
leM
ech
an
ism
Dir
ect
ion
Metr
icR
efe
ren
ces
a) T
em
pera
ture
Wate
rte
mpera
ture
can
incr
ease
meta
boli
c
act
ivit
yan
dth
us
incr
ease
nit
rogen
stable
isoto
pe
sign
atu
res
Posi
tive
Mean
maxim
um
dail
yte
m-
pera
ture
(�C
)
Fri
berg
an
doth
ers
(2009),
MacL
eod
an
dB
art
on
(1998)
Lig
ht
Lig
ht
avail
abil
ity
can
incr
ease
meta
boli
c
act
ivit
yan
dth
us
incr
ease
nit
rogen
stable
isoto
pe
sign
atu
res
Posi
tive
%ca
nopy
open
MacL
eod
an
dB
art
on
(1998)
Velo
city
Gre
ate
rfl
ow
can
redu
ceth
ebou
ndary
layers
aro
un
dperi
ph
yto
nan
dth
us
decr
ease
nit
rogen
stable
isoto
pe
sign
atu
res
Negati
ve
Gra
die
nt
(%)
Tru
deau
an
dR
asm
uss
en
(2003),
MacL
eod
an
d
Bart
on
(1998)
b) T
em
pera
ture
Wate
rte
mpera
ture
can
lim
itm
eta
boli
c
act
ivit
yan
dth
us
peri
ph
yto
ngro
wth
Posi
tive
Mean
maxim
um
dail
yte
m-
pera
ture
(�C
)
Lam
bert
ian
dSte
inm
an
(1997),
Big
gs
(1996),
DeN
icola
(1996)
Dis
solv
ed
ph
osp
horu
sPh
osp
horu
sh
as
been
show
nto
lim
it
peri
ph
yto
ngro
wth
inso
me
are
as
Posi
tive
Solu
ble
react
ive
ph
osp
horu
s
(lg
l-1)
Lam
bert
ian
dSte
inm
an
(1997),
Big
gs
(1996),
Borc
hard
t(1
996)
Dis
solv
ed
nit
rogen
Nit
rogen
has
been
show
nto
lim
itperi
ph
yto
n
gro
wth
inso
me
are
as
Posi
tive
Dis
solv
ed
inorg
an
icn
itro
gen
(lg
l-1)
Lam
bert
ian
dSte
inm
an
(1997),
Big
gs
(1996),
Borc
hard
t(1
996)
Lig
ht
Lig
ht
avail
abil
ity
can
lim
itph
oto
syn
theti
c
act
ivit
yan
dth
us
peri
ph
yto
ngro
wth
Posi
tive
%ca
nopy
open
Lam
bert
ian
dSte
inm
an
(1997),
Big
gs
(1996),
Hil
l
(1996)
Gra
zers
Invert
ebra
tegra
zers
feed
on
an
dre
du
ce
peri
ph
yto
nabu
ndan
ce
Negati
ve
Gra
zer
den
sity
(in
div
idu
als
/
m-
2)
Big
gs
(1996),
Ste
inm
an
(1996)
Wate
rsh
ed
size
Has
adem
on
stra
ted
rela
tion
ship
wit
h
pri
mary
pro
du
ctiv
ity
Posi
tive
PC
Aof
stre
am
len
gth
,w
idth
,
an
dm
agn
itu
de
Lam
bert
ian
dSte
inm
an
(1997),
Big
gs
(1996)
Th
em
ech
an
ism
,dir
ecti
onof
influ
ence
,an
dm
etri
cu
sed
toch
ara
cter
ize
each
envi
ron
men
tal
vari
able
are
des
crib
ed.
Quantitative Links Between Pacific Salmon and Stream Periphyton 1025 Author's personal copy
as a proxy for light availability. We used the first axis
of a principal components analysis of stream mag-
nitude, length, and bankfull width as a metric for
watershed size. This axis explained 79% of the var-
iation in the three variables and all variables loaded
positively with eigenvalues greater than 0.5. Stream
magnitude, which is the number of first order trib-
utaries in the watershed, and stream length were
obtained from the BC Ministry of Environment’s
Habitat Wizard (http://www.env.gov.bc.ca/habwiz/).
Bankfull width, the maximum stream width possible
without flooding, was averaged across 16 measure-
ments taken to the nearest 10 cm.
Grazer abundance was calculated from benthic
invertebrate samples collected during the month
immediately prior to salmon spawning (July 1st–
August 2nd, 2007). Four samples were taken per
stream from different riffles. Within each riffle,
three separate invertebrate collections were pooled.
Collections were made using a Surber sampler
(frame area = 0.09 m2, 500 lm mesh) by agitating
the substrate within the frame to a depth of 10 cm
for 2 min, washed into plastic bottles, preserved in
95% ethanol, and transported back to the labora-
tory. Samples were split using a Folsom Plankton
Splitter and subsamples picked under magnifica-
tion until a total count of over 300 individuals was
reached. Ten percent of samples were indepen-
dently re-picked to verify sorting efficiency as
greater than 90%. Insects of the orders Epheme-
roptera, Plecoptera, Trichoptera, and Diptera
(EPTD) were identified to family level, with all
other invertebrates identified to order, using Mer-
ritt and others (2008). Ten percent of samples were
independently identified to verify accuracy as
greater than 95%. Functional feeding group des-
ignations were made using Merritt and others
(2008) and the abundance of all individuals
classified as grazers was summed to estimate grazer
abundance (number m-2).
Data Analysis
First, we conducted an exploratory analysis to
identify the environmental variables that best de-
scribed periphyton nitrogen stable isotope signa-
tures and abundance across the 24 streams. We
then evaluated the relative importance of salmon
abundance, the environmental variables selected
from the exploratory step (explained below), and
tile soak time in describing periphyton nitrogen
stable isotope signatures, chl a content, and AFDM.
We did this by competing multiple linear regression
models using Akaike Information Criterion cor-
rected for small sample sizes (AICc).
We identified the explanatory environmental
variables that best described periphyton nitrogen
stable isotope signatures and abundance according
to methods suggested by Zuur and others (2010).
First, we examined multicollinearity among all
explanatory environmental variables using vari-
ance inflation factors (VIF) (Table 1). A VIF quan-
tifies the severity of multicollinearity in an ordinary
least squares regression analysis by measuring how
much the variance of an estimated regression
coefficient is increased because of collinearity
among explanatory variables. No variable exceeded
a value of two, suggesting multicollinearity among
variables was not of concern. We then conducted a
backward stepwise linear regression using all vari-
ables and sequentially dropped non-significant
explanatory variables (P > 0.05). A less stringent
criterion of P greater than 0.1 and a manual alter-
ation of the order in which variables were removed
had little impact on the final results. As no a priori
hypotheses for interactions were generated, none
were included in the model. Stream gradient came
through the regression procedure as an explanatory
variable of d15N, SRP as an explanatory variable of
AFDM and both SRP and canopy cover as explan-
atory variables of chl a. As the relationship between
canopy cover and chl a was the inverse to that
predicted, thus likely spurious, we dropped canopy
cover from further consideration.
We then combined the selected environmental
variables (gradient or SRP) with the relevant sal-
mon abundance metrics (2007 upstream salmon
abundance, 2007 salmon density, 2004–2007 up-
stream salmon abundance, or 2004–2007 salmon
density), and tile soak time. No variable had a VIF
above two and scatterplots did not reveal any
obvious non-linearity between any explanatory
and response variables. We created linear regres-
sion models of each response variable (d15N, chl a,
and AFDM) for all single explanatory variables and
combinations of explanatory variables, with the
restriction that two salmon abundance metrics
could not be in the same model. No interaction
terms were included as none were hypothesized
a priori. We square-root transformed 2007 salmon
density and 2004–2007 salmon density and log10
transformed 2007 upstream salmon abundance,
2004–2007 upstream salmon abundance, gradient,
SRP, AFDM, and chl a to improve fits with the
model assumptions.
We used AICc to evaluate the support for each
model in describing d15N, AFDM, and chl a. AICc
evaluates the relative descriptive power of various
a priori models with different combinations of
variables based on the principal of parsimony,
1026 J. J. Verspoor and others Author's personal copy
balancing optimal fit with the number of parame-
ters used (Anderson 2008). Delta AICc values,
model weights (wi), and evidence ratios (ER) were
calculated to aid interpretation of the model rank-
ing (Anderson 2008). The DAICc value is the
change in AICc between model i and the top
ranked model, wi is the probability that model i is
the best of the set considered, and ER is the ratio of
wtop model/wi and can be interpreted as the likeli-
hood that the top ranked model is better than
model i (Anderson 2008). All statistical analyses
were conducted in R (R Development Core Team
2009).
We used a 2-source isotope-mixing model (for
example, Naiman and others 2002; Schindler and
others 2005) to estimate the proportion of nitrogen
in the periphyton that was derived from salmon.
This model assumed that periphyton accumulated
nitrogen from salmon and a combined pool of other
sources in proportion to availability. It also as-
sumed that other sources of nitrogen had a con-
stant combined nitrogen stable isotope signature
across streams and that fractionation during nitro-
gen uptake was independent of salmon nutrient
contributions. The proportion of nitrogen in
periphyton derived from salmon (X) was calculated
as follows:
X ¼d15Nperiphyton � d15Nb
� �
d15Nsockeye � d15Nb
� � ; ð4Þ
where d15Nperiphyton was the mean nitrogen stable
isotope signature of periphyton, d15Nsockeye was the
nitrogen stable isotope signature of sockeye sal-
mon, and d15Nb was the nitrogen stable isotope
signature of the combined pool of other nitrogen
sources. We used a value of 11.29& for d15Nsockeye
(Johnson and Schindler 2009). We used the mean
value of periphyton d15N across nine ‘‘control’’
sites; three streams that had a 2004–2007 upstream
salmon abundance of fewer than 10 fish (Appendix
1) and six streams where we sampled periphyton
above the extent of salmon spawning (J. J. Vers-
poor, unpublished data) to approximate d15Nb.
RESULTS
Periphyton Nitrogen Stable IsotopeSignature
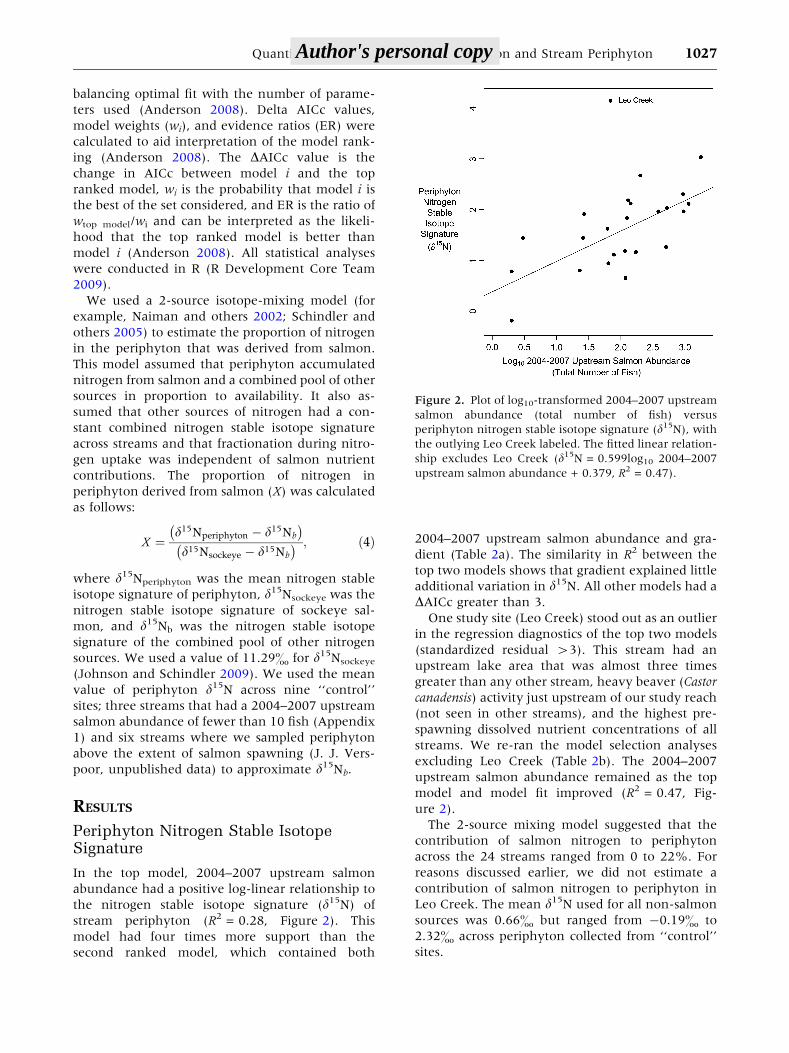
In the top model, 2004–2007 upstream salmon
abundance had a positive log-linear relationship to
the nitrogen stable isotope signature (d15N) of
stream periphyton (R2 = 0.28, Figure 2). This
model had four times more support than the
second ranked model, which contained both
2004–2007 upstream salmon abundance and gra-
dient (Table 2a). The similarity in R2 between the
top two models shows that gradient explained little
additional variation in d15N. All other models had a
DAICc greater than 3.
One study site (Leo Creek) stood out as an outlier
in the regression diagnostics of the top two models
(standardized residual >3). This stream had an
upstream lake area that was almost three times
greater than any other stream, heavy beaver (Castor
canadensis) activity just upstream of our study reach
(not seen in other streams), and the highest pre-
spawning dissolved nutrient concentrations of all
streams. We re-ran the model selection analyses
excluding Leo Creek (Table 2b). The 2004–2007
upstream salmon abundance remained as the top
model and model fit improved (R2 = 0.47, Fig-
ure 2).
The 2-source mixing model suggested that the
contribution of salmon nitrogen to periphyton
across the 24 streams ranged from 0 to 22%. For
reasons discussed earlier, we did not estimate a
contribution of salmon nitrogen to periphyton in
Leo Creek. The mean d15N used for all non-salmon
sources was 0.66& but ranged from -0.19& to
2.32& across periphyton collected from ‘‘control’’
sites.
Figure 2. Plot of log10-transformed 2004–2007 upstream
salmon abundance (total number of fish) versus
periphyton nitrogen stable isotope signature (d15N), with
the outlying Leo Creek labeled. The fitted linear relation-
ship excludes Leo Creek (d15N = 0.599log10 2004–2007
upstream salmon abundance + 0.379, R2 = 0.47).
Quantitative Links Between Pacific Salmon and Stream Periphyton 1027 Author's personal copy
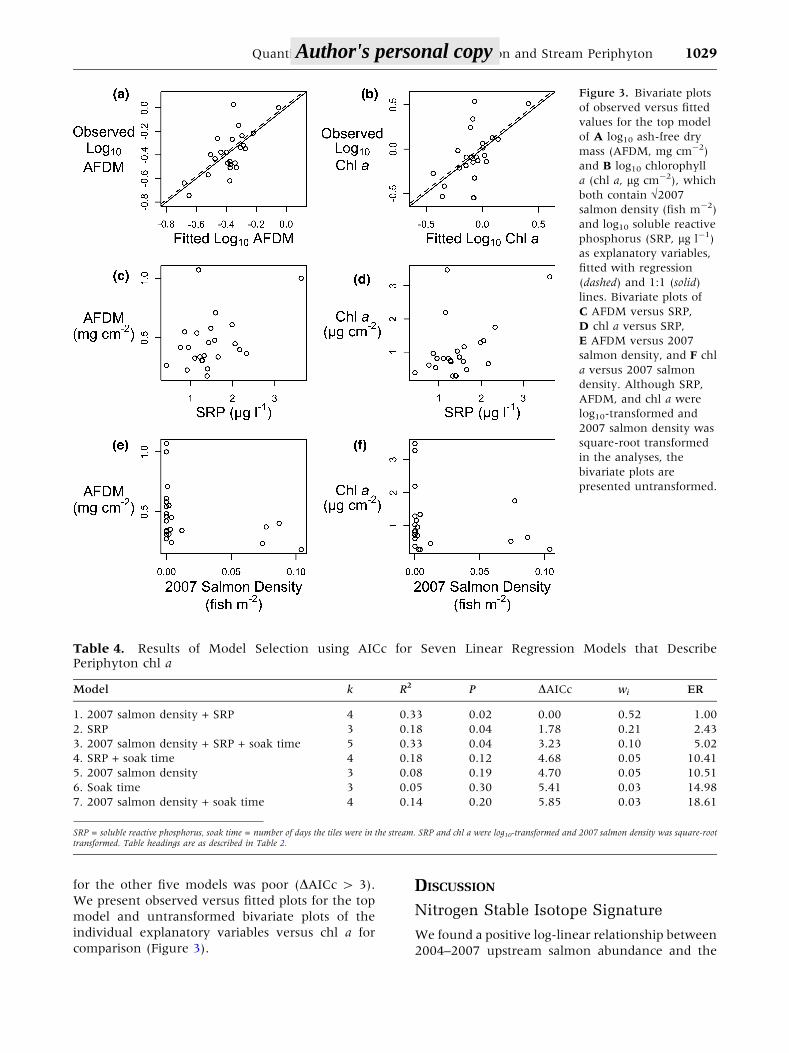
Periphyton Abundance
In the top model, salmon density in 2007 had a
negative relationship to the AFDM of stream
periphyton, whereas pre-spawning SRP had a po-
sitive relationship to AFDM (log10AFDM =
0.94log10SRP - 1.05�2007 salmon density - 0.67,
R2 = 0.49). This model had twice as much support
as the second ranked model, which contained 2007
salmon density, SRP, and tile soak time (Table 3).
The higher R2 of the second model shows that
soak time explained some additional variation in
AFDM but that it was less than the penalty imposed
for the additional parameter. Support for the other
five models was poor (DAICc > 3). We present
observed versus fitted plots for the top model and
untransformed bivariate plots of the individual
explanatory variables versus AFDM for comparison
(Figure 3).
In the top model, salmon density in 2007 had a
negative relationship to the chl a content of stream
periphyton, whereas pre-spawning SRP had a
positive relationship to chl a (log10chl a =
1.49log10SRP - 1.09�2007 salmon density - 0.58,
R2 = 0.33). This model had twice as much support
as the second ranked model, which contained SRP
as a single explanatory variable (Table 4). Support
Table 2. Results of Model Selection using AICc for Seven Linear Regression Models that DescribePeriphyton Nitrogen Stable Isotope Signatures (d15N)
k R2 P DAICc wi ER
a) Model (including Leo Creek)
1. 2004–2007 upstream salmon abundance 3 0.28 0.008 0.00 0.63 1.00
2. 2004–2007 upstream salmon abundance + gradient 4 0.28 0.03 2.84 0.15 4.15
3. 2004–2007 salmon density 3 0.13 0.09 4.63 0.06 10.14
4. 2007 upstream salmon abundance 3 0.12 0.09 4.70 0.06 10.49
5. Gradient 3 0.11 0.11 5.03 0.05 12.38
6. 2004–2007 salmon density + gradient 4 0.17 0.13 6.18 0.03 22.01
7. 2007 upstream salmon abundance + gradient 4 0.16 0.16 6.60 0.02 27.08
b) Model (excluding Leo Creek)
1. 2004–2007 upstream salmon abundance 3 0.47 0.0003 0.00 0.73 1.00
2. 2004–2007 upstream salmon abundance + gradient 4 0.47 0.002 2.96 0.17 4.39
3. 2007 upstream salmon abundance 3 0.33 0.005 5.49 0.05 15.58
4. 2004–2007 salmon density 3 0.29 0.008 6.55 0.03 26.46
5. 2007 upstream salmon abundance + gradient 4 0.34 0.02 7.96 0.01 53.42
6. 2004–2007 salmon density + gradient 4 0.33 0.02 8.25 0.01 61.85
7. Gradient 3 0.15 0.07 10.92 0.00 235.67
Results are presented (a) including Leo Creek (n = 24) and (b) excluding Leo Creek (n = 23). Stream gradient, 2007 upstream salmon abundance, and 2004–2007 upstreamsalmon abundance were log10-transformed and 2004–2007 salmon density was square-root transformed. k = number of model parameters, R2 = model regression coefficient,P = model significance, DAICc = change in AICc score from top model, wi = AICc model weight, ER = top model weight divided by model i weight.
Table 3. Results of Model Selection using AICc for Seven Linear Regression Models that DescribePeriphyton AFDM
Model k R2 P DAICc wi ER
1. 2007 salmon density + SRP 4 0.49 <0.001 0.00 0.66 1.00
2. 2007 salmon density + SRP + soak time 5 0.52 0.002 1.55 0.30 2.17
3. 2007 salmon density 3 0.24 0.02 6.66 0.02 27.88
4. 2007 salmon density + soak time 4 0.24 0.05 9.25 0.01 102.10
5. SRP 3 0.15 0.06 9.28 0.01 103.54
6. SRP + soak time 4 0.18 0.12 11.20 0.00 269.94
7. Soak time 3 0.00 0.84 13.04 0.00 679.35
SRP = soluble reactive phosphorus, soak time = number of days the tiles were in the stream. SRP and AFDM were log10-transformed and 2007 salmon density was square-roottransformed. Table headings are as described in Table 2.
1028 J. J. Verspoor and others Author's personal copy
for the other five models was poor (DAICc > 3).
We present observed versus fitted plots for the top
model and untransformed bivariate plots of the
individual explanatory variables versus chl a for
comparison (Figure 3).
DISCUSSION
Nitrogen Stable Isotope Signature
We found a positive log-linear relationship between
2004–2007 upstream salmon abundance and the
Figure 3. Bivariate plots
of observed versus fitted
values for the top model
of A log10 ash-free dry
mass (AFDM, mg cm-2)
and B log10 chlorophyll
a (chl a, lg cm-2), which
both contain �2007
salmon density (fish m-2)
and log10 soluble reactive
phosphorus (SRP, lg l-1)
as explanatory variables,
fitted with regression
(dashed) and 1:1 (solid)
lines. Bivariate plots of
C AFDM versus SRP,
D chl a versus SRP,
E AFDM versus 2007
salmon density, and F chl
a versus 2007 salmon
density. Although SRP,
AFDM, and chl a were
log10-transformed and
2007 salmon density was
square-root transformed
in the analyses, the
bivariate plots are
presented untransformed.
Table 4. Results of Model Selection using AICc for Seven Linear Regression Models that DescribePeriphyton chl a
Model k R2 P DAICc wi ER
1. 2007 salmon density + SRP 4 0.33 0.02 0.00 0.52 1.00
2. SRP 3 0.18 0.04 1.78 0.21 2.43
3. 2007 salmon density + SRP + soak time 5 0.33 0.04 3.23 0.10 5.02
4. SRP + soak time 4 0.18 0.12 4.68 0.05 10.41
5. 2007 salmon density 3 0.08 0.19 4.70 0.05 10.51
6. Soak time 3 0.05 0.30 5.41 0.03 14.98
7. 2007 salmon density + soak time 4 0.14 0.20 5.85 0.03 18.61
SRP = soluble reactive phosphorus, soak time = number of days the tiles were in the stream. SRP and chl a were log10-transformed and 2007 salmon density was square-roottransformed. Table headings are as described in Table 2.
Quantitative Links Between Pacific Salmon and Stream Periphyton 1029 Author's personal copy
nitrogen stable isotope signature (d15N) of stream
periphyton across 24 streams in north-central British
Columbia. This study is among the first to describe
periphyton d15N across a gradient in salmon abun-
dance (also see Holtgrieve and others 2010). Rela-
tionships between d15N and salmon abundance have
previously been shown for juvenile coho salmon,
terrestrial invertebrates, and riparian soil and vege-
tation (Bilby and others 2001; Reimchen and others
2003; Bartz and Naiman 2005; Hocking and Reim-
chen 2009).
Although we fit a log-linear model, the rela-
tionship between salmon abundance and
periphyton d15N should actually be a positive
function that saturates as the contribution of sal-
mon nitrogen to periphyton d15N nears 100%.
However, the periphyton d15N values in this study
were low relative to the d15N of sockeye salmon,
suggesting they were far from saturated with sal-
mon nitrogen. That periphyton derived most of
their nitrogen from sources other than salmon is
supported by the results of the 2-source mixing
model, which estimated the highest proportion of
salmon nitrogen across the 24 streams to be just
22%. This number is sensitive to the d15N chosen
for all non-salmon sources of nitrogen, which var-
ied widely among the ‘‘control’’ sites used to esti-
mate it. Therefore, although the contribution of
salmon nitrogen to periphyton d15N is low, the
values attributed by the mixing-model are highly
uncertain. It is likely that salmon nitrogen would
have made a greater contribution to periphyton
d15N in years when sockeye populations in the re-
gion were at higher abundances. In the early 1990s,
the number of adult salmon summed across the 24
streams was typically greater than 70,000 fish,
whereas it was just 20,000 fish from 2004 to 2007.
We expected three environmental variables
(temperature, light, and water velocity) to affect
periphyton d15N (Table 1a). Of the three variables,
periphyton d15N was best described by gradient,
which was used as a proxy for water velocity.
Water velocity can control the rate at which the
dissolved nitrogen available to periphyton is
replenished, which influences the rate of uptake of
the different isotopes (Trudeau and Rasmussen
2003). However, gradient poorly explained varia-
tion in periphyton d15N compared to salmon
abundance, particularly after removing the outlier,
Leo Creek. This suggests that salmon abundance
had a stronger influence on periphyton d15N than
any environmental variable we measured. This is
the first study to explicitly consider the relative
influence of salmon nutrients and environmental
variables on periphyton d15N. Although stream
gradient may have indicated relative differences
among streams, it is a poor metric for water velocity
at the individual tile sites. It is also positively cor-
related with substrate size and larger substrate
could potentially reduce water velocity at the
streambed through greater rugosity. Direct mea-
surement of water velocity at the individual tile site
may have described periphyton d15N better.
We tested one single-year and two multi-year
salmon abundance metrics. The single-year metric
represented the maximum possible exposure to
salmon nutrients delivered during the 2007
spawning period, whereas the multi-year metrics
captured the possible contribution of salmon
nutrients from previous years. The two multi-year
metrics differed in their consideration of salmon
that spawned upstream of where we collected the
periphyton. Our results suggest that salmon nitro-
gen accumulated among years in the watershed,
including upstream, contributed to periphyton
d15N. Studies could confirm this nutrient legacy
through stable isotopes of dissolved inorganic
nitrogen prior to spawning. It was possible to test
for this nutrient legacy for two reasons. First, 2007
salmon numbers were the lowest in decades. Only
4,500 sockeye returned across all 24 streams com-
pared to the 4-year average of 20,000. Second, the
dominant year of the 4-year population cycle
exhibited in these sockeye populations was in 2005
when 51,000 salmon returned across all streams
and delivered a much larger nutrient subsidy.
Although we initially calculated multi-year metrics
according to different rates of salmon nutrient loss
from the watershed, high correlation among them
prevented a test for the timeframe of the nutrient
legacy.
Periphyton Abundance
Periphyton abundance was best described by a
combination of salmon density and environmental
variables. Both AFDM and chl a were negatively
related to 2007 salmon density and positively re-
lated to pre-spawning SRP concentrations, al-
though the model fit was better for AFDM. Only a
small amount of variation in either AFDM or chl
a was explained by tile soak time.
We measured six environmental variables (water
temperature, light availability, dissolved phospho-
rus and nitrogen, grazer abundance, and watershed
size) that were predicted to affect periphyton
abundance (Table 1b). Of these, pre-spawning SRP
best described periphyton abundance, suggesting
that phosphorus may limit periphyton growth in
the streams. Dissolved nutrient concentrations
1030 J. J. Verspoor and others Author's personal copy
prior to spawning could be influenced by salmon-
derived nutrients retained in the watershed from
previous years. For example, phosphorus contained
in the salmon skeleton, which degrades slowly,
may be released into the streams over several years.
This could explain the weak positive correlation we
found between 2006 upstream salmon abundance
and pre-spawning SRP after removing the outlying
Leo Creek (r = 0.42, P = 0.044).
As pre-spawning SRP positively described
periphyton abundance after spawning, it might be
expected that the additional phosphorus deliv-
ered during spawning would further increase
periphyton abundance. In contrast, we found a
negative relationship among streams between
2007 salmon density and periphyton abundance.
This result suggests that during the spawning
period, salmon exerted a greater influence on
periphyton abundance through substrate distur-
bance than by the nutrient subsidy they provided.
Further, as periphyton samples were collected up
to 6 weeks post-spawning after some recovery in
abundance had probably occurred, our results
likely underestimate the initial ecological effect of
substrate disturbance by spawning salmon.
Periphyton recovery might have been impeded by
decreasing water temperatures and lower light
levels, as a result of decreasing day length. The
general finding that salmon exert a greater influ-
ence on periphyton abundance through substrate
disturbance than the nutrient subsidy they provide
is consistent with research on sockeye streams in
Alaska that found decreases in periphyton abun-
dance during spawning in streams with a salmon
abundance above 0.06 salmon m-2 (Moore and
Schindler 2008).
However, a positive relationship, above a
threshold value of 300 kg of carcass (dry weight)
per unit discharge, has previously been described
between salmon biomass per unit discharge and chl
a across multiple sites and years within three of our
study streams (Johnston and others 2004). In their
study from 1996 to 1998, salmon density was up to
an order of magnitude greater than in this study
and chl a was substantially higher at their high
salmon abundance sites. As both the salmon
nutrient contribution and degree of substrate dis-
turbance should be greater at higher salmon
abundance, the contrast in results is puzzling. The
relative importance of the two mechanisms could
differ as a result of temporal variation in environ-
mental variables such as temperature or discharge
(for example, Chaloner and others 2007). Another
possibility is that results differ according to spatial
scale (3 streams versus 24 streams) or whether
periphyton is collected from experimental sub-
strates (our study) or natural ones (Johnston and
others 2004).
Periphyton abundance at a single point in time
does not measure primary productivity directly.
Periphyton growth rates could in fact be high when
abundances are low if periphyton removal is ele-
vated. Indeed, spawning salmon could simulta-
neously have increased periphyton growth rates
through the nutrient subsidy and reduced
periphyton abundance through spawning activi-
ties. Larger populations of invertebrate grazers
could also reduce periphyton abundance and be
supported by elevated periphyton growth rates.
However, invertebrate grazer abundance has gen-
erally been shown to decrease during salmon
spawning through both displacement from sub-
strate disturbance and the evolution of life history
strategies whereby emergence from the streams is
timed to avoid being in the stream during salmon
spawning (Lessard and Merritt 2006; Moore and
Schindler 2008; Honea and Gara 2009; Lessard and
others 2009; Moore and Schindler 2010). As we
found that pre-spawning grazer abundance did not
explain significant variation in periphyton abun-
dance, this suggests that salmon spawning was the
primary driver of reduced abundance.
In conclusion, although salmon abundance was
positively related to periphyton nitrogen stable
isotope signatures it was negatively related to
periphyton abundance. Thus, uptake of salmon-
derived nitrogen does not always translate into
increased periphyton abundance. This suggests
that the physical disturbance of spawning salmon
outweighs the immediate influence of the nutri-
ents they deliver. This finding suggests that at-
tempts to incorporate the wider ecological role of
salmon into conservation management (for
example, DFO 2005) should be viewed with cau-
tion when using stable isotopes as a proxy for di-
rect evidence of the impacts of salmon on
freshwater ecosystems. However, our use of stable
isotopes to provide evidence for a nutrient legacy
from previous years suggests that salmon nutrients
could have ecological impacts in freshwater eco-
systems beyond the year in which they were
delivered. We found that dissolved phosphorus
levels prior to spawning, which are correlated with
past salmon abundances, also described periphyton
abundance. This both confirms the need to con-
sider the effect of environmental variables on
relationships between salmon and their ecosys-
tems and presents evidence that stream produc-
tivity may be increased as a result of long-term
salmon nutrient loading.
Quantitative Links Between Pacific Salmon and Stream Periphyton 1031 Author's personal copy
ACKNOWLEDGEMENTS
We thank our primary funder, the Fraser Salmon
and Watersheds Program, as well as the Natural
Sciences and Engineering Research Council of
Canada, the Watershed Watch Salmon Society, the
Northern Scientific Training Program, and Fisheries
and Oceans Canada (DFO). We appreciate help
from DFO staff, including David Patterson, Herb
Herunter, Erland MacIsaac, Tracy Cone, Dennis
Klassen, Kerry Parish, and Keri Benner for logistical
support, the water nutrient analyses, and valuable
advice on the field sites. We acknowledge the
contribution of lab space and equipment for the chl
a and AFDM analyses by Wendy Palen and Leah
Bendell, respectively. We appreciate field support
from Rudi Verspoor and Mike Sawyer and lab
support from Morgan Stubbs, Tereza Zagar, and
Jenn Blancard. We thank Marianne Fish, Morgan
Hocking, Phil Molloy, Wendy Palen, and John
Richardson for help with the manuscript.
REFERENCES
Ambrose HE, Wilzbach MA, Cummins KW. 2004. Periphyton
response to increased light and salmon carcass introduction in
northern California streams. J N Am Benthol Soc 23:701–12.
Anderson DR. 2008. Model based inference in the life sci-
ences—a primer on evidence. New York, USA: Springer.
APHA (American Public Health Association). 1989. Standard
methods for the examination of waste and wastewater. 17th
edn. Washington (DC): American Public Health Association,
American Water Works Association, and Water Pollution
Control Federation.
Baker TT, Wertheimer AC, Burkett RD, Dunlap R, Eggers DM,
Fritts EI, Gharrett AJ, Holmes RA, Wilmot RL. 1996. Status of
Pacific salmon and steelhead escapements in southeastern
Alaska. Fisheries 21:6–18.
Bartz KK, Naiman RJ. 2005. Effects of salmon-borne nutrients
on riparian soils and vegetation in southwest Alaska. Ecosys-
tems 8:529–45.
Biggs BJF. 1996. Patterns in benthic algae of streams. In: Ste-
venson RJ, Bothwell ML, Lowe RL, Eds. Algal ecology:
freshwater benthic ecosystems. San Diego: Academic Press,
Elsevier Inc.
Bilby RE, Fransen BR, Bisson PA. 1996. Incorporation of nitro-
gen and carbon from spawning coho salmon into the trophic
system of small streams: evidence from stable isotopes. Can J
Fish Aquat Sci 53:164–73.
Bilby RE, Fransen BR, Walter JK, Scarlett WJ. 2001. Preliminary
evaluation of the use of nitrogen stable isotope ratios to
establish escapement levels for Pacific salmon. Fisheries
26:6–14.
Borchardt MA. 1996. Nutrients. In: Stevenson RJ, Bothwell ML,
Lowe RL, Eds. Algal ecology: freshwater benthic ecosystems.
San Diego: Academic Press, Elsevier Inc.
Chaloner DT, Martin KM, Wipfli MS, Ostrom PH, Lamberti GA.
2002. Marine carbon and nitrogen in southeastern Alaska
stream food webs: evidence from artificial and natural
streams. Can J Fish Aquat Sci 59:1257–65.
Chaloner DT, Lamberti GA, Merritt RW, Mitchell NL, Ostrom
PH, Wipfli MS. 2004. Variation in responses to spawning Pa-
cific salmon among three south-eastern Alaska streams.
Freshw Biol 49:587–99.
Chaloner DT, Lamberti GA, Cak AD, Blair NL, Edwards RT.
2007. Inter-annual variation in responses of water chemistry
and epilithon to Pacific salmon spawners in an Alaskan
stream. Freshw Biol 52:478–90.
Claeson SM, Li JL, Compton JE, Bisson PA. 2006. Response of
nutrients, biofilm, and benthic insects to salmon carcass
addition. Can J Fish Aquat Sci 63:1230–41.
DeNicola DM. 1996. Periphtyon responses to temperature at
different ecological levels. In: Stevenson RJ, Bothwell ML,
Lowe RL, Eds. Algal ecology: freshwater benthic ecosystems.
San Diego: Academic Press, Elsevier Inc.
DFO (Fisheries and Oceans Canada). 2005. Canada’s policy for
conservation of wild Pacific salmon. Vancouver, BC, Canada.
http://www.pac.dfo-mpo.gc.ca/publications/pdfs/wsp-eng.
pdf.
Friberg N, Dybkjaer JB, Olafsson JS, Gislason GM, Larsen SE,
Lauridsen TL. 2009. Relationships between structure and
function in streams contrasting in temperature. Freshw Biol
54:2051–68.
Gende SM, Edwards RT, Willson MF, Wipfli MS. 2002. Pacific
salmon in aquatic and terrestrial ecosystems. Bioscience
52:917–28.
Gresh T, Lichatowich J, Schoonmaker P. 2000. An estimation of
historic and current levels of salmon production in the
Northeast Pacific ecosystem: evidence of a nutrient deficit in
the freshwater systems of the Pacific Northwest. Fisheries
25:15–21.
Hassan MA, Gottesfeld AS, Montgomery DR, Tunnicliffe JF,
Clarke GKC, Wynn G, Jones-Cox H, Poirier R, MacIsaac E,
Herunter H, Macdonald SJ. 2008. Salmon-driven bed load
transport and bed morphology in mountain streams. Geophys
Res Lett 35:6.
Hill W. 1996. Effects of light. In: Stevenson RJ, Bothwell ML,
Lowe RL, Eds. Algal ecology: freshwater benthic ecosystems.
San Diego: Academic Press, Elsevier Inc.
Hocking MD, Reimchen TE. 2009. Salmon species, density and
watershed size predict magnitude of marine enrichment in
riparian food webs. Oikos 118:1307–18.
Holm-Hansen O, Riemann B. 1978. Chlorophyll a determina-
tion: improvements in methodology. Oikos 30:438–47.
Holtgrieve GW, Schindler DE, Gowell CP, Ruff CP, Lisi PJ. 2010.
Stream geomorphology regulates the effects of ecosystem
engineering and nutrient enrichment by Pacific salmon on
periphyton. Freshw Biol. doi:10.1111/j.1365-2427.2010.024
89.x.
Honea JM, Gara RI. 2009. Macroinvertebrate community
dynamics: strong negative response to salmon redd construc-
tion and weak response to salmon-derived nutrient uptake.
J N Am Benthol Soc 28:207–19.
Howe HF, Zorn-Arnold B, Sullivan A, Brown JS. 2006. Massive
and distinctive effects of meadow voles on grassland vegeta-
tion. Ecology 87:3007–13.
Janetski DJ, Chaloner DT, Tiegs SD, Lamberti GA. 2009. Pacific
salmon effects on stream ecosystems: a quantitative synthesis.
Oecologia 159:583–95.
Johnson SP, Schindler DE. 2009. Trophic ecology of Pacific sal-
mon (Oncorhynchus spp.) in the ocean: a synthesis of stable
isotope research. Ecol Res 24:855–63.
1032 J. J. Verspoor and others Author's personal copy
Johnston NT, MacIsaac EA, Tschaplinski PJ, Hall KJ. 2004. Ef-
fects of the abundance of spawning sockeye salmon (On-
corhynchus nerka) on nutrients and algal biomass in forested
streams. Can J Fish Aquat Sci 61:384–403.
Kline TCJ, Goering JJ, Mathisen OA, Poe PH, Parker PL. 1990.
Recycling of elements transported upstream by runs of Pacific
salmon I. Delta Nitrogen-15 and Delta Carbon-13 evidence in
Sashin Creek Southeastern Alaska USA. Can J Fish Aquat Sci
47:136–44.
Kohler AE, Rugenski A, Taki D. 2008. Stream food web response
to a salmon carcass analogue addition in two central Idaho,
USA streams. Freshw Biol 53:446–60.
Lamberti GA. 1996. The role of periphyton in benthic food webs.
In: Stevenson RJ, Bothwell ML, Lowe RL, Eds. Algal ecology:
freshwater benthic ecosystems. San Diego: Academic Press,
Elsevier Inc.
Lamberti GA, Steinman AD. 1997. A comparison of primary
production in stream ecosystems. J N Am Benthol Soc
16:95–104.
Lessard JL, Merritt RW. 2006. Influence of marine-derived
nutrients from spawning salmon on aquatic insect commu-
nities in southeast Alaskan streams. Oikos 113:334–43.
Lessard JL, Merritt RW, Berg MB. 2009. Investigating the effect
of marine-derived nutrients from spawning salmon on
macroinvertebrate secondary production in southeast Alaskan
streams. J N Am Benthol Soc 28:683–93.
Levy DA, Wood CC. 1992. Review of proposed mechanisms for
sockeye salmon population cycles in the Fraser River. Bull
Math Biol 54:241–61.
Macdonald JS, Scrivener JC, Smith G. 1992. The Stuart-Takla
fisheries/forestry interaction project: study description and
design. Canadian Technical Report of Fisheries and Aquatic
Sciences No. 1899.
MacLeod NA, Barton DR. 1998. Effects of light intensity, water
velocity, and species composition on carbon and nitrogen
stable isotope ratios in periphyton. Can J Fish Aquat Sci
55:1919–25.
McNaughton SJ. 1985. Ecology of a grazing ecosystem—the
Serengeti. Ecol Monogr 55:259–94.
Merritt R, Cummins K, Berg M. 2008. An introduction to the
aquatic insects of North America. Dubuque (IA): Kendall/
Hunt Publishing Company.
Minakawa N, Gara RI. 1999. Ecological effects of a chum salmon
(Oncorhynchus keta) spawning run in a small stream of the
Pacific Northwest. J Freshw Ecol 14:327–35.
Minshall GW. 1978. Autotrophy in stream ecosystems. Biosci-
ence 28:767–70.
Mitchell NL, Lamberti GA. 2005. Responses in dissolved nutri-
ents and epilithon abundance to spawning salmon in south-
east Alaska streams. Limnol Oceanogr 50:217–27.
Moore JW, Schindler DE. 2008. Biotic disturbance and benthic
community dynamics in salmon-bearing streams. J Anim Ecol
77:275–84.
Moore JW, Schindler DE. 2010. Spawning salmon and the
phenology of emergence in stream insects. Proc R Soc B.
doi:10.1098/rspb.2009.2342.
Moore JW, Schindler DE, Scheuerell MD. 2004. Disturbance of
freshwater habitats by anadromous salmon in Alaska. Oeco-
logia 139:298–308.
Moore JW, Schindler DE, Carter JL, Fox J, Griffiths J, Holtgrieve
GW. 2007. Biotic control of stream fluxes: Spawning salmon
drive nutrient and matter export. Ecology 88:1278–91.
Moore JW, Schindler DE, Ruff CP. 2008. Habitat saturation
drives thresholds in stream subsidies. Ecology 89:306–12.
Naiman RJ, Bilby RE, Schindler DE, Helfield JM. 2002. Pacific
salmon, nutrients, and the dynamics of freshwater and
riparian ecosystems. Ecosystems 5:399–417.
Nehlsen W, Williams JE, Lichatowich JA. 1991. Pacific Salmon
at the crossroads—stocks at risk from California, Oregon,
Idaho, and Washington. Fisheries 16:4–21.
Peterson DP, Foote CJ. 2000. Disturbance of small-stream hab-
itat by spawning sockeye salmon in Alaska. Trans Am Fish Soc
129:924–34.
Peterson M, Matthews R. 2009. Retention of salmon-derived N
and P by bryophytes and microbiota in mesocosm streams. J N
Am Benthol Soc 28:352–9.
Polis GA, Anderson WB, Holt RD. 1997. Toward an integration
of landscape and food web ecology: the dynamics of spatially
subsidized food webs. Annu Rev Ecol Syst 28:289–316.
R Development Core Team. 2009. R: a language and environ-
ment for statistical computing. Vienna, Austria: R Foundation
for Statistical Computing.
Rand PS, Hall CAS, McDowell WH, Ringler NH, Kennen JG.
1992. Factors limiting primary productivity in Lake-Ontario
tributaries receiving salmon migrations. Can J Fish Aquat Sci
49:2377–85.
Reimchen TE, Mathewson DD, Hocking MD, Moran J, Harris
D. 2003. Isotopic evidence for enrichment of salmon-de-
rived nutrients in vegetation, soil, and insects in Riparian
zones in coastal British Columbia. In: Stockner JG, Ed.
Nutrients in salmonid ecosystems: sustaining production and
biodiversity. Bethesda: American Fisheries Society Sympo-
sium. pp 59–69.
Schindler DE, Scheuerell MD, Moore JW, Gende SM, Francis TB,
Palen WJ. 2003. Pacific salmon and the ecology of coastal
ecosystems. Front Ecol Environ 1:31–7.
Schindler DE, Leavitt PR, Brock CS, Johnson SP, Quay PD. 2005.
Marine-derived nutrients, commercial fisheries, and produc-
tion of salmon and lake algae in Alaska. Ecology 86:3225–31.
Schuldt JA, Hershey AE. 1995. Effect of Salmon Carcass
Decomposition on Lake-Superior Tributary Streams. J N Am
Benthol Soc 14:259–68.
Slaney TL, Hyatt KD, Northcote TG, Fielden RJ. 1996. Status of
anadromous salmon and trout in British Columbia and Yu-
kon. Fisheries 21:20–35.
Steinman AD. 1996. Effects of grazers on freshwater benthic
algae. In: Stevenson RJ, Bothwell ML, Lowe RL, Eds. Algal
ecology: freshwater benthic ecosystems. San Diego: Academic
Press, Elsevier Inc.
Steinman AD, Lamberti GA, Leavitt PR. 2006. Biomass and
pigments of benthic algae. In: Hauer RF, Lamberti GA, Eds.
Methods in stream ecology. San Diego: Academic Press,
Elsevier Inc.
Tiegs SD, Chaloner DT, Levi P, Ruegg J, Tank JL, Lamberti GA.
2008. Timber harvest transforms ecological roles of salmon in
southeast Alaska rain forest streams. Ecol Appl 18:4–11.
Tiegs SD, Campbell EY, Levi PS, Ruegg J, Benbow ME, Cha-
loner DT, Merritt RW, Tank JL, Lamberti GA. 2009. Sepa-
rating physical disturbance and nutrient enrichment caused
by Pacific salmon in stream ecosystems. Freshw Biol
54:1864–75.
Trudeau V, Rasmussen JB. 2003. The effect of water velocity on
stable carbon and nitrogen isotope signatures of periphyton.
Limnol Oceanogr 48:2194–9.
Quantitative Links Between Pacific Salmon and Stream Periphyton 1033 Author's personal copy

Wipfli MS, Hudson J, Caouette J. 1998. Influence of salmon
carcasses on stream productivity: response of biofilm and
benthic macroinvertebrates in southeastern Alaska, USA. Can
J Fish Aquat Sci 55:1503–11.
Wipfli MS, Hudson JP, Chaloner DT, Caouette JR. 1999. Influ-
ence of salmon spawner densities on stream productivity in
Southeast Alaska. Can J Fish Aquat Sci 56:1600–11.
Wright JP, Jones CG. 2004. Predicting effects of ecosystem
engineers on patch-scale species richness from primary pro-
ductivity. Ecology 85:2071–81.
Zuur AF, Ieno EN, Elphick CS. 2010. A protocol for data
exploration to avoid common statistical problems. Methods
Ecol Evol 1:3–14.
1034 J. J. Verspoor and others Author's personal copy