Embed Size (px)
Citation preview
I TI T
June 8, 2020June 8, 2020
World of App(opportunitie)s: A Techolution AheadWorld of App(opportunitie)s: A Techolution Ahead
Edelweiss Securities LimitedSandip Agarwal+91 22 6623 [email protected]
Pranav Kshatriya+91 22 [email protected]
1 Edelweiss Securities Limited
IT
World of App(opportunitie)s: Techolution Ahead
We believe the Indian IT sector will enter a high-growth phase with stocks poised to return
20-56% upside and near-term downside risk limited to 10%. Our anti-consensus conviction
(our revenue/EPS is 2-8%/2-17% higher than Street) is much higher now than our “Most
bullish in a decade “stance two years ago and is based on the following key arguments:
(1) Recent commentaries of global 200 companies (contribute >50% revenue to Indian
tech) indicate sharp cuts in non-tech capex and higher allocation towards technology.
Past cycles indicate benefits of higher allocation flow across the value chain and should
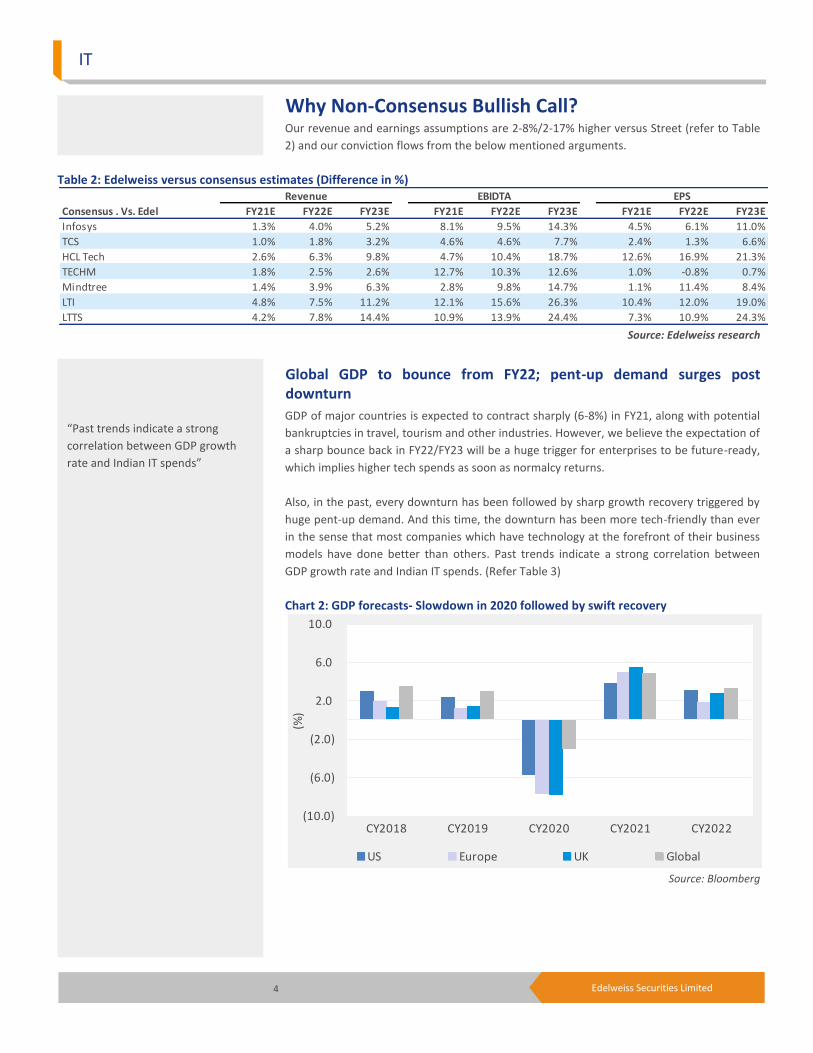
benefit Indian outsourcers significantly. For instance, Microsoft’s hyper growth has
benefitted Mindtree immensely (Refer Chart 1) (Microsoft 4-year CAGR 12.4% vs. its
growth of 32.5% for Mindtree).
(2) COVID-19 is a boon for technology players as it has forced exponential use of apps and
platforms, right from online shopping to e-learning to telemedicine. This has led to a
technological revolution or “Techolution” which will drive technological spend across
the value chain. The biggest beneficiary will be cloud providers as increased data usage
will accelerate migration to efficient frontier or Cloud. For instance, Microsoft reported
61% YoY spurt in its cloud business in the last reported quarter.
(3) Digital spends will accelerate led by substantial jump in online sales/activity/change in
clients’ behaviour accentuated by COVID-19. The higher online activity will channelise
traditional marketing spends towards digital, evident from Facebook’s results as well.
(4) High growth (25-30%) in Digital Services to lead to further demand-supply mismatch of
talent in clients’ markets, thereby keeping pricing stable for outsourcing players.
Moreover, cost reduction initiatives owing to COVID-19 (e-travel, e-meetings, e-
appraisals) will enable enterprises to restructure and re-innovate their business
substantially to keep their margins stable, excluding currency fluctuations.
(5) Substantial cash flow generation capability, higher earnings visibility, reasonable
valuation and higher ESG ranking imply significant multiple expansion going forward.
The downside risk of 10% in near term to our “bullish” call emanates from: (1) falling
GDP rates of major countries (estimated to contract 6-8% in FY21), bankruptcies in a
few global clients & a wash out FY21 for tech players; and (2) upcoming political events
in key markets & high unemployment rates, which could further fuel protectionist
voices in the near term. Currency fluctuations and regulatory changes could be
additional risks.
Hence, we are revising up our earnings (2-20%), multiples (10-15%) and target prices (25-
36%) across the sector and basing target prices on FY22E earnings. Our targeted return is
20-56% in base case scenario. Recommend ‘BUY’ on HCL Tech (HCLT), Tech Mahindra
(TechM), Infosys & TCS (upgrade to ‘BUY’) in large caps and LTTS, Mindtree & LTI in the
mid-cap space.
2 Edelweiss Securities Limited
IT
Outlook: Techolution to accelerate growth-Cash generation/ESG ratings expand multiples.
1) Techolution (ignited by Apps) further fueled by COVID-19 will lead to substantial jump in
global technology spends, implying higher revenue growth for Indian players along with cost
optimisation. 2) Substantial cash generation capability with robust distribution policy. 3)
Higher ranking of most tech companies on ESG parameters will keep large focused funds’
interest in them ticking. These three factors, we believe, will trigger substantial multiple
expansion coupled with significant upgrade in earnings over the next one year.
This prompts us to revise up our earnings, multiples and target prices across the spectrum
and estimate 20-56% return in the base case scenario with a near-term downside risk of
10%. We recommend ‘BUY’ on HCLT, TechM, Infosys & TCS (upgrade to ‘BUY’) in large caps
and LTTS, Mindtree & LTI in the mid-cap space, in that order of preference.
We upgrade TCS to ‘BUY’ primarily because: 1) Many of the global 200 companies are its
clients and higher spends by them will catapult TCS’s growth rate as well. 2) Its high cash
distribution, top-notch ESG ranking, meticulous execution and strong leadership imply
higher investor interest during an uptrend. We also revise up the company’s earnings 9%,
multiple to 24x (from 20x) and TP to INR2,310 (from INR1,708).
3 Edelweiss Securities Limited
Sector Update
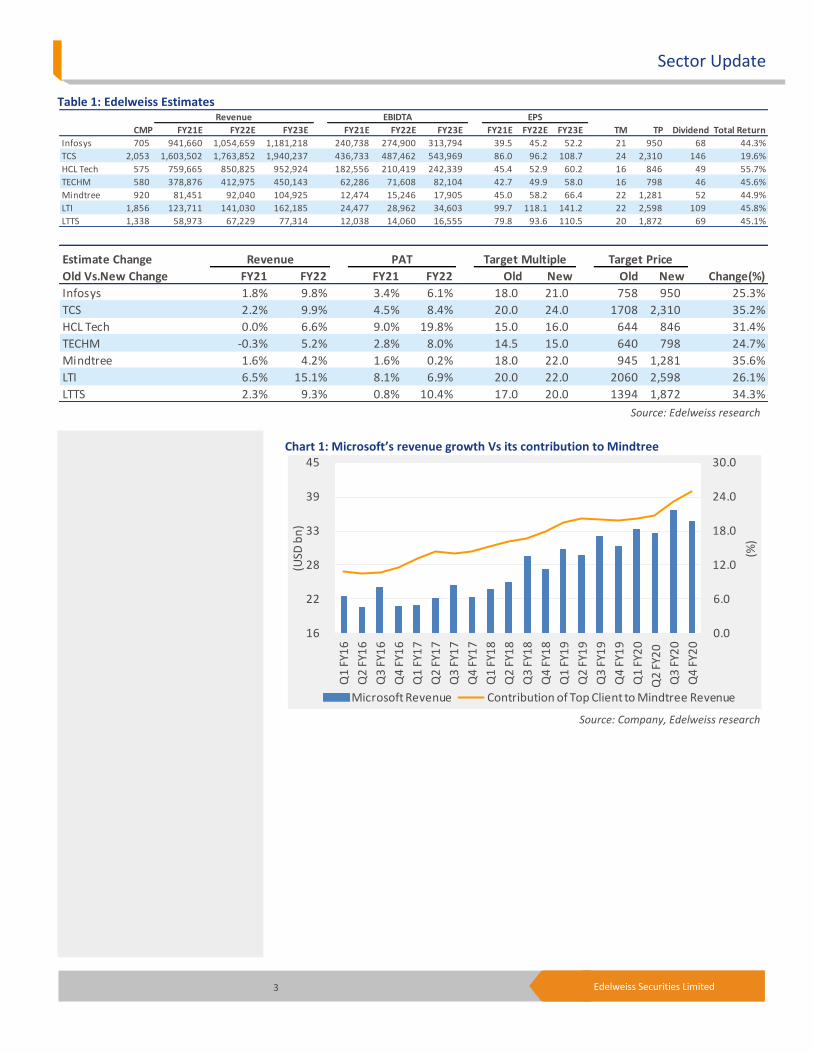
Table 1: Edelweiss Estimates
Source: Edelweiss research
Chart 1: Microsoft’s revenue growth Vs its contribution to Mindtree
Source: Company, Edelweiss research
CMP FY21E FY22E FY23E FY21E FY22E FY23E FY21E FY22E FY23E
Infosys 705 941,660 1,054,659 1,181,218 240,738 274,900 313,794 39.5 45.2 52.2 21 950 68 44.3%
TCS 2,053 1,603,502 1,763,852 1,940,237 436,733 487,462 543,969 86.0 96.2 108.7 24 2,310 146 19.6%
HCL Tech 575 759,665 850,825 952,924 182,556 210,419 242,339 45.4 52.9 60.2 16 846 49 55.7%
TECHM 580 378,876 412,975 450,143 62,286 71,608 82,104 42.7 49.9 58.0 16 798 46 45.6%
Mindtree 920 81,451 92,040 104,925 12,474 15,246 17,905 45.0 58.2 66.4 22 1,281 52 44.9%
LTI 1,856 123,711 141,030 162,185 24,477 28,962 34,603 99.7 118.1 141.2 22 2,598 109 45.8%
LTTS 1,338 58,973 67,229 77,314 12,038 14,060 16,555 79.8 93.6 110.5 20 1,872 69 45.1%
Total ReturnTM TP Dividend
Revenue EBIDTA EPS
Estimate Change
Old Vs.New Change FY21 FY22 FY21 FY22 Old New Old New Change(%)
Infosys 1.8% 9.8% 3.4% 6.1% 18.0 21.0 758 950 25.3%
TCS 2.2% 9.9% 4.5% 8.4% 20.0 24.0 1708 2,310 35.2%
HCL Tech 0.0% 6.6% 9.0% 19.8% 15.0 16.0 644 846 31.4%
TECHM -0.3% 5.2% 2.8% 8.0% 14.5 15.0 640 798 24.7%
Mindtree 1.6% 4.2% 1.6% 0.2% 18.0 22.0 945 1,281 35.6%
LTI 6.5% 15.1% 8.1% 6.9% 20.0 22.0 2060 2,598 26.1%
LTTS 2.3% 9.3% 0.8% 10.4% 17.0 20.0 1394 1,872 34.3%
Revenue PAT Target PriceTarget Multiple
0.0
6.0
12.0
18.0
24.0
30.0
16
22
28
33
39
45
Q1
FY1
6
Q2
FY1
6
Q3
FY1
6
Q4
FY1
6
Q1
FY1
7
Q2
FY1
7
Q3
FY1
7
Q4
FY1
7
Q1
FY1
8
Q2
FY1
8
Q3
FY1
8
Q4
FY1
8
Q1
FY1
9
Q2
FY1
9
Q3
FY1
9
Q4
FY1
9
Q1
FY2
0
Q2
FY2
0
Q3
FY2
0
Q4
FY2
0
(%)
(USD
bn
)
Microsoft Revenue Contribution of Top Client to Mindtree Revenue
4 Edelweiss Securities Limited
IT
Why Non-Consensus Bullish Call? Our revenue and earnings assumptions are 2-8%/2-17% higher versus Street (refer to Table
2) and our conviction flows from the below mentioned arguments.
Table 2: Edelweiss versus consensus estimates (Difference in %)
Source: Edelweiss research
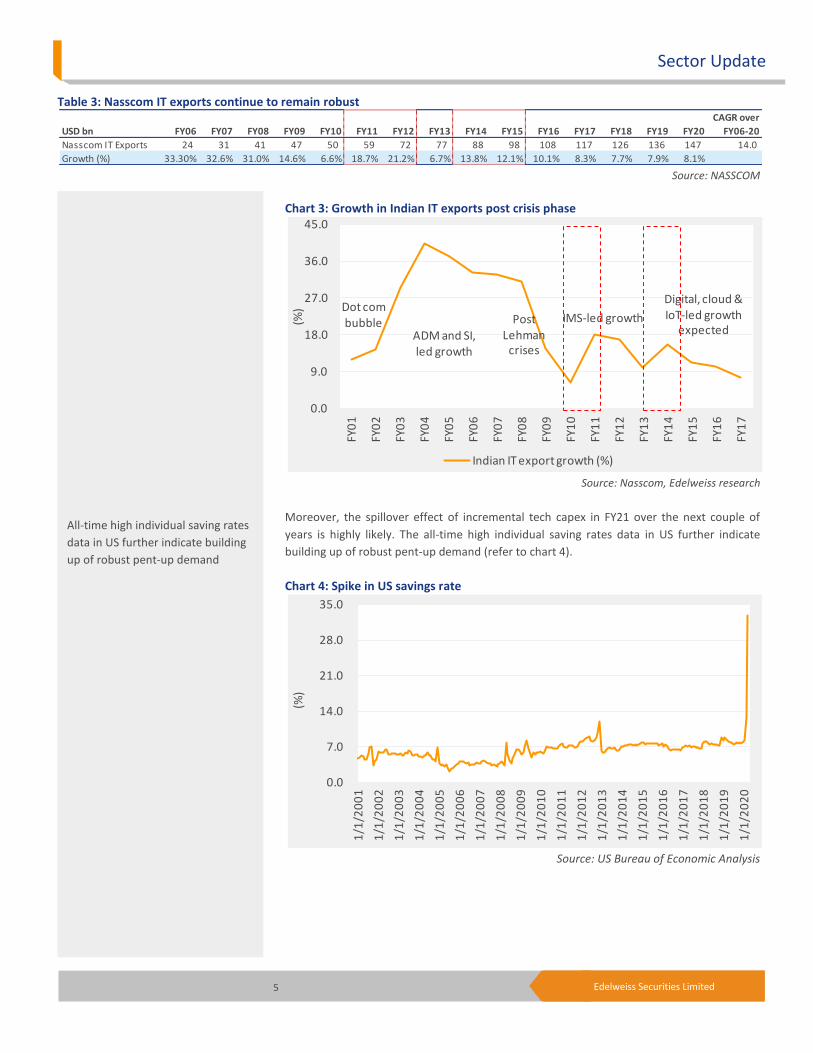
Global GDP to bounce from FY22; pent-up demand surges post downturn
GDP of major countries is expected to contract sharply (6-8%) in FY21, along with potential
bankruptcies in travel, tourism and other industries. However, we believe the expectation of
a sharp bounce back in FY22/FY23 will be a huge trigger for enterprises to be future-ready,
which implies higher tech spends as soon as normalcy returns.
Also, in the past, every downturn has been followed by sharp growth recovery triggered by
huge pent-up demand. And this time, the downturn has been more tech-friendly than ever
in the sense that most companies which have technology at the forefront of their business
models have done better than others. Past trends indicate a strong correlation between
GDP growth rate and Indian IT spends. (Refer Table 3)
Chart 2: GDP forecasts- Slowdown in 2020 followed by swift recovery
Source: Bloomberg
Consensus . Vs. Edel FY21E FY22E FY23E FY21E FY22E FY23E FY21E FY22E FY23E
Infosys 1.3% 4.0% 5.2% 8.1% 9.5% 14.3% 4.5% 6.1% 11.0%
TCS 1.0% 1.8% 3.2% 4.6% 4.6% 7.7% 2.4% 1.3% 6.6%
HCL Tech 2.6% 6.3% 9.8% 4.7% 10.4% 18.7% 12.6% 16.9% 21.3%
TECHM 1.8% 2.5% 2.6% 12.7% 10.3% 12.6% 1.0% -0.8% 0.7%
Mindtree 1.4% 3.9% 6.3% 2.8% 9.8% 14.7% 1.1% 11.4% 8.4%
LTI 4.8% 7.5% 11.2% 12.1% 15.6% 26.3% 10.4% 12.0% 19.0%
LTTS 4.2% 7.8% 14.4% 10.9% 13.9% 24.4% 7.3% 10.9% 24.3%
Revenue EBIDTA EPS
(10.0)
(6.0)
(2.0)
2.0
6.0
10.0
CY2018 CY2019 CY2020 CY2021 CY2022
(%)
US Europe UK Global
“Past trends indicate a strong
correlation between GDP growth
rate and Indian IT spends”
5 Edelweiss Securities Limited
Sector Update
Table 3: Nasscom IT exports continue to remain robust
Source: NASSCOM
Chart 3: Growth in Indian IT exports post crisis phase
Source: Nasscom, Edelweiss research
Moreover, the spillover effect of incremental tech capex in FY21 over the next couple of
years is highly likely. The all-time high individual saving rates data in US further indicate
building up of robust pent-up demand (refer to chart 4).
Chart 4: Spike in US savings rate
Source: US Bureau of Economic Analysis
USD bn FY06 FY07 FY08 FY09 FY10 FY11 FY12 FY13 FY14 FY15 FY16 FY17 FY18 FY19 FY20
CAGR over
FY06-20
Nasscom IT Exports 24 31 41 47 50 59 72 77 88 98 108 117 126 136 147 14.0
Growth (%) 33.30% 32.6% 31.0% 14.6% 6.6% 18.7% 21.2% 6.7% 13.8% 12.1% 10.1% 8.3% 7.7% 7.9% 8.1%
0.0
9.0
18.0
27.0
36.0
45.0
FY0
1
FY0
2
FY0
3
FY0
4
FY0
5
FY0
6
FY0
7
FY0
8
FY0
9
FY1
0
FY1
1
FY1
2
FY1
3
FY1
4
FY1
5
FY1
6
FY1
7
(%)
Indian IT export growth (%)
ADM and SI, led growth
PostLehman
crises
Digital, cloud & IoT-led growth
expectedIMS-led growth
Dot combubble
0.0
7.0
14.0
21.0
28.0
35.0
1/1
/20
01
1/1
/20
02
1/1
/20
03
1/1
/20
04
1/1
/20
05
1/1
/20
06
1/1
/20
07
1/1
/20
08
1/1
/20
09
1/1
/20
10
1/1
/20
11
1/1
/20
12
1/1
/20
13
1/1
/20
14
1/1
/20
15
1/1
/20
16
1/1
/20
17
1/1
/20
18
1/1
/20
19
1/1
/20
20
(%)
All-time high individual saving rates
data in US further indicate building
up of robust pent-up demand
6 Edelweiss Securities Limited
IT
Global 200 Commentaries Buoyant On Tech Spends Global tech companies to allocate more budgets to technology
Recent commentaries of global 200 companies (contribute >50% to revenues of large Indian
IT companies) indicate sharp cuts in non-tech capex and higher allocation towards
technology. Past cycles indicate benefits flow across the value chain and should benefit
Indian IT outsourcers this time as well. Most companies are showing much higher
commitment to technology versus earlier to bridge over the operational advantages which
their competitors have gained during the current pandemic.
Satya Nadella, Microsoft CEO, succinctly noted that Microsoft has “seen two years’ worth
of digital transformation in two months.”
Read across global tech giants’ latest commentaries clearly suggests robust investments in
technology going forward:
1. Facebook has said it has made significant investments in infrastructure in the past four
years and will continue to do so this year as well. It is also actively investing in gaming
with mobile apps which entail massive amount of growth in live streaming. Its CEO
Mark Zuckerberg said, “we plan to continue to invest in product development and to
recruit technical talent.”
2. Microsoft has also outlined that it will continue to make significant investments in
strategic growth opportunities organically and through strategic acquisitions. It also
expects a material increase in capital expenditures to support growing usage and
demand for cloud services.
3. Alphabet has highlighted it will invest in long-term priorities but be mindful in the short
term. Consequently, hiring will be in the slower lane and investments in data centers,
marketing and travel will be recalibrated. It continues to invest in areas like search,
machine learning and Google cloud. Investments in technical infrastructure are also
expected to increase.
4. Amazon mentioned that while it will continue to invest aggressively in technology
platforms across business lines, it has also recruited 1,75,000 people in fulfillment and
delivery network to meet increased consumer demand.
Most companies are showing much
higher commitment to technology
7 Edelweiss Securities Limited
Sector Update
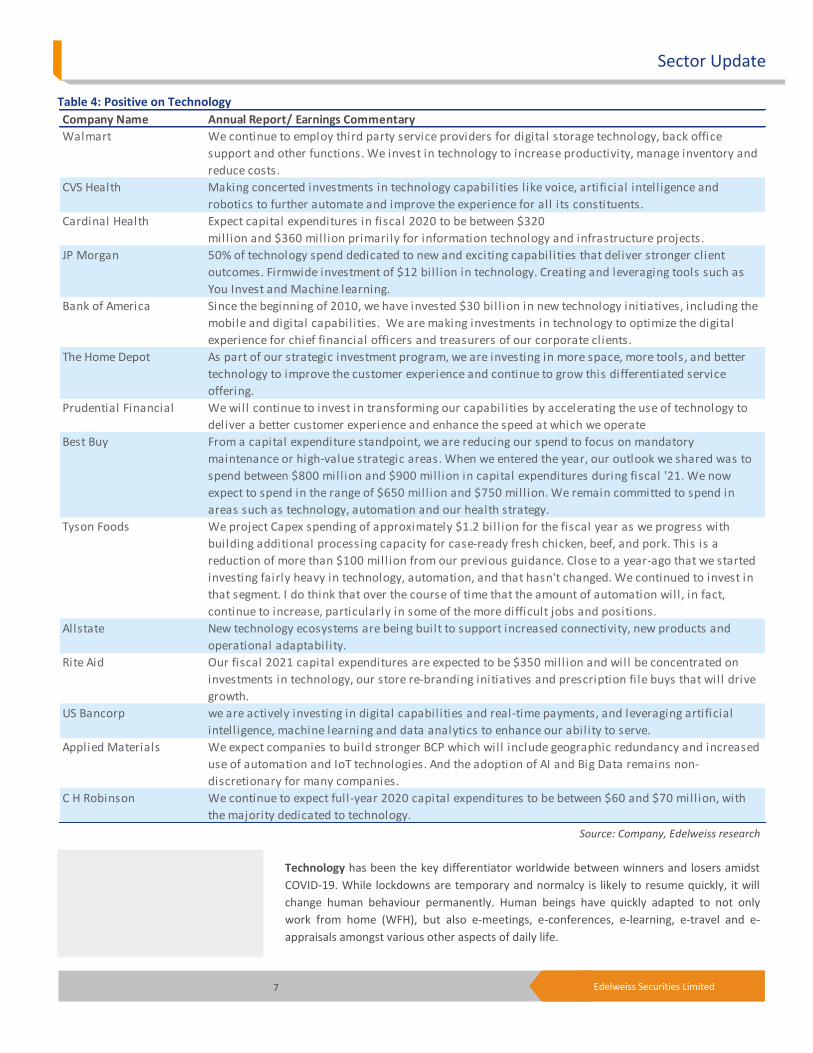
Table 4: Positive on Technology
Source: Company, Edelweiss research
Technology has been the key differentiator worldwide between winners and losers amidst
COVID-19. While lockdowns are temporary and normalcy is likely to resume quickly, it will
change human behaviour permanently. Human beings have quickly adapted to not only
work from home (WFH), but also e-meetings, e-conferences, e-learning, e-travel and e-
appraisals amongst various other aspects of daily life.
Company Name Annual Report/ Earnings Commentary
Walmart We continue to employ third party service providers for digital storage technology, back office
support and other functions. We invest in technology to increase productivity, manage inventory and
reduce costs.
CVS Health Making concerted investments in technology capabilities l ike voice, artificial intelligence and
robotics to further automate and improve the experience for all its constituents.
Cardinal Health Expect capital expenditures in fiscal 2020 to be between $320
million and $360 mill ion primarily for information technology and infrastructure projects.
JP Morgan 50% of technology spend dedicated to new and exciting capabilities that deliver stronger client
outcomes. Firmwide investment of $12 bill ion in technology. Creating and leveraging tools such as
You Invest and Machine learning.
Bank of America Since the beginning of 2010, we have invested $30 bill ion in new technology initiatives, including the
mobile and digital capabilities. We are making investments in technology to optimize the digital
experience for chief financial officers and treasurers of our corporate clients.
The Home Depot As part of our strategic investment program, we are investing in more space, more tools, and better
technology to improve the customer experience and continue to grow this differentiated service
offering.
Prudential Financial We will continue to invest in transforming our capabilities by accelerating the use of technology to
deliver a better customer experience and enhance the speed at which we operate
Best Buy From a capital expenditure standpoint, we are reducing our spend to focus on mandatory
maintenance or high-value strategic areas. When we entered the year, our outlook we shared was to
spend between $800 mill ion and $900 mill ion in capital expenditures during fiscal '21. We now
expect to spend in the range of $650 mill ion and $750 mill ion. We remain committed to spend in
areas such as technology, automation and our health strategy.
Tyson Foods We project Capex spending of approximately $1.2 bill ion for the fiscal year as we progress with
building additional processing capacity for case-ready fresh chicken, beef, and pork. This is a
reduction of more than $100 mill ion from our previous guidance. Close to a year-ago that we started
investing fairly heavy in technology, automation, and that hasn't changed. We continued to invest in
that segment. I do think that over the course of time that the amount of automation will, in fact,
continue to increase, particularly in some of the more difficult jobs and positions.
Allstate New technology ecosystems are being built to support increased connectivity, new products and
operational adaptability.
Rite Aid Our fiscal 2021 capital expenditures are expected to be $350 mill ion and will be concentrated on
investments in technology, our store re-branding initiatives and prescription fi le buys that will drive
growth.
US Bancorp we are actively investing in digital capabilities and real-time payments, and leveraging artificial
intelligence, machine learning and data analytics to enhance our ability to serve.
Applied Materials We expect companies to build stronger BCP which will include geographic redundancy and increased
use of automation and IoT technologies. And the adoption of AI and Big Data remains non-
discretionary for many companies.
C H Robinson We continue to expect full-year 2020 capital expenditures to be between $60 and $70 mill ion, with
the majority dedicated to technology.
8 Edelweiss Securities Limited
IT
We also believe with lockdowns slowly opening up and things returning to normal,
companies will re-evaluate their tech budgets with a positive bias. In fact, our channel
checks with global tech experts reveal that most companies have started realising the
importance of technology platforms and are keen to enhance investments in improving
technology.
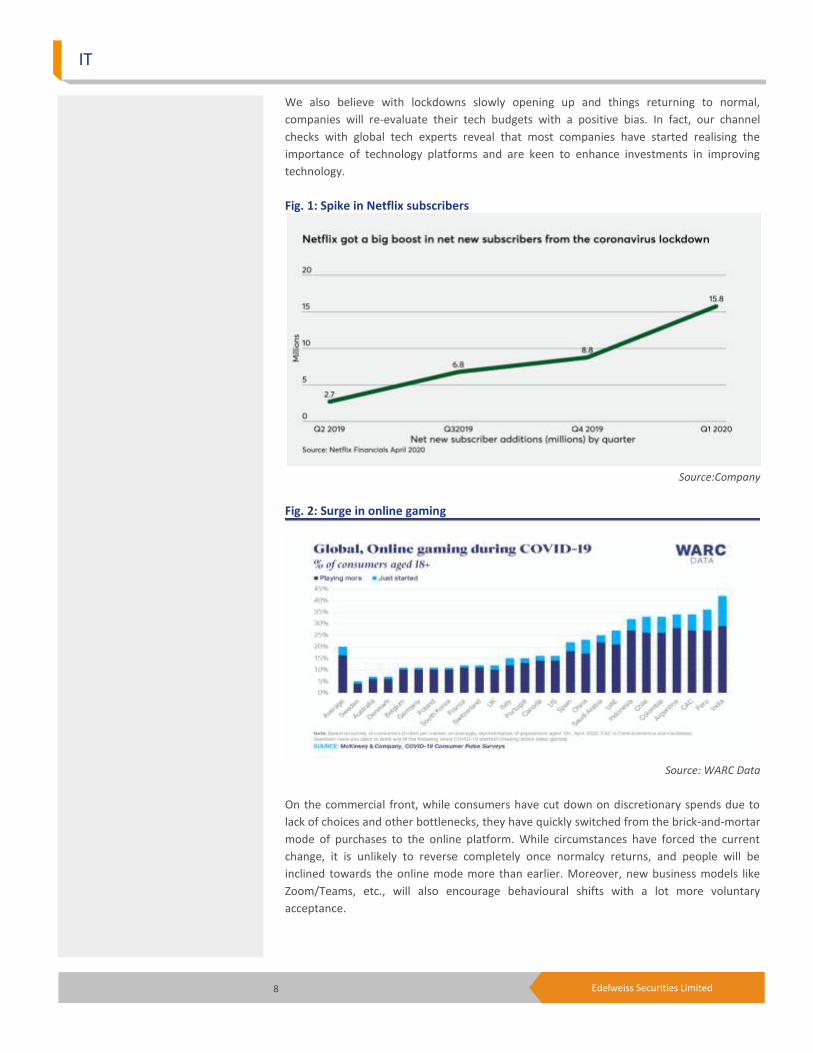
Fig. 1: Spike in Netflix subscribers
Source:Company
Fig. 2: Surge in online gaming
Source: WARC Data
On the commercial front, while consumers have cut down on discretionary spends due to
lack of choices and other bottlenecks, they have quickly switched from the brick-and-mortar
mode of purchases to the online platform. While circumstances have forced the current
change, it is unlikely to reverse completely once normalcy returns, and people will be
inclined towards the online mode more than earlier. Moreover, new business models like
Zoom/Teams, etc., will also encourage behavioural shifts with a lot more voluntary
acceptance.
9 Edelweiss Securities Limited
Sector Update
Having said that, we are cognizant of potential bankruptcies which could be triggered in
sectors worst hit by COVID-19---travel, tourism, hospitality, traditional retail, etc. Hence, we
are building in some revenue loss and bad debts in our FY21 estimates, leading to weak
near-term forecast. A few major companies that have filed for bankruptcy include Diamond
Offshore Drilling, Frontier Communications, Gold’s Gym, Intelsat, J.Crew, John Varvatos
Enterprises, Neiman Marcus, Stage Stores, True Religion Apparel, Ultra Petroleum, Virgin
Australia, Whiting Petroleum, Avianca and Foodora.
Global tech companies have always fueled growth of Indian players
We connect the dots between Indian players’ revenue growth, which is currently digital
services-led, and growth of FAANG/similar ecosystems-based enterprises. Indian digital
services and FAANG have logged exemplary growth due to similar genes, i.e., the “World of
apps”- you can buy/sell/see anything at a click. We note the confluence of connectivity
(broadband speeds and affordable smartphones), social platforms (Facebook, Twitter, etc)
and agile storages (such as the cloud) is fueling explosion of the data ecosystem and has
been further accentuated due to the current pandemic, which has rendered the world
immobile.
For instance, Microsoft’s phenomenal growth has clearly fueled substantial spurt in
Mindtree’s revenue from it. Microsoft currently contributes 24.8% to Mindtree’s revenue
and has posted 32.5% CAGR over the past 4 years.
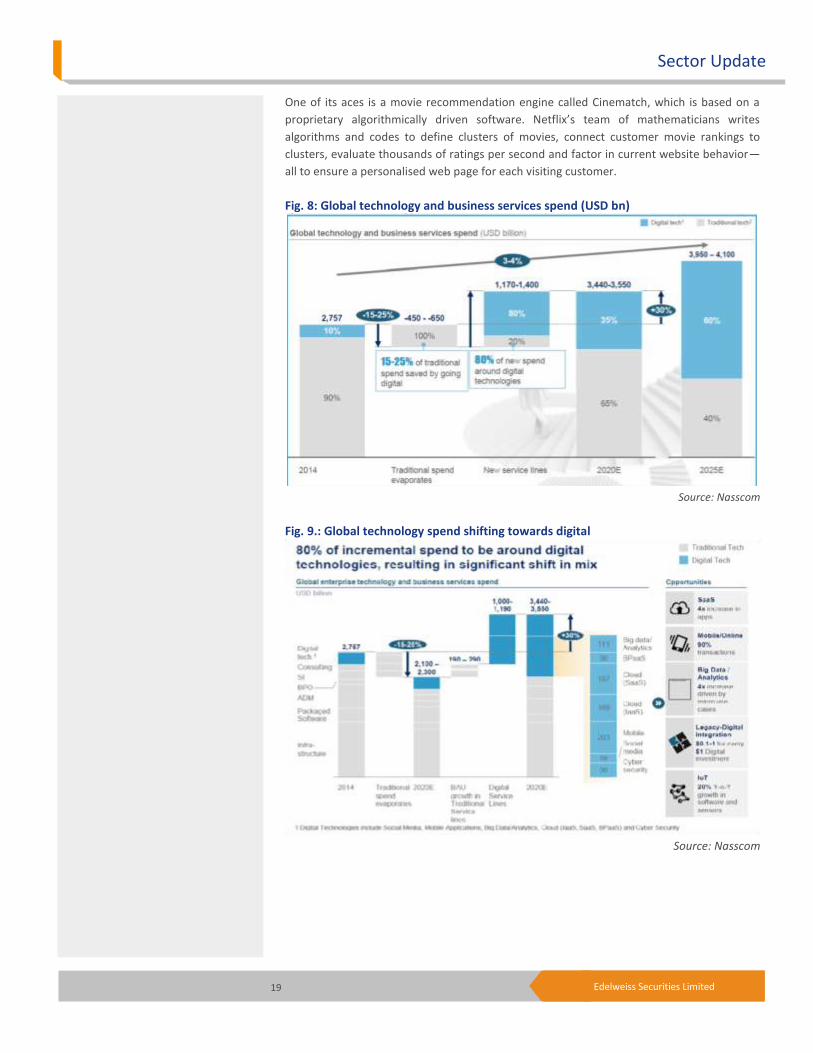
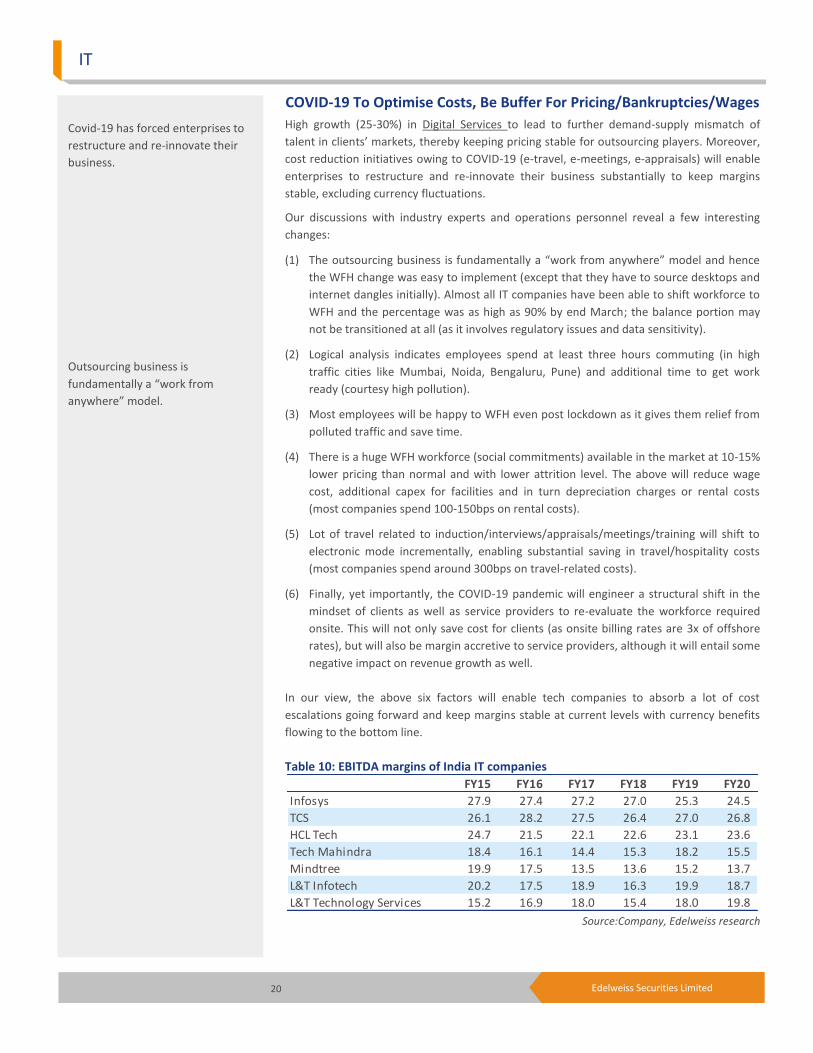
Nasscom forecasts global technology services spends to jump to USD4.0tn in FY25 from
USD2.8tn in FY15, with digital (including IoT) forming 60% of business, logging a
phenomenal 10-year CAGR of 24%. It also predicts Indian IT services to catapult to a
USD350bn industry from USD147bn with digital (including IoT) making up substantial
portion of the business and logging a dazzling 10-year CAGR of 40% over the period.
Covid-19 has triggered bankruptcies
across travel, hospitality and
tourism industry
10 Edelweiss Securities Limited
IT
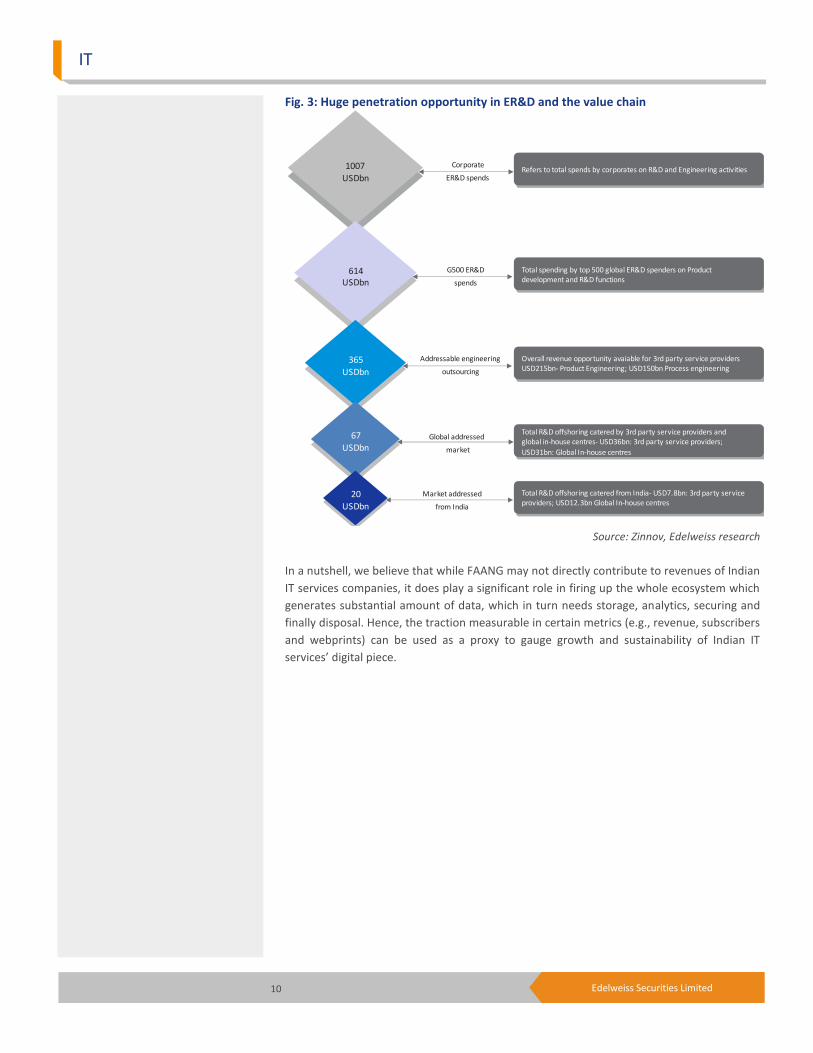
Fig. 3: Huge penetration opportunity in ER&D and the value chain
Source: Zinnov, Edelweiss research
In a nutshell, we believe that while FAANG may not directly contribute to revenues of Indian
IT services companies, it does play a significant role in firing up the whole ecosystem which
generates substantial amount of data, which in turn needs storage, analytics, securing and
finally disposal. Hence, the traction measurable in certain metrics (e.g., revenue, subscribers
and webprints) can be used as a proxy to gauge growth and sustainability of Indian IT
services’ digital piece.
20
USDbn
67
USDbn
365
USDbn
614USDbn
1007
USDbn
Corporate
ER&D spends
G500 ER&D
spends
Addressable engineering
outsourcing
Global addressed
market
Market addressed
from India
Refers to total spends by corporates on R&D and Engineering activities
Total spending by top 500 global ER&D spenders on Product development and R&D functions
Overall revenue opportunity avaiable for 3rd party service providers USD215bn- Product Engineering; USD150bn Process engineering
Total R&D offshoring catered by 3rd party service providers and global in-house centres- USD36bn: 3rd party service providers;
USD31bn: Global In-house centres
Total R&D offshoring catered from India- USD7.8bn: 3rd party service providers; USD12.3bn Global In-house centres
11 Edelweiss Securities Limited
Sector Update
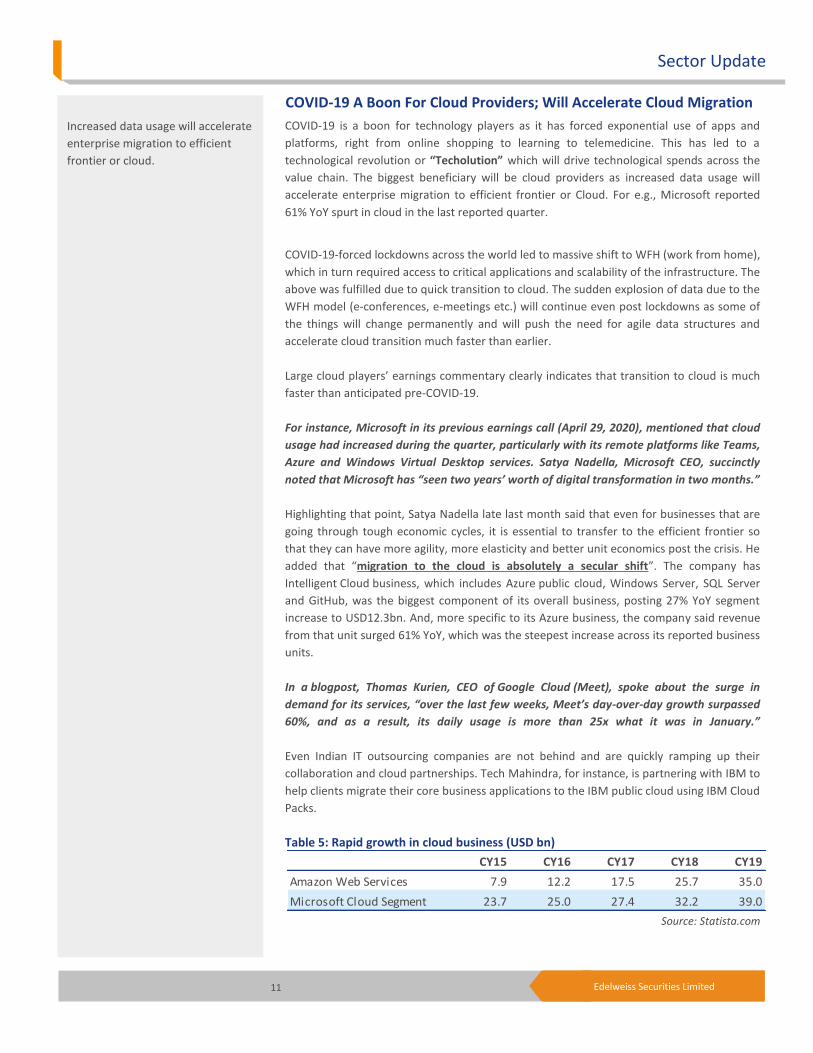
COVID-19 A Boon For Cloud Providers; Will Accelerate Cloud Migration
COVID-19 is a boon for technology players as it has forced exponential use of apps and
platforms, right from online shopping to learning to telemedicine. This has led to a
technological revolution or “Techolution” which will drive technological spends across the
value chain. The biggest beneficiary will be cloud providers as increased data usage will
accelerate enterprise migration to efficient frontier or Cloud. For e.g., Microsoft reported
61% YoY spurt in cloud in the last reported quarter.
COVID-19-forced lockdowns across the world led to massive shift to WFH (work from home),
which in turn required access to critical applications and scalability of the infrastructure. The
above was fulfilled due to quick transition to cloud. The sudden explosion of data due to the
WFH model (e-conferences, e-meetings etc.) will continue even post lockdowns as some of
the things will change permanently and will push the need for agile data structures and
accelerate cloud transition much faster than earlier.
Large cloud players’ earnings commentary clearly indicates that transition to cloud is much
faster than anticipated pre-COVID-19.
For instance, Microsoft in its previous earnings call (April 29, 2020), mentioned that cloud
usage had increased during the quarter, particularly with its remote platforms like Teams,
Azure and Windows Virtual Desktop services. Satya Nadella, Microsoft CEO, succinctly
noted that Microsoft has “seen two years’ worth of digital transformation in two months.”
Highlighting that point, Satya Nadella late last month said that even for businesses that are
going through tough economic cycles, it is essential to transfer to the efficient frontier so
that they can have more agility, more elasticity and better unit economics post the crisis. He
added that “migration to the cloud is absolutely a secular shift”. The company has
Intelligent Cloud business, which includes Azure public cloud, Windows Server, SQL Server
and GitHub, was the biggest component of its overall business, posting 27% YoY segment
increase to USD12.3bn. And, more specific to its Azure business, the company said revenue
from that unit surged 61% YoY, which was the steepest increase across its reported business
units.
In a blogpost, Thomas Kurien, CEO of Google Cloud (Meet), spoke about the surge in
demand for its services, “over the last few weeks, Meet’s day-over-day growth surpassed
60%, and as a result, its daily usage is more than 25x what it was in January.”
Even Indian IT outsourcing companies are not behind and are quickly ramping up their
collaboration and cloud partnerships. Tech Mahindra, for instance, is partnering with IBM to
help clients migrate their core business applications to the IBM public cloud using IBM Cloud
Packs.
Table 5: Rapid growth in cloud business (USD bn)
Source: Statista.com
CY15 CY16 CY17 CY18 CY19
Amazon Web Services 7.9 12.2 17.5 25.7 35.0
Microsoft Cloud Segment 23.7 25.0 27.4 32.2 39.0
Increased data usage will accelerate
enterprise migration to efficient
frontier or cloud.
12 Edelweiss Securities Limited
IT
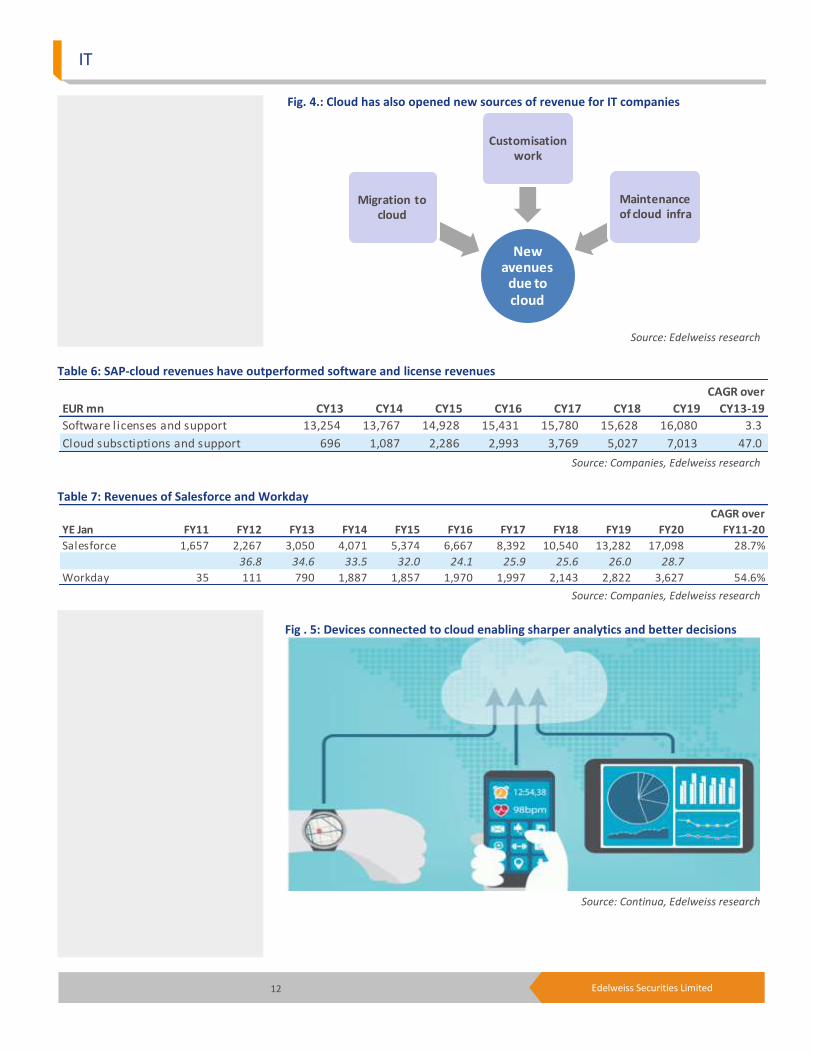
Fig. 4.: Cloud has also opened new sources of revenue for IT companies
Source: Edelweiss research
Table 6: SAP-cloud revenues have outperformed software and license revenues
Source: Companies, Edelweiss research
Table 7: Revenues of Salesforce and Workday
Source: Companies, Edelweiss research
Fig . 5: Devices connected to cloud enabling sharper analytics and better decisions
Source: Continua, Edelweiss research
New avenues
due to cloud
Migration to cloud
Customisation work
Maintenance of cloud infra
EUR mn CY13 CY14 CY15 CY16 CY17 CY18 CY19
CAGR over
CY13-19
Software licenses and support 13,254 13,767 14,928 15,431 15,780 15,628 16,080 3.3
Cloud subsctiptions and support 696 1,087 2,286 2,993 3,769 5,027 7,013 47.0
YE Jan FY11 FY12 FY13 FY14 FY15 FY16 FY17 FY18 FY19 FY20
CAGR over
FY11-20
Salesforce 1,657 2,267 3,050 4,071 5,374 6,667 8,392 10,540 13,282 17,098 28.7%
36.8 34.6 33.5 32.0 24.1 25.9 25.6 26.0 28.7
Workday 35 111 790 1,887 1,857 1,970 1,997 2,143 2,822 3,627 54.6%
13 Edelweiss Securities Limited
Sector Update
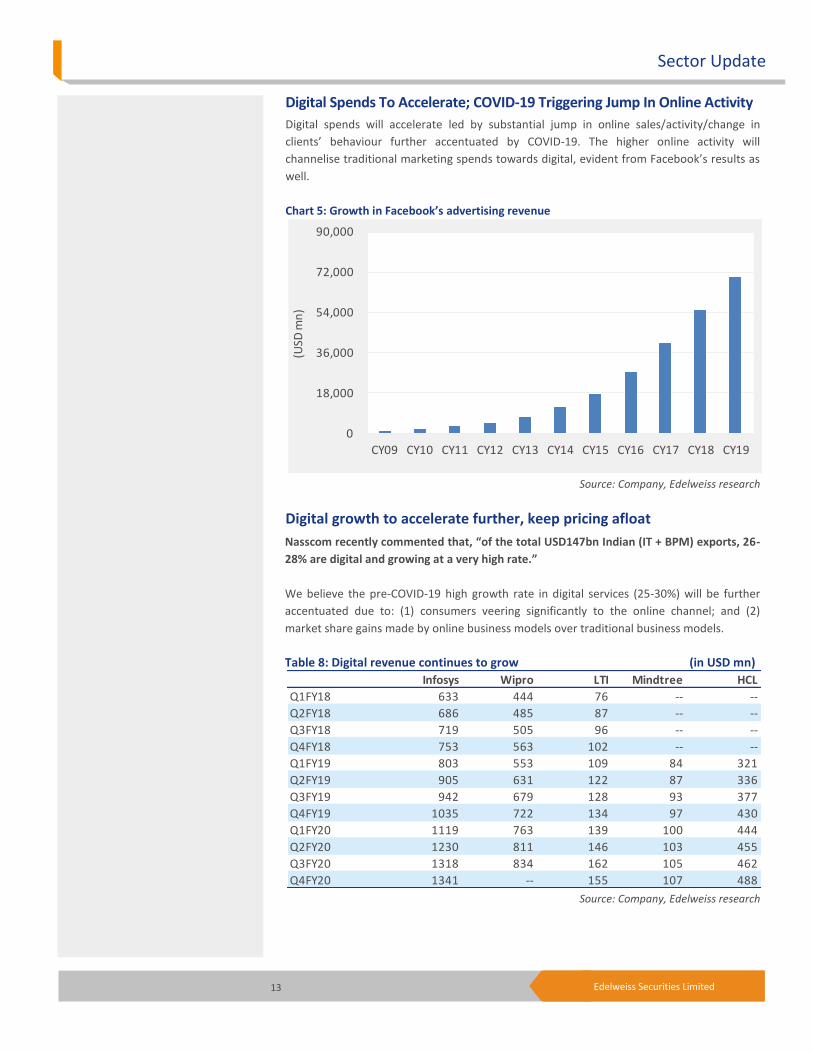
Digital Spends To Accelerate; COVID-19 Triggering Jump In Online Activity
Digital spends will accelerate led by substantial jump in online sales/activity/change in
clients’ behaviour further accentuated by COVID-19. The higher online activity will
channelise traditional marketing spends towards digital, evident from Facebook’s results as
well.
Chart 5: Growth in Facebook’s advertising revenue
Source: Company, Edelweiss research
Digital growth to accelerate further, keep pricing afloat
Nasscom recently commented that, “of the total USD147bn Indian (IT + BPM) exports, 26-
28% are digital and growing at a very high rate.”
We believe the pre-COVID-19 high growth rate in digital services (25-30%) will be further
accentuated due to: (1) consumers veering significantly to the online channel; and (2)
market share gains made by online business models over traditional business models.
Table 8: Digital revenue continues to grow (in USD mn)
Source: Company, Edelweiss research
0
18,000
36,000
54,000
72,000
90,000
CY09 CY10 CY11 CY12 CY13 CY14 CY15 CY16 CY17 CY18 CY19
(USD
mn
)
Infosys Wipro LTI Mindtree HCL
Q1FY18 633 444 76 -- --
Q2FY18 686 485 87 -- --
Q3FY18 719 505 96 -- --
Q4FY18 753 563 102 -- --
Q1FY19 803 553 109 84 321
Q2FY19 905 631 122 87 336
Q3FY19 942 679 128 93 377
Q4FY19 1035 722 134 97 430
Q1FY20 1119 763 139 100 444
Q2FY20 1230 811 146 103 455
Q3FY20 1318 834 162 105 462
Q4FY20 1341 -- 155 107 488
14 Edelweiss Securities Limited
IT
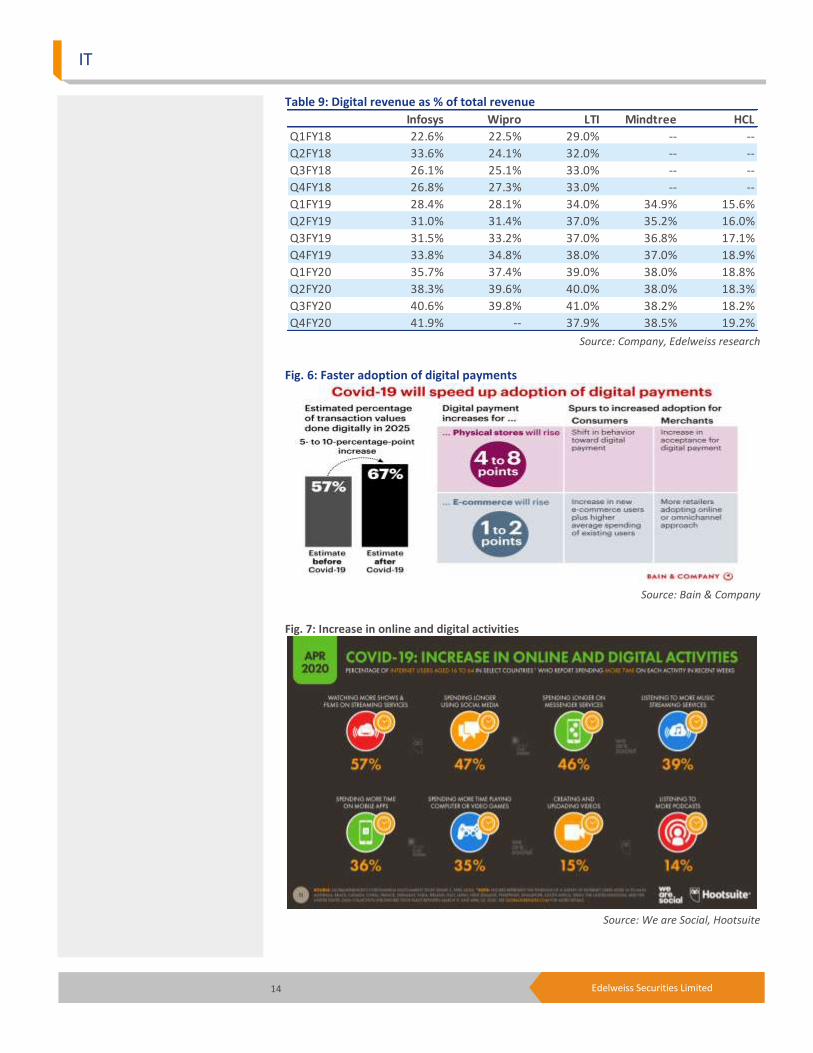
Table 9: Digital revenue as % of total revenue
Source: Company, Edelweiss research
Fig. 6: Faster adoption of digital payments
Source: Bain & Company
Fig. 7: Increase in online and digital activities
Source: We are Social, Hootsuite
Infosys Wipro LTI Mindtree HCL
Q1FY18 22.6% 22.5% 29.0% -- --
Q2FY18 33.6% 24.1% 32.0% -- --
Q3FY18 26.1% 25.1% 33.0% -- --
Q4FY18 26.8% 27.3% 33.0% -- --
Q1FY19 28.4% 28.1% 34.0% 34.9% 15.6%
Q2FY19 31.0% 31.4% 37.0% 35.2% 16.0%
Q3FY19 31.5% 33.2% 37.0% 36.8% 17.1%
Q4FY19 33.8% 34.8% 38.0% 37.0% 18.9%
Q1FY20 35.7% 37.4% 39.0% 38.0% 18.8%
Q2FY20 38.3% 39.6% 40.0% 38.0% 18.3%
Q3FY20 40.6% 39.8% 41.0% 38.2% 18.2%
Q4FY20 41.9% -- 37.9% 38.5% 19.2%
15 Edelweiss Securities Limited
Sector Update
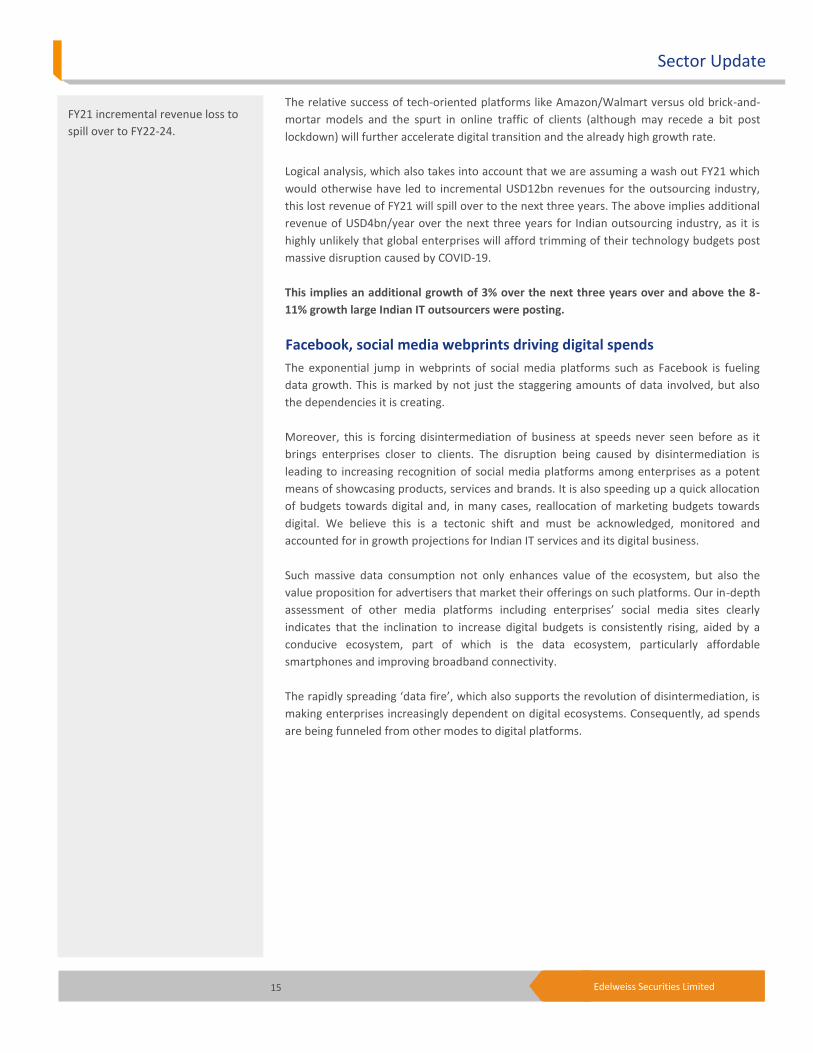
The relative success of tech-oriented platforms like Amazon/Walmart versus old brick-and-
mortar models and the spurt in online traffic of clients (although may recede a bit post
lockdown) will further accelerate digital transition and the already high growth rate.
Logical analysis, which also takes into account that we are assuming a wash out FY21 which
would otherwise have led to incremental USD12bn revenues for the outsourcing industry,
this lost revenue of FY21 will spill over to the next three years. The above implies additional
revenue of USD4bn/year over the next three years for Indian outsourcing industry, as it is
highly unlikely that global enterprises will afford trimming of their technology budgets post
massive disruption caused by COVID-19.
This implies an additional growth of 3% over the next three years over and above the 8-
11% growth large Indian IT outsourcers were posting.
Facebook, social media webprints driving digital spends
The exponential jump in webprints of social media platforms such as Facebook is fueling
data growth. This is marked by not just the staggering amounts of data involved, but also
the dependencies it is creating.
Moreover, this is forcing disintermediation of business at speeds never seen before as it
brings enterprises closer to clients. The disruption being caused by disintermediation is
leading to increasing recognition of social media platforms among enterprises as a potent
means of showcasing products, services and brands. It is also speeding up a quick allocation
of budgets towards digital and, in many cases, reallocation of marketing budgets towards
digital. We believe this is a tectonic shift and must be acknowledged, monitored and
accounted for in growth projections for Indian IT services and its digital business.
Such massive data consumption not only enhances value of the ecosystem, but also the
value proposition for advertisers that market their offerings on such platforms. Our in-depth
assessment of other media platforms including enterprises’ social media sites clearly
indicates that the inclination to increase digital budgets is consistently rising, aided by a
conducive ecosystem, part of which is the data ecosystem, particularly affordable
smartphones and improving broadband connectivity.
The rapidly spreading ‘data fire’, which also supports the revolution of disintermediation, is
making enterprises increasingly dependent on digital ecosystems. Consequently, ad spends
are being funneled from other modes to digital platforms.
FY21 incremental revenue loss to
spill over to FY22-24.
16 Edelweiss Securities Limited
IT
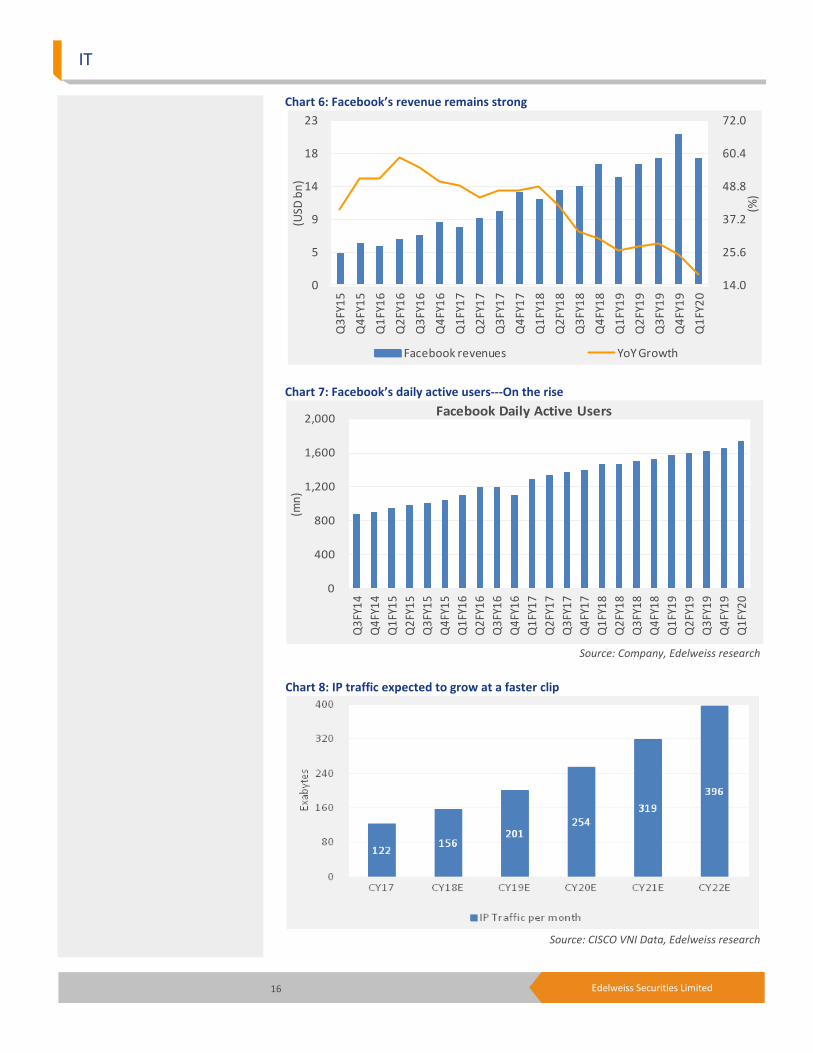
Chart 6: Facebook’s revenue remains strong
Chart 7: Facebook’s daily active users---On the rise
Source: Company, Edelweiss research
Chart 8: IP traffic expected to grow at a faster clip
Source: CISCO VNI Data, Edelweiss research
14.0
25.6
37.2
48.8
60.4
72.0
0
5
9
14
18
23
Q3
FY1
5
Q4
FY1
5
Q1
FY1
6
Q2
FY1
6
Q3
FY1
6
Q4
FY1
6
Q1
FY1
7
Q2
FY1
7
Q3
FY1
7
Q4
FY1
7
Q1
FY1
8
Q2
FY1
8
Q3
FY1
8
Q4
FY1
8
Q1
FY1
9
Q2
FY1
9
Q3
FY1
9
Q4
FY1
9
Q1
FY2
0
(%)
(USD
bn
)
Facebook revenues YoY Growth
0
400
800
1,200
1,600
2,000
Q3
FY1
4
Q4
FY1
4
Q1
FY1
5
Q2
FY1
5
Q3
FY1
5
Q4
FY1
5
Q1
FY1
6
Q2
FY1
6
Q3
FY1
6
Q4
FY1
6
Q1
FY1
7
Q2
FY1
7
Q3
FY1
7
Q4
FY1
7
Q1
FY1
8
Q2
FY1
8
Q3
FY1
8
Q4
FY1
8
Q1
FY1
9
Q2
FY1
9
Q3
FY1
9
Q4
FY1
9
Q1
FY2
0
(mn
)
Facebook Daily Active Users
17 Edelweiss Securities Limited
Sector Update
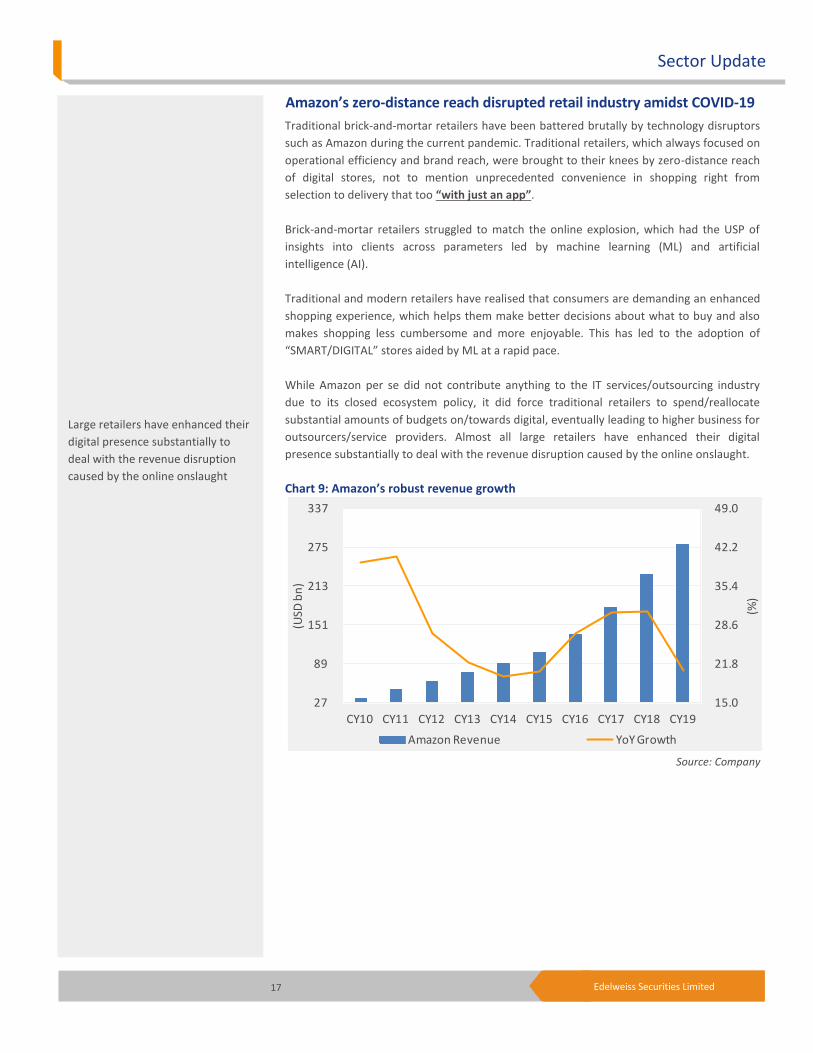
Amazon’s zero-distance reach disrupted retail industry amidst COVID-19
Traditional brick-and-mortar retailers have been battered brutally by technology disruptors
such as Amazon during the current pandemic. Traditional retailers, which always focused on
operational efficiency and brand reach, were brought to their knees by zero-distance reach
of digital stores, not to mention unprecedented convenience in shopping right from
selection to delivery that too “with just an app”.
Brick-and-mortar retailers struggled to match the online explosion, which had the USP of
insights into clients across parameters led by machine learning (ML) and artificial
intelligence (AI).
Traditional and modern retailers have realised that consumers are demanding an enhanced
shopping experience, which helps them make better decisions about what to buy and also
makes shopping less cumbersome and more enjoyable. This has led to the adoption of
“SMART/DIGITAL” stores aided by ML at a rapid pace.
While Amazon per se did not contribute anything to the IT services/outsourcing industry
due to its closed ecosystem policy, it did force traditional retailers to spend/reallocate
substantial amounts of budgets on/towards digital, eventually leading to higher business for
outsourcers/service providers. Almost all large retailers have enhanced their digital
presence substantially to deal with the revenue disruption caused by the online onslaught.
Chart 9: Amazon’s robust revenue growth
Source: Company
15.0
21.8
28.6
35.4
42.2
49.0
27
89
151
213
275
337
CY10 CY11 CY12 CY13 CY14 CY15 CY16 CY17 CY18 CY19
(%)
(USD
bn
)
Amazon Revenue YoY Growth
Large retailers have enhanced their
digital presence substantially to
deal with the revenue disruption
caused by the online onslaught
18 Edelweiss Securities Limited
IT
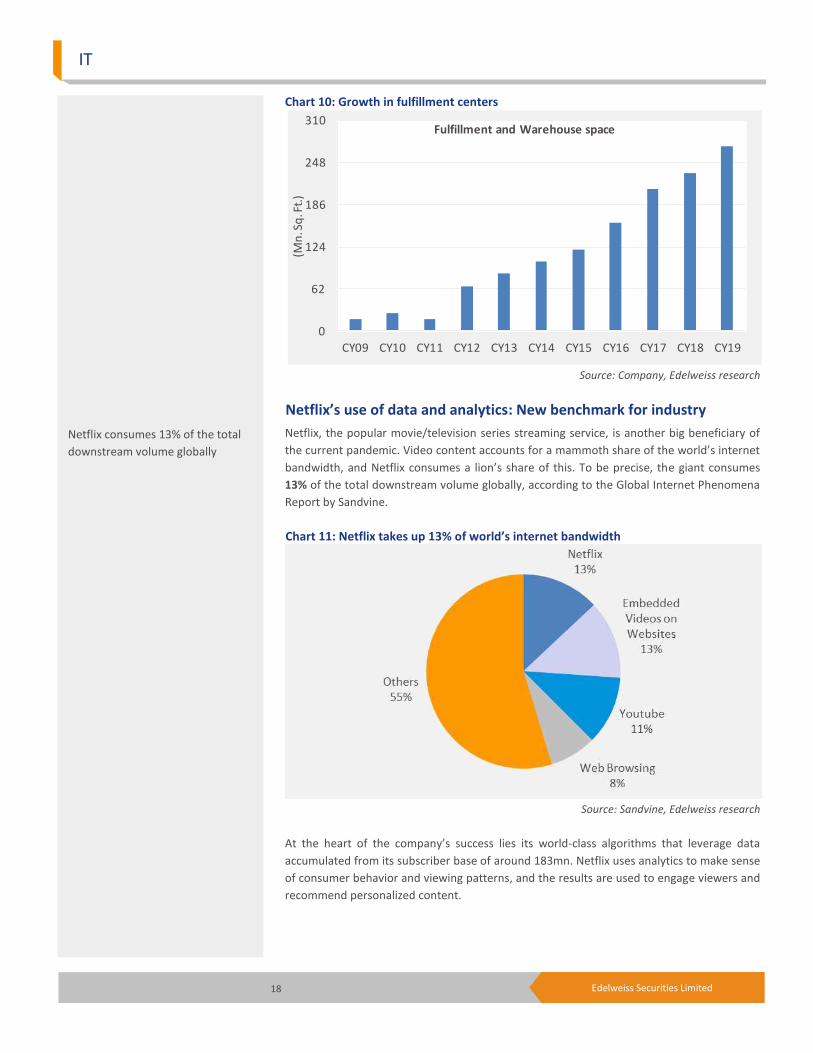
Chart 10: Growth in fulfillment centers
Source: Company, Edelweiss research
Netflix’s use of data and analytics: New benchmark for industry
Netflix, the popular movie/television series streaming service, is another big beneficiary of
the current pandemic. Video content accounts for a mammoth share of the world’s internet
bandwidth, and Netflix consumes a lion’s share of this. To be precise, the giant consumes
13% of the total downstream volume globally, according to the Global Internet Phenomena
Report by Sandvine.
Chart 11: Netflix takes up 13% of world’s internet bandwidth
Source: Sandvine, Edelweiss research
At the heart of the company’s success lies its world-class algorithms that leverage data
accumulated from its subscriber base of around 183mn. Netflix uses analytics to make sense
of consumer behavior and viewing patterns, and the results are used to engage viewers and
recommend personalized content.
0
62
124
186
248
310
CY09 CY10 CY11 CY12 CY13 CY14 CY15 CY16 CY17 CY18 CY19
(Mn
. Sq
. Ft.
)
Fulfillment and Warehouse space
Netflix consumes 13% of the total
downstream volume globally
19 Edelweiss Securities Limited
Sector Update
One of its aces is a movie recommendation engine called Cinematch, which is based on a
proprietary algorithmically driven software. Netflix’s team of mathematicians writes
algorithms and codes to define clusters of movies, connect customer movie rankings to
clusters, evaluate thousands of ratings per second and factor in current website behavior—
all to ensure a personalised web page for each visiting customer.
Fig. 8: Global technology and business services spend (USD bn)
Source: Nasscom
Fig. 9.: Global technology spend shifting towards digital
Source: Nasscom
20 Edelweiss Securities Limited
IT
COVID-19 To Optimise Costs, Be Buffer For Pricing/Bankruptcies/Wages
High growth (25-30%) in Digital Services to lead to further demand-supply mismatch of
talent in clients’ markets, thereby keeping pricing stable for outsourcing players. Moreover,
cost reduction initiatives owing to COVID-19 (e-travel, e-meetings, e-appraisals) will enable
enterprises to restructure and re-innovate their business substantially to keep margins
stable, excluding currency fluctuations.
Our discussions with industry experts and operations personnel reveal a few interesting
changes:
(1) The outsourcing business is fundamentally a “work from anywhere” model and hence
the WFH change was easy to implement (except that they have to source desktops and
internet dangles initially). Almost all IT companies have been able to shift workforce to
WFH and the percentage was as high as 90% by end March; the balance portion may
not be transitioned at all (as it involves regulatory issues and data sensitivity).
(2) Logical analysis indicates employees spend at least three hours commuting (in high
traffic cities like Mumbai, Noida, Bengaluru, Pune) and additional time to get work
ready (courtesy high pollution).
(3) Most employees will be happy to WFH even post lockdown as it gives them relief from
polluted traffic and save time.
(4) There is a huge WFH workforce (social commitments) available in the market at 10-15%
lower pricing than normal and with lower attrition level. The above will reduce wage
cost, additional capex for facilities and in turn depreciation charges or rental costs
(most companies spend 100-150bps on rental costs).
(5) Lot of travel related to induction/interviews/appraisals/meetings/training will shift to
electronic mode incrementally, enabling substantial saving in travel/hospitality costs
(most companies spend around 300bps on travel-related costs).
(6) Finally, yet importantly, the COVID-19 pandemic will engineer a structural shift in the
mindset of clients as well as service providers to re-evaluate the workforce required
onsite. This will not only save cost for clients (as onsite billing rates are 3x of offshore
rates), but will also be margin accretive to service providers, although it will entail some
negative impact on revenue growth as well.
In our view, the above six factors will enable tech companies to absorb a lot of cost
escalations going forward and keep margins stable at current levels with currency benefits
flowing to the bottom line.
Table 10: EBITDA margins of India IT companies
Source:Company, Edelweiss research
FY15 FY16 FY17 FY18 FY19 FY20
Infosys 27.9 27.4 27.2 27.0 25.3 24.5
TCS 26.1 28.2 27.5 26.4 27.0 26.8
HCL Tech 24.7 21.5 22.1 22.6 23.1 23.6
Tech Mahindra 18.4 16.1 14.4 15.3 18.2 15.5
Mindtree 19.9 17.5 13.5 13.6 15.2 13.7
L&T Infotech 20.2 17.5 18.9 16.3 19.9 18.7
L&T Technology Services 15.2 16.9 18.0 15.4 18.0 19.8
Covid-19 has forced enterprises to
restructure and re-innovate their
business.
Outsourcing business is
fundamentally a “work from
anywhere” model.
21 Edelweiss Securities Limited
Sector Update
Outlook and Valuation: High Growth, Cash, ESG Rank to Boost Multiple
1) Techolution, further fueled by COVID-19, will lead to substantial jump in global
technology spends, implying higher revenue growth for Indian players along with cost
optimisation.
2) Substantial cash generation capability with robust distribution policy.
3) Higher ranking of most tech companies on ESG parameters will keep large focused
funds’ interest in them ticking.
These three factors, we believe, will trigger substantial multiple expansion coupled with
significant upgrade in earnings over the next one year. This prompts us to revise up our
earnings, multiples and target prices across the spectrum and estimate 20-56% return in the
base case scenario with a near-term downside risk of 10%. We recommend ‘BUY’ on HCLT,
TechM, Infosys & TCS (upgrade to ‘BUY’) in large caps and LTTS, Mindtree & LTI in the mid-
cap space, in that order of preference.
We upgrade TCS to ‘BUY’ primarily because: 1) Many of the global 200 companies are its
clients and higher spends by them will catapult TCS’s growth rate as well. 2) Its high cash
distribution, top-notch ESG ranking, meticulous execution and strong leadership imply
higher investor interest during an uptrend. We also revise up the company’s earnings 9%,
multiple to 24x (from 20x) and TP to INR2,310 (from INR1,708).
We are cognizant of the fact that world GDP rates are being trimmed. Moreover, massive
unemployment triggered by COVID-19 will further fuel anti-outsourcing and protectionist
voices, particularly in an election year. And finally, FY21 will be a washout year for the tech
sector with the best-case scenario of zero growth coupled with falling margins led by a few
bankruptcies in travel, tourism and hospitality sectors.
In spite of all the above negative triggers, which can lead to ~10% correction in the near
term, we are giving an anti-consensus and aggressive bullish ‘BUY’ call on the sector
convinced by a few key factors over and above higher growth and faster transition to digital
& cloud, as mentioned earlier.
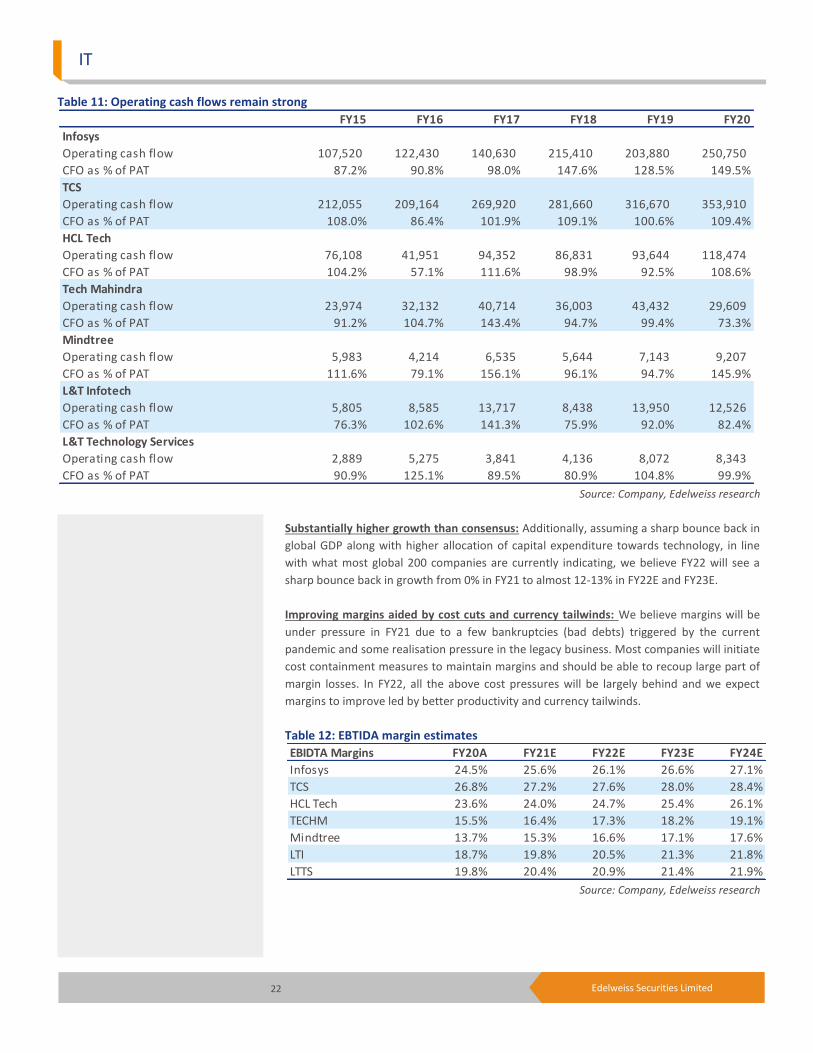
Strong cash flow generation to accelerate further: Top-5 companies will continue to
generate robust FCF like past (refer to table 11), with 80% plus cash distributed via
dividends or buy back. Moreover, given the current scenario, we don’t expect them to go for
big-bang acquisitions, thereby leaving enough room for higher cash to distribute among
shareholders.
FY21 will be a washout year for the
India Technology sector with almost
zero growth
22 Edelweiss Securities Limited
IT
Table 11: Operating cash flows remain strong
Source: Company, Edelweiss research
Substantially higher growth than consensus: Additionally, assuming a sharp bounce back in
global GDP along with higher allocation of capital expenditure towards technology, in line
with what most global 200 companies are currently indicating, we believe FY22 will see a
sharp bounce back in growth from 0% in FY21 to almost 12-13% in FY22E and FY23E.
Improving margins aided by cost cuts and currency tailwinds: We believe margins will be
under pressure in FY21 due to a few bankruptcies (bad debts) triggered by the current
pandemic and some realisation pressure in the legacy business. Most companies will initiate
cost containment measures to maintain margins and should be able to recoup large part of
margin losses. In FY22, all the above cost pressures will be largely behind and we expect
margins to improve led by better productivity and currency tailwinds.
Table 12: EBTIDA margin estimates
Source: Company, Edelweiss research
FY15 FY16 FY17 FY18 FY19 FY20
Infosys
Operating cash flow 107,520 122,430 140,630 215,410 203,880 250,750
CFO as % of PAT 87.2% 90.8% 98.0% 147.6% 128.5% 149.5%
TCS
Operating cash flow 212,055 209,164 269,920 281,660 316,670 353,910
CFO as % of PAT 108.0% 86.4% 101.9% 109.1% 100.6% 109.4%
HCL Tech
Operating cash flow 76,108 41,951 94,352 86,831 93,644 118,474
CFO as % of PAT 104.2% 57.1% 111.6% 98.9% 92.5% 108.6%
Tech Mahindra
Operating cash flow 23,974 32,132 40,714 36,003 43,432 29,609
CFO as % of PAT 91.2% 104.7% 143.4% 94.7% 99.4% 73.3%
Mindtree
Operating cash flow 5,983 4,214 6,535 5,644 7,143 9,207
CFO as % of PAT 111.6% 79.1% 156.1% 96.1% 94.7% 145.9%
L&T Infotech
Operating cash flow 5,805 8,585 13,717 8,438 13,950 12,526
CFO as % of PAT 76.3% 102.6% 141.3% 75.9% 92.0% 82.4%
L&T Technology Services
Operating cash flow 2,889 5,275 3,841 4,136 8,072 8,343
CFO as % of PAT 90.9% 125.1% 89.5% 80.9% 104.8% 99.9%
EBIDTA Margins FY20A FY21E FY22E FY23E FY24E
Infosys 24.5% 25.6% 26.1% 26.6% 27.1%
TCS 26.8% 27.2% 27.6% 28.0% 28.4%
HCL Tech 23.6% 24.0% 24.7% 25.4% 26.1%
TECHM 15.5% 16.4% 17.3% 18.2% 19.1%
Mindtree 13.7% 15.3% 16.6% 17.1% 17.6%
LTI 18.7% 19.8% 20.5% 21.3% 21.8%
LTTS 19.8% 20.4% 20.9% 21.4% 21.9%
23 Edelweiss Securities Limited
Sector Update
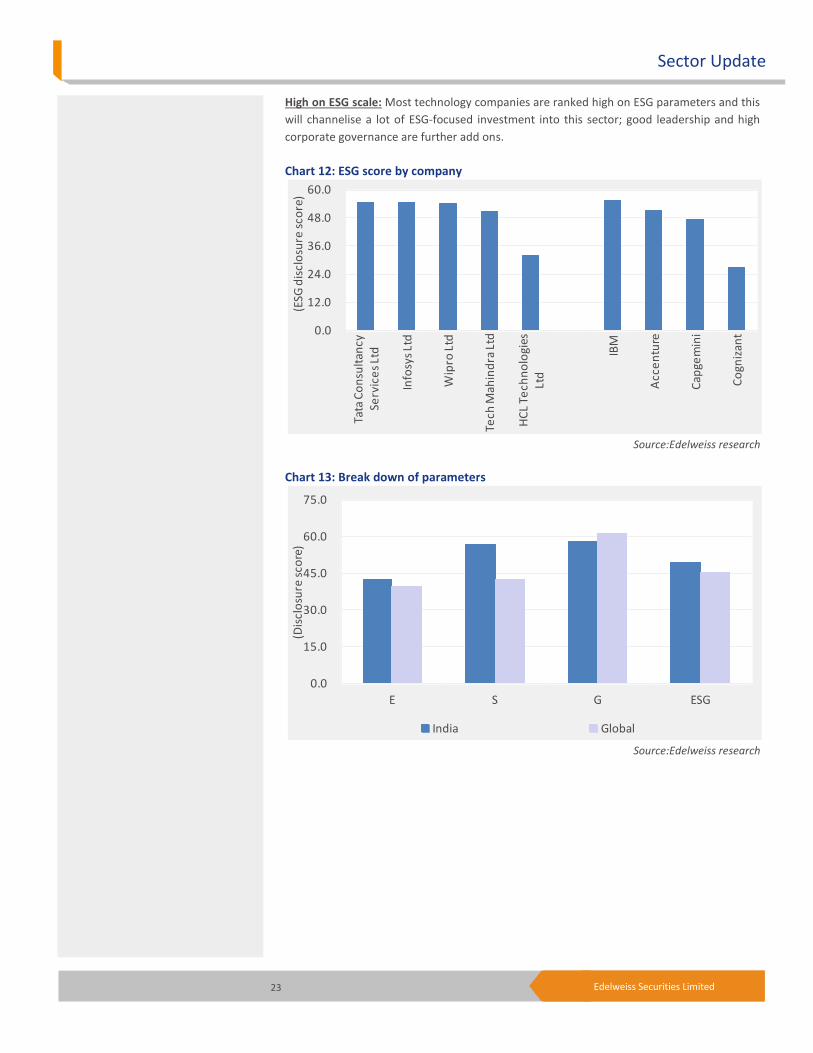
High on ESG scale: Most technology companies are ranked high on ESG parameters and this
will channelise a lot of ESG-focused investment into this sector; good leadership and high
corporate governance are further add ons.
Chart 12: ESG score by company
Source:Edelweiss research
Chart 13: Break down of parameters
Source:Edelweiss research
0.0
12.0
24.0
36.0
48.0
60.0
Tata
Co
nsu
ltan
cy
Serv
ice
s Lt
d
Info
sys
Ltd
Wip
ro L
td
Tech
Mah
ind
ra L
td
HC
L Te
chn
olo
gies
Lt
d
IBM
Acc
en
ture
Cap
gem
ini
Co
gniz
ant
(ESG
dis
clo
sure
sco
re)
0.0
15.0
30.0
45.0
60.0
75.0
E S G ESG
(Dis
clo
sure
sco
re)
India Global
24 Edelweiss Securities Limited
IT
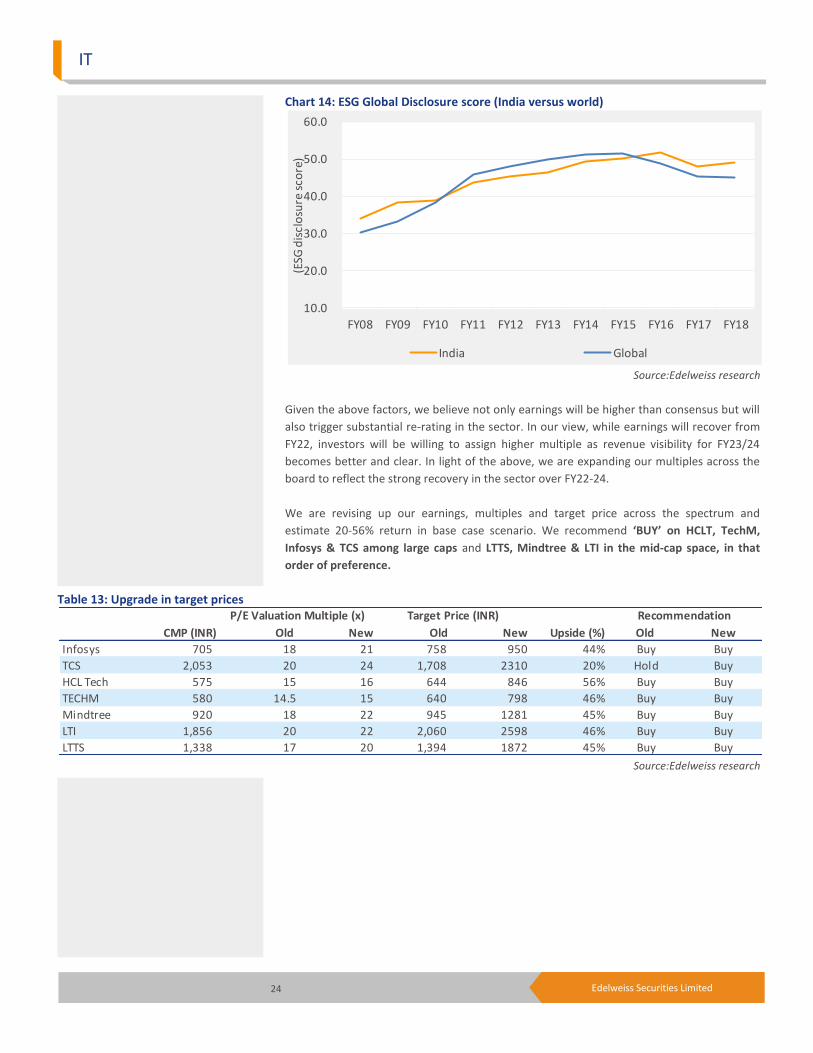
Chart 14: ESG Global Disclosure score (India versus world)
Source:Edelweiss research
Given the above factors, we believe not only earnings will be higher than consensus but will
also trigger substantial re-rating in the sector. In our view, while earnings will recover from
FY22, investors will be willing to assign higher multiple as revenue visibility for FY23/24
becomes better and clear. In light of the above, we are expanding our multiples across the
board to reflect the strong recovery in the sector over FY22-24.
We are revising up our earnings, multiples and target price across the spectrum and
estimate 20-56% return in base case scenario. We recommend ‘BUY’ on HCLT, TechM,
Infosys & TCS among large caps and LTTS, Mindtree & LTI in the mid-cap space, in that
order of preference.
Table 13: Upgrade in target prices
Source:Edelweiss research
10.0
20.0
30.0
40.0
50.0
60.0
FY08 FY09 FY10 FY11 FY12 FY13 FY14 FY15 FY16 FY17 FY18
(ESG
dis
clo
sure
sco
re)
India Global
CMP (INR) Old New Old New Upside (%) Old New
Infosys 705 18 21 758 950 44% Buy Buy
TCS 2,053 20 24 1,708 2310 20% Hold Buy
HCL Tech 575 15 16 644 846 56% Buy Buy
TECHM 580 14.5 15 640 798 46% Buy Buy
Mindtree 920 18 22 945 1281 45% Buy Buy
LTI 1,856 20 22 2,060 2598 46% Buy Buy
LTTS 1,338 17 20 1,394 1872 45% Buy Buy
P/E Valuation Multiple (x) Target Price (INR) Recommendation
25 Edelweiss Securities Limited
Sector Update
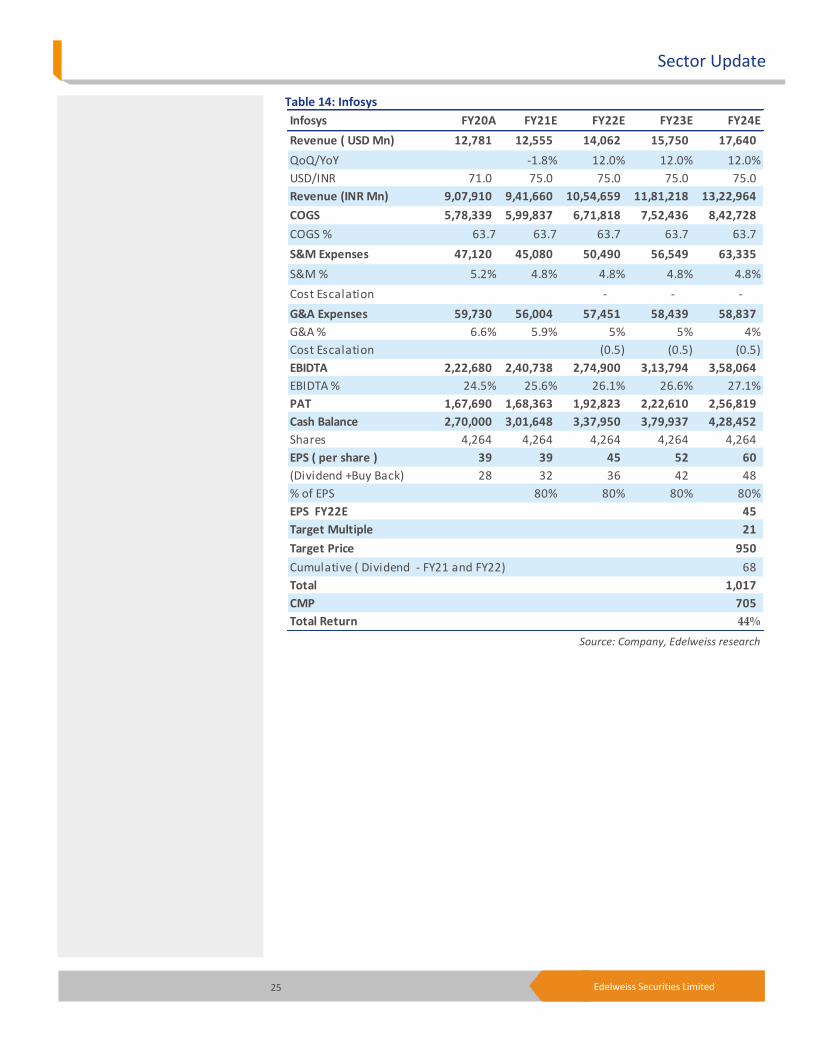
Table 14: Infosys
Source: Company, Edelweiss research
Infosys FY20A FY21E FY22E FY23E FY24E
Revenue ( USD Mn) 12,781 12,555 14,062 15,750 17,640
QoQ/YoY -1.8% 12.0% 12.0% 12.0%
USD/INR 71.0 75.0 75.0 75.0 75.0
Revenue (INR Mn) 9,07,910 9,41,660 10,54,659 11,81,218 13,22,964
COGS 5,78,339 5,99,837 6,71,818 7,52,436 8,42,728
COGS % 63.7 63.7 63.7 63.7 63.7
S&M Expenses 47,120 45,080 50,490 56,549 63,335
S&M % 5.2% 4.8% 4.8% 4.8% 4.8%
Cost Escalation - - -
G&A Expenses 59,730 56,004 57,451 58,439 58,837
G&A % 6.6% 5.9% 5% 5% 4%
Cost Escalation (0.5) (0.5) (0.5)
EBIDTA 2,22,680 2,40,738 2,74,900 3,13,794 3,58,064
EBIDTA % 24.5% 25.6% 26.1% 26.6% 27.1%
PAT 1,67,690 1,68,363 1,92,823 2,22,610 2,56,819
Cash Balance 2,70,000 3,01,648 3,37,950 3,79,937 4,28,452
Shares 4,264 4,264 4,264 4,264 4,264
EPS ( per share ) 39 39 45 52 60
(Dividend +Buy Back) 28 32 36 42 48
% of EPS 80% 80% 80% 80%
EPS FY22E 45
Target Multiple 21
Target Price 950
Cumulative ( Dividend - FY21 and FY22) 68
Total 1,017
CMP 705
Total Return 44%
26 Edelweiss Securities Limited
IT
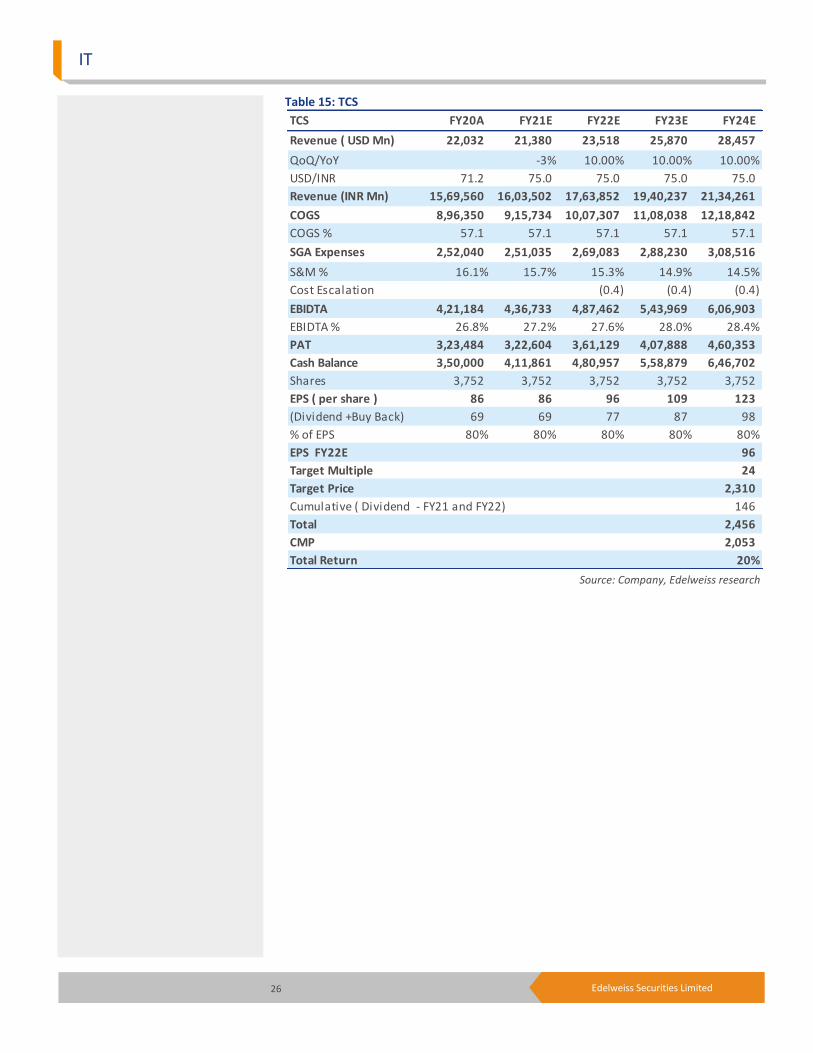
Table 15: TCS
Source: Company, Edelweiss research
TCS FY20A FY21E FY22E FY23E FY24E
Revenue ( USD Mn) 22,032 21,380 23,518 25,870 28,457
QoQ/YoY -3% 10.00% 10.00% 10.00%
USD/INR 71.2 75.0 75.0 75.0 75.0
Revenue (INR Mn) 15,69,560 16,03,502 17,63,852 19,40,237 21,34,261
COGS 8,96,350 9,15,734 10,07,307 11,08,038 12,18,842
COGS % 57.1 57.1 57.1 57.1 57.1
SGA Expenses 2,52,040 2,51,035 2,69,083 2,88,230 3,08,516
S&M % 16.1% 15.7% 15.3% 14.9% 14.5%
Cost Escalation (0.4) (0.4) (0.4)
EBIDTA 4,21,184 4,36,733 4,87,462 5,43,969 6,06,903
EBIDTA % 26.8% 27.2% 27.6% 28.0% 28.4%
PAT 3,23,484 3,22,604 3,61,129 4,07,888 4,60,353
Cash Balance 3,50,000 4,11,861 4,80,957 5,58,879 6,46,702
Shares 3,752 3,752 3,752 3,752 3,752
EPS ( per share ) 86 86 96 109 123
(Dividend +Buy Back) 69 69 77 87 98
% of EPS 80% 80% 80% 80% 80%
EPS FY22E 96
Target Multiple 24
Target Price 2,310
Cumulative ( Dividend - FY21 and FY22) 146
Total 2,456
CMP 2,053
Total Return 20%
27 Edelweiss Securities Limited
Sector Update
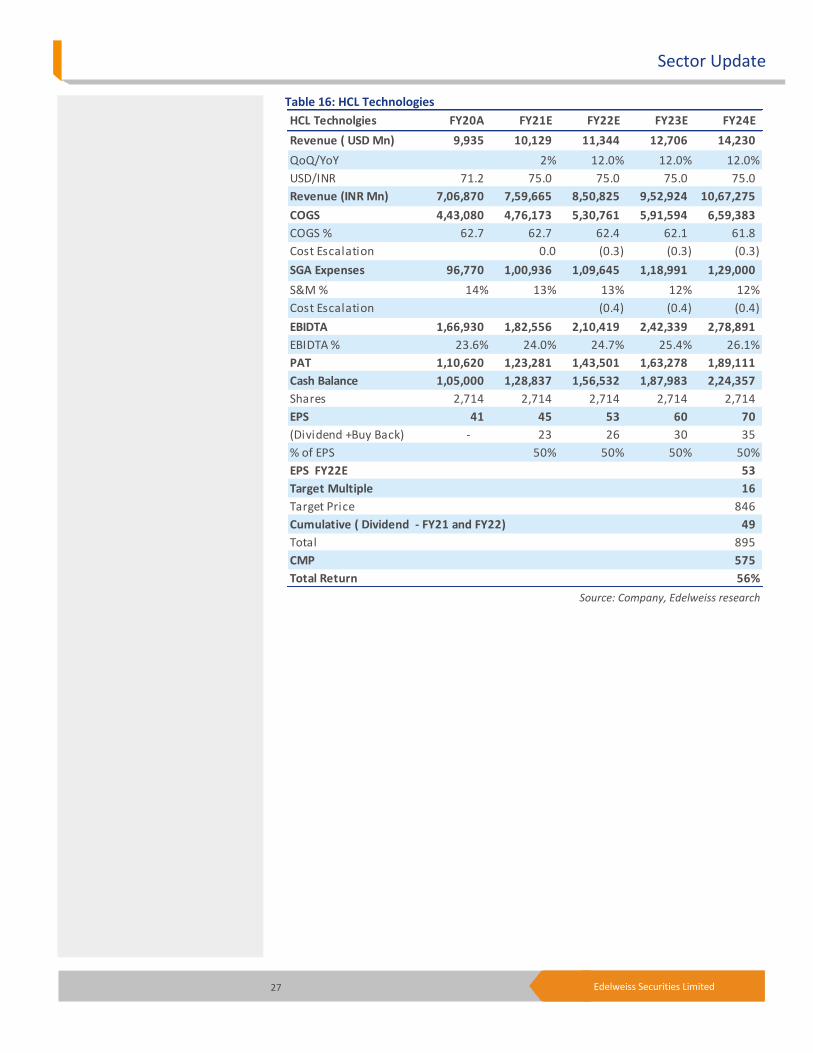
Table 16: HCL Technologies
Source: Company, Edelweiss research
HCL Technolgies FY20A FY21E FY22E FY23E FY24E
Revenue ( USD Mn) 9,935 10,129 11,344 12,706 14,230
QoQ/YoY 2% 12.0% 12.0% 12.0%
USD/INR 71.2 75.0 75.0 75.0 75.0
Revenue (INR Mn) 7,06,870 7,59,665 8,50,825 9,52,924 10,67,275
COGS 4,43,080 4,76,173 5,30,761 5,91,594 6,59,383
COGS % 62.7 62.7 62.4 62.1 61.8
Cost Escalation 0.0 (0.3) (0.3) (0.3)
SGA Expenses 96,770 1,00,936 1,09,645 1,18,991 1,29,000
S&M % 14% 13% 13% 12% 12%
Cost Escalation (0.4) (0.4) (0.4)
EBIDTA 1,66,930 1,82,556 2,10,419 2,42,339 2,78,891
EBIDTA % 23.6% 24.0% 24.7% 25.4% 26.1%
PAT 1,10,620 1,23,281 1,43,501 1,63,278 1,89,111
Cash Balance 1,05,000 1,28,837 1,56,532 1,87,983 2,24,357
Shares 2,714 2,714 2,714 2,714 2,714
EPS 41 45 53 60 70
(Dividend +Buy Back) - 23 26 30 35
% of EPS 50% 50% 50% 50%
EPS FY22E 53
Target Multiple 16
Target Price 846
Cumulative ( Dividend - FY21 and FY22) 49
Total 895
CMP 575
Total Return 56%

28 Edelweiss Securities Limited
IT
Table 17: Tech Mahindra
Source: Company, Edelweiss research
Tech Mahindra FY20A FY21E FY22E FY23E FY24E
Revenue ( USD Mn) 5,182 5,052 5,506 6,002 6,602
QoQ/YoY -3% 9.0% 9.0% 10.0%
USD/INR 71.2 75.0 75.0 75.0 75.0
Revenue (INR Mn) 3,68,699 3,78,876 4,12,975 4,50,143 4,95,157
COGS 2,59,743 2,65,018 2,86,805 3,10,367 3,38,927
COGS % 70.4 69.9 69.4 68.9 68.4
Cost Escalation -0.5 -0.5 -0.5 -0.5
SGA Expenses 51,673 51,572 54,562 57,672 61,458
S&M % 14% 14% 13% 13% 12%
Cost Escalation (0.4) (0.4) (0.4)
EBIDTA 57,283 62,286 71,608 82,104 94,771
EBIDTA % 15.5% 16.4% 17.3% 18.2% 19.1%
PAT 39,029 38,066 44,438 51,673 60,380
Cash Balance 60,000 66,966 75,132 84,657 95,820
Shares 891 891 891 891 891
EPS 44 43 50 58 68
(Dividend +Buy Back) - 21 25 29 34
% of EPS 50% 50% 50% 50%
EPS FY22E 50
Target Multiple 16
Target Price 798
Cumulative ( Dividend - FY21 and FY22) 46
Total 844
CMP 580
Total Return 46%
29 Edelweiss Securities Limited
Sector Update
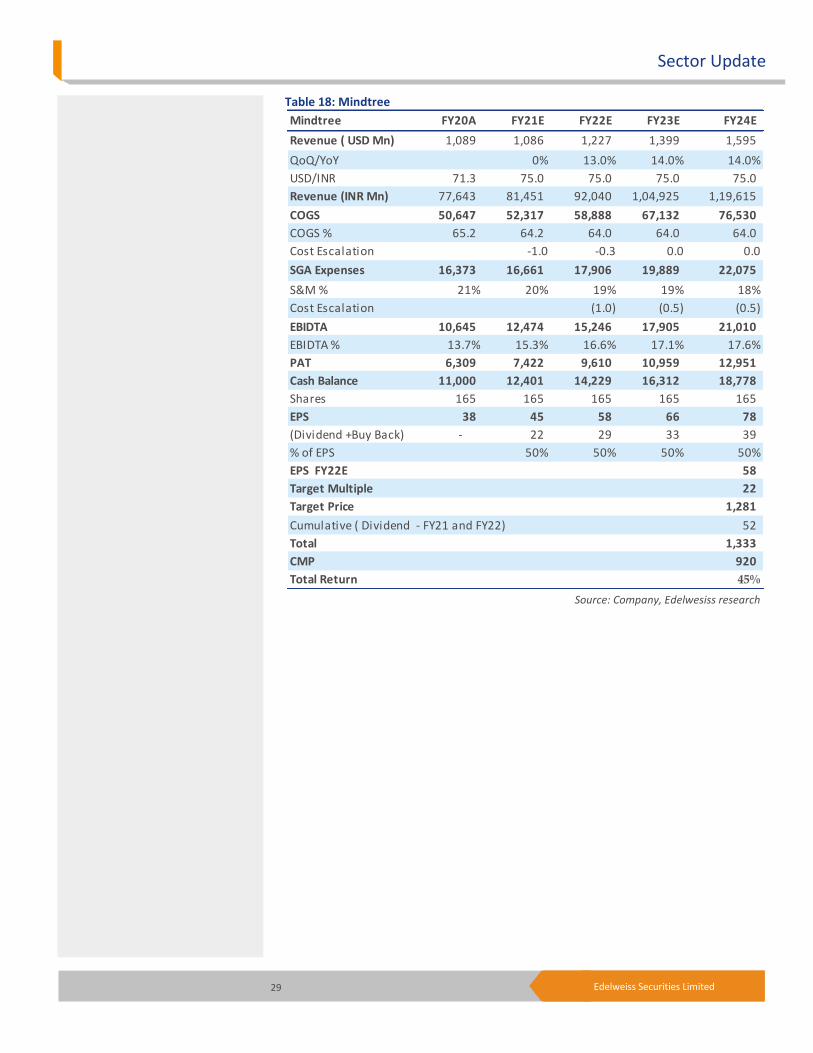
Table 18: Mindtree
Source: Company, Edelwesiss research
Mindtree FY20A FY21E FY22E FY23E FY24E
Revenue ( USD Mn) 1,089 1,086 1,227 1,399 1,595
QoQ/YoY 0% 13.0% 14.0% 14.0%
USD/INR 71.3 75.0 75.0 75.0 75.0
Revenue (INR Mn) 77,643 81,451 92,040 1,04,925 1,19,615
COGS 50,647 52,317 58,888 67,132 76,530
COGS % 65.2 64.2 64.0 64.0 64.0
Cost Escalation -1.0 -0.3 0.0 0.0
SGA Expenses 16,373 16,661 17,906 19,889 22,075
S&M % 21% 20% 19% 19% 18%
Cost Escalation (1.0) (0.5) (0.5)
EBIDTA 10,645 12,474 15,246 17,905 21,010
EBIDTA % 13.7% 15.3% 16.6% 17.1% 17.6%
PAT 6,309 7,422 9,610 10,959 12,951
Cash Balance 11,000 12,401 14,229 16,312 18,778
Shares 165 165 165 165 165
EPS 38 45 58 66 78
(Dividend +Buy Back) - 22 29 33 39
% of EPS 50% 50% 50% 50%
EPS FY22E 58
Target Multiple 22
Target Price 1,281
Cumulative ( Dividend - FY21 and FY22) 52
Total 1,333
CMP 920
Total Return 45%
30 Edelweiss Securities Limited
IT
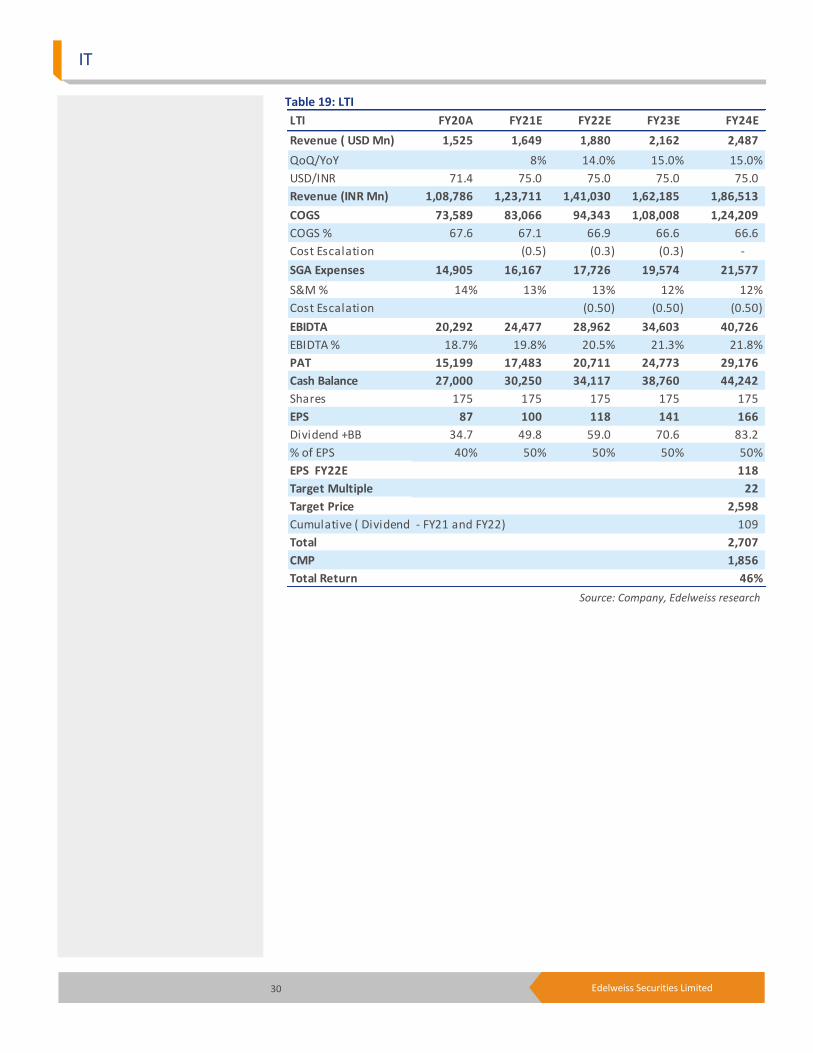
Table 19: LTI
Source: Company, Edelweiss research
LTI FY20A FY21E FY22E FY23E FY24E
Revenue ( USD Mn) 1,525 1,649 1,880 2,162 2,487
QoQ/YoY 8% 14.0% 15.0% 15.0%
USD/INR 71.4 75.0 75.0 75.0 75.0
Revenue (INR Mn) 1,08,786 1,23,711 1,41,030 1,62,185 1,86,513
COGS 73,589 83,066 94,343 1,08,008 1,24,209
COGS % 67.6 67.1 66.9 66.6 66.6
Cost Escalation (0.5) (0.3) (0.3) -
SGA Expenses 14,905 16,167 17,726 19,574 21,577
S&M % 14% 13% 13% 12% 12%
Cost Escalation (0.50) (0.50) (0.50)
EBIDTA 20,292 24,477 28,962 34,603 40,726
EBIDTA % 18.7% 19.8% 20.5% 21.3% 21.8%
PAT 15,199 17,483 20,711 24,773 29,176
Cash Balance 27,000 30,250 34,117 38,760 44,242
Shares 175 175 175 175 175
EPS 87 100 118 141 166
Dividend +BB 34.7 49.8 59.0 70.6 83.2
% of EPS 40% 50% 50% 50% 50%
EPS FY22E 118
Target Multiple 22
Target Price 2,598
Cumulative ( Dividend - FY21 and FY22) 109
Total 2,707
CMP 1,856
Total Return 46%
31 Edelweiss Securities Limited
Sector Update
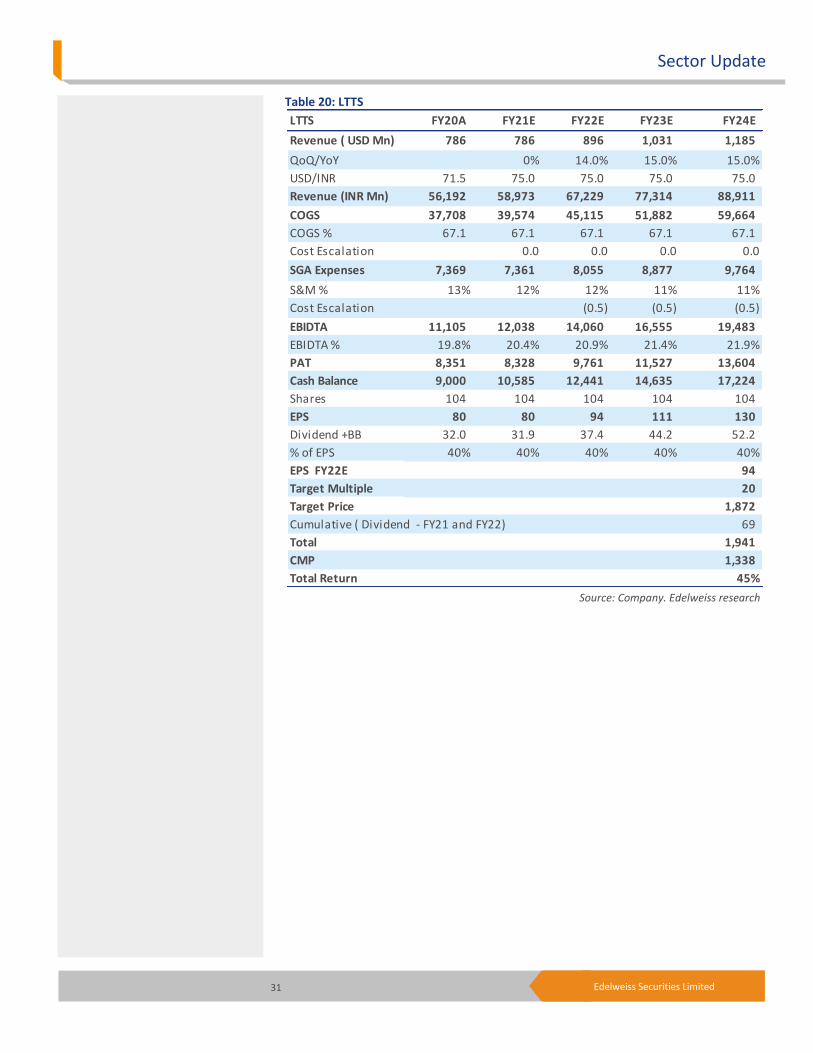
Table 20: LTTS
Source: Company. Edelweiss research
LTTS FY20A FY21E FY22E FY23E FY24E
Revenue ( USD Mn) 786 786 896 1,031 1,185
QoQ/YoY 0% 14.0% 15.0% 15.0%
USD/INR 71.5 75.0 75.0 75.0 75.0
Revenue (INR Mn) 56,192 58,973 67,229 77,314 88,911
COGS 37,708 39,574 45,115 51,882 59,664
COGS % 67.1 67.1 67.1 67.1 67.1
Cost Escalation 0.0 0.0 0.0 0.0
SGA Expenses 7,369 7,361 8,055 8,877 9,764
S&M % 13% 12% 12% 11% 11%
Cost Escalation (0.5) (0.5) (0.5)
EBIDTA 11,105 12,038 14,060 16,555 19,483
EBIDTA % 19.8% 20.4% 20.9% 21.4% 21.9%
PAT 8,351 8,328 9,761 11,527 13,604
Cash Balance 9,000 10,585 12,441 14,635 17,224
Shares 104 104 104 104 104
EPS 80 80 94 111 130
Dividend +BB 32.0 31.9 37.4 44.2 52.2
% of EPS 40% 40% 40% 40% 40%
EPS FY22E 94
Target Multiple 20
Target Price 1,872
Cumulative ( Dividend - FY21 and FY22) 69
Total 1,941
CMP 1,338
Total Return 45%
32 Edelweiss Securities Limited
IT
Date Company Title Price (INR) Recos
Recent Research
12-Dec-18 L &T Infotech
Digital to power industry-beating growth; Company Update
1,624 Buy
11-Dec-18 Persistent Systems
Execution awaited; valuation comforting; Company Update
610 Buy
07-Dec-18 HCL Technologies
Seals deal with IBM to scale market pie; Edel Flash
1,012 Buy
Edelweiss Securities Limited, Edelweiss House, off C.S.T. Road, Kalina, Mumbai – 400 098. Board: (91-22) 4009 4400, Email: [email protected]
Aditya Narain
Head of Research
Coverage group(s) of stocks by primary analyst(s): IT
Cyient, ECLERX SERVICES, HCL Technologies, Hexaware Technologies, Infosys, Info Edge, IndiaMART, Just Dial, L&T Infotech Ltd, L&T Technology Services Ltd, MINDTREE LTD, Persistent Systems, Redington India Ltd, Tata Consultancy Services, Tech Mahindra, Wipro
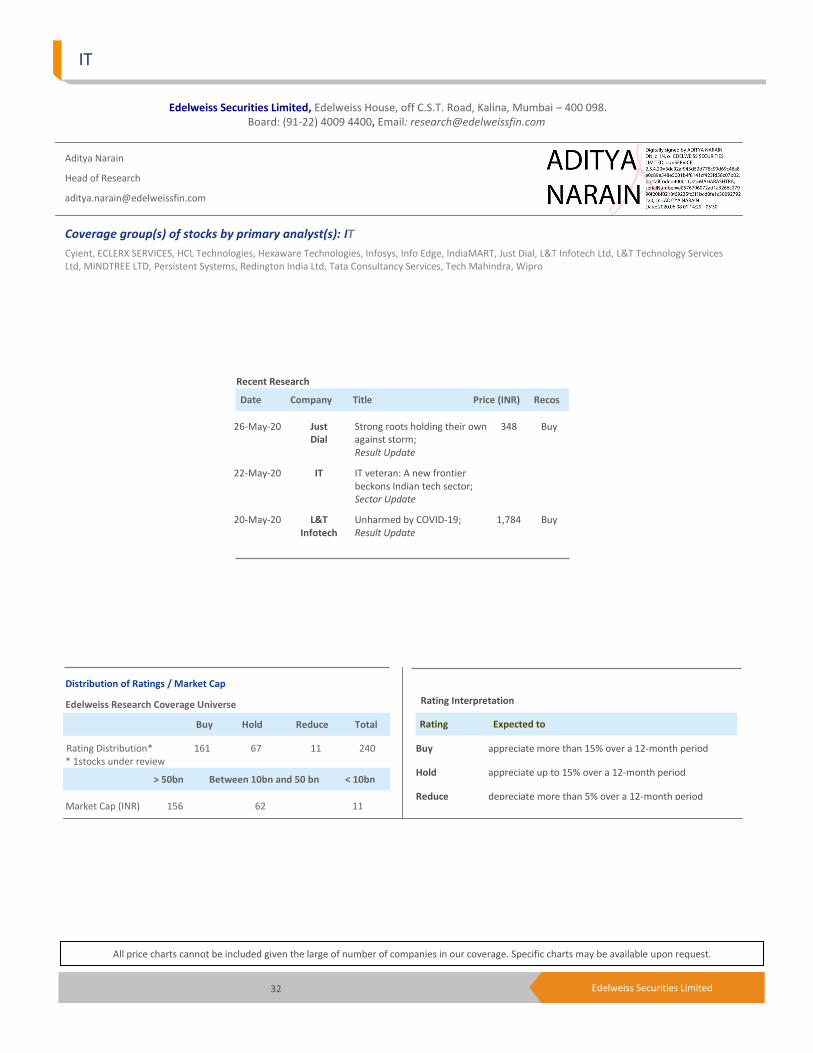
Date Company Title Price (INR) Recos
Recent Research
26-May-20 Just Dial
Strong roots holding their own against storm; Result Update
348 Buy
22-May-20 IT IT veteran: A new frontier beckons Indian tech sector; Sector Update
20-May-20 L&T Infotech
Unharmed by COVID-19; Result Update
1,784 Buy
Distribution of Ratings / Market Cap
Edelweiss Research Coverage Universe
Rating Distribution* 161 67 11 240 * 1stocks under review
Market Cap (INR) 156 62 11
> 50bn Between 10bn and 50 bn < 10bn
Buy Hold Reduce Total
Rating Interpretation
Buy appreciate more than 15% over a 12-month period
Hold appreciate up to 15% over a 12-month period
Reduce depreciate more than 5% over a 12-month period
Rating Expected to
All price charts cannot be included given the large of number of companies in our coverage. Specific charts may be available upon request.
33 Edelweiss Securities Limited
Sector Update
DISCLAIMER
Edelweiss Securities Limited (“ESL” or “Research Entity”) is regulated by the Securities and Exchange Board of India (“SEBI”) and is licensed to carry on the business of broking, depository services and related activities. The business of ESL and its Associates (list available on www.edelweissfin.com) are organized around five broad business groups – Credit including Housing and SME Finance, Commodities, Financial Markets, Asset Management and Life Insurance.
This Report has been prepared by Edelweiss Securities Limited in the capacity of a Research Analyst having SEBI Registration No.INH200000121 and distributed as per SEBI (Research Analysts) Regulations 2014. This report does not constitute an offer or solicitation for the purchase or sale of any financial instrument or as an official confirmation of any transaction. Securities as defined in clause (h) of section 2 of the Securities Contracts (Regulation) Act, 1956 includes Financial Instruments and Currency Derivatives. The information contained herein is from publicly available data or other sources believed to be reliable. This report is provided for assistance only and is not intended to be and must not alone be taken as the basis for an investment decision. The user assumes the entire risk of any use made of this information. Each recipient of this report should make such investigation as it deems necessary to arrive at an independent evaluation of an investment in Securities referred to in this document (including the merits and risks involved), and should consult his own advisors to determine the merits and risks of such investment. The investment discussed or views expressed may not be suitable for all investors.
This information is strictly confidential and is being furnished to you solely for your information. This information should not be reproduced or redistributed or passed on directly or indirectly in any form to any other person or published, copied, in whole or in part, for any purpose. This report is not directed or intended for distribution to, or use by, any person or entity who is a citizen or resident of or located in any locality, state, country or other jurisdiction, where such distribution, publication, availability or use would be contrary to law, regulation or which would subject ESL and associates / group companies to any registration or licensing requirements within such jurisdiction. The distribution of this report in certain jurisdictions may be restricted by law, and persons in whose possession this report comes, should observe, any such restrictions. The information given in this report is as of the date of this report and there can be no assurance that future results or events will be consistent with this information. This information is subject to change without any prior notice. ESL reserves the right to make modifications and alterations to this statement as may be required from time to time. ESL or any of its associates / group companies shall not be in any way responsible for any loss or damage that may arise to any person from any inadvertent error in the information contained in this report. ESL is committed to providing independent and transparent recommendation to its clients. Neither ESL nor any of its associates, group companies, directors, employees, agents or representatives shall be liable for any damages whether direct, indirect, special or consequential including loss of revenue or lost profits that may arise from or in connection with the use of the information. Our proprietary trading and investment businesses may make investment decisions that are inconsistent with the recommendations expressed herein. Past performance is not necessarily a guide to future performance .The disclosures of interest statements incorporated in this report are provided solely to enhance the transparency and should not be treated as endorsement of the views expressed in the report. The information provided in these reports remains, unless otherwise stated, the copyright of ESL. All layout, design, original artwork, concepts and other Intellectual Properties, remains the property and copyright of ESL and may not be used in any form or for any purpose whatsoever by any party without the express written permission of the copyright holders.
ESL shall not be liable for any delay or any other interruption which may occur in presenting the data due to any reason including network (Internet) reasons or snags in the system, break down of the system or any other equipment, server breakdown, maintenance shutdown, breakdown of communication services or inability of the ESL to present the data. In no event shall ESL be liable for any damages, including without limitation direct or indirect, special, incidental, or consequential damages, losses or expenses arising in connection with the data presented by the ESL through this report.
We offer our research services to clients as well as our prospects. Though this report is disseminated to all the customers simultaneously, not all customers may receive this report at the same time. We will not treat recipients as customers by virtue of their receiving this report.
ESL and its associates, officer, directors, and employees, research analyst (including relatives) worldwide may: (a) from time to time, have long or short positions in, and buy or sell the Securities, mentioned herein or (b) be engaged in any other transaction involving such Securities and earn brokerage or other compensation or act as a market maker in the financial instruments of the subject company/company(ies) discussed herein or act as advisor or lender/borrower to such company(ies) or have other potential/material conflict of interest with respect to any recommendation and related information and opinions at the time of publication of research report or at the time of public appearance. ESL may have proprietary long/short position in the above mentioned scrip(s) and therefore should be considered as interested. The views provided herein are general in nature and do not consider risk appetite or investment objective of any particular investor; readers are requested to take independent professional advice before investing. This should not be construed as invitation or solicitation to do business with ESL.
34 Edelweiss Securities Limited
IT
ESL or its associates may have received compensation from the subject company in the past 12 months. ESL or its associates may have managed or co-managed public offering of securities for the subject company in the past 12 months. ESL or its associates may have received compensation for investment banking or merchant banking or brokerage services from the subject company in the past 12 months. ESL or its associates may have received any compensation for products or services other than investment banking or merchant banking or brokerage services from the subject company in the past 12 months. ESL or its associates have not received any compensation or other benefits from the Subject Company or third party in connection with the research report. Research analyst or his/her relative or ESL’s associates may have financial interest in the subject company. ESL and/or its Group Companies, their Directors, affiliates and/or employees may have interests/ positions, financial or otherwise in the Securities/Currencies and other investment products mentioned in this report. ESL, its associates, research analyst and his/her relative may have other potential/material conflict of interest with respect to any recommendation and related information and opinions at the time of publication of research report or at the time of public appearance.
Participants in foreign exchange transactions may incur risks arising from several factors, including the following: ( i) exchange rates can be volatile and are subject to large fluctuations; ( ii) the value of currencies may be affected by numerous market factors, including world and national economic, political and regulatory events, events in equity and debt markets and changes in interest rates; and (iii) currencies may be subject to devaluation or government imposed exchange controls which could affect the value of the currency. Investors in securities such as ADRs and Currency Derivatives, whose values are affected by the currency of an underlying security, effectively assume currency risk.
Research analyst has served as an officer, director or employee of subject Company: No
ESL has financial interest in the subject companies: No
ESL’s Associates may have actual / beneficial ownership of 1% or more securities of the subject company at the end of the month immediately preceding the date of publication of research report.
Research analyst or his/her relative has actual/beneficial ownership of 1% or more securities of the subject company at the end of the month immediately preceding the date of publication of research report: No
ESL has actual/beneficial ownership of 1% or more securities of the subject company at the end of the month immediately preceding the date of publication of research report: No
Subject company may have been client during twelve months preceding the date of distribution of the research report.
There were no instances of non-compliance by ESL on any matter related to the capital markets, resulting in significant and material disciplinary action during the last three years except that ESL had submitted an offer of settlement with Securities and Exchange commission, USA (SEC) and the same has been accepted by SEC without admitting or denying the findings in relation to their charges of non registration as a broker dealer.
A graph of daily closing prices of the securities is also available at www.nseindia.com
Analyst Certification:
The analyst for this report certifies that all of the views expressed in this report accurately reflect his or her personal views about the subject company or companies and its or their securities, and no part of his or her compensation was, is or will be, directly or indirectly related to specific recommendations or views expressed in this report.
Additional Disclaimers
Disclaimer for U.S. Persons
This research report is a product of Edelweiss Securities Limited, which is the employer of the research analyst(s) who has prepared the research report. The research analyst(s) preparing the research report is/are resident outside the United States (U.S.) and are not associated persons of any U.S. regulated broker-dealer and therefore the analyst(s) is/are not subject to supervision by a U.S. broker-dealer, and is/are not required to satisfy the regulatory licensing requirements of FINRA or required to otherwise comply with U.S. rules or regulations regarding, among other things, communications with a subject company, public appearances and trading securities held by a research analyst account.
This report is intended for distribution by Edelweiss Securities Limited only to "Major Institutional Investors" as defined by Rule 15a-6(b)(4) of the U.S. Securities and Exchange Act, 1934 (the Exchange Act) and interpretations thereof by U.S. Securities and Exchange Commission (SEC) in reliance on Rule 15a 6(a)(2). If the recipient of this report is not a Major Institutional Investor as specified above, then it should not act upon this report and return the same to the sender. Further, this report may not be copied, duplicated and/or transmitted onward to any U.S. person, which is not the Major Institutional Investor.
In reliance on the exemption from registration provided by Rule 15a-6 of the Exchange Act and interpretations thereof by the SEC in order to conduct certain business with Major Institutional Investors, Edelweiss Securities Limited has entered into an agreement with a U.S. registered broker-dealer, Edelweiss Financial Services Inc. ("EFSI"). Transactions in securities discussed in this research report should be effected through Edelweiss Financial Services Inc.
35 Edelweiss Securities Limited
Sector Update
Access the entire repository of Edelweiss Research on www.edelresearch.com
Disclaimer for U.K. Persons
The contents of this research report have not been approved by an authorised person within the meaning of the Financial Services and Markets Act 2000 ("FSMA"). In the United Kingdom, this research report is being distributed only to and is directed only at (a) persons who have professional experience in matters relating to investments falling within Article 19(5) of the FSMA (Financial Promotion) Order 2005 (the “Order”); (b) persons falling within Article 49(2)(a) to (d) of the Order (including high net worth companies and unincorporated associations); and (c) any other persons to whom it may otherwise lawfully be communicated (all such persons together being referred to as “relevant persons”). This research report must not be acted on or relied on by persons who are not relevant persons. Any investment or investment activity to which this research report relates is available only to relevant persons and will be engaged in only with relevant persons. Any person who is not a relevant person should not act or rely on this research report or any of its contents. This research report must not be distributed, published, reproduced or disclosed (in whole or in part) by recipients to any other person. Disclaimer for Canadian Persons
This research report is a product of Edelweiss Securities Limited ("ESL"), which is the employer of the research analysts who have prepared the research report. The research analysts preparing the research report are resident outside the Canada and are not associated persons of any Canadian registered adviser and/or dealer and, therefore, the analysts are not subject to supervision by a Canadian registered adviser and/or dealer, and are not required to satisfy the regulatory licensing requirements of the Ontario Securities Commission, other Canadian provincial securities regulators, the Investment Industry Regulatory Organization of Canada and are not required to otherwise comply with Canadian rules or regulations regarding, among other things, the research analysts' business or relationship with a subject company or trading of securities by a research analyst.
This report is intended for distribution by ESL only to "Permitted Clients" (as defined in National Instrument 31-103 ("NI 31-103")) who are resident in the Province of Ontario, Canada (an "Ontario Permitted Client"). If the recipient of this report is not an Ontario Permitted Client, as specified above, then the recipient should not act upon this report and should return the report to the sender. Further, this report may not be copied, duplicated and/or transmitted onward to any Canadian person.
ESL is relying on an exemption from the adviser and/or dealer registration requirements under NI 31-103 available to certain international advisers and/or dealers. Please be advised that (i) ESL is not registered in the Province of Ontario to trade in securities nor is it registered in the Province of Ontario to provide advice with respect to securities; (ii) ESL's head office or principal place of business is located in India; (iii) all or substantially all of ESL's assets may be situated outside of Canada; (iv) there may be difficulty enforcing legal rights against ESL because of the above; and (v) the name and address of the ESL's agent for service of process in the Province of Ontario is: Bamac Services Inc., 181 Bay Street, Suite 2100, Toronto, Ontario M5J 2T3 Canada.
Disclaimer for Singapore Persons
In Singapore, this report is being distributed by Edelweiss Investment Advisors Private Limited ("EIAPL") (Co. Reg. No. 201016306H) which is a holder of a capital markets services license and an exempt financial adviser in Singapore and (ii) solely to persons who qualify as "institutional investors" or "accredited investors" as defined in section 4A(1) of the Securities and Futures Act, Chapter 289 of Singapore ("the SFA"). Pursuant to regulations 33, 34, 35 and 36 of the Financial Advisers Regulations ("FAR"), sections 25, 27 and 36 of the Financial Advisers Act, Chapter 110 of Singapore shall not apply to EIAPL when providing any financial advisory services to an accredited investor (as defined in regulation 36 of the FAR. Persons in Singapore should contact EIAPL in respect of any matter arising from, or in connection with this publication/communication. This report is not suitable for private investors.
Disclaimer for Hong Kong persons
This report is distributed in Hong Kong by Edelweiss Securities (Hong Kong) Private Limited (ESHK), a licensed corporation (BOM -874) licensed and regulated by the Hong Kong Securities and Futures Commission (SFC) pursuant to Section 116(1) of the Securities and Futures Ordinance “SFO”. This report is intended for distribution only to “Professional Investors” as defined in Part I of Schedule 1 to SFO. Any investment or investment activity to which this document relates is only available to professional investor and will be engaged only with professional investors.” Nothing here is an offer or solicitation of these securities, products and services in any jurisdiction where their offer or sale is not qualified or exempt from registration. The report also does not constitute a personal recommendation or take into account the particular investment objectives, financial situations, or needs of any individual recipients. The Indian Analyst(s) who compile this report is/are not located in Hong Kong and is/are not licensed to carry on regulated activities in Hong Kong and does not / do not hold themselves out as being able to do so.
Copyright 2009 Edelweiss Research (Edelweiss Securities Ltd). All rights reserved

Edelweiss Securities Limited, Edelweiss House, off C.S.T. Road, Kalina, Mumbai 400 098Tel: +91 22 4009 4400. Email: [email protected]


![Edelweiss [1]](https://img.pdfslide.net/doc/110x75/577d29e11a28ab4e1ea8224e/edelweiss-1.jpg)