Embed Size (px)
Citation preview

Japan Tobacco Inc.
Annual Report FY2014
Year ended December 31, 2014

Management
001 Financial Highlights
004 At a Glance
006 Consolidated Five-year Financial Summary
008 Message from the Chairman and CEO
010 CEO Business Review
012 Management Principle, Strategic Framework
and Resource Allocation
014 Business Plan 2015
015 Role and Priority of Each Business
016 Performance Measures
Operations & Analysis
022 Industry Overview
022 Tobacco Business
024 Pharmaceutical Business
025 Processed Food Business
026 Review of Operations
026 Tobacco Business Value Chain
028 International Tobacco Business
034 Japanese Domestic Tobacco Business
038 Pharmaceutical Business
042 Processed Food Business
044 Beverage Business
045 JT Group and Sustainability
046 Risk Factors
050 Corporate Governance
Financial Review
066 Financial Review
Financial Statements
078 Financial Statements and Notes
084 Notes to the accounts
135 Independent Auditor’s report
Shareholder Information
138 Shareholder Information
Other Information
142 History of the JT Group
146 Regulation and Other Relevant Laws
149 Litigation
150 Members of the Board, Audit & Supervisory
Board Members, and Executive Offi cers
151 Members of JTI Executive Committee
152 Glossary of Terms
154 Corporate Data
Fact Sheets
Available at:
www.jt.com/investors/results/annual_report/index.html
Contents
Unless the context indicates otherwise, references in this Annual Report to
“we”, “us”, “our”, “Japan Tobacco”, “JT Group” or “JT” are to Japan Tobacco
Inc. and its consolidated subsidiaries. References to “JTI” are to JTI Holding
B.V., our consolidated subsidiary, and its consolidated subsidiaries.
References to “TableMark” are to TableMark Holdings Co., Ltd., TableMark
Co., Ltd. and its group companies. References to “Japan Tobacco Inc.” are
only to Japan Tobacco Inc. and references to “JT International Holding B.V.”
are only to JTI Holding B.V. References to “audit & supervisory board” are to
“kansayaku-kai” (as defi ned in the Companies Act of Japan) that performs
certain supervisory functions through its monitoring and audit activities
within the overall scheme of corporate governance pursuant to the
Companies Act of Japan. References to “audit & supervisory board
member” are to a member or members of an audit & supervisory board,
also referred to in Japanese as “kansayaku” (as defi ned in the Companies
Act of Japan).
Forward-looking statementsThis report contains forward-looking statements. These statements appear
in a number of places in this report and include statements regarding the
intent, belief, or current and future expectations of our management with
respect to our business, fi nancial condition and results of operations. In
some cases, you can identify forward-looking statements by terms such as
“may”, “will”, “should”, “would”,“expect”, “intend”, “project”, “plan”, “aim”,
“seek”, “target”, “anticipate”, “believe”, “estimate”, “predict”, “potential” or
the negative of these terms or other similar terminology. These statements
are not guarantees of future performance and are subject to various risks
and uncertainties. Actual results, performance or achievements, or those
of the industries in which we operate, may diff er materially from any future
results, performance or achievements expressed or implied by these
forward-looking statements. In addition, these forward-looking statements
are necessarily dependent upon assumptions, estimates and data that may
be incorrect or imprecise and involve known and unknown risks and
uncertainties. Forward-looking statements regarding operating results are
particularly subject to a variety of assumptions, some or all of which may
not be realized.
Risks, uncertainties or other factors that could cause actual results to diff er
materially from those expressed in any forward-looking statement include,
without limitation:
1. decrease in demand for tobacco products in key markets;
2. restrictions on promoting, marketing, packaging, labeling and usage
of tobacco products in markets in which we operate;
3. increases in excise, consumption or other taxes on tobacco products
in markets in which we operate;
4. litigation around the world alleging adverse health and fi nancial eff ects
resulting from, or relating to, tobacco products;
5. our ability to realize anticipated results of our acquisition or other
similar investments;
6. competition in markets in which we operate or into which we seek
to expand;
7. deterioration in economic conditions in areas that matter to us;
8. economic, regulatory and political changes, such as nationalization,
terrorism, wars and civil unrest, in countries in which we operate;
9. fl uctuations in foreign exchange rates and the costs of raw materials; and
10. catastrophes, including natural disasters.

FY2014: Results for the fi scal year ended December 31, 2014
Results for FY2014
2014 results (Like-for-Like basis, comparison with Jan-Dec 2013)
Jan Mar
Apr Jun
Jul Sep
Oct Dec
Jan Mar
Apr Jun
Jul Sep
OctDec
Domestic
International
2013 Jan – Dec 2014 Jan – Dec
Excluding Financial Statements and Notes
2014 results (Reported basis)
Jan Mar
Apr Jun
Jul Sep
Oct Dec
Jan Mar
Apr Jun
Jul Sep
OctDec
Domestic
International
FY2013 FY2014
Financial Statements and Notes
FY2015 Forecasts
2015 forecasts (comparison with Jan-Dec 2014)
Jan Mar
Apr Jun
Jul Sep
Oct Dec
Jan Mar
Apr Jun
Jul Sep
OctDec
Domestic
International
FY2014 FY2015
With regards to the forecast for FY2015, the fi gures are presented on
a January to December basis.
Like-for-Like basis(January-December 2014)
Reported basis(Nine months ended December 31, 2014)
Adjusted Operating Profi t(JPY BN)
660.1
Year-on-year
change
+7.8%
Year-on-year change
Constant Exchange Rates
+10.6%
Adjusted Operating Profi t(JPY BN)
588.6Dividend Payout Ratio(%)
–
Dividend Payout Ratio(%)
50.1Adjusted EPS(JPY)
239.01
Year-on-year
change
+7.7%
Year-on-year change
Constant Exchange Rates
+11.1%
Adjusted EPS(JPY)
224.75
In this fi scal year, the Company and its subsidiaries have
elected to unify their fi scal year ends to December 31
which will enhance and improve the effi ciency of the
closing and management systems.
FY2014, a transitional period for the change in
accounting period, covers nine months from April 1,
2014 to December 31, 2014 for the Japanese domestic
businesses and for the Company’s consolidated
subsidiaries whose current closing date was other than
December 31. For the international tobacco business
and its subsidiaries, accounting period remains the
same, from January – December 2014 (Reported basis).
For the purpose of fair business performance
comparison, we are providing fi gures for the twelve-
month period from January 1, 2014 to December
31, 2014 (Like-for-Like basis) with regard to all
business segments.
• In Financial Statements and Notes, FY2014 results
are shown on a Reported basis.
• Excluding Financial Statements and Notes, for the
purpose of fair comparison of business performance
2014 results are shown on a January to December
(Like-for-Like) basis.
MA
NA
GE
ME
NT
OP
ER
ATIO
NS
& A
NA
LYS
ISFIN
AN
CIA
L R
EV
IEW
FIN
AN
CIA
L S
TA
TE
ME
NTS
SH
AR
EH
OLD
ER
INFO
RM
ATIO
NO
TH
ER
INFO
RM
ATIO
N
JAPAN TOBACCO INC. ANNUAL REPORT FY2014 001
Financial Highlights

Investor Presentation in September 2014:
Conference room ready to greet the investors

Please be reminded that this section is intended
to explain the business operations of JT to investors,
but not to promote sales of tobacco products or to
encourage smoking by consumers.
004 At a Glance
006 Consolidated Five-year
Financial Summary
008 Message from the Chairman and CEO
010 CEO Business Review
012 Management Principle, Strategic
Framework and Resource Allocation
014 Business Plan 2015
015 Role and Priority of Each Business
016 Performance Measures
MA
NA
GE
ME
NT
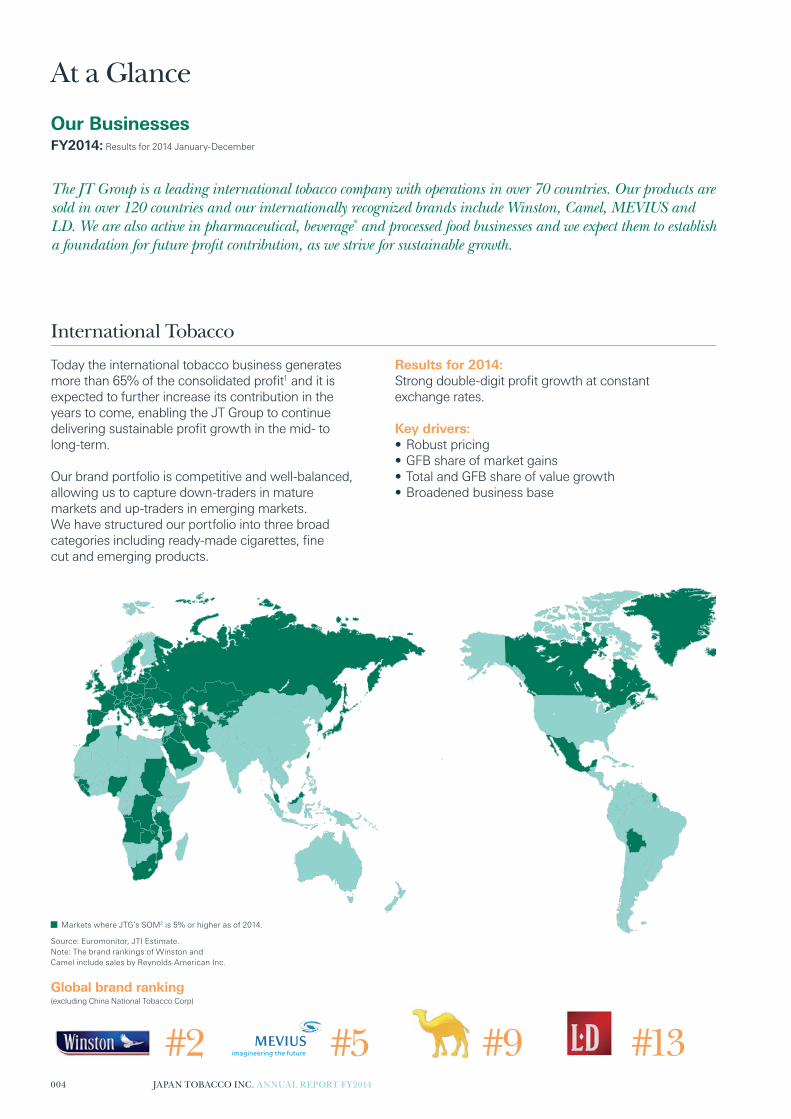
Our BusinessesFY2014: Results for 2014 January-December
The JT Group is a leading international tobacco company with operations in over 70 countries. Our products are sold in over 120 countries and our internationally recognized brands include Winston, Camel, MEVIUS and LD. We are also active in pharmaceutical, beverage* and processed food businesses and we expect them to establish a foundation for future profi t contribution, as we strive for sustainable growth.
International Tobacco
Today the international tobacco business generates
more than 65% of the consolidated profi t1 and it is
expected to further increase its contribution in the
years to come, enabling the JT Group to continue
delivering sustainable profi t growth in the mid- to
long-term.
Our brand portfolio is competitive and well-balanced,
allowing us to capture down-traders in mature
markets and up-traders in emerging markets.
We have structured our portfolio into three broad
categories including ready-made cigarettes, fi ne
cut and emerging products.
Results for 2014:Strong double-digit profi t growth at constant
exchange rates.
Key drivers:• Robust pricing
• GFB share of market gains
• Total and GFB share of value growth
• Broadened business base
Markets where JTG’s SOM2 is 5% or higher as of 2014.
Global brand ranking(excluding China National Tobacco Corp)
#2 #5 #9 #13
Source: Euromonitor, JTI Estimate.
Note: The brand rankings of Winston and
Camel include sales by Reynolds American Inc.
004 JAPAN TOBACCO INC. ANNUAL REPORT FY2014
At a Glance

Revenue breakdown by business segment
Others
0.5%Processed food
6.6%International tobacco
54.6%
Beverage
7.4%Pharmaceutical
2.7%Japanese domestic tobacco
28.2%
Composition of JT SOM2 as of 2014
OthersHope
MEVIUS
Caster
Cabin
Peace
Pianissimo
SevenStars
Tobacco business generated more than 80% of the consolidated revenue. In 2014, revenue of International tobacco business and Japanese domestic tobacco business increased 2.7% year- on-year to JPY 2,013.9 billion.
We are the market leader in Japan, one of the largest markets in
the world, with over 60% market share mainly driven by MEVIUS.
Our Japanese domestic tobacco business continues to be a
signifi cant profi t contributor to the JT Group, generating over
35% of our consolidated profi t1.
Japanese Domestic Tobacco
Pharmaceutical
We aim to build a unique, world-class pharmaceutical business
driven by R&D, and to increase our market presence through
original and innovative drugs. The pharmaceutical business is
currently focusing on the development, production, and sale of
prescription drugs.
During 2014, Group company Torii Pharmaceutical Co., Ltd. launched
‘Riona Tablets 250mg’ and ‘Cedartolen Sublingual Drop’ in Japan.
With Group company TableMark Co., Ltd. taking a central role, the
processed food business is primarily engaged in business concerning
frozen and ambient processed food, mainly staple food products
such as frozen noodles, frozen rice, packed rice and frozen baked
bread, and seasonings, including yeast extracts and oyster sauce.
We solidifi ed our number 3 position in the frozen food industry with
several top-selling products within respective categories, such as
frozen Udon noodles and frozen Okonomiyaki.
Processed Food
32.1%of our SOM2 is coming from MEVIUS,
showing resilience in the context of
intensifi ed competition.
1. Consolidated profi t: Consolidated adjusted operating profi t.
2. SOM: Share of market.
* We announced the withdrawal from the manufacture and sale of JT beverage products in February 2015.
Riona Tablets 250mg
For the improvement of hyperphosphatemia
in patients with chronic kidney disease
Cedartolen Sublingual Drop
Sublingual immunotherapy drug for
Japanese cedar pollinosis
JAPAN TOBACCO INC. ANNUAL REPORT FY2014 005
MA
NA
GE
ME
NT

Consolidated Five-year Financial Summary
Billions of yen
FY2010
(IFRS)
FY2011
(IFRS)
FY2012
(IFRS)
FY2013
(IFRS)
2013
(Jan-Dec)
2014
(Jan-Dec)
For the year:
Revenue (Note 1) 2,059.4 2,033.8 2,120.2 2,399.8 2,372.2 2,433.5
International Tobacco 963.5 966.3 1,010.7 1,270.0 1,270.0 1,328.0
Japanese Domestic Tobacco 665.8 646.2 687.1 710.3 690.5 685.9
Pharmaceutical 44.1 47.4 53.2 64.4 58.2 65.8
Food 367.5 359.4 – – – –
Beverage 188.8 185.5 184.5 183.8 181.3
Processed Food 170.7 168.7 156.9 157.2 161.2
Others 18.5 14.6 15.0 13.6 12.6 11.3
Core revenue (Note 2)
International Tobacco 887.8 894.6 943.1 1,200.7 1,200.7 1,258.2
Japanese Domestic Tobacco 632.2 611.9 654.0 676.2 656.3 649.8
Operating profi t (Note 3) 401.3 459.2 532.2 648.3 642.7 571.8
International Tobacco 225.9 252.4 289.4 376.4 376.4 379.5
Japanese Domestic Tobacco 202.3 209.3 241.3 258.1 235.6 181.5
Pharmaceutical (13.3) (13.5) (16.2) (9.0) (13.7) (7.3)
Food (3.6) 2.0 – – – –
Beverage 4.5 2.3 (2.1) (2.1) (0.5)
Processed Food (2.5) (5.8) (0.2) 0.7 (1.2)
Others (9.9) 9.0 21.2 25.0 45.7 19.9
Adjusted EBITDA/Adjusted operating profi t (Note 3) 522.0 577.1 622.0 641.8 612.6 660.1
International Tobacco 277.9 314.8 343.2 410.8 410.8 447.1
Japanese Domestic Tobacco 247.2 262.3 281.3 257.7 234.6 238.7
Pharmaceutical (9.8) (10.0) (12.7) (9.0) (13.7) (7.3)
Food 17.7 20.0 – – – –
Beverage 14.6 12.4 (2.1) (2.1) (0.5)
Processed Food 5.4 7.4 0.6 0.6 1.4
Others (11.0) (9.8) (9.6) (16.2) (17.6) (19.3)
Depreciation and amortization (Note 3) 118.0 118.8 116.5 132.9 132.7 139.5
Profi t (attributable to owners of the parent) (Note 4) 243.3 320.9 343.6 428.0 443.0 389.1
Free cash fl ow (FCF) (Note 5) 300.4 451.3 316.0 212.6 316.4 455.4
Japan Tobacco Inc. and Consolidated SubsidiariesFY2014: Results for the fi scal year ended December 31, 2014
FY2014, a transitional period for the change in accounting period, covers nine months from April 1, 2014 to December 31, 2014 for the Japanese domestic
business and for the Company’s consolidated subsidiaries whose current closing date was other than December 31. For the international tobacco business
and its subsidiaries, accounting period remains the same, from January – December 2014 (Reported basis).
For the purpose of fair business performance comparison, we are providing fi gures for the twelve-month period (Like-for-Like basis) with regard to all
business segments.
006 JAPAN TOBACCO INC. ANNUAL REPORT FY2014

FY2014: Results for the fi scal year ended December 31, 2014
Billions of yen
FY2010
(IFRS)
FY2011
(IFRS)
FY2012
(IFRS)
FY2013
(IFRS)
FY2014
(IFRS)
At year-end:
Assets 3,655.2 3,667.0 3,852.6 4,616.8 4,704.7
Interest-bearing Debts (Note 6) 709.1 502.4 327.2 375.9 228.2
Liabilities 2,053.9 1,952.4 1,960.1 2,020.7 2,082.2
Equity 1,601.3 1,714.6 1,892.4 2,596.1 2,622.5
Major Financial Ratios:
ROE (Note 7) 15.3% 20.3% 20.0% 19.9% 14.4%
ROA (Note 8) 10.2% 12.1% 13.5% 15.0% 10.8%
Equity Ratio (Note 9) 41.7% 44.6% 46.9% 54.3% 53.9%
Amounts per share: (in yen)
Diluted EPS (Notes 10/11) 25,407 168.44 180.98 235.35 199.56
Book value per share (attributable to owners of the parent) (Note 11) 160,180 858.09 993.98 1,378.57 1,395.74
Dividend per share (Note 11) 6,800 50 68 96 100.0
Dividend payout ratio (Note 12) 26.8% 29.7% 37.6% 40.8% 50.1%
Notes:
1. Excluding tobacco excise taxes and revenue from agent transactions.
2. Excluding revenue from distribution business of imported tobacco, among others,
in the Japanese domestic tobacco business, in addition to the distribution, private
label, contract manufacturing, and other peripheral businesses in the International
tobacco business.
3. (Before FY2012) Adjusted EBITDA = Operating profi t + depreciation and
amortization ± adjusted items (income and costs)*
*adjusted items (income and costs) = impairment losses on goodwill ±
restructuring income and costs ± others
(Since FY2013) Adjusted operating profi t = Operating profi t + amortization cost
of acquired intangibles + adjusted items (income and costs)*
*adjusted items (income and costs) = impairment losses on goodwill ±
restructuring income and costs ± others
4. Under IFRS, profi t is presented before deducting non-controlling interests.
For comparison, we show the profi t attributable to the owners of the
parent company.
5. FCF = (cash fl ows from operating activities + cash fl ows from investing activities)
excluding the following items:
From “cash fl ows from operating activities”: Interests and dividends received, and
their tax eff ect/interest paid and its tax eff ect.
From “cash fl ows from investing activities”: Purchase of securities/proceeds from
sale and redemption of securities/payments into time deposits/Proceeds from
withdrawal of time deposits/others (but not business-related investment securities,
which are included in the investment securities item).
6. Including lease obligation.
7. Return on equity (attributable to owners of the parent company)
8. ROA=(Profi t before income taxes)/Total assets [average of beginning
and ending balance of the period]
9. Equity ratio (attributable to owners of the parent company)
10. Based on profi t (attributable to owners of the parent company)
11. A 200-for-one share split is done, eff ective as of July 1, 2012.
Calculated on the assumption that this share split was conducted at
the beginning of FY2011 (April 1, 2011).
12. Based on profi t (attributable to owners of the parent company)
13. Financial data disclosed herein are basically rounded.
JAPAN TOBACCO INC. ANNUAL REPORT FY2014 007
MA
NA
GE
ME
NT

In 2014 we once again proved our ability to grow even in a challenging operating environment.
We would like to celebrate with you another successful
year for the JT Group. Despite a challenging operating
environment illustrated by fragile economy, increased
regulations and intensifi ed competition, our adjusted
operating profi t and adjusted EPS grew strongly on
a comparable basis.
Superior tobacco brands were key in delivering our
strong results. Leveraging the equity of its brands,
the international tobacco business most contributed
to the Group’s profi t growth. More importantly, this
performance was achieved without compromising
investment. We continued to strengthen our brands,
broaden geographical reach and expand capability in
emerging products for future top-line growth.
In addition, we adapted to changing market dynamics
by re-shaping organizations. In Europe, we proposed
a restructuring plan for two manufacturing facilities
to optimize our manufacturing footprint. In Japan,
the reorganization program for our tobacco business
operations, announced in October 2013, progressed
as planned. Furthermore, in February 2015 we
announced the withdrawal from manufacturing and
sales operation of JT branded beverages following
a thorough business review and considering the
Group’s optimal resource allocation.
Return to shareholdersUnderpinned by robust business and fi nancial
performances, our annual dividend per share was
increased from the previous year, even though,
in relation to the change in accounting period, the
Group’s reported results for fi scal year 2014 included
only nine months of Japanese operations. We have
consistently raised our dividend since the JT Group was
listed in 1994, and during the recent six-year period to
2014, compounded annual growth rate of our annual
dividend well exceeded 20%.
Moreover, on February 5, 2015, we announced
a share repurchase program of up to 100 billion yen, or
36 million shares which has completed in March 2015.
Implementation of this program further ensures high
single-digit growth rate of adjusted EPS for mid- to
long-term on a currency neutral basis, which is one
of our management targets.
008 JAPAN TOBACCO INC. ANNUAL REPORT FY2014
Message from the Chairman and CEO

Yasutake TangoChairman of the Board
Mitsuomi KoizumiPresident and CEO and Representative Director
SustainabilityOur management principle, the “4S” model, best
describes the JT Group’s approach to sustainability.
Under the “4S” model, we strive to balance the
interests of stakeholders and fulfi ll our responsibilities
towards them.
Given investors’ increasing interest in company’s
agenda for social and environmental responsibilities
as well as governance, we have been reinforcing
communication of sustainability performances to
enhance visibility for our activities. Such an eff ort
led to immediate outcomes. In 2014 JT was included
in the Dow Jones Sustainability Index Asia Pacifi c for
the fi rst time. JT Group Sustainability Report FY2014
will be issued sometime in June, in which you will fi nd
more about our sustainability initiatives. We continue
to contribute to society and remain responsible in
conducting businesses, while embracing diversity
within the Group.
In the years to comeOur well-conceived strategy and its excellent execution
drove the strong results in 2014. Looking ahead, the
operating environment is not expected to signifi cantly
improve anytime soon. In fact, our plan for 2015
assumes industry volume declines in key markets for
our tobacco business and signifi cant currency
headwinds which are forecast to impact fi nancials on a
reported basis. However, we stay on the right course
towards future sustainable profi t growth by prioritizing
business investment. In 2015 and beyond, the JT Group
is looking to adjusted operating profi t growth rate of
mid- to high- single digit at constant currency, as we
believe our business fundamentals are and will remain
sound and solid supported by investment.
This fi rm belief in business fundamentals leads us to
a shareholder return commitment for 2015, dividend
payout ratio of 50%, which is a comparable range to
the global FMCG players we have been benchmarking.
Accordingly, dividend per share will continue to increase.
In addition, the completed share repurchase program
should contribute to EPS growth.
We have confi dence in our strategy, our people and
our brands. Above all, we share the same value through
our management principle, which encourages and
motivates each member of the organization. We have
good reasons to believe that the JT Group will continue
to grow in the years to come.
JAPAN TOBACCO INC. ANNUAL REPORT FY2014 009
MA
NA
GE
ME
NT

Business investment remains our fi rst priority. We will increase investment in 2015 to secure long-term sustainable growth.
Mitsuomi KoizumiPresident and CEO
and Representative Director
Strong business momentumThe JT Group’s profi t growth continued. After 2009
when severely hit by economic turmoil and negative
currency movements, our profi t has been consistently
increasing. In 2014, we grew adjusted operating profi t
at 7.8% year over year, or 10.6% excluding adverse FX
impact. Our international tobacco business was the
growth driver, while the Japanese domestic tobacco
and other businesses delivered solid results.
Tobacco industry experienced various challenges in
2014. Economy was fragile across the globe, excise
tax hikes were steep in several markets, geopolitical
tension was mounting in certain areas, and regulations
became increasingly restrictive. As a result, we faced
severe industry contractions and accelerated down-
trading in some of our key markets. In addition, in the
competitive environment, aggressive tactical pricing
was observed in several markets, against which we
reluctantly responded in some cases.
Despite these diffi culties, our international tobacco
business repeated a double-digit adjusted operating
profi t growth of 13.1% on a currency neutral basis
driven mainly by strong pricing and supplemented
by continued cost control.
Our confi dence in brand equity, built through continuous
investment particularly in GFB, allowed us to pursue
pricing opportunities in various markets including
Russia, the UK and Ukraine among others. Furthermore,
effi ciency was sought across operations, and we
successfully managed material cost increases and
infl ation. Consequently, the international tobacco
business overcame negative volume development
due to industry volume decline and fulfi lled its role
as the profi t growth engine of the JT Group.
At the same time, eyeing on the future growth, the
international tobacco business rigorously expanded
earnings base both in geographical and product fronts.
We started to build foundations for our cigarette
business in Brazil, Egypt and Myanmar as well as
in markets where we are under-represented. In the
emerging product area, we took a meaningful step in
the E-Vapor category through the acquisition of
Zandera, the owner of E-Lites brand. The addition of this
well-established brand will accelerate our progress
toward leadership in emerging products.
In Japan, consumption tax, generally known as value
added tax, was hiked in April 2014. The Government
requested all industries including tobacco to take
appropriate price increases, indicating that companies
were advised not to look for excessive gains from
tax-led pricing. Accordingly, we revised our price list
by taking higher price increases for certain brands and
lower for others so that our average price increase met
the Government’s intention.
Impact of the price increase on industry volume was felt,
but within our expectation. However, there has been
a noticeable change in the competitive tactics, which
conceivably target down-traders. In fact, competitors
launched a number of new extensions below the
brand’s base price after the tax and price hike.
Under such a circumstance, we clearly distinguished
ourselves and focused our sales eff orts on brands of
higher price increase to retain consumers. Moreover,
underpinned by strong brand equity, our new product
off erings were focused on higher end with an aim to
further improve profi tability. Consequently, the Japanese
domestic tobacco business defended its market share
of over 60% despite intensifi ed competition.
010 JAPAN TOBACCO INC. ANNUAL REPORT FY2014
CEO Business Review

Improved unit selling price as well as effi cient cost
management more than off set volume downside,
leading to year-on-year increase in adjusted
operating profi t.
The pharmaceutical business is on the path to generate
profi t and its step-by-step progress continued during
2014. Most notably, we introduced two promising new
drugs in Japan, Riona Tablets for hyperphosphatemia
and Cedartolen Sublingual Drop for Japanese cedar
pollinosis. In addition, we out-licensed JTE-052, JAK
inhibitor, for topical use in dermatological indication
worldwide excluding Japan, to a partner renowned
in the relevant therapeutic area. We believe that these
achievements, solid performance of Torii Pharmaceutical
and growing loyalty revenues from Stribild and Mekinist
will turn our pharmaceutical business to a profi t
contributor in the foreseeable future, as early as in 2016.
The processed food business weathered another diffi cult
year. Japanese economy saw a sign of recovery, but the
defl ationary mindset of the population persisted. Material
cost increases mainly due to weaker yen and increased
competition among other factors put additional pressure
on earnings. However, solid performance of staple
food products, our focus area, and successful cost
management resulted in adjusted operating profi t
improvement from the previous year.
The beverage business experienced unfavorable
weather condition in summer as well as intensive
competition, and these factors collectively brought
negative impact on our revenue. Despite that,
additional focus on cost optimization contributed
to a year-on-year earnings improvement.
Reshaping foundationIn 2014 our businesses remained strong. Notwithstanding,
with an aim to achieve sustainable profi t growth for a
mid- to long-term, we engaged in initiatives to strengthen
our business foundation, most of which required
tough decisions.
In February 2015 we announced the exit from
manufacturing and sales operations of JT branded
beverages, expecting the timing of the exit by the
end of September 2015. The JT Group started these
operations in 1988, and marketed several unique
brands since then. However, according to our analysis
the overall beverage industry has matured and certain
scale of business is required for the market players to
sustain profi t growth. After carefully considering the
growth strategy for these operations, we concluded
that it would be diffi cult for them to make a profi table
contribution to the JT Group in the mid- to long-term.
Meanwhile, we will continue the beverage vending
machine operation conducted by our subsidiaries,
and seek various options for these subsidiaries.
The international tobacco business made a diffi cult
proposal to optimize product sourcing by adjusting
and relocating manufacturing capability within Europe.
This initiative is to respond to the expected market
development in this region, notably industry contraction
and the planned introduction of new regulations, known
as “Revised European Tobacco Product Directive”,
which will cause a signifi cant impact on the entire EU
tobacco industry. As of March 2015 we started discussing
the closure of manufacturing operations of two facilities,
one in Lisnafi llan, Northern Ireland and the other in
Wervik, Belgium. Under the current proposal, their
production as well as most of OTP manufacturing
function in Trier, Germany, will be moved to existing
factories in Poland and Romania.
The processed food business will be implementing a
program to transfer certain employees to the TableMark
Group companies in April 2015. This program to move
employees within the JT Group ensures the unity of
the TableMark Group employees coming from various
backgrounds after a series of acquisitions.
Reorganization of the Japanese domestic tobacco
business is on track, re-arranging the organizations and
preparing for offi ce and factory closures. As part of the
process, approximately 1,750 employees applied for a
voluntary retirement program, and most of the applicants
will leave the JT Group at the end of March 2015.
Investing now, delivering in the futureThe JT Group prioritizes business investment that leads
to sustainable profi t growth. This policy is refl ected in
our 2015 plan to increase investment from the previous
year, notably with an aim to accelerate development of
emerging products and “seeding” markets. These two
areas represent points of strategic emphasis on top of
continuous brand equity enhancement. We are not
expecting immediate return from the investments in
these areas; rather we regard them as future growth
drivers. The current operating environment is all the
more challenging and uncertain. Thinking short-term,
it would be tempting to reduce investment to secure
profi t, but this approach cannot be sustainable.
Instead, we think long-term, we continue to invest
during this diffi cult time, to enjoy the most benefi t
from the investment when the environment stabilizes.
This approach proved successful in the past in helping
us weather similar turmoil. Incorporating the additional
investments, the JT Group plans year-on-year adjusted
operating profi t growth of approximately 7% in 2015 at
constant currency driven by our core tobacco business.
Our proven strategies remain unchanged. We will
continue to enhance our brand equity and broaden
earnings base for quality top-line growth. In and after
2015, cost reduction will be realized from certain
initiatives taken in 2014. We will stay committed to
pursuing effi ciency to build a competitive cost base.
Our eff orts to further establish robust business
foundation will continue. We will respond to the
evolving environment and reshape our organizations
so that our talented and diverse employees can perform
up to or even exceed their capabilities. With these
strategies in place, the JT Group is well-positioned to
achieve sustainable growth in the mid- to long-term.
JAPAN TOBACCO INC. ANNUAL REPORT FY2014 011
MA
NA
GE
ME
NT

Shareholders
Consumers
Employees Society
The “4S” model, our management principle, is the most shared value among JT Group employees across businesses and countries.
The “4S” model is JT Group’s core competency.
Our decision making has been and will continue to be
based on this management principle. To balance the
interests of and fulfi ll responsibilities towards
stakeholders and exceed their expectations;
• For our consumers, we will off er superior products
which meet or even go beyond their evolving needs.
To achieve that, we will make the most of JT Group’s
diversity to enhance our capability in innovation.
• For our shareholders, we will continue to seek an
optimal balance between profi t growth through
business investment and shareholder returns
comparable to global FMCG players.
• For our employees, we will further evolve to become
an attractive and respected company so that
employees feel proud to be a part of it. For that,
we will highly value the employees with a strong
sense of commitment to deliverables and properly
reward their accomplishments.
• The growth of the JT Group is dependent on
sustainability of society. We will continue to
contribute to society and eventually enhance
our company value.
Quality top-line growthAmong the strategic pillars, the JT Group places a
particular emphasis on quality top-line growth, which is
indispensable for sustainable growth. We aim to grow
top-line by consistently off ering innovative products. For
example, in both international and Japanese domestic
tobacco businesses, innovative off erings such as XS and
capsule supported share of market and share of value
performances in 2014. Also, we emphasize on key
areas, brands or products to achieve top-line growth.
In tobacco businesses, we continued to focus on GFB
and certain local brands. Our pharmaceutical business
concentrated its R&D eff orts on glucose and lipid
metabolism, virus research as well as immune disorders
and infl ammation as in the past. And staple foods
remained the focus area for processed food business.
Competitive cost baseThe JT Group has a history to proactively address cost
optimization, even before cost increase becomes a
serious problem. 2014 was no exception. As explained
in the previous sections, we implemented various
initiatives across businesses which will enhance
effi ciency. More importantly, these initiatives were
intended not merely to reduce costs, but to strengthen the
business operations. We continuously seek to improve
cost base, while not compromising investments for
future sustainable growth.
Robust business foundationBusiness environment surrounding the JT Group
has been changing fast. In order to respond to and
even take advantage of the changes, we encourage
each employee and organization to challenge the
status quo for continuous improvement. We believe
that our talented and diverse employees are the
cornerstone of business growth. We have been
off ering various development opportunities for
them and listening to their feedback via employee
engagement survey conducted regularly.
Management Principle
Strategic Framework
Our track record proves that our strategy is right, and we believe that it will continue to underpin the strong performance of the JT Group.
012 JAPAN TOBACCO INC. ANNUAL REPORT FY2014
Management Principle, Strategic Framework and Resource Allocation

FY2010 FY2011 FY2012 FY2013 FY2014 FY2015Forecast
Dividend per share(JPY)
108
96100
Business investment and capital policyThe JT Group is a growth company. Investing for both
external and organic growth, we historically increased
profi t, and eventually corporate value. We believe that
opportunities exist to expand earnings base especially
for tobacco business. Our investment will mainly focus
on this core business to fuel its growth. As we expect
pharmaceutical and processed food businesses to
contribute to the Group profi t in the future, we will
allocate our funds to best utilize existing assets and
improve their profi tability.
Under the Japan Tobacco Inc. law, we are subject
to restriction in issuing new shares. Given the
circumstance, we plan to maintain a strong balance sheet
for debt fi nancing and not to cancel treasury stock.
With suffi cient debt capacity, we can consider share
repurchase when the Government, who holds one-third
of our outstanding shares, releases them, in whole or in
part, in the future.
Shareholder ReturnAs profi t increased, we have consistently improved
return to shareholders. Our benchmark in this regard is
global FMCG players, not tobacco peers, and we aim
to off er shareholders a return comparable to FMCG
companies. We set targets for dividend payout ratio
and EPS growth. As for EPS, our objective is to grow
adjusted EPS at constant FX, which excludes one-off
fi nancial infl uences from such as restructuring as well as
impact from currency movements. We intend to achieve
the target for EPS growth through profi t increase from
operations; however, we would consider a share
buy-back program to supplement the EPS growth,
if necessary to reach our target.
Resource Allocation
First, we grow profi t through business investment. Then, use this profi t to return cash to our shareholders.
JAPAN TOBACCO INC. ANNUAL REPORT FY2014 013
MA
NA
GE
ME
NT

+6.8% -11.4%
Adjusted operating profit(JPY BN)
2014Jan-Dec
Business momentum
FY2015(Jan-Dec)Forecast
at current currency
Local currencyvs USD
FX effects
JPY vs USDFX effects
2015(Jan-Dec)Forecast
660.1
44.9
705.0
-153.0
33.0585.0
Dividend per share (JPY)
100 108
+8.0
FY2014 FY2015Forecast
The JT Group’s Business Plan covers a three-year period, and is rolled-over annually to refl ect the changes in our business environment including economics, geopolitics and competition. By leveraging and enhancing our ability to adapt to changes, we will achieve sustainable profi t growth.
Group profi t target:• Adjusted operating profi t at constant currency over mid- to long-term:
– Mid to high single-digit annual average growth rate
Shareholder return targets:• Consolidated dividend payout ratio:
– A level comparable to global FMCG players and no less than 50%
– 50% in FY2015
• Adjusted EPS at constant currency over mid- to long-term:
– High single-digit annual average growth rate
Forecast for FY2015
• We will achieve dividend payout ratio of 50%
in FY2015. Accordingly, dividend per share will
continue to increase and reach 108 yen. In addition,
share repurchase program of up to 100 billion yen or
36 million shares was initiated in February 2015 and
completed in ensuring month. This program aims
to complement the EPS growth to ensure that we
achieve the target in Business Plan 2015 and beyond.
* Adjusted items (income and costs) = impairment losses on goodwill ± restructuring income and costs ± others.
• Adjusted operating profi t is forecast to grow
6.8% at constant currency. International tobacco
business, the profi t growth engine, is expected
to grow its currency neutral adjusted operating
profi t at 8% driven by top-line. Japanese domestic
tobacco business is projected to increase adjusted
operating profi t at approximately 5% mainly through
cost optimization.
• On a reported basis, adjusted operating profi t is
forecast to decline 11.4%, as negative currency
impact, most notably weak Russian ruble, exceeds
strong business performance.
014 JAPAN TOBACCO INC. ANNUAL REPORT FY2014
Business Plan 2015

Grow adjusted operating profi t at mid to high single-
digit rate per annum over the mid- to long-term as the
core business and profi t growth engine of the JT Group.
International Tobacco Business
p28
Continue to strengthen its role as the group’s
profi t growth engine
Japanese Domestic Tobacco Business
p34
Maintain its highly competitive platform
of profi tability
• Prioritize quality top-line growth
– strengthen our brand equity with focus on core brands
– grow or maintain market share in existing key markets
• Continue to improve cost base
• Strengthen business base
– broaden geographical earnings base
– develop emerging products categories
Pharmaceutical BusinessStrive to strengthen the profi t base through value maximization
of each product and R&D promotion for next generation of
strategic compounds. p38
p42
Processed Food BusinessAchieve operating profi t margin on par with industry average,
aiming to make profi t contribution to the JT Group.
In view of Business Plan 2015, the role and priorities of each business in the mid- to long-term are as follows.
Tobacco Business
JAPAN TOBACCO INC. ANNUAL REPORT FY2014 015
MA
NA
GE
ME
NT
Role and Priority of Each Business

International tobacco (BnU)
2012 2013 2014
436.5 417.5 398.0
Calendar year basis
GFB shipment volume (BnU)
2012 2013 2014
268.8 267.5 262.2
Calendar year basis
Japanese domestic tobacco (BnU)
FY2012 2013Jan-Dec
2014Jan-Dec
116.2 116.5 112.4
Performance Measures
Tobacco sales volume
GFB shipment volume
-4.7% to 398.0 BnU
-2.0% to 262.2 BnU
-3.6% to 112.4 BnU
For the international tobacco business, total shipment volume
includes fi ne cut, cigars, pipe tobacco and snus, but excludes
contract manufactured products, waterpipe tobacco products
and emerging products.
Shipment volume of GFBs, namely Winston, Camel, MEVIUS,
LD, B&H, Silk Cut, Glamour and Sobranie in the international
tobacco business.
For Japanese domestic tobacco, total sales volume excludes sales
volume of Japanese domestic duty free and the China business.
In our Business Plan 2015, targets are set for adjusted Operating Profi t growth rate at constant exchange rates, as well as consolidated dividend payout ratio and adjusted EPS growth rate at constant exchange rates. While they are mid- to long-term targets, we also monitor these performance measures annually.
In our strategic framework to achieve adjusted Operating Profi t growth rate, the JT Group places a particular
emphasis on “quality top-line growth”, while, at the same time, focusing on building a “competitive cost base”
and “robust business foundations”. In line with our strategic emphasis, the measures to review our business
performance are skewed towards top-line related indicators. As for shareholder return, we have selected
three indicators to monitor the improvement.
FY2014: Results for the fi scal year ended December 31, 2014
016 JAPAN TOBACCO INC. ANNUAL REPORT FY2014

Revenue (JPY BN)
FY2012 2013Jan-Dec
2014Jan-Dec
2,120.2
2,372.22,433.5
Japanese domestic tobacco (JPY BN)
FY2012 2013Jan-Dec
2014Jan-Dec
654.0656.3
649.8
International tobacco (US$ MM)
Calendar year basis
2012Restated*
2013 Operations 2014 at constant
currency
FX 2014
11,655
12,273
427
12,700
-790
11,911
* See glossary of terms.
Revenue
Core revenues
+3.5% at constant exchange rates to US$ 12,700 MM
+2.6% to JPY 2,433.5 BN
-1.0% to JPY 649.8 BN
For the international tobacco business, US dollar-based core
revenue includes revenue from waterpipe tobacco products
and emerging products, but excludes revenues from distribution,
contract manufacturing and other peripheral businesses.
Revenue on a consolidated basis which, for the avoidance of
doubt, excludes excise and other similar taxes, as well as sales
from transactions in which the JT Group acts as an agent.
For the Japanese domestic tobacco business, core revenue
excludes revenue from distribution of imported tobacco in
Japan, among others.
JAPAN TOBACCO INC. ANNUAL REPORT FY2014 017
MA
NA
GE
ME
NT

Dividend payout ratio (%)
FY2012 FY2013 FY2014
37.6
40.8
50.1
Adjusted Operating Profit(JPY BN)
FY2012 2013Jan-Dec
Operations 2014 at constant
currency
FX 2014Jan-Dec
622.0 612.6
65.1
677.8
-17.7
660.1
Adjusted Operating Profi t
Dividend payout ratio
+10.6% at constant exchange ratesto JPY 677.8 BN
+7.8% including currency impactto JPY 660.1 BN
Adjusted operating profi t is calculated as follows:
Adjusted operating profi t = Operating profi t + Amortization cost of
acquired intangibles + Adjustment items (income and costs)*
* Adjustment items (income and costs) are impairment losses on goodwill,
restructuring related income and costs and others.
Dividend per share divided by profi t attributable to owners
of the parent company per share.
CAGR13.2%adjusted operating profi t (JPY) growth rate1 over the past fi ve years
FY2014: Results for the fi scal year ended December 31, 2014
1. The calculation was based on operating profi t for FY2010, FY2011 and FY2012
and adjusted operating profi t for Jan-Dec 2013 and 2014.
018 JAPAN TOBACCO INC. ANNUAL REPORT FY2014
Performance Measures continued

Adjusted EPS (diluted) (JPY)
2012 2013Jan-Dec
Operations 2014 atconstantcurrency
FX 2014Jan-Dec
173.64
221.98
24.59
246.57
-7.56
239.01
Dividend per share (JPY)
FY2012 FY2013 FY2014
68
96 100
+11.1% at constant exchange ratesto JPY 246.57
+7.7% including currency impactto JPY 239.01
Adjusted EPS is calculated as follows:
Adjusted EPS = (Profi t or loss attributable to owners of the
parent company ± adjustment items (income and costs)* ± tax
and minority interests adjustments) / (weighted-average common
shares + increased number of ordinary shares under subscription
rights to shares).
* Adjustment items (income and costs) are impairment losses on goodwill,
restructuring related income and costs and others.
Dividend per share
The sum of interim and year-end dividends per share, the record
dates of which fall in the relevant fi scal year.
CAGR31%dividend per share growth over the past fi ve years
Adjusted EPS (diluted)
+4 yen to 100 yen
JAPAN TOBACCO INC. ANNUAL REPORT FY2014 019
MA
NA
GE
ME
NT

Factory fl oor of Kansai factory:
One of the key tobacco manufacturing plants in Japan

022 Industry Overview
026 Review of Operations
045 JT Group and Sustainability
046 Risk Factors
050 Corporate Governance
Please be reminded that this section is intended
to explain the business operations of JT to investors,
but not to promote sales of tobacco products or to
encourage smoking by consumers.
OP
ER
ATIO
NS
& A
NA
LYS
IS

Tobacco industry
Market dynamicsThere are many types of tobacco products available in
today’s marketplace. Cigarettes remain the most popular
choice for consumers, while fi ne-cut, cigars, pipe
tobacco, snuff , chewing tobacco and water-pipe tobacco
continue to draw consumers’ interest, with some of these
product categories increasing their volumes worldwide.
In addition, the next generation of emerging products such
as electronic cigarettes (e-cigarettes) have become widely
popular, particularly in the US and European markets.
E-cigarettes use vaporized liquid solutions often containing
nicotine, and vapor is inhaled to off er a diff erent experience.
Recently, other type of emerging products referred to as
‘E-Vapor’ or ‘Heat-not-Burn’ cigarette products, have
become available to consumers. Unlike e-cigarettes,
E-Vapor products often use tobacco leaf and are therefore
taxed and regulated as cigarette products. Although
market size for e-cigarettes or E-Vapor is still small, further
innovation and product off erings are anticipated, as market
players take keen interest in this new growing category.
Approximately 5.7 trillion cigarettes are consumed
around the world. China is by far the largest market,
accounting for over 40% of global consumption, but it is
almost exclusively operated by a state monopoly. Russia,
the U.S., Indonesia and Japan are the next four largest
markets, according to a survey conducted in 2013*.
In general, the market dynamics are distinctively diff erent
between mature and emerging markets. In mature markets,
industry volume tends to decline refl ecting various factors
such as limited economic growth, tax increases, tightening
regulations, and demographic changes, among others.
In addition, down-trading is prevalent in these markets.
Consumers are inclined to seek more value as they feel
tobacco products become less aff ordable in the context
of limited growth of disposable income. Recently, these
trends have been notable in EU countries, as weak
economic conditions accelerate industry contraction
and down-trading.
In emerging markets, on the other hand, total
consumption tends to increase, driven by population
growth and economic development, particularly in
Asia, the Middle East and Africa. As their disposable
income increases, consumers look for quality and
trade up to products in higher price bands.
Overall, when we exclude China, global industry volume
has been slightly decreasing according to a survey
conducted in 2014*. However, more importantly,
industry value continues to grow even in the current
diffi cult operating environment, mainly driven by price
increases. This is a sign of the resilience of the industry.
These trends – decline in volume and increase in value
– are expected to continue in the years ahead.
RegulationsThe regulatory environment continues to be more
restrictive for the tobacco industry. Restrictions on
promotions and advertisements are the most common
around the world. An increasing number of markets
are introducing bans on smoking in public places and
promoting larger health warnings on product packaging,
in some cases with pictorial health warnings.
Recent regulations are focusing more on the product
itself. Plain packaging has been introduced in some
markets and furthermore, regulators are becoming
more aggressive by restricting ingredients and emissions,
following the guidelines on these attributes proposed by
the Framework Convention on Tobacco Control. In
Europe, a revised European Tobacco Directive adopted
extended health warnings, reduction in the number of
pack formats or restrictions on the use of additives,
among others. We expect to see EU member states
complying with these restrictions by May 2017. These
moves to commoditize tobacco products will undermine
fair competition among tobacco manufacturers trying to
meet increasingly diverse consumer preferences. Worse,
they could result in an undesired increase in illicit trade, as
commoditized products with less uniqueness are easier
to counterfeit and more diffi cult to detect when smuggled.
Excise taxes were raised in various markets during the past
year, and in general, tax increases are passed onto prices.
However, repeated tax increases in a short period of time,
or steep tax increases, could lead to a decline in industry
volume. Often, tax increases coincide with an increase in
illicit trade, which could in turn aff ect our business.
CompetitionExcluding China, two-thirds of world industry volume
is produced by four major global tobacco companies,
namely Philip Morris International Inc., British American
Tobacco Plc., Japan Tobacco Inc. and Imperial Tobacco
Group Plc*. The competition within the industry is intense
and, as consumers’ needs and preferences continue to
diversify, a strong portfolio with established brands is
increasingly important to support market share gains.
Therefore, major global companies are focusing on brand
equity enhancement to strengthen their brand portfolios
by introducing innovative products. In addition to the
pursuit of organic growth, M&A is an eff ective way to
supplement growth opportunities in this industry.
Tobacco
* Source: Euromonitor, excluding e-cigarettes (2014 data).
022 JAPAN TOBACCO INC. ANNUAL REPORT FY2014
Industry Overview
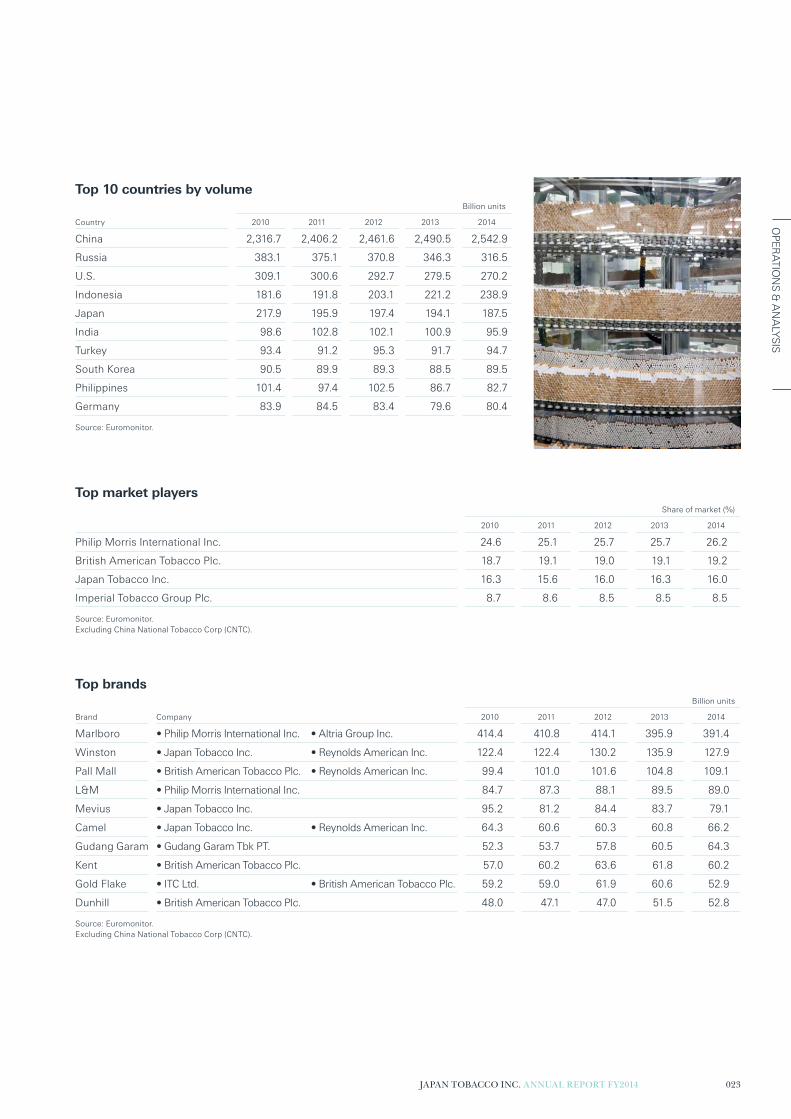
Top 10 countries by volumeBillion units
Country 2010 2011 2012 2013 2014
China 2,316.7 2,406.2 2,461.6 2,490.5 2,542.9
Russia 383.1 375.1 370.8 346.3 316.5
U.S. 309.1 300.6 292.7 279.5 270.2
Indonesia 181.6 191.8 203.1 221.2 238.9
Japan 217.9 195.9 197.4 194.1 187.5
India 98.6 102.8 102.1 100.9 95.9
Turkey 93.4 91.2 95.3 91.7 94.7
South Korea 90.5 89.9 89.3 88.5 89.5
Philippines 101.4 97.4 102.5 86.7 82.7
Germany 83.9 84.5 83.4 79.6 80.4
Source: Euromonitor.
Top brandsBillion units
Brand Company 2010 2011 2012 2013 2014
Marlboro • Philip Morris International Inc. • Altria Group Inc. 414.4 410.8 414.1 395.9 391.4
Winston • Japan Tobacco Inc. • Reynolds American Inc. 122.4 122.4 130.2 135.9 127.9
Pall Mall • British American Tobacco Plc. • Reynolds American Inc. 99.4 101.0 101.6 104.8 109.1
L&M • Philip Morris International Inc. 84.7 87.3 88.1 89.5 89.0
Mevius • Japan Tobacco Inc. 95.2 81.2 84.4 83.7 79.1
Camel • Japan Tobacco Inc. • Reynolds American Inc. 64.3 60.6 60.3 60.8 66.2
Gudang Garam • Gudang Garam Tbk PT. 52.3 53.7 57.8 60.5 64.3
Kent • British American Tobacco Plc. 57.0 60.2 63.6 61.8 60.2
Gold Flake • ITC Ltd. • British American Tobacco Plc. 59.2 59.0 61.9 60.6 52.9
Dunhill • British American Tobacco Plc. 48.0 47.1 47.0 51.5 52.8
Source: Euromonitor.
Excluding China National Tobacco Corp (CNTC).
Top market playersShare of market (%)
2010 2011 2012 2013 2014
Philip Morris International Inc. 24.6 25.1 25.7 25.7 26.2
British American Tobacco Plc. 18.7 19.1 19.0 19.1 19.2
Japan Tobacco Inc. 16.3 15.6 16.0 16.3 16.0
Imperial Tobacco Group Plc. 8.7 8.6 8.5 8.5 8.5
Source: Euromonitor.
Excluding China National Tobacco Corp (CNTC).
OP
ER
ATIO
NS
& A
NA
LYS
IS
JAPAN TOBACCO INC. ANNUAL REPORT FY2014 023

36.8% North America
29.2% Europe
9.6% Japan
24.4% Others
2013 Regional Composition
Source: 2014 IMS Health.
Pharmaceutical
Market dynamicsThe global pharmaceutical market continues to grow,
reaching sales of approximately US$980 billion in
2013 according to IMS Health.
In emerging countries, demand for modern medicine
is rapidly growing due to multiple factors including
growing consciousness of health, increase in
population, and development of public healthcare
systems, among others. Mature markets also see a
value increase, though the pace of growth is moderate.
Facing a rapidly aging society and a fi scal defi cit, the
governments in these markets try to contain healthcare
costs through wider promotion of generic drugs.
In addition, patents of commercially successful
drugs have been expiring during recent years, which
accelerates the global trend of industry consolidation.
Mature markets hold majority of share in global
pharmaceutical markets. North America is the largest
market and accounts for 37% of the worldwide market,
followed by Europe and Japan, representing 29% and
10%, respectively.
In Japan, the main market for our pharmaceutical
business, prescription drugs comprise the majority
of the market in terms of net sales. The Japanese
generic drug market for prescription drugs is still small
compared with that in the U.S. and Europe. However,
it has been expanding more recently due in part to
government promotion of generic drugs in order to
control medical care expenses.
In Japan, the government determines the price of
pharmaceutical products with revisions being made
every two years. In April 2014, the latest round of price
revisions led to an industry-wide reduction of drug
prices by 5.6% on average excluding consumption
tax increase.
CompetitionThe pharmaceutical industry is highly competitive
worldwide. Our pharmaceutical business focuses
on building a R&D-led operational platform. Based on
this platform, original compounds are developed and
marketed as leading products in major global markets.
As such, we face competition with Japanese and
multinational pharmaceutical companies. These
companies are also focused on their research
and development pipelines.
100
300
500
700
900
1100
2009 2010 2011 2012 2013
Worldwide Pharmaceutical Market(US$ BN)
830.6891.3
965.2 957.3 980.1
Source: 2014 IMS Health.
024 JAPAN TOBACCO INC. ANNUAL REPORT FY2014
Industry Overview continued

processed food business is also signifi cantly impacted
by developments in the wholesale and retail sales
channels, particularly by their consolidation. We will
continue to monitor the development of these channels,
especially in the area of M&A.
In response to the April 2014 consumption tax increase,
whereby consumption tax was raised from 5% to 8%,
food manufacturers managed the tax hike in a number
of ways, for example by raising prices in conjunction
with product renewals or reducing cost by amending
product specifi cations.
CompetitionTableMark is competing against major players like
Nichirei, Maruha Nichiro, Ajinomoto and Nissui
as well as a multitude of mid-or small-scale producers.
We are seeing a polarization of retailers as well as
reorganization and oligopolization of the wholesale
sector led by sogo-shosha, the general trading
companies, resulting in stronger price negotiation
power against manufacturers. We are also seeing
an increase in private label brands.
21.4% Nichirei
15.8% Maruha Nichiro
12.6% TableMark
10.8% Ajinomoto
8.0% Nissui
31.4% Others
2013 Share of Market by Frozen Food Manufacture
Source: The Nikkei Business Daily.
Market dynamicsJT’s processed food business is operated through our
subsidiary TableMark Co., Ltd. (TableMark) which plays
a central role in our processed food business. TableMark
focuses on frozen food such as frozen noodles, frozen
rice and bread, ambient processed food represented
by packed-cooked rice, seasoning business utilizing our
yeast technology, and bakery business.
The size of the Japanese frozen food market in 2013 on
a consumption basis including imports was ¥977.1
billion, up 8.7% year-on-year (Source: Japan Frozen
Food Association). This was due to an increase in
household consumption of frozen food arising from
stronger preference for eating-in after the Great East
Japan Earthquake. Product development eff orts by
manufacturers also contributed to the growth, as well as
the use of frozen food in restaurants, so demand for
them remained solid throughout the year.
For the Japanese processed food industry, we expect to
see additional price increases in imported raw materials
and prices of raw materials remaining at high levels. The
100
300
500
700
900
1100
2009 2010 2011 2012 2013
Japanese Frozen Food Market(JPY BN)
832.7 832.8 859.3 899.2 977.1
Source: Japan Frozen Food Association.
Processed Food
OP
ER
ATIO
NS
& A
NA
LYS
IS
JAPAN TOBACCO INC. ANNUAL REPORT FY2014 025

R&D
Create value for the business through
innovation and quality
• We focus on fundamental research
and product technology development,
taking advantage of our global research
platform, in close collaboration with other
functions. In particular, focus areas in our
R&D activities are:
– Develop products and analytical
capabilities in line with market needs
and our anticipation of regulatory trends.
– Maintain existing products to comply
with regulatory changes.
– Develop new technologies and improve
production processes to maintain
competitiveness and increase effi ciency.
– Drive product innovation to enhance
brand equity from various aspects,
including tobacco leaves, blends,
fi lters, printing techniques and packaging.
– Develop emerging products.
Procurement
Ensure stable supply of quality tobacco leaf
• Tobacco leaf is the most important
material for our products, and we dedicate
our eff orts to strengthen our capability
to ensure a stable supply of quality leaf
in the long-term.
– Increase the proportion of leaf from
our vertical integration bases in Africa,
Brazil and the U.S.
– Enhance sustainability of tobacco
farming by helping farmers to improve
productivity as well as taking initiatives
to support their communities.
– Maintain good relationships with
external suppliers to ensure suffi cient
supply at competitive prices.
• With regard to non-tobacco-materials,
we aim to mitigate cost increases due
to design enhancements and investment
in innovative products by, among others,
eff ectively managing procurement lot-size.
026 JAPAN TOBACCO INC. ANNUAL REPORT FY2014
Review of Operations
Tobacco Business Value Chain

Manufacturing
Support top-line growth by delivering
quality products
• Our emphasis on product quality
is increasing to meet consumer
expectations for innovative off erings.
In addition, we consistently pursue an
optimal manufacturing footprint which
ensures effi cient and timely product
deliveries to markets.
– Strengthen our ability for business
continuity in times of emergency.
– Ensure high quality of products and
enhance fl exibility in the manufacturing
process, overcoming complexity
in manufacturing due to an increase
in number of products.
– At the same time, seek effi ciency by
containing cost increases through
continuous improvement and
reviewing manufacturing footprint
for further optimization.
Marketing
Enhance equity of fl agship brands
• Our strategic focus is placed on our
fl agship brands and we strive to
enhance their equity through eff ective
communications with consumers.
– Allocate appropriate resources
to support GFB’s equity building.
– Implement eff ective marketing
programs, in compliance with
applicable laws and regulations
as well as our own marketing code.
Sales & Distribution
Expand product availability by leveraging
our trade marketing excellence
• There are various sales channels for
tobacco products such as supermarkets,
convenience stores, street and train
station kiosks, small independent retailers
and vending machines. Key channels are
diff erent depending on market and we
develop win-win relationships with them
to increase the availability of our products.
– Strengthen relationship with key
accounts, leveraging our trained
sales forces.
– Develop trade marketing initiatives
for each market, taking into account
the channel development as
well as consumer trends and
competitors’ actions.
OP
ER
ATIO
NS
& A
NA
LYS
IS
JAPAN TOBACCO INC. ANNUAL REPORT FY2014 027

International Tobacco BusinessFY2014: Results for the fi scal year ended December 31, 2014
+3.5%Constant currency
+1.1%Year-on-year change
+13.1%Constant currency
-4.7%Year-on-year change
-3.0%Year-on-year change
-2.0%Year-on-year change
4,253Adjusted operating profi t (US$ MM)
398.0Total Shipment Volume (BnU)
11,911Core Revenue (US$ MM)
262.2GFB Shipment Volume (BnU)
JTI represents the international activities of the JT Group’s tobacco business. JTI manufactures and sells some 90 brands in more than 120 countries. It is the profi t growth engine of the Group, driven by its diversifi ed geographic profi le and the strength of its brands and people.
“In 2014, JTI yet again delivered strong fi nancial results
with adjusted operating profi t growing 13.1% at
constant rates of exchange driven by robust pricing
and share momentum.
Our continued investment behind our brands enabled us
to maintain our total share of market while growing total
share of value, despite industry volume contraction in
some key markets. We also grew both Global Flagship
Brands (GFB) share of market and share of value.
In the fi ne cut category, we continued to grow both
volume and share of market. This was driven by our GFBs
and strong brands like Amber Leaf and Old Holborn.
JTI enhanced its presence in the growing emerging
products category with the acquisition of Zandera,
owner of E-Lites, a leading e-cigarette brand in the UK.
Another cornerstone of our growth is our people.
The recently awarded Top Employer Global 2015
certifi cation recognizes the high standards we have
set ourselves globally in fostering a work environment
where employees can excel.
Importantly, solid pricing, combined with cost effi ciencies
and benefi ts related to Megapolis, resulted in another
year of double-digit profi t growth at constant currency.
For 2015, we forecast GFB volume growth and continued
market share momentum. We will step up investments
in our emerging products portfolio while also enhancing
our organic growth by focusing on areas where our
presence is limited and by pursuing opportunities to
expand into new markets.
While the environment will remain challenging, we
expect our 2015 earnings to grow by 8% at constant
currency, enabling JTI to continue to be the profi t engine
of the JT Group.”
Thomas A. McCoy President & CEO, JTI
Our strategiesOur priorities are to continue achieving quality top-line
growth and broadening our earnings base. JTI’s
business strategies are guided and underpinned
by the principle of continuous improvement.
Our key strategies are:
• Build and nurture outstanding brands
• Continuously enhance productivity
• Maintain focus on responsibility and credibility
• Strengthen human resources as a cornerstone
of growth
Review of operations:Despite fi ne cut volume growing 11.1%, total shipment
volume was down 4.7% to 398.0 billion cigarette
equivalent units, due to signifi cant industry contraction.
Our total share of market remained at the same level as
2013 while our GFBs continued to gain market share,
building on their momentum.
We also grew total share of value and GFB share of value.
This is the result of focused and consistent investment
over many years to enhance the equity of our brands and
ensure the highest standards in our trade marketing.
Another key success factor is the well-balanced
structure of our portfolio capturing both down-traders
and up-traders according to local market trends.
Pricing was the key fi nancial driver of our fi nancial
growth. Core revenue at constant currency increased
3.5% driven by price/mix improvements of US$958
million, mainly in Russia, Taiwan, the UK and Ukraine.
On a reported basis, core revenue decreased 3.0%
due to unfavorable currency movements.
028 JAPAN TOBACCO INC. ANNUAL REPORT FY2014
Review of Operations continued

1999 2014
Camel volumes (billion of cigarette equivalent units)
30.3
46.4
Global Flagship Brands (GFB) Portfolio
Our GFBs form the core of our brand portfolio. We have eight GFBs providing a well-balanced portfolio to address consumer needs globally.
Winston
First introduced in 1954, Winston is one
of our key growth drivers. The second
largest cigarette brand worldwide since
2007, Winston is currently sold in more
than 100 markets.
In 2014, Winston gained share and global
reach. It consolidated its number 2 global
ranking, growing its market share 0.4ppt
to 9.6%. Winston achieved record market
share in 27 markets, including Russia where
it is the leading brand. Notable gains were
also achieved in Azerbaijan, Germany,
Sweden, Switzerland and Taiwan where the
brand was historically under-represented.
Winston continued expanding with
launches in Brazil, Egypt, Hungary,
Oman and Sudan.
Winston grew volume in 21 of its top
30 markets, reaching over 1 billion units
in 26 markets. In fi ne cut, shipment volume
momentum continued with an increase
of 34.1% and market share growing
across Europe.
Both pillars of the Winston portfolio
architecture, Winston Core and
Winston XS contributed.
Our Core pillar delivers an authentic,
high quality, premium smoking experience.
It continues to grow steadily driven by
mainstream products such as: Winston
King Size, Winston Super Slims and
Winston Fine Cut. Our XS pillar off ers
a more style focused product, created
specifi cally to open up new segments and
territories to Winston. Despite being a new
player, XS is the number 1 off ering in the
King Size Super Slim segment and the
number 2 in fat slims globally.
Launched in 1913 and originator of the
American blend, Camel has stood the
test of time. It is sold today in more than
85 countries and is one of the top fi ve
premium brands in many of our key markets.
Camel continues to successfully reinvent
itself, building on its strong heritage and
genuine taste.
In 2014, Camel grew market share 0.5ppt
to 3.6% and achieved new records in
the Czech Republic, Greece, the Netherlands,
Poland and Turkey.
Following its price repositioning in Turkey in
May 2014, Camel grew volume and share to
become the number 1 cigarette brand by the
fourth quarter. Its market share increased
6ppt to reach 7.9%, with all line extensions
contributing to the growth.
On a global basis, all Camel line extensions
grew volume, including Black & White,
Essential and Activate. Camel also grew its
fi ne cut volume and remained the number
1 brand in the fi ne cut category in France.
In 2014, Camel achieved a record high
shipment volume since the brand was
acquired by JTI in 1999.
Camel
129.6 BnUGlobal Sales
46.4 BnUGlobal Sales
Disclaimer: market share for brands is based on the markets they are sold in.
Please be reminded that this section is intended to explain the business operations of JT to
investors, but not to promote sales of tobacco products or to encourage smoking by consumers.
OP
ER
ATIO
NS
& A
NA
LYS
IS
JAPAN TOBACCO INC. ANNUAL REPORT FY2014 029

Cluster breakdown
Shipmentvolume
Core Revenue (reported)
AdjustedOperating Profit
(reported)
15% 17% 16%13%
20% 25%
42% 34%43%
30% 29% 17%
Rest-of-the-World
CIS+
North & Central
Europe
South & West
Europe
South & West EuropeThe economic environment showed early signs of
improvement throughout the second half of 2014 with
a slow down in the rate of industry volume decline
compared to 2013.
Total shipment volume declined 2.2% while GFB
shipment volume was fl at as growth in Benelux
markets, Portugal and Spain off set the decline in Italy.
We grew share of market across almost the entire
cluster with gains in Belgium, France, Greece,
Luxembourg, the Netherlands, Spain and Switzerland.
In France, total and GFB shipment volumes declined
2.1% and 1.0% respectively, over-performing the industry
volume. Fine cut shipment volume was up 7.1%. Market
share gained 0.8ppt to 20.8% led by Winston and Camel.
In Italy, Benson & Hedges grew volume 28.6% following
its launch in the value segment. Fine cut volume was
up 8.3% led by our GFBs. Our business fundamentals
remain solid and we anticipate a turnaround in the profi t
contribution in 2015.
In Spain, total and GFB shipment volumes increased
0.6% and 4.9% respectively, driven by Winston, Camel
and Benson & Hedges. Fine cut shipment volume also
grew 2.2% driven by Winston and Camel. Our market
share was up 0.7ppt to 21.7%.
Core revenue and adjusted operating profi t were
signifi cantly impacted by the overall volume decline
and the lack of price increases in France and Italy. Core
revenue was down 5.1% while adjusted operating profi t
declined 10.3%, both at constant currency rates.
Adjusted operating profi t grew 13.1% at constant
exchange rates driven by pricing, cost effi ciencies
and by broadening our business footprint which now
includes a 20% ownership in Megapolis, a Russian
distributor. Reported profi t was impacted by
unfavorable foreign exchange rates, growing 1.1%.
GFB shipment volume performanceIn 2014, while their shipment volume declined 2% to
262.2 billion cigarette equivalent units, GFBs continued
to gain market share across the diff erent markets they
are sold in.
The strength and resilience of our GFBs, in combination
with innovative propositions, resulted in a 0.5ppt market
share increase versus the prior year, reaching 14.3%.
In addition, GFBs retained brand leadership positions in
the Caucasus, Ireland, Jordan, Russia, Taiwan and Turkey.
Overall, the weight of our GFBs in our total shipment
volume increased 1.8ppt to 65.9%. This increase,
combined with pricing opportunities, enabled our
GFBs to also grow their share of value 0.6ppt to 14.4%.
Cluster performance
International Tobacco Business continued
BnU
South &
West
Europe
North &
Central
Europe CIS+
Rest-of-
the-World Total JTI
Total shipment
volume 59.8 51.6 165.7 120.8 398.0
GFB shipment
volume 51.4 27.8 115.7 67.2 262.2
030 JAPAN TOBACCO INC. ANNUAL REPORT FY2014
Review of Operations continued
+13.1% +1.1%
2013reported
2014reported
Volume Price/Mix
Other FX2014 atconstant
FX
Adjusted Operating Profit (US$ MM)
4,206
-423
938
36
4,7574,253
-504

LD was launched in 1999 in the Russian
market. The brand achieved immediate
success and is now recognized as a
compelling international brand in the
value segment.
Since 2007, LD has grown continuously in
all clusters, reaching 42 countries. LD has
also constantly expanded its portfolio to
meet consumer aspirations, including in
fi ne cut.
In 2014, LD volume was almost fl at at
44.9 billion cigarette equivalent units,
mainly impacted by industry contraction
and intense competitive pressure in Russia.
Excluding Russia, LD grew volume a strong
7.3% driven by new slimmer formats and
its performance in fi ne cut.
Overall, the brand grew its share of market
by 0.4ppt to reach 5.9%.
LD
Launched as Mild Seven in 1977, Mevius is
the top-selling brand in Japan. Internationally,
Mevius is present in over 18 countries, mainly
in Asia. We have started expanding the reach
of Mevius with launches in Azerbaijan and
Switzerland, with more markets planned for
the future.
In 2014, Mevius delivered 17.8 billion
cigarette equivalent units aff ected by
downtrading in Taiwan.
Market share declined 0.1ppt to 2.4%
but Mevius grew its share of the premium
segment in its top Asian markets. Mevius
also became the number 1 premium
brand in the Far East region of Russia.
Mevius
17.8 BnUGlobal Sales
44.9 BnUGlobal Sales
Benson & Hedges
Originally established in 1873, Benson &
Hedges has a proud British heritage.
In 2014, B&H volume delivered 10.9 billion
cigarette equivalent units despite growth
in the North & Central Europe cluster. B&H
increased its market share 0.1ppt to 1.9%.
Glamour
Glamour is JTI’s leading super slims brand,
launched in 2005.
In 2014, due to industry contraction in
its main markets, its volume declined
to 7.2 billion cigarette equivalent units.
Glamour share of market declined
0.1ppt to 1.0%.
10.9 BnUGlobal Sales
7.2 BnUGlobal Sales
Sobranie
Sobranie is one of the world’s oldest
tobacco brands and has been synonymous
with luxury cigarettes since 1879.
In 2014, despite the diffi cult environment,
Sobranie grew volume by 15.1% to 2.6
billion cigarette equivalent units. Its market
share grew 0.1ppt to 0.6%.
Silk Cut
Launched in 1964, Silk Cut established
its credentials as one of the fi rst low tar
brands in the 1970s, long before it became
the norm of other manufacturers.
In 2014, Silk Cut volume declined to
2.9 billion cigarette equivalent units
due to industry volume contraction
in Ireland and the UK.
2.9 BnUGlobal Sales
2.6 BnUGlobal Sales
Disclaimer: market share for brands is based on the markets they are sold in.
Please be reminded that this section is intended to explain the business operations of JT to
investors, but not to promote sales of tobacco products or to encourage smoking by consumers.
OP
ER
ATIO
NS
& A
NA
LYS
IS
JAPAN TOBACCO INC. ANNUAL REPORT FY2014 031

North & Central EuropeWe achieved a strong overall performance in this
cluster in 2014. Total and GFB shipment volume were
up 0.8% and 5.4% respectively. This positive volume
performance was mainly driven by the Czech Republic,
Germany and Hungary.
We continued to grow share of market and share of
value in this cluster, particularly in the Czech Republic,
Germany, Hungary, Ireland, Poland and the UK.
In Austria, GFB shipment volume grew 5.6% driven
by Winston, Camel and Benson & Hedges while total
shipment volume decreased 2.0%. Market share
declined 0.2ppt to 32.0%.
In the UK, despite industry volume contraction aff ecting
our volumes, we continued to grow share of market and
share of value to over 40%. Our consistent commitment
to invest in our brands secured our number 1 brand
ranking in the ready-made cigarettes with Sterling and
the number 1 brand position in the fi ne cut category
with Amber Leaf. Amber Leaf is now the number 1
tobacco brand in the UK.
Thanks to a robust pricing environment and positive
volume performance, core revenue and adjusted
operating profi t grew strongly by 7.7% and 12.8%
respectively, at constant currency rates.
CIS+Industry contraction in Kazakhstan, Russia and Ukraine
in 2014 resulted in a 10.5% decline in the cluster’s total
shipment volume. Despite the strong equity of our brands,
GFB volume declined 6.5%. However, in the second half
of the year, trend in total shipment volume improved in
Russia driven by our GFBs.
We grew GFB market share across the cluster.
In Russia, the industry contracted 9.5% in 2014
yet uptrading into the sub-premium and mid-price
segments continued, both segments in which we lead.
Winston continued its growth momentum achieving a
record share of market of 15.0%, gaining 0.7ppt. Camel
and Sobranie maintained their share of market level
compared to the previous year. As expected, LD’s
market share increased in Q4.
Driven by relatively predictable excise tax regimes,
pricing opportunities are still available in this cluster.
As a result of such opportunities, core revenue and
adjusted operating profi t grew 8.5% and 31.5%
respectively, at constant currency rates.
Rest-of-the-WorldTotal and GFB shipment volumes increased 0.8% and
2.1% respectively, despite continued geopolitical unrest
in several Middle East markets.
We grew market share in Canada, Malaysia and Turkey.
In Taiwan, we continued to lead both in share of market
and share of value. Winston grew market share 1.2ppt
to 4.8%, partially off setting the market share loss of
Mevius. In the last quarter of 2014, we observed a
positive turnaround in volume and market share
for Mevius.
In Turkey, total and GFB shipment volumes grew 2.3%
and 0.7% respectively, driven by the continued growth
of Camel. Overall market share was up 2.4ppt to 29.0%
with Camel and Winston now representing a combined
20% market share.
Core revenue was fl at while adjusted operating profi t
declined 3.8%, both at constant currency.
OutlookJTI will continue to be the profi t growth engine of the
JT Group.
In 2015, we expect the operating environment to
remain very challenging and highly volatile across
a number of geographies. GFB volume is forecast
to resume growth driven by our on-going share
of market momentum as we continue to enhance
our brand equity and geographic reach.
Following the acquisition of Zandera, we plan to step
up investments primarily in our emerging products
portfolio. We will also enhance our organic growth
in areas where we have limited presence and we will
pursue opportunities to expand into new markets to
secure future growth.
Our 8% earnings target at constant currency for 2015
represents a balanced approach between short-term
profi t delivery and investing to secure long-term
sustainable growth.
International Tobacco Business continued
032 JAPAN TOBACCO INC. ANNUAL REPORT FY2014
Review of Operations continued
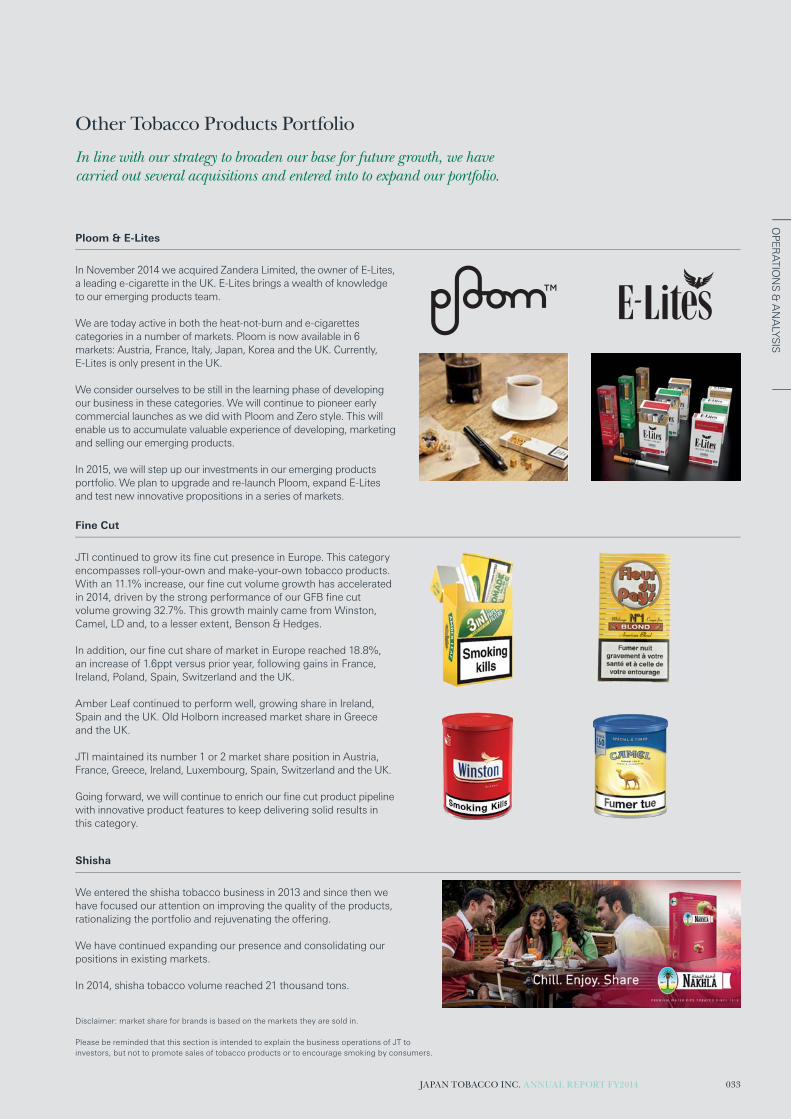
Other Tobacco Products Portfolio
In line with our strategy to broaden our base for future growth, we have carried out several acquisitions and entered into to expand our portfolio.
In November 2014 we acquired Zandera Limited, the owner of E-Lites,
a leading e-cigarette in the UK. E-Lites brings a wealth of knowledge
to our emerging products team.
We are today active in both the heat-not-burn and e-cigarettes
categories in a number of markets. Ploom is now available in 6
markets: Austria, France, Italy, Japan, Korea and the UK. Currently,
E-Lites is only present in the UK.
We consider ourselves to be still in the learning phase of developing
our business in these categories. We will continue to pioneer early
commercial launches as we did with Ploom and Zero style. This will
enable us to accumulate valuable experience of developing, marketing
and selling our emerging products.
In 2015, we will step up our investments in our emerging products
portfolio. We plan to upgrade and re-launch Ploom, expand E-Lites
and test new innovative propositions in a series of markets.
JTI continued to grow its fi ne cut presence in Europe. This category
encompasses roll-your-own and make-your-own tobacco products.
With an 11.1% increase, our fi ne cut volume growth has accelerated
in 2014, driven by the strong performance of our GFB fi ne cut
volume growing 32.7%. This growth mainly came from Winston,
Camel, LD and, to a lesser extent, Benson & Hedges.
In addition, our fi ne cut share of market in Europe reached 18.8%,
an increase of 1.6ppt versus prior year, following gains in France,
Ireland, Poland, Spain, Switzerland and the UK.
Amber Leaf continued to perform well, growing share in Ireland,
Spain and the UK. Old Holborn increased market share in Greece
and the UK.
JTI maintained its number 1 or 2 market share position in Austria,
France, Greece, Ireland, Luxembourg, Spain, Switzerland and the UK.
Going forward, we will continue to enrich our fi ne cut product pipeline
with innovative product features to keep delivering solid results in
this category.
Fine Cut
Ploom & E-Lites
We entered the shisha tobacco business in 2013 and since then we
have focused our attention on improving the quality of the products,
rationalizing the portfolio and rejuvenating the off ering.
We have continued expanding our presence and consolidating our
positions in existing markets.
In 2014, shisha tobacco volume reached 21 thousand tons.
Shisha
Disclaimer: market share for brands is based on the markets they are sold in.
Please be reminded that this section is intended to explain the business operations of JT to
investors, but not to promote sales of tobacco products or to encourage smoking by consumers.
OP
ER
ATIO
NS
& A
NA
LYS
IS
JAPAN TOBACCO INC. ANNUAL REPORT FY2014 033

-3.6%
2013Jan-Dec
2014Jan-Dec
Sales volume (BnU)
116.5 112.4
-1.0%
2013Jan-Dec
2014Jan-Dec
Core Revenue and Adjusted Operating Profit(JPY BN)
656.3 649.8
+1.8%
2013Jan-Dec
2014Jan-Dec
234.6 238.7
649.8 -1.0%Core Revenue (JPY BN) Year-on-year change
238.7 +1.8%Adjusted Operating Profi t (JPY BN) Year-on-year change
Japanese Domestic Tobacco BusinessFY2014: Results for Jan-Dec 2014 (Like-for-Like basis)
Akira SaekiPresident, Tobacco Business
Japanese domestic tobacco business is a highly competitive platform of profi tability. In the year ended December 2014, industry volume was 186.2 billion units in Japan, making it one of the largest markets in the world. We own 9 of the top 10 selling products in this large market. We are the undisputed market leader in Japan with over 60% market share.
Since the consumption tax hike in April 2014, we
have strengthened sales promotion activities to retain
consumers, with a particular focus on our core brands.
The industry volume in Japan, however, has been
declining over the past years. In this challenging
environment, we prioritized quality top-line growth by
investing in brand equity enhancement and launching
new products to meet consumers’ needs.
After this summer, we have been actively launching new
extensions with additional value, most notably from the
Peace, Cabin and Caster brands.
We continue to be a signifi cant profi t contributor to
the JT Group by further quality top-line growth and
continuous cost improvement.
Business results (vol./fi nancial performance)• Enhanced brand equity enabled price/mix
improvement:
– JT sales volumes decreased 3.6% from the
previous year in line with our forecast in 2014.
– Core revenue decreased 1.0% year-on-year to
¥649.8 billion as our average unit price improved,
supported by additional marketing investments
in brands with higher price increase as well as
successful launches of value-added products.
– Adjusted operating profi t grew 1.8% year-on year
to ¥238.7 billion driven by price/mix improvement
and eff ective cost management.
034 JAPAN TOBACCO INC. ANNUAL REPORT FY2014
Review of Operations continued

Seven Stars
• Launched in 1969, Seven Stars featured
Japan’s fi rst domestically produced
charcoal fi lter in pursuit of better taste.
• Since its launch, Seven Stars has
consistently off ered unique value in terms
of taste, aroma, and product design.
• The Seven Stars family comprises a line-up
of 14 products (as of February 28, 2015).
Pianissimo
• In August 1995, the Pianissimo family saw the launch of Japan’s fi rst 1mg-tar menthol cigarette product featuring function of less smell and less smoke**.
• The pianissimo family comprises a line-up
of 9 products (as of February 28, 2015).
MEVIUS
• Our leading brand in Japan is MEVIUS,
evolved from Mild Seven in February
2013. MEVIUS inherits Mild Seven’s
strong consumer base which has
commanded the number 1 share in
the Japanese domestic market for
more than 30 years since 1978*.
• The MEVIUS family encompasses 33
products (as of February 28, 2015),
refl ecting the evolution that it has
undergone in step with the changing
times and brand expansion.
* Source: TIOJ.
** Less smoke: Less smoke is released from
the tip of cigarette based on a visual comparison
with conventional JT cigarette products.
Our Core Brands
Please be reminded that this section is intended to
explain the business operations of JT to investors, but
not to promote sales of tobacco products or to
encourage smoking by consumers.
OP
ER
ATIO
NS
& A
NA
LYS
IS
JAPAN TOBACCO INC. ANNUAL REPORT FY2014 035

Japanese Domestic Tobacco Business continuedFY2014: Results for Jan-Dec 2014 (Like-for-Like basis)
Our strategies:We focus on quality top-line growth by increasing share
of market and promoting consumers to shift to higher
unit price products. In order to achieve this goal, we
will continue to invest in brand equity enhancement
and business foundation building with a mid- to long-
term vision.
In addition, we also continue to pursue effi ciencies
to further strengthen our profi tability.
• Priority on quality top-line growth:
– Continue to strengthen our brand equity,
with focus on our core brands.
– Grow or maintain market share in existing
key markets.
– Develop emerging product categories.
• Continuous cost improvement.
OutlookIn 2015, we start to operate under a new organizational
structure. We will re-arrange our sales organizations to
strengthen consumer and trade marketing capabilities,
and consolidate manufacturing facilities in pursuit of
cost competitiveness.
Competition in Japan has been intensifying. With these
initiatives, the Japanese domestic tobacco business will
be able to develop insight into consumers’ needs and
promptly respond to their changes. In addition, we
continue to seek cost competitiveness.
Furthermore, we will continue to invest in and build
brand equity, particularly of MEVIUS.
Japanese domestic tobacco business is committed
to fulfi lling its role as a highly competitive platform of
profi tability. This will be achieved by quality top-line
growth as well as further pursuit of a competitive
cost base.
Business results (market share performance)• MEVIUS performance led to resilient market share
in the context of intensifi ed competition.
– In FY2014, JT market share decreased
0.1 percentage points to 60.4%.
Share evolution of JT and MEVIUS(%)
Oct-Dec2013
Oct-Dec2014
Apr-Jun2014
Jul-Sep2014
Jan-Mar2014
60.1 60.059.661.561.1
31.7 31.931.333.432.8
MEVIUSJT
In 2014, our market share has been resilient amid an
intensifi ed competitive environment, where competitors
have been taking more aggressive marketing approach,
including strategic pricing.
In particular, a MEVIUS has performed strongly, mainly
led by MEVIUS Premium Menthol Option. The strong
performance demonstrates the outstanding equity that
is underpinned by the investments have made so far in
this brand.
Please be reminded that this section is intended to explain the business operations of JT to
investors, but not to promote sales of tobacco products or to encourage smoking by consumers.
036 JAPAN TOBACCO INC. ANNUAL REPORT FY2014
Review of Operations continued

Please be reminded that this section is intended to
explain the business operations of JT to investors, but
not to promote sales of tobacco products or to
encourage smoking by consumers.
JAPAN TOBACCO INC. ANNUAL REPORT FY2014 037
OP
ER
ATIO
NS
& A
NA
LYS
IS

+7.6
2013 Jan-Dec
2014Jan-Dec
Revenue (JPY BN)
58.265.8
Adjusted Operating Profit(JPY BN)
+6.3
2013 Jan-Dec
2014Jan-Dec
-13.7-7.3
Pharmaceutical BusinessFY2014: Results for Jan-Dec 2014 (Like-for-Like basis)
65.8 +7.6Revenue (JPY BN) Year-on-year change (JPY BN)
-7.3 +6.3Adjusted operating profi t (JPY BN) Year-on-year change (JPY BN)
Muneaki FujimotoPresident, Pharmaceutical Division
In the pharmaceutical business, we aim to build a unique, world-class pharmaceutical business driven by R&D, and to increase our market presence through original and innovative drugs. We strive to strengthen the profi t base through value maximization of each product and R&D promotion for next generation of strategic compounds.
Strategy: • Promote R&D of strategic compounds for next
generation and seek optimum timing to out
license them
• Maximize the value of each product
Performance overview:[Development in Japan]• Product launch
– Riona Tablets 250mg (hyperphosphatemia)
– Cedartolen Sublingual Drop (Japanese
cedar pollinosis)
• TO-203 (house dust mite allergy): Torii Pharmaceutical
fi led its New Drug Application in Japan (Jan 2015).
[Licensed compounds]• JTE-052 (JAK inhibitor): Exclusive rights to develop
and market for topical use in dermatological
indications worldwide excluding Japan out-licensed
to LEO Pharma.
• Elvitegravir (HIV infection)
– Vitekta (Standalone-agent): approved in the US
– E/C/F/TAF (new single-tablet regimen) partner
submitted regulatory applications in the US and EU.
• Trametinib (melanoma)
– Mekinist (Standalone-agent ): approved in EU
– For use in combination with dabrafenib: approved
in the US.
Business results (fi nancial overview):• Revenue grew ¥7.6 billion driven by an increased
royalty from our license partners, most notably
related to Stribild. Torii Pharmaceutical’s top-line
growth related to Riona and Striblid also contributed.
• Operating loss improved by ¥6.3 billion due to
revenue increase.
038 JAPAN TOBACCO INC. ANNUAL REPORT FY2014
Review of Operations continued

Value Chain
R&D
Continue to strengthen
R&D capability, a
cornerstone of our
pharmaceutical
business
Sales & Promotion
Build marketing
competence
on our MRs
Manufacturing
Ensure a reliable
supply of quality
products
R&D
Continue to strengthen R&D capability, a cornerstone of our
pharmaceutical business
A particular emphasis is placed on research and development in line
with our mission to establish a unique R&D oriented business model
which can compete on a global basis. By focusing our resources on
specifi c areas, we effi ciently strengthen our R&D capability which
enables us to create innovative drugs.
• Focus mainly on the fi elds of glucose and lipid metabolism; virus
research; and immune disorders and infl ammation to best
leverage our expertise.
• Allocate adequate resources in R&D in light of the increasingly
complex, time-consuming and therefore costly development
process due to stringent regulations.
• Aiming at discovery of “fi rst-in-class” compounds, enhance
pre-clinical research capability and build development strategies
tailored to accomplish the objective
• Translate innovation into medicines that are both approvable
and commercially viable.
Manufacturing
Ensure a reliable supply of quality products
Sustainable supply chain to deliver high quality products to our
patients has been established. We also pursue effi ciencies in our
manufacturing arrangements; products marketed in Japan are mainly
produced by Torii Pharmaceutical to maximize intra-group synergies,
while outsourcing to contract manufacturers where appropriate.
• Remain focused on quality assurance and safely control.
• Maintain optimal manufacturing arrangements.
• Continuously strive to reduce environmental impacts, as
evidenced by operation and maintenance of the ISO 14001
certifi cate by our Sakura plant.
Sales & Promotion
Build marketing competence on our MRs
In the pharmaceutical industry, medical representatives (MRs) play a
crucial role in successful sales and promotion by providing medical
and scientifi c knowledge with clients. At the same time, they collect
valuable information from the medical front which could be refl ected
in the ongoing or future R&D activities. Torii Pharmaceutical is
marketing our products in Japan through 499 highly-trained MRs.
Outside Japan, we do not have a sales function. As such, instead of
directly marketing our products, we receive royalties based on sales
performance from our license partners for the compounds for which
we out-license the right to develop and market.
• Provide extensive training programs to MRs and expand
their knowledge to earn trust from our clients.
• Strengthen our marketing capabilities by leveraging the marketing
support system, which integrates information and needs from the
medical front line spread across functions.
• Build a sales and marketing strategy to meet the existing and
future market needs in the changing business environment
OP
ER
ATIO
NS
& A
NA
LYS
IS
JAPAN TOBACCO INC. ANNUAL REPORT FY2014 039

Pharmaceutical Business continued
Japan Tobacco Inc. Clinical Development (as of February 5, 2015)
In-house developmentCode
(Generic name)Potential Indication/
Dosage form Mechanism Description
JTK303 (elvitegravir)/ cobicistat/ emtricitabine/ tenofovir alafenamide
HIV infection/Oral HIV integrase inhibitor/Nucleoside reverse transcriptase inhibitor
Suppresses blood HIV levels by inhibiting the activities of integrase and reverse transcriptase, enzymes involved in the replication of HIV.
JTT-851 Type 2 diabetes mellitus/Oral G protein-coupled receptor 40 agonist
Decreases blood glucose by stimulation of glucose-dependent insulin secretion.
JTZ-951 Anemia associated with chronic kidney disease/Oral
HIF-PHD inhibitor Increases red blood cells by stimulating production of erythropoietin, an erythropoiesis-stimulating hormone, via inhibition of HIF-PHD.
JTE-051 Autoimmune/allergic diseases/Oral
Interleukin-2 inducible T cell kinase inhibitor
Suppresses overactive immune response via inhibition of the signal to activate T cells related to immune response.
JTE-052 Autoimmune/allergic diseases /Oral, Topical
JAK inhibitor Suppresses overactive immune response via inhibition of Janus kinase (JAK) related to immune signal.
JTE-151 Autoimmune/allergic diseases/Oral
ROR antagonist Suppresses overactive immune response via inhibition of ROR related to Th 17 activation.
JTE-350*
(histamine dihydrochloride)
Diagnostic product/Positive control solution in the skin prick test
Histamine receptor agonist
Induces wheal and fl are as histamine reactions on the epidermis in the skin prick test.
JTT-251 Type 2 diabetes mellitus/Oral PDHK inhibitor Decreases blood glucose by activation of pyruvate dehydrogenase (PDH) related to carbohydrate metabolism.
JTT-252 Type 2 diabetes mellitus/Oral SGLT1 inhibitor Decreases blood glucose by inhibition of sodium glucose co-transporter 1 (SGLT1) in small intestine.
JTK-351 HIV infection/Oral HIV integrase inhibitor Suppresses blood HIV levels by inhibiting the activity of integrase, an enzyme involved in the replication of HIV.
Clinical trial phase presented above is based on the fi rst dose.
* One of the medical products publicly off ered for a development company by the Study Group on Unapproved and Off -label Drugs of High Medical Need, set up by the Ministry
of Health, Labour and Welfare.
Licensed compoundsCompound
(JT’s code) Licensee Mechanism Note
elvitegravir(JTK-303)
Gilead Sciences HIV Integrase inhibitor
Suppresses blood HIV levels by inhibiting the activity of integrase, an enzyme involved in the replication of HIV.
New Single Tablet Regimen:(elvitegravir/cobicistat/emtricitabine/tenofovir alafenamide)U.S. and EU marketing approvals submitted
trametinib GlaxoSmithKline* MEK inhibitor
Inhibits cellular growth by specifi cally inhibiting the activity of MAPK/ERK Kinase (MEK1/2).
Metastatic melanoma, trametinib+dabrafenib Phase3
Anti-ICOS monoclonal antibody
MedImmune ICOS antagonist
Suppresses overactive immune response via inhibition of ICOS which regulates activation of T cells.
JTE-052 LEO Pharma JAK inhibitor Suppresses overactive immune response via inhibition of Janus kinase (JAK) related to immune signal.
* Oncology products and pipeline compounds of GlaxoSmithKline were acquired by Novartis on March 2, 2015.
040 JAPAN TOBACCO INC. ANNUAL REPORT FY2014
Review of Operations continued

Location Phase 1 Phase 2 Phase 3 Preparing to fi le Filed Origin
Japan
New Single Tablet Regimen:JTK-303(elvitegravir); In-houseCobicistat, Emtricitabine, Tenofovir Alafenamide;In-license(Gilead Sciences)
Japan
In-house
Overseas
Japan
In-house
Overseas
Overseas In-house
Japan In-house
Overseas In-house
JapanIn-license(ALK-Abelló)Co-development with Torii
Overseas In-house
Overseas In-house
Japan In-house
OP
ER
ATIO
NS
& A
NA
LYS
IS
JAPAN TOBACCO INC. ANNUAL REPORT FY2014 041

Revenue (JPY BN)
+4.0
2013Jan-Dec
2014Jan-Dec
157.2 161.2
+0.8
2013Jan-Dec
2014Jan-Dec
Adjusted Operating Profit(JPY BN)
0.6
1.4
Processed Food BusinessFY2014: Results for Jan-Dec 2014 (Like-for-Like basis)
Miyoharu HinoPresident & CEO TableMark
If we are going to prepare food for those who matter to us most, we wish to do so cordially and with care. This is our desire when running our business at TableMark. From 2010 onwards, TableMark began its operation as a food manufacturer with frozen and ambient processed food, bakery items and seasoning as our business pillars. In particular, we strive to provide high value-added products by focusing on staple food such as frozen noodles, frozen rice, packed cooked rice and frozen baked bread.
Strategy• Achieve operating profi t margin on par with industry
average and aim to make a profi t contribution to the
JT Group
– Increase the attractiveness of our off erings with
a particular emphasis on staple food products by
meeting consumer needs with our own expertise
– Minimize negative impact of rising raw material
costs and weak yen.
Performance Overview• The processed food business is primarily engaged in
business concerning frozen and ambient processed
food, mainly staple food products such as frozen
noodles, frozen rice, packed rice and frozen baked
bread, bakery chain outlets in the Tokyo metropolitan
area, and seasonings including yeast extracts and
oyster sauce
• We increased revenue in all of our business area,
namely frozen and ambient processed food, bakery
and seasoning.
Business results (fi nancial performance):• Revenue increased ¥4.0 billion driven by growth
of staple products and frozen food for bento box use
• Adjusted operating profi t increased ¥0.8 billion.
Revenue growth more than off set the eff ect of higher
material cost and weak yen.
* Staple food products: frozen noodles, frozen rice, packed cooked rice
and frozen baked bread.
161.2 +4.0Revenue (JPY BN) Year-on-year change (JPY BN)
1.4 +0.8Adjusted operating profi t (JPY BN) Year-on-year change (JPY BN)
042 JAPAN TOBACCO INC. ANNUAL REPORT FY2014
Review of Operations continued

Value Chain
R&D
Strive to develop innovative products to meet consumers’ needs
• Leveraging our own know-how, we aim to develop value-added
products to meet diversifi ed consumers’ needs.
• Frozen baked bread products have been developed,
allowing consumers to enjoy the taste of freshly baked
bread at home. TableMark’s original techniques for fermentation,
baking and freezing recreate and preserve
the taste and texture of fresh bread.
• New process for making frozen udon noodles, called
“Tamnenjikomi Aya Jyukusei-ho” was developed. This process
enables us to off er higher quality and value-added udon products.
Procurement
Ensure procurement of safe and quality raw materials
• Review of quality assurance certifi cates submitted by our suppliers.
• Inspections and monitoring of agrochemical residues and regular
inspection at processing plants, in compliance with
JT Group’s internal standards, the Food Sanitation Act and other
relevant laws.
• Examination of safety of production sites for raw materials
sourced abroad.
• As for agricultural farms, inspections are made not only for
soil and water but also in terms of how products are cultivated
and how agrochemicals are handled. Breeding farms are
also inspected.
Production
Prioritize safety and follow established quality control procedures
• JT Group is pursuing the adoption of the HACCP system and ISO
22000 in our and business partners‘ factories. Under the ISO
22000 standard, continuous improvements are made following
eff ective rules to control sanitation and other key issues. These
rules are based on the HACCP concept, and
their eff ectiveness is tested using scientifi c evidence.
• All of JT Group’s 30 factories in and outside Japan, as well
as our business partners’ factories that produce frozen foods,
have achieved the ISO 22000 certifi cation.
Marketing
Strive for eff ective marketing to improve product awareness
• We analyze the market from consumers’ point of view and,
by combining the technology owned by TableMark, we strive
to provide products with new values to increase our presence
in the market. We strive for eff ective marketing in order to improve
consumer awareness of our products.
Sales & Distribution
Increase penetration to retail outlets
• Strive to enhance profi tability through initiatives to increase
our presence in supermarkets and convenience stores, by off ering
a wider range of products while also seeking better shelf space.
• TableMark products are also sold to restaurants and other public
facilities.
Food Safety Control
Ensure safety control at all levels of the value chain
• Independent food safety management division is responsible for
overall safety control, ensuring that consumers can continue to
enjoy our products safely.
• Cross-functional food safety initiatives within the JT Group
are promoted.
• External food safety experts provide assessment and advice
regarding our initiatives – their knowledge and viewpoints
are actively incorporated into our business.
Food Safety Control
Ensure safety control at all levels of the value chain
R&D
Strive to develop
innovative
products to meet
consumers’ needs
Production
Prioritize safety and
follow established
quality control
procedures
Marketing
Strive for eff ective
marketing to improve
product awareness
Procurement
Ensure procurement
of safe and quality
raw materials
Sales & Distribution
Increase penetration
to retail outlets
OP
ER
ATIO
NS
& A
NA
LYS
IS
JAPAN TOBACCO INC. ANNUAL REPORT FY2014 043

-2.5
2013 Jan-Dec
2014Jan-Dec
Revenue (JPY BN)
183.8181.3
+1.6
2013Jan-Dec
2014Jan-Dec
Adjusted Operating Profit(JPY BN)
-2.1
-0.5
Goichi MatsudaHead of Beverage Business
Beverage BusinessFY2014: Results for Jan-Dec 2014 (Like-for-Like basis)
181.3 -2.5Revenue (JPY BN) Year-on-year change (JPY BN)
-0.5 +1.6Adjusted operating profi t (JPY BN) Year-on-year change (JPY BN)
Business results (fi nancial performance):• Revenue declined due to unfavorable summer weather and intensifi ed competition at sales channels.
• Operating loss was reduced by ¥1.6 billion as a result of cost containment eff orts.
Withdrawal from the Manufacture and Sale of JT Beverage Products
Source: JT press release on February 4th , 2015
JT announced that it has decided to withdraw from the manufacture
and sale of JT beverage products. The manufacture and sale of JT
beverage products conducted by JT’s beverage business division
and JT Beverage Inc. is expected to be discontinued by the end of
September 2015.
The Company entered the beverage business in 1988. Since
then, it has marketed innovative beverage products including
“Roots” and “Momono Tennen-sui” with a fi rm belief based on
the Company’s management principle, the “4S” model, that
exceeding consumers’ expectations leads to sustainable profi t
growth in the mid- to long-term.
However, the operating environment of the beverage business
in Japan has become increasingly challenging. The beverage
market matured and the scale of the business has become more
important for maintaining and strengthening the competitiveness.
Additionally, the product life cycle has shortened. In such an
environment, expanding business scale through active sales
promotion and constantly developing unique quality products
within a short time frame have become indispensable to
establish a sustainable profi t platform. After carefully considering
the growth strategy for the manufacture and sale of JT beverage
products, the Company has concluded that it will be diffi cult to
make a profi table contribution to the JT Group in the mid- to
long-term. From the perspective of optimizing the Group’s
overall resource allocation, it was decided to withdraw from
the manufacture and sale of JT beverage products, targeting
the end of September 2015.
Japan Beverage Group and JT A-Star Group will continue the
vending machine operation business. JT is to consider various
options for these subsidiaries.
The Company would like to sincerely thank its consumers for
their long-term support for JT beverage products.
* There was no impact on the JT’s consolidated fi nancial performance for the
fi scal year ended December 31, 2014. The eff ects on the performance for the
fi scal year ending December 31, 2015 have not been confi rmed.
044 JAPAN TOBACCO INC. ANNUAL REPORT FY2014
Review of Operations continued

JT Group and Sustainability
Our People Responsible Supply Chain
How we do business
Environment Product, Responsibility and Consumer Impact
The Bigger Picture
JT Group and Sustainability
Our approach to sustainability is governed by our management principles, known as the “4S” model. Under
the model we balance the interests of consumers, shareholders, employees and wider society, and fulfi ll our
responsibilities towards them, aiming to exceed their expectations. Using the “4S” model, we strive for
sustainable growth over the mid- to long-term by continually delivering added value to our consumers.
We believe that pursuing this model enhances corporate value and helps us to meet and exceed stakeholders’
interest in the most balanced way possible.
To learn more about JT Group’s approach and commitment to sustainability, please visit our website for Sustainability
Report FY2014.
http://www.jt.com/csr/report/index.html
OP
ER
ATIO
NS
& A
NA
LYS
IS
JAPAN TOBACCO INC. ANNUAL REPORT FY2014 045
* We announced withdrawal from the manufacture and sale of JT beverage products
in February 2015.
The JT Group operates diverse businesses, namely tobacco, pharmaceutical, beverage* and processed food. In addition, we conduct our business on a global basis, extending to Europe, CIS countries, Africa, the Middle East and others. Due to this diversity and these changing environments, we are exposed to various risks.
Considering such circumstances, we have put in place
a risk management framework. Under the framework,
relevant divisions are assigned to carefully monitor the
development of events that may adversely impact the
JT Group and prevent their materialization where possible.
When these risks are materialized, we promptly respond
in order to minimize their unfavorable impacts.
In reviewing risks, the magnitude of potential impact
and likelihood of occurrence are most prudently
assessed among other factors. Material risks, which
could have a signifi cant impact on our sustainable
profi t growth and business continuity, are reported
to the CEO together with the request for approval
to implement countermeasures against them.
The following section describes certain risks which
potentially have a material impact on our business
operations and fi nancial results, but is not intended to
be an exhaustive list of the risks we face. In addition, it is
possible that risks that are currently considered immaterial
or even unknown could turn out to be material in the
future, as the business environment changes.
This section should be read together with the forward
looking and cautionary statements contained in this
annual report.
1. Disruptive tax increasesTobacco products are subject to excise or similar taxes in
addition to value-added tax. Excise taxes are increasing
in most markets where we operate as governments
seek to secure their revenue or promote public health.
In general, value-added tax is also increasing. As a
general principle, we fully pass on any tax increase
to consumers by adjusting our sales prices. In addition,
to the extent possible, we increase our prices more than
the tax increase, considering the fi nancial impact of
an expected volume decline. A tax increase within a
reasonable range is manageable through such a price
increase as well as our eff orts to support top-line and
pursue effi ciency. Most governments are aware that a
substantial tax increase or repeated tax increases can
reduce their revenue and they take a rational approach.
However, in the past we have experienced such tax
increases in some markets, which have disrupted
our business.
Risk description and potential impactA disruptive tax increase on tobacco products could
result in a large legitimate industry volume decline due
to lower consumption and, in many cases, increased
illicit trade. In addition, down-trading to lower priced
products could be initiated or accelerated. Our shipment
volume, revenue and profi t could decrease due to these
negative reactions by consumers.
Measures to address the risk• Promote the understanding of relevant authorities
that a disruptive tax increase does not necessarily
serve their purpose.
• Optimize our product off erings to capture the
potential changes in consumer preference.
• Enhance our geographical portfolio to limit the
negative impact of a disruptive tax increase in
a specifi c market.
• Further improve effi ciency to protect earnings.
• If a disruptive tax increase takes place, fi nd an
optimal price for each product which minimizes
the unfavorable infl uence in the market.
046 JAPAN TOBACCO INC. ANNUAL REPORT FY2014
Risk Factors

2. Pressure from illicit tradeIllicit trade is a major concern not only for the tobacco
industry, but for wider society. For the tobacco industry,
it undermines the legitimate tobacco business. For society,
illicit trade reduces excise revenue for the government,
often fuels organized crime, and may increase health
concerns due to poor manufacturing standards and
improper product handling. The tobacco industry has
been fi ghting against the illicit trade, which takes the
forms of contraband, counterfeit and illicit whites.
Illegally traded products in a market tend to increase
after a steep tax increase. Regulatory actions seeking
to commoditize packages and products could also
trigger the acceleration of illicit trade because such
commoditization could make counterfeit manufacturing
easier and detection of illicit products more diffi cult.
We take a zero tolerance approach towards all these
criminal activities with an emphasis on eliminating
contraband products.
Risk description and potential impactAn increase in illicit trades could reduce the legitimate
industry volume, leading to a decline in our shipment
volume, revenue and profi t. In addition, the industry
bears the cost to combat illicit trades, resulting in
pressure to its earnings. Furthermore, it is possible
that low quality counterfeits and improperly handled
smuggled products damage the credibility of the
genuine brands, as well as the reputation of their owner.
Measures to address the risk• Engage with the governments, regulatory bodies and
law enforcement agencies to eradicate the illicit trade.
• Ensure we buy from and sell to only reputable
business partners following our rigorous compliance
initiatives.
• Raise awareness among individual consumers of
the negative consequences of purchasing illegally
traded products.
3. Tightening tobacco regulationsThe tobacco industry is highly regulated in various
aspects, and regulations could infl uence our business
performance and fi nancial results. Among the regulations
on products, for example, we may incur additional costs
in order to comply with requirements for ingredient and
packaging.
Furthermore, the regulatory attempt to commoditize
tobacco products could lead to an increase in the illicit
trade and negatively infl uence our legitimate business.
Business activities of tobacco companies are also
restricted. With more prohibitive regulations on
communication with consumers, our ability to
eff ectively market products becomes further limited,
and our top-line performance may be adversely impacted.
As a responsible organization, the JT Group abides
by the laws and regulations wherever we operate.
That said, we believe that laws and regulations should
diff er country by country, refl ecting its legal, social
and cultural background. We encourage governments,
regulators and stakeholders to take a reasonable and
balanced approach towards tobacco regulation.
Working together with authorities:
In 2007, JT International Holding B.V. and JT International
S.A., JT Group subsidiaries, entered a cooperation agreement
with the European Commission, the executive branch of the
European Union (EU), and 26 EU Member States as part of
eff orts to combat the illicit trade. In 2009, the United Kingdom
joined the agreement.
Under the terms of the agreement, the JT Group contributes
US$50 million annually in the fi rst fi ve years from its execution
and US$15 million annually in the subsequent ten years.
This fi nancial contribution is to be used to support anti-
smuggling and anti-counterfeiting initiatives led by the EU
or EU Member States.
In 2010, JTI-Macdonald Corp., a JT Group Canadian subsidiary,
also signed a similar agreement with the Government and
Provinces of Canada.
OP
ER
ATIO
NS
& A
NA
LYS
IS
JAPAN TOBACCO INC. ANNUAL REPORT FY2014 047

Risk description and potential impactFurther tightening of tobacco regulations on marketing
activities could undermine our strategy for top-line
growth as we lose opportunities to enhance brand
equity. Moreover, certain regulations may impose on
us additional compliance costs. These may negatively
infl uence our volume, revenue and profi t.
Measures to address the risk• Identify ongoing regulatory initiatives as early as
possible by promptly collecting accurate information.
• Engage with the governments, regulators and
stakeholders, as necessary, to develop reasonable
and balanced regulations that meet their objectives.
For further details, please refer to ‘Regulation and
Other Relevant Laws’ contained in this annual report
on page 152.
4. Country risksOur tobacco business has consistently expanded our
earnings base to secure long-term growth by making
acquisitions, entering new markets and increasing share
in markets where we had limited presence. Such a
geographical expansion increases our exposure to
country risks. In any market where we operate, we may
face economic, political or social turmoil which may
negatively aff ect our operations and fi nancial results.
Risk description and potential impactPolitical instability, economic downturn, social unrest
or other unfavorable developments in a certain market
could disrupt our business, leading to a lower volume,
revenue and profi t in the market.
Measures to address the risk• Avoid overdependence on a small number of markets
as sources of profi ts by expanding the pool of highly
profi table markets.
5. Instability in the procurement of key materialsAcross the businesses, the JT Group procures raw
and processed materials for product manufacturing.
In particular, we strive to procure key materials in the
required quantity and at reasonable costs. Our key
materials include agricultural products: most notably,
tobacco leaf for the tobacco business, grains for the
processed food business. Availability of agricultural
products is often aff ected by natural phenomena
including climate. In addition, there is a growing
concern that agricultural production costs may increase,
as a result of the high demand in energy resource and
other inputs due to a global population increase as
well as economic growth in emerging countries.
Risk description and potential impactInsuffi cient supply of key materials could lead to inability
to manufacture our products, subsequently resulting in
the loss of revenue and profi t. Furthermore, the increase
in procurement costs driven by higher production costs for
agricultural products would directly pressure our earnings.
Measures to address the risk• Reinforce ability to procure key materials by building
a strong relationship with suppliers. In the case of
tobacco leaf, further promote internal sourcing.
• Promote effi cient use of materials by continuously
reviewing the manufacturing process and product
specifi cations where possible.
6. Unfavorable development in litigationJT and some of its subsidiaries are defendants in
lawsuits fi led by plaintiff s seeking damages for harm
allegedly caused by smoking. As of December 31, 2014,
19 smoking and health-related cases were pending in
which one or more members of the JT Group were
named as defendant or for which JT may have certain
indemnity obligations pursuant to the agreement for
JT’s acquisition of RJR Nabisco Inc.’s overseas (non-
U.S.) tobacco operations. JT and its subsidiaries, who
are defendants in such lawsuits, believe that we have
valid grounds to defend the claims in such lawsuits;
however, we cannot predict the outcome of any
pending or future litigation.
Risk description and potential impactA decision unfavorable to us could materially aff ect our
fi nancial performance due to the payment of monetary
compensation. Critical media coverage of such lawsuits
may reduce social tolerance of and strengthen regulations
on smoking. Such media coverage may also prompt the
fi ling of a number of similar lawsuits against JT or its
subsidiaries, resulting in increased litigation costs.
Measures to address the risk• Continue to build well-organized teams coordinating
with external legal counsel to defend ourselves
against these lawsuits.
• Continue legitimate and appropriate business
operations. For further details, see section regarding
‘Litigation’ on Page 149.
048 JAPAN TOBACCO INC. ANNUAL REPORT FY2014
Risk Factors continued

7. Natural disastersOur operations may be disturbed by natural disasters
such as earthquakes, typhoons, fl oods, volcano eruptions
and others. Japan is one of the most important markets
for the JT Group’s businesses and subject in particular
to various natural disasters. The Great East Japan
Earthquake was devastating. The impacts on the
JT Group included casualties among our employees,
physical damage to our factories, and shortage of
supply for certain material for tobacco products.
Our tobacco business was forced to temporarily
suspend product shipment and limit shipment
volume for an extended period.
We have developed a Business Continuity Plan to
minimize the impact of such disasters, with a particular
emphasis on the optimization of the global supply chain.
Risk description and potential impactNatural disasters could cause damage to the JT Group
as well as our suppliers, trades and consumers, leading
to disruption of our business and negatively impacting
fi nancial results.
Measures to address the risk• Continuously review the Business Continuity Plan
and revise it as necessary.
• Carry out emergency drills to increase employees’
preparedness against disasters.
• Insure key assets such as buildings, machinery,
equipment and inventory to recover fi nancial losses
as appropriate.
8. Currency fl uctuationsAs the JT Group is operating globally, we are exposed
to the risks associated with currency fl uctuations.
The reporting currency of the JT Group consolidated
fi nancial statements is Japanese Yen, while the fi nancial
statements of our international subsidiaries are reported
in other currencies such as Russian ruble, Euro, British
pound, Taiwanese dollar, U.S. dollar, and Swiss franc.
Therefore, exchange rate fl uctuations of these
currencies against Japanese Yen infl uence the Group’s
reported fi nancial results. As for the fi nancial reporting
of the international tobacco business, JT International
Holding B.V. consolidates the fi nancial results of the
international tobacco subsidiaries and reports its
consolidated fi nancial statements in U.S. dollars. We
often communicate the fi nancial performance of our
international tobacco business in U.S. dollars, which is
aff ected by exchange rate fl uctuations against the U.S.
dollar. In principle, we do not hedge these risks which
arise from the translation of fi nancial statements.
However, we hedge against risks which arise when
equity denominated in each functional currency of
the JT Group is translated into Japanese yen to be
consolidated by using foreign currency-denominated
interest-bearing debts and part of these are designated
as net investment hedges. In addition, many group
companies make transactions in currencies other than
their reporting currencies for day-to-day operations.
Such transactions also involve the risk of exchange
rate fl uctuations. We mitigate these transaction risks
through hedging activities; however, it is not possible
to completely eliminate them.
Furthermore, if we liquidate or sell our group subsidiary
which we acquired in a currency other than Japanese
yen or impair a substantial value of such a subsidiary,
the gain or loss from the transaction includes the
currency fl uctuation impact. Specifi cally, the impact
comes from the diff erence in the exchange rates of the
relevant currency against Japanese yen at the time of
the acquisition and at the time of such transaction.
Risk description and potential impactFluctuations of exchange rates against Japanese yen
aff ect the JT Group’s reported fi nancial results. Reported
fi nancial results of our international tobacco business in
U.S. dollars are similarly infl uenced by the fl uctuations
of exchange rates against the U.S. dollar. In addition, we
are exposed to the exchange rate fl uctuation risks when
a group company makes a transaction in a currency
other than its reporting currency.
Measures to address the risk• Mitigate the risk through hedging activities such as
derivative contracts, possession of interest bearing
debts in a foreign currency etc.
OP
ER
ATIO
NS
& A
NA
LYS
IS
JAPAN TOBACCO INC. ANNUAL REPORT FY2014 049

Our corporate governance system
General Meeting of Shareholders
Board ofDirectors
Executive Officers
Departments
Group Companies
Auditor’s OfficeCompliance Office
President andChief Executive
Officer
Audit & SupervisoryBoard
Independent Auditors
Lawyers
four members (including two outside Audit & Supervisory
board members)
eight members (including two
outside directors)
JT Group Compliance Committee
five members (including three
outside members)
CompensationAdvisory Panel
five members (including two outside
directors and two outside auditors)
Operational Reviewand Business
Assurance Division
Selection or dismissal of membersSelection or dismissal of members Selection or dismissal of members
Introduction of compliance-related matters
Review of the policy and the rule relating to compensation for board members and executive officers
Supervision of the performanceAccounting
audit
Advice
Report/Proposal
Internal audit
Groupaudit
Accounting audit/Operating audit
Accounting audit/Operating audit
Report
Audit Report
OverviewIn our belief, enhancement of corporate governance is one of the critical management initiatives in order to achieve
sustainable profi t growth in this uncertain business environment. We have enhanced our corporate governance
aiming at “quality and prompt decision-making”, “effi cient business execution” and “rigorous supervisory and
advisory function”. We will continue to improve this framework to further strengthen our corporate governance.
Initiatives to enhance corporate governance
Rigorous supervisory and advisory function Quality and prompt decision-making Effi cient business execution
Set up the Compliance CommitteeFY2000
Reduced number of directorsFY2000
Introduced executive offi cer systemFY2001
Set up the Advisory Committee*
FY2001Promoted the delegation of business execution to the executive offi cers FY2000, FY2008 and FY2011
Set up the Compensation Advisory Panel FY2006
Invited outside directorsFY2012
* Abolition of the Advisory Committee on June 30, 2014.
Decision-Making, Business Execution, Supervision
050 JAPAN TOBACCO INC. ANNUAL REPORT FY2014
Corporate Governance

General Meeting of ShareholdersA general meeting of shareholders resolves the matters
stipulated by law and our Articles of Incorporation.
Under the Companies Act, certain matters are required
to be resolved at a shareholder meeting including,
most notably, the appointment and dismissal of the
directors, audit & supervisory board members and
external accounting auditors, dividend amount, loss
compensation, as well as change in the Articles of
Incorporation. Our Articles of Incorporation do not
stipulate any additional matter to be resolved at our
shareholders’ meeting other than matters legally
required. The Annual General Shareholders’ Meeting
is held in March, and a special meeting of shareholders
shall be called by the Board of Directors, as necessary.
The President chairs the shareholders’ meetings.
Within the extent as permitted by law, requirements for
resolutions at our shareholders’ meeting were lowered
by amending our Articles of Incorporation. A resolution
at a general meeting of shareholders can be adopted
by a majority of the voting rights present or represented
at the meeting. A resolution for the appointment of the
Company’s director and audit & supervisory board
members additionally require a quorum, which is
one-third of the total number of voting rights. A special
resolution as stipulated under Section 2, Article 309 of
the Companies Act, such as amendment to the Articles
of Incorporation, requires the quorum of one-third of the
total number of voting rights and the approval of
at least two-thirds of the voting rights present or
represented at the meeting. Certain matters resolved
at our shareholders’ meetings need further approval
by the Minister of Finance in Japan.
The Japan Tobacco Inc. ActJT was established pursuant to the Japan Tobacco,
Inc. Act (“the JT Act”) for the purpose of managing
businesses related to the manufacturing, sale and
imports of tobacco products. The JT Act provides
that the Government of Japan must continue to hold
over one-third of all of the issued shares except for the
class shares, which have no voting right against all
matters that can be resolved at our shareholders’
meeting. The JT Act also states that the issuance of new
shares and stock acquisition rights requires the approval
of the Minister of Finance. In the case of a share-for-
share exchange, the same approval is required for
issuance of new shares, stock acquisition rights and
bonds with stock acquisition rights. Under the JT
Act, subject to the approval by the Minister of Finance,
JT is allowed to engage in businesses other than
manufacturing, sales and imports of tobacco products
or tobacco-related business, provided that our
engagement in such businesses serves the purpose of
the Company. JT is also required to obtain approval from
the Minister of Finance for certain matters, including the
appointment or dismissal of directors, executive offi cers
and audit & supervisory board members as well as
amendment to our Articles of Incorporation, distribution
of surplus (excluding loss compensation), merger,
corporate split, or dissolution. In addition, within three
months after the end of each fi scal year, we are required
to issue a statement of fi nancial position, a statement of
income, and a business report to the Minister of Finance.
The supplementary provisions of the Reconstruction
Financing Act*, which came into eff ect on December 2,
2011 states that the Government shall study by the year
ending March 31, 2023 the possibility of full disposal of
government-owned JT shares by reassessing the
Government’s holding in JT shares considering the
Government’s involvement in the tobacco-related
industries based on the Tobacco Business Act.
* Act on Special Measures for Securing Financial Resources Necessary
for Reconstruction from the Great East Japan Earthquake.
OP
ER
ATIO
NS
& A
NA
LYS
IS
JAPAN TOBACCO INC. ANNUAL REPORT FY2014 051
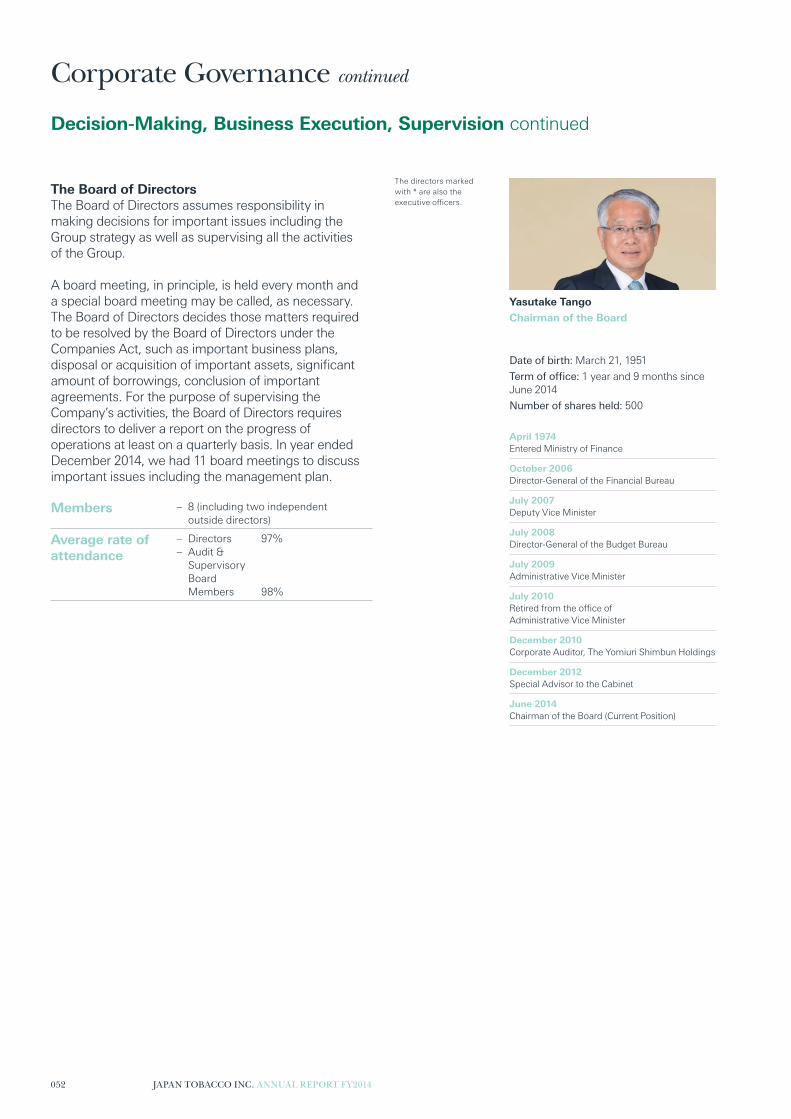
The Board of DirectorsThe Board of Directors assumes responsibility in
making decisions for important issues including the
Group strategy as well as supervising all the activities
of the Group.
A board meeting, in principle, is held every month and
a special board meeting may be called, as necessary.
The Board of Directors decides those matters required
to be resolved by the Board of Directors under the
Companies Act, such as important business plans,
disposal or acquisition of important assets, signifi cant
amount of borrowings, conclusion of important
agreements. For the purpose of supervising the
Company’s activities, the Board of Directors requires
directors to deliver a report on the progress of
operations at least on a quarterly basis. In year ended
December 2014, we had 11 board meetings to discuss
important issues including the management plan.
Decision-Making, Business Execution, Supervision continued
The directors marked
with * are also the
executive offi cers.
Yasutake Tango
Chairman of the Board
Date of birth: March 21, 1951
Term of offi ce: 1 year and 9 months since
June 2014
Number of shares held: 500
April 1974 Entered Ministry of Finance
October 2006Director-General of the Financial Bureau
July 2007 Deputy Vice Minister
July 2008 Director-General of the Budget Bureau
July 2009 Administrative Vice Minister
July 2010 Retired from the offi ce of
Administrative Vice Minister
December 2010 Corporate Auditor, The Yomiuri Shimbun Holdings
December 2012 Special Advisor to the Cabinet
June 2014 Chairman of the Board (Current Position)
Members – 8 (including two independent
outside directors)
Average rate of attendance
– Directors 97%
– Audit &
Supervisory
Board
Members 98%
052 JAPAN TOBACCO INC. ANNUAL REPORT FY2014
Corporate Governance continued

Yasushi Shingai *
Representative Director and Executive Deputy President
Date of birth: January 11, 1956
Term of offi ce: 1 year and 9 months since
June 2014
Number of shares held: 23,800
April 1980
Joined the Company (Japan Tobacco and
Salt Public Corporation)
July 2001
Vice President of Financial Planning Division
June 2004
Senior Vice President, and Head of Finance Group,
Vice President of Financial Planning Division
July 2004
Senior Vice President, and Chief Financial Offi cer
June 2005
Member of the Board, Senior Vice President,
and Chief Financial Offi cer
June 2006
Member of the Board, Executive Vice President,
JT International S.A.
June 2011
Member of the Board, Senior Vice President,
and Executive Vice President in charge of
International Tobacco Business
June 2011
Representative Director and Executive Deputy
President (Current Position)
June 2014Member of the Board (outside director) Recruit
Holdings Co., Ltd. (Current Position)
Noriaki Okubo *
Representative Director and Executive Deputy President
Date of birth: May 22, 1959
Term of offi ce: 1 year and 9 months since
June 2014
Number of shares held: 9,900
April 1983
Joined the Company (Japan Tobacco and Salt
Public Corporation)
April 2000
Vice President of Business Development Dept.,
Pharmaceutical Division
June 2002
Vice President of Business Planning Dept.,
Pharmaceutical Division
June 2004
Member of the Board, Senior Vice President,
and President, Pharmaceutical Business
June 2006
Member of the Board, Executive Vice President,
and President, Pharmaceutical Business
June 2009
Member of the Board, Senior Executive Vice
President, and President, Pharmaceutical Business
May 2010
Member of the Board, Senior Executive Vice
President, and President, Pharmaceutical
Business, Vice President of Business Planning
Dept., Pharmaceutical Division
January 2011
Member of the Board, Senior Executive Vice
President, and President, Pharmaceutical Business
June 2012
Representative Director and Executive Deputy
President (Current Position)
Mitsuomi Koizumi *
President, Chief Executive Offi cer and Representative Director
Date of birth: April 15, 1957
Term of offi ce: 1 year and 9 months since
June 2014
Number of shares held: 24,400
April 1981
Joined the Company (Japan Tobacco and Salt
Public Corporation)
June 2001 Vice President of Corporate Planning Division
June 2003 Senior Vice President, and Head of Human
Resources and Labor Relations Group
June 2004 Senior Vice President, and Vice President of
Tobacco Business Planning Division,
Tobacco Business Headquarters
June 2006 Executive Vice President, and Vice President of
Tobacco Business Planning Division,
Tobacco Business Headquarters
June 2007 Member of the Board, Executive Vice President,
and Head of Marketing & Sales General Division,
Tobacco Business Headquarters
July 2007 Member of the Board, Executive Vice President,
and Chief Marketing & Sales Offi cer,
Tobacco Business Headquarters
June 2009 Representative Director and
Executive Deputy President
June 2012 President, Chief Executive Offi cer and
Representative Director (Current Position)
OP
ER
ATIO
NS
& A
NA
LYS
IS
JAPAN TOBACCO INC. ANNUAL REPORT FY2014 053

Hideki Miyazaki *
Member of the Board and Executive Deputy President
Date of birth: January 22, 1958
Term of offi ce: 1 year and 9 months since
June 2014
Number of shares held: 12,100
April 1980
Joined Nomura Securities Co., Ltd.
July 2005
Joined the Company (Japan Tobacco Inc.)
January 2006
Deputy Chief Financial Offi cer
June 2008
Senior Vice President, and Chief Financial Offi cer,
Vice President, Tax Division
October 2009
Senior Vice President, and Chief Financial Offi cer
May 2010
Senior Vice President, and Chief Financial Offi cer,
Vice President, Treasury Division
June 2010
Executive Vice President and Chief Financial
Offi cer, Vice President, Treasury Division
July 2010
Executive Vice President and Chief Financial
Offi cer, Vice President, Treasury Division and
Vice President, Procurement Planning Division
August 2010
Executive Vice President and Chief Financial Offi cer
June 2012
Member of the Board and Executive Vice
President (Current Position)
Akira Saeki *
Representative Director and Executive Deputy President
Date of birth: August 25, 1960
Term of offi ce: 1 year and 9 months since
June 2014
Number of shares held: 15,500
April 1985
Joined the Company (Japan Tobacco Inc.)
June 2005
Vice President of Corporate Strategy Division
June 2007
Senior Vice President, Vice President
of Tobacco Business Planning Division,
Tobacco Business Headquarters
May 2008
Senior Vice President, Vice President of Tobacco
Business Planning Division, Tobacco Business
Headquarters, Head of China Division,
Tobacco Business
June 2008
Senior Vice President, Vice President of Tobacco
Business Planning Division, Tobacco Business
Headquarters, Chief Corporate, Scientifi c &
Regulatory Aff airs Offi cer, Tobacco Business,
Head of China Division, Tobacco Business
July 2008
Senior Vice President, Vice President of Tobacco
Business Planning Division, Tobacco Business
Headquarters, Chief Corporate, Scientifi c &
Regulatory Aff airs Offi cer, Tobacco Business
July 2009
Senior Vice President, Vice President of Tobacco
Business Planning Division, Tobacco Business
Headquarters, Chief Corporate, Scientifi c &
Regulatory Aff airs Offi cer, Tobacco Business
June 2010
Executive Vice President, and Vice President
of Tobacco Business Planning Division,
Tobacco Business Headquarters
June 2012
Representative Director and Executive Deputy
President (Current Position)
Decision-Making, Business Execution, Supervision continued
Corporate Governance continued
054 JAPAN TOBACCO INC. ANNUAL REPORT FY2014

Motoyuki Oka
Member of the Board (Outside director)
Date of birth: September 15, 1943
Term of offi ce: 1 year and 9 months since
June 2014
Number of shares held: 0
April 1966 Joined Sumitomo Corporation
June 1994 Director, Sumitomo Corporation
April 1998 Managing Director, Sumitomo Corporation
April 2001 Senior Managing Director, Sumitomo Corporation
June 2001 President, Chief Executive Offi cer,
Sumitomo Corporation
June 2007 Chairman of the Board of Directors,
Sumitomo Corporation
June 2012 Advisor, Sumitomo Corporation.
Member of the Board, the Company
(Current Position)
June 2013 Member of the Board(outside director),
NEC Corporation (Current Position)
Main Kohda
Member of the Board (Outside director)
Date of birth: April 25, 1951
Term of offi ce: 1 year and 9 months since
June 2014
Number of shares held: 0
September 1995 Started independently as Novelist
(Current Position)
January 2003 Member of Financial System Council,
Ministry of Finance Japan
April 2004 Visiting professor, Faculty of Economics,
Shiga University
March 2005 Member of the Council for Transport Policy,
Ministry of Land, Infrastructure, Transport
and Tourism
November 2006 Member of the Tax Commission, Cabinet Offi ce,
Government of Japan
June 2010 Member of the Board of Governors, Japan
Broadcasting Corporation
June 2012 Member of the Board, the Company
(Current Position)
June 2013 Member of the Board (outside director),
LIXIL Group (Current Position)
The directors marked
with * are also the
executive offi cers.
OP
ER
ATIO
NS
& A
NA
LYS
IS
JAPAN TOBACCO INC. ANNUAL REPORT FY2014 055

The Audit & Supervisory BoardEntrusted by shareholders and ensured of its autonomy,
the Audit & Supervisory Board conducts accounting
audits as well as operating audits. Currently, we have
four audit & supervisory board members including two
independent outside audit & supervisory board members.
Collectively, they have experience in management, legal,
fi nance and accounting among other areas. Audit &
supervisory board members have various statutory rights
in order to accomplish their roles and responsibilities,
including making requests to deliver reports to the
directors, executive offi cers and employees, issuing
an injunction to prevent illegal activities by directors,
and representing the Company in case of litigation
between any director and the Company. In addition,
the Audit & Supervisory Board has a right to dismiss
the auditing fi rm which conducts accounting audit.
The Audit & supervisory board members’ report
containing the results of both the accounting and
operating audits is submitted to the annual general
meeting of shareholders.
If directors and executive offi cers fi nd any issue that
may cause a substantial damage to the Company, they
are obliged to report it to the Audit & Supervisory Board,
along with other relevant matters that could aff ect the
Company. Audit & supervisory board members are
authorized to attend the meetings of the Board of
Directors and other important meetings. Our directors
and executive offi cers respond in a prompt and
appropriate manner, when requested by audit &
supervisory board members to deliver documents
for their inspection, to arrange fi eld audits and to
submit reports. The Operational Review and Business
Assurance Division, which conducts internal audits,
as well as the Compliance Offi ce, exchanges necessary
information and works together with audit & supervisory
board members.
Futoshi Nakamura
Standing Audit & Supervisory Board Members
Date of birth: November 23, 1957
Term of offi ce: 4 years since March 2015
Number of shares held: 4,800
April 1981 Joined the Company (Japan Tobacco and Salt
Public Corporation)
July 2004 Head of Procurement Planning Division
July 2005 Senior Manager of Operational Review
and Business Assurance Division
September 2005 Senior Manager of Operational Review and
Business Assurance Division JT International
Holding B.V. Vice President
July 2009 Senior Manager of Accounting Division
July 2010 Head of Operational Review and
Business Assurance Division
June 2012 Standing Audit & Supervisory Board Members,
the Company (Current Position)
Decision-Making, Business Execution, Supervision continued
Corporate Governance continued
Members – 4 (including two independent
outside audit & supervisory
board members)
Average rate of attendance
– 100%
056 JAPAN TOBACCO INC. ANNUAL REPORT FY2014

Tomotaka Kojima
Standing Audit & Supervisory Board Members
Date of birth: December 19, 1953
Term of offi ce: 4 years since March 2015
Number of shares held: 0
April 1976 Joined Ministry of Finance
July 2000 Director of the Fukuoka Local Finance
Branch Bureau
July 2002 Deputy Head of Finance Group of the Company
July 2004 Deputy Director General of Employee Welfare
Bureau, Secretariat of National Personnel Authority
April 2007 Deputy Director General for Administrative Policy
Matters, National Personnel Authority
January 2008 Director General of Equity and Investigation
Bureau, Secretariat of National Personnel
Authority
August 2009 Executive Director, National Hospital Organization
March 2010 Retired from Executive Director,
National Hospital Organization
October 2010 Adviser, Japan Association of Corporate Directors
November 2010 Secretary General, Japan Association
of Corporate Directors
June 2013 Standing Audit & Supervisory Board Members,
the Company (Current Position)
Yoshinori Imai
Audit & Supervisory Board Members (Outside Audit & Supervisory Board Members)
Date of birth: December 3, 1944
Term of offi ce: 4 years since March 2015
Number of shares held: 700
April 1968 Joined Japan Broadcasting Corporation
June 1995 Bureau Chief of General Bureau for Europe
May 2000 Director General,
Planning & Broadcasting Department
June 2003 Executive Editor and Program Host
January 2008 Executive Vice President
January 2011 Retired from Executive Vice President
April 2011 Visiting Professor, Ritsumeikan University
(Current Position)
June 2011 Audit & Supervisory Board Members,
the Company (Current Position)
Hiroshi Obayashi
Audit & Supervisory Board Members (Outside Audit & Supervisory Board Members)
Date of birth: June 17, 1947
Term of offi ce: 4 years since March 2015
Number of shares held: 0
April 1970 Judicial Apprentice
April 1972 Appointed as Public Prosecutor
May 2001 Director-General of the Rehabilitation Bureau,
Ministry of Justice
January 2002 Deputy Vice-Minister of Justice,
Ministry of Justice
June 2004 Director-General of the Criminal Aff airs Bureau,
Ministry of Justice
June 2006 Vice-Minister of Justice, Ministry of Justice
July 2007 Superintending Prosecutor, Sapporo High Public
Prosecutors‘ Offi ce
July 2008 Superintending Prosecutor, Tokyo High Public
Prosecutors‘ Offi ce
June 2010 Prosecutor-General
December 2010 Retired from the offi ce of Prosecutor-General
March 2011 Registered as Attorney at Law
April 2011Audit & Supervisory Board Members (outside
Audit & Supervisory Board Members) Daiwa
Securities Co. Ltd. (Current Position)
June 2013Member of the Board (outside director) Mitsubishi
Electric Corporation (Current Position)
June 2014Audit & Supervisory Board Members (outside
Audit & Supervisory Board Members) NIPPON
STEEL & SUMITOMO METAL CORPORATION
(Current Position)
March 2015Audit & Supervisory Board Members, the
Company (Current Position)
OP
ER
ATIO
NS
& A
NA
LYS
IS
JAPAN TOBACCO INC. ANNUAL REPORT FY2014 057

Independence of Outside Directors and Outside Audit & Supervisory Board Members JT reports to the securities exchanges on which it is
listed that the two outside directors and two outside
audit & supervisory board members are designated
as independent executives. We have a criteria list to
assess the independence of an executive. Based on the
criteria, the independence of the four executives has
been confi rmed. Motoyuki Oka, Main Kohda, Yoshinori
Imai and Hiroshi Obayashi, who are outside directors
and outside audit & supervisory board members, serve
as members of the Compensation Advisory Panel.
Criteria list for independence of an executiveA person who fi ts any of the following descriptions
is not designated as an independent executive.
1. A person who belongs or belonged to JT or
an affi liate or sister company of JT
2. A person who belongs to a company or any
other form of organization of which JT is a
major shareholder
3. A person who is a major shareholder of JT or
who belongs to a company or any other form of
organization which is a major shareholder of JT
4. A person who is a major supplier or customer of JT
(if the supplier or customer is a company or any other
form of organization, a person who belongs thereto)
5. A major creditor of JT including a major loan lender
(if the creditor is a company or any other form of
organization, a person who belongs thereto)
6. A certifi ed public accountant who serves as an
accounting auditor or an audit advisor of JT, or a
person who belongs to an auditing fi rm which serves
as an accounting auditor or an audit advisor of JT
7. A person who receives a large amount of fees from
JT in exchange for providing professional services
for legal, fi nancial and tax aff airs or business
consulting services (if the recipient of such fee
is a company or any other form of organization,
a person who belongs thereto)
8. A person who receives a large amount of donation
from JT (if the recipient of such donation is a company
or any other form of organization, a person who
belongs thereto)
9. A person who has fi t any of the descriptions in
2 to 8 above in the recent past
10. A close relative of a person who fi ts any of the
following descriptions:
(a) A person who fi ts any of the descriptions in
2 to 8 above (if such descriptions apply to a
company or any other form of organization, a
person who performs important duties thereof)
(b) A director, audit & supervisory board member,
audit advisor, executive offi cer or employee of
JT or an affi liate or sister company of JT
(c) A person who has fi t the descriptions in 1 or 2
in the recent past
058 JAPAN TOBACCO INC. ANNUAL REPORT FY2014
Corporate Governance continued
Decision-Making, Business Execution, Supervision continued

Support for Outside Directors and Outside Audit & Supervisory Board MembersWe provide supports to outside directors and outside
audit & supervisory board members. The Corporate
Strategy Division or Secretary Division explains the
agendas for board meetings in advance, submits
requested documents and delivers necessary information
to outside directors for them to contribute to the quality
of board discussion. As an independent body entrusted
by shareholders, the Audit & Supervisory Board is
expected to monitor the performance of the directors
and executive offi cers, with an aim to underpin the
Company’s healthy and sustainable growth as well as
increase its credibility. For outside audit & supervisory
board members to perform their expected roles, we are
supporting them by making necessary information
available and allocating adequate human resources to
the Auditor Offi ce which assists audit & supervisory
board members.
Executive Offi cer SystemJT employs the Executive Offi cer System to ensure
eff ective and effi cient management by promptly
responding to the changing environment, and thus aims
to increase its company value. Executive offi cers are
appointed by the Board of Directors. At the same time,
the board assigns certain responsibilities and delegates
relevant authorities to the executive offi cers in
accordance with the Rules Defi ning the Extent of
Responsibility and Authority. In addition, we have the
structure for quick decision-making about plan and
strategy relevant to all business execution except the
matters which are submitted to the Board of Directors.
This structure has been established by an articulate
decision-making process based on the Rules Defi ning
the Extent of Responsibility and Authority.
Please refer to page 150 for the list of executive offi cers.
OP
ER
ATIO
NS
& A
NA
LYS
IS
JAPAN TOBACCO INC. ANNUAL REPORT FY2014 059

Internal control framework
The Board of Directors External Auditors
Compliance Policy and the Compliance
Implementation Plan
Financial risks/Credit exposure
Crisis management/Disaster response
Internal audit plan/Internal audit report
Internal control report
Internal control audit
Reporting Monitoring
OverviewJT devotes its eff orts to ensure appropriate business operation by reinforcing internal control such as compliance,
internal audit and risk management among other matters. The developments of these internal control focuses are
reported regularly to the Board of Directors. In addition, we have the Auditor Offi ce, a department dedicated to
support the Audit & Supervisory Board, for our audit & supervisory board members to eff ectively perform their duties.
Collaboration among the Group companies is encouraged to strengthen the framework for compliance (which
includes the internal consultation and reporting), reliable fi nancial reporting, internal audit and risk management.
ComplianceA Code of Conduct has been created based on our
internal guidelines approved by the Board of Directors.
Under the Code of Conduct, all directors and employees
are expected to fully comply with applicable laws,
our Articles of Incorporation, social norms and other
compliance standards. In addition, the Board of
Directors has established a fair and eff ective
compliance framework as described below.
• Set up the JT Group Compliance Committee, which
reviews and discusses compliance related matters,
then directly reports to the Board of Directors
• Assign responsibility for compliance to a director
(who also serves as an executive offi cer)
• Assign responsibility for compliance to an executive
offi cer without directorship
• Assess and approve the Compliance Policy as well
as the Compliance Implementation Plan
• Review the implemented compliance initiatives.
The Compliance Offi ce is in charge of improving the
compliance framework, while identifying any issue in
the framework. The Compliance Offi ce also promotes
compliance by off ering training programs to directors
and employees.
The JT Group has both internal and external hotlines
through which employees may consult or report any
misconduct they suspect to be taking place. The
Compliance Offi ce is responsible for investigating
consulted or reported cases and implementing
Group-wide measures to prevent the recurrence
of misconduct after discussing it with the divisions
concerned. Material cases are reviewed by the
JT Group Compliance Committee, and further
reported to the Board of Directors as necessary.
The JT Group Compliance Committee is headed by the
Chairman, and external members comprise the majority.
The JT Group Compliance Committee met twice in the
year ended December 31, 2014, and discussed initiatives
to strengthen compliance throughout the Group among
other matters.
060 JAPAN TOBACCO INC. ANNUAL REPORT FY2014
Corporate Governance continued
Internal Control System & Risk Management System

Reliable fi nancial reportingIn order to ensure the reliability of its fi nancial reporting,
JT has introduced a relevant internal control system in
accordance with the Financial Instruments and Exchange
Act and other standards. In addition, a dedicated division
has been created which reviews the internal control
system and reports the result of the assessment.
Reliability of our fi nancial reporting is confi rmed
by the external accounting auditor who makes an
assessment of our internal control system based
on the Internal Control Report prepared by us.
Risk management
Financial risk managementJT has put in place the internal guidelines for fi nancial
risk management. The executive offi cer in charge
updates the status of fi nancial risks together with
the countermeasures against these risks. Meanwhile,
these risks and the countermeasures against them
are reported to CEO and the Board of Directors on
a quarterly basis.
Crisis management and disaster controlIn order to deal with possible crises or disasters, JT has
produced a manual for crisis management and disaster
control so that we can make a proper initial response.
In the event of a crisis or a disaster, a project team led by
the President is immediately assembled. In the project
team, the Corporate Strategy Division assumes the key
role to support the President. Under the leadership of
the President, we respond promptly and properly,
ensuring close cooperation across the organization.
The director in charge reports crisis or disaster incidents
to the Board of Directors on a quarterly basis.
Management of other risksIn accordance with the Rules Defi ning the Extent of
Responsibility and Authority, management of other
risks is delegated to relevant divisions, which identify
and monitor the risks in their areas of responsibility.
Signifi cant risks are reported to CEO, together with the
request for approval to implement countermeasures
against them, where necessary.
Please refer to page 46 for our risk factors.
Internal audit systemJT has an Operational Review and Business Assurance
Division, which is thoroughly independent of other
JT Group divisions and organizations engaging in
operations. Under such a capacity, it conducts internal
audits and directly reports to the President. The
Operational Review and Business Assurance Division
has unlimited access to all activities, records and
employees Group-wide to accomplish its roles and
responsibilities. The head of the division is required to
report to the President the results of internal audits
along with their analysis and assessment, and also
reports to the Board of Directors. The head of the
division has the right to contact the management of
JT and the Group companies regularly and as frequently
as needed.
OP
ER
ATIO
NS
& A
NA
LYS
IS
JAPAN TOBACCO INC. ANNUAL REPORT FY2014 061
OverviewRemuneration for our directors is determined by resolution
at the Board of Directors, taking into account discussion
at the Compensation Advisory Panel. Remuneration for
our audit & supervisory board members is determined
through the deliberations of the Audit & Supervisory
Board. The aggregate remuneration of directors and
audit & supervisory board members cannot exceed
the respective ceilings approved at a general meeting
of shareholders. In determining remuneration, we refer
to research management remuneration conducted by
a third party, and benchmark Japanese manufacturing
companies operating globally with a scale or profi t
comparable with ours.
The Compensation Advisory PanelThe Compensation Advisory Panel has been established
as an advisory body to the Board of Directors with an
aim to increase the objectiveness and transparency
of our executive remuneration. The Compensation
Advisory Panel comprises the Chairman, two outside
directors and two outside audit & supervisory board
members. Upon request, the Panel reviews and provides
advice on the policy, framework and calculation method
for remuneration of our directors and executive offi cers.
It also monitors whether our executive remuneration
level is reasonable. During the past fi scal year, the
Compensation Advisory Panel met twice to discuss
the level of remuneration among other matters.
Based on the recommendation by the Compensation
Advisory Panel, the key policy for our executive
remuneration is as follows:
• Set the remuneration at an adequate level to retain
personnel with superior capabilities
• Link the remuneration to company performance
so as to motivate executives to achieve their
performance targets
• Link the remuneration to company value in the
mid- to long-term
• Ensure transparency by implementing an objective
and quantitative framework.
Structure of executive remunerationIn accordance with the above policy, remuneration
for our executive comprises (1) “base salary” paid
monthly, (2) “executive bonus” linked to our business
performance in the relevant year, and (3) “stock option
grants”, the value of which is linked to our mid- to
long-term company value. In 2007, JT introduced a
stock option program as an incentive linked to the
mid- to long-term company value. The Companies
Act requires a special resolution at a shareholders’
meeting if stock options are granted under particularly
advantageous terms or at particularly advantageous
prices. This is not the case with our stock option
program, as our stock options are compensation for the
executives who perform their duties, and the options
are granted in exchange for certain considerations.
Remuneration for the directors and audit & supervisory
board members are structured as follows:
Remuneration for the directors who also serve as executive
offi cers comprises “base salary”, “executive bonus” and
“stock option grants”. “Executive bonus” is included, as
they are responsible for the achievement of assigned
annual targets through their day-to-day management.
As for the president or each executive deputy president,
the combined amount of “executive bonus” at a 100%
grant basis and “stock option grants” is targeted at
slightly less than 80% of respective annual base salary.
The same scheme is introduced to set “executive
bonus” and “stock option grants” for other directors,
while the combined amount is targeting approximately
70% of respective annual base salary. Excluding outside
directors, remuneration for the directors not serving as
executive offi cers comprises “base salary” and “stock
option grants”, as they focus on decision-making on the
Group strategies in addition to supervision of business
and corporate activities. Remuneration for outside
directors consists solely of “base salary” and does not
include performance linked compensation from the
perspective of sustaining their independence.
Remuneration for the audit & supervisory board members
is also composed of “base salary” alone, in light of their
key responsibility to conduct audits.
062 JAPAN TOBACCO INC. ANNUAL REPORT FY2014
Corporate Governance continued
Executive Remuneration
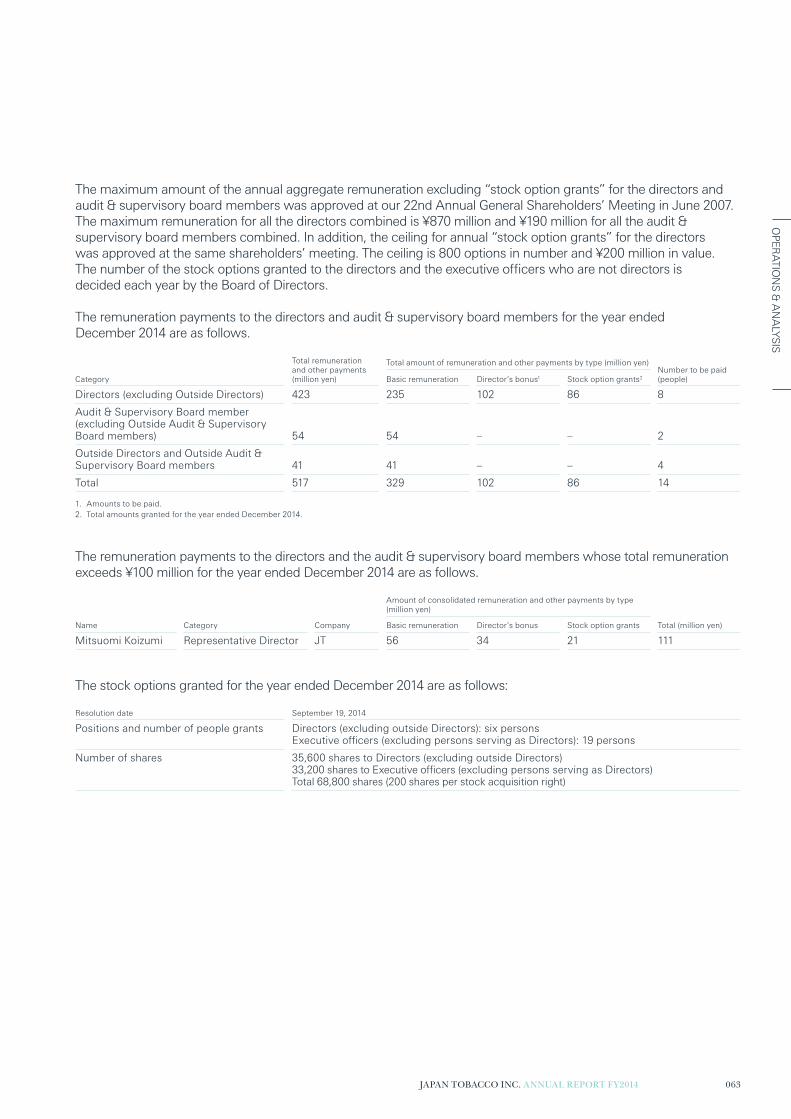
The maximum amount of the annual aggregate remuneration excluding “stock option grants” for the directors and
audit & supervisory board members was approved at our 22nd Annual General Shareholders’ Meeting in June 2007.
The maximum remuneration for all the directors combined is ¥870 million and ¥190 million for all the audit &
supervisory board members combined. In addition, the ceiling for annual “stock option grants” for the directors
was approved at the same shareholders’ meeting. The ceiling is 800 options in number and ¥200 million in value.
The number of the stock options granted to the directors and the executive offi cers who are not directors is
decided each year by the Board of Directors.
The remuneration payments to the directors and audit & supervisory board members for the year ended
December 2014 are as follows.
Category
Total remuneration
and other payments
(million yen)
Total amount of remuneration and other payments by type (million yen)Number to be paid
(people)Basic remuneration Director’s bonus1 Stock option grants2
Directors (excluding Outside Directors) 423 235 102 86 8
Audit & Supervisory Board member (excluding Outside Audit & Supervisory Board members) 54 54 – – 2
Outside Directors and Outside Audit & Supervisory Board members 41 41 – – 4
Total 517 329 102 86 14
1. Amounts to be paid.
2. Total amounts granted for the year ended December 2014.
The remuneration payments to the directors and the audit & supervisory board members whose total remuneration
exceeds ¥100 million for the year ended December 2014 are as follows.
Name Category Company
Amount of consolidated remuneration and other payments by type
(million yen)
Total (million yen)Basic remuneration Director’s bonus Stock option grants
Mitsuomi Koizumi Representative Director JT 56 34 21 111
The stock options granted for the year ended December 2014 are as follows:
Resolution date September 19, 2014
Positions and number of people grants Directors (excluding outside Directors): six personsExecutive offi cers (excluding persons serving as Directors): 19 persons
Number of shares 35,600 shares to Directors (excluding outside Directors)33,200 shares to Executive offi cers (excluding persons serving as Directors)Total 68,800 shares (200 shares per stock acquisition right)
OP
ER
ATIO
NS
& A
NA
LYS
IS
JAPAN TOBACCO INC. ANNUAL REPORT FY2014 063

The new JTI headquarters in Geneva:
Designed to inspire our diverse employees

FIN
AN
CIA
L R
EV
IEW
066 Financial Review

About the unifi cation of accounting periodIn this fi scal year, the Company and its subsidiaries have unifi ed their fi scal years to end on December 31, in line with
overseas consolidated subsidiaries of the Group which will enhance and improve the effi ciency of the closing and
management systems.
FY2014, a transitional period for the change in accounting period, covers nine months from April 1, 2014 to
December 31, 2014 for the Japanese domestic businesses. The same change in the accounting period is applied
to those the Company’s consolidated subsidiaries whose current closing date was other than December 31
(Reported basis).
For the purpose of fair comparison of business performance, we are providing fi gures for the twelve-month period
from January 1, 2014 to December 31, 2014 (Like-for-Like basis) with regard to all business segments.
2014 results (Like-for-like basis, Comparison with 2013 Jan – Dec)
Jan Mar
Apr Jun
Jul Sep
Oct Dec
Jan Mar
Apr Jun
Jul Sep
OctDec
Domestic
International
2013 Jan – Dec 2014 Jan – Dec
All business segments: Twelve-month period from January 1 to
December 31 for 2013 and 2014, respectively
2014 results (Reported basis)
Jan Mar
Apr Jun
Jul Sep
Oct Dec
Jan Mar
Apr Jun
Jul Sep
OctDec
Domestic
International
FY2013 FY2014
Japan domestic businesses: From April 1, 2014 to December 31,
2014 (Nine months)
International business : From January 1, 2014 to December 31, 2014
(Twelve months)
066 JAPAN TOBACCO INC. ANNUAL REPORT FY2014
Financial Review
Notes:Revenue, operating profi t, adjusted operating profi t and profi t attributed to owners of the parent company for January – December, 2014 would be disclosed in the Financial Statements and
Notes, which would be audited.
For the purpose of fair comparison and reference, the same accounting methods were applied to both fi nancial results of January – December 2013 and 2014. Financial results of January –
December, 2013 would not be audited.
Analysis of the ResultsFY2014: Results for the fi scal year ended December 31, 2014

1. Signifi cant Accounting Policies Having acquired RJR Nabisco’s non-U.S. tobacco
operation in 1999 and Gallaher Group Plc. in the UK
in 2007, the JT Group has been growing steadily as a
global company with operations in over 70 countries
and with our products sold in more than 120 countries
and regions around the world. In this context, the JT
Group has adopted IFRS from the year ended March 31,
2012 to improve international comparability of fi nancial
information in capital markets and to diversify the
group’s sources of fi nancing through international
capital markets.
Eff ective from the current fi scal year, the Company
and those of its consolidated subsidiaries with fi scal
year ends other than December 31 have changed their
fi scal year ends to December 31 for the purpose of
unifying the fi scal year end with overseas consolidated
subsidiaries of the Group, which will enhance and
improve the effi ciency of the closing and management
systems. As a result of this change, the consolidated
fi scal year end date has been changed from March 31
to December 31, and the current fi scal year is the
nine-month period from April 1, 2014, through
December 31, 2014. In addition, the fi scal year end date
of JT International Holding B.V. and its subsidiaries,
which operate the Group’s International Tobacco
Business, is already December 31. Consequently, the
fi nancial results of these companies for the twelve-
month period from January 1, 2014, through December
31, 2014, have been consolidated into the Group’s
consolidated fi nancial results for the current fi scal year.
For further details of signifi cant accounting policies,
please refer to Note 3 to the consolidated fi nancial
statements.
2. Non-GAAP fi nancial measures The JT Group discloses certain additional fi nancial
measures that are not required or defi ned under IFRS.
These measures help grasp underlying performance
of each business and are used for internal performance
management. We believe that they are useful
information for users of our fi nancial statements
to assess the Group’s performance.
For our international tobacco business, its consolidated
fi nancial statements reported in US dollars are internally
reviewed and therefore revenue and adjusted operating
profi t are externally communicated in US dollars. These
non-GAAP fi nancial measures should be treated as
supplementary information, rather than alternative
measures to corresponding fi nancial numbers
prepared in accordance with IFRS.
Core revenue For the tobacco business, core revenue is disclosed
additionally as a breakdown of revenue. Specifi cally,
the core revenue for the Japanese domestic tobacco
business is presented after deducting revenue
accounted for distribution of imported tobacco
products, among other things, from revenue, while
core revenue for the international tobacco business
is presented after deducting the revenue accounted
for the distribution business and contract manufacturing,
among other areas, from revenue.
Adjusted Operating Profi tIn order to provide useful comparative information
on our business performance, adjusted operating
profi t is presented as operating profi t plus amortization
of acquired intangibles and adjusted items (income
and costs). Adjusted items (income and costs) are
impairment losses on goodwill and restructuring
income and costs, and other items. Furthermore, for
the international tobacco business, adjusted operating
profi t at constant rates of exchange which excludes
foreign exchange eff ects, is also presented as additional
information. Adjusted operating profi t at constant
exchange rate for a relevant period in the international
tobacco business is calculated using the foreign
exchange rates of the prior year.
Adjusted EPS (diluted) In order to provide useful comparative information
on our shareholder return, adjusted EPS (diluted) is
presented after making certain adjustments to dilute
EPS. For the adjustments made for the adjusted EPS
(diluted), please refer to Notes to Consolidated
Financial Statements ’30. Earnings per share’.
Consolidated dividend payout ratio The consolidated dividend payout ratio is calculated by
dividing the annual dividend per share for the relevant
year (total of interim dividends and year-end dividends
for which the record dates are included in the relevant
year) by basic earnings per share.
3. Analysis of consolidated fi nancial results for FY2014 (the fi scal year ended December 31, 2014) For analysis of ‘Revenue’, ‘Adjusted Operating Profi t’,
‘Operating profi t’ and ‘Profi t attributable to owners of
the parent company’, it was disclosed based on the
results of January 1 to December 31, 2013 and 2014
(Like-for-Like base) for the Company and its subsidiaries.
For analysis of fi nancial results by business segment,
please refer to ‘Review of Operations’.
FIN
AN
CIA
L R
EV
IEW
JAPAN TOBACCO INC. ANNUAL REPORT FY2014 067

Revenue1
(billions of yen)
2,372.2
+58.0
-4.6
+7.6
-2.5
+4.0
-1.3
2,433.5
2013 Jan – Dec
International tobacco business
Japanese domestic tobacco
Pharmaceutical
Beverage
Processed Food
Others
2014 Jan – Dec
Adjusted Operating Profit2 / Operating Profit(billions of yen)
612.6
+53.8
-49.6
+31.9
2013 Jan – Dec
International tobacco at constant currency
Japanese domestic business
Pharmaceutical
Beverage
Processed Food
Others
2013 Jan – Dec Adjusted Operating Profit
2014 Jan – Dec Operating Profit
Adjusted total
+4.1
+6.3
+1.6
+0.8
-1.6
660.1
571.8
-88.3
International tobacco US$ vs. YenForex Effect
International tobacco at Local currencyvs. US$ Forex Effect
• Revenue increased ¥61.3 billion or +2.6% year-on-year to ¥2,433.5 billion.
• This was mainly the results of robust pricing and mix eff ect in the international tobacco business as well as the weak yen eff ect.
Adjusted operating profi t increased ¥47.5 billion or +7.8% year-on-year to ¥660.1 billion, driven by the tobacco business.• In International tobacco business, adjusted operating profi t growth was driven by strong price and mix eff ect as well as the weak yen eff ect.
• In Japanese domestic tobacco business , adjusted operating profi t growth was driven by price/mix improvement resulting from successful
consumer retention and the decrease in costs and sales promotion expenses.
Operating profi t at constant currency increased +10.6% year-on-year.
Operating profi t decreased ¥70.9 billion or -11.0% year-on-year to ¥571.8 billion.• Recognized the costs associated with measures to strengthen the competitiveness of the Japanese domestic tobacco business.
• Recognized the restructuring costs of manufacturing facilities in Europe in the International tobacco business.
• Other income of proceeds from disposal of investment property decreased.
Actual Results Decrease Increase (Decrease in case of expense)
068 JAPAN TOBACCO INC. ANNUAL REPORT FY2014
Financial Review continued
Analysis of the Results continuedFY2014: Results for the fi scal year ended December 31, 2014

Profit3(billions of yen)
443.0
-70.9
+14.0
+2.9
389.1
2013 Jan – Dec
Operating profit
Financial income/financial cost
Income tax/Profit attributable to non-controlling interests
2014 Jan – Dec
• Profi t decreased ¥54.0 billion or -12.2% year-on-year to ¥389.1 billion, as the decrease in operating profi t more than the increase in net fi nancial income.
• Financial income/Financial costs improved year-on-year mainly due to the increase in interest income and the decrease in interest expenses.
• Income tax decreased (increased as in the above graph), due to the decrease in profi t and post a deferred tax liability.
Billions of yen
2013
Jan-Dec
2014Jan-Dec
Consolidated operating profi t 642.7 571.8
Adjustment total6 (30.1) 88.3
Consolidated: Adjusted operating profi t 612.6 660.1
International tobacco: Operating profi t4 376.4 379.5
Adjustment total6 34.4 67.6
International tobacco:
Adjusted operating profi t 410.8 447.1
Japanese domestic tobacco: Operating profi t 235.6 181.5
Adjustment total6 (1.0) 57.2
Japanese domestic tobacco:
Adjusted operating profi t 234.6 238.7
Pharmaceutical: Operating profi t (13.7) (7.3)
Adjustment total6 – –
Pharmaceutical: Adjusted operating profi t (13.7) (7.3)
Beverage: Operating profi t (2.1) (0.5)
Adjustment total6 – –
Beverage: Adjusted operating profi t (2.1) (0.5)
Processed Food: Operating profi t 0.7 (1.2)
Adjustment total6 (0.1) 2.6
Processed food: Adjusted operating profi t 0.6 1.4
Others/Elimination: Operating profi t 45.7 19.9
Adjustment total6 (63.4) (39.1)
Others/Elimination:
Adjusted operating profi t (17.6) (19.3)
• For analysis of revenue, core revenue and adjusted operating profi t of each
business segment, please refer to section “Review of Operations.”
Adjusted Operating Profi t and Operating profi t by business segment
Billions of yen
2013
Jan-Dec
2014Jan-Dec
Revenue 2,372.2 2,433.5
International tobacco 1,270.0 1,328.0
Core revenue4 1,200.7 1,258.2
Japanese domestic tobacco 690.5 685.9
Core revenue5 656.3 649.8
Pharmaceutical 58.2 65.8
Beverage 183.8 181.3
Processed Food 157.2 161.2
Others 12.6 11.3
2013
Jan-Dec
2014Jan-Dec
YEN/US$ 97.73 105.79
RUB/US$ 31.84 38.40
GBP/US$ 0.64 0.61
EUR/US$ 0.75 0.75
1. Exclude tobacco excise taxes and agency transactions.
2. Adjusted Operating profi t = Operating profi t + amortization of intangible assets of ±
adjusted items (income and costs)*.
*Adjusted items (income and costs) = Impairment losses on goodwill ± restructuring
income and costs ± others.
3. Profi t attributable to owners of the parent.
4. Excludes revenues from distribution, contract manufacturing and other peripheral
businesses.
5. Excludes revenue form distribution of imported tobacco in the Japanese domestic
tobacco business, among other factors.
6. Amortization cost of acquired intangibles ± adjustment items(income and cost)**.
** Adjustment items (income and costs) = impairment losses on goodwill ±
restructuring income and costs ± others.
Revenue by business segment
Average Exchange Rate
FIN
AN
CIA
L R
EV
IEW
JAPAN TOBACCO INC. ANNUAL REPORT FY2014 069

(2) Adjusted EPS (diluted)Adjusted profi t for January – December, 2014 increased ¥27.7 billion year-on-year to ¥434.7 billion. Adjusted EPS
(diluted) for January – December, 2014 increased ¥17.03 or +7.7% year-on-year to ¥239.01.
(Billions of yen)
2013
Jan-Dec
2014 Jan-Dec
Profi t used for calculation of adjusted diluted earnings per share 443.0 389.1
Adjustment items (income) (65.1) (46.1)
Adjustment items (costs) 9.0 105.0
Adjustments on income taxes and non-controlling interests 20.0 (13.3)
Adjusted profi t for the year 406.9 434.7
Weighted-average number of diluted ordinary shares during the year (thousands of shares) 1,833,237 1,818,590
Adjusted diluted earnings per share (yen) 221.98 239.01
(3) Results and plans of capital expendituresCapital expenditures include outlays on property, plants and equipment such as land, buildings, and structures;
machinery; vehicles and others; and intangible assets such as goodwill, trademark, software, and others that are
necessary for enhancing the productivity of our factories and other facilities; strengthening our competitiveness,
and operating in various business fi elds.
(Billions of yen, %)
Years ended March 31
2013
Jan-Dec
2014 Jan-Dec
Capital expenditure 168.6 140.9
International tobacco 78.5 74.2
Japanese domestic tobacco 61.2 41.0
Pharmaceutical 3.5 4.7
Beverage 15.4 10.7
Processed Food 4.8 4.7
Other/Elimination and corporate 5.1 5.5
Total amount of capital expenditures amounted to ¥140.9 billion from January 1 to December 31, 2014.
In the international tobacco business, capital expenditures amounted to ¥74.2 billion which was spent on expanding
production capacity, maintenance and replacement of facility, and for improvement of product specifi cations. In the
Japanese domestic tobacco business, capital expenditures amounted to ¥41.0 billion which was spent on initiatives
to streamline manufacturing processes, to strengthen our ability to respond fl exibly to supply and demand
fl uctuations with an increasingly diverse range of products, and to develop new products.
In the pharmaceutical business, capital expenditures amounted to ¥4.7 billion which was spent on the development
and reinforcement of R&D capabilities.
In the beverage business, capital expenditures amounted to ¥10.7 billion, which was spent on maintaining and
renewing the vending machine network, among other areas.
In the processed food business, capital expenditures amounted to ¥4.7 billion, which was spent on enhancing
and maintaining the production capacity.
These capital expenditures were internally funded through cash generated by operations.
070 JAPAN TOBACCO INC. ANNUAL REPORT FY2014
Financial Review continued
Analysis of the Results continuedFY2014: Results for the fi scal year ended December 31, 2014

Plans for new installations and disposal of facilitiesRegarding the mid- to long-term resource allocation of the JT Group, we will place top priority on business
investments that will lead to sustainable profi t growth in the mid- to long-term based on our management
principles. We position the international and Japanese domestic tobacco business as the core business and profi t
growth engine and place top priority on business investments that will lead to their sustainable profi t growth.
Meanwhile, regarding the pharmaceutical business and processed food business, we will strive to strengthen
foundations that will lead to future profi t contribution, and we will make investments to that end. Based on this
policy, we plan capital expenditures totaling ¥161.0* billion for FY2015.
As JT and JT Group companies have wide-ranging plans for capital expenditure, fi gures are disclosed by segment.
Our actual capital expenditures may diff er signifi cantly from the planned fi gures mentioned above as a result of a
number of factors, including those discussed in ‘Risk Factors’.
Capital Expenditure plan
(Billions of yen) Main purpose of investment Funding
International tobacco
business 85.0
Investment for improvement of product specifi cations, expansion
of production capacity, maintenance and upgrading of facilities Internally funded
Japanese domestic
tobacco 41.0
Investment in production and sales facilities for the purpose of brand
equity enhancement Same as above
Pharmaceutical 6.5 Investment for the maintaining and reinforcing of R&D Same as above
Beverage 13.0 Investment for the maintenance and reinforcing trade marketing Same as above
Processed food 7.0 Investment for enhancing and maintaining production capacity Same as above
* The business impact and costs related to the withdrawal from the manufacture and sale of JT beverage products, announced in February 2015, was not included in the planned
capital expenditures for FY2015.
FIN
AN
CIA
L R
EV
IEW
JAPAN TOBACCO INC. ANNUAL REPORT FY2014 071

Consolidated Balance Sheet (Assets)(billions of yen)
4,616.8
+132.6
+8.2
+36.9
-23.9
-45.1
-19.3
-1.5
4,704.7
March 31, 2014
Cash and cash equivalents
Trade and other receivables
Inventory
Property, plant and equipment
Goodwill
Trademark
Other assets
December 31, 2014
Consolidated Balance Sheet (Debt and Equity)(billions of yen)
4,616.8
+59.7
-163.6
+10.4
+103.3
+51.7
+139.9
-113.6
+0.1
4,704.7
March 31, 2014
Trade and other payables
Bonds
Borrowings
Tobacco excise tax payables etc
Other liabilities
Retained earnings
Exchange differences on translation of foreign operations
Other equity total
March 31, 2014
• Total assets increased ¥87.9 billion to ¥4,704.7 billion, due to, among other factors, the weak yen eff ect, which partially off set the decrease in goodwill with
weak local currency eff ect (vs. US$) and investment property.
• Total liabilities increased ¥61.5 billion to ¥2082.2 billion mainly due to the increase in tobacco excise tax payables and the weak yen, which was partially off -set
by decrease in interest bearing debts.
• Total equity increased ¥26.4 billion to ¥2,622.5 billion due to the increase in retained earnings but partially off set by the decrease in exchange diff erences
on translation of foreign operations.
(4) Consolidated fi nancial results for FY2014 (Consolidated balance sheet)Analysis of consolidated statement of fi nancial position (assets, debt and equity) ended December 31, 2014 was
disclosed as below.
072 JAPAN TOBACCO INC. ANNUAL REPORT FY2014
Financial Review continued
Analysis of the Results continuedFY2014: Results for the fi scal year ended December 31, 2014
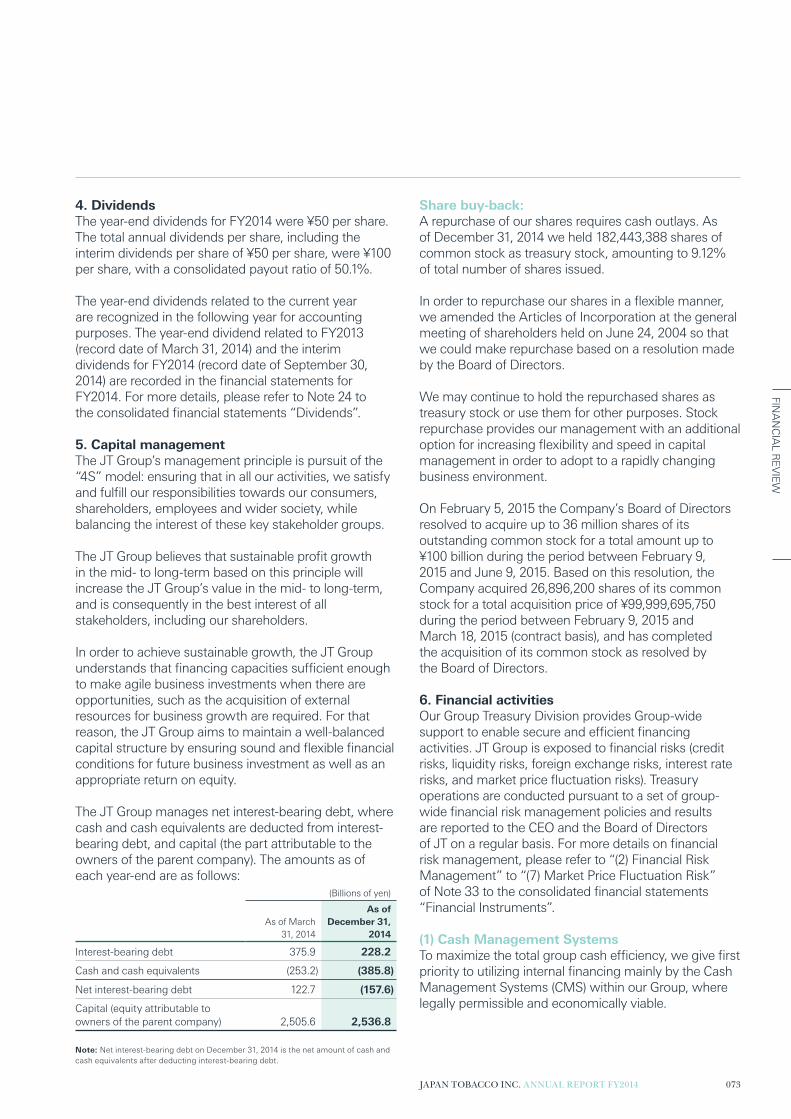
4. Dividends The year-end dividends for FY2014 were ¥50 per share.
The total annual dividends per share, including the
interim dividends per share of ¥50 per share, were ¥100
per share, with a consolidated payout ratio of 50.1%.
The year-end dividends related to the current year
are recognized in the following year for accounting
purposes. The year-end dividend related to FY2013
(record date of March 31, 2014) and the interim
dividends for FY2014 (record date of September 30,
2014) are recorded in the fi nancial statements for
FY2014. For more details, please refer to Note 24 to
the consolidated fi nancial statements “Dividends”.
5. Capital management The JT Group’s management principle is pursuit of the
“4S” model: ensuring that in all our activities, we satisfy
and fulfi ll our responsibilities towards our consumers,
shareholders, employees and wider society, while
balancing the interest of these key stakeholder groups.
The JT Group believes that sustainable profi t growth
in the mid- to long-term based on this principle will
increase the JT Group’s value in the mid- to long-term,
and is consequently in the best interest of all
stakeholders, including our shareholders.
In order to achieve sustainable growth, the JT Group
understands that fi nancing capacities suffi cient enough
to make agile business investments when there are
opportunities, such as the acquisition of external
resources for business growth are required. For that
reason, the JT Group aims to maintain a well-balanced
capital structure by ensuring sound and fl exible fi nancial
conditions for future business investment as well as an
appropriate return on equity.
The JT Group manages net interest-bearing debt, where
cash and cash equivalents are deducted from interest-
bearing debt, and capital (the part attributable to the
owners of the parent company). The amounts as of
each year-end are as follows:
(Billions of yen)
As of March
31, 2014
As of December 31,
2014
Interest-bearing debt 375.9 228.2
Cash and cash equivalents (253.2) (385.8)
Net interest-bearing debt 122.7 (157.6)
Capital (equity attributable to
owners of the parent company) 2,505.6 2,536.8
Note: Net interest-bearing debt on December 31, 2014 is the net amount of cash and
cash equivalents after deducting interest-bearing debt.
Share buy-back: A repurchase of our shares requires cash outlays. As
of December 31, 2014 we held 182,443,388 shares of
common stock as treasury stock, amounting to 9.12%
of total number of shares issued.
In order to repurchase our shares in a fl exible manner,
we amended the Articles of Incorporation at the general
meeting of shareholders held on June 24, 2004 so that
we could make repurchase based on a resolution made
by the Board of Directors.
We may continue to hold the repurchased shares as
treasury stock or use them for other purposes. Stock
repurchase provides our management with an additional
option for increasing fl exibility and speed in capital
management in order to adopt to a rapidly changing
business environment.
On February 5, 2015 the Company’s Board of Directors
resolved to acquire up to 36 million shares of its
outstanding common stock for a total amount up to
¥100 billion during the period between February 9,
2015 and June 9, 2015. Based on this resolution, the
Company acquired 26,896,200 shares of its common
stock for a total acquisition price of ¥99,999,695,750
during the period between February 9, 2015 and
March 18, 2015 (contract basis), and has completed
the acquisition of its common stock as resolved by
the Board of Directors.
6. Financial activities Our Group Treasury Division provides Group-wide
support to enable secure and effi cient fi nancing
activities. JT Group is exposed to fi nancial risks (credit
risks, liquidity risks, foreign exchange risks, interest rate
risks, and market price fl uctuation risks). Treasury
operations are conducted pursuant to a set of group-
wide fi nancial risk management policies and results
are reported to the CEO and the Board of Directors
of JT on a regular basis. For more details on fi nancial
risk management, please refer to “(2) Financial Risk
Management” to “(7) Market Price Fluctuation Risk”
of Note 33 to the consolidated fi nancial statements
“Financial Instruments”.
(1) Cash Management Systems To maximize the total group cash effi ciency, we give fi rst
priority to utilizing internal fi nancing mainly by the Cash
Management Systems (CMS) within our Group, where
legally permissible and economically viable.
FIN
AN
CIA
L R
EV
IEW
JAPAN TOBACCO INC. ANNUAL REPORT FY2014 073

(2) External fi nancing Short-term working capital needs are basically fi nanced
through short-term borrowings from fi nancial institutions
or through commercial paper, or a combination of both.
Mid-to long-term capital needs are fi nanced through
long-term borrowings from fi nancial institutions, bond
or equity, or a combination of those previously stated.
We continue to diversify our fi nancing method and
correspondent fi nancial institutions to secure stable and
effi cient funding sources through activities such as the
establishment of committed facilities. The condition of
the Group’s wide external debt is reported to the CEO
and the Board of Directors of JT on a regular basis.
(3) External investments Our fi nancial investments are always made taking into
account safety, liquidity and optimal yield. Speculative
dealings in pursuit of profi t margin are not allowed.
The results of the fi nancial investment are reported
to the CEO and the Board of Directors of JT on
a regular basis.
7. Results of cash fl ows FY2013 and FY2014 Cash and cash equivalents at the end of FY2014
increased by ¥132.6 billion from the end of FY2013
to ¥385.8 billion. Cash and cash equivalents at the
end of FY2013 were ¥253.2 billion.
Note: Tobacco excise tax is paid monthly, one month in arrears, at the end of each
month. In Japan, since December 31, 2014 was a holiday for fi nancial institutions in
Japan, we did not pay the tobacco excise tax for the previous month’s tobacco sales in
Japan on that fi scal year-end. The amounts of excise taxes paid on the business day
immediately following the end of the previous year was ¥136.8 billion.
Cash fl ows from (used in) operating activities Net cash fl ows from operating activities during
FY2014 were ¥543.7 billion. The main factors were
the generation of a stable cash infl ow from the tobacco
business. As a result of holidays for fi nancial institutions,
the amount of national tobacco excise tax paid for the
prior year in Japan was for 13 months, while the amount
for FY2014 in Japan was for 8 months. Net cash fl ows
from operating activities were ¥396.5 billion for FY2013.
Cash fl ows from (used in) investing activities Net cash fl ows used in investing activities during
FY2014 were ¥49.1 billion. This was mainly due to the
proceeds from sale of investment property but partially
off set by the payment for the purchase of property,
plant and equipment. Net cash fl ows used in investing
activities were ¥163.5 billion for FY2013.
Cash fl ows from (used in) fi nancing activities Net cash fl ows used in fi nancing activities during
FY2014 were ¥388.9 billion. This was mainly due to
the increase of dividends per share and repayment
of bonds. Net cash fl ows used in fi nancing activities
were ¥145.2 billion for FY2013.
8. Liquidity We have historically had, and expect to continue to
have, signifi cant cash fl ows from operating activities.
We expect that cash generated from operating activities
will continue to be stable and cover funds needed for
ordinary business activities. On December 31, 2014,
we had Yen 386.5 billion committed facilities for both
domestic and international major fi nancial institutions,
of which 100% was unused. In addition, we have a
domestic commercial paper program, uncommitted
facilities and a domestic bond shelf registration.
(1) Long-term debt Bonds issued (including the current portion) as of
March 31, 2014 and December 31, 2014 accounted
for ¥303.5 billion and ¥140.0 billion respectively and
long-term borrowings as loans from fi nancial institutions
(including the current portion) accounted for ¥36.3
billion and ¥41.0 billion respectively. Annual interest rates
applicable to long-term borrowings outstanding as of
March 31, 2014 and December 31, 2014 ranged from
0.43% to 5.90% and 0.43% to 5.90% respectively.
Long-term lease obligations accounted for ¥9.7 billion as
of March 31, 2014 and ¥15.3 billion as of December 31,
2014. Maturities of interest bearing debts are shown in
the table below.
As of December 31, 2014, our long-term debt was rated
Aa3 by Moody’s Japan K.K.(Moody’s), AA- by Standard
& Poor’s Ratings Japan K.K.(S&P), and AA by Rating and
Investment Information Inc. (R&I), with a “stable”
outlook from Moody’s, a “stable” outlook from S&P and
a “stable” outlook from R&I. These ratings are among
the highest ratings for international tobacco companies.
These ratings are aff ected by a number of factors
such as developments in our major markets, our
business strategies and general economic trends that
are beyond control. The ratings may be withdrawn or
revised at any time. Each rating should be evaluated
separately from other ratings. Under the Japan Tobacco
Inc. Act, the bondholders of JT can enjoy statutory
preferential rights over unsecured creditors in seeking
repayment, with the exception of national and local
taxes and other statutory obligations.
074 JAPAN TOBACCO INC. ANNUAL REPORT FY2014
Financial Review continued
Analysis of the Results continuedFY2014: Results for the fi scal year ended December 31, 2014

(2) Short-term debt Short-term borrowings totaled ¥21.9 billion as of March 31, 2014 and ¥27.6 billion as of December 31, 2014. There
was no commercial paper outstanding as of March 31, 2014 and December 31, 2014. Annual interest rates applicable
to short-term borrowings ranged from 0.45% to 13.00% as of March 31, 2014, and from 0.43% to 10.00% as of
December 31, 2014. Short-term lease obligations totaled ¥4.4 billion as of March 31, 2014 and ¥4.3 billion as of
December 31, 2014.
(Billions of yen)
Book Value
Due within
1 year
Due after
1 year
through 2
years
Due after
3 years
through 4
years
Due after
3 years
through 4
years
Due after
4 years
through 5
years
Due after 5
years
Short-term borrowings as loans 27.6 27.6 – – – – –
Short-term lease obligations 4.3 4.3 – – – – –
Long-term borrowings as loans (current portion) 39.9 39.9 – – – – –
Bonds (current portion) 40.0 40.0 – – – – –
Long-term borrowings as loans 1.0 – 0.1 0.1 0.2 0.1 0.5
Bonds 100.0 – – 20.0 60.3 – 20.0
Long-term lease obligations 15.3 – 3.6 2.8 1.8 0.7 6.4
Total 228.2 111.8 3.7 22.9 62.3 0.8 26.9
FIN
AN
CIA
L R
EV
IEW
JAPAN TOBACCO INC. ANNUAL REPORT FY2014 075

JT headquarters in Tokyo:
The statuesque front entrance

078 Financial Statements
084 Notes to the Consolidated
Financial Statements
135 Independent Auditor’s Report
FIN
AN
CIA
L S
TA
TE
ME
NTS
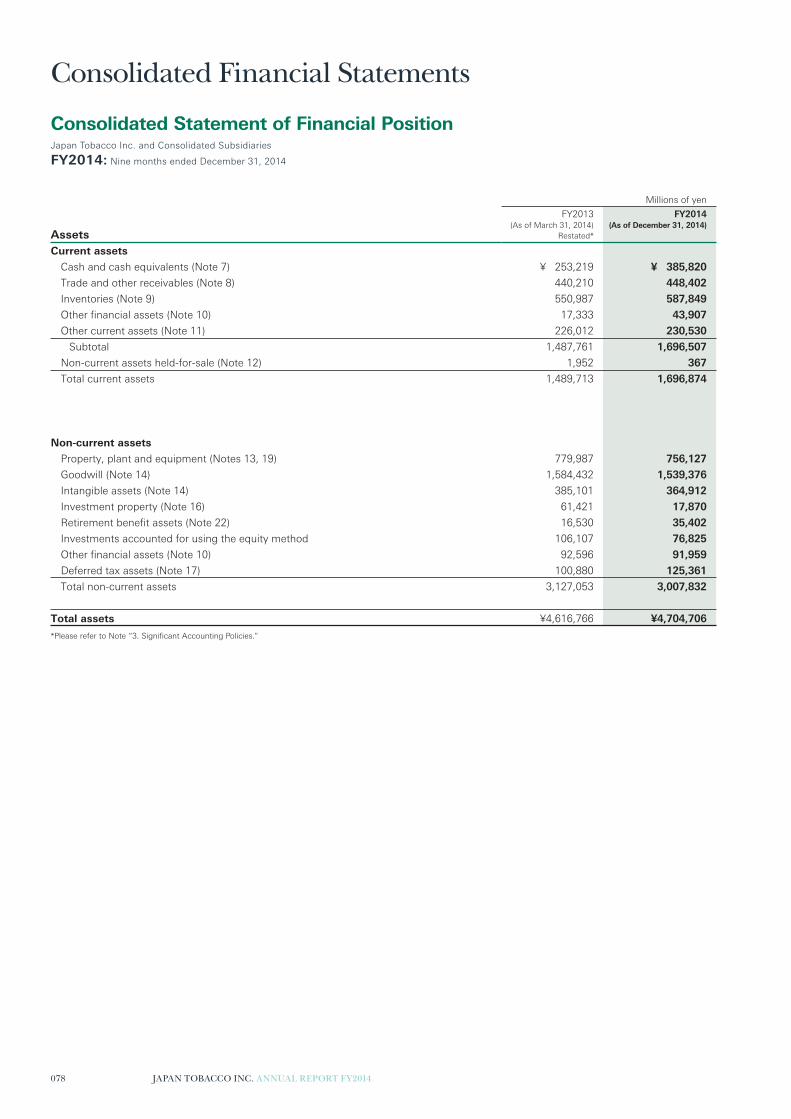
Assets
Millions of yen
FY2013(As of March 31, 2014)
Restated*
FY2014(As of December 31, 2014)
Current assets
Cash and cash equivalents (Note 7) ¥ 253,219 ¥ 385,820
Trade and other receivables (Note 8) 440,210 448,402
Inventories (Note 9) 550,987 587,849
Other financial assets (Note 10) 17,333 43,907
Other current assets (Note 11) 226,012 230,530
Subtotal 1,487,761 1,696,507
Non-current assets held-for-sale (Note 12) 1,952 367
Total current assets 1,489,713 1,696,874
Non-current assets
Property, plant and equipment (Notes 13, 19) 779,987 756,127
Goodwill (Note 14) 1,584,432 1,539,376
Intangible assets (Note 14) 385,101 364,912
Investment property (Note 16) 61,421 17,870
Retirement benefit assets (Note 22) 16,530 35,402
Investments accounted for using the equity method 106,107 76,825
Other financial assets (Note 10) 92,596 91,959
Deferred tax assets (Note 17) 100,880 125,361
Total non-current assets 3,127,053 3,007,832
Total assets ¥4,616,766 ¥4,704,706
*Please refer to Note “3. Significant Accounting Policies.”
Consolidated Financial Statements
Consolidated Statement of Financial Position Japan Tobacco Inc. and Consolidated Subsidiaries
FY2014: Nine months ended December 31, 2014
078 JAPAN TOBACCO INC. ANNUAL REPORT FY2014

Liabilities and equity
Millions of yen
FY2013(As of March 31, 2014)
Restated*
FY2014(As of December 31, 2014)
Liabilities
Current liabilities
Trade and other payables (Note 18) ¥ 360,025 ¥ 419,764
Bonds and borrowings (Note 19) 195,562 107,562
Income tax payables 77,158 54,942
Other financial liabilities (Note 19) 9,491 14,463
Provisions (Note 20) 7,362 9,200
Other current liabilities (Note 21) 606,161 754,169
Subtotal 1,255,759 1,360,098
Liabilities directly associated with non-current assets held-for-sale (Note 12) 75 —
Total current liabilities 1,255,834 1,360,098
Non-current liabilities
Bonds and borrowings (Note 19) 166,165 101,001
Other financial liabilities (Note 19) 17,731 18,617
Retirement benefit liabilities (Note 22) 340,462 351,915
Provisions (Note 20) 5,241 25,425
Other non-current liabilities (Note 21) 126,539 121,792
Deferred tax liabilities (Note 17) 108,703 103,356
Total non-current liabilities 764,842 722,106
Total liabilities 2,020,675 2,082,204
Equity
Share capital (Note 23) 100,000 100,000
Capital surplus (Note 23) 736,400 736,400
Treasury shares (Note 23) (344,463) (344,447)
Other components of equity (Note 23) 251,107 142,425
Retained earnings 1,762,566 1,902,460
Equity attributable to owners of the parent company 2,505,610 2,536,838
Non-controlling interests 90,481 85,665
Total equity 2,596,091 2,622,503
Total liabilities and equity ¥4,616,766 ¥4,704,706
*Please refer to Note “3. Significant Accounting Policies.”
JAPAN TOBACCO INC. ANNUAL REPORT FY2014 079
FIN
AN
CIA
L S
TA
TE
ME
NTS

Millions of yen
FY2013(Year ended March 31, 2014)
FY2014(Nine months ended December 31, 2014)
Revenue (Notes 6, 25) ¥2,399,841 ¥2,153,970
Cost of sales (Notes 14, 22) (979,975) (886,267)
Gross profit 1,419,866 1,267,703
Other operating income (Note 26) 55,634 47,651
Share of profit in investments accounted for using the equity method 1,702 7,812
Selling, general and administrative expenses (Notes 12, 13, 14, 16, 22, 27, 32) (828,942) (823,410)
Operating profit (Note 6) 648,260 499,757
Financial income (Notes 28, 33) 8,351 13,847
Financial costs (Notes 22, 28, 33) (20,408) (11,304)
Profit before income taxes 636,203 502,299
Income taxes (Note 17) (200,912) (133,673)
Profit for the period ¥ 435,291 ¥ 368,626
Attributable to:
Owners of the parent company ¥ 427,987 ¥ 362,919
Non-controlling interests 7,304 5,708
Profit for the period ¥ 435,291 ¥ 368,626
Earnings per share
Basic (Yen) (Note 30) ¥ 235.48 ¥ 199.67
Diluted (Yen) (Note 30) 235.35 199.56
Reconciliation from “Operating profit” to “Adjusted operating profit”
Millions of yen
FY2013(Year ended March 31, 2014)
FY2014(Nine months ended December 31, 2014)
Operating profit ¥648,260 ¥499,757
Amortization cost of acquired intangibles 25,984 29,465
Adjustment items (income) (47,047) (44,302)
Adjustment items (costs) 14,580 103,641
Adjusted operating profit (Note 6) ¥641,777 ¥588,561
Consolidated Statement of IncomeJapan Tobacco Inc. and Consolidated Subsidiaries
FY2014: Nine months ended December 31, 2014
080 JAPAN TOBACCO INC. ANNUAL REPORT FY2014

Millions of yen
FY2013(Year ended March 31, 2014)
FY2014(Nine months ended December 31, 2014)
Profit for the period ¥435,291 ¥ 368,626
Other comprehensive income
Items that will not be reclassified to profit or loss
Net gain (loss) on revaluation of financial assets measured at fair value
through other comprehensive income (Notes 29, 33) 4,725 3,725
Remeasurements of defined benefit plans (Notes 22, 29) 8,824 (14,164)
Total of items that will not be reclassified to profit or loss 13,549 (10,439)
Items that may be reclassified subsequently to profit or loss
Exchange differences on translation of foreign operations (Note 29) 400,941 (114,242)
Net gain (loss) on derivatives designated as cash flow hedges (Note 29) 481 922
Total of items that may be reclassified subsequently to profit or loss 401,421 (113,319)
Other comprehensive income (loss), net of taxes 414,970 (123,759)
Comprehensive income (loss) for the period ¥850,261 ¥ 244,868
Attributable to:
Owners of the parent company ¥842,867 ¥ 240,363
Non-controlling interests 7,394 4,505
Comprehensive income (loss) for the period ¥850,261 ¥ 244,868
Consolidated Statement of Comprehensive IncomeJapan Tobacco Inc. and Consolidated Subsidiaries
FY2014: Nine months ended December 31, 2014
JAPAN TOBACCO INC. ANNUAL REPORT FY2014 081
FIN
AN
CIA
L S
TA
TE
ME
NTS
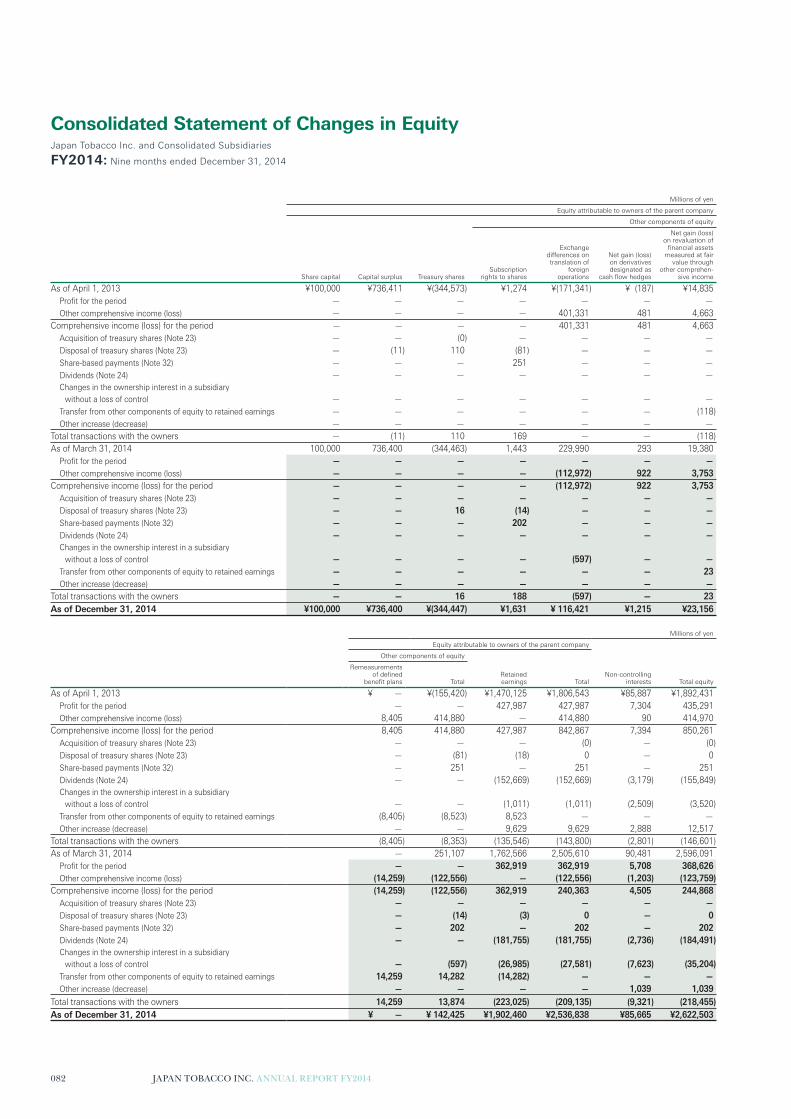
Millions of yen
Equity attributable to owners of the parent company
Other components of equity
Share capital Capital surplus Treasury sharesSubscription
rights to shares
Exchange differences on translation of
foreign operations
Net gain (loss) on derivatives designated as
cash flow hedges
Net gain (loss) on revaluation of
financial assets measured at fair
value through other comprehen-
sive income
As of April 1, 2013 ¥100,000 ¥736,411 ¥(344,573) ¥1,274 ¥(171,341) ¥ (187) ¥14,835
Profit for the period — — — — — — —
Other comprehensive income (loss) — — — — 401,331 481 4,663
Comprehensive income (loss) for the period — — — — 401,331 481 4,663
Acquisition of treasury shares (Note 23) — — (0) — — — —
Disposal of treasury shares (Note 23) — (11) 110 (81) — — —
Share-based payments (Note 32) — — — 251 — — —
Dividends (Note 24) — — — — — — —
Changes in the ownership interest in a subsidiary
without a loss of control — — — — — — —
Transfer from other components of equity to retained earnings — — — — — — (118)
Other increase (decrease) — — — — — — —
Total transactions with the owners — (11) 110 169 — — (118)
As of March 31, 2014 100,000 736,400 (344,463) 1,443 229,990 293 19,380
Profit for the period — — — — — — —Other comprehensive income (loss) — — — — (112,972) 922 3,753
Comprehensive income (loss) for the period — — — — (112,972) 922 3,753Acquisition of treasury shares (Note 23) — — — — — — —Disposal of treasury shares (Note 23) — — 16 (14) — — —Share-based payments (Note 32) — — — 202 — — —Dividends (Note 24) — — — — — — —Changes in the ownership interest in a subsidiary
without a loss of control — — — — (597) — —Transfer from other components of equity to retained earnings — — — — — — 23Other increase (decrease) — — — — — — —
Total transactions with the owners — — 16 188 (597) — 23As of December 31, 2014 ¥100,000 ¥736,400 ¥(344,447) ¥1,631 ¥ 116,421 ¥1,215 ¥23,156
Millions of yen
Equity attributable to owners of the parent company
Other components of equity
Remeasurements of defined
benefit plans TotalRetainedearnings Total
Non-controlling interests Total equity
As of April 1, 2013 ¥ — ¥(155,420) ¥1,470,125 ¥1,806,543 ¥85,887 ¥1,892,431
Profit for the period — — 427,987 427,987 7,304 435,291
Other comprehensive income (loss) 8,405 414,880 — 414,880 90 414,970
Comprehensive income (loss) for the period 8,405 414,880 427,987 842,867 7,394 850,261
Acquisition of treasury shares (Note 23) — — — (0) — (0)
Disposal of treasury shares (Note 23) — (81) (18) 0 — 0
Share-based payments (Note 32) — 251 — 251 — 251
Dividends (Note 24) — — (152,669) (152,669) (3,179) (155,849)
Changes in the ownership interest in a subsidiary
without a loss of control — — (1,011) (1,011) (2,509) (3,520)
Transfer from other components of equity to retained earnings (8,405) (8,523) 8,523 — — —
Other increase (decrease) — — 9,629 9,629 2,888 12,517
Total transactions with the owners (8,405) (8,353) (135,546) (143,800) (2,801) (146,601)
As of March 31, 2014 — 251,107 1,762,566 2,505,610 90,481 2,596,091
Profit for the period — — 362,919 362,919 5,708 368,626Other comprehensive income (loss) (14,259) (122,556) — (122,556) (1,203) (123,759)
Comprehensive income (loss) for the period (14,259) (122,556) 362,919 240,363 4,505 244,868Acquisition of treasury shares (Note 23) — — — — — —Disposal of treasury shares (Note 23) — (14) (3) 0 — 0Share-based payments (Note 32) — 202 — 202 — 202Dividends (Note 24) — — (181,755) (181,755) (2,736) (184,491)Changes in the ownership interest in a subsidiary
without a loss of control — (597) (26,985) (27,581) (7,623) (35,204)Transfer from other components of equity to retained earnings 14,259 14,282 (14,282) — — —Other increase (decrease) — — — — 1,039 1,039
Total transactions with the owners 14,259 13,874 (223,025) (209,135) (9,321) (218,455)As of December 31, 2014 ¥ — ¥ 142,425 ¥1,902,460 ¥2,536,838 ¥85,665 ¥2,622,503
Consolidated Statement of Changes in EquityJapan Tobacco Inc. and Consolidated Subsidiaries
FY2014: Nine months ended December 31, 2014
082 JAPAN TOBACCO INC. ANNUAL REPORT FY2014

Millions of yen
FY2013(Year ended March 31, 2014)
Restated*
FY2014(Nine months ended December 31, 2014)
Cash flows from operating activitiesProfit before income taxes ¥ 636,203 ¥ 502,299Depreciation and amortization 132,921 122,171Impairment losses 2,446 21,877Impairment losses of investments in associates 9,717 —Interest and dividend income (7,933) (13,560)Interest expense 8,612 4,651Share of profit in investments accounted for using the equity method (1,702) (7,812)(Gains) losses on sale and disposal of property, plant and equipment,
intangible assets and investment property (38,800) (31,315)(Increase) decrease in trade and other receivables (13,631) (12,130)(Increase) decrease in inventories (15,530) (16,808)Increase (decrease) in trade and other payables 11,055 83,885Increase (decrease) in retirement benefit liabilities (17,661) (25,736)(Increase) decrease in prepaid tobacco excise taxes (14,274) (23,963)Increase (decrease) in tobacco excise tax payables (103,515) 103,651Increase (decrease) in consumption tax payables (5,148) 37,550Other (2,013) (37,055)
Subtotal 580,748 707,703Interest and dividends received 9,514 22,569Interest paid (8,469) (7,050)Income taxes paid (185,298) (179,526)Net cash flows from operating activities 396,496 543,696
Cash flows from investing activitiesPurchase of securities (8,880) (3,280)Proceeds from sale and redemption of securities 23,716 4,769Purchase of property, plant and equipment (132,256) (106,655)
Proceeds from sale of investment property 56,159 85,653Purchase of intangible assets (18,263) (7,749)Payments into time deposits (798) (852)Proceeds from withdrawal of time deposits 4,744 778Purchase of investments in subsidiaries — (20,977)Purchase of investments in associates (74,801) —Other (13,095) (800)Net cash flows from investing activities (163,473) (49,110)
Cash flows from financing activitiesDividends paid to owners of the parent company (Note 24) (152,570) (181,635)Dividends paid to non-controlling interests (3,195) (2,663)Capital contribution from non-controlling interests 59 44Increase (decrease) in short-term borrowings and commercial paper (8,936) 6,373Proceeds from long-term borrowings 70 —Repayments of long-term borrowings (20,558) (1,225)Proceeds from issuance of bonds 49,395 —Redemption of bonds — (170,670)Repayments of finance lease obligations (4,992) (3,837)Acquisition of treasury shares (0) —Payments for acquisition of interests in subsidiaries from non-controlling interests (4,462) (35,246)Other 0 0Net cash flows from financing activities (145,189) (388,859)
Net increase (decrease) in cash and cash equivalents 87,834 105,727Cash and cash equivalents at the beginning of the period 142,713 253,219Effect of exchange rate changes on cash and cash equivalents 22,672 26,874Cash and cash equivalents at the end of the period (Note 7) ¥ 253,219 ¥ 385,820
*Please refer to Note “3. Significant Accounting Policies.”
Consolidated Statement of Cash FlowsJapan Tobacco Inc. and Consolidated Subsidiaries
FY2014: Nine months ended December 31, 2014
JAPAN TOBACCO INC. ANNUAL REPORT FY2014 083
FIN
AN
CIA
L S
TA
TE
ME
NTS
1. Reporting Entity
Japan Tobacco Inc. (hereinafter referred to as the “Company”) is
a joint stock corporation under the Companies Act of Japan, pur-
suant to the Japan Tobacco Inc. Act, with its principal places of
business located in Japan since its incorporation. The addresses
of the Company’s registered head office and principal business
offices are available on the Company’s website (http://www.jti.
co.jp).
The details of businesses and principal business activities of
the Company and its subsidiaries (hereinafter referred to as the
“Group”) are stated in “6. Operating Segments.”
The Group’s consolidated financial statements for the nine
months ended December 31, 2014, were approved on March 20,
2015 by Mitsuomi Koizumi, President and Chief Executive Officer.
2. Basis of Preparation
(1) Compliance with IFRSThe Group’s consolidated financial statements are prepared in
accordance with International Financial Reporting Standards
(hereinafter referred to as “IFRS”).
(2) Basis of MeasurementExcept for the financial instruments, stated in “3. Significant
Accounting Policies,” the Group’s consolidated financial state-
ments are prepared on the historical cost basis.
(3) Functional Currency and Presentation Currency
The Group’s consolidated financial statements are presented in
Japanese yen, which is the functional currency of the Company.
The units are in millions of yen, and figures less than one million
yen are rounded to the nearest million yen.
(4) Early Adoption of New Accounting StandardsThe Group has early adopted IFRS 9 “Financial Instruments”
(revised in October 2010) (hereinafter referred to as “IFRS 9”) from
April 1, 2011.
IFRS 9 replaces IAS 39 “Financial Instruments: Recognition
and Measurement” (hereinafter referred to as “IAS 39”) and pro-
vides two measurement categories for financial instruments:
amortized cost and fair value. Changes in fair value of financial
assets measured at fair value are recognized in profit or loss.
However, changes in fair value of investments in equity instru-
ments, except for equity instruments held for trading purposes,
are allowed to be recognized in other comprehensive income.
(5) Change of Fiscal Year EndIn this fiscal year, the Company and its subsidiaries with fiscal
year ends other than December 31 have changed their fiscal year
ends to December 31 for the purpose of unifying the fiscal year
end with overseas consolidated subsidiaries of the Group, which
will enhance and improve the efficiency of the closing and
management systems.
As a consequence of this change of fiscal year end, fiscal year
2014 was a nine-month period from April 1, 2014 to December
31, 2014.
In addition, the fiscal year end date of JT International Holding
B.V. and its subsidiaries which operate the Group’s international
tobacco business, continues to be December 31 as before, hence
the Group consolidates financial results of the JTIH Group for the
twelve-month period from January 1, 2014 to December 31, 2014
into the Group’s consolidated financial results for the nine months
ended December 31, 2014.
For the consolidated statement of income assuming that the
fiscal year of the Group had been the twelve-month period from
January 1, 2014 to December 31, 2014, please refer to Note “39.
Consolidated Statement of Income (2014 January—December)”.
Notes to Consolidated Financial StatementsJapan Tobacco Inc. and Consolidated Subsidiaries
FY2014: Nine months ended December 31, 2014 / FY2013: Year ended March 31, 2014
084 JAPAN TOBACCO INC. ANNUAL REPORT FY2014

3. Significant Accounting Policies
(1) Basis of ConsolidationThe consolidated financial statements include financial statements
of the Company and its subsidiaries, and interests in investments
in associates and joint arrangements.
A. Subsidiaries
A subsidiary is an entity that is controlled by the Group and the
Group has control over the entity if it is exposed, or has rights, to
variable returns from its involvement with the investee and has the
ability to affect those returns through its power over the investee.
The acquisition date of a subsidiary is the date on which the
Group obtains control of the subsidiary, and the subsidiary is
included in the consolidation from the date of acquisition until
the date on which the Group loses control.
In cases where the accounting policies applied by a subsidiary
are different from those applied by the Group, adjustments are
made to the subsidiary’s financial statements, if necessary.
All intergroup balances, transactions, income and expenses
are eliminated on consolidation.
Comprehensive income for subsidiaries is attributed to owners
of the parent company and non-controlling interests even if this
results in the non-controlling interests having a deficit balance.
B. Associates
An associate is an entity over which the Group has significant
influence. The Group has significant influence over the entity if
it has the power to participate in the financial and operating
policy decisions of the investee but it does not have control or
joint control over the investee. Investments in associates are
accounted for using the equity method from the date on which
the Group has the significant influence until the date on which it
ceases to have the significant influence.
C. Joint Arrangements
A joint arrangement is a contractual arrangement of which two
or more parties have joint control. Depending upon the rights and
obligations of the parties to the arrangement, the Group classifies
a joint arrangement into a joint operation whereby the Group has
rights to the assets and obligations for the liabilities relating to the
arrangement, and a joint venture whereby the Group has rights
to the net assets of the arrangement only. The Group recognizes
the assets, liabilities, revenues and expenses relating to its interest
in a joint operation while a joint venture is accounted for using the
equity method.
(2) Business CombinationBusiness combinations are accounted for using the acquisition
method. Consideration transferred in a business combination is
measured as the sum of the acquisition-date fair value of the
assets transferred, the liabilities assumed and equity instruments
issued by the Company in exchange for control over an acquiree.
Any excess of the consideration of acquisition over the fair value
of identifiable assets and liabilities is recognized as goodwill in the
consolidated statement of financial position. If the consideration
of acquisition is lower than the fair value of the identifiable assets
and liabilities, the difference is immediately recognized as profit
in the consolidated statement of income. If the amount of initial
accounting for a business combination is not determined by the
end of the reporting period in which the combination occurs, the
provisional amounts for the items for which the accounting is
incomplete are reported and are adjusted during the measurement
period, which is one year from the acquisition date. Acquisition-
related costs incurred are recognized as expenses. The additional
acquisition of non-controlling interests after obtaining control is
accounted for as a capital transaction. Any difference between the
amount by which the non-controlling interests are adjusted and
the fair value of the consideration paid or received is recognized
directly in retained earnings and no goodwill is recognized with
respect to such transaction.
(3) Foreign Currency TranslationConsolidated financial statements of the Group are presented in
Japanese yen, which is the functional currency of the Company.
Each company in the Group specifies its own functional currency
and measures transactions based on it.
Foreign currency transactions are translated into the functional
currency at the rates of exchange prevailing at the dates of trans-
actions or an approximation of the rate. Monetary assets and
liabilities denominated in foreign currencies are translated into
the functional currency at the rates of exchange prevailing at the
fiscal year end date. Differences arising from the translation and
settlement are recognized as profit or loss. However, exchange
differences arising from the translation of financial instruments
designated as hedging instruments for net investment in foreign
operations (foreign subsidiaries), financial assets measured at fair
value through other comprehensive income, and cash flow
hedges are recognized as other comprehensive income.
The assets and liabilities of foreign operations are translated
into Japanese yen at the rates of exchange prevailing at the fiscal
year end date, while income and expenses of foreign operations
are translated into Japanese yen at the rates of exchange prevail-
ing at the dates of transactions or an approximation to the rate.
The resulting translation differences are recognized as other com-
prehensive income. In cases where foreign operations are dis-
posed of, the cumulative amount of translation differences related
to the foreign operations is recognized as profit or loss in the
period of disposition.
JAPAN TOBACCO INC. ANNUAL REPORT FY2014 085
FIN
AN
CIA
L S
TA
TE
ME
NTS

(4) Financial InstrumentsA. Financial Assets
(i) Initial Recognition and Measurement
Financial assets are classified into financial assets measured at
fair value through profit or loss, fair value through other compre-
hensive income, and amortized cost. The Group determines the
classification at initial recognition.
Financial assets are classified as financial assets measured
at amortized cost if both of the following conditions are met.
Otherwise, they are classified as financial assets measured at
fair value.
• The asset is held within a business model whose objective is to
hold assets in order to collect contractual cash flows
• The contractual terms of the financial asset give rise on specified
dates to cash flows that are solely payments of principal and
interest on the principal amount outstanding
For financial assets measured at fair value, each equity instru-
ment is designated as measured at fair value through profit or loss
or as measured at fair value through other comprehensive income,
except for equity instruments held for trading purposes that must
be measured at fair value through profit or loss. Such designa-
tions are applied consistently.
All financial assets are measured at fair value plus transaction
costs that are attributable to the financial assets, except for the
case of being classified in the category of financial assets
measured at fair value through profit or loss.
(ii) Subsequent Measurement
After initial recognition, financial assets are measured based
on the classification as follows:
(a) Financial Assets Measured at Amortized Cost
Financial assets measured at amortized cost are measured at
amortized cost using the effective interest method.
(b) Other Financial Assets
Financial assets other than those measured at amortized cost are
measured at fair value.
Changes in the fair value of financial assets measured at fair
value are recognized as profit or loss.
However, changes in the fair value of equity instruments
designated as measured at fair value through other comprehen-
sive income are recognized as other comprehensive income and
the amount in other comprehensive income is transferred to
retained earnings when equity instruments are derecognized or
the decline in its fair value compared to its acquisition cost is
significant. Dividends on the financial assets are recognized in
profit or loss for the year.
(iii) Derecognition
Financial assets are derecognized when the rights to receive
benefits from them expire or are transferred, or when substantially
all the risks and rewards of the ownership are transferred.
B. Impairment of Financial Assets
In accordance with IAS 39, the Group assesses at the end of
each reporting period whether there is any objective evidence
that financial assets measured at amortized cost are impaired.
Evidence of impairment includes significant financial difficulty of
the borrower or a group of borrowers, a default or delinquency
in interest or principal payments, and bankruptcy of the borrower.
The Group assesses whether objective evidence of impairment
exists individually for financial assets that are individually signifi-
cant and collectively for financial assets that are not individually
significant.
If there is objective evidence that impairment losses on finan-
cial assets measured at amortized cost have been incurred, the
amount of the loss is measured as the difference between the
asset’s carrying amount and the present value of estimated future
cash flows.
When impairment is recognized, the carrying amount of the
financial asset is reduced by an allowance for doubtful accounts
and impairment losses are recognized in profit or loss. The carry-
ing amount of financial assets measured at amortized cost is
directly reduced for the impairment when they are expected to
become uncollectible in the future and all collaterals are imple-
mented or transferred to the Group. If, in a subsequent period,
the amount of the impairment loss provided changes due to
an event occurring after the impairment was recognized, the
previously recognized impairment losses are adjusted through
the allowance for doubtful accounts.
C. Financial Liabilities
(i) Initial Recognition and Measurement
Financial liabilities are classified into financial liabilities measured
at fair value through profit or loss and financial liabilities measured
at amortized cost. The Group determines the classification at initial
recognition.
All financial liabilities are measured at fair value at initial recog-
nition. However, financial liabilities measured at amortized cost
are measured at cost after deducting transaction costs that are
directly attributable to the financial liabilities.
(ii) Subsequent Measurement
After initial recognition, financial liabilities are measured based on
the classification as follows:
(a) Financial Liabilities Measured at Fair Value through Profit
or Loss
Financial liabilities measured at fair value through profit or loss
include financial liabilities held for trading and financial liabilities
designated as measured at fair value through profit or loss at
initial recognition.
(b) Financial Liabilities Measured at Amortized Cost
After initial recognition, financial liabilities measured at amortized
cost are measured at amortized cost using the effective interest
method. Amortization under the effective interest method and
086 JAPAN TOBACCO INC. ANNUAL REPORT FY2014

gains or losses on derecognition are recognized as profit or loss
in the consolidated statement of income.
After initial recognition, financial guarantee contracts are
measured at the higher of:
• The best estimate of expenditure required to settle the obligation
as of the end of the fiscal year, and
• The amount initially recognized less cumulative amortization.
(iii) Derecognition
Financial liabilities are derecognized when the obligation is
discharged, canceled or expired.
D. Offsetting of Financial Instruments
Financial assets and financial liabilities are offset and presented as
a net amount in the consolidated statement of financial position
only when there is a legally enforceable right to set off the recog-
nized amounts and the Group intends either to settle on a net
basis or to realize the asset and settle the liability simultaneously.
E. Derivatives and Hedge Accounting
The Group utilizes derivatives, including forward foreign exchange
contracts and interest rate swap contracts, to hedge foreign
exchange and interest rate risks. These derivatives are initially
measured at fair value when the contract is entered into, and are
subsequently remeasured at fair value. Changes in the fair value
of derivatives are recognized as profit or loss in the consolidated
statement of income. However, the gains or losses on the hedging
instrument relating to the effective portion of cash flow hedges
and hedges of net investment in foreign operations are recognized
as other comprehensive income in the consolidated statement of
comprehensive income.
At the inception of the hedge, the Group formally designates
and documents the hedging relationship to which hedge account-
ing is applied and the objectives and strategies of risk manage-
ment for undertaking the hedge. The documentation includes
identification of hedging instruments, the hedged items or trans-
actions, the nature of the risks being hedged and how the hedg-
ing instrument’s effectiveness is assessed in offsetting the
exposure to changes in the hedged item’s fair value or cash flows
attributable to the hedged risks. Even though these hedges are
expected to be highly effective in offsetting changes in fair value
or cash flows, they are assessed on an ongoing basis and deter-
mined actually to have been highly effective throughout the finan-
cial reporting periods for which the hedges were designated.
Hedges that meet the stringent requirements for hedge
accounting are classified in the following categories and
accounted for in accordance with IAS 39.
(i) Fair Value Hedge
Changes in the fair value of derivatives are recognized as profit
or loss in the consolidated statement of income. Regarding
changes in the fair value of hedged items attributable to the
hedged risks, the carrying amount of the hedged item is adjusted
and the change is recognized as profit or loss in the consolidated
statement of income.
(ii) Cash Flow Hedge
The effective portion of gains or losses on hedging instruments is
recognized as other comprehensive income in the consolidated
statement of comprehensive income, while the ineffective portion
is recognized immediately as profit or loss in the consolidated
statement of income.
The amounts of hedging instruments recognized in other
comprehensive income are reclassified to profit or loss when the
transactions of the hedged items affect profit or loss. In cases
where hedged items result in the recognition of non-financial
assets or liabilities, the amounts recognized as other comprehen-
sive income are accounted for as adjustments to the original
carrying amount of non-financial assets or liabilities.
When forecast transactions or firm commitments are no longer
expected to occur, any related cumulative gain or loss that has
been recognized in equity as other comprehensive income is reclas-
sified to profit or loss. When hedging instruments expire, are sold,
terminated or exercised without the replacement or rollover of other
hedging instruments, or when the hedge designation is revoked,
amounts that have been recognized in other comprehensive
income are continued to be recognized in other comprehensive
income until the forecast transactions or firm commitments occur.
(iii) Hedge of Net Investment in Foreign Operations
Translation differences resulting from the hedge of net investment
in foreign operations are accounted for similarly to a cash flow
hedge. The effective portion of gains or losses on hedging instru-
ments is recognized as other comprehensive income in the
consolidated statement of comprehensive income, while the inef-
fective portion is recognized as profit or loss in the consolidated
statement of income. At the time of the disposal of the foreign
operations, any related cumulative gain or loss that has been
recognized in equity as other comprehensive income is reclassi-
fied to profit or loss.
F. Fair Value of Financial Instruments
Fair value of financial instruments that are traded in active finan-
cial markets at the fiscal year end refers to quoted prices or dealer
quotations.
If there is no active market, fair value of financial instruments is
determined using appropriate valuation models.
(5) Cash and Cash EquivalentsCash and cash equivalents consist of cash on hand, demand
deposits, and short-term investments that are readily convertible to
known amounts of cash and subject to insignificant risk of change
in value and due within three months from the date of acquisition.
JAPAN TOBACCO INC. ANNUAL REPORT FY2014 087
FIN
AN
CIA
L S
TA
TE
ME
NTS

(6) InventoriesThe cost of inventories includes all costs of purchase, costs of
conversion and other costs incurred in bringing the inventories to
their present location and condition.
Inventories are measured at the lower of cost or net realizable
value, and the costs are determined by using the weighted-average
method. Net realizable value is determined as the estimated selling
price in the ordinary course of business less the estimated costs of
completion and estimated costs necessary to make the sale.
Leaf tobacco which is stored for more than 12 months before
being used for production is included in current assets since it is
held within the normal operating cycle.
(7) Property, Plant and EquipmentProperty, plant, and equipment is measured by using the cost
model and is stated at cost less accumulated depreciation and
accumulated impairment losses.
The acquisition cost includes any costs directly attributable to
the acquisition of the asset and dismantlement, removal and resto-
ration costs, as well as borrowing costs eligible for capitalization.
Except for assets that are not subject to depreciation such as
land, assets are depreciated using the straight-line method over
their estimated useful lives. The estimated useful lives of major
asset items are as follows:
• Buildings and structures: 38 to 50 years
• Machinery and vehicles: 10 to 15 years
The estimated useful lives and depreciation method are
reviewed at each fiscal year end and if there are any changes
made to the estimated useful lives and depreciation method,
such changes are applied prospectively as changes in estimate.
(8) Goodwill and Intangible AssetsA. Goodwill
Goodwill is stated at acquisition cost less accumulated impair-
ment losses.
Goodwill is not amortized. It is allocated to cash-generating
units that are identified according to locations and types of busi-
nesses and tested for impairment annually or whenever there
is any indication of impairment. Impairment losses on goodwill
are recognized in the consolidated statement of income and no
subsequent reversal is made.
B. Intangible Assets
Intangible assets are measured by using the cost model and are
stated at cost less accumulated amortization and accumulated
impairment losses.
Intangible assets acquired separately are measured at cost at
the initial recognition, and the costs of intangible assets acquired
through business combinations are recognized at fair value at the
acquisition date. Expenditures on internally generated intangible
assets are recognized as expense in the period when incurred,
except for development expenses that satisfy the capitalization
criteria.
Intangible assets with finite useful lives are amortized using
the straight-line method over their estimated useful lives and are
tested for impairment whenever there is any indication of impair-
ment. The estimated useful lives and amortization method of
intangible assets with finite useful lives are reviewed at each fiscal
year end, and the effect of any changes in estimate would be
accounted for on a prospective basis.
The estimated useful lives of major intangible assets with finite
useful lives are as follows:
• Trademarks: 20 years
• Software: 5 years
Intangible assets with indefinite useful lives and intangible
assets that are not ready to use are not amortized, but they are
tested for impairment individually or by cash-generating unit
annually or whenever there is any indication of impairment.
(9) LeasesLeases are classified as finance leases whenever substantially all
the risks and rewards incidental to ownership are transferred to
the Group. All other leases are classified as operating leases.
In finance lease transactions, leased assets and lease obliga-
tions are recognized in the consolidated statement of financial
position at the lower of the fair value of the leased property or the
present value of the minimum lease payments, each determined
at the inception of the lease. Lease payments are apportioned
between the financial cost and the reduction of the lease obliga-
tions based on the effective interest method. Financial costs are
recognized in the consolidated statement of income. Leased
assets are depreciated using the straight-line method over their
estimated useful lives or lease terms, whichever is shorter.
In operating lease transactions, lease payments are recognized
as an expense using the straight-line method over the lease terms
in the consolidated statement of income. Contingent rents are
recognized as an expense in the period when they are incurred.
Determining whether an arrangement is, or contains, a lease is
based on the substance of the arrangement in accordance with
IFRIC 4 “Determining Whether an Arrangement Contains a Lease,”
even if the arrangement does not take the legal form of a lease.
(10) Investment PropertyInvestment property is property held to earn rentals or for capital
appreciation or both.
Investment property is measured by using the cost model and
is stated at cost less accumulated depreciation and accumulated
impairment losses.
088 JAPAN TOBACCO INC. ANNUAL REPORT FY2014

(11) Impairment of Non-financial AssetsThe Group assesses for each fiscal year whether there is any
indication that an asset may be impaired. If any such indication
exists, or in cases where the impairment test is required to be
performed each year, the recoverable amount of the asset is esti-
mated. In cases that the recoverable amount cannot be estimated
for each asset, it is estimated by the cash-generating unit to
which the asset belongs. The recoverable amount of an asset or
a cash-generating unit is determined at the higher of its fair value
less costs of disposal or its value in use. If the carrying amount of
the asset or cash-generating unit exceeds the recoverable amount,
impairment losses are recognized and the carrying amount is
reduced to the recoverable amount. In determining the value in
use, estimated future cash flows are discounted to the present
value, using pretax discount rates that reflect current market
assessments of the time value of money and the risks specific to
the asset. In determining the fair value less costs of disposal, the
Group uses an appropriate valuation model supported by available
fair value indicators.
The Group assesses whether there is any indication that an
impairment loss recognized in prior years for an asset other than
goodwill may no longer exist or may have decreased, such as any
changes in assumptions used for the determination of the recover-
able amount. If any such indication exists, the recoverable amount
of the asset or cash-generating unit is estimated. In cases that the
recoverable amount exceeds the carrying amount of the asset or
cash-generating unit, impairment losses are reversed up to the
lower of the estimated recoverable amount or the carrying amount
(net of depreciation) that would have been determined if no
impairment losses had been recognized in prior years.
(12) Non-current Assets Held-for-SaleAn asset or asset group for which the value is expected to be
recovered through a sales transaction rather than through continu-
ing use is classified into a non-current asset or disposal group
held-for-sale when the following conditions are met: it is highly
probable that the asset or asset group will be sold within one year,
the asset or asset group is available for immediate sale in its pres-
ent condition, and the Group management commits to the sale
plan. In such cases, the non-current asset is not depreciated or
amortized and is measured at the lower of its carrying amount
or its fair value less costs of disposal.
(13) Post-employment BenefitsThe Group sponsors defined benefit plans and defined contribu-
tion plans as employee retirement benefit plans.
The Company is obligated to bear pension expenses for a
mutual assistance association incurred with respect to services in
or before June 1956 (prior to the enforcement of the Act on the
Mutual Aid Association of Public Corporation Employees). Such
obligations are calculated and included in liabilities related to the
retirement benefits.
For each plan, the Group calculates the present value of
defined benefit obligations, related current service cost and past
service cost using the projected unit credit method. For a discount
rate, a discount period is determined based on the period until
the expected date of benefit payment in each fiscal year, and the
discount rate is determined by reference to market yields for the
period corresponding to the discount period at the end of the
fiscal year on high quality corporate bonds or government bonds.
Liabilities or assets for defined benefit plans are calculated by the
present value of the defined benefit obligation, deducting the fair
value of any plan assets (including adjustments for the asset
ceiling for defined benefit plan and minimum funding require-
ments, if necessary). Expected interest costs and interest income
are recognized as financial costs.
Remeasurements of defined benefit plans are recognized in
full as other comprehensive income in the period when they are
incurred and transferred to retained earnings immediately. Past
service costs are recognized as profit or loss in the period when
incurred.
The cost for retirement benefits for defined contribution plans
is recognized as an expense at the time of contribution.
(14) Share-based PaymentsThe Company has a share option plan as an equity-settled share-
based payment plan. Share options are estimated at fair value
at grant date and are recognized as an expense over the vesting
period in the consolidated statement of income after considering
the number of share options that are expected to be eventually
vested. The corresponding amount is recognized as an increase
in equity in the consolidated statement of financial position.
(15) ProvisionsThe Group has present obligations (legal or constructive) resulting
from past events and recognizes provisions when it is probable
that the obligations are required to be settled and the amount of
the obligations can be estimated reliably.
Where the effect of the time value of money is material, the
amount of provisions is measured at the present value of the
expenditures expected to be required to settle the obligations. In
calculating the present value, the Group uses the pretax discount
rate reflecting current market assessments of the time value of
money and the risks specific to the liability.
In accordance with IAS 37 “Provisions, Contingent Liabilities
and Contingent Assets,” the Group recognizes a provision for
restructuring when it has a detailed formal plan for the restructur-
ing and has raised a valid expectation in those affected that it will
carry out the restructuring by starting to implement that plan or
announcing its main scheme to those affected by it. Restructuring
provisions include only the direct expenditures arising from the
restructuring, which meet both of the following criteria:
• necessarily entailed by the restructuring;
• not associated with the ongoing activities of the entity.
JAPAN TOBACCO INC. ANNUAL REPORT FY2014 089
FIN
AN
CIA
L S
TA
TE
ME
NTS

(16) RevenueA. Sale of Goods
The Group mainly engages in the sale of tobacco products, pre-
scription drugs, beverages and processed foods. Revenue from
the sale of these goods is recognized when the significant risks
and rewards of ownership of the goods transfer to the buyers,
the Group retains neither continuing managerial involvement nor
effective control over the goods sold, it is probable that the future
economic benefits will flow to the Group, and the amount of
revenue and the corresponding costs can be measured reliably.
Therefore, revenue is usually recognized at the time of delivery
of goods to customers. In addition, revenue is recognized at fair
value of the consideration received or receivable less discounts,
rebates and taxes, including consumption taxes.
Since the amount of turnover where the Group is involved as an
agency, including tobacco excise taxes, is deducted from revenue,
the Group recognizes only the economic benefit inflow, excluding
such amount as revenue in the consolidated statement of income.
B. Interest Income
Interest income is recognized using the effective interest rate
method.
C. Dividend Income
Dividend income is recognized when the shareholder’s right to
receive payment is established.
D. Royalties
Royalties are recognized on an accrual basis in accordance with
the substance of the relevant agreement.
(17) Government GrantsGovernment grants are recognized at fair value when there is a
reasonable assurance that the Group will comply with the condi-
tions attached to them and receive the grants.
In case that the government grants are related to expense
items, they are recognized in profit or loss on a systematic basis
over the period in which the related costs for which the grants
are intended to compensate are recognized. With regard to gov-
ernment grants for assets, the amount of the grants is deducted
from the acquisition cost of the assets.
(18) Borrowing CostsWith respect to assets that necessarily take a substantial period
of time to get ready for their intended use or sale, the borrowing
costs that are directly attributable to the acquisition, construction
or production of the assets are capitalized as part of the acquisi-
tion cost of the assets. Other borrowing costs are recognized as
an expense in the period when they are incurred.
(19) Income TaxesIncome taxes in the consolidated statement of income are
presented as the total of current income taxes and deferred
income taxes.
Current income taxes are measured at the amount that is
expected to be paid to or refunded from the taxation authorities.
For the calculation of the tax amount, the Group uses the tax rates
and tax laws that have been enacted or substantively enacted by
the end of the fiscal year. The current income taxes are recognized
in profit or loss, except for taxes arising from items that are recog-
nized in other comprehensive income or directly in equity and
taxes arising from business combinations.
Deferred income taxes are calculated based on the temporary
differences between the tax base for assets and liabilities and the
carrying amount at the fiscal year end. Deferred tax assets are
recognized for deductible temporary differences, carryforward of
unused tax credits and unused tax losses to the extent that it is
probable that future taxable profit will be available against which
they can be utilized. Deferred tax liabilities are recognized for
taxable temporary differences.
The deferred tax assets or liabilities are not recognized for the
following temporary differences:
• the initial recognition of goodwill
• the initial recognition of assets or liabilities in transactions that
are not business combinations and at the time of transaction,
affect neither accounting profit nor taxable profit or tax loss
• deductible temporary differences arising from investments in
subsidiaries and associates, and interests in joint venture to the
extent that it is probable that the timing of the reversal of the
temporary difference in the foreseeable future and it is not prob-
able that future taxable profits will be available against which
they can be utilized
• taxable temporary differences arising from investments in sub-
sidiaries and associates, and interests in joint venture to the
extent that the timing of the reversal of the temporary difference
is controlled and that it is probable the temporary difference will
not reverse in the foreseeable future.
Deferred tax assets and liabilities are measured at the tax rates
that are expected to apply to the fiscal year when the asset is
realized or the liability is settled, based on tax rates that have been
enacted or substantively enacted by the fiscal year end.
(20) Treasury SharesTreasury shares are recognized at cost and deducted from equity.
No gain or loss is recognized on the purchase, sale or cancellation
of the treasury shares. Any difference between the carrying
amount and the consideration paid is recognized in capital surplus.
090 JAPAN TOBACCO INC. ANNUAL REPORT FY2014

(21) Earnings per ShareBasic earnings per share are calculated by dividing profit or loss
attributable to ordinary shareholders of the parent company by the
weighted-average number of ordinary shares outstanding during
the year, adjusted by the number of treasury shares. Diluted earn-
ings per share are calculated by adjusting the effects of dilutive
potential ordinary shares.
(22) DividendsDividend distributions to the shareholders of the Company are
recognized as liabilities in the period in which, for year end divi-
dends, the Annual Shareholders’ Meeting approves the distribu-
tion and, for interim dividends, the Board of Directors’ Meeting
approves the distribution.
(23) ContingenciesA. Contingent Liabilities
The Group discloses contingent liabilities in the notes to consoli-
dated financial statements if it has possible obligations at the
fiscal year end, whose existence cannot be confirmed at that date,
or if the obligations do not meet the recognition criteria of a provi-
sion described in “20. Provisions.”
B. Contingent Assets
The Group discloses contingent assets in the notes to consolidated
financial statements if an inflow of future economic benefits to the
Group is probable, but not virtually certain at the fiscal year end.
(24) Adjusted Financial MeasuresThe adjusted financial measures are calculated by adding certain
adjustment items to the non-adjusted financial data or by deduct-
ing the items from the non-adjusted financial data.
The adjustment items are determined by management’s judg-
ment, taking into consideration the nature and frequency of the
income and costs such that they provide effective comparative
information on the Group performance and that they reflect the
way of managing our business appropriately. Adjusted financial
measures are presented in the consolidated statement of income,
“6. Operating Segments” and “30. Earnings per Share.”
The adjusted financial measures are not defined under IFRS and
are not comparable with equivalent indicators for other entities.
(Changes in Accounting Policies)
The Group has adopted the following new accounting standards,
amended standards and new interpretations from the fiscal year
ended December 31, 2014.
IFRS Description of new standards and amendments
IAS 39 Financial
Instruments:
Recognition and
Measurement
Requirements for continuation of
hedge accounting in certain circum-
stances in which there is a change in
counterparty to a hedging instrument
IFRIC 21 Levies Clarifying the accounting for levies
The effect of the above standards on the consolidated financial
statements is immaterial.
Regarding IFRIC 21 mentioned above, the comparative infor-
mation was retrospectively adjusted in accordance with the transi-
tional provisions.
4. Significant Accounting Estimates and Judgments
Preparation of consolidated financial statements of the Group
requires management estimates and assumptions in order to
measure income, expenses, assets and liabilities, and disclose
contingencies as of the fiscal year end date. These estimates and
assumptions are based on the best judgment of management in
light of historical experience and various factors deemed to be
reasonable as of the fiscal year end date. Given their nature,
actual results may differ from those estimates and assumptions.
The estimates and assumptions are continuously reviewed by
management. The effects of a change in estimates and assump-
tions are recognized in the period of the change or the period of
the change and future periods.
Among the above estimates and assumptions, the following
are items that may have a material effect on the amounts recog-
nized in the consolidated financial statements of the Group:
A. Impairment of Property, Plant and Equipment, Goodwill,
Intangible Assets and Investment Properties
With regard to property, plant and equipment, goodwill, intangible
assets and investment properties, if there is any indication that the
recoverable amount declines below the carrying amounts of the
assets, the Group performs an impairment test.
The important indications include significant changes with
adverse effect on the results of past or projected business perfor-
mance, significant changes in the use of acquired assets or in
overall business strategy, and significant deteriorations in industry
trends and economic trends. With regard to goodwill, the impair-
ment test is conducted at least once a year, regardless of any
indication of the impairment, in order to ensure that the recover-
able amount exceeds the carrying amount.
JAPAN TOBACCO INC. ANNUAL REPORT FY2014 091
FIN
AN
CIA
L S
TA
TE
ME
NTS

The impairment test is performed by comparing the carrying
amount and the recoverable amount of assets. If the recoverable
amount declines below the carrying amount, impairment losses
are recognized. The recoverable amount is mainly calculated
based on the discounted cash flow model. Certain assumptions
are made for the useful lives and the future cash flows of the
assets, discount rates and long-term growth rates. These assump-
tions are based on the best estimates and judgments made by
management; however, there’s a possibility that these assump-
tions may be affected by changes in uncertain future economic
conditions, which may have a material impact on the consolidated
financial statements in future periods.
The method for calculating the recoverable amount is
described in “13. Property, Plant and Equipment,” “14. Goodwill
and Intangible Assets” and “16. Investment Property.” With regard
to goodwill, the sensitivity analysis is described in “14. Goodwill
and Intangible Assets.”
B. Post-employment Benefits
The Group has various types of retirement benefit plans, including
defined benefit plans. In addition, the mutual pension benefits
plan of the Company is one of the public pension systems under
the jurisdiction of the government of Japan and the Company is
legally obligated to bear a part of the pension costs of the plan.
The present value of defined benefit obligations on each of
these plans and the related service costs are calculated based on
actuarial assumptions. These actuarial assumptions require esti-
mates and judgments on variables, such as discount rates and
inflation rate.
The Group obtains advice from external pension actuaries with
respect to the appropriateness of these actuarial assumptions
including these variables.
The actuarial assumptions are determined based on the best
estimates and judgments made by management; however, there is
a possibility that these assumptions may be affected by changes
in uncertain future economic conditions, or by the publication
or the amendment of related laws, which may have a material
impact on the consolidated financial statements in future periods.
These actuarial assumptions and related sensitivity analysis are
described in “22. Employee Benefits.”
C. Provisions
The Group recognizes various provisions, including provisions for
asset retirement obligations and restructuring, in the consolidated
statement of financial position.
These provisions are recognized based on the best estimates of
the expenditures required to settle the obligations taking risks and
uncertainty related to the obligations into account as of the fiscal
year end date.
Expenditures required to settle the obligations are calculated
by taking possible results into account comprehensively; however,
they may be affected by the occurrence of unexpected events or
changes in conditions which may have a material impact on the
consolidated financial statements in future periods.
The nature and amount of recognized provisions are described
in “20. Provisions.”
D. Income Taxes
The Group operates business activities around the world, and it
recognizes current tax liabilities and income taxes as the esti-
mated amounts to be paid to the tax authorities, based on the
estimation in accordance with their laws and regulations.
Calculating current tax liabilities and income taxes requires
estimates and judgment on various factors, including the interpre-
tation of tax regulations by taxable entities and the tax authority
in the jurisdiction or the experience of past tax audits.
Therefore, there may be differences between the amount
r ecognized as tax liabilities and income taxes and the amount of
actual tax liabilities and income taxes. These differences may have
a material impact on the consolidated financial statements in
future periods.
In addition, deferred tax assets are recognized to the extent
that it is probable that taxable income will be available against
which deductible temporary differences can be utilized.
In recognizing the deferred tax assets, when judging the pos-
sibility of the future taxable income, we reasonably estimate the
timing and amount of future taxable income based on the busi-
ness plan.
The timing when taxable income arises and the amount of
such income may be affected by changes in uncertain future
economic conditions. Therefore, this may have a material impact
on the consolidated financial statements in future periods.
The content and amount related to income taxes are described
in “17. Income Taxes.”
E. Contingencies
With regard to contingencies, any items that may have a material
impact on business in the future are disclosed in light of all the
available evidence as of the fiscal year end date and by taking into
account the probability of these contingencies and their impact on
financial reporting.
The content of contingencies is described in “37. Contingencies.”
092 JAPAN TOBACCO INC. ANNUAL REPORT FY2014
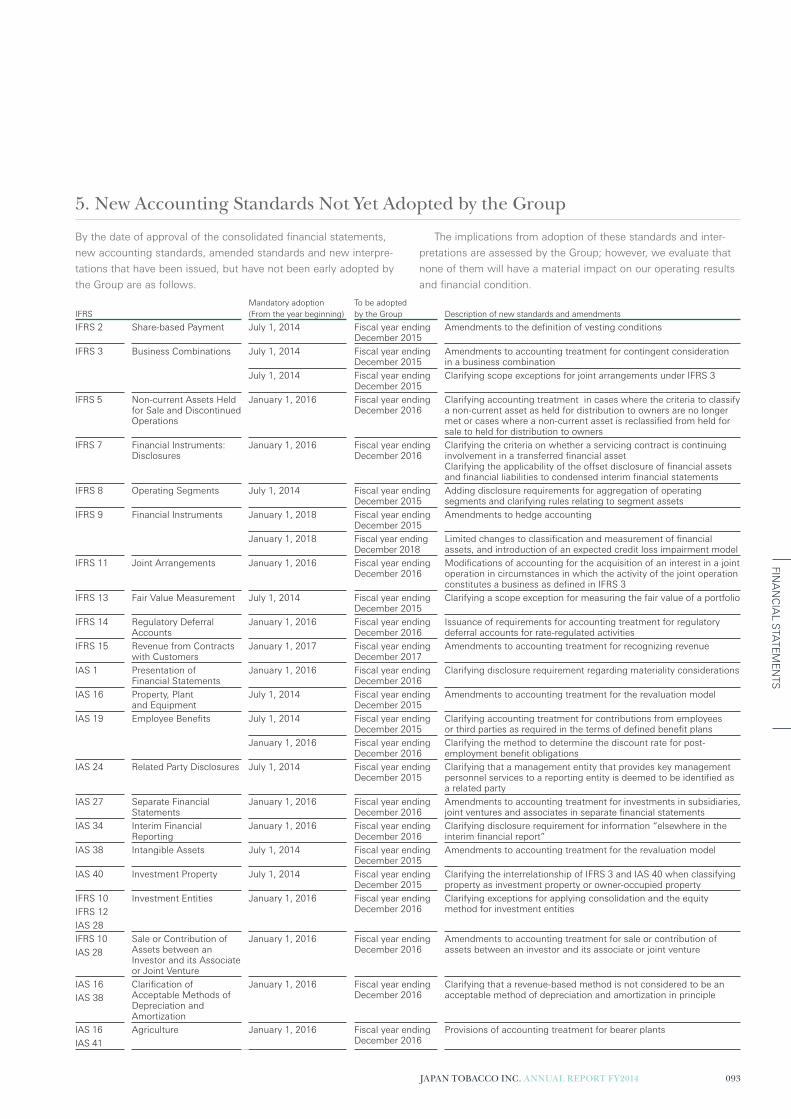
5. New Accounting Standards Not Yet Adopted by the Group
By the date of approval of the consolidated financial statements,
new accounting standards, amended standards and new interpre-
tations that have been issued, but have not been early adopted by
the Group are as follows.
The implications from adoption of these standards and inter-
pretations are assessed by the Group; however, we evaluate that
none of them will have a material impact on our operating results
and financial condition.
IFRS
Mandatory adoption
(From the year beginning)
To be adopted
by the Group Description of new standards and amendments
IFRS 2 Share-based Payment July 1, 2014 Fiscal year ending December 2015
Amendments to the definition of vesting conditions
IFRS 3 Business Combinations July 1, 2014 Fiscal year ending December 2015
Amendments to accounting treatment for contingent consideration in a business combination
July 1, 2014 Fiscal year ending December 2015
Clarifying scope exceptions for joint arrangements under IFRS 3
IFRS 5 Non-current Assets Held for Sale and Discontinued Operations
January 1, 2016 Fiscal year ending December 2016
Clarifying accounting treatment in cases where the criteria to classify a non-current asset as held for distribution to owners are no longer met or cases where a non-current asset is reclassified from held for sale to held for distribution to owners
IFRS 7 Financial Instruments: Disclosures
January 1, 2016 Fiscal year ending December 2016
Clarifying the criteria on whether a servicing contract is continuing involvement in a transferred financial assetClarifying the applicability of the offset disclosure of financial assets and financial liabilities to condensed interim financial statements
IFRS 8 Operating Segments July 1, 2014 Fiscal year ending December 2015
Adding disclosure requirements for aggregation of operating segments and clarifying rules relating to segment assets
IFRS 9 Financial Instruments January 1, 2018 Fiscal year ending December 2015
Amendments to hedge accounting
January 1, 2018 Fiscal year ending December 2018
Limited changes to classification and measurement of financial assets, and introduction of an expected credit loss impairment model
IFRS 11 Joint Arrangements January 1, 2016 Fiscal year ending December 2016
Modifications of accounting for the acquisition of an interest in a joint operation in circumstances in which the activity of the joint operation constitutes a business as defined in IFRS 3
IFRS 13 Fair Value Measurement July 1, 2014 Fiscal year ending December 2015
Clarifying a scope exception for measuring the fair value of a portfolio
IFRS 14 Regulatory Deferral Accounts
January 1, 2016 Fiscal year ending December 2016
Issuance of requirements for accounting treatment for regulatory deferral accounts for rate-regulated activities
IFRS 15 Revenue from Contracts with Customers
January 1, 2017 Fiscal year endingDecember 2017
Amendments to accounting treatment for recognizing revenue
IAS 1 Presentation of Financial Statements
January 1, 2016 Fiscal year ending December 2016
Clarifying disclosure requirement regarding materiality considerations
IAS 16 Property, Plant and Equipment
July 1, 2014 Fiscal year endingDecember 2015
Amendments to accounting treatment for the revaluation model
IAS 19 Employee Benefits July 1, 2014 Fiscal year ending December 2015
Clarifying accounting treatment for contributions from employees or third parties as required in the terms of defined benefit plans
January 1, 2016 Fiscal year ending December 2016
Clarifying the method to determine the discount rate for post- employment benefit obligations
IAS 24 Related Party Disclosures July 1, 2014 Fiscal year ending December 2015
Clarifying that a management entity that provides key management personnel services to a reporting entity is deemed to be identified as a related party
IAS 27 Separate Financial Statements
January 1, 2016 Fiscal year ending December 2016
Amendments to accounting treatment for investments in subsidiaries, joint ventures and associates in separate financial statements
IAS 34 Interim Financial Reporting
January 1, 2016 Fiscal year ending December 2016
Clarifying disclosure requirement for information “elsewhere in the interim financial report”
IAS 38 Intangible Assets July 1, 2014 Fiscal year ending December 2015
Amendments to accounting treatment for the revaluation model
IAS 40 Investment Property July 1, 2014 Fiscal year ending December 2015
Clarifying the interrelationship of IFRS 3 and IAS 40 when classifying property as investment property or owner-occupied property
IFRS 10 Investment Entities January 1, 2016 Fiscal year ending December 2016
Clarifying exceptions for applying consolidation and the equity method for investment entitiesIFRS 12
IAS 28
IFRS 10 Sale or Contribution of Assets between an Investor and its Associate or Joint Venture
January 1, 2016 Fiscal year ending December 2016
Amendments to accounting treatment for sale or contribution of assets between an investor and its associate or joint ventureIAS 28
IAS 16 Clarification of Acceptable Methods of Depreciation and Amortization
January 1, 2016 Fiscal year ending December 2016
Clarifying that a revenue-based method is not considered to be an acceptable method of depreciation and amortization in principleIAS 38
IAS 16 Agriculture January 1, 2016 Fiscal year ending December 2016
Provisions of accounting treatment for bearer plants
IAS 41
JAPAN TOBACCO INC. ANNUAL REPORT FY2014 093
FIN
AN
CIA
L S
TA
TE
ME
NTS

6. Operating Segments
(1) Outline of Reportable SegmentsThe reportable segments of the Group are determined based on
the operating segments that are components of the Group about
which separate financial information is available and are evaluated
regularly by the Board of Directors in deciding how to allocate
resources and in assessing performance.
The Group is mainly engaged in the manufacture and sale of
tobacco products, prescription drugs, beverages and processed
foods. With respect to tobacco products, operations are man-
aged separately for domestic and overseas markets. The report-
able segments of the Group are composed of five segments:
“Domestic Tobacco Business,” “International Tobacco Business,”
“Pharmaceutical Business,” “Beverage Business” and “Processed
Food Business.” They are determined by types of products,
characteristics, and markets.
The “Domestic Tobacco Business” manufactures and sells
tobacco products in domestic areas (which include duty-free
shops in Japan and markets in China, Hong Kong, and Macau
where the Company’s China Division operates). The “International
Tobacco Business” manufactures and sells tobacco products
overseas mainly through JT International S.A., which controls
manufacturing and sales operations. The “Pharmaceutical
Business” consists of research and development, and the manu-
facture and sale of prescription drugs. The “Beverage Business”
consists of the manufacture and sale of beverages. The
“Processed Food Business” consists of the manufacture and
sale of frozen and room-temperature processed foods, bakery
products and seasonings.
(2) Revenues and Performances for Reportable Segments
Revenues and performances for reportable segments are as fol-
lows. The Board of Directors assesses the segment performance
and determines resource allocation after reviewing revenues and
adjusted operating profit. Since financial income, financial costs
and income taxes are managed by the Group head office, this
income and these expenses are excluded from the segment
performance. Transactions within the segments are based mainly
on the prevailing market price.
FY2013: Year ended March 31, 2014
Millions of yen
FY2013
Reportable Segments
Domestic
Tobacco
International
Tobacco (Note 2) Pharmaceuticals Beverage
Processed
Food Total Other (Note 3) Elimination Consolidated
Revenue
External revenue (Note 4) ¥710,299 ¥1,270,020 ¥64,448 ¥184,506 ¥156,920 ¥2,386,194 ¥ 13,648 ¥ — ¥2,399,841
Intersegment revenue 23,770 36,902 — 100 760 61,532 10,014 (71,546) —
Total revenue ¥734,069 ¥1,306,922 ¥64,448 ¥184,607 ¥157,680 ¥2,447,725 ¥ 23,662 ¥(71,546) ¥2,399,841
Segment profit (loss)
Adjusted operating
profit (Note 1) ¥257,687 ¥ 410,847 ¥ (9,008) ¥ (2,097) ¥ 563 ¥ 657,993 ¥(16,277) ¥ 61 ¥ 641,777
Other items
Depreciation and
amortization ¥ 44,411 ¥ 63,745 ¥ 3,624 ¥ 10,761 ¥ 6,903 ¥ 129,444 ¥ 3,787 ¥ (310) ¥ 132,921
Impairment losses on
other than financial assets 427 1,746 — — 29 2,202 244 — 2,446
Reversal of impairment
losses on other than
financial assets — 157 — — — 157 — — 157
Share of profit (loss) in
investments accounted for
using the equity method 47 1,613 — — (2) 1,657 44 — 1,702
Capital expenditures 49,101 78,527 3,859 14,643 4,900 151,029 5,129 — 156,158
094 JAPAN TOBACCO INC. ANNUAL REPORT FY2014

FY2014: Nine months ended December 31, 2014
Millions of yen
FY2014
Reportable Segments
Domestic
Tobacco
International
Tobacco (Note 2) Pharmaceuticals Beverage
Processed
Food Total Other (Note 3) Elimination Consolidated
Revenue
External revenue (Note 4) ¥505,602 ¥1,328,005 ¥47,555 ¥139,519 ¥122,919 ¥2,143,600 ¥ 10,370 ¥ — ¥2,153,970
Intersegment revenue 13,899 39,445 — 63 454 53,861 7,784 (61,645) —
Total revenue ¥519,501 ¥1,367,450 ¥47,555 ¥139,582 ¥123,373 ¥2,197,461 ¥ 18,154 ¥(61,645) ¥2,153,970
Segment profit (loss)
Adjusted operating
profit (Note 1) ¥172,235 ¥ 447,053 ¥ (6,914) ¥ 153 ¥ 1,259 ¥ 613,786 ¥(25,266) ¥ 41 ¥ 588,561
Other items
Depreciation and
amortization ¥ 33,475 ¥ 69,940 ¥ 3,283 ¥ 8,182 ¥ 5,135 ¥ 120,016 ¥ 2,383 ¥ (228) ¥ 122,171
Impairment losses on other
than financial assets 4,926 16,842 — — 110 21,877 — — 21,877
Reversal of impairment
losses on other than
financial assets — 33 — — — 33 — — 33
Share of profit (loss) in
investments accounted for
using the equity method 114 7,671 — — (26) 7,758 54 — 7,812
Capital expenditures 27,915 74,244 2,856 8,321 3,615 116,951 3,818 — 120,769
Reconciliation from “Adjusted operating profit” to “Profit before income taxes”
FY2013: Year ended March 31, 2014
Millions of yen
FY2013
Reportable Segments
Domestic
Tobacco
International
Tobacco (Note 2) Pharmaceuticals Beverage
Processed
Food Total Other (Note 3) Elimination Consolidated
Adjusted operating
profit (Note 1) ¥257,687 ¥410,847 ¥(9,008) ¥(2,097) ¥ 563 ¥657,993 ¥(16,277) ¥61 ¥641,777
Amortization cost of
acquired intangibles — (25,984) — — — (25,984) — — (25,984)
Adjustment items
(income) (Note 5) 1,122 3,031 — — 244 4,397 42,650 — 47,047
Adjustment items
(costs) (Note 5) (712) (11,477) — — (1,002) (13,191) (1,389) — (14,580)
Operating profit (loss) ¥258,098 ¥376,416 ¥(9,008) ¥(2,097) ¥ (195) ¥623,215 ¥ 24,984 ¥61 ¥648,260
Financial income 8,351
Financial costs (20,408)
Profit before income taxes ¥636,203
JAPAN TOBACCO INC. ANNUAL REPORT FY2014 095
FIN
AN
CIA
L S
TA
TE
ME
NTS

FY2014: Nine months ended December 31, 2014
Millions of yen
FY2014
Reportable Segments
Domestic
Tobacco
International
Tobacco (Note 2) Pharmaceuticals Beverage
Processed
Food Total Other (Note 3) Elimination Consolidated
Adjusted operating
profit (Note 1) ¥172,235 ¥447,053 ¥(6,914) ¥153 ¥ 1,259 ¥ 613,786 ¥(25,266) ¥41 ¥ 588,561
Amortization cost of
acquired intangibles — (29,465) — — — (29,465) — — (29,465)
Adjustment items
(income) (Note 5) 76 4,221 — — 3 4,300 40,002 — 44,302
Adjustment items
(costs) (Note 5) (56,680) (42,351) — — (2,215) (101,246) (2,395) — (103,641)
Operating profit (loss) ¥115,631 ¥379,458 ¥(6,914) ¥153 ¥ (953) ¥ 487,375 ¥ 12,341 ¥41 ¥ 499,757
Financial income 13,847
Financial costs (11,304)
Profit before income taxes ¥ 502,299
(Note 1) For adjusted operating profit, amortization cost of acquired intangibles, and adjustment items (income and costs) are excluded from operating profit (loss).
In addition, the key performance indicator of the Group has changed from “Adjusted EBITDA” to “Adjusted operating profit” since the quarter ended June 30, 2014.
Accordingly, the segment information of the comparative period was retrospectively adjusted.
(Note 2) The foreign subsidiaries group, which includes the core company of JT International S.A., that is part of the “International Tobacco Business” segment continues to have
December 31 as its fiscal year end date and the profit or loss for the period from January 1 to December 31 is included in the year ended March 31, 2014 and in the nine
months ended December 31, 2014, respectively.
(Note 3) “Other” includes business activities relating to rent of real estate and corporate expenses relating to corporate communication and operation of the head office.
(Note 4) Core revenue as part of the “Domestic Tobacco Business” and the “International Tobacco Business” is as follows:
Millions of yen
FY2013(Year ended March 31, 2014)
FY2014(Nine months ended December 31, 2014)
Domestic tobacco ¥ 676,171 ¥ 478,692
International tobacco 1,200,694 1,258,176
(Note 5) “Adjustment items (income)” include restructuring income of gains on sale of real estate.
“Adjustment items (costs)” include restructuring costs of the closing down of a factory and impairment losses of investments in associates.
The breakdown of restructuring income is described in “26. Other Operating Income.” Restructuring costs included in “Cost of sales” were ¥70 million for the nine months
ended December 31, 2014. Restructuring costs included in “Selling, general and administrative expenses” were ¥4,862 million and ¥100,335 million for the year ended March
31, 2014 and for the nine months ended December 31, 2014, respectively. The breakdown of restructuring costs in “Selling, general and administrative expenses” is described
in “27. Selling, General and Administrative Expenses.”
The breakdown of “Adjustment items (costs)” for each fiscal year is as follows:
Millions of yen
FY2013(Year ended March 31, 2014)
FY2014(Nine months ended December 31, 2014)
Restructuring costs ¥ 4,862 ¥100,405
Impairment losses of investments in associates 9,717 —
Other — 3,236
Adjustment items (costs) ¥14,580 ¥103,641
Restructuring costs for the nine months ended December 31, 2014 mainly relate to costs of measures to strengthen the competitiveness
of “Domestic Tobacco Business” and restructuring of manufacturing facilities in Europe in the “International Tobacco Business.”
096 JAPAN TOBACCO INC. ANNUAL REPORT FY2014

(3) Geographic InformationThe regional breakdown of non-current assets and external revenues as of each fiscal year end is as follows:
Non-current Assets
Millions of yen
FY2013(As of March 31, 2014)
FY2014(As of December 31, 2014)
Japan ¥ 587,768 ¥ 522,920
Overseas 2,223,173 2,155,365
Consolidated ¥2,810,941 ¥2,678,285
(Note) Non-current assets, exclusive of financial instruments, deferred tax assets and retirement benefits assets, are segmented by the location of the assets.
External Revenue
Millions of yen
FY2013(Year ended March 31, 2014)
FY2014(Nine months ended December 31, 2014)
Japan ¥1,100,874 ¥ 801,752
Overseas 1,298,967 1,352,218
Consolidated ¥2,399,841 ¥2,153,970
(Note) Revenue is segmented by the sales destination.
(4) Major Customers InformationThe “International Tobacco Business” of the Group sells products to the Megapolis Group that engages in distribution and wholesale
business in Russia and other countries. The external revenues from the Megapolis Group were ¥357,980 million (14.9% of consolidated
revenue) for the year ended March 31, 2014 and ¥335,446 million (15.6% of consolidated revenue) for the nine months ended December
31, 2014.
7. Cash and Cash Equivalents
The breakdown of “Cash and cash equivalents” as of each fiscal year end is as follows:
Millions of yen
FY2013(As of March 31, 2014)
FY2014(As of December 31, 2014)
Cash and deposits ¥238,959 ¥297,000
Short-term investments 14,260 88,820
Total ¥253,219 ¥385,820
Cash and cash equivalents are classified as financial assets measured at amortized cost.
“Cash and cash equivalents” include ¥42,139 million (IRR 12,055 billion) as of March 31, 2014 and ¥49,884 million (IRR 14,566 billion)
as of December 31, 2014 held by the Group’s Iranian subsidiary, JTI Pars PJS Co. Due to international sanctions and other factors
imposed on Iran, the subsidiary’s ability to remit funds outside of Iran is restricted.
JAPAN TOBACCO INC. ANNUAL REPORT FY2014 097
FIN
AN
CIA
L S
TA
TE
ME
NTS

8. Trade and Other Receivables
The breakdown of “Trade and other receivables” as of each fiscal year end is as follows:
Millions of yen
FY2013(As of March 31, 2014)
FY2014(As of December 31, 2014)
Note and account receivables ¥430,211 ¥435,824
Other 12,326 14,487
Allowance for doubtful accounts (2,327) (1,910)
Total ¥440,210 ¥448,402
Trade and other receivables are presented net of allowance for doubtful accounts in the consolidated statement of financial position.
Trade and other receivables are classified as financial assets measured at amortized cost.
9. Inventories
The breakdown of “Inventories” as of each fiscal year end is as follows:
Millions of yen
FY2013(As of March 31, 2014)
FY2014(As of December 31, 2014)
Merchandise and finished goods (Note 1) ¥160,248 ¥163,436
Leaf tobacco (Note 2) 334,318 367,991
Other 56,420 56,422
Total ¥550,987 ¥587,849
(Note 1) For imported tobacco products (merchandise) that are sold by TS Network Co., Ltd., a subsidiary of the Company, commissions solely from wholesale are included in revenue.
The amount of imported tobacco products (merchandise) that the company holds at the end of each fiscal year is included in inventories and presented as “Merchandise and
finished goods.”
(Note 2) Leaf tobacco includes those products that will be used after 12 months from the end of each fiscal year, but they are included in inventories since they are held within the
normal operating cycle.
10. Other Financial Assets
(1) The breakdown of “Other financial assets” as of each fiscal year end is as follows:
Millions of yen
FY2013(As of March 31, 2014)
FY2014(As of December 31, 2014)
Derivative assets ¥ 8,600 ¥ 31,837
Equity securities 53,705 59,355
Debt securities 7,177 8,787
Time deposits 1,538 1,044
Other 47,202 43,530
Allowance for doubtful accounts (8,293) (8,685)
Total ¥109,929 ¥135,866
Current assets ¥ 17,333 ¥ 43,907
Non-current assets 92,596 91,959
Total ¥109,929 ¥135,866
Other financial assets are presented net of allowance for doubtful accounts in the consolidated statement of financial position.
Derivative assets are classified as financial assets measured at fair value through profit or loss excluding those hedge accounting is
applied to, equity securities are classified as financial assets measured at fair value through other comprehensive income, and time
deposits and debt securities are classified as financial assets measured at amortized cost.
098 JAPAN TOBACCO INC. ANNUAL REPORT FY2014

(2) Names of major securities held as financial assets measured at fair value through other comprehensive income and their fair values as
of each fiscal year end are as follows:
Company name
Millions of yen
FY2013(As of March 31, 2014)
FY2014(As of December 31, 2014)
KT&G Corporation ¥22,163 ¥23,939
Seven & i Holdings Co., Ltd. 3,373 3,728
Mizuho Financial Group, Inc. 2,609 2,590
Mitsubishi UFJ Financial Group, Inc. 2,043 2,394
DOUTOR•NICHIRES Holdings Co., Ltd. 2,426 2,314
Japan Airport Terminal Co., Ltd. 1,072 1,914
Equity securities are held mainly for strengthening relationships with investees. Therefore, they are designated as financial assets
measured at fair value through other comprehensive income.
In order to pursue the efficiency of assets held and to use them effectively, sales of financial assets measured at fair value through
other comprehensive income have been carried out (derecognition).
The fair value at the time of sale and cumulative gain or loss that is recognized in equity through other comprehensive income for
each fiscal year is as follows:
Millions of yen
FY2013(Year ended March 31, 2014)
FY2014(Nine months ended December 31, 2014)
Fair Value ¥ 286 ¥227
Cumulative gain or loss recognized in equity as other comprehensive income (Note) (118) 23
(Note) The figure represents the amount transferred to retained earnings.
The cumulative gain or loss recognized in equity as other comprehensive income is transferred to retained earnings when an equity instrument is sold or the decline in its fair
value compared to its acquisition cost is significant.
11. Other Current Assets
The breakdown of “Other current assets” as of each fiscal year end is as follows:
Millions of yen
FY2013(As of March 31, 2014)
FY2014(As of December 31, 2014)
Prepaid tobacco excise taxes ¥176,277 ¥180,160
Prepaid expenses 16,636 16,914
Consumption tax receivables 12,527 12,818
Other 20,572 20,637
Total ¥226,012 ¥230,530
12. Non-current Assets Held-for-Sale
The breakdown of “Non-current assets held-for-sale” and “Liabilities directly associated with non-current assets held-for-sale” as of each
fiscal year end is as follows:
Breakdown of Major Assets and LiabilitiesMillions of yen
FY2013(As of March 31, 2014)
FY2014(As of December 31, 2014)
Non-current assets held-for-sale
Property, plant and equipment ¥ 221 ¥115
Investment property 1,730 252
Total ¥1,952 ¥367
Liabilities directly associated with non-current assets held-for-sale
Guarantee deposits ¥ 68 ¥ —
Long-term guarantee deposits 6 —
Total ¥ 75 ¥ —
JAPAN TOBACCO INC. ANNUAL REPORT FY2014 099
FIN
AN
CIA
L S
TA
TE
ME
NTS

“Non-current assets held-for-sale” as of March 31, 2014 are
mainly rental properties and idle properties which are currently
actively marketed for sale. Guarantee deposits and long-term
guarantee deposits related to the rental properties are included
in“Liabilities directly associated with non-current assets
held-for-sale.”
With regard to such assets and assets sold, impairment losses
of ¥400 million are recognized in “Selling, general and administra-
tive expenses” in the consolidated statement of income for the
year ended March 31, 2014.
“Non-current assets held-for-sale” as of December 31, 2014
are mainly rental properties and idle properties which are currently
actively marketed for sale.
With regard to such assets and assets sold, impairment losses
of ¥46 million are recognized in “Selling, general and administra-
tive expenses” in the consolidated statement of income for the
nine months ended December 31, 2014.
13. Property, Plant and Equipment
(1) Schedule of Property, Plant and EquipmentThe schedules of the carrying amount, acquisition cost, and accumulated depreciation and accumulated impairment losses of “Property,
plant and equipment” are as follows:
Millions of yen
Carrying Amount
Land, buildings
and structures
Machinery
and vehicles
Tools, furniture
and fixtures
Construction
in progress Total
As of April 1, 2013 ¥307,332 ¥271,207 ¥ 65,256 ¥ 28,522 ¥672,316
Individual acquisition 14,255 50,973 21,750 50,371 137,349
Capitalization of borrowing costs (Note) — — — 287 287
Transfer to investment property (1,623) (4) (5) — (1,633)
Depreciation (15,892) (50,521) (22,387) — (88,801)
Impairment losses (27) (922) (2) (282) (1,233)
Reversal of impairment losses — 157 — — 157
Sale or disposal (1,612) (3,914) (363) (111) (6,000)
Exchange differences on translation of foreign operations 16,204 28,189 3,438 6,201 54,031
Other 12,672 16,764 1,024 (16,947) 13,514
As of March 31, 2014 331,308 311,929 68,710 68,041 779,987
Individual acquisition 15,646 33,818 16,944 42,215 108,623
Capitalization of borrowing costs (Note) — — — 141 141
Acquisition through business combinations 4 1 10 — 15
Transfer to investment property (2,627) (1) (5) — (2,633)
Depreciation (13,545) (48,444) (18,086) — (80,075)
Impairment losses (7,552) (10,663) (177) (653) (19,045)
Reversal of impairment losses — 33 — — 33
Sale or disposal (655) (7,867) (461) (444) (9,427)
Exchange differences on translation of foreign operations (3,070) (11,808) (1,086) (4,480) (20,443)
Other 6,385 25,406 774 (33,614) (1,050)
As of December 31, 2014 ¥325,895 ¥292,404 ¥ 66,622 ¥ 71,206 ¥756,127
(Note) The capitalization rates calculating the borrowing costs for capitalization were 4.3% for the year ended March 31, 2014 and 4.6% for the nine months ended December 31, 2014,
respectively.
Millions of yen
Acquisition Cost
Land, buildings
and structures
Machinery
and vehicles
Tools, furniture
and fixtures
Construction
in progress Total
As of April 1, 2013 ¥615,682 ¥720,165 ¥171,351 ¥28,522 ¥1,535,719
As of March 31, 2014 654,008 811,079 187,959 68,041 1,721,087
As of December 31, 2014 661,172 804,276 188,732 71,206 1,725,386
100 JAPAN TOBACCO INC. ANNUAL REPORT FY2014

Millions of yen
Accumulated Depreciation and Accumulated Impairment Losses
Land, buildings
and structures
Machinery
and vehicles
Tools, furniture
and fixtures
Construction
in progress Total
As of April 1, 2013 ¥308,350 ¥448,958 ¥106,095 ¥ — ¥ 863,403
As of March 31, 2014 322,700 499,150 119,250 — 941,099
As of December 31, 2014 335,277 511,872 122,110 — 969,259
The carrying amount of property, plant and equipment as of each fiscal year end includes the carrying amount of the following
leased assets:
Millions of yen
Land, buildings
and structures
Machinery
and vehicles
Tools, furniture
and fixtures Total
As of April 1, 2013 ¥1,378 ¥3,364 ¥6,798 ¥11,540
As of March 31, 2014 1,335 5,015 6,763 13,113
As of December 31, 2014 6,910 5,250 6,766 18,926
(2) Impairment LossesThe grouping of property, plant and equipment for impairment test
is the smallest cash-generating unit that independently generates
cash inflow.
The Group recognized impairment losses of ¥1,233 million for
the year ended March 31, 2014 and ¥19,045 million for the nine
months ended December 31, 2014 in “Selling, general and admin-
istrative expenses” in the consolidated statement of income.
Impairment losses recognized in the year ended March 31,
2014 represent the losses incurred to reduce the carrying amounts
to the recoverable amounts of the buildings, structures, machinery
and vehicles due to individual selection for demolition.
The recoverable amounts of these assets are calculated mainly
by their values in use, which are set at “zero.”
Impairment losses recognized in the nine months ended
December 31, 2014 represent the losses incurred to reduce the
carrying amounts to the recoverable amounts of the buildings,
structures, machinery and vehicles due to decision of closing
down of a factory.
The recoverable amounts of these assets are calculated mainly
by their values in use, which are set at “zero.”
14. Goodwill and Intangible Assets
(1) Schedule of Goodwill and Intangible AssetsThe schedules of carrying amount, acquisition cost, and accumulated amortization and accumulated impairment losses of “Goodwill” and
“Intangible assets” are as follows:
Carrying Amount
Millions of yen
Goodwill Trademarks Software Other Total
As of April 1, 2013 ¥1,316,476 ¥287,622 ¥ 31,869 ¥29,321 ¥1,665,289
Individual acquisition 24 388 6,573 11,287 18,271
Amortization (Note) — (25,378) (11,093) (5,336) (41,807)
Impairment losses — — (2) (713) (715)
Sale or disposal — (1) (137) (66) (203)
Exchange differences on translation of foreign operations 266,105 60,164 693 783 327,745
Other 1,828 (1,562) 6,462 (5,775) 953
As of March 31, 2014 1,584,432 321,234 34,366 29,501 1,969,532
Individual acquisition 49 256 5,176 6,354 11,836
Acquisition through business combinations 29,615 376 4 — 29,995
Amortization (Note) — (27,326) (9,457) (4,299) (41,082)
Impairment losses — (2,672) (6) — (2,678)
Sale or disposal — — (87) (148) (234)
Exchange differences on translation of foreign operations (74,720) 10,085 977 376 (63,281)
Other — 7 4,882 (4,688) 201
As of December 31, 2014 ¥1,539,376 ¥301,960 ¥ 35,856 ¥27,096 ¥1,904,288
(Note) The amortization of intangible assets is included in “Cost of sales” and “Selling, general and administrative expenses” in the consolidated statement of income.
JAPAN TOBACCO INC. ANNUAL REPORT FY2014 101
FIN
AN
CIA
L S
TA
TE
ME
NTS

Millions of yen
Acquisition Cost Goodwill Trademarks Software Other Total
As of April 1, 2013 ¥1,316,476 ¥733,745 ¥111,640 ¥87,671 ¥2,249,531
As of March 31, 2014 1,584,432 824,669 123,940 92,853 2,625,893
As of December 31, 2014 1,539,376 845,499 132,309 92,280 2,609,465
Millions of yen
Accumulated Amortization and Accumulated Impairment Losses Goodwill Trademarks Software Other Total
As of April 1, 2013 ¥ — ¥446,122 ¥79,770 ¥58,350 ¥584,242
As of March 31, 2014 — 503,435 89,574 63,352 656,361
As of December 31, 2014 — 543,539 96,453 65,184 705,177
The carrying amount of intangible assets as of each fiscal year end includes the carrying amount of the following leased assets:
Millions of yen
Software
As of April 1, 2013 ¥5
As of March 31, 2014 3
As of December 31, 2014 1
(2) Material Goodwill and Intangible AssetsGoodwill and intangible assets recognized in the consolidated
statement of financial position are mainly composed of goodwill
and trademarks in the JTIH Group. The carrying amounts of
goodwill as of March 31, 2014 and December 31, 2014 were
¥1,541,904 million and ¥1,496,799 million, respectively. The carry-
ing amounts of trademarks as of March 31, 2014 and December
31, 2014 were ¥318,671 million and ¥299,502 million, respectively.
The majority of the goodwill and trademarks was recognized as
a result of acquisitions of RJR Nabisco’s non-U.S. tobacco opera-
tions in 1999 and Gallaher in 2007.
The trademarks are amortized using the straight-line method
and the remaining amortization period is mainly 12 years.
(3) Impairment Test for GoodwillFor the nine months ended December 31, 2014, the carrying
amount of the majority of goodwill is allocated to the international
tobacco cash-generating unit of ¥1,496,799 million (¥1,541,904
million for the year ended March 31, 2014) and the processed
food cash-generating unit of ¥25,368 million (¥25,368 million
for the year ended March 31, 2014). Details of the result of
impairment tests are as follows:
A. International Tobacco Cash-generating Unit
The recoverable amount is calculated by the value in use based
on the three-year business plan that was prepared by reflecting
past experiences and external information and that was approved
by management. After the three-year business plan, the Group
sets a growth rate that decreases gradually from 5.1% in the
fourth year (FY2013: 6.0%) to 3.9% in the ninth year (FY2013:
4.4%), and the same growth rate as the ninth year from the tenth
year as a continued growth rate for inflation.
The discount rate before taxes is 11.1% (FY2013: 10.7%).
The value in use sufficiently exceeds the carrying amount of the
cash-generating unit. Therefore, even in cases where the discount
rate and growth rate used in calculating the value in use fluctuate
within reasonable ranges, the Group assumes that the value in
use will not become less than the carrying amount.
B. Processed Food Cash-generating Unit
The recoverable amount is calculated by the value in use based on
the three-year business plan that was prepared by reflecting past
experiences and external information and that was approved by
management. After the three-year business plan, the Group sets a
growth rate that decreases gradually from 2.8% in the fourth year
(FY2013: 3.1%) to 2.1% in the ninth year (FY2013: 2.1%), and the
same growth rate as the ninth year issued from the tenth year as
a continued growth rate for inflation. The discount rate before
taxes is 3.9% (FY2013: 3.6%). The value in use exceeds the carry-
ing amount. If the discount rate increases by 2.1%, impairment
losses would be recognized. In case that growth rate fluctuates
within a reasonable range, the Group assumes that the value in
use will not become less than the carrying amount.
(4) Impairment lossesGoodwill is allocated to cash-generating units that are identified
according to locations and types of businesses. The grouping
of intangible assets for impairment test is the smallest cash-
generating unit that independently generates cash inflow.
The Group recognized impairment losses of ¥2,678 million for
the nine months ended December 31, 2014 in “Selling, general and
administrative expenses” in the consolidated statement of income.
Impairment losses recognized in the nine months ended
December 31, 2014 represent the losses incurred to reduce the
carrying amounts to the recoverable amounts of trademarks
and software as the recoverable amounts were lower than the
carrying amounts.
The recoverable amounts of these assets are calculated mainly
by their values in use.
102 JAPAN TOBACCO INC. ANNUAL REPORT FY2014

15. Lease Transactions
The Group leases factory sites, vehicles, vending machines and other assets as a lessee. Some of the lease contracts have renewal
options or escalation clauses. There are no restrictions on additional debt and further leasing imposed by the lease arrangements.
(1) Present Value of Finance Lease ObligationsThe total of future minimum lease payments for leased assets recognized based on the finance lease contracts, their present value and
future financial costs as of each fiscal year end are as follows:
Millions of yen
FY2013(As of March 31, 2014)
FY2014(As of December 31, 2014)
Not later than 1 year
Total of future minimum lease payments ¥ 4,831 ¥ 4,675
Future financial costs 392 357
Present value 4,439 4,318
Later than 1 year and not later than five years
Total of future minimum lease payments 9,666 10,071
Future financial costs 620 1,168
Present value 9,045 8,902
Later than 5 years
Total of future minimum lease payments 708 10,447
Future financial costs 38 4,015
Present value 670 6,432
Total
Total of future minimum lease payments 15,204 25,192
Future financial costs 1,050 5,540
Present value 14,154 19,652
(2) Future Minimum Lease Payments under Non-cancellable Operating LeasesThe total of future minimum lease payments under non-cancellable operating leases as of each fiscal year end is as follows:
Millions of yen
FY2013(As of March 31, 2014)
FY2014(As of December 31, 2014)
Not later than 1 year ¥ 8,521 ¥ 8,250
Later than 1 year and not later than 5 years 13,804 9,957
Later than 5 years 7,908 7,996
Total ¥30,233 ¥26,203
(3) Total of Minimum Lease Payments and Contingent RentsThe total of minimum lease payments and contingent rents of operating lease contracts recognized as an expense for each fiscal year is
as follows:
Millions of yen
FY2013(Year ended March 31, 2014)
FY2014(Nine months ended December 31, 2014)
Total of minimum lease payments ¥11,266 ¥12,059
Contingent rents 1,028 773
JAPAN TOBACCO INC. ANNUAL REPORT FY2014 103
FIN
AN
CIA
L S
TA
TE
ME
NTS

16. Investment Property
(1) Schedule of Investment PropertyThe schedule of the carrying amount of “Investment property” for each fiscal year is as follows:
Millions of yen
FY2013(Year ended March 31, 2014)
FY2014(Nine months ended December 31, 2014)
Balance at the beginning of the period ¥ 58,995 ¥ 61,421
Expenditure after acquisition 244 77
Transfer from property, plant and equipment 1,633 2,633
Transfer to non-current assets held-for-sale (4,114) (44,381)
Transfer to property, plant and equipment (6,339) —
Depreciation (2,313) (1,014)
Impairment losses (98) (108)
Sale or disposal (1,513) (760)
Exchange differences on translation of foreign operations 18 0
Other 14,908 2
Balance at the end of the period ¥ 61,421 ¥ 17,870
Acquisition cost at the beginning of the period ¥127,493 ¥108,831
Accumulated depreciation and accumulated impairment losses
at the beginning of the period 68,498 47,410
Acquisition cost at the end of the period 108,831 46,084
Accumulated depreciation and accumulated impairment losses
at the end of the period 47,410 28,214
(2) Fair ValueThe fair value of investment property is determined based on a valuation conducted by an external real estate appraiser. The valuation is
made in accordance with the appraisal of the country where the investment property is located and based on market evidence of transac-
tion prices for similar assets.
The fair value hierarchy of investment property is categorized from Level 1 to Level 3 as follows:
Level 1: Fair value measured at the quoted price in the active market
Level 2: Fair value that is calculated using the observable price other than categorized in Level 1 directly or indirectly
Level 3: Fair value that is calculated based on valuation techniques which include inputs that are not based on observable market data
The fair value of investment property based on the fair value hierarchy as of each fiscal year end is as follows:
Millions of yen
FY2013 (As of March 31, 2014)
Level 1 Level 2 Level 3 Total
Investment property ¥ — ¥112,070 ¥2,387 ¥114,457
Millions of yen
FY2014 (As of December 31, 2014)
Level 1 Level 2 Level 3 Total
Investment property ¥ — ¥44,687 ¥1,986 ¥46,674
The carrying amount of investment property as of each fiscal year end is as follows:
Millions of yen
FY2013(As of March 31, 2014)
FY2014(As of December 31, 2014)
Investment property ¥61,421 ¥17,870
104 JAPAN TOBACCO INC. ANNUAL REPORT FY2014
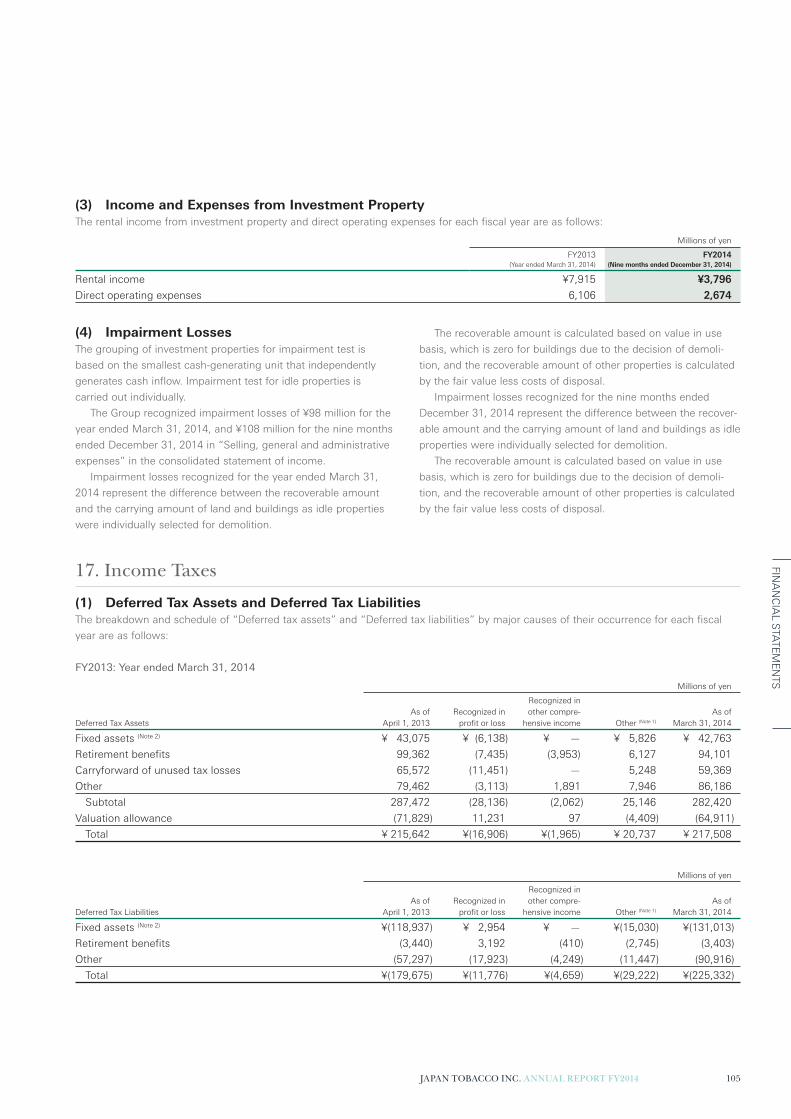
(3) Income and Expenses from Investment PropertyThe rental income from investment property and direct operating expenses for each fiscal year are as follows:
Millions of yen
FY2013(Year ended March 31, 2014)
FY2014(Nine months ended December 31, 2014)
Rental income ¥7,915 ¥3,796
Direct operating expenses 6,106 2,674
(4) Impairment LossesThe grouping of investment properties for impairment test is
based on the smallest cash-generating unit that independently
generates cash inflow. Impairment test for idle properties is
carried out individually.
The Group recognized impairment losses of ¥98 million for the
year ended March 31, 2014, and ¥108 million for the nine months
ended December 31, 2014 in “Selling, general and administrative
expenses” in the consolidated statement of income.
Impairment losses recognized for the year ended March 31,
2014 represent the difference between the recoverable amount
and the carrying amount of land and buildings as idle properties
were individually selected for demolition.
The recoverable amount is calculated based on value in use
basis, which is zero for buildings due to the decision of demoli-
tion, and the recoverable amount of other properties is calculated
by the fair value less costs of disposal.
Impairment losses recognized for the nine months ended
December 31, 2014 represent the difference between the recover-
able amount and the carrying amount of land and buildings as idle
properties were individually selected for demolition.
The recoverable amount is calculated based on value in use
basis, which is zero for buildings due to the decision of demoli-
tion, and the recoverable amount of other properties is calculated
by the fair value less costs of disposal.
17. Income Taxes
(1) Deferred Tax Assets and Deferred Tax LiabilitiesThe breakdown and schedule of “Deferred tax assets” and “Deferred tax liabilities” by major causes of their occurrence for each fiscal
year are as follows:
FY2013: Year ended March 31, 2014
Millions of yen
Deferred Tax Assets
As of
April 1, 2013
Recognized in
profit or loss
Recognized in
other compre-
hensive income Other (Note 1)
As of
March 31, 2014
Fixed assets (Note 2) ¥ 43,075 ¥ (6,138) ¥ — ¥ 5,826 ¥ 42,763
Retirement benefits 99,362 (7,435) (3,953) 6,127 94,101
Carryforward of unused tax losses 65,572 (11,451) — 5,248 59,369
Other 79,462 (3,113) 1,891 7,946 86,186
Subtotal 287,472 (28,136) (2,062) 25,146 282,420
Valuation allowance (71,829) 11,231 97 (4,409) (64,911)
Total ¥ 215,642 ¥(16,906) ¥(1,965) ¥ 20,737 ¥ 217,508
Millions of yen
Deferred Tax Liabilities
As of
April 1, 2013
Recognized in
profit or loss
Recognized in
other compre-
hensive income Other (Note 1)
As of
March 31, 2014
Fixed assets (Note 2) ¥(118,937) ¥ 2,954 ¥ — ¥(15,030) ¥(131,013)
Retirement benefits (3,440) 3,192 (410) (2,745) (3,403)
Other (57,297) (17,923) (4,249) (11,447) (90,916)
Total ¥(179,675) ¥(11,776) ¥(4,659) ¥(29,222) ¥(225,332)
JAPAN TOBACCO INC. ANNUAL REPORT FY2014 105
FIN
AN
CIA
L S
TA
TE
ME
NTS

FY2014: Nine months ended December 31, 2014
Millions of yen
Deferred Tax Assets
As of
April 1, 2014
Recognized in
profit or loss
Recognized in
other compre-
hensive income Other (Note 1)
As of December 31,
2014
Fixed assets (Note 2) ¥ 42,763 ¥ 2,051 ¥ — ¥ 414 ¥ 45,228
Retirement benefits 94,101 22,786 6,550 893 124,330
Carryforward of unused tax losses 59,369 3,401 — 280 63,050
Other 86,186 (10,195) 6,628 3,064 85,684
Subtotal 282,420 18,043 13,178 4,651 318,292
Valuation allowance (64,911) (144) 11 (1,433) (66,478)
Total ¥217,508 ¥ 17,898 ¥13,189 ¥ 3,218 ¥251,814
Millions of yen
Deferred Tax Liabilities
As of
April 1, 2014
Recognized in
profit or loss
Recognized in
other compre-
hensive income Other (Note 1)
As of December 31,
2014
Fixed assets (Note 2) ¥(131,013) ¥ 15,715 ¥ — ¥(455) ¥(115,753)
Retirement benefits (3,403) (2,043) (1,968) 80 (7,334)
Other (90,916) (10,636) (5,753) 583 (106,722)
Total ¥(225,332) ¥ 3,035 ¥(7,721) ¥ 209 ¥(229,809)
(Note 1) “Other” includes exchange differences on translation of foreign operations.
(Note 2) “Fixed assets” include property, plant and equipment, goodwill, intangible assets and investment property.
The deferred tax assets are recognized by taking taxable tem-
porary differences, future taxable profits plan and tax planning
into account. The carryforward of unused tax losses, for which
the deferred tax assets are not recognized, was ¥46,162 million
(including ¥30,707 million, for which the carryforward expires
after five years) as of March 31, 2014, and ¥50,549 million
(including ¥23,962 million, for which the carryforward expires
after five years) as of December 31, 2014. Tax credits, for which
the deferred tax assets are not recognized, were ¥729 million
(including ¥46 million, for which the carryforward expires after
five years) as of March 31, 2014, and ¥606 million (including
¥192 million, for which the carryforward expires after five years)
as of December 31, 2014.
(2) Income TaxesThe breakdown of “Income taxes” for each fiscal year is as follows:
Millions of yen
FY2013(Year ended March 31, 2014)
FY2014(Nine months ended December 31, 2014)
Current income taxes ¥172,230 ¥154,606
Deferred income taxes 28,682 (20,933)
Total income taxes ¥200,912 ¥133,673
Deferred income taxes decreased by ¥1,667 million and increased by ¥62 million for the year ended March 31, 2014 and for the nine
months ended December 31, 2014, respectively, due to the effect of changes in tax rates in Japan and other countries.
106 JAPAN TOBACCO INC. ANNUAL REPORT FY2014

(3) Reconciliation of the Effective Tax RateThe breakdown of major items that caused differences between the effective statutory tax rate and the average actual tax rate for each
fiscal year is as follows:
The Company is subject mainly to corporate tax, inhabitant tax, and enterprise tax. The effective statutory tax rates calculated based
on these taxes were 37.78% and 35.41% for the year ended March, 2014 and for the nine months ended December 2014, respectively.
Special Corporation Tax for Reconstruction has been abolished in this fiscal year. Foreign subsidiaries are subject to income taxes at their
locations.
%
FY2013(Year ended March 31, 2014)
FY2014(Nine months ended December 31, 2014)
Effective statutory tax rate 37.78 35.41
Different tax rates applied to foreign subsidiaries (10.98) (13.28)
Non-deductible expenses 3.71 1.90
Undistributed earnings of subsidiaries 3.20 2.00
Other (2.13) 0.58
Average actual tax rate 31.58 26.61
18. Trade and Other Payables
The breakdown of “Trade and other payables” as of each fiscal year end is as follows:
Millions of yen
FY2013(As of March 31, 2014)
FY2014(As of December 31, 2014)
Accounts payable ¥190,408 ¥188,674
Other payables 78,662 147,918
Other 90,955 83,173
Total ¥360,025 ¥419,764
Trade and other payables are classified as financial liabilities measured at amortized cost.
19. Bonds and Borrowings (including Other Financial Liabilities)
(1) Breakdown of Financial LiabilitiesThe breakdown of “Bonds and borrowings” and “Other financial liabilities” as of each fiscal year end is as follows:
Millions of yen %
FY2013(As of March 31, 2014)
FY2014(As of December 31, 2014)
Average
interest rate
(Note 1) Due
Derivative liabilities ¥ 4,856 ¥ 10,010 — —
Short-term borrowings 21,936 27,632 1.47 —
Current portion of long-term borrowings 1,225 39,930 0.33 —
Current portion of bonds (Note 2) 172,401 40,000 — —
Long-term borrowings 35,034 1,046 4.44 2016–2028
Bonds (Note 2) 131,131 99,954 — —
Other 22,366 23,070 — —
Total ¥388,949 ¥241,642
Current liabilities ¥205,053 ¥122,024
Non-current liabilities 183,895 119,618
Total ¥388,949 ¥241,642
(Note 1) The average interest rate is calculated using the interest rate and outstanding balance as of December 31, 2014.
JAPAN TOBACCO INC. ANNUAL REPORT FY2014 107
FIN
AN
CIA
L S
TA
TE
ME
NTS

Derivative liabilities are classified as financial liabilities measured at fair value through profit or loss excluding those hedge accounting
is applied to, and bonds and borrowings are classified as financial liabilities measured at amortized cost.
There are no financial covenants that have a significant impact on the Group on bonds and borrowings.
(Note 2) The summary of the issuing conditions of the bonds is as follows:
Millions of yen %
FY2013(As of March 31, 2014)
FY2014(As of December 31, 2014)
Interest
rate Collateral Date of maturityCompany Name of bond Date of issuance
Japan Tobacco
Inc.
5th Domestic
straight bond
June 3, 2009 ¥ 99,993
(99,993)
¥ — 1.13 Yes June 3, 2014
Japan Tobacco
Inc.
6th Domestic
straight bond
December 9, 2010 40,000 40,000(40,000)
0.53 Yes December 9, 2015
Japan Tobacco
Inc.
7th Domestic
straight bond
December 9, 2010 20,000 20,000 0.84 Yes December 8, 2017
Japan Tobacco
Inc.
8th Domestic
straight bond
December 9, 2010 20,000 20,000 1.30 Yes December 9, 2020
Japan Tobacco
Inc.
Straight bond
in USD
July 23, 2013 51,131
[USD 500 mil.]
59,954[USD 500 mil.]
2.10 Yes July 23, 2018
JTI (UK) Finance
Plc
Straight bond
in EUR
October 2, 2006 72,408
(72,408)
[EUR 500 mil.]
— 4.50 Non April 2, 2014
Total ¥ 303,532
(172,401)
¥139,954(40,000)
(Note 1) The figure in parentheses ( ) represents the amount of the current portion of the bond.
(Note 2) The figure in parentheses [ ] represents the amount of foreign currency-denominated bond.
(2) Assets Pledged as Collateral for LiabilitiesA. Pursuant to the provisions of Article 6 of Japan Tobacco Inc. Act, the Company’s properties are pledged as general collateral for bonds
issued by the Company. Bondholders are entitled to claim satisfaction in preference to unsecured creditors of the Company properties
(with the exception of national and local taxes and certain other statutory obligations).
B. Assets pledged as collateral by some subsidiaries and their corresponding debts as of each fiscal year end are as follows:
Assets Pledged as Collateral
Millions of yen
FY2013(As of March 31, 2014)
FY2014(As of December 31, 2014)
Land, buildings, and structures ¥5,838 ¥ —
Other 114 125
Total ¥5,952 ¥125
Corresponding Debts
Millions of yen
FY2013(As of March 31, 2014)
FY2014(As of December 31, 2014)
Current portion of long-term borrowings ¥1,072 ¥ —
Other 156 125
Total ¥1,227 ¥125
108 JAPAN TOBACCO INC. ANNUAL REPORT FY2014

20. Provisions
The breakdown and schedule of “Provisions” for each fiscal year are as follows:
FY2013: Year ended March 31, 2014
Millions of yen
Asset retirement
provisions
Restructuring
provisions
Provisions for
sales rebates
Other
provisions Total
As of April 1, 2013 ¥1,695 ¥ 450 ¥ 4,073 ¥3,824 ¥10,043
Provisions 72 1,910 4,288 557 6,827
Interest cost associated with passage of time 19 — — — 19
Provisions used (92) (309) (3,958) (185) (4,544)
Provisions reversed — (202) (116) (360) (678)
Exchange differences on translation of foreign operations — 206 — 730 936
As of March 31, 2014 ¥1,695 ¥2,055 ¥ 4,288 ¥4,566 ¥12,603
Current liabilities ¥ 5 ¥2,055 ¥ 4,288 ¥1,014 ¥ 7,362
Non-current liabilities 1,690 — — 3,552 5,241
Total ¥1,695 ¥2,055 ¥ 4,288 ¥4,566 ¥12,603
FY2014: Nine months ended December 31, 2014
Millions of yen
Asset retirement
provisions
Restructuring
provisions
Provisions for
sales rebates
Other
provisions Total
As of April 1, 2014 ¥1,695 ¥ 2,055 ¥ 4,288 ¥4,566 ¥ 12,603
Provisions 1,110 31,154 3,994 969 37,227
Interest cost associated with passage of time 28 — — — 28
Provisions used (91) (10,902) (4,148) (247) (15,388)
Provisions reversed — (462) (140) (800) (1,402)
Exchange differences on translation of foreign operations — 1,110 — 447 1,557
As of December 31, 2014 ¥2,742 ¥ 22,954 ¥ 3,994 ¥4,935 ¥ 34,624
Current liabilities ¥ — ¥ 3,950 ¥ 3,994 ¥1,256 ¥ 9,200
Non-current liabilities 2,742 19,004 — 3,679 25,425
Total ¥2,742 ¥ 22,954 ¥ 3,994 ¥4,935 ¥ 34,624
A. Asset Retirement Provisions
In order to settle the obligation of restoring and of removing
hazardous substances from plant facilities and premises that the
Group uses, the probable amount to be paid in the future is recog-
nized based on past performances. These expenses are expected
to be paid after one year or more; however, they may be affected
by future business plans.
B. Restructuring Provisions
These provisions are mainly related to business integration and
measures for the rationalization of international tobacco business.
The timing of the payment may be affected by future business
plans.
C. Provisions for Sales Rebates
These provisions are for contracts which reward the customers
with discounts when the sales volume or sales amount in a given
period exceeds specified volume or amount. They are expected to
be paid within one year.
JAPAN TOBACCO INC. ANNUAL REPORT FY2014 109
FIN
AN
CIA
L S
TA
TE
ME
NTS
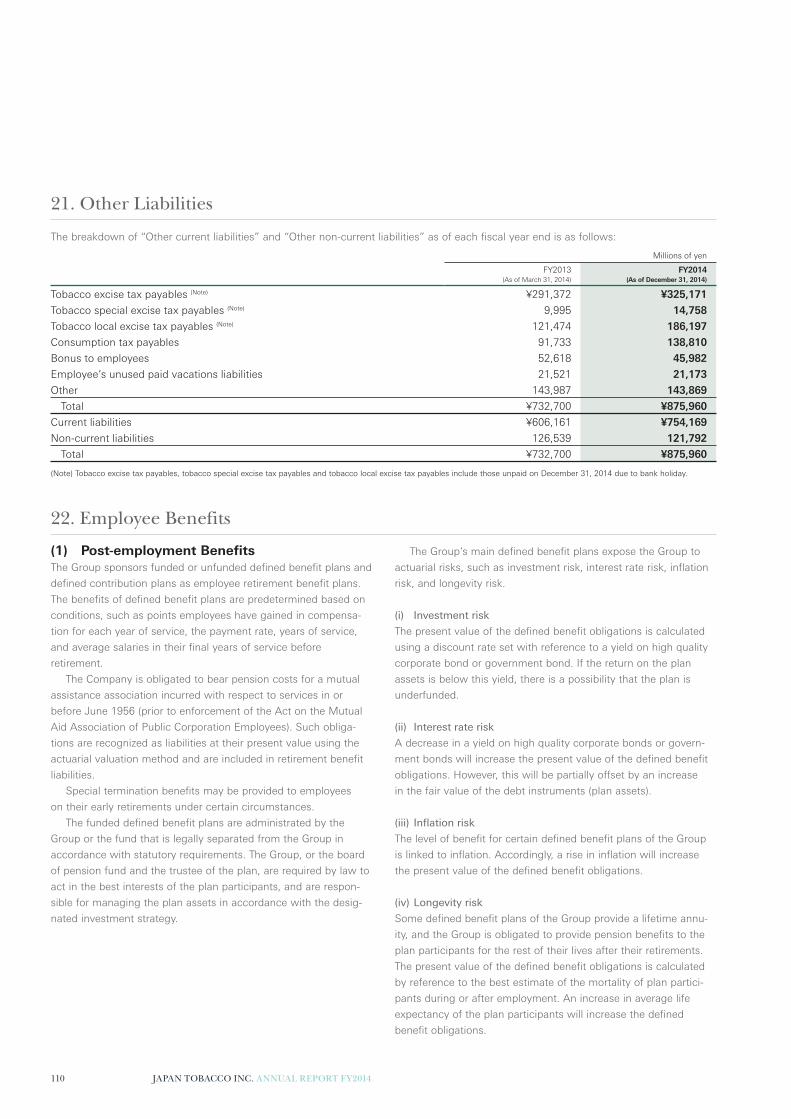
21. Other Liabilities
The breakdown of “Other current liabilities” and “Other non-current liabilities” as of each fiscal year end is as follows:
Millions of yen
FY2013(As of March 31, 2014)
FY2014(As of December 31, 2014)
Tobacco excise tax payables (Note) ¥291,372 ¥325,171
Tobacco special excise tax payables (Note) 9,995 14,758
Tobacco local excise tax payables (Note) 121,474 186,197
Consumption tax payables 91,733 138,810
Bonus to employees 52,618 45,982
Employee’s unused paid vacations liabilities 21,521 21,173
Other 143,987 143,869
Total ¥732,700 ¥875,960
Current liabilities ¥606,161 ¥754,169
Non-current liabilities 126,539 121,792
Total ¥732,700 ¥875,960
(Note) Tobacco excise tax payables, tobacco special excise tax payables and tobacco local excise tax payables include those unpaid on December 31, 2014 due to bank holiday.
22. Employee Benefits
(1) Post-employment BenefitsThe Group sponsors funded or unfunded defined benefit plans and
defined contribution plans as employee retirement benefit plans.
The benefits of defined benefit plans are predetermined based on
conditions, such as points employees have gained in compensa-
tion for each year of service, the payment rate, years of service,
and average salaries in their final years of service before
retirement.
The Company is obligated to bear pension costs for a mutual
assistance association incurred with respect to services in or
before June 1956 (prior to enforcement of the Act on the Mutual
Aid Association of Public Corporation Employees). Such obliga-
tions are recognized as liabilities at their present value using the
actuarial valuation method and are included in retirement benefit
liabilities.
Special termination benefits may be provided to employees
on their early retirements under certain circumstances.
The funded defined benefit plans are administrated by the
Group or the fund that is legally separated from the Group in
accordance with statutory requirements. The Group, or the board
of pension fund and the trustee of the plan, are required by law to
act in the best interests of the plan participants, and are respon-
sible for managing the plan assets in accordance with the desig-
nated investment strategy.
The Group’s main defined benefit plans expose the Group to
actuarial risks, such as investment risk, interest rate risk, inflation
risk, and longevity risk.
(i) Investment risk
The present value of the defined benefit obligations is calculated
using a discount rate set with reference to a yield on high quality
corporate bond or government bond. If the return on the plan
assets is below this yield, there is a possibility that the plan is
underfunded.
(ii) Interest rate risk
A decrease in a yield on high quality corporate bonds or govern-
ment bonds will increase the present value of the defined benefit
obligations. However, this will be partially offset by an increase
in the fair value of the debt instruments (plan assets).
(iii) Inflation risk
The level of benefit for certain defined benefit plans of the Group
is linked to inflation. Accordingly, a rise in inflation will increase
the present value of the defined benefit obligations.
(iv) Longevity risk
Some defined benefit plans of the Group provide a lifetime annu-
ity, and the Group is obligated to provide pension benefits to the
plan participants for the rest of their lives after their retirements.
The present value of the defined benefit obligations is calculated
by reference to the best estimate of the mortality of plan partici-
pants during or after employment. An increase in average life
expectancy of the plan participants will increase the defined
benefit obligations.
110 JAPAN TOBACCO INC. ANNUAL REPORT FY2014

A. Schedule of Defined Benefit Obligations
The schedule of the defined benefit obligations is as follows:
Millions of yen
Japan (Note 3) Overseas Total
As of April 1, 2013 (Notes 1, 2) ¥335,312 ¥364,893 ¥700,205
Current service cost 12,377 7,755 20,132
Past service cost and gains and losses on settlement — 2,627 2,627
Interest expense 3,046 14,972 18,018
Contributions by plan participants — 972 972
Special termination benefits — 37 37
Remeasurement gains and losses:
Actuarial gains and losses arising from changes in demographic assumptions 4 4,211 4,215
Actuarial gains and losses arising from changes in financial assumptions (679) 1,173 494
Actuarial gains and losses arising from experience adjustments (86) 3,029 2,943
Benefits paid (30,703) (17,871) (48,574)
Exchange differences on translation of foreign operations — 88,196 88,196
Other 308 237 545
As of March 31, 2014 (Notes 1, 2) 319,579 470,230 789,809
Current service cost 9,957 9,028 18,984
Past service cost and gains and losses on settlement 590 (1,293) (703)
Interest expense 2,135 18,102 20,236
Contributions by plan participants — 1,156 1,156
Remeasurement gains and losses:
Actuarial gains and losses arising from changes in demographic assumptions (4) 3,120 3,116
Actuarial gains and losses arising from changes in financial assumptions 5,539 47,891 53,430
Actuarial gains and losses arising from experience adjustments (2,571) (5,648) (8,219)
Benefits paid (43,044) (21,829) (64,872)
Exchange differences on translation of foreign operations — 31,249 31,249
Other (42) — (42)
As of December 31, 2014 (Notes 1, 2) ¥292,138 ¥552,006 ¥844,144
(Note 1) The Group’s weighted-average duration of the defined benefit obligations is 8.1 years for Japan and 15.4 years for overseas (FY2013: 7.6 years for Japan and 14.5 years
for overseas).
(Note 2) The Group’s breakdown of the defined benefit obligation by plan participant is as follows:
Millions of yen
FY2013 (As of March 31, 2014) FY2014 (As of December 31, 2014)
Japan Overseas Total Japan Overseas Total
Active members ¥200,292 ¥187,191 ¥387,483 ¥183,381 ¥214,855 ¥398,236
Deferred members 14,791 49,900 64,691 14,542 58,165 72,707
Pensioners 104,497 233,139 337,635 94,216 278,986 373,202
Total ¥319,579 ¥470,230 ¥789,809 ¥292,138 ¥552,006 ¥844,144
(Note 3) The schedule of mutual pension benefits obligations included in the category of Japan is as follows:
Millions of yen
FY2013(Year ended March 31, 2014)
FY2014(Nine months ended December 31, 2014)
Balance at the beginning of the period ¥76,814 ¥67,825
Interest expense 461 254
Remeasurement gains and losses (1,070) (3,748)
Benefits paid (8,380) (5,140)
Balance at the end of the period ¥67,825 ¥59,191
JAPAN TOBACCO INC. ANNUAL REPORT FY2014 111
FIN
AN
CIA
L S
TA
TE
ME
NTS

B. Schedule of Plan Assets
The schedule of the plan assets is as follows:
Millions of yen
Japan Overseas Total
As of April 1, 2013 ¥107,590 ¥264,835 ¥372,425
Interest income 1,065 11,116 12,181
Remeasurement gains and losses:
Return on plan assets (excluding amounts included in interest income) 4,363 16,391 20,754
Contributions by the employer (Notes 1, 2) 4,453 11,890 16,342
Contributions by plan participants — 972 972
Benefits paid (8,293) (13,378) (21,671)
Exchange differences on translation of foreign operations — 64,357 64,357
Other 306 210 516
As of March 31, 2014 109,484 356,392 465,876
Interest income 821 14,003 14,823
Remeasurement gains and losses:
Return on plan assets (excluding amounts included in interest income) 3,592 26,027 29,618
Contributions by the employer (Notes 1, 2) 3,087 9,433 12,519
Contributions by plan participants — 1,156 1,156
Benefits paid (5,425) (15,743) (21,168)
Exchange differences on translation of foreign operations — 26,811 26,811
Other (43) (1,962) (2,005)
As of December 31, 2014 ¥111,515 ¥416,117 ¥527,631
(Note 1) Pursuant to laws and regulations, the Group and the pension fund review the financial condition of the pension plan regularly and recalculate contributions for allocating future
benefit and keeping the balance of the pension financing when the plan is underfunded.
(Note 2) The Group plans to pay contributions of ¥14,350 million in the year ending December 31, 2015.
C. Reconciliation of Defined Benefit Obligations and Plan Assets
The reconciliation of the defined benefit obligations and plan assets to the net defined benefit liabilities (assets) recognized in the consoli-
dated statement of financial position as of each fiscal year end is as follows:
FY2013: As of March 31, 2014
Millions of yen
FY2013
Japan Overseas Total
Present value of the funded defined benefit obligations ¥ 115,400 ¥ 358,842 ¥ 474,242
Fair value of the plan assets (109,484) (356,392) (465,876)
Subtotal 5,916 2,450 8,365
Present value of the unfunded defined benefit obligations 204,179 111,388 315,568
Net defined benefit liabilities (assets) recognized in the consolidated statement of
financial position ¥ 210,095 ¥ 113,838 ¥ 323,933
Retirement benefit liabilities ¥ 210,096 ¥ 130,366 ¥ 340,462
Retirement benefit assets (1) (16,529) (16,530)
Net defined benefit liabilities (assets) recognized in the consolidated statement of
financial position ¥ 210,095 ¥ 113,838 ¥ 323,933
112 JAPAN TOBACCO INC. ANNUAL REPORT FY2014

FY2014: As of December 31, 2014
Millions of yen
FY2014
Japan Overseas Total
Present value of the funded defined benefit obligations ¥ 115,668 ¥ 413,149 ¥ 528,817
Fair value of the plan assets (111,515) (416,117) (527,631)
Subtotal 4,154 (2,968) 1,186
Present value of the unfunded defined benefit obligations 176,470 138,858 315,327
Net defined benefit liabilities (assets) recognized in the consolidated statement of
financial position ¥ 180,624 ¥ 135,889 ¥ 316,513
Retirement benefit liabilities ¥ 181,548 ¥ 170,367 ¥ 351,915
Retirement benefit assets (924) (34,477) (35,402)
Net defined benefit liabilities (assets) recognized in the consolidated statement of
financial position ¥ 180,624 ¥ 135,889 ¥ 316,513
D. Major Breakdown of Plan Assets
The breakdown of plan assets by major category as of each fiscal year end is as follows:
Japan
Millions of yen
FY2013 (As of March 31, 2014) FY2014 (As of December 31, 2014)
Market price in
an active market
Market price in
an active market
Quoted Unquoted Total Quoted Unquoted Total
Cash and cash equivalents ¥ 8,524 ¥ — ¥ 8,524 ¥24,172 ¥ — ¥ 24,172
Equity instruments 18,238 — 18,238 7,946 — 7,946
Japan 8,369 — 8,369 4,668 — 4,668
Overseas 9,869 — 9,869 3,278 — 3,278
Debt instruments 20,483 — 20,483 15,383 — 15,383
Japan 18,248 — 18,248 12,820 — 12,820
Overseas 2,235 — 2,235 2,563 — 2,563
Real estate 60 — 60 75 — 75
General account of life insurance companies (Note 2) — 61,330 61,330 — 63,023 63,023
Other 46 803 850 84 830 914
Total ¥47,351 ¥62,133 ¥109,484 ¥47,662 ¥63,853 ¥111,515
Overseas
Millions of yen
FY2013 (As of March 31, 2014) FY2014 (As of December 31, 2014)
Market price in
an active market
Market price in
an active market
Quoted Unquoted Total Quoted Unquoted Total
Cash and cash equivalents ¥ 19,313 ¥ — ¥ 19,313 ¥ 18,725 ¥ — ¥ 18,725
Equity instruments 139,446 — 139,446 142,301 — 142,301
United Kingdom 50,670 — 50,670 49,318 — 49,318
North America 42,537 — 42,537 39,859 — 39,859
Other 46,238 — 46,238 53,124 — 53,124
Debt instruments 167,683 4,623 172,305 218,662 5,518 224,180
United Kingdom 108,883 — 108,883 136,578 — 136,578
North America 28,553 — 28,553 46,413 — 46,413
Other 30,246 4,623 34,869 35,671 5,518 41,189
Real estate 5,479 1,199 6,679 6,225 1,051 7,276
Other 4,763 13,886 18,649 7,360 16,275 23,635
Total ¥336,684 ¥19,708 ¥356,392 ¥393,272 ¥22,844 ¥416,117
JAPAN TOBACCO INC. ANNUAL REPORT FY2014 113
FIN
AN
CIA
L S
TA
TE
ME
NTS

TotalMillions of yen
FY2013 (As of March 31, 2014) FY2014 (As of December 31, 2014)
Market price in
an active market
Market price in
an active market
Quoted Unquoted Total Quoted Unquoted Total
Cash and cash equivalents ¥ 27,837 ¥ — ¥ 27,837 ¥ 42,897 ¥ — ¥ 42,897
Equity instruments 157,684 — 157,684 150,247 — 150,247
Debt instruments 188,166 4,623 192,788 234,046 5,518 239,563
Real estate 5,539 1,199 6,738 6,300 1,051 7,351
General account of life insurance companies (Note 2) — 61,330 61,330 — 63,023 63,023
Other 4,810 14,689 19,499 7,444 17,105 24,549
Total ¥384,035 ¥81,841 ¥465,876 ¥440,934 ¥86,697 ¥527,631
(Note 1) The fair value of the plan assets is provided for each of quoted and unquoted market price in an active market as defined in IFRS 13 “Fair Value Measurement.”
(Note 2) A certain interest rate and principal for the general account of life insurance are guaranteed by life insurance companies.
The investment strategy for the Group’s major plans is as follows:
(Japan)
The Company’s pension fund is managed in accordance with the
internal policy for securing stable profits in the middle- and long-
term in order to ensure the redemption of the plan liability.
Concretely, by setting a target rate of return and composition ratio
of plan assets by asset category within the risk tolerance that is
annually assessed, the Company invests plan assets consistently
with the composition ratio. When reviewing the composition ratio,
the Company considers introducing an asset investment which
has a high correlation with the liability.
In the case where an unexpected situation occurs in the
market environment, it is temporarily allowed to make an adjust-
ment on the weight of risk assets complying with the policy.
(Overseas)
The investment strategy for the foreign subsidiaries’ funded pen-
sion plans is decided properly by the trustee of the plan or the
management of overseas subsidiaries according to local legisla-
tions. The Company’s objective for the foreign subsidiaries’ funded
pension plans is to manage risks arising from its defined benefit
obligation, and meanwhile to achieve a return on assets in excess
of the movement in the value of the defined benefit obligation.
The majority of the plan assets have been allocated to liability
matching bonds and the remaining parts of the plan assets are
mainly invested in equities targeting long-term return.
E. Matters Related to Actuarial Assumptions
The major items of actuarial assumptions as of each fiscal year end are as follows:
%
FY2013 (As of March 31, 2014) FY2014 (As of December 31, 2014)
Japan Overseas Japan Overseas
Discount rate 0.9 3.9 0.7 2.9
Inflation rate — 2.6 — 2.4
FY2013: As of March 31, 2014Years
FY2013
Japan Overseas
Males Females Males Females
Average life expectancy at retirement (Note 1)
Current pensioners23.4 (Note 2) 29.3 (Note 2)
21.2 (Note 3) 23.8 (Note 3)
Future pensioners 22.5 (Note 4) 25.1 (Note 4)
FY2014: As of December 31, 2014Years
FY2014
Japan Overseas
Males Females Males Females
Average life expectancy at retirement (Note 1)
Current pensioners23.4 (Note 2) 29.3 (Note 2)
21.7 (Note 3) 24.1 (Note 3)
Future pensioners 23.1 (Note 4) 25.6 (Note 4)
114 JAPAN TOBACCO INC. ANNUAL REPORT FY2014

(Note 1) The average life expectancies underlie the values of the defined benefit obligations on major plans. Assumptions regarding future mortality rate are based on published statics
and mortality tables.
(Note 2) Life expectancy for a pensioner currently aged 60. Regardless of the plan participant's current age, the Group performs actuarial calculations based on the assumption that life
expectancy remains the same.
(Note 3) Life expectancy for a pensioner currently aged 65
(Note 4) Life expectancy at the age of 65 for an active member currently aged 50
(Note 5) The valuation of defined benefit obligations reflects a judgment on uncertain future events. The sensitivities of defined benefit obligations due to changes in major assumptions
as of each fiscal year end are as follows. Each of these sensitivities assumes that other variables remain fixed; however, in fact, they do not always change independently.
Negative figures show a decrease in pension plan obligations, while positive figures show an increase.
Millions of yen
FY2013 (As of March 31, 2014) FY2014 (As of December 31, 2014)
Change in assumptions Japan Overseas Japan Overseas
Discount rate Increase by 0.5% ¥(11,555) ¥(32,618) ¥(11,283) ¥(40,281)
Decrease by 0.5% 12,394 36,585 12,081 44,274
Inflation rate Increase by 0.5% — 23,784 — 28,231
Decrease by 0.5% — (21,928) — (26,185)
Mortality rate Extended 1 year 7,094 15,870 6,441 17,700
Shortened 1 year (6,970) (14,384) (6,317) (17,698)
F. Breakdown of Defined Benefit Cost
The breakdown of defined benefit cost for each fiscal year is as follows:
FY2013: Year ended March 31, 2014Millions of yen
FY2013
Japan Overseas Total
Current service cost ¥12,377 ¥ 7,755 ¥ 20,132
Past service cost and gains and losses on settlement — 2,627 2,627
Interest expense (income) 1,981 3,856 5,836
Special termination benefits — 37 37
Defined benefit cost through profit or loss 14,358 14,275 28,632
Actuarial gains and losses arising from changes in demographic assumptions 4 4,211 4,215
Actuarial gains and losses arising from changes in financial assumptions (679) 1,173 494
Actuarial gains and losses arising from experience adjustments (86) 3,029 2,943
Return on plan assets (excluding amounts included in interest income) (4,363) (16,391) (20,754)
Defined benefit cost through other comprehensive income ¥ (5,125) ¥ (7,978) ¥(13,103)
Total of defined benefit cost ¥ 9,233 ¥ 6,297 ¥ 15,530
FY2014: Nine months ended December 31, 2014Millions of yen
FY2014
Japan Overseas Total
Current service cost ¥ 9,957 ¥ 9,028 ¥ 18,984
Past service cost and gains and losses on settlement 590 (1,293) (703)
Interest expense (income) 1,314 4,099 5,413
Defined benefit cost through profit or loss 11,861 11,834 23,695
Actuarial gains and losses arising from changes in demographic assumptions (4) 3,120 3,116
Actuarial gains and losses arising from changes in financial assumptions 5,539 47,891 53,430
Actuarial gains and losses arising from experience adjustments (2,571) (5,648) (8,219)
Return on plan assets (excluding amounts included in interest income) (3,592) (26,027) (29,618)
Defined benefit cost through other comprehensive income ¥ (628) ¥ 19,336 ¥ 18,708
Total of defined benefit cost ¥11,233 ¥ 31,170 ¥ 42,403
(Note 1) The net amount of interest expense and interest income is included in “Financial costs.” Other expenses are included in “Cost of sales” and “Selling, general and administra-
tive expenses.”
(Note 2) Contributions to the defined contribution plans were ¥6,224 million for the year ended March 31, 2014 and ¥6,833 million for the nine months ended December 31, 2014
and were not included in the table above.
JAPAN TOBACCO INC. ANNUAL REPORT FY2014 115
FIN
AN
CIA
L S
TA
TE
ME
NTS

(2) Other Employee Benefit Expenses The employee benefit expenses other than post-employment benefits that are included in the consolidated statement of income for each
fiscal year are as follows:
Millions of yen
FY2013(Year ended March 31, 2014)
FY2014(Nine months ended December 31, 2014)
Remuneration and salary ¥247,730 ¥231,254
Bonus to employees 70,066 55,648
Legal welfare expenses 45,994 45,544
Welfare expenses 26,696 30,660
Termination benefits (242) 61,621
23. Equity and Other Equity Items
(1) Share Capital and Capital SurplusA. Authorized Shares
The number of authorized shares as of March 31, 2014 and as of December 31, 2014 is 8,000,000 thousand ordinary shares.
B. Fully Paid Issued Shares
The schedule of the number of issued shares and share capital is as follows:
Thousands of shares Millions of yen
Number of ordinary
issued shares Share capital Capital surplus
As of April 1, 2013 2,000,000 ¥100,000 ¥736,411
Increase (decrease) — — (11)
As of March 31, 2014 2,000,000 100,000 736,400
Increase (decrease) — — —
As of December 31, 2014 2,000,000 ¥100,000 ¥736,400
(Note) The shares issued by the Company are non-par value ordinary shares that have no restriction on any content of rights.
(2) Treasury SharesThe schedule of the number of treasury shares and its amount as of each fiscal year end is as follows:
Thousands of shares Millions of yen
Number of shares Amount
As of April 1, 2013 182,510 ¥344,573
Increase (decrease) (Notes 2) (58) (110)
As of March 31, 2014 182,452 344,463
Increase (decrease) (Note 2) (9) (16)
As of December 31, 2014 182,443 ¥344,447
(Note 1) The Company adopts share option plans and utilizes treasury shares for delivery of shares due to its exercise. Contract conditions and amount are described in
“32. Share-based Payments.”
(Note 2) The decrease of treasury shares is due to the exercise of share option.
(3) Other Components of EquityA. Subscription rights to shares
The Company adopts share option plans and issues subscription
rights to shares based on the Companies Act. Contract conditions
and amount are described in “32. Share-based Payments.”
B. Exchange differences on translation of foreign operations
Exchange differences on translation of foreign operations are
composed of foreign currency translation difference that occurs
when consolidating financial statements of foreign subsidiaries
prepared in foreign currencies, and the effective portion of net
gain (loss) on the hedging instruments designated as hedge of
net investment.
C. Net gain (loss) on derivatives designated as cash flow
hedges
The Company uses derivatives for hedging to avoid the risk of
fluctuation in future cash flows. This is the effective portion of
changes in the fair value of derivative transactions designated as
cash flow hedges.
116 JAPAN TOBACCO INC. ANNUAL REPORT FY2014

D. Net gain (loss) on revaluation of financial assets measured
at fair value through other comprehensive income
This is the valuation difference in the fair value of financial assets
measured at fair value through other comprehensive income.
E. Remeasurements of defined benefit plans
Remeasurements of defined benefit plans comprise actuarial gains
and losses, the return on plan assets excluding amounts included
in interest income, and any change in the effect of the asset ceil-
ing excluding amounts included in interest income. In addition,
actuarial gains and losses are the effects of differences between
the actuarial assumptions at the beginning of the year and what
has actually occurred, and the effects of changes in actuarial
assumptions. Remeasurements are recognized as other compre-
hensive income when occurred and are transferred immediately
from other components of equity to retained earnings.
24. Dividends
Dividends paid for each fiscal year are as follows:
FY2013: Year ended March 31, 2014
FY2013
Millions of yen Yen
Class of shares Total dividends Dividends per share Basis date Effective date
(Resolution)
Annual Shareholders Meeting
(June 21, 2013) Ordinary shares ¥69,065 ¥38 March 31, 2013 June 24, 2013
Board of Directors
(October 31, 2013) Ordinary shares 83,605 46 September 30, 2013 November 29, 2013
FY2014: Nine months ended December 31, 2014
FY2014
Millions of yen Yen
Class of shares Total dividends Dividends per share Basis date Effective date
(Resolution)
Annual Shareholders Meeting
(June 24, 2014) Ordinary shares ¥90,877 ¥50 March 31, 2014 June 25, 2014
Board of Directors
(October 30, 2014) Ordinary shares 90,878 50 September 30, 2014 December 1, 2014
Dividends, for which the effective date falls in the following fiscal year, are as follows:
FY2013: Year ended March 31, 2014
FY2013
Millions of yen Yen
Class of shares Total dividends Dividends per share Basis date Effective date
(Resolution)
Annual Shareholders Meeting
(June 24, 2014) Ordinary shares ¥90,877 ¥50 March 31, 2014 June 25, 2014
FY2014: Nine months ended December 31, 2014
FY2014
Millions of yen Yen
Class of shares Total dividends Dividends per share Basis date Effective date
(Resolution)
Annual Shareholders Meeting
(March 20, 2015) Ordinary shares ¥90,878 ¥50 December 31, 2014 March 23, 2015
JAPAN TOBACCO INC. ANNUAL REPORT FY2014 117
FIN
AN
CIA
L S
TA
TE
ME
NTS
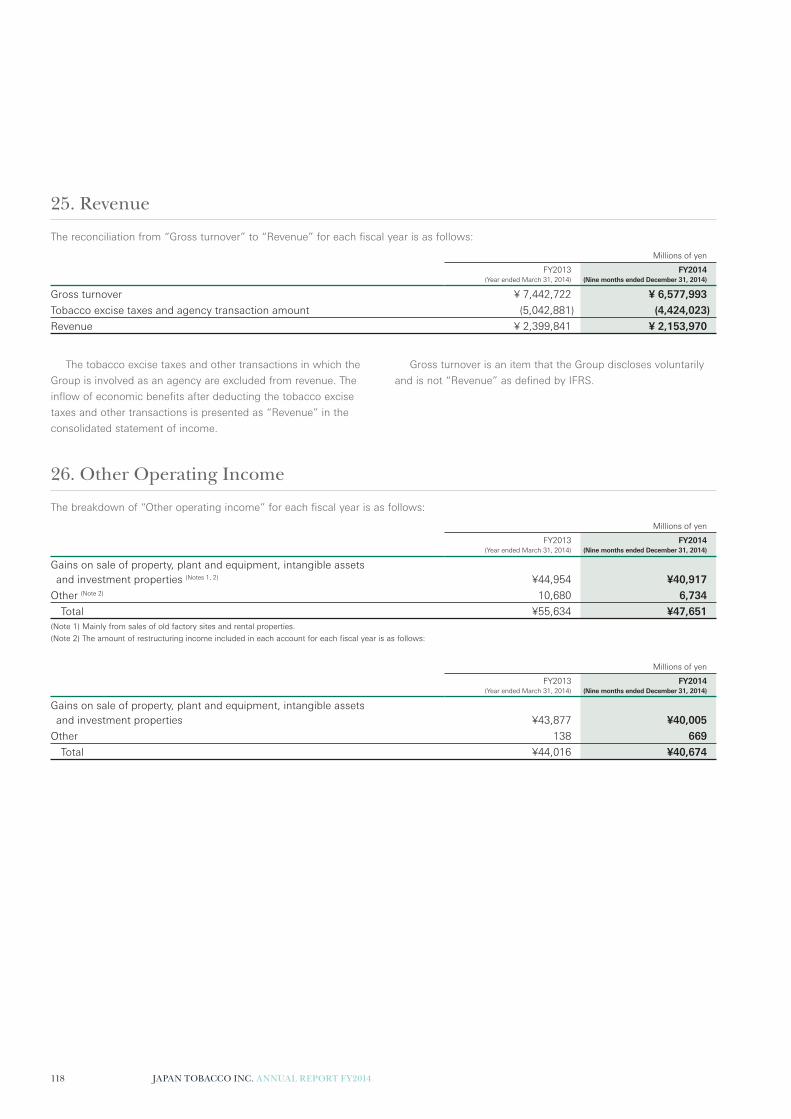
25. Revenue
The reconciliation from “Gross turnover” to “Revenue” for each fiscal year is as follows:
Millions of yen
FY2013(Year ended March 31, 2014)
FY2014(Nine months ended December 31, 2014)
Gross turnover ¥ 7,442,722 ¥ 6,577,993
Tobacco excise taxes and agency transaction amount (5,042,881) (4,424,023)
Revenue ¥ 2,399,841 ¥ 2,153,970
The tobacco excise taxes and other transactions in which the
Group is involved as an agency are excluded from revenue. The
inflow of economic benefits after deducting the tobacco excise
taxes and other transactions is presented as “Revenue” in the
consolidated statement of income.
Gross turnover is an item that the Group discloses voluntarily
and is not “Revenue” as defined by IFRS.
26. Other Operating Income
The breakdown of “Other operating income” for each fiscal year is as follows:
Millions of yen
FY2013(Year ended March 31, 2014)
FY2014(Nine months ended December 31, 2014)
Gains on sale of property, plant and equipment, intangible assets
and investment properties (Notes 1, 2) ¥44,954 ¥40,917
Other (Note 2) 10,680 6,734
Total ¥55,634 ¥47,651(Note 1) Mainly from sales of old factory sites and rental properties.
(Note 2) The amount of restructuring income included in each account for each fiscal year is as follows:
Millions of yen
FY2013(Year ended March 31, 2014)
FY2014(Nine months ended December 31, 2014)
Gains on sale of property, plant and equipment, intangible assets
and investment properties ¥43,877 ¥40,005
Other 138 669
Total ¥44,016 ¥40,674
118 JAPAN TOBACCO INC. ANNUAL REPORT FY2014

27. Selling, General and Administrative Expenses
The breakdown of “Selling, general and administrative expenses” for each fiscal year is as follows:
Millions of yen
FY2013(Year ended March 31, 2014)
FY2014(Nine months ended December 31, 2014)
Advertising expenses ¥ 21,736 ¥ 21,258Promotion expenses 147,793 129,998Shipping, warehousing expenses 27,089 21,092Commission 49,294 46,136Employee benefit expenses (Note 2) 275,831 321,410Research and development expenses (Note 1) 57,103 43,998Depreciation and amortization 68,767 63,092Impairment losses on other than financial assets (Note 2) 2,446 21,877Impairment losses of investments in associates 9,717 —Losses on sale and disposal of property, plant and equipment, intangible assets,
and investment property (Note 2) 9,467 14,077Other (Note 2) 159,699 140,471
Total ¥828,942 ¥823,410(Note 1) All research and development expenses are included in “Selling, general and administrative expenses.”
(Note 2) The amount of restructuring costs included in each account is as follows:
Millions of yen
FY2013(Year ended March 31, 2014)
FY2014(Nine months ended December 31, 2014)
Employee benefit expenses ¥ (205) ¥ 66,814Impairment losses on other than financial assets 668 18,078Losses on sale and disposal of property, plant and equipment, intangible assets,
and investment property 1,650 5,111Other 2,749 10,333
Total ¥4,862 ¥100,335
28. Financial Income and Financial Costs
The breakdown of “Financial income” and “Financial costs” for each fiscal year is as follows:
Financial Income
Millions of yen
FY2013(Year ended March 31, 2014)
FY2014(Nine months ended December 31, 2014)
Dividend income
Financial assets measured at fair value through other comprehensive income ¥1,520 ¥ 691Interest income
Financial assets measured at amortized cost
Deposits and bonds 6,413 12,870Other 418 287
Total ¥8,351 ¥13,847
JAPAN TOBACCO INC. ANNUAL REPORT FY2014 119
FIN
AN
CIA
L S
TA
TE
ME
NTS

Financial Costs
Millions of yen
FY2013(Year ended March 31, 2014)
FY2014(Nine months ended December 31, 2014)
Interest expenses
Financial liabilities measured at amortized cost
Bonds and borrowings (Note 2) ¥ 8,144 ¥ 4,293Other 468 357
Foreign exchange losses (Note 1) 4,728 426Employee benefit expenses (Note 3) 5,836 5,413Other 1,233 815
Total ¥20,408 ¥11,304
(Note 1) Valuation gain (loss) of currency derivatives is included in the foreign exchange losses.
(Note 2) Valuation gain (loss) of interest rate derivatives is included in interest expenses.
(Note 3) The employee benefit expenses are the net amount of interest cost and interest income related to employee benefits.
29. Other Comprehensive Income
Amount arising during year, reclassification adjustments to profit or loss and tax effects for each component of “Other comprehensive
income” for each fiscal year are as follows:
FY2013: Year ended March 31, 2014Millions of yen
FY2013
Amount arising
Reclassification
adjustments
Before tax
effects Tax effects
Net of
tax effects
Items that will not be reclassified to profit or loss
Net gain (loss) on revaluation of financial assets measured
at fair value through other comprehensive income ¥ 7,235 ¥ — ¥ 7,235 ¥(2,509) ¥ 4,725
Remeasurements of defined benefit plans 13,103 — 13,103 (4,279) 8,824
Total of items that will not be reclassified to profit or loss ¥ 20,337 ¥ — ¥ 20,337 ¥(6,788) ¥ 13,549
Items that may be reclassified subsequently to profit or loss
Exchange differences on translation of foreign operations ¥400,578 ¥ (32) ¥400,546 ¥ 395 ¥400,941
Net gain (loss) on derivatives designated as cash flow hedges 4,444 (3,700) 744 (264) 481
Total of items that may be reclassified subsequently to
profit or loss ¥405,022 ¥(3,733) ¥401,290 ¥ 131 ¥401,421
Total ¥425,360 ¥(3,733) ¥421,627 ¥(6,657) ¥414,970
FY2014: Nine months ended December 31, 2014Millions of yen
FY2014
Amount arising
Reclassification
adjustments
Before tax
effects Tax effects
Net of
tax effects
Items that will not be reclassified to profit or loss
Net gain (loss) on revaluation of financial assets measured
at fair value through other comprehensive income ¥ 5,895 ¥ — ¥ 5,895 ¥(2,171) ¥ 3,725
Remeasurements of defined benefit plans (18,708) — (18,708) 4,544 (14,164)
Total of items that will not be reclassified to profit or loss ¥ (12,813) ¥ — ¥ (12,813) ¥ 2,374 ¥ (10,439)
Items that may be reclassified subsequently to profit or loss
Exchange differences on translation of foreign operations ¥(117,734) ¥ (122) ¥(117,856) ¥ 3,614 ¥(114,242)
Net gain (loss) on derivatives designated as cash flow hedges 10,998 (9,570) 1,428 (506) 922
Total of items that may be reclassified subsequently to
profit or loss ¥(106,736) ¥(9,693) ¥(116,428) ¥ 3,109 ¥(113,319)
Total ¥(119,548) ¥(9,693) ¥(129,241) ¥ 5,483 ¥(123,759)
120 JAPAN TOBACCO INC. ANNUAL REPORT FY2014

30. Earnings per Share
(1) Basis of Calculating Basic Earnings per ShareA. Profit Attributable to Ordinary Shareholders of the Parent Company
Millions of yen
FY2013(Year ended March 31, 2014)
FY2014(Nine months ended December 31, 2014)
Profit attributable to owners of the parent company ¥427,987 ¥362,919
Profit not attributable to ordinary shareholders of the parent company — —
Profit used for calculation of basic earnings per share ¥427,987 ¥362,919
B. Weighted-average Number of Ordinary Shares Outstanding During the Period
Thousands of shares
FY2013(Year ended March 31, 2014)
FY2014(Nine months ended December 31, 2014)
Weighted-average number of shares during the period 1,817,507 1,817,553
(2) Basis of Calculating Diluted Earnings per ShareA. Profit Attributable to Diluted Ordinary Shareholders
Millions of yen
FY2013(Year ended March 31, 2014)
FY2014(Nine months ended December 31, 2014)
Profit used for calculation of basic earnings per share ¥427,987 ¥362,919
Adjustment — —
Profit used for calculation of diluted earnings per share ¥427,987 ¥362,919
B. Weighted-average Number of Diluted Ordinary Shares Outstanding During the Period
Thousands of shares
FY2013(Year ended March 31, 2014)
FY2014(Nine months ended December 31, 2014)
Weighted-average number of ordinary shares during the period 1,817,507 1,817,553
Increased number of ordinary shares under subscription rights to shares 1,014 1,048
Weighted-average number of diluted ordinary shares during the period 1,818,521 1,818,601
(3) Adjusted Diluted Earnings per Share Millions of yen
FY2013(Year ended March 31, 2014)
FY2014(Nine months ended December 31, 2014)
Profit used for calculation of adjusted diluted earnings per share ¥427,987 ¥362,919
Adjustment items (income) (47,047) (44,302)
Adjustment items (costs) 14,580 103,641
Adjustments on income taxes and non-controlling interests 11,856 (13,534)
Adjusted profit for the period ¥407,377 ¥408,724
Adjusted diluted earnings per share (yen) ¥ 224.02 ¥ 224.75
31. Non-cash Transactions
Significant Non-cash Transactions
The amount of assets acquired under finance leases was ¥5,835 million for the year ended March 31, 2014 and ¥9,199 million for the
nine months ended December 31, 2014, respectively.
JAPAN TOBACCO INC. ANNUAL REPORT FY2014 121
FIN
AN
CIA
L S
TA
TE
ME
NTS

32. Share-based Payments
The Company adopts share option plans. Share options are
granted by the resolution of the Board of Directors based on the
approval at the Annual Shareholders Meeting.
The outline of the share option plan is as follows:
(1) Share Option Contract Conditions Positions of persons granted : Directors and Executive
Officers
Settlement : Issuance of share
Effective period of granted share option : 30 years after the date
of grant
Vesting conditions : None
Conditions related to the exercise of share options are as
follows:
(a) The subscription rights to shares become exercisable when a
holder of a subscription right to shares no longer holds a posi-
tion as a director, an audit & supervisory board member or an
executive officer. In the subscription rights to shares allocation
contract with holders of such rights, it is provided for that the
rights become exercisable from the date following the date on
which one year has elapsed after leaving their positions (how-
ever, the rights become exercisable even within one year after
leaving their positions only in the case where the Board of
Directors find it to be unavoidable).
(b) In the case where any holders of subscription rights to shares
waive such rights, they cannot exercise them.
(2) Changes in the Number of Share OptionsShares
FY2013 (Year ended March 31, 2014) FY2014 (Nine months ended December 31, 2014)
Directors
Executive
Officers Total Directors
Executive
Officers Total
Balance at the beginning of the period 324,400 644,600 969,000 351,000 659,800 1,010,800
Granted 42,000 58,000 100,000 35,600 33,200 68,800
Exercised — (58,200) (58,200) — (8,600) (8,600)
Transfer (15,400) 15,400 — (110,800) 110,800 —
Balance at the end of the period 351,000 659,800 1,010,800 275,800 795,200 1,071,000
Exercisable balance at the end of the period — 332,800 332,800 — 341,000 341,000
(Note 1) The number of share options is presented as the number of underlying shares.
(Note 2) All share options are granted with an exercise price of ¥1 per share.
(Note 3) Share options were granted to 7 directors and 19 executive officers for the year ended March 31, 2014, and 6 directors and 19 executive officers for the nine months ended
December 31, 2014.
“Transfer” included in the “Changes in the Number of Share Options” represents the number of share options for persons granted whose management position changed
during the period.
(Note 4) The weighted-average fair values per share of share options granted during the period were ¥2,567 and ¥2,416 for the year ended March 31, 2014 and for the nine months
ended December 31, 2014, respectively.
(Note 5) The weighted-average share prices of share options at the time of exercise during the period were ¥3,445 and ¥3,600 for the year ended March 31, 2014 and for the nine
months ended December 31, 2014, respectively.
(Note 6) The weighted-average remaining contract year of unexercised share options at the end of each period was 26.7 years and 26.2 years for the year ended March 31, 2014
and for the nine months ended December 31, 2014, respectively.
(3) Method of Measuring Fair Value of Share Options Granted During the PeriodA. Valuation Model
Black-Scholes Model
B. Main Assumptions and Estimation
FY2013(Year ended March 31, 2014)
FY2014(Nine months ended December 31, 2014)
Share price ¥3,450 ¥3,603
Volatility of share price (Note 1) 36.1% 34.6%
Estimated remaining period (Note 2) 15 years 15 years
Estimated dividends (Note 3) ¥68/share ¥96/share
Risk free interest rate (Note 4) 1.10% 0.93%
(Note 1) Calculated based on daily share prices quoted for the past 15 years
(Note 2) With difficulty in reasonable estimation due to insufficient data, the remaining period is estimated based on the assumption that share option rights would be exercised at
a midpoint of the exercise period.
(Note 3) Based on the latest dividends paid
(Note 4) The yield on government bonds for a period of the expected remaining period
122 JAPAN TOBACCO INC. ANNUAL REPORT FY2014

(4) Share-based Payment ExpensesThe costs for share options included in “Selling, general and administrative expenses” in the consolidated statement of income were
¥251 million for the year ended March 31, 2014, and ¥202 million for the nine months ended December 31, 2014.
33. Financial Instruments
(1) Capital ManagementThe Group’s management principle is pursuit of the “4S” model:
balancing the interests of consumers, shareholders, employees
and wider society, and fulfilling our responsibilities towards them,
aiming to exceed their expectations.
The Group believes that sustainable profit growth in the mid-
to long-term based on this principle will increase the Group’s
value in the mid- to long-term, and is consequently in the best
interest of all stakeholders, including our shareholders.
The Group understands that it is inevitable to maintain a suf-
ficient financing capacity in order to make agile business invest-
ments which link to sustainable growth such as acquisitions of
external resources. For that reason, the Group aims to maintain a
well-balanced capital structure that ensures an appropriate return
on equity and to maintain a sound and flexible financial condition
for future business investments.
The Group manages net interest-bearing debt, where cash and cash equivalents are deducted from interest-bearing debt, and capital
(the part attributable to the owners of the parent company). The amounts as of each fiscal year end are as follows:
Millions of yen
FY2013(As of March 31, 2014)
FY2014(As of December 31, 2014)
Interest-bearing debt ¥ 375,881 ¥ 228,214
Cash and cash equivalents (253,219) (385,820)
Net interest-bearing debt (Note) 122,662 (157,605)
Capital (equity attributable to owners of the parent company) 2,505,610 2,536,838
(Note) The figure in parentheses ( ) represents the net amount of cash and cash equivalents after deducting interest-bearing debt.
There are specific rules for shares of the Company under the
Japan Tobacco Inc. Act as follows:
The Japanese government shall hold more than one-third of
all of the shares issued by the Company (excluding the type of
shares, for which it is stipulated that voting rights may not be
exercised on any matters that can be resolved by Annual
Shareholders Meeting) (Article 2 (1)).
In cases where the Company intends to solicit persons to
subscribe for shares to be issued or subscription rights to shares
or where the Company intends to deliver shares (excluding trea-
sury shares), subscription rights to shares (excluding subscription
right to own shares) or bonds with subscription right to shares
(excluding bonds with subscription rights to shares) when
exchanging with shares, the Company shall obtain the approval
of the Minister of Finance (Article 2 (2)).
Disposal of shares owned by the Japanese government shall
be within the limits on the number of shares decided by the Diet
in the relevant annual budget (Article 3).
The Group monitors financial indicators in order to maintain a
well-balanced capital structure that ensures an appropriate return
on equity and a sound and flexible financial condition for future
investment. We monitor credit ratings for financial soundness
and flexibility, and ROE (return on equity) for profitability, while
focusing on changes in the domestic and overseas environment.
(2) Financial Risk ManagementThe Group is exposed to financial risks (credit risks, liquidity risks,
foreign exchange risks, interest rate risks, and market price fluc-
tuation risks) in the process of its management activities; and it
manages risks based on a specific policy in order to avoid or
reduce said risks. The results of risk management are regularly
reported by the Treasury Division to the president and the Board
of Directors of the Company.
The Group policy limits derivatives to transactions for the
purpose of mitigating risks from transactions based on actual
demand. Therefore, we do not transact derivatives for speculation
purposes or trading purposes.
(3) Credit RiskReceivables, such as note and account receivables, acquired from
the operating activities of the Group are exposed to customer
credit risk.
The Group holds mainly debt securities for surplus investment
and equity securities of customers and suppliers to strengthen
relationships with them; those securities are exposed to the issu-
er’s credit risk. In addition, through derivative transactions that the
Group conducts in order to hedge foreign exchange fluctuation
risks and interest rate fluctuation risks, we are exposed to the
credit risk of the financial institutions which are counterparties to
these transactions.
JAPAN TOBACCO INC. ANNUAL REPORT FY2014 123
FIN
AN
CIA
L S
TA
TE
ME
NTS

In principle, the Group sets credit lines or transaction condi-
tions with respect to trade receivables for counterparties based on
the Credit Management Guidelines in order to control the credit
risk relating to counterparties. In addition, the receivable balances
of counterparties with high credit risk are monitored. The Treasury
Division of the Company regularly monitors the status of the
occurrence and collection of bad debts, and reports them to
the president and the Board of Directors of the Company.
With regard to the investment of cash surpluses and deriva-
tives, the Group invests in debt securities and other financial
instruments with a certain credit rating and transacts with finan-
cial institutions with a high credit rating in principle in order to
prevent credit risks from occurring and based on the Group
Financial Operation Basic Policy. In addition, the Treasury Division
of the Company regularly monitors the performances of these
transactions and reports the results to the president and the Board
of Directors of the Company.
The maximum exposure pertaining to credit risks for financial
assets is the carrying amount after considering impairment in
the consolidated financial statements.
The analysis of the aging of financial assets that are past due but not impaired as of each fiscal year end date is as follows:
The financial assets include amounts considered recoverable by credit insurance and collateral.
FY2013: As of March 31, 2014
Millions of yen
FY2013
Amount past due
Total Within 30 days
Over 30 days,
within 60 days
Over 60 days,
within 90 days Over 90 days
Trade and other receivables ¥6,271 ¥5,353 ¥612 ¥140 ¥165
Other financial assets 86 — — — 86
FY2014: As of December 31, 2014
Millions of yen
FY2014
Amount past due
Total Within 30 days
Over 30 days,
within 60 days
Over 60 days,
within 90 days Over 90 days
Trade and other receivables ¥2,518 ¥1,515 ¥696 ¥252 ¥55
Other financial assets 86 — — — 86
The Group reviews collectability of trade receivables depending on the credit conditions of counterparties and recognizes allowance for
doubtful accounts. The schedule of the allowance of doubtful accounts is as follows:Millions of yen
FY2013(Year ended March 31, 2014)
FY2014(Nine months ended December 31, 2014)
Balance at the beginning of the period ¥10,681 ¥10,620
Addition 1,486 782
Decrease (intended use) (1,609) (616)
Decrease (reversal) (480) (378)
Other 541 187
Balance at the end of the period ¥10,620 ¥10,595
(4) Liquidity Risk The Group raises funds by borrowings, commercial paper and
bonds; however, these liabilities are exposed to the liquidity risk
that we would not be able to repay liabilities on the due date due
to the deterioration of the financing environment.
In accordance with the Group Financial Operation Basic Policy,
the Group establishes a finance plan based on the annual
business plan and the Treasury Division of the Company regularly
monitors and collects information on the balance of liquidity-
in-hand and interest-bearing debt and reports it to the president
and the Board of Directors of the Company. In addition, the Group
keeps necessary credit facilities to manage liquidity risk by having
commitment lines with several financial institutions.
124 JAPAN TOBACCO INC. ANNUAL REPORT FY2014

The financial liability balance (including derivative financial instruments) by maturity as of each fiscal year end is as follows:
FY2013: As of March 31, 2014
Millions of yen
FY2013
Carrying
amount
Contractual
cash flow
Due within
one year
Due after
one year
through
two years
Due after
two years
through
three years
Due after
three years
through
four years
Due after
four years
through
five years
Due after
five years
Non-derivative financial liabilities
Trade and other payables ¥360,025 ¥360,025 ¥360,025 ¥ — ¥ — ¥ — ¥ — ¥ —
Short-term borrowings 21,936 21,936 21,936 — — — — —
Current portion of long-term borrowings 1,225 1,225 1,225 — — — — —
Long-term borrowings 35,034 35,034 — 34,096 131 133 135 539
Current portion of bonds 172,401 172,412 172,412 — — — — —
Bonds 131,131 131,460 — 40,000 — 20,000 51,460 20,000
Subtotal 721,752 722,092 555,599 74,096 131 20,133 51,595 20,539
Derivative financial liabilities
Foreign exchange forward contract 4,681 4,681 4,681 — — — — —
Interest rate swap 175 166 103 62 — — — —
Subtotal 4,856 4,846 4,784 62 — — — —
Total ¥726,608 ¥726,939 ¥560,383 ¥74,158 ¥131 ¥20,133 ¥51,595 ¥20,539
FY2014: As of December 31, 2014
Millions of yen
FY2014
Carrying
amount
Contractual
cash flow
Due within
one year
Due after
one year
through
two years
Due after
two years
through
three years
Due after
three years
through
four years
Due after
four years
through
five years
Due after
five years
Non-derivative financial liabilities
Trade and other payables ¥419,764 ¥419,764 ¥419,764 ¥ — ¥ — ¥ — ¥ — ¥ —
Short-term borrowings 27,632 27,632 27,632 — — — — —
Current portion of long-term borrowings 39,930 39,930 39,930 — — — — —
Long-term borrowings 1,046 1,046 — 146 149 151 97 503
Current portion of bonds 40,000 40,000 40,000 — — — — —
Bonds 99,954 100,275 — — 20,000 60,275 — 20,000
Subtotal 628,326 628,647 527,325 146 20,149 60,426 97 20,503
Derivative financial liabilities
Foreign exchange forward contract 9,901 9,901 9,901 — — — — —
Interest rate swap 109 97 95 1 — — — —
Subtotal 10,010 9,998 9,997 1 — — — —
Total ¥638,336 ¥638,644 ¥537,322 ¥147 ¥20,149 ¥60,426 ¥97 ¥20,503
The total of commitment lines and withdrawal as of each fiscal year end are as follows:
Millions of yen
FY2013(As of March 31, 2014)
FY2014(As of December 31, 2014)
Total committed line of credit ¥364,826 ¥386,492
Withdrawing — —
Unused balance ¥364,826 ¥386,492
JAPAN TOBACCO INC. ANNUAL REPORT FY2014 125
FIN
AN
CIA
L S
TA
TE
ME
NTS

(5) Foreign Exchange RiskThe Group operates businesses globally and, therefore, is exposed
to the following risks due to foreign exchange fluctuation:
(i) The risk where the profit or loss and cash flow in each func-
tional currency of the Group is influenced by foreign exchange
fluctuation as a result of external transactions and intergroup
transactions, including the payment and receipt of dividends,
in currencies that are different from each functional currency
of the Group.
(ii) The risk that the equity of the Group is influenced by foreign
exchange fluctuation when equity denominated in each func-
tional currency of the Group is translated into Japanese yen
and consolidated.
(iii) The risk that the profit or loss of the Group is influenced by
foreign exchange fluctuation when profit or loss denominated
in each functional currency of the Group is translated into
Japanese yen and consolidated.
The Group hedges against risk (i) using derivatives or foreign
currency-denominated interest-bearing debts for example, when
future cash flow is projected or when receivables and payables
are fixed.
The Group hedges against risk (ii) using foreign currency-
denominated interest-bearing debts for example, and part of these
are designated as net investment hedges. The Group does not
hedge against risk (iii) in principle.
In order to mitigate risks mentioned above resulting from
the foreign exchange fluctuation, in accordance with the Group
Financial Operation Basic Policy, the Group establishes a foreign
currency hedge policy based on the current conditions and fore-
cast of the foreign exchange market, implement the aforemen-
tioned hedges under the supervision of the Financial Risk
Management Committee of the Company, and the Treasury
Division of the Company regularly reports the performances to
the president and the Board of Directors of the Company.
The breakdown of currency derivatives is follows:
(i) Derivative transactions to which hedge accounting is not applied
Millions of yen
FY2013 (As of March 31, 2014) FY2014 (As of December 31, 2014)
Contract amount Over one year Fair value Contract amount Over one year Fair value
Foreign exchange forward contract
Buying ¥269,718 ¥ — ¥ 764 ¥293,425 ¥ — ¥15,797
Selling 307,880 — (1,937) 285,503 — (9,419)
Total ¥577,598 ¥ — ¥(1,173) ¥578,928 ¥ — ¥ 6,379
(ii) Derivative transactions to which hedge accounting is applied
Millions of yen
FY2013 (As of March 31, 2014) FY2014 (As of December 31, 2014)
Contract amount Over one year Fair value (Note) Contract amount Over one year Fair value (Note)
Foreign exchange forward contract
Buying ¥14,122 ¥ — ¥505 ¥13,950 ¥ — ¥1,899
Total ¥14,122 ¥ — ¥505 ¥13,950 ¥ — ¥1,899
(Note): Cash flow hedge or fair value hedge is applied, and derivative transactions are recognized at fair value in the consolidated statement of financial position.
Foreign currency-denominated interest-bearing debts, for example, are designated as hedging instruments for the Group in order to
reduce fluctuation risk of foreign currency translation differences that are incurred by translating net investment in foreign operations into
the reporting currency.
Bonds designated as hedging instruments as of each fiscal year end are as follows:
Millions of yen
FY2013 (As of March 31, 2014) FY2014 (As of December 31, 2014)
Carrying amount Due Carrying amount Due
Bonds in EUR ¥64,448 2014 ¥ — —
Bonds in USD 33,120 2018 38,858 2018
Foreign Exchange Sensitivity Analysis
In cases where each currency other than the functional currency
that denominates the financial instruments held by the Group as
of each fiscal year end increases by 10% in value against the
functional currency, the impact on profit before income taxes in
the consolidated statement of income is as follows:
126 JAPAN TOBACCO INC. ANNUAL REPORT FY2014

The impact from the translation of functional currency-
denominated financial instruments, and assets, liabilities, income
and expenses of foreign operations into Japanese yen is not
included. Also, it is based on the assumption that currencies other
than the currencies used for the calculation do not fluctuate.
Millions of yen
FY2013(As of March 31, 2014)
FY2014 (As of December 31, 2014)
Profit before income taxes ¥(4,262) ¥(3,255)
(6) Interest Rate RiskInterest rate risk within the Group arises from interest-bearing
debts after deducting cash equivalents. Borrowings and bonds
with floating rates are exposed to interest rate fluctuation risk.
In accordance with the Group Financial Operation Basic Policy,
the Group establishes an interest rate hedging policy based on the
current condition and the forecast of the interest rates to reduce
the interest rate fluctuation risk related to borrowings and bonds,
implement the hedges using derivatives under the supervision of
the Financial Risk Management Committee of the Company and
the Treasury Division of the Company reports the performances to
the president and the Board of Directors of the Company.
The descriptions of interest rate derivatives are as follows:
(i) Derivative transactions to which hedge accounting is not applied
Millions of yen
FY2013 (As of March 31, 2014) FY2014 (As of December 31, 2014)
Contract amount Over one year Fair value Contract amount Over one year Fair value
Interest rate swap
Floating rate receipt and fixed rate payment ¥2,607 ¥2,607 ¥(175) ¥2,880 ¥2,880 ¥(109)
Total ¥2,607 ¥2,607 ¥(175) ¥2,880 ¥2,880 ¥(109)
(ii) Derivative transactions to which hedge accounting is applied
Millions of yen
FY2013 (As of March 31, 2014) FY2014 (As of December 31, 2014)
Contract amount Over one year Fair value (Note) Contract amount Over one year Fair value (Note)
Cross currency swap
Floating rate receipt and fixed rate payment ¥30,000 ¥30,000 ¥3,866 ¥30,000 ¥ — ¥ 9,731
Fixed rate receipt and fixed rate payment 17,439 17,439 721 17,439 17,439 3,927
Total ¥47,439 ¥47,439 ¥4,587 ¥47,439 ¥17,439 ¥13,658
(Note) Cash flow hedge is applied, and derivative transactions are recognized at fair value in the consolidated statement of financial position.
Interest Rate Sensitivity Analysis
In cases where the interest rate of financial instruments held
by the Group as of each fiscal year end increases by 100bp,
the impact on profit before income taxes in the consolidated
statement of income is as follows:
The analysis is subject to financial instruments affected by
interest rate fluctuation and based on the assumption that other
factors, including the impacts of foreign exchange fluctuation,
are constant.
Millions of yen
FY2013(As of March 31, 2014)
FY2014 (As of December 31, 2014)
Profit before income taxes ¥(634) ¥1,589
(7) Market Price Fluctuation Risk With respect to securities, the Group regularly assesses the fair value and financial conditions of the issuers, and each relevant depart-
ment reviews the portfolio held by taking into account the relationship with counterparty entities as necessary.
JAPAN TOBACCO INC. ANNUAL REPORT FY2014 127
FIN
AN
CIA
L S
TA
TE
ME
NTS

(8) Fair Value of Financial Instruments The fair value hierarchy of financial instruments is categorized from Level 1 to Level 3 as follows:
Level 1: Fair value measured at the quoted price in the active market
Level 2: Fair value that is calculated using the observable price other than categorized in Level 1 directly or indirectly
Level 3: Fair value that is calculated based on valuation techniques which include inputs that are not based on observable market data
(i) Financial instruments measured at amortized cost
The carrying amount and fair value hierarchy of financial instruments measured at amortized cost as of each fiscal year end are as follows:
FY2013: As of March 31, 2014
Millions of yen
FY2013
Fair value
Carrying amount Level 1 Level 2 Level 3 Total
Long-term borrowings (Note) ¥ 36,259 ¥ — ¥ — ¥36,259 ¥ 36,259
Bonds (Note) 303,532 309,025 — — 309,025
FY2014: As of December 31, 2014
Millions of yen
FY2014
Fair value
Carrying amount Level 1 Level 2 Level 3 Total
Long-term borrowings (Note) ¥ 40,976 ¥ — ¥ — ¥40,976 ¥ 40,976
Bonds (Note) 139,954 142,586 — — 142,586
(Note) Current portion is included.
With regard to short-term financial assets and short-term financial liabilities measured at amortized cost, their fair value approximates
the carrying amount.
The fair value of long-term borrowings is calculated based on the present value which is obtained by discounting the total of the
principal and interest by the interest rate assumed in a case where the same loan is newly made.
(ii) Financial instruments measured at fair value
The fair value hierarchy of financial instruments measured at fair value is as follows:
FY2013: As of March 31, 2014
Millions of yen
FY2013
Level 1 Level 2 Level 3 (Note) Total
Derivative assets ¥ — ¥8,600 ¥ — ¥ 8,600
Equity securities 49,809 — 3,896 53,705
Other 201 — 1,333 1,534
Total ¥50,011 ¥8,600 ¥5,229 ¥63,840
Derivative liabilities ¥ — ¥4,856 ¥ — ¥ 4,856
Total ¥ — ¥4,856 ¥ — ¥ 4,856
128 JAPAN TOBACCO INC. ANNUAL REPORT FY2014

FY2014: As of December 31, 2014
Millions of yen
FY2014
Level 1 Level 2 Level 3 (Note) Total
Derivative assets ¥ — ¥31,837 ¥ — ¥31,837
Equity securities 55,499 — 3,856 59,355
Other 279 — 1,555 1,834
Total ¥55,778 ¥31,837 ¥5,411 ¥93,025
Derivative liabilities ¥ — ¥10,010 ¥ — ¥10,010
Total ¥ — ¥10,010 ¥ — ¥10,010
(Note) The schedule of financial instruments that are classified in Level 3 is as follows:
Millions of yen
FY2013(Year ended March 31, 2014)
FY2014(Nine months ended December 31, 2014)
Balance at the beginning of the period ¥4,625 ¥5,229Total gain (loss)
Profit or loss (Note 1) 289 294Other comprehensive income (Note 2) 258 212
Purchases 89 —Sales (32) (324)Balance at the end of the period ¥5,229 ¥5,411
(Note 1) Gains and losses included in profit or loss for the year ended March 31, 2014 and for the nine months ended December 31, 2014 are related to financial assets measured
at fair value through profit or loss as of the fiscal year end date. These gains and losses are included in “Financial income” and “Financial costs.”
(Note 2) Gains and losses included in other comprehensive income for the year ended March 31, 2014 and for the nine months ended December 31, 2014 are related to financial
assets measured at fair value through other comprehensive income as of the fiscal year end date. These gains and losses are included in “Net gain (loss) on revaluation of
financial assets measured at fair value through other comprehensive income.”
34. Related Parties
Based on the Japan Tobacco Inc. Act, the Japanese government shall hold more than one-third of all of the shares issued by the Company
(excluding the type of shares, for which it is stipulated that voting rights may not be exercised on any matters that can be resolved by
Annual Shareholders Meeting). As of December 31, 2014, the Japanese government held 33.35% of all outstanding shares of the Company.
(1) Related-party Transactions Related-party transactions are conducted under the same conditions as regular business transactions.
The Company’s revenue from CJSC TK Megapolis, the local Russian distribution affiliate, for the nine months ended December 31,
2014 was ¥309,519 million. The Company held trade receivables of ¥47,393 million and ¥33,302 million from CJSC TK Megapolis as of
March 31, 2014 and December 31, 2014, respectively.
(2) Remuneration for Directors and Audit & Supervisory Board MembersRemuneration for directors and audit & supervisory board members for each fiscal year is as follows:
Millions of yen
FY2013(Year ended March 31, 2014)
FY2014(Nine months ended December 31, 2014)
Remuneration and bonuses ¥814 ¥526Share-based payments 107 84
Total ¥921 ¥610
JAPAN TOBACCO INC. ANNUAL REPORT FY2014 129
FIN
AN
CIA
L S
TA
TE
ME
NTS

35. Subsidiaries, Associates and Others
(The composition of the Group)
The composition of the Group by reportable segment as of each fiscal year end is as follows:
FY2013 (As of March 31, 2014) FY2014 (As of December 31, 2014)
Reportable Segments
Number of
subsidiaries
Number of entities
accounted for using
the equity method (Note)
Number of
subsidiaries
Number of entities
accounted for using
the equity method (Note)
Domestic Tobacco 14 2 14 2International Tobacco 148 7 145 6Pharmaceuticals 3 — 3 —Beverage 17 — 17 —Processed Food 28 3 28 3Other 8 1 8 1
Total 218 13 215 12
(Note) No associates or joint ventures are considered to be material to the Group.
There is no significant change in the composition of the Group for the nine months ended December 31, 2014.
Regarding the restrictions on its ability to use the assets of the Group, please refer to Note “7. Cash and Cash Equivalents.”
36. Commitments
(1) Commitments for the Acquisition of Assets Commitments for the acquisition of assets after each fiscal year end date are as follows:
Millions of yen
FY2013(As of March 31, 2014)
FY2014 (As of December 31, 2014)
Acquisition of property, plant and equipment ¥62,670 ¥64,832
Acquisition of intangible assets 934 2,612
Total ¥63,605 ¥67,444
(2) Procurement of Domestic Leaf TobaccoWith regard to the procurement of domestic leaf tobacco by the
Company, based on the Tobacco Business Act, the Company
enters into purchase contracts with domestic leaf tobacco grow-
ers every year, and the contracts determine the area under
cultivation by type of tobacco and the prices by type and quality
of tobacco leaf. Under the contracts, the Company is obligated to
purchase all domestic leaf tobacco produced pursuant to such
contracts, except for any domestic leaf tobacco not suited for the
manufacture of tobacco products.
37. Contingencies
Contingent LiabilitiesThe Company and some of its subsidiaries are defendants in
lawsuits. Provisions are not accounted for in matters it is not
practicable to reasonably estimate the final outcomes.
The Company and its subsidiaries, who are defendants in such
lawsuits, believe that our defenses asserted in these lawsuits are
based on substantial evidence and implements the system for
the response to action with the assistance of external lawyers.
(1) Smoking and Health Related Litigation
The Company and some of its subsidiaries are defendants in
lawsuits filed by plaintiffs seeking damages for harm allegedly
caused by smoking, the marketing of tobacco products, or expo-
sure to tobacco smoke. As of December 31, 2014, there were a
total of 19 smoking and health related cases pending in which
one or more members of the Group were named as a defendant
or for which the Company may have certain indemnity obligations
pursuant to the agreement for the Company’s acquisition of RJR
Nabisco Inc.’s overseas (non-U.S.) tobacco operations.
The major ongoing smoking and health related cases are
as follows:
a. Individual Claim
There is one individual case brought against the Company’s
indemnitee in South Africa.
South Africa Individual Claim (Joselowitz):
The individual claim was brought against the Company’s indemni-
tee in South Africa in October 2000. Plaintiff seeks compensatory
and punitive damages, alleging that the Company’s indemnitee
130 JAPAN TOBACCO INC. ANNUAL REPORT FY2014

marketed products which it knew to be dangerous to health,
manipulated nicotine content to foster addiction, failed to comply
with South African labeling requirements and participated in a
clandestine worldwide operation to encourage children to smoke.
This case has been dormant since February 2001.
In addition, there is one individual case (which is currently
dormant) brought against the Company’s subsidiary in Ireland.
b. Class Actions
There are eight ongoing class actions in Canada against the
Company’s subsidiary and/or indemnitees.
Canada Quebec Class Action (Cecilia Letourneau):
This class action was brought in September 1998 against three
Canadian tobacco manufacturers including JTI-Macdonald Corp.
(hereinafter referred to as “JTI-Mac”), the Company’s Canadian
subsidiary. Plaintiffs are seeking a total of approximately ¥475.8
billion (approximately CAD 4.6 billion) in compensatory damages,
an amount for which all the defendants would be jointly and sever-
ally liable. Plaintiffs are seeking an additional amount of approxi-
mately ¥475.8 billion (approximately CAD 4.6 billion) in punitive
damages, to be divided among all the defendants based on their
respective market shares. The class was certified by the court in
February 2005. The trial commenced in March 2012. The defen-
dants filed a third-party claim against the Government of Canada
seeking contribution and indemnity on the grounds that the
Canadian government was highly involved in the tobacco industry
in respect of smoking and health related matters. The Court of First
Instance denied the Government of Canada’s motion to dismiss
such third-party claim in February 2012. The Court of Appeal there-
after granted the Government of Canada’s appeal of the decision
of the Court of First Instance in November 2012. The defendants
did not appeal that decision, which dismissed the Government of
Canada as a defendant in the case. The Court of First Instance
granted plaintiffs’ motion to amend their claims in March 2014,
and thereby the claim amount currently sought is as set out above.
Canada Quebec Class Action (Conseil Québécois sur le tabac et
la santé):
This class action was brought in November 1998 against three
Canadian tobacco manufacturers including JTI-Mac. Plaintiffs are
seeking a total of approximately ¥1,288.9 billion (approximately
CAD 12.4 billion) in compensatory damages, an amount for which
all the defendants would be jointly and severally liable. Plaintiffs
are seeking an additional amount of approximately ¥84 billion
(approximately CAD 0.8 billion) in punitive damages, to be divided
among all the defendants based on their respective market shares.
The class was certified by the court in February 2005. The trial
commenced in March 2012. The defendants filed a third-party
claim against the Government of Canada seeking contribution
and indemnity on the grounds that the Canadian government was
highly involved in the tobacco industry in respect of smoking
and health related matters. The Court of First Instance denied the
Government of Canada’s motion to dismiss such third-party claim
in February 2012. The Court of Appeal thereafter granted the
Government of Canada’s appeal of the decision of the Court of
First Instance in November 2012. The defendants did not appeal
that decision, which dismissed the Government of Canada as a
defendant in the case. The Court of First Instance granted plain-
tiffs’ motion to amend their claims in March 2014, and thereby
the claim amount currently sought is as set out above.
Canada Saskatchewan Class Action (Adams):
This class action was brought against tobacco industry members
including JTI-Mac and the Company’s indemnitees in June 2009.
Plaintiffs are seeking unspecified compensatory and punitive
damages on behalf of class members who allege to be or have
been addicted to the nicotine contained in cigarettes manufac-
tured by the defendants. The preliminary motions are pending.
The case is currently dormant.
Canada Manitoba Class Action (Kunta):
This class action was brought against tobacco industry members
including JTI-Mac and the Company’s indemnitees in June 2009.
Plaintiffs are seeking unspecified compensatory and punitive
damages on behalf of class members who allege to be or have
been addicted to the nicotine contained in cigarettes manufac-
tured by the defendants. The statement of claim was served on
the Company’s indemnitees but not on JTI-Mac. The class action
is currently dormant.
Canada Nova Scotia Class Action (Semple):
This class action was brought against tobacco industry members
including JTI-Mac and the Company’s indemnitees in June 2009.
Plaintiffs are seeking unspecified compensatory and punitive
damages on behalf of class members who allege to be or have
been addicted to the nicotine contained in cigarettes manufac-
tured by the defendants. The statement of claim was served on
the Company’s indemnitees but not on JTI-Mac. The class action
is currently dormant.
Canada British Columbia Class Action (Bourassa):
This class action was brought against tobacco industry members
including JTI-Mac and the Company’s indemnitees in June 2010.
Plaintiffs are seeking unspecified compensatory and punitive
damages for class members. The preliminary motions are pending.
The pre-trial process is ongoing. A trial date is not yet scheduled.
Canada British Columbia Class Action (McDermid):
This class action was brought against tobacco industry members
including JTI-Mac and the Company’s indemnitees in June 2010.
Plaintiffs are seeking unspecified compensatory and punitive
damages for class members. The preliminary motions are pend-
ing. The case is currently dormant.
Canada Ontario Class Action (Jacklin):
This class action was brought against tobacco industry members
including JTI-Mac and the Company’s indemnitees in June 2012.
Plaintiffs are seeking unspecified compensatory and punitive
damages for class members. The class action has been dormant
since the date it was served on defendants.
c. Health-Care Cost Recovery Litigation
There are nine ongoing health-care cost recovery cases in Canada
pending against the Company’s subsidiary and indemnitees
brought by the Provinces of British Columbia, New Brunswick,
Ontario, Newfoundland and Labrador, Manitoba, Quebec, Alberta,
Saskatchewan and Prince Edward Island. These provinces filed
JAPAN TOBACCO INC. ANNUAL REPORT FY2014 131
FIN
AN
CIA
L S
TA
TE
ME
NTS

lawsuits under their own provincial legislation which was enacted
exclusively for the purpose of authorizing the provincial govern-
ment to file a direct action against tobacco manufacturers to
recoup the health-care costs the government has incurred and
will incur, resulting from “tobacco related wrongs.”
Canada British Columbia Health-Care Cost Recovery Litigation:
This health-care cost recovery litigation was filed by the Province
of British Columbia in January 2001 against tobacco industry
members including JTI-Mac and the Company’s indemnitees
based on its provincial legislation, the “Tobacco Damages and
Health-Care Costs Recovery Act.” The claim amount is unspeci-
fied. In 2001, several defendants challenged the legislation’s con-
stitutionality, which was ultimately rejected by the Supreme Court
of Canada in September 2005. The action remains pending in
the first instance. The defendants further filed a third-party claim
against the Government of Canada seeking contribution and
indemnity on the grounds that the Canadian government was
highly involved in the tobacco industry in respect of smoking and
health related matters. In July 2011, the Supreme Court of Canada
ultimately dismissed the defendants’ third-party claim against the
Government of Canada. The pre-trial process is ongoing. A trial
date is not yet scheduled.
Canada New Brunswick Health-Care Cost Recovery Litigation:
This health-care cost recovery litigation was filed by the Province
of New Brunswick in March 2008 against tobacco industry mem-
bers including JTI-Mac and the Company’s indemnitees based
on legislation similar to that introduced in the Province of British
Columbia. The claim amount is unspecified. The pre-trial process
is ongoing. A trial date is not yet scheduled.
Canada Ontario Health-Care Cost Recovery Litigation:
This health-care cost recovery litigation was filed by the Province
of Ontario in September 2009 against tobacco industry members
including JTI-Mac and the Company’s indemnitees based on
legislation similar to that introduced in the Province of British
Columbia. The statement of claim contains allegations of joint and
several liabilities among all the defendants but does not specify
any individual amount or percentages within the total claimed
amount of ¥5,181.5 billion (CAD 50.0 billion). The pre-trial process
is ongoing. A trial date is not yet scheduled.
Canada Newfoundland and Labrador Health-Care Cost Recovery
Litigation:
This health-care cost recovery litigation was filed by the Province
of Newfoundland and Labrador in February 2011 against tobacco
industry members including JTI-Mac and the Company’s indemni-
tees based on legislation similar to that introduced in the Province
of British Columbia. The claim amount is unspecified. The pre-trial
process is ongoing. A trial date is not yet scheduled.
Canada Manitoba Health-Care Cost Recovery Litigation:
This health-care cost recovery litigation was filed by the Province
of Manitoba in May 2012 against tobacco industry members
including JTI-Mac and the Company's indemnitees based on
legislation similar to that introduced in the Province of British
Columbia. The claim amount is unspecified. The pre-trial process
is ongoing. A trial date is not yet scheduled.
Canada Quebec Health-Care Cost Recovery Litigation:
This health-care cost recovery litigation was filed by the Province of
Quebec in June 2012 against tobacco industry members including
JTI-Mac and the Company's indemnitees based on legislation simi-
lar to that introduced in the Province of British Columbia. The state-
ment of claim in this case contains allegations of joint and several
liabilities among all the defendants but does not specify any indi-
vidual amount or percentages, within the total amount of the claim
approximately ¥6,285.9 billion (approximately CAD 60.7 billion).
The pre-trial process is ongoing. A trial date is not yet scheduled.
Canada Alberta Health-Care Cost Recovery Litigation:
This health-care cost recovery litigation was filed by the Province
of Alberta in June 2012 against tobacco industry members includ-
ing JTI-Mac and the Company's indemnitees based on the legisla-
tion similar to that introduced in the Province of British Columbia.
The statement of claim in this case contains allegations of joint
and several liabilities among all the defendants but does not spec-
ify any individual amount or percentages, within the total claimed
amount of at least ¥1,036.3 billion (CAD 10.0 billion). The pre-trial
process is ongoing. A trial date is not yet scheduled.
Canada Saskatchewan Health-Care Cost Recovery Litigation:
This health-care cost recovery litigation was filed by the Province
of Saskatchewan in June 2012 against tobacco industry members
including JTI-Mac and the Company's indemnitees based on
legislation similar to that introduced in the Province of British
Columbia. The claim amount is unspecified. The pre-trial process
is ongoing. A trial date is not yet scheduled.
Canada Prince Edward Island Health-Care Cost Recovery Litigation:
This health-care cost recovery litigation was filed by the Province
of Prince Edward Island in September 2012 against tobacco
industry members including JTI-Mac and the Company’s indemni-
tees based on legislation similar to that introduced in the Province
of British Columbia. The claim amount is unspecified. The pre-trial
process is ongoing. A trial date is not yet scheduled.
(2) Other Litigation
The Company and some of its subsidiaries are also named as
defendants in other litigation such as commercial and tax dis-
putes. One major case is pending:
Commercial Litigation
Japan Compensatory Damages Claim:
In February 2010, a former President & CEO of Katokichi Co., Ltd.
filed a claim against TableMark Holdings Co., Ltd. (renamed after
acquisition of Katokichi Co., Ltd. by the Company) and its subsid-
iary seeking damages allegedly incurred by the plaintiff from an
asset purchase agreement between the plaintiff and Katokichi Co.,
Ltd. and a joint and several guarantee provided by the plaintiff.
The plaintiff argues the invalidity of the asset purchase agreement.
(Note) The amount of damages sought denominated in foreign currencies is translated
into Japanese yen at the rates of 31 December 2014.
132 JAPAN TOBACCO INC. ANNUAL REPORT FY2014

38. Subsequent Events
(1) Legal MatterSubsequent to December 31, 2014, the following health-care cost
recovery litigation was filed.
Canada Nova Scotia Health-Care Cost Recovery Litigation:
This health-care cost recovery litigation was filed by the Province
of Nova Scotia on January 2, 2015 against tobacco industry mem-
bers including JTI-Mac and the Company’s indemnitees based on
its provincial legislation, the “Tobacco Damages and Health-Care
Costs Recovery Act.” The Province of Nova Scotia is seeking to
recoup the health-care costs the province has incurred and will
incur, resulting from “tobacco related wrongs.” The claim amount
is unspecified. The pre-trial process is ongoing. A trial date is not
yet scheduled.
(2) Withdrawal from the Manufacture and Sale of JT Beverage Products
The Company decided by resolution at a meeting of the Board of
Directors held on February 4, 2015 to withdraw from manufacture
and sale of JT beverage products in the beverage business. The
manufacture and sale of JT beverage products conducted by JT’s
beverage business division and JT Beverage Inc. is expected to be
discontinued by the end of September 2015. The impact of the
decision on the consolidated financial statements for fiscal year
ending December 31, 2015 has not been confirmed at present.
(3) Acquisition of Own SharesAs a supplemental measure for the adjusted EPS growth at con-
stant FX in the mid- to long-term in the framework of shareholder
return, the Company’s Board of Directors made a resolution on
February 5, 2015 for the Company to acquire its own shares
according to the particulars stated below pursuant to the provision
of Article 156 of the Companies Act, as applied by replacing the
relevant terms pursuant to the Act’s provision of Article 165,
paragraph 3.
a. Class of shares to be acquired : Common stock
b. Number of shares to be acquired : Up to 36,000,000 shares
c. Total payment amount to
acquire shares : Up to ¥100,000 million
d. Period of share acquisition : From February 9, 2015
to June 9, 2015
e. Method of acquisition : Purchase on the stock
exchange via a trust bank
Based on this resolution, the Company acquired 26,896,200
shares of its common stock for a total acquisition price of
¥100,000 million during the period between February 9, 2015 and
March 18, 2015 (contract basis), and has completed the acquisi-
tion of its common stock as resolved by the Board of Directors.
39. Consolidated Statement of Income (2014 January–December)
Consolidated statement of income assuming that the fiscal year of the Group had been the twelve-month period from January 1, 2014 to
December 31, 2014 is as follows:
Millions of yen
2014(January–December)
Revenue ¥2,433,463Cost of sales (987,231)Gross profit 1,446,232
Other operating income 50,477Share of profit in investments accounted for using the equity method 7,812Selling, general and administrative expenses (932,754)Operating profit 571,767
Financial income 14,773Financial costs (12,976)Profit before income taxes 573,565
Income taxes (177,857)Profit for the year ¥ 395,708
Attributable to:Owners of the parent company ¥ 389,065Non-controlling interests 6,643Profit for the year ¥ 395,708
Earnings per shareBasic (Yen) ¥ 214.06Diluted (Yen) 213.94
JAPAN TOBACCO INC. ANNUAL REPORT FY2014 133
FIN
AN
CIA
L S
TA
TE
ME
NTS

Reconciliation from “Operating profit” to “Adjusted operating profit”
Millions of yen
2014(January–December)
Operating profit ¥571,767Amortization cost of acquired intangibles 29,465Adjustment items (income) (46,113)Adjustment items (costs) 104,980
Adjusted operating profit ¥660,099
Consolidated Supplementary InformationA. Quarterly Information for the Nine Months ended December 31, 2014
Millions of yen
Q1From April 1, 2014
to June 30, 2014
Q2From April 1, 2014
to September 30, 2014
FY2014From April 1, 2014
to December 31, 2014
Revenue ¥556,448 ¥1,174,450 ¥2,153,970
Profit before income taxes for the period (year) 147,516 302,952 502,299
Profit for the period (year) 107,796 223,149 368,626
Basic earnings per share for the period (year) (yen) 58.42 120.68 199.67
Q1From April 1, 2014
to June 30, 2014
Q2From July 1, 2014
to September 30, 2014
Q3 (Note)
From October 1, 2014 to December 31, 2014
Basic earnings per share for the quarter (yen) ¥58.42 ¥62.26 ¥79.00
(Note) The period from October 1, 2014 to December 31, 2014 consists of financial results of the Company and its subsidiaries whose fiscal year end was March 31 for the three-
month period from October 1, 2014 to December 31, and financial results of the JTIH Group for the six-month period from July 1, 2014 to December 31, 2014.
B. Significant Lawsuits
The significant lawsuits of the Group are as stated in “37. Contingencies” and “38. Subsequent Events” in the notes to consolidated
financial statements.
134 JAPAN TOBACCO INC. ANNUAL REPORT FY2014

JAPAN TOBACCO INC. ANNUAL REPORT FY2014 135
FIN
AN
CIA
L S
TA
TE
ME
NTS

Investor Presentation in September 2014:
Presentation materials

SH
AR
EH
OLD
ER
INFO
RM
ATIO
N
138 Shareholder Information

Shareholder Information
Composition of Shareholders (%)
2014Mar 31
2014Dec 31
2013Mar 31
2012Mar 31
2011Mar 31
2010Mar 31
33.350.050.050.0
15.0
13.514.415.0
33.5
27.426.626.5
15.97.57.87.2
1.21.10.60.61.1
33.3
15.9
35.1
13.4
1.40.9
33.3
15.9
33.6
13.7
2.31.30.50.70.7
Common Stock Note: A 200 for 1 stock split was completed on July 1, 2012.
Authorized: 8,000,000,000
Issued: 2,000,000,000
Number of shareholders: 147,546
Administration of the Registry of ShareholdersThe Mitsubishi UFJ Trust and Banking Corporation
4-5, Marunouchi 1-chome, Chiyoda-ku, Tokyo.
Stock Exchange ListingsFirst Sections of Tokyo Stock Exchange.
Principal Shareholders
Name Shares held
The Minister of Finance 666,930,000
The Master Trust Bank of Japan, Ltd. (Trust Account) 48,016,600
Japan Trustee Services Bank, Ltd. (Trust Account) 44,042,200
JPMorgan Chase Bank 380055
(Standing proxy: Mizuho Bank, Ltd., Settlement Sales Department) 40,614,441
State Street Bank and Trust Company
(Standing proxy: The Hongkong and Shanghai Banking Corporation Limited, Tokyo Branch) 37,725,319
State Street Bank and Trust Company 505223
(Standing proxy: Mizuho Bank, Ltd., Settlement Sales Department) 37,079,564
Trust & Custody Services Bank, Ltd. as trustee for Mizuho Bank, Ltd. Retirement Benefi t Trust Account re-entrusted by
Mizuho Trust and Banking Co., Ltd. 33,800,000
State Street Bank and Trust Company (Standing proxy: Mizuho Bank, Ltd., Settlement Sales Department) 33,575,126
HSBC Bank plc A/C The Children’s Investment Master Fund
(Standing proxy: The Hongkong and Shanghai Banking Corporation Limited, Tokyo Branch) 28,362,300
JPMorgan Chase Bank 385632 (Standing proxy: Mizuho Bank, Ltd., Settlement Sales Department) 16,560,688
(As of December 31, 2014)
Individuals and others
Foreign institutions and others
Other institutions
Securities companies
Financial institutions
Government of Japan
138 JAPAN TOBACCO INC. ANNUAL REPORT FY2014

14.3 14.1213.311.310.309.308.307.306.305.304.303.302.301.300.399.398.397.396.395.394.10 12.3
Stock Price Chart (Yen)
(Points)
All Time High
November 4, 2014: ¥4,193
All Time Low
April 7, 2003: ¥644
(Pre-split: ¥128,800)
Reference
TOPIX (right)
500
1,500
1,000
2,000
2,500
3,000
3,500
4,000
500
1,000
1,500
2,000
2,500
3,000
4,000
3,500
Off ering JT Shares by Government1st Off ering
Method Off ering by Bids Off ering by non-Bids
Off er Price
(Pricing Date)
Bid Price: From ¥1,362,000 to ¥2,110,000
Weighted Average Price: ¥1,438,000
(August 29, 1994)
¥1,438,000
(August 31, 1994)
Number of
Off ering shares
229,920 shares 164,356 shares
Off ering Term From August 15 to 18, 1994 From September 2 to 8, 1994
Note:
The Listing date
October 27, 1994: First Sections of Tokyo Stock Exchange.
2nd and 3rd, 4th Off ering
2nd Off ering 3rd Off ering 4th Off ering
Method Off ering by Book-Building formula Off ering by Book-Building formula Off ering by Book-Building formula
Off er Price
(Pricing Date)
Bid Price: ¥815,000
(June 17, 1996)
¥843,000
(June 7, 2004)
¥2,949 (March 11, 2013)
Number of
Off ering shares
Japan: 237,390 shares,
International: 35,000 shares
(Total: 272,390 shares)
Japan: 198,334 shares,
International: 91,000 shares
(Total: 289,334 shares)
Japan: 145,625,500 shares,
International: 107,636,300 shares
(Total: 253,261,800 shares)
Off ering Term From June 18 to 19, 1996 From June 8 to 10, 2004 From March 12 to 13, 2013
Note:
Due to a 5-for-1 stock split on April 1, 2006, and a 200 for 1 stock split on July 1, 2012, stock prices refl ect post-split levels.
SH
AR
EH
OLD
ER
INFO
RM
ATIO
N
JAPAN TOBACCO INC. ANNUAL REPORT FY2014 139

Meeting at JT Tokyo headquarters:
Always striving for the best results

OTH
ER
INFO
RM
ATIO
N
142 History of the JT Group
146 Regulation and Other Relevant Laws
149 Litigation
150 Members of the Board
151 Members of JTI Executive Committee
152 Glossary of Terms
154 Corporate Data
JT’s history in Japan dates back to 1898, when the Government formed a monopoly bureau to operate the exclusive sale of domestic tobacco leaf.
The JT Group’s overseas history began with the
founding of Austria Tabak in 1784. Roughly 70 years
later, Tom Gallaher started out in business in Northern
Ireland, laying the foundations for the Gallaher Group.
Meanwhile, R.J. Reynolds Tobacco Co. (RJR), which
would subsequently create the Camel and Winston
brands, was established in 1874 in the U.S. In this
manner, the current JT Group can trace its origins to
many diff erent countries and regions such as Austria,
Northern Ireland, the U.S. and Japan. The JT Group
has a long history and extensive experience in the
tobacco business.
History in Japan from the early 20th century to 1984, when the Japan Tobacco Inc. Act was enacted. Our history in Japan dates back to 1898, when the
Government formed a monopoly bureau to undertake
the exclusive sale of domestic leaf tobacco. In the
early 1900s, the Japanese government extended this
monopoly to all tobacco products in Japan and to the
domestic salt business. On June 1, 1949, the bureau
was established and duly named the Japan Tobacco
and Salt Public Corporation, or JTS. This corporation
helped to ensure the stable supply of tobacco and
secure fi scal revenues for the Government.
The growth in demand for cigarettes in Japan began
to slow in the mid-1970s as a result of demographic
trends and growing concern about health risks
associated with smoking. This trend continued, such
that growth in industry sales essentially stopped. In
addition to the structural change, the domestic tobacco
market opened up substantially to foreign suppliers,
triggering competition between domestic and foreign
tobacco products in Japan.
Foreign countries stepped up pressure on Japan to take
further measures to open the market that were diffi cult
to implement within the framework of the monopoly
tobacco sales system. Amid such pressure as well as
moves toward the reform of Government-run public
corporations, a Government panel was established
in March 1981 to conduct research into the public
corporation system. In its third report (July 30, 1982),
the panel proposed drastic reform of the monopoly
and public corporation systems. In response to this
proposal, the Government conducted a comprehensive
review of these systems and drafted bills to:
• Abolish the tobacco monopoly law to liberalize
tobacco imports and establish a tobacco business
law to make necessary adjustments related to the
tobacco business.
• Abolish the JTS law, reorganize JTS as a joint stock
corporation so as to enable it to pursue rational
corporate management as much as possible and
establish the Japan Tobacco Inc. Act, which provides
for a necessary minimum level of regulation in light
of the corporation’s need to compete with foreign
tobacco companies on an equal footing in the
domestic market following the liberalization of
tobacco imports.
These bills were enacted on August 3, 1984 in
the 101st session of the Diet and promulgated on
August 10 of the same year. In April 1985, JT was
founded as an entity that took over the whole of
the business operations and assets of JTS.
Before 1985
History of the JT Group
142 JAPAN TOBACCO INC. ANNUAL REPORT FY2014

JT is a joint stock corporation that was incorporated in April 1985 under the Commercial Code of Japan, pursuant to the Japan Tobacco Inc. Act, or the JT Act.
1784Austria Tabak is founded by Emperor Joseph II.
1857Tom Gallaher sets up his business in Londonderry, Northern Ireland.
1874RJR is founded by Richard Joshua Reynolds in Winston, North Carolina.
1879Sobranie is registered in London, to become one of the oldest cigarette brands in the world.
1891The Moscow-based Ducat factory is founded.
1898The Japanese Monopoly Bureau is established for the sale of domestic leaf tobacco.
1913Camel is launched.
1931Cellophane is introduced by RJR in order to preserve the freshness of tobacco.
1949The Monopoly Bureau becomes the Japan Tobacco and Salt Public Corporation.
1954Winston is launched.
1955Benson & Hedges is acquired by Gallaher.
1956Salem is launched.
1957HOPE (10) is launched as Japan’s fi rst domestically produced fi lter cigarettes.
1964Silk Cut is launched.
1968Gallahar is acquired by the American Tobacco Company.
1969Seven Stars is launched, featuring Japan’s fi rst domestically produced charcoal fi lter.
1977Mild Seven is launched (Japan).
1981Mild Seven is launched internationally.
1984Japan Tobacco Inc. Act is enacted.
OTH
ER
INFO
RM
ATIO
N
JAPAN TOBACCO INC. ANNUAL REPORT FY2014 143

1985AprilJapan Tobacco Inc. is established. (Japanese tobacco market opened to Foreign tobacco manufacturers).
The Business Development Division is established to promote new businesses.
The Business Development Division is later reorganized into operational divisions engaged in the food and pharmaceutical businesses, fi nishing in July 1990.
1987AprilImport tariff s on imported cigarettes are abolished.
1988OctoberJT communication name is introduced.
1992Acquisition of Manchester Tobacco Company Ltd. Acquisition of AS-Petro (Russia).*
1993SeptemberThe Central Pharmaceutical Research Institute is established to enhance in-house research capabilities.
1994OctoberGovernment releases fi rst tranche of outstanding JT shares for initial public off ering (394,276 shares off ered at ¥1,438,000 apiece).
JT stock is listed on the fi rst sections of stock exchanges in Tokyo, Osaka and Nagoya.
NovemberJT stock is listed on the stock exchanges in Kyoto, Hiroshima, Fukuoka, Niigata and Sapporo.
Acquisition of Yelets (Russia).*
1995MayHead offi ce is moved back to Minato-ku from Shinagawa-ku following completion of new head offi ce building.
Peter I is launched (Russia).*
1996JuneGovernment releases second tranche of outstanding JT shares (272,390 shares off ered at ¥815,000 apiece).
Acquisition of Tanzanian tobacco production facility.*
1997AprilJT ends its salt monopoly business in line with abolition of the salt monopoly system.
The Tobacco Mutual Aid Pension scheme is integrated into the Employees’ Pension scheme.
American Brands spins off Gallaher which becomes Gallaher Group Plc and is listed on the London and New York stock exchanges.**
1998AprilJT signs an agreement with Unimat Corporation (currently, Japan Beverage Holdings Inc.) on a tie-up regarding beverage business. JT later acquires a majority stake in Unimat.
DecemberJT acquires a majority stake in Torii Pharmaceutical Co., Ltd. through a tender off er.
1999MayJT acquires the non-U.S. tobacco business of RJR Nabisco Inc.
JulyJT acquires the food business of Asahi Kasei Corporation, including Asahi Foods and seven other subsidiaries.
OctoberUnder a business tie-up between JT and Torii Pharmaceutical Co., Ltd., the two companies’ R&D operations related to medical pharmaceuticals are concentrated at JT, while their promotion operations are combined at Torii Pharmaceutical.
LD launched (Russia).**
2000Acquisition of Liggett-Ducat (Russia).**
2001Acquisition of Austria Tabak.**
2003OctoberJT repurchases 45,800 of its own shares to increase its management options.
2004JuneGovernment releases third tranche of outstanding JT shares (289,334 shares off ered at ¥843,000 apiece), reducing its stake in JT to the minimum level allowed under law.
November-March 2005JT repurchases 38,184 of its own shares to increase its management options.
2005AprilJT terminates a licensing contract under which it had exclusive rights to produce and sell Marlboro brand products in Japan and use the Marlboro trademark in the country.
JuneAcquisition of CRES Neva Ltd. (Russia). Glamour is launched (Russia, Ukraine, Kazakhstan).**
2006AprilJT implements a fi ve-for-one stock split in order to expand the investor base, eff ective April 1, 2006.
MayAcquisition of AD Duvanska Industrija Senta in Serbia.
2007AprilJT acquires all outstanding shares of Gallaher Group Plc.
2008JanuaryJT acquires a majority stake in Katokichi Co., Ltd. through a tender off er.
AprilJT acquires a majority stake in Fuji Foods Corporation.
JulyJT concentrates its processed food operations, including frozen food and seasonings operations, at the Katokichi Group.
In and after 1985
History of the JT Group continued
144 JAPAN TOBACCO INC. ANNUAL REPORT FY2014

* Topics of RJR Nabisco’s non-US operations before participating in the JT Group.
** Topics of Gallaher before participating in the JT Group.
The corporate history of JT is summarized in the table
to the left. For the international tobacco business,
the history before JT’s acquisitions of RJR Nabisco’s
non-US tobacco operations and Gallaher is included.
The operating environment for JT changed drastically
in just two years after the foundation of the Company,
with the yen’s strong appreciation following the Plaza
Accord in 1985, a tobacco tax hike in 1986 and the
abolition of tariff s on imported cigarettes in 1987.
Amid the yen’s upsurge, a price increase for JT products
due to the tobacco tax hike, coupled with price cuts for
imported cigarettes attributable to the tariff abolition,
eliminated the price advantage of JT products over
imported products, which had stood at around ¥60
to ¥80 when JT was founded in 1985. As a result,
competition between JT and foreign tobacco makers
intensifi ed in the Japanese market, leading to a decline
in JT’s market share from 97.6% in fi scal 1985 to 90.2%
in fi scal 1987.
To cope with the rapid deterioration of the operating
environment, JT implemented rationalization measures
to enhance its cost-competitiveness and pursued
diversifi cation while taking measures to strengthen
its marketing capability. In the 1990s, JT’s competition
with foreign rivals in the Japanese market intensifi ed
further. Furthermore, overall cigarette demand in
Japan peaked in the latter half of the 1990s due
to a contraction of the adult population and growing
concerns with health problems associated with smoking.
Amid the increasingly diffi cult operating environment
for the Japanese domestic tobacco business, JT took
additional rationalization steps, pursued consolidation
of operations in its areas of business diversifi cation and
expanded the international tobacco business, thereby
strengthening its business foundation.
JT signifi cantly strengthened the international tobacco
business by acquiring RJR Nabisco’s non-U.S. tobacco
operations in 1999 and Gallaher in 2007. With its
international sales volume exceeding its domestic sales
volume, the JT Group continues to grow as a global
tobacco company. The international tobacco business
is the engine of the JT Group’s profi t growth through
its comprehensive brand portfolio which includes
Winston, Camel , Mild Seven – MEVIUS and LD as well
as Benson & Hedges, Silk Cut, Sobranie and Glamour.
2009MayJTI celebrates its 10th anniversary.
JuneJTI Leaf Services (U.S.) LLC is established.
OctoberAcquisition of leaf suppliers Kannenberg & Cia. Ltda. (Brazil) and Kannenberg, Barker, Hail & Cotton Tabacos Ltda. (Brazil).
NovemberAcquisition of leaf suppliers Tribac Leaf Limited (UK).
2010JanuaryKatokichi Co., Ltd. is renamed TableMark Co., Ltd.
MaySmokeless tobacco product Zerostyle Mint is launched.
2011MarchJT repurchases 58,630 of its own shares, as part of its shareholder return measures.
NovemberAcquisition of Haggar Cigarette & Tobacco Factory Ltd. (North Sudan) and Haggar Cigarette & Tobacco Factory Ltd. (South Sudan).
2012JulyFor the purpose of enlarging Company’s investor base, a 200-for-1 stock-split is conducted. At the same time, JT adopts the share unit system, setting a share trading unit at 100 shares.
AugustAcquisition of Gryson NV, a Belgium Fine Cut maker.
2013FebruaryThe name change of Mild Seven to MEVIUS in Japan.
Government releases fourth tranche of outstanding JT shares (333,333,200 shares off ered).
On February 27, JT repurchases 86,805,500 shares through ToSTNeT-3, including 80,071,400 shares from the Government.
Excluding the share repurchased by JT, 253,261,800 shares are off ered by the Government in March.
MarchAcquisition of Al Nakhla Tobacco Company S.A.E. and Al Nakhla Tobacco Company – Free Zone S.A.E., a leading Egyptian water-pipe company.
MayLaunch of a novel anti-HIV drug “Stribild Combination Tablets” in Japan, containing our original compound (elvitegravir).
DecemberJT acquires a minority interest in Megapolis, the leading Russian distribution company.
2014AprilTableMark establishes a holding company.
OctoberLaunch of “Cedatoren sublingual drop Japanese Ceder Pollen,” a sublingual Immunotherapy Drug for Japanese Ceder Pollinosis.
NovemberAcquisition of e-cigarettes company Zandera Ltd. (UK).
OTH
ER
INFO
RM
ATIO
N
JAPAN TOBACCO INC. ANNUAL REPORT FY2014 145

Tobacco businessRegulation in the international marketsIn international markets where JT Group’s tobacco
products are sold, World Health Organization (WHO)
adopted the Framework Convention on Tobacco Control
(“FCTC”) at its 56th World Health Assembly held in May
2003. It came into force in February 2005 (Government
of Japan accepted it in June 2004). Since then, there
has been a rising trend in regulations regarding sales
promotions, packages and outer wrappers, marketing
of tobacco products and smoking.
The purpose of the FCTC is to continuously and
substantively control the proliferation of smoking.
Its provisions include, among others, price and tax
measures to reduce tobacco demand, non-price
measures to reduce the demand for tobacco (such as
protection from exposure to tobacco smoke, regulation
of contents and emissions of tobacco products,
regulation of disclosure of tobacco products, regulations
on packaging and labeling of tobacco products,
regulations on tobacco advertising, promotion and
sponsorship, among others), and measures relating
to the reduction of the supply of tobacco (such as
prevention of illicit trade, prohibition of sale of tobacco
products to minors, among others). In addition,
descriptive expressions such as “mild” and “light” are
stipulated by some provisions as numerous steps are
being taken. Moreover, in November 2012, the protocol
to eliminate illicit trade in tobacco products was adopted
at the fi fth session of the Conference of the Parties.
As general obligation, signatories to the protocol are
to formulate, adopt, periodically update and review
strategies, plans and programs for tobacco regulation.
However, the content, scope and method of specifi c
controls undertaken in these nations are ultimately
legislated by each respective nation.
Regulation by country or region
In May 2014, the ‘EU Tobacco Product Directive (EU
TPD)’, revised from the earlier Directive promulgated
in July 2001, entered into force. This revised Directive
includes, among others, strengthening of packaging and
labeling regulations, restrictions on the use of additives
including menthol for cigarettes and fi ne cut, and
regulations related to electronic cigarettes. All EU
member states are required to establish their domestic
laws, regulations and ordinances to conform the revised
directive. This revised Directive will be implemented
Regulation and Other Relevant Laws
(except some measures such as prohibiting menthol
products) by May 2017, through legislation of each EU
member state by May 2016.
One of the most notable regulations adopted recently is
the plain packaging legislation in Australia. In Australia,
individual packages of tobacco products must be of a
prescribed color, and product names must be displayed
on the packages in a prescribed location, font size, color
and style. In addition, visual warning labels must take
up 75% of the front side and 90% of the back side of
packages. The legislation was passed in 2011 and
came into eff ect in December 2012. The plain packaging
legislation in Ireland was also enacted in March 2015.
A number of other countries are considering the
implementation of similar measures.
In the UK, one of our key markets, the plain packaging
regulation was enacted in March 2015. In addition, laws
including “Restrictions on the in-store display of tobacco
products” and “Ban on sale of tobacco products through
vending machines” are already enforced in the UK.
In Russia, another of our key markets, legislation was
passed in February 2013, which includes protection from
exposure to tobacco smoke and other matters related to
tobacco consumption. The legislation came into eff ect,
starting from June 2013 and is being implemented in
steps through up to 2017. It contains a number of
provisions including display ban, restrictions on sales
of tobacco products in certain retail stores, ban on
advertising, sponsorship and promotions, introduction
of minimal pricing and ban on smoking in public places.
Although it is impossible to predict the content of
future laws, regulations and industry guidelines
relating to sales activities, marketing and smoking,
the JT Group expects regulations like the above and
new regulations (including those of local governments)
to diff use across Japan and other countries where the
group sells its products.
146 JAPAN TOBACCO INC. ANNUAL REPORT FY2014

Regulation in JapanThe Tobacco Business Act, related acts and statutes and
voluntary standards set forth the regulations for the sale
and promotion activities of tobacco products in Japan
that include the indication of warning labels on tobacco
product advertisements and packages that urge caution
over the relationship between the consumption of
tobacco products and health.
In November 2003, the Ordinance for Enforcement
of the Tobacco Business Act was revised including the
wording of the cautions over the relationship between
the consumption of tobacco products and health
indicated on tobacco product packages and, starting
July 2005, all tobacco products sold in Japan have been
in conformity to the revised regulations. In addition, the
Japanese Minister of Finance has indicated a “Guideline
for Advertising of Tobacco Products” based on the
Tobacco Business Act which, in March 2004, was
revised with tougher language. The Tobacco Institute
of Japan has established voluntary standards regarding
the advertising and sales promotion activities for
tobacco products. All member companies, including
JT, comply with these standards. Recently in Japan
from the perspective of passive smoking prevention,
cases where smoking in public areas including
restaurants and offi ce buildings has been restricted
by laws and regulations and the like are on the rise.
Moreover, from the perspective of labor protection,
a number of initiatives are being implemented and
promoted by the government and governing bodies,
while revision of the law is also being considered.
We expect this trend to continue in the future.
Tobacco Business ActImporters and wholesalers of tobacco products must
register with the Minister of Finance and, retailers of
tobacco products must obtain the license of the Minister
of Finance. The retailers of tobacco products are required
to sell the tobacco products manufactured by JT and
imported tobacco products at the fi xed retail price
which is approved by the Minister of Finance. The
Minister of Finance must approve the fi led retail sales
prices unless otherwise considered unfairly prejudicial
to consumers. The Tobacco Business Act requires JT
to annually enter into purchase contracts with tobacco
growers regarding the aggregate cultivation area for
specifi c varieties of leaf tobacco and the prices for leaf
tobacco by variety and grade. JT must purchase all leaf
tobacco produced pursuant to such contracts, except
for any not suited for the manufacture of tobacco
products. When JT decides the aggregate cultivation
area and the prices of leaf tobacco for its contracts with
tobacco growers, it is required to respect the opinion of
the Leaf Tobacco Deliberative Council (hatabako shingi
kai), which consists of members appointed by JT with
the approval of the Minister of Finance from among the
representatives of domestic leaf tobacco growers and
academic appointees. Much like many other agricultural
products in Japan, production costs for domestically-
grown leaf tobacco is higher than those of foreign-
grown leaf tobacco to the extent that the purchasing
price for the former (before re-drying) is approximately
three times that of the latter (after re-drying).
In November 2003, the Ordinance for Enforcement of
the Tobacco Business Act was revised and the wording
of warnings concerning tobacco consumption and
health indicated on the tobacco product package was
changed. In addition, the Ordinance stipulated that
when wording like “mild” and “light” is used on the
package, they must be accompanied by a warning
that clarifi es that such words do not mean that the risk
to their health is lower than other tobacco products so
as to prevent consumers from misunderstanding the
relationship between the consumption of tobacco
products and health. JT has been adhering to this
rule since July 1, 2005.
Self-regulation on marketingPrevention of youth smoking
Youth smoking prevention is an issue which must be
addressed by society as a whole. The JT Group has a
voluntary code, ‘Global Tobacco Products Marketing
Standard’, to govern its business and marketing activities
in support of youth smoking prevention. We are working
with government and other relevant organizations to
take steps towards preventing youth smoking in the
countries in which we operate. For further details,
please refer to the following website pages:
Initiatives taken in Japan:
http://www.jti.co.jp/corporate/enterprise/tobacco/
responsibilities/activity/index.html
Initiatives taken in the international markets:
http://www.jti.com/how-we-do-business/product-
regulation/youth-smoking-prevention/ OTH
ER
INFO
RM
ATIO
N
JAPAN TOBACCO INC. ANNUAL REPORT FY2014 147

Regulation and Other Relevant Laws continued
Global Tobacco Products Marketing Standards
The JT Group complies with all the national regulation
and has implemented a ‘Global Tobacco Products
Marketing Standard’, a self-regulatory code, which
governs the marketing of its tobacco products in every
country. The key provisions include ‘Strict minimum
guidelines applicable to advertise tobacco products’,
and ‘Indication of health warnings in ads and other
media’, ‘Restrictions on sponsorships’, among others.
Please refer to the following link for more information
regarding the Global Tobacco Product Marketing
Standards of JTI:
http://www.jti.com/how-we-do-business/product-
regulation/jti-global-marketing-standard/
Pharmaceutical BusinessThe pharmaceutical industry operates in a highly
regulated environment. In many countries, R&D,
manufacturing and sales activities are strictly
regulated. Moreover, in recent years, the approval
process for new drugs has been tightening due to the
increased requirements to promote public health and
safety. Today, compared to the past, pharmaceutical
companies are required to spend more time to examine
pharmaceutical safety issues and conduct a greater
number of clinical trials on subjects to collect more data
on the effi cacy of new pharmaceuticals. Consequently,
clinical trials are growing in scale, cost and time.
In Japan, the marketing of pharmaceutical products
is subject to the supervision of the Ministry of Health,
Labor and Welfare, or MHLW, primarily under the
Act on Securing Quality, Effi cacy and Safety of
Pharmaceuticals, Medical Devices, Regenerative
and Cellular Therapy Products, Gene Therapy Products,
and Cosmetics, while part of its supervisory authority is
undertaken by the relevant prefectural governor. Under
the act, in order to conduct the marketing business of
pharmaceuticals, a person is required to obtain from
the relevant prefectural governor a renewable, generally
fi ve-year marketing business license. In addition, under
the act, in order to market pharmaceuticals, it is
necessary to obtain marketing approval from the
MHLW for each kind of product.
The national health insurance system covers virtually
the entire Japanese population. To sell a pharmaceutical
product in Japan, a marketing business license holder
of pharmaceutical products must fi rst have a new
pharmaceutical product listed on the National Health
Insurance Pharmaceutical Price List for coverage under
the national health insurance system. Generally, prices
on the price list are subject to revision once every two
years as part of the government’s policy to control
health-care spending.
Processed Food BusinessAs a producer and seller of food products, the
JT Group’s processed food business is subject to
regulations mainly under the Food Safety Basic Act,
the Food Sanitation Act and the JAS Act.
The Food Safety Basic Act requires food-related
companies to take necessary measures to ensure food
safety in each process of the supply chain, as well as
to make eff orts to provide accurate information about
foods and food-related goods in an appropriate manner.
The Food Sanitation Act concentrates on prevention of
sanitary problems arising from consumption of foods
and beverages. This Act requires food companies to
take necessary measures under their own responsibility
to ensure the safety of foods, additives, appliances and
packages. The measures discussed in the Act include
the acquisition of knowledge and skills, assurance of the
safety of raw materials and voluntary inspection. The
JAS Act sets the quality labeling standards which defi ne
the labeling requirements to indicate quality-related
items such as materials and the origin. Manufacturers
and others must comply with the standards in preparing
their product labels.
The JT Group is striving to establish a high level of
food safety control from the above-mentioned four
perspectives – “food safety”, “food defense”, “food
quality” and “food communication” – in addition to
complying with these laws and regulations and
ensuring thorough awareness about them.
148 JAPAN TOBACCO INC. ANNUAL REPORT FY2014

JT and some of its subsidiaries are defendants in
lawsuits fi led by plaintiff s seeking damages for harm
allegedly caused by smoking, the marketing of tobacco
products, or exposure to tobacco smoke. As of the fi scal
year-end date, there were a total of 19 smoking and
health-related cases pending in which one or more
members of the JT Group were named as defendant
or for which JT may have certain indemnity obligations
pursuant to the agreement for JT’s acquisition of RJR
Nabisco Inc.’s overseas (non-U.S.) tobacco operations.
We believe it is possible that other similar smoking and
health-related lawsuits may be fi led in the future.
In addition, JT and some of its subsidiaries are also
defendants in lawsuits other than the smoking and
health-related cases. Please refer to “Note 37” to the
consolidated fi nancial statements (Contingencies
-Contingent Liabilities) for major lawsuits to which JT
and some of its subsidiaries are named as defendants.
Similar lawsuits involving us may be fi led and contested
in courts in the future.
To date, we have never lost a case or paid any
settlement award in connection with smoking and
health-related litigation. However, we are unable to
predict the outcome of currently pending or future
lawsuits. If a court ruling is unfavorable for us, in
such cases whether lawsuits are smoking and health
related or not, our fi nancial results, production, sales
and imports/exports of tobacco products may be
adversely aff ected.
In recent decades, numerous, large-scale, smoking and
health-related cases have been brought against tobacco
product manufacturers in the United States of America,
and some of the cases resulted in verdicts with massive
damage awards.
Litigation
As of the fi scal year-end date, there are nine ongoing
health-care cost recovery cases in Canada pending
against JTI-Macdonald Corp. and JT’s indemnitees (RJR
Nabisco Inc.’s affi liate), brought by Canadian provinces.
In addition, there are eight pending class actions in
Canada, in which plaintiff s are seeking damages for
harm allegedly caused by smoking of cigarettes.
Damages claimed in some of these cases reach sums in
the multi-billion dollar range. We will continue to take all
appropriate actions to defend such claims vigorously,
and believe there are a number of valid defenses.
In recent decades, numerous, large-scale, smoking and
health-related cases have been brought against tobacco
product manufacturers in the United States of America,
and some of the cases resulted in verdicts with massive
damage awards. JT and its subsidiaries are not
defendants in any of these lawsuits, nor are they subject
to any indemnity claims. The tobacco business which JT
acquired from RJR Nabisco Inc. did not include brands
in the United States of America, and even now, our
historic and current tobacco business scale in the United
States of America remains very small. Accordingly, we
consider its exposure to smoking and health-related
litigation in the United States of America to be low, and
we thus believe that situations under the litigation in the
United States of America will not materially aff ect our
businesses in the near future.
As a tobacco product manufacturer, we continue
to monitor closely the developments and trends of
litigation involving tobacco companies in the United
States of America, Canada, and elsewhere, with
particular interest and attention.
OTH
ER
INFO
RM
ATIO
N
JAPAN TOBACCO INC. ANNUAL REPORT FY2014 149

Members of the Board
Chairman of the BoardYasutake Tango
Representative DirectorsMitsuomi Koizumi
Yasushi Shingai
Noriaki Okubo
Akira Saeki
Members of the BoardHideki Miyazaki
Motoyuki Oka*
Main Kohda*
* Outside Directors under the Companies Act of
Japan.
Audit & Supervisory Board Members
Futoshi Nakamura
Tomotaka Kojima
Yoshinori Imai*
Hiroshi Ohbayashi*
* Outside Audit & Supervisory Board Members under
the Companies Act of Japan.
Executive Offi cers
PresidentMitsuomi Koizumi
Chief Executive Offi cer
Executive Deputy PresidentsYasushi Shingai
Compliance, Strategy, HR, General
Administration, Legal and Operation
Review & Business Assurance
Noriaki Okubo
Pharmaceutical, Beverage, and
Processed Food Business
Akira Saeki
President, Tobacco Business
Hideki Miyazaki
CSR, Finance and Communications
Senior Executive Vice PresidentsKenji Iijima
Chief Marketing & Sales Offi cer,
Tobacco Business
Ryoji Chijiiwa
Compliance and
Chief General Aff airs Offi cer
Mutsuo Iwai
Chief Strategy Offi cer
Executive Vice PresidentKazuhito Yamashita
Head of China Division, Tobacco Business
Senior Vice PresidentsJunichi Fukuchi
Chief Corporate, Scientifi c & Regulatory
Aff airs Offi cer, Tobacco Business
Yasuyuki Yoneda
Chief R&D Offi cer, Tobacco Business
Masahiko Sato
Head of Manufacturing General Division,
Tobacco Business
Kiyohide Hirowatari
Head of Tobacco Business Planning
Division, Tobacco Business
Yasushi Hasegawa
Head of Domestic Leaf Tobacco
General Division, Tobacco Business
Muneaki Fujimoto
President, Pharmaceutical Business
Shigenori Ohkawa
Head of Central Pharmaceutical Research
Institute, Pharmaceutical Business
Goichi Matsuda
Head of Beverage Business
Ryoko Nagata
CSR
Takehiko Tsutsui
Business Development and Corporate
Strategy
Chito Sasaki
Chief Human Resources Offi cer
Naohiro Minami
Chief Financial Offi cer
Yuki Maeda
Chief Communications Offi cer
Haruhiko Yamada
Chief Legal Offi cer
Members of the Board, Audit & Supervisory Board Members, and Executive Offi cers
150 JAPAN TOBACCO INC. ANNUAL REPORT FY2014
(As of March 20, 2015)

Members of JTI Executive Committee
Thomas A. McCoy
President and Chief Executive Offi cer
Masamichi Terabatake
Deputy CEO, Executive Vice President
Emerging Products & Corporate Strategy
Eddy Pirard
Executive Vice President Business
Development, Corporate Aff airs and
Corporate Communications
Jorge da Motta
Regional President Central Europe
Bruno Duguay
Senior Vice President Compliance and
Corporate Social Responsibility
Stefan Fitz
Regional President Asia Pacifi c
Roland Kostantos
Senior Vice President Finance, Information
Technology and Chief Financial Offi cer
Paul Neumann
Senior Vice President Global Leaf
Howard Parks
Senior Vice President
Marketing & Sales
Fadoul Pekhazis
Regional President Middle East, Near East,
Africa, Turkey and World Wide Duty Free
Michel Poirier
Regional President Americas
Jörg Schappei
Senior Vice President Human Resources
Bill Schulz
Senior Vice President Global Supply Chain
Takehisa Shibayama
Senior Vice President Research &
Development
Kevin Tomlinson
Regional President CIS+
Vassilis Vovos
Regional President Western Europe
Wade Wright
Senior Vice President Legal &
Regulatory Aff airs
OTH
ER
INFO
RM
ATIO
N
JAPAN TOBACCO INC. ANNUAL REPORT FY2014 151
(As of April 1, 2015)

Adjusted Operating Profi t: Operating profi t + Amortization cost of acquired intangibles + Adjusted items (income
and costs)*.* Adjusted items (income and costs) = impairment losses on goodwill ± restructuring income and costs ± others
Adjusted EPS: (Profi t or loss attributable to owners of the parent company ± adjustment items (income and costs)*
± tax and minority interests adjustments) / (weighted-average common shares + increased number of
ordinary shares under subscription rights to shares)* Adjustment items (income and costs) = impairment losses on goodwill ± restructuring income and costs ± others
Adjusted Profi t: Profi t for the year (profi t attributable to owners of the parent company) ± adjustment items
(income and costs)* ± (tax and minority interests adjustments)* Adjustment items (income and costs): impairment losses on goodwill± restructuring income and costs ± others
BnU: Billion Units.
CAGR: Compound annual growth rate.
Contraband: Genuine products smuggled from abroad. Genuine products diverted from the legitimate supply chain
and sold in a country diff erent from the intended market of retail sale and without domestic duty paid in that country.
Constant Exchange Rates: Constant exchange rates measures are computed by restating current year results at
the previous year’s foreign currency exchange rate. Results at constant rates of exchange should be considered in
addition to, not as a substitute for, results reported in accordance with IFRS.
Core revenue (International Tobacco Business): Includes revenues from waterpipe tobacco and emerging
products, but excludes revenues from distribution, contract manufacturing and other peripheral businesses.
Core Revenue (Japanese Domestic Tobacco Business): Excludes revenue from the distribution business
of imported tobacco.
Counterfeit: Fake products appearing to be a genuine brand. Products protected by intellectual property rights
which are manufactured without authorization from the rights’ owners and with the intent to copy the genuine
brand to deceive the consumer, also sold without duties being paid.
FCF (Free Cash Flow): Cash fl ow from operating activities + Cash fl ow from investing activities excluding the
following items:
• Cash fl ows from interest and dividends received and its tax eff ect / interest paid and its tax eff ect in
operating activities.
• Cash fl ows from purchase of short-term investment securities, proceeds from sale and redemption of short-
term investment securities, purchase of investment securities, proceeds from sale of investment securities,
payments into time deposits, proceeds from withdrawal of time deposits and others in investing activities
(those from purchase/sale of securities held for business operation are not included here).
GFB: Global Flagship Brands (Winston, Camel, MEVIUS, LD, Benson & Hedges, Glamour, Silk Cut and Sobranie).
FY2014: Results for the fi scal year ended December 31, 2014.
In FY2014, the Company and its subsidiaries with fi scal year ends other than December 31 have changed their fi scal
year ends to December 31.
The fi scal year end for international business continues to be December 31 as before, hence the Group consolidates
fi nancial results of international business for the twelve-month period from January 1, 2014 to December 31, 2014 into
the Group’s consolidated fi nancial results for the nine months ended December 31, 2014 (Reported basis).
For the purpose of fair comparison of business performance, we are providing fi gures for the twelve-month period
from January 1, 2014 to December 31, 2014 (Like-for-Like basis) with regard to all business segments.
Unless otherwise stated, terms and numbers reported in this glossary are in accordance with IFRS.
Glossary of Terms
152 JAPAN TOBACCO INC. ANNUAL REPORT FY2014

Illicit whites: Legitimately manufactured brands intentionally sold on the illicit market. Brands manufactured
legitimately in one country but smuggled into another country to provide consumers with cheap brands, also
without duties being paid.
IFRS: International Financial Reporting Standards.
JPY BN: Billion Japanese Yen.
Restated: See ‘Constant Exchange Rates’.
Revenue: Excluding tobacco excise taxes and revenue from agent transactions.
Profi t: Profi t attributable to owners of the Parent.
TableMark: References to “TableMark” are to TableMark Holdings Co. Ltd., TableMark Co. Ltd.
Total Shipment Volume (International Tobacco Business): Includes fi ne cut, cigars, pipe tobacco and snus but
excludes contract manufactured products, waterpipe tobacco and emerging products.
Total Sales Volume (Japanese Domestic Tobacco Business): Excludes sales volume of domestic duty free and
the China business.
US$ MM: Million US Dollars.
Results for Nine months ended December 31, 2014 (Reported basis)For domestic businesses: consolidated nine-month
results from April 1 to December 31, 2014.
For international business: consolidated twelve-month
results from January 1 to December 31, 2014.
Results for Jan-Dec 2014 (Like-for-Like basis):For the purpose of fair comparison of business
performance, we also provide fi gures with regard to
all business segments for January – December 2014,
in comparison to results for the twelve-month period
for January – December 2013.
• Revenue, operating profi t, adjusted operating
profi t and profi t attributable to owners of the parent
company for January – December, 2014 would be
disclosed in the Financial Statements and Notes,
which would be audited.
• For the purpose of fair comparison and reference,
the same accounting methods were applied to both
fi nancial results of January – December 2013 and
2014. Financial results of January – December, 2013
would not be audited.
Results for the year ended December 2015.With regard to the forecast for FY2015, the fi gures are
presented on a January to December basis.
Jan Mar
Apr Jun
Jul Sep
Oct Dec
Jan Mar
Apr Jun
Jul Sep
OctDec
Domestic
International
2013 Jan – Dec 2014 Jan – Dec
Jan Mar
Apr Jun
Jul Sep
Oct Dec
Jan Mar
Apr Jun
Jul Sep
OctDec
Domestic
International
FY2013 FY2014
Jan Mar
Apr Jun
Jul Sep
Oct Dec
Jan Mar
Apr Jun
Jul Sep
OctDec
Domestic
International
FY2014 FY2015
OTH
ER
INFO
RM
ATIO
N
JAPAN TOBACCO INC. ANNUAL REPORT FY2014 153

Head Offi ce
2-1, Toranomon 2-chome,
Minato-ku, Tokyo 105-8422, Japan
Tel: 81-3-3582-3111
Fax: 81-3-5572-1441
URL: www.jt.com
Date of Establishment
April 1, 1985
Paid-in Capital
¥100 billion
JT International S.A.
1, Rue de la Gabelle CH-1211 Geneva 26,
Switzerland
Tel: +41 (0)22-703-0777
Fax: +41 (0)22-703-0789
URL: www.jti.com
154 JAPAN TOBACCO INC. ANNUAL REPORT FY2014
Corporate Data

2-1, Toranomon 2-chome,
Minato-ku, Tokyo 105-8422, Japan
Tel: (81) 3-3582-3111
Fax: (81) 3-5572-1441
URL: http://www.jt.com/
This annual report is printed using
ink that contains less than 1% Volatile
Organic Compounds (VOCs).
Printed in Japan
Japan Tobacco Inc.