Embed Size (px)
Citation preview

911 Centers in Oregon: Efficiencies Through Consolidation
Jeff RasmussenPortland State University EMPA Capstone Presentation 2012

1) Background of the Project
2) Goal & Purpose
3) Description of Research
Methods
4) Description of Research
Findings
5) Significance of the Project
6) Acknowledgements
911 Centers in Oregon: Efficiencies Through Consolidation

1) Background of the Project
A. Jefferson County Conditions
B. State of Oregon Conditions
C. 911 History and Trends
911 Centers in Oregon: Efficiencies Through Consolidation
1) Background of the Project
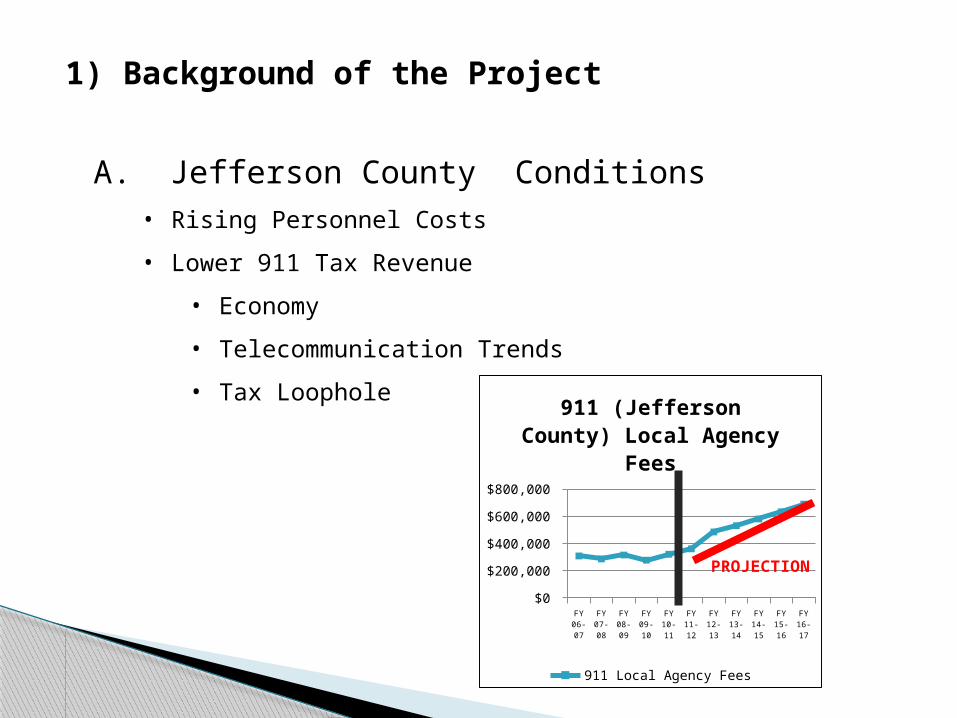
A. Jefferson County Conditions• Rising Personnel Costs
• Lower 911 Tax Revenue
• Economy
• Telecommunication Trends
• Tax Loophole
FY 06-07
FY 07-08
FY 08-09
FY 09-10
FY 10-11
FY 11-12
FY 12-13
FY 13-14
FY 14-15
FY 15-16
FY 16-17
$0
$100,000
$200,000
$300,000
$400,000
$500,000
$600,000
$700,000
$800,000
911 (Jefferson County) Local Agency Fees
911 Local Agency Fees
PROJECTION

1) Background of the Project
B. State of Oregon Conditions• State Legislature Budget Notes in 2009, 2010, and 2012
• 911 Tax Sunsets in 2013 ($0.75/month – 1995)
• NG911 (Text, Pictures, and Video)
• 2012 Kimball Report – Savings of $31 Million if 911
Regionalized
1) Background of the Project
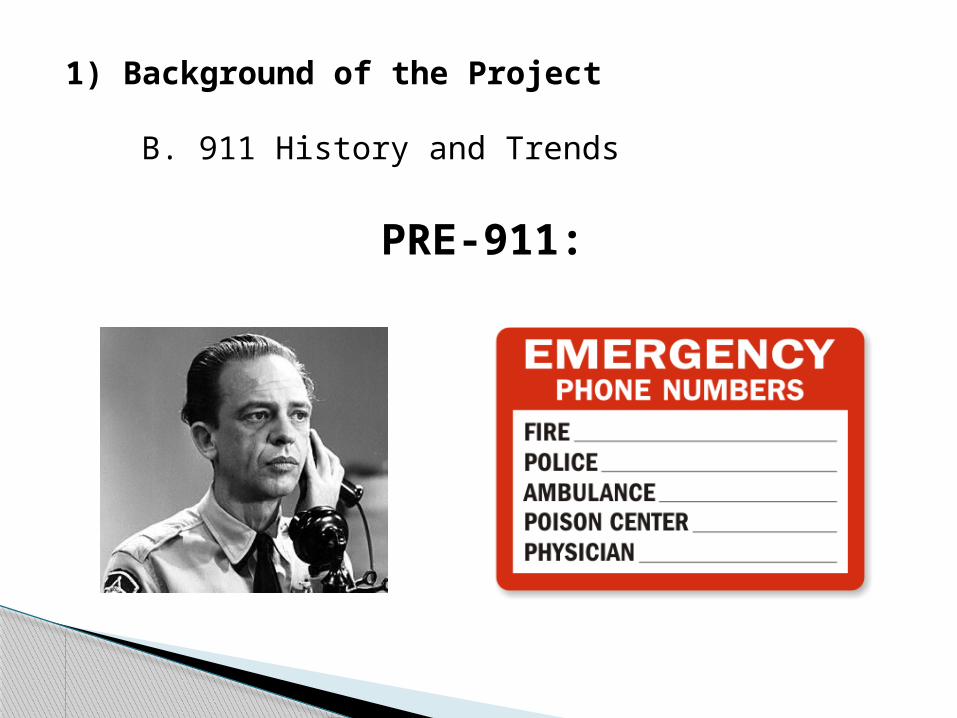
PRE-911:
B. 911 History and Trends

1) Background of the project
PRE-911:
Basic 9-1-1:Three-digit number is dialed. Central Office Switch. The emergency and its location are communicated by voice.
Enhanced 9-1-1:The call is selectively routed to the proper PSAP. The caller’s location and phone number are displayed.
Wireless Phase I & II:The call is selectively routed to the proper PSAP. The caller’s phone number is displayed. The location of the cell tower handling the call and location information is displayed. The call is routed to a PSAP based on cell site/sector information.
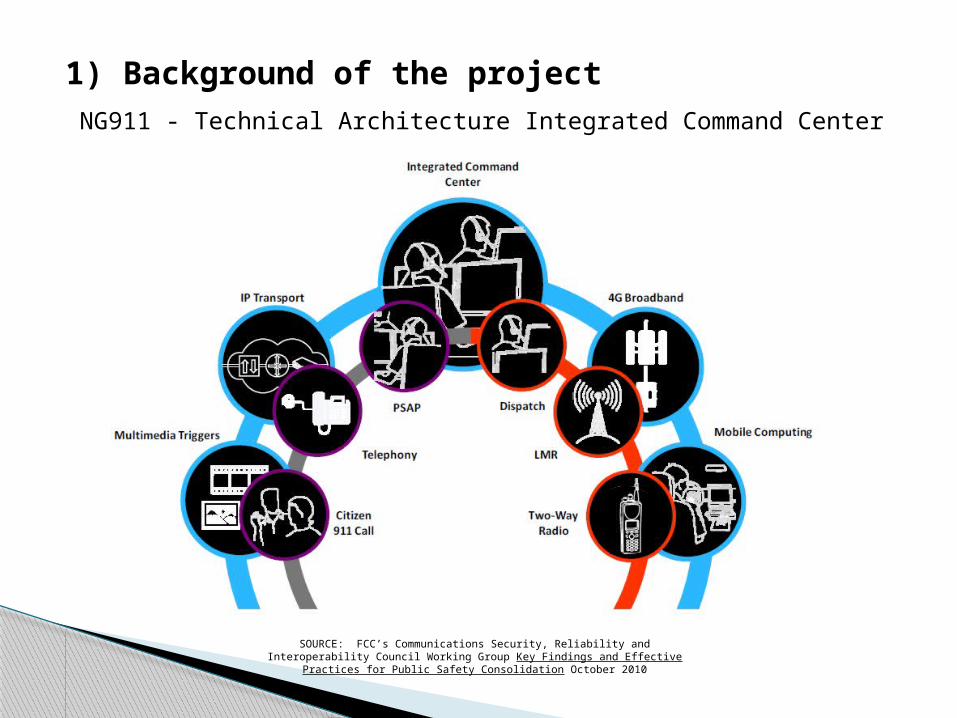
1) Background of the projectNG911 - Technical Architecture Integrated Command Center
SOURCE: FCC’s Communications Security, Reliability and Interoperability Council Working Group Key Findings and Effective Practices for Public Safety Consolidation October 2010

1) Background of the Project
2) Goal & Purpose
3) Description of Research
Methods
4) Description of Research
Findings
5) Significance of the Project
6) Acknowledgements
911 Centers in Oregon: Efficiencies Through Consolidation

2) Goal & Purpose
A. Identify Small PSAPs Costs
B. Identify Characteristics of Lower Cost
PSAPs
C. Identify a Minimally Sized Rightsized PSAP
D. Develop a Financial Template for
Consolidation Scenarios

1) Background of the Project
2) Goal & Purpose
3) Description of Research
Methods
4) Description of Research
Findings
5) Significance of the Project
6) Acknowledgements
911 Centers in Oregon: Efficiencies Through Consolidation

3) Description of Research Methods
A. Data Set
B. Analysis

3) Description of Research Methods
A. Data Set

2) Description of Research Methods
B. Analysis
1. 911 calls per resident
2. 911 tax revenue per resident
3. Percentage of expenditures paid by 911 tax
revenue
4. Cost (gross) per resident
5. Cost (gross) per 911 call received
6. Residents per PSAP employee (FTE)
7. Annual 911 calls per PSAP employee (FTE)
8. Average 911 calls per hour

3) Description of Research Methods
B. Analysis
Grouped PSAPs into the National Emergency Number
Association’s (NENA) three size classifications:
Small: Less than 19,000 population (13 PSAPs)
Medium: Between 19,000 and 100,000 (17 PSAPs)
Large*: Between 100,000 and above (7 PSAPs)
* NENA’s large PSAP classification stops at 140,000 population. The six PSAPs in Oregon greater than 140,000 population are labeled “large” for this analysis.

1) Background of the Project
2) Goal & Purpose
3) Description of Research
Methods
4) Description of Research
Findings
5) Significance of the Project
6) Acknowledgements
911 Centers in Oregon: Efficiencies Through Consolidation

4) Description of Research Findings
A. Smaller PSAP Costs
B. Low Cost PSAP Characteristics
C. Minimally Sized Rightsized PSAP
D. Financial Template for Consolidation Scenarios

4) Description of Research Findings
A. Smaller PSAP Costs
TRI C
ount
y Co
mm
+
*Wal
lowa
Coun
ty S
heriff
+
Harne
y Co
unty
She
riff+
*Joh
n Day
Com
m C
ente
r+
*Mor
row C
ount
y Sh
eriff
+
Bake
r Cou
nty+
*Cur
ry C
ount
y Sh
eriff
Jeffe
rson
Cou
nty Sh
eriff
+
Broo
king
s PD
Linc
oln
City
PD+
Milt
on-Fre
ewat
er C
omm
+
Tole
do Pol
ice
Depar
tmen
t+
Ontar
io 9
-1-1
Prin
evill
e 9-
1-1+
Union
Cou
nty Co
mm
+
Was
co C
ount
y 9-
1-1
Hood
Rive
r Cou
nty Dis
trict+
Mal
heur
Cou
nty Sh
eriff
*Till
amoo
k Co
unty
District+
Asto
ria 9
-1-1
Linc
oln
Coun
ty C
omm
Age
ncy+
Umat
illa
Coun
ty S
heriff
+
Colu
mbi
a 9-
1-1
Com
m D
istrict+
Corv
allis
Reg
iona
l Com
m+
Yam
hill
Coun
ty C
omm
+
Klam
ath
Com
m D
istrict+
Lake
Osw
ego
Com
mun
icat
ions
N. Mar
ion
Coun
ty C
omm
(NORC
OM)
*Her
misto
n PD
Newbe
rg-D
unde
e Co
mm
Desch
utes
Cou
nty Dis
trict+
Bure
au o
f Em
erg.
Com
m (P
ortla
nd)+
Emer
g. C
omm
S. O
re (J
acks
on)+
Was
hing
ton
Coun
ty C
omm
+
Dougl
as C
ount
y
Will
amet
te V
alle
y Co
mm
(Sal
em)
Clac
kam
as C
ount
y+ $-
$20.00
$40.00
$60.00
$80.00
$100.00
$120.00
$140.00
Gross Cost Per Resident & 911 Tax Revenue Per ResidentGross Cost Per Resident
911 tax per resident
Small Size PSAPs Large Size PSAPs
Medium Size PSAPs

4) Description of Research Findings
B. Low Cost PSAP Characteristics
Small Medium Large Combined -
1,000
2,000
3,000
4,000
5,000
6,000
1,446
3,356
5,597
4,423
Residents per PSAP FTE
Residents per PSAP FTE

4) Description of Research Findings
TRI C
ount
y Com
m+
Linc
oln
City P
D+
*Wal
lowa
Count
y Sh
eriff
+
Harne
y Cou
nty
Sher
iff+
Hood
River
Cou
nty
District+
Brook
ings
PD
*Tillam
ook Cou
nty
District+
Ont
ario
9-1
-1
Jeffer
son
Count
y Sh
eriff
+
Linc
oln
Count
y Com
m A
genc
y+
Umat
illa
Count
y Sh
eriff
+
*Her
misto
n PD
Desch
utes
Cou
nty
District+
Corva
llis Reg
iona
l Com
m+
Klam
ath
Comm
District+
Yam
hill Cou
nty
Comm
+
Dougl
as C
ount
y
Was
hing
ton
Count
y Com
m+
Clack
amas
Cou
nty+
-
1,000
2,000
3,000
4,000
5,000
6,000
7,000
8,000
9,000
$0.00
$20.00
$40.00
$60.00
$80.00
$100.00
$120.00
$140.00
Residents per PSAP FTE and Cost per ResidentResidents per PSAP FTE Gross Cost per resident
911 Special Districts
PSAPs that have a higher ratio of residents served per FTE is a compelling factor that translates into lower costs per resident.

4) Description of Research Findings
The average of the 10 lowest cost PSAPs was $19.75 per resident.
These PSAPs average resident to FTE ratio is 5,273.
Small Medium Large Recommended Combined -
1,000
2,000
3,000
4,000
5,000
6,000
1,446
3,356
5,597 5,273
4,423
Residents per PSAP FTE

4) Description of Research Findings
C. Minimally Sized Rightsized PSAP
1. Minimum staffing for double coverage.
2. A PSAP with 13.0 FTEs using the recommended resident to staffing ratio (5,237), would be highly efficient if it served at least 68,549 residents.
3. This population size and staffing is consistent with an Oregon PSAP and similar to NENA staffing recommendations of similar sized PSAPs.

4) Description of Research Findings
D. Financial Template for Consolidation Scenarios

1) Background of the Project
2) Goal & Purpose
3) Description of Research
Methods
4) Description of Research
Findings
5) Significance of the Project
6) Acknowledgements
911 Centers in Oregon: Efficiencies Through Consolidation

5) Significance of the Project
A. 2013 Legislative Session
B. Public Safety – Double Coverage
PSAPs that are not providing double coverage 24/7 are putting citizens in harms way by not providing adequate resources to handle multiple emergency situations.

1) Background of the Project
2) Goal & Purpose
3) Description of Research
Methods
4) Description of Research
Findings
5) Significance of the Project
6) Acknowledgements
911 Centers in Oregon: Efficiencies Through Consolidation

6) Acknowledgements

Questions


![EMPA Koller[1]](https://img.pdfslide.net/doc/110x75/577ccf8e1a28ab9e789008fa/empa-koller1.jpg)