Embed Size (px)
Citation preview


Editorial Board
I
JAQM Editorial Board Editors Ion Ivan, University of Economics, Romania Claudiu Herteliu, University of Economics, Romania Gheorghe Nosca, Association for Development through Science and Education, Romania Editorial Team Cristian Amancei, University of Economics, Romania Catalin Boja, University of Economics, Romania Radu Chirvasuta, “Carol Davila” University of Medicine and Pharmacy, Romania Irina Maria Dragan, University of Economics, Romania Eugen Dumitrascu, Craiova University, Romania Matthew Elbeck, Troy University, Dothan, USA Nicu Enescu, Craiova University, Romania Bogdan Vasile Ileanu, University of Economics, Romania Miruna Mazurencu Marinescu, University of Economics, Romania Daniel Traian Pele, University of Economics, Romania Ciprian Costin Popescu, University of Economics, Romania Aura Popa, University of Economics, Romania Marius Popa, University of Economics, Romania Mihai Sacala, University of Economics, Romania Cristian Toma, University of Economics, Romania Erika Tusa, University of Economics, Romania Adrian Visoiu, University of Economics, Romania Manuscript Editor Lucian Naie, SDL Tridion

Advisory Board
II
JAQM Advisory Board Luigi D’Ambra, University of Naples “Federico II”, Italy Ioan Andone, Al. Ioan Cuza University, Romania Kim Viborg Andersen, Copenhagen Business School, Denmark Tudorel Andrei, University of Economics, Romania Gabriel Badescu, Babes-Bolyai University, Romania Catalin Balescu, National University of Arts, Romania Avner Ben-Yair, SCE - Shamoon College of Engineering, Beer-Sheva, Israel Constanta Bodea, University of Economics, Romania Ion Bolun, Academy of Economic Studies of Moldova Recep Boztemur, Middle East Technical University Ankara, Turkey Constantin Bratianu, University of Economics, Romania Irinel Burloiu, Intel Romania Ilie Costas, Academy of Economic Studies of Moldova Valentin Cristea, University Politehnica of Bucharest, Romania Marian-Pompiliu Cristescu, Lucian Blaga University, Romania Victor Croitoru, University Politehnica of Bucharest, Romania Cristian Pop Eleches, Columbia University, USA Michele Gallo, University of Naples L'Orientale, Italy Angel Garrido, National University of Distance Learning (UNED), Spain Bogdan Ghilic Micu, University of Economics, Romania Anatol Godonoaga, Academy of Economic Studies of Moldova Alexandru Isaic-Maniu, University of Economics, Romania Ion Ivan, University of Economics, Romania Radu Macovei, “Carol Davila” University of Medicine and Pharmacy, Romania Dumitru Marin, University of Economics, Romania Dumitru Matis, Babes-Bolyai University, Romania Adrian Mihalache, University Politehnica of Bucharest, Romania Constantin Mitrut, University of Economics, Romania Mihaela Muntean, Western University Timisoara, Romania Ioan Neacsu, University of Bucharest, Romania Peter Nijkamp, Free University De Boelelaan, The Nederlands Stefan Nitchi, Babes-Bolyai University, Romania Gheorghe Nosca, Association for Development through Science and Education, Romania Dumitru Oprea, Al. Ioan Cuza University, Romania Adriean Parlog, National Defense University, Bucharest, Romania Victor Valeriu Patriciu, Military Technical Academy, Romania Perran Penrose, Independent, Connected with Harvard University, USA and London University, UK Dan Petrovici, Kent University, UK Victor Ploae, Ovidius University, Romania Gabriel Popescu, University of Economics, Romania Mihai Roman, University of Economics, Romania Ion Gh. Rosca, University of Economics, Romania Gheorghe Sabau, University of Economics, Romania Radu Serban, University of Economics, Romania Satish Chand Sharma, Janta Vedic College, Baraut, India Ion Smeureanu, University of Economics, Romania Ilie Tamas, University of Economics, Romania Nicolae Tapus, University Politehnica of Bucharest, Romania Timothy Kheng Guan Teo, University of Auckland, New Zeeland Daniel Teodorescu, Emory University, USA Dumitru Todoroi, Academy of Economic Studies of Moldova Nicolae Tomai, Babes-Bolyai University, Romania Victor Voicu, “Carol Davila” University of Medicine and Pharmacy, Romania Vergil Voineagu, University of Economics, Romania

Contents
III
Page Quantitative Methods Inquires
Mark VERHEYDEN, Katie GOEMAN Does (Company) Size Matter? Differences In Social Media Usage For Business Purposes
3
Marian Pompiliu CRISTESCU, Ion IVAN, Laurentiu CIOVICA, Liviu CIOVICA Specification Methods of Economic Processes 17 Mohammad Ohid ULLAH, Md. Abu HASAN, Taj UDDIN Environmental Awareness and disaster factors in Bangladesh 34 Ştefan Cristian CIUCU, Mihai REBENCIUC, Ionuţ Alexandru PETRE Addenda to Weibull Distribution In Matlab (Definitions, Code Sources For Functions, Applications)
43
Book Reviews
Vasile Alecsandru STRAT Book Review on WEB SOCIAL SCIENCE (Concepts, Data and Tools for social scientist in the digital age) by ROBERT ACKLAND
55
Loredana MANASIA
Book Review on Nick EMMEL: Sampling and Choosing Cases in Qualitative Research. A realist approach
58

Quantitative Methods Inquires
3
DOES (COMPANY) SIZE MATTER? DIFFERENCES IN SOCIAL MEDIA USAGE FOR BUSINESS PURPOSES
Mark VERHEYDEN PhD Candidate, Faculty of Economic and Social Sciences and Solvay Business School, Vrije Universiteit Brussel, Brussels, Belgium. E-mail: [email protected]
Katie GOEMAN PhD, Hogeschool-Universiteit Brussel, Economics and Management, Brussels, Belgium. E-mail: [email protected]
ABSTRACT Ninety-nine percent of all companies in the European Union (E.U.) are small to
medium-sized enterprises (SMEs). Together, they provide employment for more than half of the European workforce. In its digital Agenda communications and JRC reports, the E.U. expressed high hopes regarding the expected positive impact of social media on employment, social inclusion and economic growth. These observations imply that the E.U. needs to focus on social media adoption if it wants to attain its targets as defined in the Europe 2020 strategy. A study by the International Data Corporation revealed a growing acceptance of social media in SMEs. (Bonagura, 2013) The question addressed in this dissertation is whether company size alters the nature and intensity of the adoption process. To this end an online survey was distributed in a knowledge-sharing network, yielding 182 responses, a 21 % response rate. Our survey covered four areas, which a McKinsey report (2012) identified as holding much potential for value creation, namely (1) internal communication, (2) external communication, (3) knowledge sharing and (4) recruitment. The analysis of our data showed that Social Network Sites (SNS) like Facebook or Linkedin are the most popular platforms and are mostly used to communicate with external stakeholders. Statistical significant differences related to company size were mainly found with regard to the use of internal social media, which are mostly adopted in large enterprises. A second interesting finding is that both SMEs and larger companies reported important benefits related to the adoption of social media. To conclude, a number of factors were identified as hampering the adoption process. All organizations seem to be in need of both tangible (money) and intangible (time, knowledge, skills) resources. Blocking access to social media seems to be the only challenge significantly more prevalent in large enterprises.
Keywords: social media; company size; social network sites; SNS; SMEs.

Quantitative Methods Inquires
4
INTRODUCTION
In its latest Digital Agenda communications and JRC reports, the European Union
expressed high hopes regarding the impact of social media on employment, social inclusion and economic growth. Unquestionably, these ICTs offer strategic opportunities to companies, e.g. new means for participation, new grounds for branding and new types of interaction, both for internal and external business processes. Flipside to this are professional organizations’ concerns about security and privacy, the lack of successful business case examples and the large investments needed to exploit social media optimally.
In February 2013, the International Data Corporation (IDC) announced findings from
a large-scale survey in five western European countries about social media adoption within small and medium-sized enterprises (SMEs). Newsworthy is their prognosis of a swift evolution of social media deployment for business purposes, next to the statement that the level of adoption is strongly related to company size. Such studies offer relevant insights, considering that ninety-nine percent of all companies in the European Union are SMEs, and given that these employ over half of the European workforce. Other recent monitoring studies with regard to social media focused significantly more on private than business usage, or were conducted to explore corporate employment of specific applications such as social networking services, twitter or internal networks within particular areas such as public relations.
There are only a handful of empirical studies on the adoption of Internet
technologies in which the authors define clearly which platforms are considered to be social. To avoid the pitfalls of focusing on a specific platform of which the life expectancy is unknown, we have chosen to use an existing classification of different categories of platforms. We consider this important to avoid the danger of using social media as a container term. Using a detailed classification additionally allows to test more in-depth whether differences in adoption exist between different platforms according to company size. An additional contribution of this study is that it offers a first look at the adoption process of different social media tools in a knowledge-sharing network.
This goal of this study is to detect whether SMEs differ significantly from larger
enterprises regarding the adoption of social media for business purposes. Such endeavor is relevant given the aforementioned gaps in the academic literature. Firstly, the study seeks to address the following question: How and why do organizations adopt social media for business purposes? To this end, a survey instrument was developed and pretested in order to measure social media usage in terms of tools, intensity and diversity of use. The central constructs of the survey are derived from several models on the adoption and diffusion of ICTs of which the Innovation Diffusion Theory (IDT) (Rogers 2003) and the Unified Theory of Acceptance and Use of Technology (UTAUT) (Venkatesh, Thong, and Xu 2012) are the most important ones.
Based on a McKinsey report (Chui et al. 2012), we demarcated four business
purposes where the adoption of social media holds most potential for value creation: 1)

Quantitative Methods Inquires
5
internal communication, 2) external communication, 3) knowledge sharing, and 4) recruitment. The McKinsey study additionally points out one can expect considerable changes within these particular areas. Secondly, our research aims to identify significant differences in social media usage. It was hypothesized that social media adoption differs significantly depending on company size, expressed in number of people employed. In particular, it was expected that the larger the company, the more likely it has already adopted use of social media, it employs a greater diversity of social media for a larger variety of business purposes. The reasons for this are thought to be related to Nielsen’s 1-9-90 rule (Nielsen 2006), scale advantages and a different cost structure.
One hundred and fifteen employees from 86 professional organizations were
included in the statistical analysis. The main results can be summarized as follows: 1) overall, within the corporate sector most popular social media tools are internal networks and social network services, which are mainly deployed for internal and external communication purposes, 2) our data seem to confirm the idea that larger companies do indeed have the advantage over SMEs when it comes to the adoption of social media. These results add to previous research, and indicate that further, more broad-scale research is needed to test differences in social media adoption between SMEs and large companies. Implications for practice and theory are discussed.
BACKGROUND
A first central concept in this study is one that has been popularized under the name
of ‘social media’. Most scholars would agree that this term is rather vague and open to all kinds of ICT platforms. Some authors take a very broad view on this term while others tend to restrict it to popular Social Networking Services (SNS) like Facebook and Linkedin. Some approach the concept from a technological perspective while others use classifications based on the characteristics and functions of the different tools (Abeysinghe and Alsobhi 2013, 267).
A number of scholars have argued that social media did not ‘suddenly appear’ but
are instead the outcome of a long evolution in information technologies (Backhouse 2009, 2). These new ‘social’ media platforms are part of an evolution in what has been coined ‘Web 2.0’ by Tim O’Reilly. Web 2.0, according to O’Reilly, means a “change from the web as a publishing platform to a tool supporting participation (Fuchs 2007, 390).” Manuel Castells (Castells 2011) prefers to talk about a paradigm shift in which the age of mass communication has given way to an age of mass-self communication. The implementation of Web 2.0 tools in a business context has sometimes been referred to as ‘Enterprise 2.0’ (Mcafee 2006).
It is clear that social media as a concept defies easy definitions. Common
characteristics include participation of the user, computer mediated communication (CMC) and more interactivity between producer and consumer, sometimes labeled ‘Produsage’ (Bruns 2008). In this article we have chosen to use the classification made by Cann et al. (Cann, Dimitriou, and Hooley 2011).

Quantitative Methods Inquires
6
Table 1: Classification of Social Media Tools by Cann et al. (2011)
In contrast to the previous concepts the idea of what constitutes an SME has been
clearly defined by EU law (EU recommendation 2003/361). In this definition, two criteria are taken into account, namely the number of employees and the yearly turnover or balance sheet total. We have taken the constant in this definition, being the number of employees, as central criterion in our analysis.
ADOPTION AND USE OF SOCIAL MEDIA: EXISTING MODELS The aim of this section is to provide the reader with an overview of theoretical
frameworks that can be used to study the adoption of social media in professional contexts. The goal is not to discuss the separate models in detail. Instead we have chosen to highlight possible venues for current and future research. The first models presented are general models on the adoption of technology. Next, we list models to study SMEs’ adoption of Information System (IS) innovations. We conclude with a state of the art focusing specifically on the adoption of social media in SMEs.
Table 2: Models on the adoption and diffusion of technology
Note: Original overview presented in the work of Talukder et al. (Talukder, Quazi, and Djatikusumo 2013, 1687)

Quantitative Methods Inquires
7
Table 3: Models on the adoption of IS innovations in SMEs
Note: Original overview presented in the work of Ramdani et al. (Ramdani, Kawalek, and Lorenzo 2009)
Studies on the organizational adoption of social media can be subdivided into two
groups. A first group of studies is focused on the organizational adoption of social media while a second group puts more emphasis on the individual adoption of these tools. What both groups have in common is that the bulk of all studies concentrate on large enterprises. This has also been noticed by Peris et al. (Peris et al. 2013) who write that: “as a result we can state that in academic research the acceptance of Web 2.0 and social media across companies and especially in the context of SME networks is not considered so far (p. 2795).”
Some scholars argue that the adoption process of different social media can differ.
Barnes & Mattson (Ganim Barnes and Mattson 2009) for example have witnessed growth in some technologies (e.g. SNS, Blogging) while the use of others (e.g. message boards, podcasting) declines. Ramdani et al. (Ramdani, Kawalek, and Lorenzo 2009) offer a possible explanation by arguing that factors influencing the adoption process differ according to the specific tools under study.
In this research we focus on the adoption of social media at the organizational level
in contrast to adoption at the personal level. This means that adoption is only considered as such when it is accepted as an official communication tool within the organization. Additionally, we do not only consider social media use but also adoption, perceived output and obstacles preventing adoption. We have chosen not to focus on specific platforms because these can disappear as witnessed in the rapid decline of previously popular platforms like MySpace and Netlog. Instead we choose to work with categorizations of platforms as suggested by Cann et al. (Cann, Dimitriou, and Hooley 2011).
RETURN ON INVESTMENT (ROI): REPORTED BENEFITS OF USING SOCIAL MEDIA
In 2003 Venkatesh et al. postulated the Unified Theory of Acceptance and Use of
Technology (UTAUT) for explaining user intentions and subsequent usage behavior of information systems. The authors identified performance and effort expectancy, social

Quantitative Methods Inquires
8
influence, and facilitating conditions as determinants with direct impact. The impact of these four key constructs on usage intention and behavior are mediated by gender, age, experience, and voluntariness of use. Subsequent validation of UTAUT in a longitudinal study found it to account for seventy percent of the variance in usage intention (Venkatesh et al. 2003).
In this light we can understand the finding of Durkin et al. (Durkin, McGowan, and
McKeown 2013) who argue that a universally common motivator for social media adoption is that companies share the anxiety of losing out if they do not adopt the new tools. In contrast to what we might expect when reasoning from a rational theory perspective, Durkin et al. (2013) argue that anxiety is the main driver of social media adoption, not a thoughtful and well-planned agenda.
In line with this finding there are a number of studies of which the authors state that
the adoption of social media is often the result of ‘convenient implementation’, mostly focused on achieving quick gains (Annabi and McGann 2013, 63). Under the same heading can be categorized those situations where social media are adopted to respond to an internal communication or public relations crisis (Norman and Huerta 2006).
In SMEs, decisions on the adoption of new tools cannot be detached from the
entrepreneur’s perception of their use. According to Marcati et al. (Marcati, Guido, and Peluso 2008, 1583) entrepreneurs tend to think of innovations as incremental and more dealing with production than marketing or accounting. However, we feel that the important nuance must be made that these findings may vary according to the business or sector under study.
A survey of the International Data Corporation (IDC) has shown that SMEs seem to
have reached certain maturity in using social media for customer facing and marketing processes but often fail to identify how to leverage social media tools into other areas (Bonagura 2013). Our aim in this study is therefore to focus on a number of fields in which the adoption of social media has most value-creating potential. Based on a McKinsey report (2012), we have identified four domains, which we have labeled “internal communication”, “external communication”, “knowledge sharing” and “recruitment”.
THE ADOPTION OF SOCIAL MEDIA: EXISTING CHALLENGES Related to the previous section on ROI are the existing challenges in adopting social
media successfully. Kuikka & Åkkinen (Kuikka and Äkkinen 2011) have categorized these challenges into two broad groups. A first group consists of challenges organizations face internally. One of the most important elements hindering the adoption is a lack of resources. This problem is expected to be even more prominent in SMEs where budgets are tight and employees already combine tasks in their current jobs. As already mentioned, the personality of the entrepreneur is also an important factor in understanding why some SMEs adopt new technological tools while others do not. Internal discussions on whether to adopt a new technology also often revolve around the question of clear arrangements on authorization and ownership in using the new tools.

Quantitative Methods Inquires
9
External challenges, the second group in the analysis of Kuikka & Åkkinen (2011),
are those factors that cannot be entirely controlled by the organization. These same authors mention legal issues, concerns about the alignment of public and private network identity as well as fear for the effects on company reputation as belonging to this group. A central element in all these factors is an existing uneasiness of corporate decision makers to relinquish control.
Research on the factors hampering the adoption of social media in SMEs is still in its
early phases. This gap in the literature is even more pressing in the face of a study published by Gartner in which the authors argue that 80% of social business initiatives will provide disappointing results over the next three years (Mann et al. 2012). In a common social business report, MIT Sloan Management Review and Deloitte report three reasons why social media initiatives fail so often. Full details can be found in the report (Kiron et al. 2013). However, what is interesting for this research is what these reasons have in common. The conclusion comes down to the observation that organizations launch social business projects without clear objectives, are reluctant to invest resources (mainly time and money) and expect too much too fast in terms of financial returns. These ingredients create a fertile soil for boom-and-bust scenarios in which managers expect too much from a technology that contributes to their disappointment if the technology does not bring the expected results or financial gains.
METHOD The first step in answering the question whether SMEs are different from larger
enterprises with regard to the adoption of social media platforms consists of selecting an appropriate sample. The option of choosing a random sample of all enterprises active in a given geographical location was dropped because there are no indications to expect differences based on this factor. Instead, we tried to find a network of organizations of which the members are expected to be amongst the early adopters. It is expected that if differences with regard to company size are spotted here, they are likely to be found in other samples as well. VOV, a non-profit networking organization focusing on Human Resources (HR), more specific knowledge sharing in public and private businesses, fulfilled the necessary criteria and granted access to its members’ database. A sufficiently large sample was obtained ensuring the reliability of our results.
An online anonymous survey was developed and disseminated through the use of
Qualtrics. The reason for choosing this type of survey is related to the fact that online communication is the standard mode of interaction between VOV and its members. Other means of distributing the survey are not expected to significantly alter the obtained results. The survey was sent to all members of the network, being 848 employees from 396 organizations. The members are active in various professional activities in different economic sectors. The questionnaire was distributed between 19 April and 8 May 2012 and yielded 182 responses, which results in a response percentage of 21 %. The obtained data can be considered statistically representative for all members of VOV Network when working with a confidence level of 95% and a margin of error of 7 %.

Quantitative Methods Inquires
10
A total of 67 responses were excluded from further analysis because they did not
supply sufficient information about the variables of interest. All people who filled out the survey are members of VOV and therefore comparable in terms of their ability to answer the survey questions. Most of the respondents (43%) are working in HR departments.
The survey consisted of 27 questions falling under 4 headings reflecting the 4
selected fields of interest (internal communication, external communication, knowledge sharing and recruitment). A number of statistical tests were run in SPSS to detect whether the observed differences in the use of different social media platforms and the intensity of this use in the aforementioned fields of interest were also statistically significant. The results of this analysis are presented in the following section.
RESULTS An overview of the literature has led us to the conclusion that there are few studies
offering comparative data on the adoption rates of different social media platforms in organizational contexts allowing scholars to determine whether social media adoption takes on different forms in SMEs. Based on the classification of social media tools by Cann et al. (2011) we have looked for significant differences between SMEs and larger organizations with regard to the adoption of different social media platforms in four important value-creating areas (internal communication, external communication, knowledge sharing, recruitment).
Table 4: Adoption of Social Media Tools in Four Value-creating areas
n = 105 (total number of respondents) * Significant differences found between SMEs and larger organizations at 0,05 level ** Significant differences found between SMEs and larger organizations at 0,001
level The results in table 1 indicate that, in almost all cases, less than half of the
respondents report using social media platforms in our domains of interest. Social networking services (including popular platforms like Facebook and Linkedin) are clearly the most used. The figures show that blogging and microblogging services like Blogger, Twitter and Wordpress as well as internal (social) networks including social intranets are also widely used. In line with our expectations, these data suggest that not all platforms are used to the same end. Some, like internal social networks are most suited - and therefore logically also most used – for internal communication purposes while other tools, like Social Networks

Quantitative Methods Inquires
11
Services (SNS) and (micro)blogging are rather used to communicate with external stakeholders.
Table 5: Statistically Significant Differences between SMEs and larger enterprises regarding the adoption of social media platforms in four domains of interest
Only in a few cases did we find significant statistical differences between SMEs and larger organizations with regard to the adoption of different social media tools in the four areas of interest. The details of these results can be found in table 2. A remarkable finding is that 3 out of 7 statistically significant differences were related to the use of an internal social network. These figures show that there is a higher chance of finding internal social networks in large companies.
Where statistical significant evidence was found, the data seem to argue in favor of
the hypothesis that large companies have higher adoption rates of different social media platforms in the four value-creating areas under study. However, higher adoption rates do not give us any information about the intensity with which these platforms are used. A different analysis comparing the mean ranks regarding the intensity of use of different platforms between SMEs and their larger counterparts revealed, in line with our hypothesis, that the intensity with which social media platforms are used is also higher in large enterprises. Still, a critical nuance to be made is that this conclusion does only hold in the case of SNS and internal social networks. Unsurprisingly, these are also the best known and most used platforms. The lack of statistically significant results in the other cases is most likely due to the low adoption rates of these other social media platforms.
Table 6: Comparing the intensity of use of different social media platforms between SMEs and larger organizations
There are several reasons why organizations adopt social media into their daily workings. Amongst the more important reasons are the expected gains derived from this adoption process. This can be expected since organizations hope to get a good return on

Quantitative Methods Inquires
12
investment (ROI). A remarkable finding of our survey is that respondents report positive effects brought by using social media and this in all four fields included in the analysis. However, no statistically significant differences were found between SMEs and larger organizations regarding these reported benefits. The data additionally reveal that respondents have a hard time calculating the effects of social media adoption on company turnover. This conclusion can be drawn from the fact that almost half of the respondents who answered this question took a neutral position.
Table 7: Reported benefits of adopting social media
Of our sample 78,1 % of all respondents indicates that their organization uses social media professionally. Except for those respondents who were not sure (4,4%) this leaves us with 17,5 % reporting their organization has not yet adopted social media. This brings us to the important question why certain organizations opt-out for this innovation. Based on our theoretical framework including several models like Rogers’ innovation diffusion model and Venkatesh’ et al. Unified Theory of Acceptance and Use of Technology (UTAUT), we have included a number of questions to briefly test which factors respondents consider to be decisive obstructions in the adoption process. A statistically significant difference was found between SMEs and larger organizations with regard to blocking access to social media platforms. This phenomenon seems to be substantially more common in the latter (Chi2= 4,508; p= 0,034). Lack of knowledge and skills on how to use social media as well as lack of time are also frequently named, regardless of the size of the organization, as obstacles in the adoption process.
DISCUSSION AND CONCLUSION In the European Union SMEs make up 99% of all companies and provide
employment for more than half of the European workforce. As a result, the European Commission has no choice but to consider these stakeholders in future initiatives aimed at leveraging social media in order to raise employment rates, encourage social inclusion and stimulate economic growth. Based on a recent IDC study reporting growing acceptance of social media among Western European SMEs, we would be inclined to conclude that things are moving in the right direction. However, the question remains whether an adoption gap still exists between SMEs and larger organizations.
Based on a thorough screening of the academic literature, we have derived the
hypothesis that bigger companies are in the lead with regard to social media adoption and use. Up until now the majority of scholarly contributions have approached social media as an aggregate or focused on a specific platform. Additionally, social media adoption is often studied as if it were a cause in itself. With our research we added to existing knowledge by making comparisons between platforms and this in four areas where, according to a

Quantitative Methods Inquires
13
McKinsey report (2012), most value creation remains untapped. We did not only focus on the adoption of social media platforms in these areas but additionally examined respondents’ perceived ROI of these initiatives. To conclude, those who did not (yet) adopt social media were asked why this was the case.
In spring 2012 a survey was disseminated among members of a knowledge sharing
networking organization. Our data revealed that most respondents are HR professionals working in various organizations. A response rate of 21% resulted in a sample statistically representative for all members of the network. The sample size in itself can be seen as offering a unique view of social media adoption in the early-adopter segment of the market. Our results on the differences in social media adoption and use according to company size are therefore expected to be even more pronounced in random samples.
Our data have shown that social networking sites are the most popular platforms
and that the focus of most organizations is aimed at leveraging social media to communicate with external stakeholders. Where statistically significant differences were found they seem to confirm our initial hypothesis that larger companies, in comparison with SMEs, are more likely to adopt social media platforms and more inclined to use them more intensively. Especially with regard to the adoption of internal social media did we notice significant differences revealing that company size fundamentally affects internal communication processes.
A second group of results shows that respondents report positive effects in several
important fields like customer relationship and company image. Even more interesting is that, with regard to the reported benefits, SMEs do not differ significantly from larger enterprises. This seems to indicate that the benefits of social media are not reserved solely for large organizations.
To conclude we found that factors most frequently named as hampering the
adoption process of social media are factors related to blocked access (significantly more prevalent in large organizations), a lack of knowledge and skills as well as tangible (e.g. money) and intangible (time, effort) resources. From our data we can therefore confirm our initial hypothesis that company size does matter with regard to the adoption of social media and that companies mostly focus their efforts on a few popular platforms like Linkedin, Twitter and Facebook to reach out to external stakeholders. However, once adopted both large organizations and SMEs seem to perceive important benefits. The results are hopeful but do indicate that SMEs are still catching up and lack knowledge, skills and resources to match the efforts of the bigger players. This information should encourage the E.U. to invest its resources where they have most potential to unlock value. Only this way can the E.U. obtain its goals and remain competitive with other economies.

Quantitative Methods Inquires
14
BIBLIOGRAPHY 1. Abeysinghe, Geetha, and Aisha Yaquob Alsobhi. Social Media Readiness in Small
Businesses. In Proceedings of the International Conference Information Systems, 267–72. Madrid, 2013 https://eprints.mdx.ac.uk/11433/1/social%20media%20readiness%20in%20small%20businesses.pdf.
2. Annabi, Hala, and Sean T. McGann Social Media as the Missing Link: Connecting Communities of Practice to Business Strategy. Journal of Organizational Computing and Electronic Commerce 23 (1-2): 56–83. doi:10.1080/10919392.2013.748608, 2013
3. Backhouse, Jenny Social Media: Impacting the Enterprise? In , 9. Izmir, 2009
4. Bonagura, Nina. IDC Study Confirms the Growing Acceptance of Social Media for Business Purposes among Western European SMBs. International Data Corporatation (IDC), 2013 http://www.idc.com/getdoc.jsp?containerId=prIT23968113.
5. Bruns, Axel Blogs, Wikipedia, Second Life, and Beyond: From Production to Produsage. Digital Formations v. 45. New York: Peter Lang, 2008.
6. Cann, Alan, Konstantia Dimitriou, and Tristram Hooley Social Media: A Guide for Researchers. Research Information Network, 2011.
7. Castells, Manuel Communication Power Oxford: Oxford University Press, 2011.
8. Chui, Michael, James Manyika, Jacques Bughin, Richard Dobbs, Charles Roxburgh, Hugo Sarrazin, Geoffrey Sands, and Magdalena Westergren The Social Economy: Unlocking Value and Productivity Through Social Technologies McKinsey Global Institute, 2012. http://www.mckinsey.com/insights/high_tech_telecoms_internet/the_social_economy.
9. Durkin, Mark, Pauric McGowan, and Niall McKeown. Exploring Social Media Adoption in Small to Medium-Sized Enterprises in Ireland Journal of Small Business and Enterprise Development 20 (4): 716–34. doi:10.1108/JSBED-08-2012-0094, 2013
10. Fuchs, Christian Towards a Dynamic Theory of Virtual Communities International Journal of Knowledge and Learning 3 (4/5): 372–403, 2007.
11. Ganim Barnes, Nora, and Eric Mattson Social Media in the 2009 Inc. 500: New Tools & New Trends Center for Marketing Research, 2009. https://www.sncr.org/sites/default/files/socialmedia2009_0.pdf.
12. Kiron, David, Doug Palmer, Anh Nguyen Philips, and Robert Berkman Social Business: Shifting Out of First Gear Research report. MIT Sloan Management Review. Massachusetts: MIT in collaboration with Deloitte, 2013.
Quantitative Methods Inquires
15
http://cdn.dupress.com/wp-content/uploads/2013/07/DUP446_SB_Report_Final.pdf.
13. Kuikka, Meri, and Mia Äkkinen Determining the Challenges of Organizational Social Media Adoption and Use In ECIS 2011 Proceedings, Paper 248. http://aisel.aisnet.org/ecis2011/248.
14. Mann, Jeffrey, Tom Austin, Nikos Drakos, Carol Rozwell, and Andrew Walls Predicts 2013: Social and Collaboration Go Deeper and Wider Gartner. November 28, 2012. https://www.gartner.com/doc/2254316/predicts--social-collaboration-deeper.
15. Marcati, Alberto, Gianluigi Guido, and Alessandro M. Peluso The Role of SME Entrepreneurs’ Innovativeness and Personality in the Adoption of Innovations Research Policy 37 (9): 1579–90. doi:10.1016/j.respol.2008.06.004, 2008.
16. Mcafee, Andrew Enterprise 2.0: The Dawn of Emergent Collaboration Management of Technology and Innovation 47 (3), 2006.
17. Nielsen, Jakob. Participation Inequality: Encouraging More Users to Contribute Nielsen Normal Group, 2006. http://www.nngroup.com/articles/participation-inequality/.
18. Norman, Cameron D., and Tim Huerta. Knowledge Transfer & Exchange through Social Networks: Building Foundations for a Community of Practice within Tobacco Control Implementation Science 1 (1): 20. doi:10.1186/1748-5908-1-20, 2006.
19. Peris, Martina, Nadine Blinn, Markus Nüttgens, Nadine Lindermann, and Harald von Kortzfleisch Acceptance of Professional Web 2.0 Platforms in Regional SME Networks: An Evaluation Based on the Unified Theory of Acceptance and Use of Technology In Proceedings of the 46th Hawaii International Conferences on System Sciences, 2793–2802. Wailea, HI, USA, 2013. http://ieeexplore.ieee.org/xpl/articleDetails.jsp?tp=&arnumber=6480182&url=http%3A%2F%2Fieeexplore.ieee.org%2Fxpls%2Fabs_all.jsp%3Farnumber%3D6480182.
20. Ramdani, Boumediene, Peter Kawalek, and Oswaldo Lorenzo Predicting SMEs’ Adoption of Enterprise Systems Journal of Enterprise Information Management 22 (1/2): 10–24. doi:10.1108/17410390910922796, 2009.
21. Rogers, Everett M. Diffusion of Innovations. 5th ed. New York: Free Press, 2003.
22. Talukder, Majharul, Ali Quazi, and Dede Djatikusumo.. Impact of Social Influence on Individuals’ Adoption of Social Networks in SMEs. Journal of Computer Science 9 (12): 1686–94, 2013.

Quantitative Methods Inquires
16
23. Venkatesh, Viswanath, Michael G. Morris, Gordon B. Davis, and Fred D. Davis User Acceptance of Information Technology: Toward A Unified View MIS Quarterly 27 (3): 425–78, 2003.
24. Venkatesh, Viswanath, James Y.L. Thong, and Xin Xu Consumer Acceptance and Use of Information Technology: Extending the Unified Theory of Acceptance and Use of Technology MIS Quarterly 36 (1): 157–78, 2012.

17
SPECIFICATION METHODS OF ECONOMIC PROCESSES
Marian Pompiliu CRISTESCU
Lucian Blaga” University of Sibiu Email: [email protected]
Ion IVAN
A.S.E. Bucharest Email:[email protected]
Laurentiu CIOVICĂ A.S.E. Bucharest Email:[email protected]
Liviu CIOVICĂ A.S.E. Bucharest
Email:[email protected]
ABSTRACT This paper present the stages by which we associate a formal language of a
economic process. It proposes the use of a mathematical model, described as a graph, for the specification of business processes such as: investments, organization of production, activities of economic analysis. It deals with those economic problems that may be put into formal practice when there is no possibility of using one of the known techniques, or when we are modeling a business process, a manufacturing process etc.
Keywords: optimization algorithm, economic modeling, formal language, graph
1. INTRODUCTION
A production process can be simulated or modeled effectively using linear bounded automated. However, if every time stock elements are bounded, then a finite state automaton can simulate the complexity of machine depends essentially on the size of graphs that describe technology products recipes. The unit of time is greater, the more the grammars associated with a system are simple, and the system is easier modeling.
Operation of many devices due to continuous processes and signal deviations from normality can be simulated using sequential transducers. Through the practical consequences of these results can be listed: the ordering, production planning and

18
programming, formal demonstration of the need for top-down design and implementation of information systems for manage the economic systems, necessity hierarchical management of socio-economic systems.
Economic problems are put into formal practice when we wish to model a business process, a manufacture process, a part, etc. Each action of the respective business process is marked with: a, b, c, d, such actions having clearly defined periods of time, and the action pairs are those composed of strings of the form: ab*cab*bc…, ab, bb, bc, so that there are no other restrictions.
2. USING FORMAL ELEMENTS FOR ECONOMIC SYSTEMS SPECIFICATION
The model by which a language L is assigned to a business process Pi involves the
following steps: 1) For the beginning, we seek the elementary events of a process, namely the
actionable atoms, by means of which any process development can be written as a string. Most times these events are naturally suggested by the process development. In some cases, we cannot make a natural separation of these elementary actions, but we have to make a cut out of the process with respect to a conveniently chosen time unit. The description of this process will be interpreted as elementary events;
2) In both cases, the essential problem is represented by the finitude/ finiteness of the elementary events inventory, or otherwise of the vocabulary we are working on;
3) Once the vocabulary has been found, we pass on to the identification of the language which describes the process. This requires knowing the process and the rules of process development;
4) The purpose is to build effectively a grammar that generates strings that satisfy all these conditions imposed by fairness. Formally expressed, it can be written as [ATAN07]1:
Given c1,c2, ... ,cn, the conditions that a string of elementary events must satisfy in order to be correct. For each i=1,2, ... ,n we build a language L(ci) of all strings that comply with the condition ci ignoring the others. The language that is sought is the intersection of all languages, namely:
n
iicLPL
1
)()(
(1)
Obtaining the languages L(ci) is carried out so that each condition corresponds to another method of building an associated language, namely its grammar. This way we can obtain an automat or a grammar used for simulating the system under consideration, and the conclusions on system behavior are obtained with the help of the automat.
A mathematic model, called graph, can be used successfully in investments, organization of production, economic analysis activities, transport, etc. The graph is “a figure composed of points connected by arrows. The points symbolize different elements depending on the modeled phenomenon, and the arrows represent the connections that are established between the elements”.
19
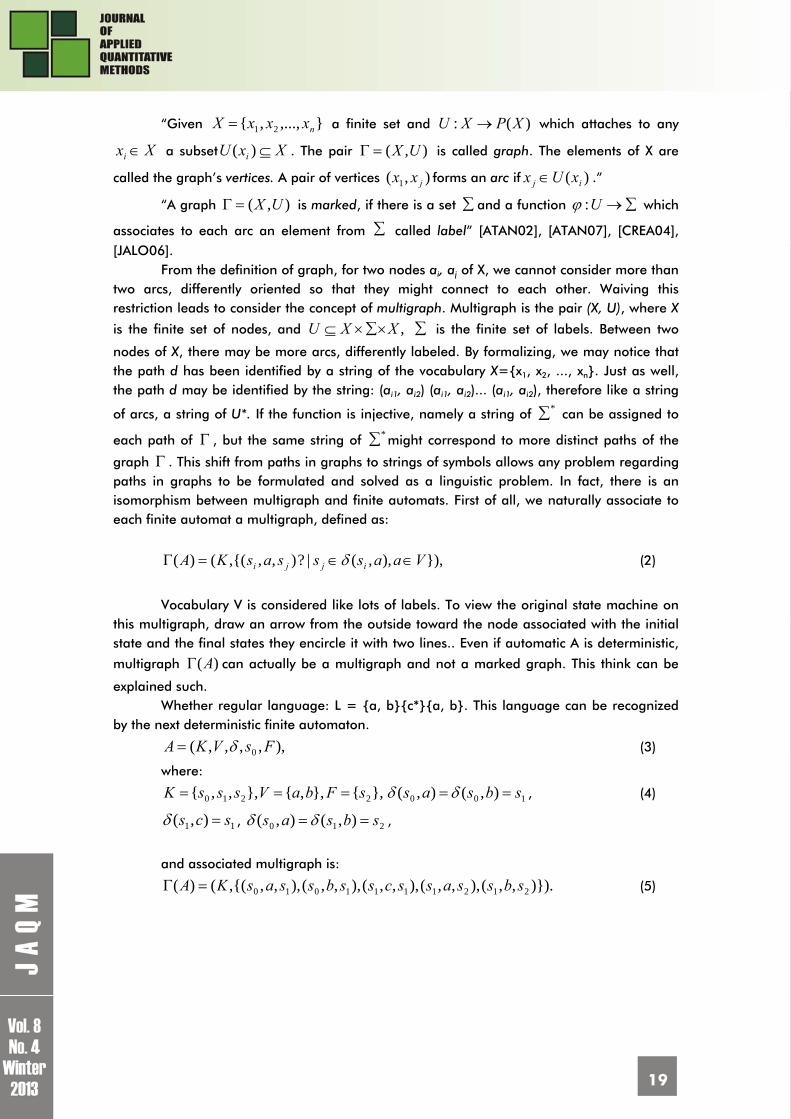
“Given },...,,{ 21 nxxxX a finite set and )(: XPXU which attaches to any
Xxi a subset XxU i )( . The pair ),( UX is called graph. The elements of X are
called the graph’s vertices. A pair of vertices ),( 1 jxx forms an arc if )( ij xUx .”
“A graph ),( UX is marked, if there is a set and a function U: which
associates to each arc an element from called label” [ATAN02], [ATAN07], [CREA04],
[JALO06]. From the definition of graph, for two nodes ai, aj of X, we cannot consider more than
two arcs, differently oriented so that they might connect to each other. Waiving this restriction leads to consider the concept of multigraph. Multigraph is the pair (X, U), where X
is the finite set of nodes, and ,XXU is the finite set of labels. Between two
nodes of X, there may be more arcs, differently labeled. By formalizing, we may notice that the path d has been identified by a string of the vocabulary X={x1, x2, ..., xn}. Just as well, the path d may be identified by the string: (ai1, ai2) (ai1, ai2)... (ai1, ai2), therefore like a string
of arcs, a string of U*. If the function is injective, namely a string of * can be assigned to
each path of , but the same string of * might correspond to more distinct paths of the
graph . This shift from paths in graphs to strings of symbols allows any problem regarding paths in graphs to be formulated and solved as a linguistic problem. In fact, there is an isomorphism between multigraph and finite automats. First of all, we naturally associate to each finite automat a multigraph, defined as:
}),),,(|?),,{(,()( VaasssasKA ijji (2)
Vocabulary V is considered like lots of labels. To view the original state machine on
this multigraph, draw an arrow from the outside toward the node associated with the initial state and the final states they encircle it with two lines.. Even if automatic A is deterministic,
multigraph )(A can actually be a multigraph and not a marked graph. This think can be
explained such. Whether regular language: L = {a, b}{c*}{a, b}. This language can be recognized
by the next deterministic finite automaton.
),,,,,( 0 FsVKA (3)
where:
},{},,{},,,{ 2210 sFbaVsssK 100 ),(),( sbsas , (4)
11 ),( scs , 210 ),(),( sbsas ,
and associated multigraph is:
)}).,,(),,,(),,,(),,,(),,,{(,()( 2121111010 sbssasscssbssasKA (5)

20
Multigraph )(A associated with a finite automaton ),,,,( 0 FsVKA is a graph
marked only if either as: ,,,, 2121 VaaKss if ),( 112 ass and ),( 212 ass , then
21 aa . Thus, it is concluded that: the language of )(A is infinite if only multigraph )(A
contains circuits.
Demonstrating backwards: if given a multigraph ),( UX with XXU ,
we can build the following associated finite automats: and
XsXsXsA 000 ),,,,,(),( for Xs and a , }.)',,(,'{),( UsasXsas
Any path in the multigraph with the initial node in point s0, corresponds to a string of the
language )),(( 0sAT and vice versa.
For finding all roads that unite a node si with a node sj, will take si like initial state
and sj, like final state (F = sj), ), then the language )),,(( 21 ssAT indicate exactly the set of
all roads in the form of rows of labels.
If ),( UX is a graph, then we may consider U and ),( ji ss , and the
previous automat will recognize paths written under the form of arcs. In order to obtain the
paths of an unmarked graph ),( UX written as strings over X – the set of nodes, with
the help of a grammar, we may get the following result:
Given ),,,}({)( PSXUSG where S is a new symbol and P:
}),(|),{(}),(),,(|),(
),{(},|),({
UsssssUsssssss
ssUsssssSP
jijjikjjikjj
jijijii
(6)
Obviously, the language ))(( GL comprises all paths of the graph written as
strings of nodes. In order to generate only the paths that leave, for instance, from a given
node si, we will eliminate all rules of the form: ),( jkk sssS for any ik .
Similarly, in order to generate only paths which end in a given node sj, we will
eliminate all end rules of the form: kki sss ),( , with jk .
It is worth noting the fact that, if the graph comprises circuits, then the language
))(( GL is infinite.
The demonstration is the following:
Given 11 ,,..., iipi sss in the graph and the associated string x. Obviously, any
sequence xn represents a path in , so it is in the language ))(( GL and, therefore, this
language is infinite. Vice versa, if ))(( GL is infinite, then according to the lemma uvw for

21
regular languages, it results that for any string z long enough to be written under the form of
uvw with 0|| v , so that uviw ))(( GL , for any 0i . If ipii sssv ...21 because
ipiiipii ssssssvv ...... 2121 represents a path in , it result that vsi1 represents a circuit.
Another way to address these problems and namely, to obtain the roads from a graph using the grammar is used to bypass trees.
Whether G = (V, VT, S, P), a context-free grammar, so that every derivation D in grammar G, is associated with a derivation tree, such:
is marked with the S tree root; if a tree node is marked with an unfinished A and in the derivation D this
nonterminal is rewritten using rules : rxxxA ...21 , ix being the terminal or non-terminal
symbols, then node A has r descendants mark from left to right with the symbols rxxx ...21 .
According [ATAN02], [ATAN07], [JALO06], we may assign to a
graph ),( UX , the grammar: ),},{,}({)( PSbXSG , where:
}|{}),(|{}|{ XsbsUssssXssSP ijjijiii (7)
Any derivation in the grammar )(G will be of the form:
bsssS ikii ...21 , with ikii sss ...21 . We must make clear the fact that, when we
refer only to paths from the node si to the node sj, then we keep the initial and end rules,
namely isS and bs j .
We must mention the fact that all derivations of b in the grammar )(G will indicate
such paths. Based on the building of grammar )(G we may find all optimal paths, in terms
of transport, on certain itineraries, with certain restrictions, in time units. In order to generate all possible itineraries that meet the conditions of a problem, it
is necessary to be constructed by a linear grammar )(G for each race, so to have all
itineraries that start with a point of departure, according to that race. For finding a minimum total road duration, going once through each point of the
graph, there is at least one solution is found through Hamiltonian paths of a graph .
Given ),( UX , a marked graph, so that to any arc of U we assign a positive real
number expressing the duration of passing it, or otherwise, the cost of passing that arc. This problem may have interpretation in transport issues, in the technological flow of processing
some parts nppp ,...,, 21 , on a certain machine, by replacing a part pi and adapting the
machine in order to process another part pj, so that the time c(pi,pj) for the preparation thereof be minimal. In order to solve these problems, we can use optimal and heuristic algorithms. In order to generate all Hamiltonian paths in a graph, there’s the method of Latin multiplication, mentioning the fact that it is difficult to program in order to be executed on the computer, assuming the memorizing of all paths with the length I in order to be able to generate paths with the length i+1.
An algorithm that requires little memory, and which can be applied to any graph, is the algorithm based on the algorithm for generating permutations of a set in a lexicographical order.

22
Be an oriented graph ),( UX , X={a1, a2, ... ,an}, X orderly crowd with the
orderly indices of the nodes, extending this to X* introducing the orderly lexicographer between the strings so that x, yX*:
If )(Pr yefx , than it says that x < y
If )(Pr yefx and )(Pr xefy , but ,21 xaxx i 31 xaxy j with cu x1,x2,x3X* and
ji aa than it says that x < y. We build the following grammar, independent from the
context:
),},{,}({ PSbXSG , where:
},...,2,1|{},...,{ 21 nibaaaaSP in (8)
jUaaiiiiaaaa ijikikiii ,),(},,...,{,...{ 2,121 și }....21 kiii
It observed that exists an unique derivation shift A, in report with the grammar G, with the following proprieties:
Any way in A, has the length at most n+ 1; Any way contains different nodes;
The shift is maximal, in the sense that no rule bai can’t be replaced with
an undetermined rule without violate the integrate to one of the proprieties 1 or 2. There are removed from this shift all the ways, which have the length less than n+1
after its eliminated all the terminals arch, so the one who has the form bai , resulting a
new shift A'. Starting from the following theory [ATAN07], [CREA04], [JALO06]: ” The shift A'
contains all the Hamiltonians ways from graph and the order endings ways from A', match with the lexicography order of the Hamiltonian’s ways from ”, resulting that the engendering algorithm of the Hamiltonian’s ways, from graph , it reduce to engendering
from left to right of the shifts ways A'. Being )'},,,...,2,1,0({' Un the extending graph,
where:
|),{(}),(|),{(' ioUaajiU ji exist },...,2,1|),{(}),( niiUaa ji (9)
Considering the matrix
jkkjim |min{),( și ,'),( Uki }.,...,2,1,0, nji (10)
Being the graph:
)}).,(),,(),,(),,(),,}{(,,,({ 23424131214321 aaaaaaaaaaaaaa (11)
Consider the associate graph: = ( {0,1,2,3,4, }, { (1,2),(1,3),(1,4), (2,4),(3,2), (12) (0,1),(0,2),(0,3),(0, ), (1, ),(2, ),(3, ),(4, ) } ), And the corresponding matrix is the following:

23
22
444
4322
321
,
To get the crowd )(H and not P(X), the necessary modifications which are made,
are necessary data like (ark,ark+1)U for any k. The verification is made by using the matrix m.
Considering the extension of the concept of Hamiltonian’s way. Being ),( UX
un orientated graph, X={a1, a2,...,an}. Any n with form v = (p1, p2, ... ,pn), where pi is un positive whole number for any i,
it is called frequency vector. A way from passing through the node ai exactly on pi or, it is called Hamiltonian way engender associated vector v. I this case, if v = (1 ... n), then determine the classical notion of Hamiltonian way. The problem of searching the Hamiltonian’s ways, generalized, associated a vector v=(pl,p2,...,pn), can be reduced by one usual Hamilton way so that, for each node ai we insert pi - 1 new distinct nodes.
3. MODELING THE ECONOMIC SYSTEMS WITH HELP OF THE GRAPH THEORY If the graph is seen like a image of a system, the nodes representing the components of the system, than the immediate interpretation of an arch (xi, xj) is that the component xi, influences directly the component xj. If the nodes are described as possible moods for the economic system, it can be said that an arch (xi, xj) signify the fact that the system can pass directly from status xi, in status xj. In both of the cases it has to do only with information about direct links; tough if a component xi doesn’t influence directly the component xj it can be influenced by other components, existing a series of intermediate components : x1, x2,...,xk, each a direct influence on the next and xi, directly on x1, while xk has directly influence on xj. So, if it can be realized the through from stage xi, directly in stage xj, it could still go through several stages and through other intermediate states. Since finding these influences or possible transitions , is usually very important, this thing isn’t quite simple to realize for the case of a system with many components, therefore it is necessary to formalize the notion of possible ‘’influences” and ‘’ crosswalks’’, not necessarily directly. It is obvious that „xi influences xj" or "the crosswalk from stage xi in stage xj" is equivalent to saying that there in a graph exists a way from node xi to node xj.
3.1 Search algorithms based on graph theory
For modelling, the economic system it are used several techniques. A method used frequently, is the one that appeals to search algorithms.
In [CORM02], [RADE02], is described the algorithm with help of which it makes searching for, in a directed graph with a finite number of nodes, to find all the possible ways.
So:

24
1 Step: it is build the Boolean matrix is built of direct adjacent, corresponding to the graph, noted with A. In this situation all the ways have the length 1.
It must be noticed that there is a connection between this matrix and the roads of length 2.
Being two nodes xi and xj from graph. The existence of a road of length 2 between them implies the existence of a node xk, from the graph, with the property that there are the arch (xi ,xk) as well as arch and arc (xi,xk) . To see if this exists, it takes at a run every node of the graph and check if there is or not both arcs ((xi, xk) and (xi, xk)). This is equivalent with checking if the directly adjacent of the Boolean matrix, exists any index k so that the k-line element i and the element k of the column j are both equal to 1:
111
100
10.
101
000
10.
then the verifications, described above, appear to be equivalent to the process of verification of the situation in which the element from the position (i,j) of A2 equal to 1. The value 1 only say that there is at least one way, whose length is 2, between xi, and xj. If you want to determine the number of ways of length 2, there are used the rules of multiplication and addition.
Also, it can be observed that if there is a road of length 3 situated between nodes xi, and xj, , this implies the existence of a node xk so that you can determine the existence of a road with length 2 from xi, to xk , and an arch from xk to xj, , which is equivalent with the check of existence to at least of an index k so that the element k placed on line i of the matrix A2 and the element k on the j-th column in the matrix A are at the same time equal with 1 or, more simple, if the element (i,j) from A3 is 1.
Starting from the ones presented above shows that the existing roads with length k, is given by the matrix values Ak , if you have used rules of Boolean algebra and their number are given by Ak if the usual rules were used.
Step 2: we calculate, in succession, the power of A till the power of An-1. If between the nodes xi, and xj exists a road with length n , then he will contain a
number of nodes at least equal to n+1 and, as in the graph are just n peaks, it is clear that at least one, for example xk,, will appear twice. Here will be, in this case, a road from the xi, to the first appearance of the xk, and a road from the last apparition of the xk and xj. Eliminating all the nodes of the first appearance of xk and the last one, it results a way from xi, to xj, xj, in which xk appears only once. Applying the method described above, all nodes with multiple appearances on the road, it will get a road from xi, to xj, in which each node appeared only once, which is obviously less than n arches. In conclusion, if there is at least one way from xi, to xj , then there is an elementary way and there will exist a power of A, between A1 and An-1, in which the position (i,j) is different from 0. In order to demonstrate the existence of a road between any two nodes it is necessary to calculate only the first n-1 powers of A.
Step 3: we calculate the matrix D = A + A 2 + ... + An-1 If you want only the determination of roads between the nodes, and not their
number, you use multiplication and the Boolean adding, and in accordance with the above observation, we obtain:

25
dij=
ji
ji
xlaxladedrumunniciexistănudacă
xlaxladedrumunputincelexistădacă
,0
,1 (13)
In this case you can observe that:
122
322
212
02
2 ...)( nnnnnn
n ACACACACIAA (14)
DAAAA n 132 ...
As a result it is enough to calculate only the power n-2 of the matrix A+I , and then the multiplication with A . The advantage of this method, in terms of the economy, is supported by the following observation: if D contains all pairs of arches, among which there exists a road , then:
DAAAAAAD knnnn ...)...( 112 being any 0k
DAAAAAAAIAA knnnnkn 11122 ...)...()( (15)
222 )()()( nknn IAAIAAIAA being any 0k
Therefore, starting with power k = n-2, all matrices Ak are equal. As such, it goes directly to the calculation of any powers of A+I which is greater than or equal to n-1.
For example, you can calculate: r
IAIAIAIA 2222 )(,...,)(,)(,)(321
, (16)
where r represents the first power of 2 for which: 22 nr .
The above procedure allows you to determine if there is or not at least a road between two nodes, possibly what length he has and how many are this long. However, in practical problems, the most important is to know which actually these roads are. Considering that, all roads can be decomposed into elementary roads, and in the practical problems, they are generally matters of interest, the following steps of the algorithm will be dedicated to finding them and their decomposition. In order to find them, we use the representation of the graph through the Latin matrix from the case F.
The Latin matrices attend to the relation for defining a graph. Sequences of peaks from a graph can be characterized by certain properties. According to [MINU02]”the peaks from an orientated graph which have the same proprieties and, which succeed in a one compatible order with the order from the graph, it is called sequence”. The operation can be realized with the sequences, which have the same property, is called concatenation.
The 4th step: building the Latin matrix L associated to the graph, where:
lij=
),(,0
),(,
ji
jiji
xxarchexistnotif
xxarchexistifxx (17)
and matrix ~
L is defined by:
~
l =
),(,0
),(,
ji
jij
xxarchexistnotif
xxarchexistifx (18)
named the Latin matrix reduced.

26
The process for finding a way with length size 2, from xi, to xj implies finding a node with the property that the arches exist (xi,xk) and (xk,xj) and memorize the vector (xi, xk, xj) .This is equivalent for finding a index k so that the element on the k position of i line, from
the L matrix should be xi,xk and the element on the k position of column j, from the matrix ~
L
should be xj. It will be multiplied matrix L with the matrix ~
L ,but using special calculation rules, named Latin multiply and addition.
It is called alphabet, a set of signs named symbols or letters }/{ Iisi where I is a
ordinary set of indexes, defined or undefined.
It is called word a set defined by symbols named: niii SSS ...
21.
It is called latin multiply an operation defined by the set of words from an alphabet noted ”xL” so:
smnm jjjiiijjjLiii ssssssssssss ............
21212121 (19)
the product of two words is obtained by “counteraction” them. The Latin multiply is associative, has a neutral element the word void, is not
commutative and an element is irreversible only is the word is void. It is called Latin addition a function defined on a set of words of an alphabet with
values in the set of the parts set of words, noted ”+L” as:
m
n
mjjj
iii
jjjLiii sss
sssssssss
...
.........
21
21
2121 (20)
the sum of two words is the set having those two words. The 5th step: is calculated, successive, the matrix:
L2=L L~
L , L3=L2L
~
L , ..., Lk+1=LkL
~
L (21)
Using the Latin multiply and addition operations, the alphabet being the set of nodes
of the graph, where the multiply operation is easily to modified, the product of two elements of the matrix is 0,in case at least one is zero or a common node comes and is the Latin product of them , in contrary case.
From the way it was built, the matrix Lk will contain all the elementary ways of length k. Due to the fact that an elementary way has at most n nodes it results that:
the first n-1 powers of L contain all the ways from the graph; there are powers of L that are higher or equal to n and has all the elements
equal to 0; matrix Ln-1 contain all the Hamilton ways from the graph(if they exist); Because obtaining the matrix D, using the method described earlier, needs a volume
very high of calculation, for example: for a graph with 100 nodes, calculations will be 100x100 raised to 100 power, for the D matrix it can be applied with success the next algorithm:

27
Step one: the adjacency matrix A is built; Step two: for each line is addition, Boolean, all the j line for those aij = l; Step 3: it repeat the step two until the matrix remain the and there are no ’1’s. The last matrix resulted is the matrix of the D ways, also named the matrix of total
connection. This method, although easier, it does not lead which are those ways and for finding them, it applies, for instance, Latin multiply.
3.2 Optimization algorithms of the economic flow based on the graph theory
Considering that, the economic flows can be associated with some flows from the classic graph theory, in economic theory and practices it assumes using a set of algorithms, evolved, and developed in operation research. From these algorithms it was choose Ford Fulkerson.
The method Ford-Fulkerson solves the maximum flow problem. This method is based on three important theories, which exceed the algorithm and it is also used in other problems related to flows: residual networks, improvement ways and cuts [CORM02], [RADE02].
Ford-Fulkerson’s method is iterative. It starts with a flow f(u, v) = 0 for Vvu , , like
the initial flow with value 0.At every step of the iteration it enlarges the value of the flow by finding a „improvement way”, which is a way along which its flow can be enlarged, so its value too. Repeat those steps until these is no improvement way found.
a) Residual network For a transport network and a flow, it can be said that there is a residual network
that consist from the arches that admit the biggest flow. According to [CORM02], if there is a transport network with the form: G=(V, U) with source s and destination t, and f is a flow in
G and is considered a pair of peaks Vvu , , the amount of additional flow which can be
transported from u to v, without overcome the capacity c(u,v), is the residual capacity of the arch (u,v) defined by:
),(),(),( vufvucvuc f (22)
Having a transportation network G= (V,E) and a f flow, the residual network of G
induced by f is ),( ff EVG , where:
}0),(:),{( vucVVvuE ff (23)
Every arch of the residual network, or residual arch, admits a strictly positive grow of the flow.
It can be observed that (u, v) can be an arch in Ef even though it is not an arch in E,
is observed that EE f .This kind of arch (u,v) can appear in Gf only if Euv ),( and if
there is a positive flow from v to u. Because the flow f(u,v) from u to v is negative,
),(),(),( vufvucvuc f is positive and fEvu ),( .Because the arch (u,v) can appear in
the residual network only if at least one of the arches (u,v) and (v,u) appear in the original
network ,we have EE f 2 .It can be observed that the residual network Gf is a transport
network with capacity function cf.

28
b) Improvement ways According to [CORM02],”having a transport network G= (V,E) and a flow f, a
improvement way p is a simple way from s to t in the residual network Gf. After the definition of the residual network, every arch (u,v) on an improvement way admits a additional positive flow ,without breaking the restriction of capacity.”
Residual capacity of p is the maximum capacity of the flow that can be transported along the improvement way p, given by the formula:
}),(:),(min{)( pwaytheisvuvucpc ff (24)
c) Cuts in the transport network
Ford-Fulkerson’s method grows the flow repeatedly, along the improvement ways, until it gets to a maximum flow. The theorem of the maximum flow-minimum cut, demonstrates the fact that a flow is maximum, if and only if in the residual network doesn’t exist ways of improvement.
A cut (S,T) of a transport network G=(V,E) is a partition of the V set in the S and T=V-
S set, so Ss and Tt .If f is a flow ,then the cut flow (S,T) is defined equal to f(S,T).The
capacity of the cut (S,T) is c(S,T). A minimum cut is the cut with the lowest capacity from the whole network cuts.
d) Ford-Fulkerson algorithm In every iteration a Ford-Fulkerson method is searching for a randomly improvement
way p and it is growing the flow f along way p at residual capacity cf(p). Implementation of the method allows the calculation of the maximum flow in the G= (V,E) graph, updating the flow f[u,v] between any other two peaks which are bounded thru an arch. If u and v are not bounded thru an arch in any other direction, it is suppose that f[u,v]=0. The value of the capacity of the peaks u and v is given by the function c(u,v) computable in a constant time ,
c(u,v)=0 if Evu ),( .
Schematization of the algorithm Ford-Fulkerson (G,s,t):
1: for every arch ][),( GEvu execute
2: 0],[ vuf
3: 0],[ uvf
4: as long there is a way p from s to t in the residual network Gf execute
5: }),(:),(min{)( wayponisvuvucpc ff
6: for every arch (u,v) din p execute
7: )(],[],[ pcvufvuf f
8: ],[],[ uvfuvf
Lines between 1 and 3 initialize the flow i with value equal to 0. The cycle ”as long”
from the 4-8 lines finds, by turn, an improvement way p in Gf and increases the f flow along p with the value of the residual capacity Cf(p). When there is no improvement way then f is at a maximum flow.

29
The execution time of the Ford-Fulkerson algorithm depends on the way of determination of the improvement way p. If the chosen way is wrong it can happen that the algorithm does not stop: value of the flow increases successive, but doesn’t converge to its maximum value.
The execution time of the Ford-Fulkerson algorithm is given by |)|( *fEO , where f*
is the maximum flow resulted from the algorithm. The execution time for line 1 to 3 is
)(E .Lines 4-8 executes at most | f* |, because the value of the flow increases at every
step with at least a unit.
4. IMPLEMENTATION OF OPTIMIZATION ALGORITHMS FOR A TRANSPORT PROBLEM
A transport company has 35 trucks which must move in point J. Displacement of the
35 trucks from one place to another is done in stages, so in the first step is to get as many of them in point J. In their way, the trucks have to make one more stop in one of the other intermediate point B, C, D, E, F, G,H ,I, J . Reception conditions, supply and so on, are to be a limitation of routes used, existing capacities are listed on the network arches.
A
B
C
D
E
F
G
H
I
J
12
3
20
4
4
5
6 3
3
5
3510
13
10
12
The objectives are to determine the optimal transport plan so that, at this stage a
large number of trucks could go toward point J. The problem of maximum flow crossing transport network, has the following
mathematical form, using linear programming in order to fix it:

30
1
0
1
0
,1
,1,
1
0
1
0
,0
,0
1
0
1
0
,,
,,
maxmax
);,1(
);1,0,(0
n
j
n
jnnj
m
j
n
jjj
n
j
n
jijij
ijij
ni
njic
conditiileînz
Where: ),( ji yxu is the arch, is the flow value and ,,)( iju is arch flow.
Automaton corresponding to algorithm is ),,,,( 0 FqQM and has the
following values
JIHGFEDCBAQ ,,,,,,,,, , F={J}, alphabet input is given by
12,10,13,3,5,3,3,10,5,4,4,6,5,20,3,12 , passing functions are defined in the following
manner:
BA )12,(
GB )5,( EC )4,(
CA )3,( EB )6,( FC )4,(
DA )20,(
FD )5,(
GE )3,( HF )5,(
ID )10,(
HE )3,(
IF )3,(
JG )13,(
JH )10,(
JI )12,(
Regular grammar ),,,( PSVVG TN where JIHGFEDCBAVN ,,,,,,,,, ,
12,10,13,3,5,3,3,10,5,4,4,6,5,20,3,12TV , with the set of rules for generating:

31
1) BA 12 2) CA 3 3) DA 20
4) EB 6 5) GB 5
6) EC 4 7) FC 4
8) FD 5 9) ID 10
10) GE 3 11) HE 3
12) HF 5 13) IF 3
14) JG 13
15) H →10J
16) JI 12
17) J
Possible derivations, based on the grammar are:
135121351251212 )17()5()1( JGBA
133612133612361261212 )17()14()10()4()1( JGEBA
103612103612361261212 )17()15()11()4()1( JHEBA
1334313343343433 )17()14()10()6()2( JGECA
1034310343343433 )17()15()11()6()2( JHECA
1054310543543433 )17()15()12()7()2( JHFCA
1234312343343433 )17()16()13()7()2( JIFCA
105520105520552052020 )17()15()12()8()3( JHFDA
123520123520352052020 )17()16()13()8()3( JIFDA
121020121020102020 )17()16()9()3( JIDA
The language generated is L={ 13512 , 133612 , 103612 , 13343 ,
10343 , 10543 , 12343 , 105520 , 123520 , 121020 }
In the case where for each sub graph defined by the grammar derivations, the maximum flow is established, there is the whole graph value of 41 trucks driving from point A to reach the point J. This is not correct because there are duplicates of the minimum flows on certain routes, which must be removed. Solving the problem with the help of Ford-Fulkerson algorithm, the maximum flow starting from point A, and arrives at the point J, is 28 trucks.
11/12
3/3
14/20
5/5
6/6 3/3
3/30/4
3/4
5/5
9/10
3/3
5/5
8/13
8/10
12/12
A
B
C
D
E
F
G
H
I
J
Figure 1. Solving problem with Ford-Fulkerson algorithm

32
It is observed that the difference between the two values is given by the carrying
capacity of the point G, H and i. these values are: ○ for the G-spot maximum capacity supported is 8, and from the grammar we obtain
11 ○ for the H-spot maximum capacity supported is 8, and from the grammar we obtain
14 ○ for the I-spot maximum capacity supported is 12, and from the grammar, we
obtain 16 The problem arises from section I for which, through grammar obtained above, there
are the values given by sub graphs: ACFIJ, ADFIJ and ADIJ, which have a minimum capacity of 2, 3 and 10. Point 1 may have the maximum flow of just 12, according to problem solving using algorithm, resulting one from the two sub graphs (ACFIJ, ADFIJ) has in fact the minimum capacity of 2, and the other is doubled as value.
To remove the duplicate values that are not found, there’s no method to bring a plus and to lead to a result equal to that which is found by the method obtained by Ford Fulkerson.
In the case of a graph with a small number of nodes, this is very easy to apply.
5. CONCLUSIONS In the paper, we simplified the problem specifying economic processes so that simple
notations as: a, b, c, d, signifies actions with well-defined timescales, and pairs of actions are represented by a string of characters so that will no longer be any other restrictions.
There were treated formal logic elements, and has been described as part of mathematical logic in which logical variables are sentences.
Seeing the graph like an image of system, the nodes represent the components of
the system, then an immediately interpretation of an arch ( ji xx , ) it is the one specifying that
component ix is the one which influences directly the component jx . Using this
interpretation there are presented two algorithms : the algorithm in which can be found all the ways on the graph, orientated to a finite number of nodes, as well the construction algorithm of the Latin matrix in which the alphabet represent the set of the nodes of the graph.
All roads in the merged graph are decomposed into elementary roads, this being followed in practice specification economic systems. Carrying out the decomposition in the basic road is performed by using the Latin matrix.
It was presented the Ford-Fulkerson algorithm and how to solve a problem with this algorithm. The problem, initially, is resolved with the help of formal languages and grammar and language are identified. The result thus obtained was compared with the problem solved by the Ford-Fulkerson algorithm.

33
REFERENCES
Atanasiu A., Limbaje formale și automate, Editura Infodata, Cluj, 2007; Atanasiu I., Raicu D., Sion R., Mocanu I., Limbaje formale și Automate, Îndrumar pentru
aplicații, 2002 Bocu D., Bocu R., Modelare obiect orientată cu UML, Editura Albastră, Cluj Napoca,
2006 Cocan M., Pop B., Logică computațională, Editura Albastră, Cluj Napoca, 2006 Cormen H. Thomas, Charles E. Leiserson, Rivest R. Roland, Introducere în algoritmi,
Editura Agora, 2002 Creanga I, Reischer C., Simovici D., Introducere algebrică în informatică, Editura
Junimea, Iași, 2004 Jalobeanu C, Marinescu D, Bazele teoriei calculului limbajelor formale și automate,
Editura Albastră, Cluj Napoca, 2006 Minuț P., Kupan A. P., Cercetări operaționale, Târgu Mureș, Editura „Dimitrie Cantemir”,
2001 Minuț P., Matematici aplicate în economie, Târgu Mureș, Editura „Dimitrie Cantemir”,
2002 Rădescu N., Rădescu E., Probleme de teoria grafurilor, Editura Scrisul Românesc, 2002
1 [ATAN07] Atanasiu A., Limbaje formale și automate, Editura Infodata, Cluj, 2007 [ATAN02] Atanasiu I., Raicu D., Sion R., Mocanu I., Limbaje formale și Automate, Îndrumar pentru
aplicații, 2002 [BOCU06] Bocu D., Bocu R., Modelare obiect orientată cu UML, Editura Albastră, Cluj Napoca, 2006 [COCA06] Cocan M., Pop B., Logică computațională, Editura Albastră, Cluj Napoca, 2006 [CORM02] Cormen H. Thomas, Charles E. Leiserson, Rivest R. Roland, Introducere în algoritmi, Editura
Agora, 2002 [CREA04] Creanga I, Reischer C., Simovici D., Introducere algebrică în informatică, Editura Junimea,
Iași, 2004 [JALO06] Jalobeanu C, Marinescu D, Bazele teoriei calculului limbajelor formale și automate,
Editura Albastră, Cluj Napoca, 2006 [MINU01] Minuț P., Kupan A. P., Cercetări operaționale, Târgu Mureș, Editura „Dimitrie Cantemir”,
2001 [MINU02] Minuț P., Matematici aplicate în economie, Târgu Mureș, Editura „Dimitrie Cantemir”, 2002 [RADE02] Rădescu N., Rădescu E., Probleme de teoria grafurilor, Editura Scrisul Românesc, 2002

34
ENVIRONMENTAL AWARENESS AND DISASTER FACTORS
IN BANGLADESH
Mohammad Ohid ULLAH PhD Associate professor Department of Statistics, Shahjalal University of Science and Technology (SUST) Sylhet-3114, Bangladesh Email: [email protected]
Md. Abu HASAN MSc student, Department of Statistics, SUST, Sylhet-3114, Bangladesh
Taj UDDIN Professor, Department of Statistics, SUST, Sylhet-3114, Bangladesh
ABSTRACT Environmental pollution is one of the important problems for the living beings. It
interrupts to lead better life. The present study is an attempt to study the environmental awareness and behavior towards the environment of the students with environmental disasters factors in private universities in Sylhet, Bangladesh. To conduct this study, a questionnaire was designed and implemented on a sample of 200 students of four private universities in Sylhet city. Research findings show that global warming (66.5%) is the most important problem in the world and unplanned urbanization (32%) is the most important problem in Bangladesh. Research indicates that ‘Global warming’, ‘The conflict over the natural water resources’ and ‘The needs for other energy sources against petroleum’ are the most influential factors for environmental disaster. Most of the respondents believe that education of environmental awareness and use of bi-cycle for short distance in the city may solve environment pollution. Therefore, Government and non-government organizations should take initiative to prepare bi-cycle road aside foot-path as well as educational activities regarding healthy environment.
Keywords: Environment, Awareness, Disaster factors, Behavior
INTRODUCTION Environment is the aggregate of water, air, sound and land interrelationships and also
with the human being, other living organisms and property. It includes physical, biological, social, cultural and economical factors which constitute the surroundings of human being, who is both the creator and molder of the environment (Pillai, 2012). Human beings from their

35
beginning of life always have been tried to derive benefits from the environment to provide for their needs, and environment has been used to improve their quality of life. Because of over uses of natural resources the natural balance has been broken down and thus serious problem occurred, which called environmental problems. Those problems have gained international extent as a result of technological progress and industrialization that has been achieved in the recent decades (Gulgan et al., 2008). Among many global phenomenons, environmental pollution has become a key concern for human beings. Each and everybody of whatever occupation he or she may have, is affected by environmental issues like global warming, depletion of ozone layer, dwindling forest, energy resources, loss of global biodiversity, air, soil, water pollutions, water shortage, garbage problems etc(Oluk & Ozalp, 2007; Bybee, 1991). And these types of environmental disasters are increasing enormously. Global warming turns Bangladesh into one of the most vulnerable countries in the world. Climate change over the coming decades will become a major threat for the well being and survival of the people in Bangladesh (Ministry of Environment and Forests, Bangladesh). The people of Bangladesh are already suffering from climate impacts. It is scientifically established that some of the changes in motion are irreversible, that some impacts will be unavoidable, and some unmanageable (Kalpana, 2012). Our mistakes and wrongful decision have leaded us such a place, there is no return pathway, which enforcing us to reshape our principles, responsive mechanisms and way of thinking (Krousouloudi et al., 2010). To keep our environment safe and livable it is important to raise environmental awareness. By the term environmental awareness we mean knowledge about environment and also attitude, values and necessary skills to solve environment related problems. Environmental awareness also refers to the ability of a person to carry on citizenship behavior (Shobeiri et al., 2007). To encourage meaningful public participation and environment, it is necessary to create awareness about environment pollution and related adverse effects. Any Government at its own level can’t achieve the goal of environment conservation, until the public has a participatory role in it. Therefore, there is a great need to protect and preserve our environment by increasing the level of awareness among the public as well as the students, who are the future of a nation. The role of students would go a long way in achieving such desired goals. In order to faster their awareness towards environment, it is necessary to know what levels of awareness they possess in these areas. For raising public awareness and enhancing the protective attitudes towards the environmental issue, environmental education is one of the most effective strategy or role. If the peoples’ perception, knowledge, awareness and attitude toward environmental issues are high, it means that the people’s environmental literacy rate is also high. Increasing environmental literacy will lead to a change in behavior or action. Determining, what people know about the environment, how they feel about it, and what actions they take that may help or harm the environment is required to establishing the sustainability of a community and to protect the environment. Environmental education rate will be high when people’s conception, knowledge, consciousness and behavior toward environmental issues will be high. Environmental education helps to change the concept about environment. Three things are needed for a community and for saving the environment; those are feelings of the people about environment, proper knowledge for maintaining the environment, actions of the peoples about environment (Thapa, 2001; Stapp, 1969). Environmental education is aimed at producing a citizenry that is knowledgeable concerning the biophysical environment and its associated problems, to aware of how to help to solve these problems and to motivate to work towards their solution (Kumar, 2011). Environmental Education acts as an indispensable tool in

36
the battle against the degradation of living environment. Environmental consciousness and environmental sincerity should be grown among young people. For the awareness of society it is essential to work at a gross root level. So the whole society can work to save the environment. If we want to generate the environmental values in our children, we have to know the responsibility towards environment and also we have to show our behavior as a like eco-friendly. Environmental awareness should be the integral part of any environmental curriculum encouraging student to take an active role in the protection to their environment in one way by which the critical balance between man and environment may be preserved. Through it young generations are full of curiosity to learn about their environment (Talay et al., 2004). Universities educate young generations who are expected to be the upcoming leaders in many different areas in the society and who will be the decision makers, the role of the universities in the environmental training of the public is huge. The future decision of these young generations will affect the sustainability of the human existence, their approach and activities will have important consequence for the environment (Uddin et al., 2007).
So, in this paper we tried to see the awareness of the undergraduate students of private universities in Sylhet city about the environmental problem. We also tried to identify the disaster factors and to understand the attitude and behavior of the students about the solutions.
MATERIALS AND METHODS The study was conducted during the period April - May in 2013 among the student
of four private universities at Sylhet city in Bangladesh. A total of 200 participants were drawn by selecting 50 students from each university. Investigators have prepared a set of questionnaire, which were included closed questions covering various aspects of the current environmental issues at global and local levels with 8 environmental disaster factors as Likart scale. The questions were administered at the end of class periods and students responded voluntarily. The Statistical Package (SPSS version 20) and “FactoMineR” package in R program were used to analyze the data.
RESULTS General characteristics of the participants It is found that only 57% of the participants were male while 43% were female. The
larger group of the participants (69%) was between 18-21 years of age. Among them 37.5% were in 1st year, 33% in 2nd year, 26.5% in 3rd year and rest of all were in 4th year students of under graduate level.
Students’ environmental awareness The result showed that most of the students (66.5%) believe global warming is the
most serious problem in the world. However, they gave their opinion that the global warming is the fourth serious problem in Bangladesh (13%). The first three problems in Bangladesh, as mentioned by the students, were unplanned urbanization (32%), air pollution (17%) and Soil pollution & loss of farmland (13.5%). The most interesting outcome of this question is the difference between the perceptions of the local and global problem. Around

37
39% students think that lack of awareness is the most important factor responsible for environmental problems in Bangladesh.
Most of the participants (57%) think ‘education for raising the awareness of public’
may solve the environmental problem followed by ‘technological improvements’ (16%). To raise the public awareness of the people about the environmental issue, most of the students think it is essential to increase the activities of government followed by TV-Radio watching with and internet (facebook, twitter etc.). Most of the students (63%) are familiar with sustainable development on environment; this indicates that the students are really conscious about the environmental issues.
DISASTER FACTORS Eight different disaster scenarios/factors which may be faced in the future as a result
of environmental problems were presented to the participants. Students were asked to put their thoughts about the possibilities of these disaster scenarios by using Likart scale. Using these 8 factors of environmental disaster scenarios we run principal component analysis by FactoMineR package in R program We found that DSGW (Global warming), DSNWR(The conflict over the natural water resources) and DSNOE (The needs for other energy sources against petroleum) are the most influential factors for environmental disaster.
-5 0 5
-20
24
Individuals factor map (PCA)
Dim 1 (26.33%)
Dim
2 (
15
.32
%)
1
2
3
4567
8
9
1011
12
13
141516
17
18
19
2021
2223
2425
26 27282930
3132
33
34
353637
3839
4041
42
434445
464748
49
5051
5253
54 55
56
5758
5960
61
6263
64
65
66
67 68
69
707172
73
74
7576
77
7879 80818283 84
85
8687
88 8990
91 929394
9596
9798
99100101
102103104
105
106107108
109
110111
112113
114115116
117118
119120121
122
123
124
125126
127
128
129
130131132133134
135
136137
138
139140
141
142143144
145146 147
148 149
150
151 152153154
155
156157
158
159 160
161
162163
164
165
166
167
168169
170171172
173174
175176
177
178179180
181 182183184
185186
187188
189
190
191192193
194
195
196197
198199200
-1.0 -0.5 0.0 0.5 1.0
-1.0
-0.5
0.0
0.5
1.0
Variables factor map (PCA)
Dim 1 (26.33%)
Dim
2 (15.3
2%
)
DSGW
DSNOE
DSWE
DSNWR
DSAUN
DSIEA
DSRSL
DSDW
DSGW
DSNOE
DSWE
DSNWR
DSAUN
DSIEA
DSRSL
DSDW
DSGW
DSNOE
DSWE
DSNWR
DSAUN
DSIEA
DSRSL
DSDW
DSGW
DSNOE
DSWE
DSNWR
DSAUN
DSIEA
DSRSL
DSDW
DSGW
DSNOE
DSWE
DSNWR
DSAUN
DSIEA
DSRSL
DSDW
DSGW
DSNOE
DSWE
DSNWR
DSAUN
DSIEA
DSRSL
DSDW
DSGW
DSNOE
DSWE
DSNWR
DSAUN
DSIEA
DSRSL
DSDW
DSGW
DSNOE
DSWE
DSNWR
DSAUN
DSIEA
DSRSL
DSDW
DSGW
DSNOE
DSWE
DSNWR
DSAUN
DSIEA
DSRSL
DSDW

38
Figure 1. (A) Individual factor map (score plot). It shows all the respondents respond almost homogeneously. (B) Variable factor map (Loading plot) of 8 disaster factors. It shows the association among the factors of environmental disaster. Longer the vectors indicate more influential and the vectors that are close of each other with same direction indicate highly positive association. First principal component shows around 26% of the variation in the dataset. DSGW (Global warming), DSNOE (The needs for other energy sources against petroleum), DSWE (Water endangerment), DSNWR (The conflict over the natural water resources), DSAUN (The abandonment of using the nuclear power), DSIEA (Raising importance of ecological agricultural), DSRSL (Melting ice/Raising Sea level), DSDW (Desertification of the world).
The variable factor map (loading plot) shows that all the factors are positively
associated with each other as they are showing same direction. We also found that DSGW (Global warming) and DSRSL (Melting ice/Raising Sea level) are adjacent to each other- indicates they are positively associated which is expected as ice is melting because of global warming.
PARTICIPANTS’ ATTITUDE AND BEHAVIOR TOWARDS THE ENVIRONMENTAL ISSUES
We found that 48.5% students read newspaper, magazine or books on
environmental issue regularly. They also liked to watch TV and Radio about environmental issue regularly.
It is pleasing that a large number of students (69%) would like to work voluntarily, while 18.5% students want to include in environmental preservation activities by providing donation or extra taxes. It is also observed that 45.5% of participants are not a member of any environmental organization, 12% of them have taken part of environmental activity and 35% students are interested to join any environmental organization. We found that 40% students prefer bicycle for transportation, 18.5% prefer subway-train but 29% prefer taxi, buses or mini buses. We also found that industries (66%) is the worst polluters followed by individual people (13.5%).
It’s serious issue in Bangladesh that only 43% of the respondent sort plastic and
20.5% of them sort waste food. It’s pleasing that, a small proportion of participant (8%) never take any reaction against the polluters, on the other hand 56.5% participants try to tell people and warn people about the polluters. In order to find out their opinion, how would be their future concerning the current condition of environment we have found that 50% students think that their future will be challenging while 25.5% think it will be bright and hopeful. Besides that 61.5% students believe that their health has already been affected by pollution. And 56.5% students think that the environmental situation after 10 years from now will be worse than it is now.
DISCUSSION & CONCLUSION Environmental education is the most efficient way to improving the environmental
literacy which consists people’s perception, knowledge, awareness and attitude towards

39
environmental issue. Increasing environmental literacy makes people more conscious about their environment and which leads to a positive change about the environmentally responsible behaviors or the action of the people. However, from this study we found that students are concerned about environment to some extents and they maintained a positive behavior towards the environmental issues but they presented a little inadequacy about some other environmental issues. Students are concerned about present situation about environment and also they can realized that their future will be challenging and they have also noticed that their health is already been affected by the environmental pollution.
We also found that ‘Global warming’, ‘The conflict over the natural water resources’ and ‘The needs for other energy sources against petroleum’ are the most influential factors for environmental disaster. We also found that DSGW (Global warming) and DSRSL (Melting ice/Raising Sea level) are adjacent to each other- indicates they are positively associated which is expected as ice is melting because of global warming.
In this study we observed that there is a positive association between watching TV, Radios program on environmental issue and the number of person who are the member of any environmental organization. Thus it implies that TV, Radio programs on environmental issue have a great influence on raising environmental awareness.
It is observed that private university students’ awareness levels are almost same with public university students (Barraza & Walford, 2002) in many cases such as, “the most serious environmental problem of the world”, “the environmental disaster scenarios that the world may face in future”, “the most probable recommendation that can be taken against the environmental problem” etc. But we have got better percentages on some cases such as they enjoy following printing media or electronic media on environmental issue, they are wishing to work voluntarily on environmental issue etc. We think that these percentages have been increased for time difference and this is a good sign that is the awareness levels are increasing day by day.
It is observed that, there is no discrimination in the awareness level between male and female students that is there is no association between gender and work voluntarily on environmental issue. So Bangladeshi women’s are also aware about environmental situation and they are playing a positive role on environmental preservation activities with men.
It is clear whether in this survey or other similar works about environmental awareness and conservation studies the most important fact is public awareness. To do this, it is crucial to have national strategies about environment and increasing the awareness of environment among public. Moreover visual and pressed media have an important role of aware public about environmental issues. The other important fact is non-governmental organizations. Environmental awareness can be raised with collaboration and rising educational programs on these instruments.
Respect to the most environmental problem in the world, respondents thinking are almost same, where global warming is the most serious problem in the world by both the university students of Bangladesh and Turkey (Gulgun et al., 2008; Onder, 2006; Oguz et al., 2010). Concerning the most probable recommendation that can be taken against the environmental problem, from those papers we have found that “Education for raising the awareness of public” is the best recommendation. As the most important factor responsible for environmental problems in both countries, 38.5% of Bangladeshi and 28.4% of Turkey students choose “Lack of Awareness” (Oguz et al., 2010). In environmental preservation activities Bangladeshi students showed better percentage (69%), they would like to work

40
voluntarily, though only few students (12%) are member of an environmental organization same as others (Gulgun et al., 2008; Onder, 2006).
To save our environment, it is obvious that we need educated people as individuals who care for environment as well as have environmental awareness and knowledge to environmental subjects (Erol & Gezer, 2006). It can be accomplished that the future of environmental education in Bangladesh is hopeful, though the existing environmental education programs in higher studies do not seem to be good enough. No doubt, Bangladesh is environmentally rich and its culture and traditions is also well known to the people as naturally beauty which are also incorporated initially as a course of geography in the education systems of the country. This idea is connected in the early stage of the human civilization and gradually developed. The consciousness of the environmental problems grew in the country at all levels and in all sectors. It is seen particularly at the higher studies stage, in all universities (Masum & Akhir, 2010; Ozmen et al., 2005). Most of the students prefer bicycle in Bangladesh though there is no separate bicycle road. It suggests that Government should take initiative to prepare bicycle road near the footpath so that people go here and there. This action may solve the air pollution as well as traffic jam in the big cities.
To be a member of environmental organization plays a vital rule, by made a valuable difference about attitude and behavior of students regarding environment. We should encourage our young generation as well as students, to be a member of environmental organization and to take responsibility to protect our environment with non government organization (Budak et al., 2005). After all, a reorganization is needed which will be guided by the inalterable principles of Environmental Education, intending into creating a ecologically-oriented environmental ethics, should be the foundation to construct the new personalities required. The way youngsters compact with the information received and their natural sensitivity, under the auspices of enlightened educators could be what we should expect (Krousouloudi et al., 2010).
All these findings suggest that the government should take necessary steps to protect the environment. The environmental studies is not limited only to related disciplines but also others discipline like law, medicine and economics etc.
Finally, the aspire of all efforts of environmental education, preservation, and improvement is to endow with more safety and healthy environment to all human and alive who have to rights to live in safe and healthy world during their life. This article may be helpful for the stakeholder or policy makers of the country.
REFERENCES
1. Barraza, L., & Walford, R.A Environmental Education: a Comparison Between English and Mexican School Children. Environmental Education Research, 8, 2002, 171–186.
2. Budak, F., Zaimoğlu, Z., Kekeç, S. & Sucu, M.Y. Behavior and Attitudes of Students towards Environmental Issues at Faculty of Agriculture Turkey. Journal of Applied Sciences, 5(7), 2005, 1224-1227.
3. Bybee R.W. Planet Earth in Crisis: How Should Science Educators Respond? The American Biology Teacher, 53(3), 1991, 146-153.
41
4. Erol, G.H. & Gezer, K., Teachers’ Attitudes toward Environment and Environmental Problems. International Journal of Environmental and Science Education, 1(1), 2006, 65-77.
5. Gulgun, B., Onder, S., Aktas, E. & Unal Ankaya, F. Responses of University Students Related to Environmental Problems: A Case Study of Ege University (Izmir-Turkey). J. Int. Environmental Application & Science, 3 (4), 2008, 234-246.
6. Krousouloudi, N., Terzoglou, E., Bakti, G., Theocharopoulos, D., Tsekos, C.A, Mimigiannis, A. and D. P. Matthopoulos, Environmental Education as Means to Reshape Our Society, International Journal of Arts and Sciences 3(19), 2010, 28-36
7. Kumar, P. A Study of Environmental Awareness Among Higher Secondary Students and Some Educational Factors Affecting it. International Journal of Multidisciplinary Research, 1(7), 2011, 90-101
8. Masum, A. & Akhir, M. Environmental Education in Bangladesh with Special Reference to Higher Studies (1992-2009). International Journal of History & Research, 1(1), 2010, 1-32.
9. Ministry of Environment and Forests, Bangladesh. 18 July, 2013. http://www.climatechange-cell.org.bd/recent-initiatives.html
10. Oguz, D., Çakci, I. & Kavas, S. Environmental awareness of University Students in Ankara, Turkey, African Journal of Agricultural Research, 5(19), 2010, 2629-2636.
11. Oluk, S. And I. Ozalp, The Teaching of Global Environmental Problems According to The Constructivist Approach: As a Focal Point of the Problem and the Availability of Concept Cartoons. Educational Sciences: Theory and Practice, 7(2), 2007, 881-896.
12. Onder, S. A Survey of Awareness and Behaviour in Regard to Environmental Issues among Selcuk University Students in Konya, Turkey. Journal of Applied Sciences, 6 (2), 2006, 347-352.
13. Ozmen, D., Çetinkaya, A.Ç. & Nehir, S. Behaviors of University Students Towards Environmental Issues. TAF Preventive Medicine Bulletin, 4(6), 2005, 330-344.
14. Pillai, S. K. P. A Study of Environmental Awareness of Higher Secondary School Students in Cuddalore District. Research Expo International Multidisciplinary Research Journal 2(2), 2012, 44-48.
15. Shobeiri, S. M., Omidvar, B. & Prahallada, N. N. A Comperative Study of Environmental Awareness among Secondary School Students in Iran and India. Int. J. Environ. Res., 1 (1), 2007, 28-34.
16. Stapp, W.B. The concept of Environmental Education. Journal of Environmental Education. 1(1), 1969, 30-31.

42
17. Talay, I., Gündüz S. & Akpınar, N. The Determination of Environmental Awareness of University Students. A Case Study: Ankara University, Turkey. Int. J. of Environment and Pollution, 21(3), 2004, 293-308.
18. Thapa, B. Environmental Concern: a Comparative Analysis between Students in Recreation and Park Management and Other Departments. Environmental Education Research, 7, 2001, 39-53.
19. Uddin, M.T., Chowdhury, M. A. I. & Hossain, M. I. Study on Environmental Awareness, Attitude and Behavior of Students of Shahjalal University of Science and Technology, Sylhet, Bangladesh. Bangladesh J. Environ. Sci. 13(2), 2007, 65-70.

43
ADDENDA TO WEIBULL DISTRIBUTION IN MATLAB (DEFINITIONS, CODE SOURCES FOR FUNCTIONS,
APPLICATIONS)
Ştefan Cristian CIUCU 1 PhD Candidate, Cybernetics and Statistics Doctoral School, The Bucharest University of Economics Studies E-mail: [email protected]
Mihai REBENCIUC 2 PhD Lecturer, Dept. of Applied Mathematics, The Faculty of Applied Sciences, University Politehnica of Bucharest, Romania E-mail: [email protected]
Ionuţ Alexandru PETRE3 Programmer E-mail: [email protected]
ABSTRACT In this paper we make a new presentation of the Weibull distribution. We will make
some add-ons for the Statistics Toolbox in MATLAB with our functions for the form with scale and displacement of the distribution. Finally we will use these new functions on applications of the Weibull distribution. Key words: probability density function (pdf), cumulative distribution function (cdf), survivor function (sf), reliability function (rf).
INTRODUCTION The Weibull distribution has numerous applications, but most of the programs that
exist like MATLAB see [6], and others, have functions only for the scaled model of the distribution. In this paper we will present the Weibull distribution as probability function of the exponential distribution (for other types of generalizations of Weibull distribution see [7], [9]). We mention the classic application of the Weibull distribution which is using the scale parameter as an estimator of the wind speed in the wind turbines, see [1], [5], [12], [13], [14], [15], [16]. Additionally this estimation can be done in a mixt context where other distributions are used as well and even other techniques, see [2], [3], [4], [8], [10], [11]. The scope of this paper is to make a completion by using the Weibull distribution with its location

44
parameter. So we will define the Weibull distribution the scaled model with displacement having the shape, scale and location parameter.
Like before mentioned, existing programs have functions only for the scaled form of the Weibull distribution. For this reason we come to complete the statistics toolbox in MATLAB with functions that compute the pdf, cdf, quantiles, mean and variance (dispersion) the Weibull distribution with 3 parameters. We also have functions that plot the cdf for each of the distribution. Through these functions we wish to encourage the usage of the 3-parameter Weibull distribution.
WEIBULL DISTRIBUTION Definition 2.1. The Weibull distribution is defined through
where is the shape parameter and is the exponential distribution with . Observations 2.1.
i (scale) Formally is called the scale parameter and the definition
becomes .
ii (positive defined) By definition the random variable T is positive defined. iii (reliability function – rf, cumulative distribution function – cdf, probability density function – pdf) Specifically the Weibull distribution T is defined through: ‐ Reliability function (rf): , , because
( )=exp( ;
‐ Cumulative distribution function (cdf): , ,
‐ Probability density function (pdf): , ,
because is right differentiable in 0 just for .
The expressions with scaling are:
- rf: ;
- cdf: ;
- pdf: ;
iv (Weibull distribution with displacement) Weibull distribution with displacement (with
.location parameter and a=0 ) is defined through
where is the shape parameter and is the exponential distribution with displacement equal to 0 and .
The Weibull distribution with displacement is defined through:
- Reliability function (rf): , ;
Because

45
- Cumulative distribution function (cdf): ,
;
- Probability density function (pdf): , , with the
exception of because is not differantiable in a just for , meaning:
By definition the Weibull distribution with displacement is positive defined. Similar to the expressions with scaling we have:
- rf: ;
- cdf: ;
- pdf:
Moments of the Weibull distribution. The mean and variance (dispersion) of the
random variable T are:
Moments of the Weibull distribution with scaling.
To generalize the moments of k order of random variable T is:
Moments of the Weibull distribution with scaling and displacement. We have (by definition) the mean , variance (dispersion) similar to the
moments of superior order, we have:

46
MATLAB – STATISTICS TOOLBOX – WEIBULL DISTRIBUTION Waloddi Weibull offered the distribution that bears his name as an appropriate
analytical tool for modeling the breaking strength of materials. Current usage also includes reliability and lifetime modeling. The Weibull distribution is more flexible than the exponential for these purposes. [1]
Matlab Statistics Toolbox offers functions for the Weibull distribution with two
parameters baxb eabxy 1 , where a is the scale parameter and b is the shape parameter.
We will briefly go through the available functions in Matlab for the Weibull distribution.
i) wblpdf - Weibull probability density function Syntax Y = wblpdf(X,A,B) The pdf of the Weibul distribution is:
For the pdf of the Weibull distribution with one parameter we will use A = 1. ii) wblcdf - Weibull cumulative distribution function Syntax P = wblcdf(X,A,B) [P,PLO,PUP] = wblcdf(X,A,B,PCOV,alpha)
The cdf of the Weibull distribution is:
iii) wblinv - Weibull inverse cumulative distribution function Syntax X = wblinv(P,A,B) [X,XLO,XUP] = wblinv(P,A,B,PCOV,alpha)
Inverse cumulative distribution function:
iv) wblrnd – Weibull random numbers Syntax R = wblrnd(A,B) R = wblrnd(A,B,m,n,...) R = wblrnd(A,B,[m,n,...])
v) wblplot - Weibull probability plot Syntax wblplot(X) h = wblplot(X)

47
vi) wblstat - Weibull mean and variance (dispersion) Syntax [M,V] = wblstat(A,B) The mean of Weibull distribution with parameters a and b is:
1b1a
the variance is:
2112 b1b21a
vii) wblfit - Weibull parameter estimates Syntax parmhat = wblfit(data) [parmhat,parmci] = wblfit(data) [parmhat,parmci] = wblfit(data,alpha) [...] = wblfit(data,alpha,censoring) [...] = wblfit(data,alpha,censoring,freq) [...] = wblfit(...,options)
Estimates the Weibull distribution parameters in the probability
density: )x(Iexbab,axfy ),0(a
x
1bb
b
viii) wbllike - Weibull negative log-likelihood Syntax nlogL = wbllike(params,data) [logL,AVAR] = wbllike(params,data) [...] = wbllike(params,data,censoring) [...] = wbllike(params,data,censoring,freq)
The Weibull negative log-likelihood for uncensored data is:
where f is the Weibull pdf. wbllike is a utility function for maximum likelihood estimation.
4. FUNCTIONS FOR THE THREE PARAMETER WEIBULL DISTRIBUTION The Statistics Toolbox does not have functions for the Weibull distribution with three
parameters. For this reason we come with our own functions. i) The probability density function The pdf of 3 parameter Weibull distribution is:
function [P] = wbl3pdf(x, theta, beta, gamma) %theta scale parameter %beta shape parameter

48
%gamma location parameter n = length(x); f = zeros(1,n); for i=1:n if((x(i) > gamma) && (x(i)>0) && (gamma>=0)) f(i) = (beta/theta)*( ( (x(i)-gamma)/theta )^(beta-1) )*exp( -( (x(i)-gamma)/theta )^beta ); else f(i) = 0; end end P = f; end
ii) The cumulative distribution function The cdf of 3 parameter Weibull distribution is:
where ;1
,1
function [P] = wbl3cdf(x, theta, beta, gamma) %theta scale parameter %beta shape parameter %gamma location parameter n = length(x); F = zeros(1,n); for i=1:n if( (x(i) > gamma) && (x(i)>0) && (gamma>=0)) F(i) = 1 - exp(-( (x(i)-gamma)/theta)^beta); else F(i) = 0; end end P = F; end
iii) The inverse cumulative distribution function The inverse cdf of 3 parameter Weibull distribution is:
function [P] = wbl3inv(x, theta, beta, gamma) %x probability that is calculated %theta scale parameter %beta location parameter %gamma displacement parameter n = length(x); F = zeros(1,n);

49
for i=1:n if((x(i)>0) && (x(i)<1) && (gamma>=0)) F(i) = (-theta*((log(1-(x(i))))^(1/beta)))*sqrt(-1)-gamma; else F(i) = NaN; end end P = real(F); end
iv) The mean and the variance (dispersion) The formulas respectively for mean and variance (dispersion) are:
mean:
1
1m
variance (dispersion):
1
12
1 22
function [M V] = wbl3stat(theta, beta, gamma) %theta scale parameter %beta shape parameter %gamma location parameter mean = theta*gamma( (1/beta) + 1) + gamma; var = (theta^2)*( gamma( (2/beta) +1 ) - ( gamma( (1/beta)+1 ) )^2 ); M= mean; V = var; end
v) Random numbers generation
where x comes from a uniform distribution with values
between 0 and 1. function [X] = wbl3rnd(theta, beta, gamma, n) %theta scale parameter %beta shape parameter %gamma location parameter y = zeros(1,n); for i =1:n y(i) = (( -(theta^beta) * log( (1- (rand(1,1)) ) ) )^(1/beta)) + gamma; end X = y; end
vi) Plotting of the cumulative distribution function
function wbl3plot(x, theta, beta, gamma,) %theta scale parameter %beta shape parameter %gamma location parameter

50
n = length(x); lnx = zeros(1,n); Fecdf = wbl3cdf(x, theta, beta, gamma); for i=1:n lnx(i) = log(x(i)); end plot(lnx, Fecdf, 'bo'); end
APPLICATIONS
1) Data were gathered regarding the behavior of a truck gearbox, for a length of 15.000 km. During the period of analysis, 141 breaks of the gearbox were recorded.
The results, as frequency distribution function of the breaks, are in Table I: Table I
ti ki (%) (ti)
1 2 3 4 3000 6000 9000 12000 15000
26 49 39 22 4
18.6 53.2 81.1 96.6 99.7
0.82 0.46 0.18 0.04 0.008
Total =
141
- -
By constructing and studying the probabilistic networks a 3-parameter Weibull model
could be used, with the shape parameter =2, scale parameter =6900 and the location parameter =0.
The survivor function will have the form:
We will use our functions for the 3-Parameter Weibull Distribution. Since the location parameter is 0 we have a 2-Parameter Weibull Distribution, so we
can also use the Mathlab functions to verify the results of our functions. Command history To shorten the command history we will not always show the results of the
commands. First we initialize variables with the values of the scale, shape and locations
parameters, and a vector with the number of kilometers traveled. theta = 6900 beta = 2 gamma = 0 t = [3000 6000 9000 12000 15000]

51
We calculate the density distribution, first with the Mathlab function, then with our function:
wblpdf(t, theta, beta) wbl3pdf(t, theta, beta, gamma) The answer was identical for the both queries. The answer is: ans = 1.0e-003 * 0.1043 0.1183 0.0690 0.0245 0.0056 We calculate the distribution function: wblcdf(t, theta, beta) wbl3cdf(t, theta, beta, gamma) The answer is: ans = 0.1722 0.5305 0.8176 0.9514 0.9911 We calculate the quantiles: wblinv(0.25, theta, beta) wbl3inv(0.25, theta, beta, gamma) The answer is: ans = 3.7009e+003 wblinv(0.5, theta, beta) wbl3inv(0.5, theta, beta, gamma) The answer is: ans = 5.7446e+003 wblinv(0.75, theta, beta) wbl3inv(0.75, theta, beta, gamma) The answer is: ans = 8.1241e+003 We calculate the mean and the variance (dispersion): [m v] = wblstat(theta, beta) [m v] = wbl3stat(theta, beta, gamma) The answer is: mean: m = 6.1150e+003 variance (dispersion): v = 1.0217e+007 2) Trials have been made over five elements of a technical system. The cycles which
the breaks have followed (ascending reordered) were: 1.2, 2.0, 2.5, 2.9, 3.6. The estimator of the distribution function: lead to (in %): 10, 30, 50, 70, 90, which, represented on a probabilistic Nelson Thompson network along with the values of the working time allows us to state that the variable „work time” (in cycles) follows a Weibull law
with = 2.65 and = 2.7 cycles.(A.9)We will add the location parameter = 1 cycle, which helps us to state that a component will work at least 1 cycle until it will break.

52
Command history: theta = 2.7 beta = 2.65 gamma = 1 t = [1.2 2.0 2.5 2.9 3.6] wbl3pdf(t, theta, beta, gamma) The result is: ans = 0.0134 0.1774 0.3014 0.3706 0.3731 wbl3cdf(t, theta, beta, gamma) The result is: ans = 0.0010 0.0694 0.1899 0.3257 0.5954 wbl3inv(0.25, theta, beta, gamma) The result is: ans = 0.5636 wbl3inv(0.50, theta, beta, gamma) The result is: ans = 1.1789 wbl3inv(0.75, theta, beta, gamma) The result is: ans = 1.8303 [m v] = wbl3stat(theta, beta, gamma) The result is: mean: m = 3.3996 variance (dispersion):v = 0.9499 We will now draw the dispersion function: wbl3plot(t, theta, beta, gamma)
Fig. 1. Plotting of pdf from application 2) Observation. We could have used as an estimator the survival function instead of
the cumulative distribution function. We then would have had the survival function estimator, which would lead to the values (in %): 90, 70, 50, 30, 10.

53
6. CONCLUSIONS This article treats more the probabilistic side of the Weibull distribution, for this
reason we don’t have functions that estimate the parameters for the scaled model with displacement of the Weibull distribution.
The functions presented in this paper can be used in MATLAB also for the case when the location parameter is 0, but their purpose is to be used on applications of the Weibull distribution when the location parameter has a value that influences the calculation of the pdf, cdf or quantile.
REFERENCES 1. Ani, Samuel O., (Student Member, IEEE), Polinder, Henk (Member, IEEE), Ferreira, Jan
Abraham (Fellow, IEEE), Comparison of Energy Yield of Small Wind Turbines in Low Wind Speed Areas, IEEE Transactions on Sustainable Energy, Vol. 4, No. 1, January 2013.
10. Qin, Zhilong, Li, Wenyuan (Fellow, IEEE), Xiong, Xiaofu (Member, IEEE), Generation System Reliability Evaluation Incorporating Correlations of Wind Speeds With Different Distributions, IEEE Transactions on Power Systems, Vol. 28, No. 1, February 2013.
11. Rad, Arezou Habibi, Yousefzadeh, Fatemeh, Balakrishnan, Narayanaswamy, Goodness-of-Fit Test Based on Kullback-Leibler Information for Progressively Type-II Censored Data, IEEE Transactions on Reliability, Vol. 60, No. 3, September 2011.
12. Shi, Libao (Senior Member, IEEE), Wang, Chen, Yao, Liangzhong, Ni, Yixin, (Senior Member, IEEE), Bazargan, Masoud, Optimal Power Flow Solution Incorporating Wind Power, IEEE Systems Journal, Vol. 6, No. 2, June 2012.
13. Tuzuner, Akiner, Yu, Zuwei (Member IEEE), A Theoretical Analysis on Parameter Estimation for the Weibull Wind Speed Distribution, IEEE Transactions on Power Systems, Vol. 23, No. 3, August 2008.
14. Vallée, François, Lobry, Jacques, and Deblecker Olivier, System Reliability Assessment Method for Wind Power Integration, IEEE Transactions on Power Systems, Vol. 23, No. 3, August 2008.
15. Wang, Ruigang, Li, Wenyi, Bagen, B., Development of Wind Speed Forecasting Model Based on the Weibull Probability Distribution, International Conference on Computer Distributed Control and Intelligent Environmental Monitoring, 2011.
16. Yu, Zuwei (Member IEEE), Tuzuner, Akiner, Wind Speed Modeling and Energy Production Simulation with Weibull Sampling, IEEE PES General Meeting, 2008.
17. Isaic-Maniu, Al., “Metoda Weibull. Aplicaţii” (EN: “The Weibull Method. Applications”), Ed. Academiei Republicii Socialiste România, Bucureşti, 1983

54
2. Dey, Arabin Kumar, Kundu, Debasis, Discriminating Among the Log-Normal, Weibull, and Generalized Exponential Distributions, IEEE Transactions on Reliability, Vol. 58, No. 3, September 2009.
3. Fernández, A., Vázquez, M., Improved Estimation of Weibull Parameters Considering Unreliability Uncertainties, IEEE Transactions on Reliability, Vol. 61, No. 1, March 2012.
4. Kaminskiy, M. P., Krivtsov, V., A Simple Procedure for Bayesian Estimation of the Weibull Distribution, IEEE Transactions on Reliability, Vol. 54, No. 4, December 2005.
5. Liu, Xian (Senior Member, IEEE), Xu, Wilsun (Fellow, IEEE), Minimum Emission Dispatch Constrained by Stochastic Wind Power Availability and Cost, IEEE Transactions on Power Systems, Vol. 25, No. 3, August 2010.
6. MathWorks, Matlab Software R2011b (7.13.0.564), Statistics Toolbox V7.6 (R2011b), Weibull Distribution.
7. Nadarajah, S., Kotz, S., On Some Recent Modifications of Weibull Distribution, IEEE Transactions on Reliability, Vol. 54, No. 4, December 2005.
8. Ng, H. K. T., Parameter Estimation for a Modified Weibull Distribution, for Progressively Type-II Censored Samples, IEEE Transactions on Reliability, Vol. 54, No. 3, September 2005.
9. Pham, Hoang, Lai, Chin-Diew, On Recent Generalizations of the Weibull Distribution, IEEE Transactions on Reliability, Vol. 56, No. 3, September 2007.
1Ștefan Cristian CIUCU is PhD Candidate, Cybernetics and Statistics Doctoral School, The Bucharest University of Economics Studies - Thesis title: Creşterea economică a ţărilor în curs de tranziţie – O analiză cantitativă (Growth in Transition Countries - A quantitative analysis). 2011-2013 - Master’s degree - Politehnica University of Bucharest, Faculty of Applied Sciences, Models of decision, risk and forecasting. 2007-2011 - Bachelor of Engineering (B.E.) / IT Engineer - University of Bucharest, Department of Technology, Information Technology. Working in the IT domain since 2009. 2Mihai REBENCIUC is currently (in 2014), PhD Lecturer of the Dept. of Applied Mathematics, at The Faculty of Applied Sciences, University Politehnica of Bucharest, Romania. Domains of interest: Mathematical analysis, Fractals analysis, Probability theory, Statistics, Game Theory, Algebraic logic, General Topology, Rough Systems. 3Ionuţ Alexandru PETRE is Programmer, Software Development. Currently (in 2014) working in the IT business as a software developer having collaborations with people mainly from the US and Canada. He is developing backend applications in Node JS or in PHP frameworks like SugarCRM and Zend. Studied at the University of Bucharest, Department of Technology, Information Technology (2007 - 2011) for the Bachelor degree. Continued with a Masters at Politehnica University of Bucharest, Faculty of Applied Sciences, Models of decision, risk and forecasting (2011 - 2013). Participated and won 2nd prize at Science Communications Conference May 2012 at Politehnica University of Bucharest with paper “Addenda to Exponential and Weibull distribution” and again 2nd prize at Science Communications Conference May 2013 at Politehnica University of Bucharest with paper “Wind speed forecasting with Markov chains”.

55
WEB SOCIAL SCIENCE (Concepts, Data and Tools for social scientist in the digital age) by ROBERT ACKLAND
Vasile Alecsandru STRAT PhD, University Lecturer, Department of Statistics and Econometrics, Bucharest University of Economic Studies, Romania E-mail: [email protected]
ABSTRACT The goal of this book, as mentioned in the introductory part, is to provide a very
usable instrument for everyone to understand the social, political and economical dimensions of the web and also their implications regarding the existence of the contemporary society. Following this goal, the book is structured into two main parts, the first concerned with presenting and describing the main methods used in social science when conducting research on the web, and the second provides examples of different aspects that can and should be investigated using the web by social scientists. The examples provided by Ackland in his book range from friendship formation to politics, government and commerce related aspects. Key words: web, social media network, hyperlink, power law; Robert Ackland
The work entitled Web Social Science is the
outcome of many years of research conducted by professor Ackland in web related fields. The fact that the paper is written in a facile language becomes one of the main strengths of this book.
Going further, even though, as I have already pointed, the language used makes the book very accessible it is also very effective in providing a very clear description of the different methods that one might use when conducting web based researches. Therefore the book should be regarded as a very useful tool that describes how the web should be used by social scientists in order to shed some light over a wide range of questions that are still under debate. Still, some could find the approach as being simplistic due to the fact that the author does not provide very thorough descriptions of all the mentioned (described) methods and aspects, but instead, he prefers to focus his attention in providing a complete framework of all sides, related with the web that might be of interest for social scientists.

56
One of the main strengths of the present paper is the abundance of the sources provided as bibliographic notes that will be considered by everybody deciding to extend his research into one particular aspect as very useful.
Further, in this paper, I will try to identify the strengths and also the weaknesses of the book written by professor Ackland, using an iterative approach based on the chapters of the paper.
In the Introduction professor Ackland tries to establish some basic concepts involving the virtual world developed on top of the Internet. As strength I have to mention the fact that his work provides a very facile description of the main concepts that should be familiar to any researcher that shows interest for the web.
The first part of the book is concerned with presenting and describing the main methods used in social science when conducting research on the web. The chapter “Online research methods” is very well structured and all types of researches, quantitative and qualitative, are presented, and therefore the constructed picture is complete. Although, I have mentioned in the beginning of my work, the book tries to be a very accessible tool for researchers, practitioners and students, some parts should have been presented using a more detailed approach. Also, noteworthy is the fact that professor Ackland identifies clearly the advantages and the limitations of these online research methods.
The description of the social media networks and of the hyperlink networks (the author proposes the social network analysis as the appropriate method to quantitatively study the social networks that have emerged using the web) provided in the second and third chapter are very well documented with examples that make all the presented concepts very easy to understand. The book touches some very hot topics of our days by presenting Facebook and Twitter as environments extremely suitable for the social researchers to conduct their studies. The presentation of the three web crawlers (IssueCrawler, SocSciBot, VOSON) is also notable and will definitely be of great help for fellow researchers that find themselves in need for gathering large amount of data from different web pages.
The second part of the book provides examples that describe how the web has influenced several economical and social phenomena and also how different aspects related to social sciences can and should be studied using the web (using the methods described in the first part of the book).
In this second part, the first topic that receives the attention of the author is the friendship formation process (in different web networks as Facebook, online dating sites, Twitter) and the concept of social influence. Very important to mention, regarding this chapter, is the detailed description of the significant potential of web data when studying these aspects of the social life. Further, the book provides valuable information about the collective behavior of organizations on the web. Also noteworthy in this chapter is the description of the way the web influences the human behavior when talking about collective social movements (rioting behavior).
The next chapter tries to provide a clear description of how politics has been influenced by the web which brought new and very useful tools for increasing the visibility of political parties and other actors. The introduction to power laws from this chapter is very useful in order to provide a better understanding of how different phenomena occur on the web. Still, a more detailed description of power laws could have been provided because such an undertaking would have facilitated the understanding of the differences occurred in different phenomena between the web and the real world.
The focus in the eighth chapter is mostly on the ways the web impacts the methods used by government to disseminate information and to yield authority and lets the study of the macroeconomics of virtual worlds in a second plan. Therefore, even though the first part is very well covered by the author I believe that the study of the microeconomics of virtual world should have received a higher attention because these types of worlds are becoming more and more important nowadays (and their impact on the real world has become significant).
In the ninth chapter the author provides a very detailed description of the way the development of the web has influenced the collaboration and production. This chapter exemplifies in a very straightforward manner the impact of the web on the “scholarly world”

57
by discussing the visibility of the scholarly outputs and the distribution of the scholarly authority in the new paradigm of a highly interconnected academic world.
The last chapter provides some very valuable insights about two very important phenomena that were enhanced by the web (commerce and marketing). A strong point of the book is the description of the main coordinates of the online commerce versus the real world commerce through the long tail concept and superstar concept (both based on the same power laws). Further, the implication of Facebook in particular and of the online friendship in general in the marketing activity (influence in markets) is largely presented in this chapter and therefore social scientists concerned with this domain might find this chapter very interesting and useful.
Before bringing this paper to an end I have to state that even though the book is mainly recommended for social scientists it might prove useful for engineers, mathematicians and statisticians who are studying how different parts of the web are built and are functioning and also the methodological mechanism behind different phenomena that occur on the web.
As a final remark I will list professor’s Paul Vogt (from the Illinois State University, USA) words “Reading it taught me quite a lot about a subject I thought I knew rather well”

58
Nick EMMEL: Sampling and Choosing Cases in Qualitative Research. A realist approach
Loredana MANASIA PhD Candidate, University of Bucharest E-mail: [email protected]
ABSTRACT Nick Emmel’s book, Sampling and Choosing Cases in Qualitative Research. A realist
approach, stresses and lightens an important issue in qualitative research conducted in social sciences: sampling or choosing cases.
Key words: sampling; qualitative research; choosing cases; Nick Emmel
From a structural perspective, the book’s
information is organized in two main parts: the first one including three chapters and the second one divided into six chapters. The nine chapters are preceded by the Introductio n: from sampling to choosing cases.
From the early beginning, the author expresses in Introduction its dubitative opinion regarding the appropriate use of the verb sampling in the context of the qualitative research. Emmel apprises that this conceptual fuzziness doesn’t lay only on this sampling issue but goes further on the three main cases of sampling: theoretical, purposeful and theoretical or purposive.
Based on the three traditions in qualitative research sampling, the author builds the first part of the book taking a lot of care for historical, methodological and conceptual details. The first chapter develops the evolutionary story of the grounded theory and theoretical sampling form positivism to constructivism. Emmel starts by presenting Glaser and Strauss (1967) theoretical and research work in the field of grounded theory

59
and scaffolds his argumentation with the work of Strauss and Corbin (1990) ending in the paradigm of the constructivist grounded theory (Charmaz, 2006). In the end of the first chapter it is pointed out one of the biggest changes in theoretical sampling: the reflexive researcher.
The next chapter moves to Purposeful Sampling and introduces the pragmatic researcher using purposeful sampling strategies. Patton’s 14+1 sampling strategies are the core of the chapter adding value to the qualitative research form a practical perspective. The last chapter of the part one is focused on the case of theoretical or purposive sample bringing in the interpretative analytic induction. The author emphasizes the new position of the researcher as a part of his research work, making decisions and being intellectually involved.
In the second part of the book the focus is on a realist approach to sampling in qualitative research as the author himself states. This six-chapter part starts by retaking into account the five propositions Emmel made in Introduction. Chapter four is designed to state the basics of a realist approach in qualitative research. Chapter five continues the reflection on the purposive work and on the role of the intellectual work of the researcher in his work and decision making process. In this case the presuppositions, opinions, interests and knowledge of the researcher have a significant influence in research shaping. Chapter six puts into the light the concept of cases and explains how cases become research based on purposeful choices. The role of the researcher is essential and active in transforming a sample into cases and furthermore in valuable insights through interpretation and explanation. The seventh chapter reveals how researcher’s ideas could transform purposive sampling into a purposeful one. Also in this chapter the reader will find some challenges emerging form a realistic casing methodology such as unrepresentativeness of the sample and difficulties in generalizing the findings. The author continues in chapter eight with expressing another actual and present challenge in qualitative research: the sample size. He reflects on issues like small samples and number of cases to be sampled in qualitative research. Chapter nine lightens up the ideas of the author in choosing cases in qualitative research from a very practical and realistic point of view.
Nevertheless the book proposes a dense lecture and addresses a wide range of scholars in social sciences like researchers or teachers, young PhDs and students interested in qualitative research. Emmel presents and critically evaluates different methodologies used to casing in qualitative research. Sampling and Choosing Cases in Qualitative Research builds in a relevant and interesting way a link between theoretical framework, author’s personal reflection and examples coming from the research practice.