Embed Size (px)
Citation preview
April 2005Volume 67 Number 1ISSN 1090-6924A Publication of the NationalSpeleological Society
JOURNAL OFCAVE AND KARSTSTUDIES
EditorMalcolm S. Field
National Center of Environmental Assessment (8623D)Office of Research and Development
U.S. Environmental Protection Agency1200 Pennsylvania Avenue NW
Washington, DC 20460-0001202-564-3279 Voice 202-565-0079 FAX
Production EditorJames A. PisarowiczWind Cave National ParkHot Springs, SD 57747
BOARD OF EDITORSAnthropologyPatty Jo Watson
Department of AnthropologyWashington UniversitySt. Louis, MO 63130
Conservation-Life SciencesJulian J. Lewis & Salisa L. Lewis
Lewis & Associates LLCCave, Karst & Groundwater Biological Consulting
17903 State Road 60Borden, IN 47106-8608
Earth Sciences-Journal IndexIra D. SasowskyDepartment of Geology
University of AkronAkron, OH 44325-4101
ExplorationPaul Burger
Cave Resources Office3225 National Parks Highway
Carlsbad, NM 88220(505)785-3106
PaleontologyGreg McDonald
Geologic Resource DivisonNational Park Service
P.O. Box 25287Denver, CO 80225
Social SciencesJoseph C. Douglas
History DepartmentVolunteer State Community College
1480 Nashville PikeGallatin, TN 37066
Book ReviewsArthur N. Palmer & Margaret V. Palmer
Department of Earth SciencesState University of New York
Oneonta, NY 13820-4015607-432-6024
ProofreaderDonald G. Davis
JOURNAL ADVISORY BOARDBarbara am Ende Hazel A. BartonChris Groves Carol HillHorton Hobbs III David JagnowJulia James Kathy Lavoie
Joyce Lundberg
Journal of Cave and Karst Studiesof the National Speleological SocietyVolume 67 Number 1 April 2005
CONTENTS
ArticleGenetic processes of cave minerals in volcanic environments:An overviewPaolo Forti 3
ArticleKarst development on Tinian, Commonwealth of the Northern Mariana Islands: Controls on dissolution in relationto the carbonate island karst modelKevin Stafford, John Mylroie, Danko Taboroši, John Jenson, and Joan Mylroie 14
ArticleMicrobial metabolic structure in a sulfidic cave hot spring:Potential mechanisms of biospeleogenesisHazel Barton and Frederick Luiszer 28
ArticleThe 19th century excavation of Kent’s Cavern, EnglandDonald A. McFarlane and Joyce Lundberg 39
ArticleKarst distribution and controls on Yoron-Jima, an emerged reef island in sub-tropical JapanJames P Terry 48
DiscussionPersistent coliform contamination in Lechuguilla cave poolsHazel A. Barton and Norman R. Pace 55
ForumPersistent coliform contamination in Lechuguilla cave poolsDonald G. Davis 57
Book ReviewsEncyclopedia of Caves 58Recommendations and Guidelines for Managing Caves on Protected Lands 59Water Resources Engineering in Karst 60
ArticlePreservation of prehistoric footprints in Jaguar Cave, TennesseeP. Willey, Judy Stolen, George Crothers, and Patty Jo Watson 61
ArticleCarbonate precipitation along a microclimatic gradient in a Thailand cave - Continuum of calcareous tufa and speleothemsDanko Taboroši, Kazuomi Hirakawa, and Takanobu Sawagaki 69
EditorialNew “Forum” for AuthorsMalcolm S. Field 88
The Journal of Cave and Karst Studies (ISSN 1090-6924, CPM Number #40065056) is a multi-disciplinary, refereedjournal published three times a year by the National Speleological Society, 2813 Cave Avenue, Huntsville, Alabama35810-4431 USA; (256) 852-1300; FAX (256) 851-9241, e-mail: [email protected]; World Wide Web:http://www.caves.org/pub/journal/. The annual subscription fee, worldwide, by surface mail, is $18 US. Airmail deliv-ery outside the United States of both the NSS News and the Journal of Cave and Karst Studies is available for an addi-tional fee of $40 (total $58); The Journal of Cave and Karst Studies is not available alone by airmail. Back issues andcumulative indices are available from the NSS office. POSTMASTER: send address changes to the Journal of Caveand Karst Studies, 2813 Cave Avenue, Huntsville, Alabama 35810-4431 USA.
The Journal of Cave and Karst Studies is covered the the following ISI Thomson Services: Science Citation IndexExpanded, ISI Alerting Services, and Current Contents/Physical, Chemical, and Earth Sciences.
Copyright © 2005 by the National Speleological Society, Inc. Printed on recycled paper by American Web, 4040Dahlia Street, Denver, Colorado 80216 USA
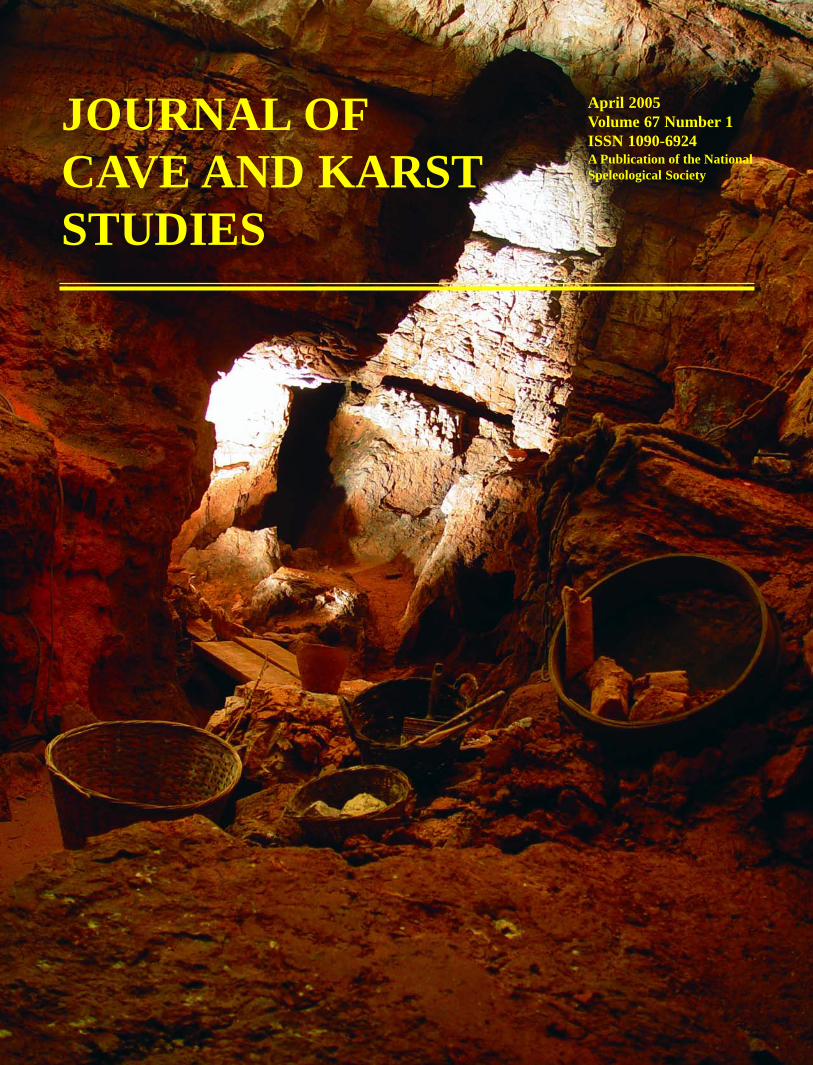
Front cover: Reconstruction of Pengelly’s excavations, the Charcoal Cave, Kent’s Cavern. See Donald A. McFarlaneand Joyce Lundberg, p. 39.
Journal of Cave and Karst Studies, April 2005 • 3
Paolo Forti - Genetic processes of cave minerals in volcanic environments: An overview. Journal of Cave and Karst Studies, v. 67, no. 1, p. 3-13.
Volcanic caves are widespread in the world and are active-ly explored by cavers so it is common to find descriptions ofthe exploration, speleogenesis and morphology of these cavesin the literature. However, the accurate study of thespeleothems hosted by these caves is rather new because, untilrecently, lava tubes and other volcanic cavities have been con-sidered of little interest from the point of view of secondaryminerals (Forti 1994). Most volcanic caves allow for the devel-opment of only a few small speleothems apart from lava sta-lactites and stalagmites, which normally cannot be consideredas true cave formations (Hill & Forti 1997).
The first written report of minerals found in a volcaniccave appeared only at the end of the 18th century, some onehundred years later than the first descriptions of speleothemsin limestone caves (Shaw 1997). Lazzaro Spallanzani in hisrenowned “Viaggio alle Due Sicilie” (1792-97) first wrote ofminerals he found in Alum Cave in the Vulcano Island:
“…but the most interesting object is a natur-al cave…from which a column of smoke con-tinuously exits…Sublimated sulphur givesrise to conical yellow to pink stalactites up to3 feet long and two inch thick. …Some watersprings out from the cave wall giving rise tosome deposits over the lava beds…consistingof stalactitic alum…sometimes with ammoni-um chloride…Deposits of iron sulphate arefairly common…”
After this first paper only a few others were printed up tothe middle of the 20th century (Recupero 1815; Sava 1842;Scacchi 1850; Ulrich 1870; Mac Ivor 1887; Bellini 1901;Zambonini 1907).
However, within the last 10 years it has become increas-ingly clear that volcanic cavities are one of the most importantcave environments in which minerogenetic reactions can takeplace (Forti 1994). The peculiar physicochemical conditions,which dramatically change from the early stages of lava tubeformation to the maturity of the cavity, together with the high
number of different elements present inside the lava itself,allow for the development of a great variety of cave minerals(some tens of which are restricted to a volcanic environment).Even if only a few volcanic caves have been specifically stud-ied from the mineralogical point of view, some of them areamong the most interesting caves of the world for their hostedspeleothems.
The present paper presents an update on the minerogeneticmechanisms active in a volcanic environment (Forti 2000) andit an overview of those minerals which are presently restrictedto such an environment. Lastly, the most important volcaniccaves in the world for the hosted speleothems are discussed.
MINEROGENETIC MECHANISMS IN THE VOLCANIC ENVIRONMENT
Despite the general scarcity of secondary chemicaldeposits, volcanic caves host up to six active minerogeneticmechanisms (Table 1; Fig. 1). The first two are absolutelypeculiar to this environment; in fact, in the early stages of theirdevelopment the extremely different environmental conditionsthat exist inside them allow for the activation of differentprocesses which are practically controlled by the temperatureof the cave atmosphere. In the time that passes as the lavawalls cool, the active process changes, and therefore the chem-ical composition as well as the morphology of the resultingspeleothems are quite different. The first place where such anevolution was experimentally demonstrated was the Cutronalava tube on Mt. Etna (Forti et al. 1994). Here, the cave climateand the evolution of speleothems were monitored since thecave’s discovery (some 8–10 months after the end of the erup-tion which generated the cave) until its internal temperaturewas no longer in equilibrium with the external environment.This study demonstrated that the evolution of secondary chem-ical deposits may start as soon as the lava stops flowing, andmaybe even earlier, when the temperature inside the cave isstill extremely high.
GENETIC PROCESSES OF CAVE MINERALS IN VOLCANICENVIRONMENTS: AN OVERVIEW
PAOLO FORTIItalian Institute of Speleology, University of Bologna, via Zamboni 67, 40126 Bologna, ITALY [email protected]
Volcanic caves have been considered of little mineralogic interest until recent years. As a consequence,very few papers have been printed on this topic in the past. In reality volcanic cavities are a very favor-able environment for the development of different minerogenetic processes. Cave minerals actually pre-sent in volcanic environments constitute up to 40% of secondary chemical deposits found in all the cavesof the world, and 35 of them (corresponding to ~10% of the actually known cave minerals) are restrict-ed to such a environment. In the present paper, the six minerogenetic mechanisms active in the volcaniccaves (degassing, solubilization, alteration, karst process, biogenic activity, phase change) are describedfollowing the decrease of cave temperature. The genesis of some of the most important secondary chem-ical deposits is discussed and a tentative list of the most interesting volcanic caves for hosted speleothemsis given.
4 • Journal of Cave and Karst Studies, April 2005
GENETIC PROCESSES OF CAVE MINERALS IN VOLCANIC ENVIRONMENTS
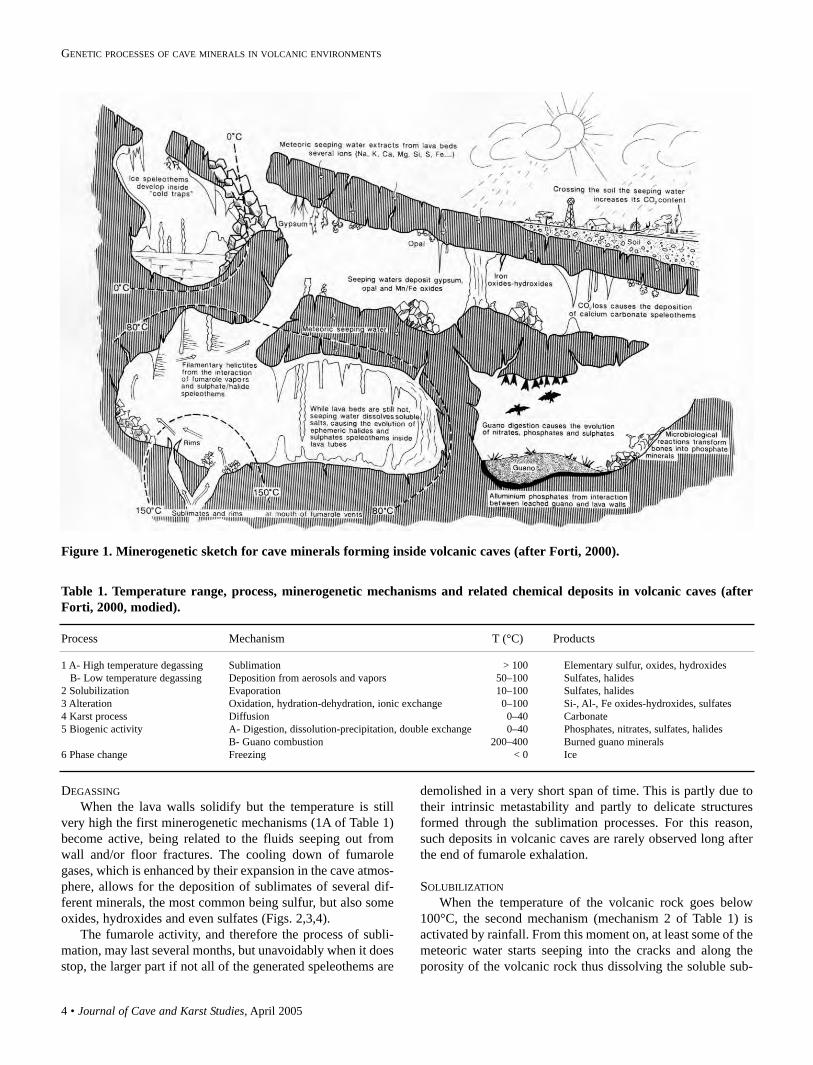
DEGASSINGWhen the lava walls solidify but the temperature is still
very high the first minerogenetic mechanisms (1A of Table 1)become active, being related to the fluids seeping out fromwall and/or floor fractures. The cooling down of fumarolegases, which is enhanced by their expansion in the cave atmos-phere, allows for the deposition of sublimates of several dif-ferent minerals, the most common being sulfur, but also someoxides, hydroxides and even sulfates (Figs. 2,3,4).
The fumarole activity, and therefore the process of subli-mation, may last several months, but unavoidably when it doesstop, the larger part if not all of the generated speleothems are
demolished in a very short span of time. This is partly due totheir intrinsic metastability and partly to delicate structuresformed through the sublimation processes. For this reason,such deposits in volcanic caves are rarely observed long afterthe end of fumarole exhalation.
SOLUBILIZATIONWhen the temperature of the volcanic rock goes below
100°C, the second mechanism (mechanism 2 of Table 1) isactivated by rainfall. From this moment on, at least some of themeteoric water starts seeping into the cracks and along theporosity of the volcanic rock thus dissolving the soluble sub-
Figure 1. Minerogenetic sketch for cave minerals forming inside volcanic caves (after Forti, 2000).
Table 1. Temperature range, process, minerogenetic mechanisms and related chemical deposits in volcanic caves (afterForti, 2000, modied).
Process Mechanism T (°C) Products
1 A- High temperature degassing Sublimation > 100 Elementary sulfur, oxides, hydroxidesB- Low temperature degassing Deposition from aerosols and vapors 50–100 Sulfates, halides
2 Solubilization Evaporation 10–100 Sulfates, halides3 Alteration Oxidation, hydration-dehydration, ionic exchange 0–100 Si-, Al-, Fe oxides-hydroxides, sulfates4 Karst process Diffusion 0–40 Carbonate5 Biogenic activity A- Digestion, dissolution-precipitation, double exchange 0–40 Phosphates, nitrates, sulfates, halides
B- Guano combustion 200–400 Burned guano minerals6 Phase change Freezing < 0 Ice
Journal of Cave and Karst Studies, April 2005 • 5
FORTI
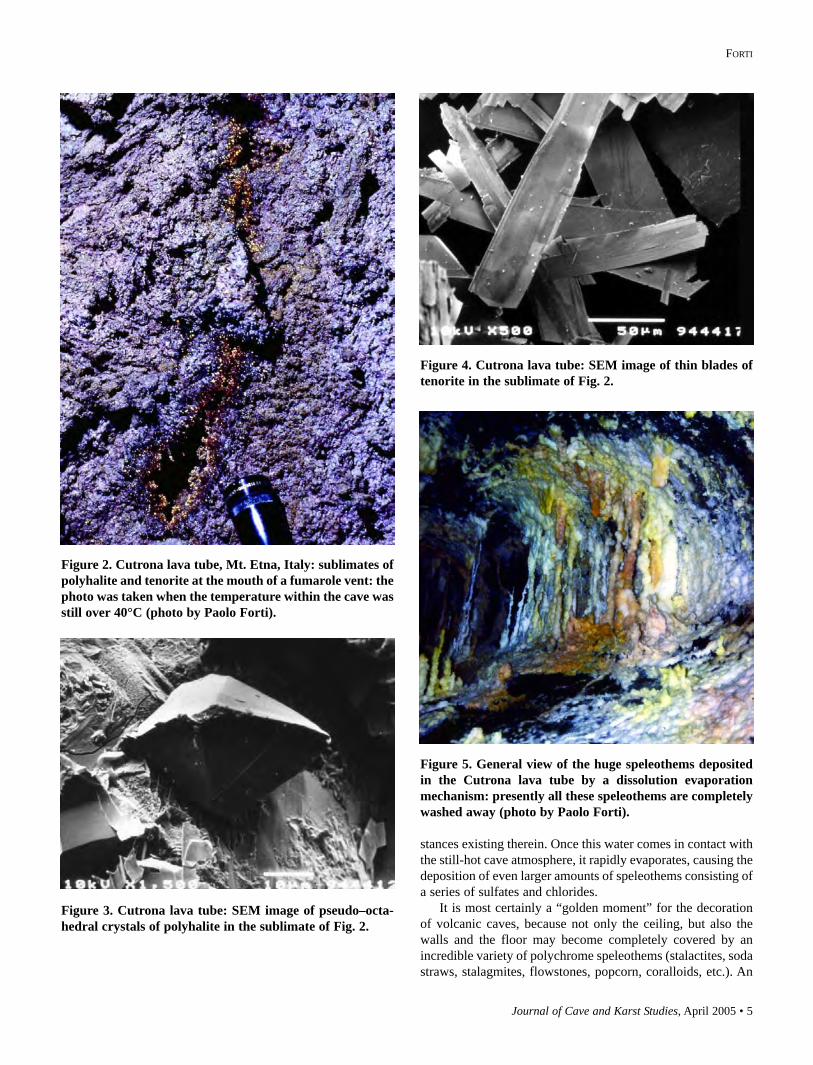
stances existing therein. Once this water comes in contact withthe still-hot cave atmosphere, it rapidly evaporates, causing thedeposition of even larger amounts of speleothems consisting ofa series of sulfates and chlorides.
It is most certainly a “golden moment” for the decorationof volcanic caves, because not only the ceiling, but also thewalls and the floor may become completely covered by anincredible variety of polychrome speleothems (stalactites, sodastraws, stalagmites, flowstones, popcorn, coralloids, etc.). An
Figure 2. Cutrona lava tube, Mt. Etna, Italy: sublimates ofpolyhalite and tenorite at the mouth of a fumarole vent: thephoto was taken when the temperature within the cave wasstill over 40°C (photo by Paolo Forti).
Figure 3. Cutrona lava tube: SEM image of pseudo–octa-hedral crystals of polyhalite in the sublimate of Fig. 2.
Figure 4. Cutrona lava tube: SEM image of thin blades oftenorite in the sublimate of Fig. 2.
Figure 5. General view of the huge speleothems depositedin the Cutrona lava tube by a dissolution evaporationmechanism: presently all these speleothems are completelywashed away (photo by Paolo Forti).
6 • Journal of Cave and Karst Studies, April 2005
GENETIC PROCESSES OF CAVE MINERALS IN VOLCANIC ENVIRONMENTS
exceptional example of this kind of decoration was found inthe Cutrona lava tube on Mt. Etna (Fig.5), but other caves areknown in the world with similar formations (Jakobsson et al.1992, Jónsson 1994, Davies 1998).
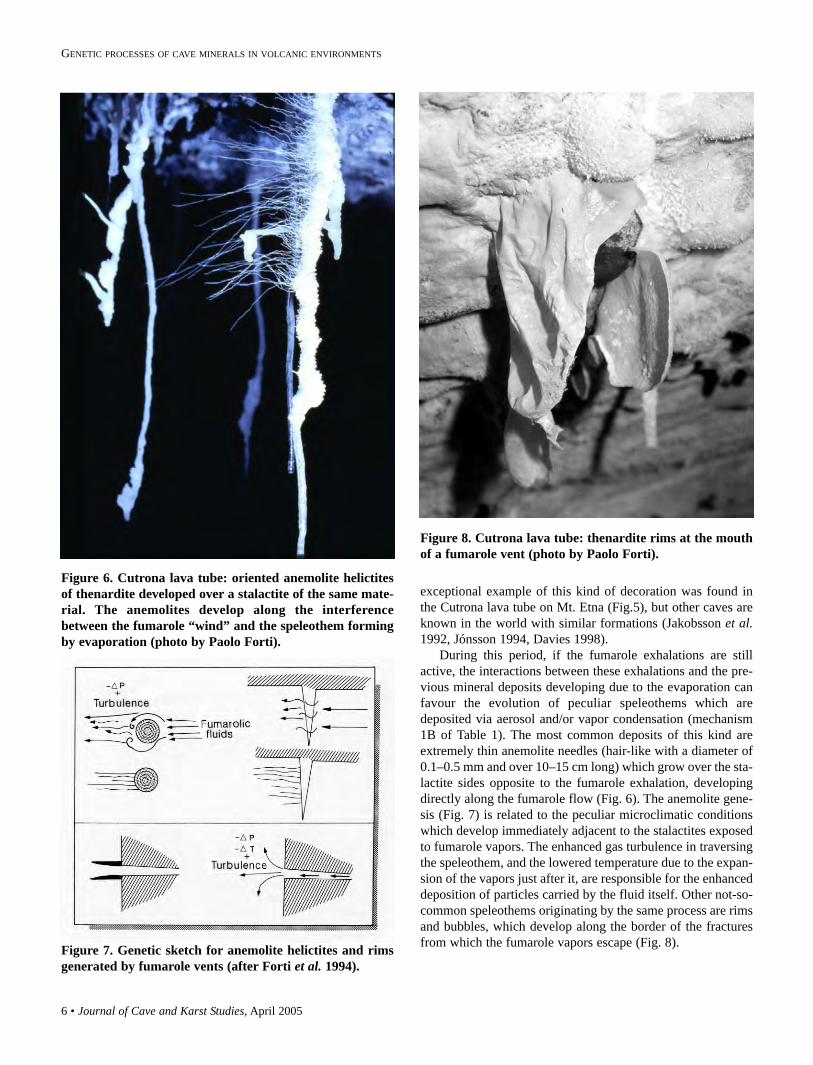
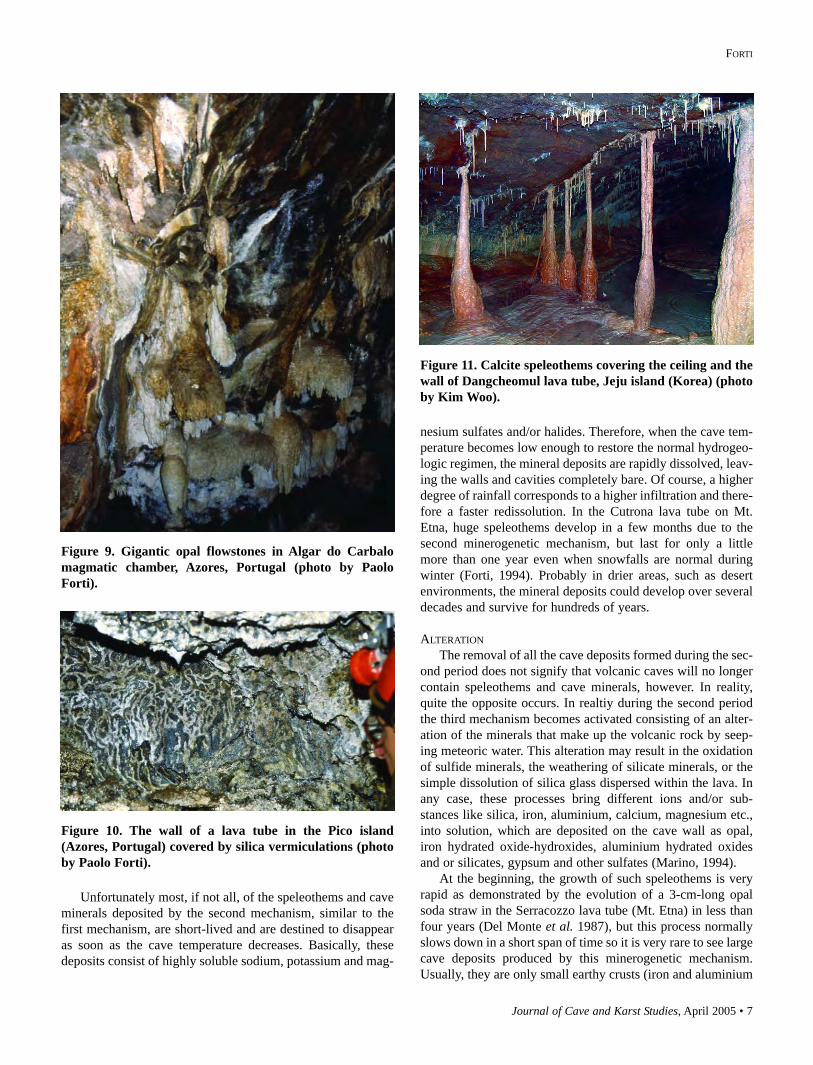
During this period, if the fumarole exhalations are stillactive, the interactions between these exhalations and the pre-vious mineral deposits developing due to the evaporation canfavour the evolution of peculiar speleothems which aredeposited via aerosol and/or vapor condensation (mechanism1B of Table 1). The most common deposits of this kind areextremely thin anemolite needles (hair-like with a diameter of0.1–0.5 mm and over 10–15 cm long) which grow over the sta-lactite sides opposite to the fumarole exhalation, developingdirectly along the fumarole flow (Fig. 6). The anemolite gene-sis (Fig. 7) is related to the peculiar microclimatic conditionswhich develop immediately adjacent to the stalactites exposedto fumarole vapors. The enhanced gas turbulence in traversingthe speleothem, and the lowered temperature due to the expan-sion of the vapors just after it, are responsible for the enhanceddeposition of particles carried by the fluid itself. Other not-so-common speleothems originating by the same process are rimsand bubbles, which develop along the border of the fracturesfrom which the fumarole vapors escape (Fig. 8).
Figure 6. Cutrona lava tube: oriented anemolite helictitesof thenardite developed over a stalactite of the same mate-rial. The anemolites develop along the interferencebetween the fumarole “wind” and the speleothem formingby evaporation (photo by Paolo Forti).
Figure 7. Genetic sketch for anemolite helictites and rimsgenerated by fumarole vents (after Forti et al. 1994).
Figure 8. Cutrona lava tube: thenardite rims at the mouthof a fumarole vent (photo by Paolo Forti).
Journal of Cave and Karst Studies, April 2005 • 7
FORTI
Unfortunately most, if not all, of the speleothems and caveminerals deposited by the second mechanism, similar to thefirst mechanism, are short-lived and are destined to disappearas soon as the cave temperature decreases. Basically, thesedeposits consist of highly soluble sodium, potassium and mag-
nesium sulfates and/or halides. Therefore, when the cave tem-perature becomes low enough to restore the normal hydrogeo-logic regimen, the mineral deposits are rapidly dissolved, leav-ing the walls and cavities completely bare. Of course, a higherdegree of rainfall corresponds to a higher infiltration and there-fore a faster redissolution. In the Cutrona lava tube on Mt.Etna, huge speleothems develop in a few months due to thesecond minerogenetic mechanism, but last for only a littlemore than one year even when snowfalls are normal duringwinter (Forti, 1994). Probably in drier areas, such as desertenvironments, the mineral deposits could develop over severaldecades and survive for hundreds of years.
ALTERATIONThe removal of all the cave deposits formed during the sec-
ond period does not signify that volcanic caves will no longercontain speleothems and cave minerals, however. In reality,quite the opposite occurs. In realtiy during the second periodthe third mechanism becomes activated consisting of an alter-ation of the minerals that make up the volcanic rock by seep-ing meteoric water. This alteration may result in the oxidationof sulfide minerals, the weathering of silicate minerals, or thesimple dissolution of silica glass dispersed within the lava. Inany case, these processes bring different ions and/or sub-stances like silica, iron, aluminium, calcium, magnesium etc.,into solution, which are deposited on the cave wall as opal,iron hydrated oxide-hydroxides, aluminium hydrated oxidesand or silicates, gypsum and other sulfates (Marino, 1994).
At the beginning, the growth of such speleothems is veryrapid as demonstrated by the evolution of a 3-cm-long opalsoda straw in the Serracozzo lava tube (Mt. Etna) in less thanfour years (Del Monte et al. 1987), but this process normallyslows down in a short span of time so it is very rare to see largecave deposits produced by this minerogenetic mechanism.Usually, they are only small earthy crusts (iron and aluminium
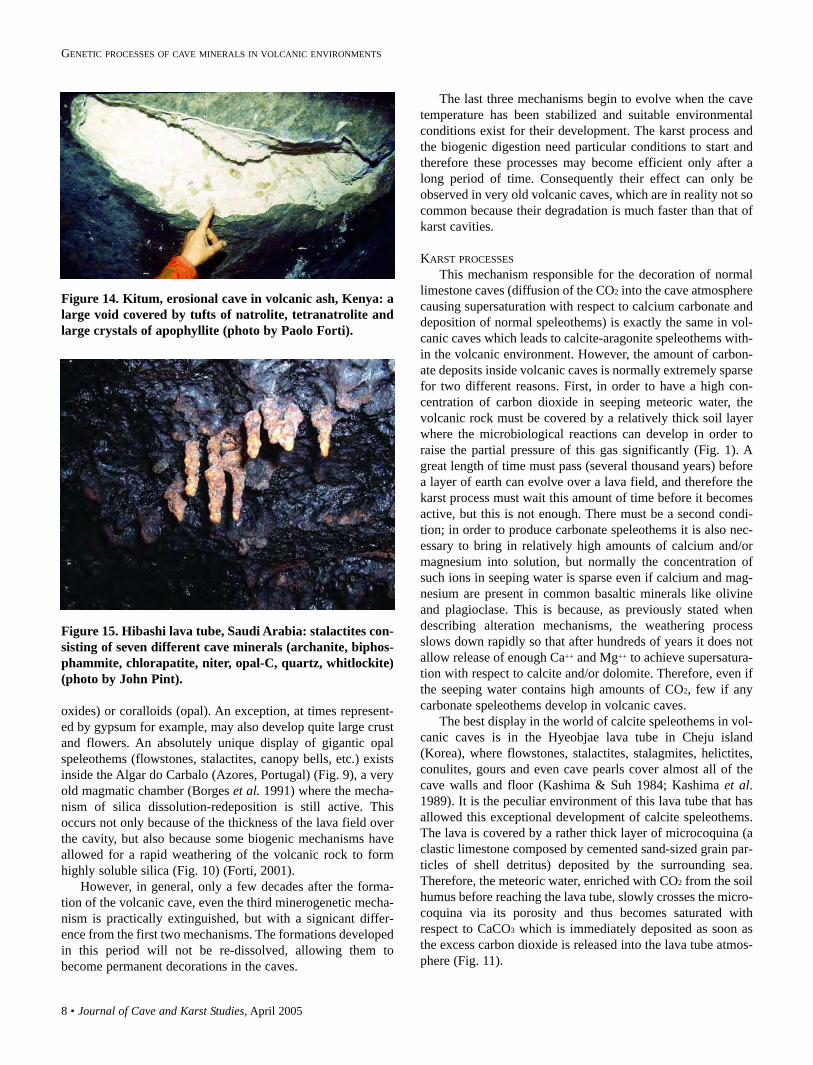
Figure 9. Gigantic opal flowstones in Algar do Carbalomagmatic chamber, Azores, Portugal (photo by PaoloForti).
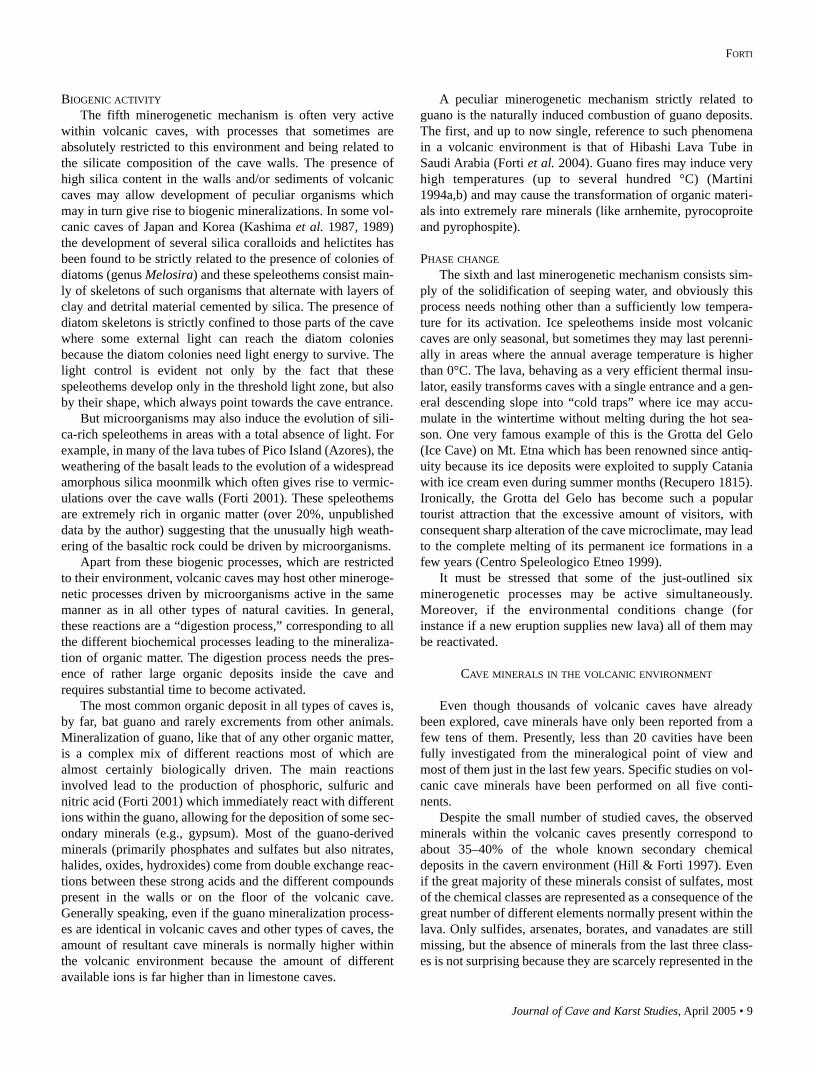
Figure 10. The wall of a lava tube in the Pico island(Azores, Portugal) covered by silica vermiculations (photoby Paolo Forti).
Figure 11. Calcite speleothems covering the ceiling and thewall of Dangcheomul lava tube, Jeju island (Korea) (photoby Kim Woo).
8 • Journal of Cave and Karst Studies, April 2005
GENETIC PROCESSES OF CAVE MINERALS IN VOLCANIC ENVIRONMENTS
oxides) or coralloids (opal). An exception, at times represent-ed by gypsum for example, may also develop quite large crustand flowers. An absolutely unique display of gigantic opalspeleothems (flowstones, stalactites, canopy bells, etc.) existsinside the Algar do Carbalo (Azores, Portugal) (Fig. 9), a veryold magmatic chamber (Borges et al. 1991) where the mecha-nism of silica dissolution-redeposition is still active. Thisoccurs not only because of the thickness of the lava field overthe cavity, but also because some biogenic mechanisms haveallowed for a rapid weathering of the volcanic rock to formhighly soluble silica (Fig. 10) (Forti, 2001).
However, in general, only a few decades after the forma-tion of the volcanic cave, even the third minerogenetic mecha-nism is practically extinguished, but with a signicant differ-ence from the first two mechanisms. The formations developedin this period will not be re-dissolved, allowing them tobecome permanent decorations in the caves.
The last three mechanisms begin to evolve when the cavetemperature has been stabilized and suitable environmentalconditions exist for their development. The karst process andthe biogenic digestion need particular conditions to start andtherefore these processes may become efficient only after along period of time. Consequently their effect can only beobserved in very old volcanic caves, which are in reality not socommon because their degradation is much faster than that ofkarst cavities.
KARST PROCESSESThis mechanism responsible for the decoration of normal
limestone caves (diffusion of the CO2 into the cave atmospherecausing supersaturation with respect to calcium carbonate anddeposition of normal speleothems) is exactly the same in vol-canic caves which leads to calcite-aragonite speleothems with-in the volcanic environment. However, the amount of carbon-ate deposits inside volcanic caves is normally extremely sparsefor two different reasons. First, in order to have a high con-centration of carbon dioxide in seeping meteoric water, thevolcanic rock must be covered by a relatively thick soil layerwhere the microbiological reactions can develop in order toraise the partial pressure of this gas significantly (Fig. 1). Agreat length of time must pass (several thousand years) beforea layer of earth can evolve over a lava field, and therefore thekarst process must wait this amount of time before it becomesactive, but this is not enough. There must be a second condi-tion; in order to produce carbonate speleothems it is also nec-essary to bring in relatively high amounts of calcium and/ormagnesium into solution, but normally the concentration ofsuch ions in seeping water is sparse even if calcium and mag-nesium are present in common basaltic minerals like olivineand plagioclase. This is because, as previously stated whendescribing alteration mechanisms, the weathering processslows down rapidly so that after hundreds of years it does notallow release of enough Ca++ and Mg++ to achieve supersatura-tion with respect to calcite and/or dolomite. Therefore, even ifthe seeping water contains high amounts of CO2, few if anycarbonate speleothems develop in volcanic caves.
The best display in the world of calcite speleothems in vol-canic caves is in the Hyeobjae lava tube in Cheju island(Korea), where flowstones, stalactites, stalagmites, helictites,conulites, gours and even cave pearls cover almost all of thecave walls and floor (Kashima & Suh 1984; Kashima et al.1989). It is the peculiar environment of this lava tube that hasallowed this exceptional development of calcite speleothems.The lava is covered by a rather thick layer of microcoquina (aclastic limestone composed by cemented sand-sized grain par-ticles of shell detritus) deposited by the surrounding sea.Therefore, the meteoric water, enriched with CO2 from the soilhumus before reaching the lava tube, slowly crosses the micro-coquina via its porosity and thus becomes saturated withrespect to CaCO3 which is immediately deposited as soon asthe excess carbon dioxide is released into the lava tube atmos-phere (Fig. 11).
Figure 14. Kitum, erosional cave in volcanic ash, Kenya: alarge void covered by tufts of natrolite, tetranatrolite andlarge crystals of apophyllite (photo by Paolo Forti).
Figure 15. Hibashi lava tube, Saudi Arabia: stalactites con-sisting of seven different cave minerals (archanite, biphos-phammite, chlorapatite, niter, opal-C, quartz, whitlockite)(photo by John Pint).
Journal of Cave and Karst Studies, April 2005 • 9
FORTI
BIOGENIC ACTIVITYThe fifth minerogenetic mechanism is often very active
within volcanic caves, with processes that sometimes areabsolutely restricted to this environment and being related tothe silicate composition of the cave walls. The presence ofhigh silica content in the walls and/or sediments of volcaniccaves may allow development of peculiar organisms whichmay in turn give rise to biogenic mineralizations. In some vol-canic caves of Japan and Korea (Kashima et al. 1987, 1989)the development of several silica coralloids and helictites hasbeen found to be strictly related to the presence of colonies ofdiatoms (genus Melosira) and these speleothems consist main-ly of skeletons of such organisms that alternate with layers ofclay and detrital material cemented by silica. The presence ofdiatom skeletons is strictly confined to those parts of the cavewhere some external light can reach the diatom coloniesbecause the diatom colonies need light energy to survive. Thelight control is evident not only by the fact that thesespeleothems develop only in the threshold light zone, but alsoby their shape, which always point towards the cave entrance.
But microorganisms may also induce the evolution of sili-ca-rich speleothems in areas with a total absence of light. Forexample, in many of the lava tubes of Pico Island (Azores), theweathering of the basalt leads to the evolution of a widespreadamorphous silica moonmilk which often gives rise to vermic-ulations over the cave walls (Forti 2001). These speleothemsare extremely rich in organic matter (over 20%, unpublisheddata by the author) suggesting that the unusually high weath-ering of the basaltic rock could be driven by microorganisms.
Apart from these biogenic processes, which are restrictedto their environment, volcanic caves may host other mineroge-netic processes driven by microorganisms active in the samemanner as in all other types of natural cavities. In general,these reactions are a “digestion process,” corresponding to allthe different biochemical processes leading to the mineraliza-tion of organic matter. The digestion process needs the pres-ence of rather large organic deposits inside the cave andrequires substantial time to become activated.
The most common organic deposit in all types of caves is,by far, bat guano and rarely excrements from other animals.Mineralization of guano, like that of any other organic matter,is a complex mix of different reactions most of which arealmost certainly biologically driven. The main reactionsinvolved lead to the production of phosphoric, sulfuric andnitric acid (Forti 2001) which immediately react with differentions within the guano, allowing for the deposition of some sec-ondary minerals (e.g., gypsum). Most of the guano-derivedminerals (primarily phosphates and sulfates but also nitrates,halides, oxides, hydroxides) come from double exchange reac-tions between these strong acids and the different compoundspresent in the walls or on the floor of the volcanic cave.Generally speaking, even if the guano mineralization process-es are identical in volcanic caves and other types of caves, theamount of resultant cave minerals is normally higher withinthe volcanic environment because the amount of differentavailable ions is far higher than in limestone caves.
A peculiar minerogenetic mechanism strictly related toguano is the naturally induced combustion of guano deposits.The first, and up to now single, reference to such phenomenain a volcanic environment is that of Hibashi Lava Tube inSaudi Arabia (Forti et al. 2004). Guano fires may induce veryhigh temperatures (up to several hundred °C) (Martini1994a,b) and may cause the transformation of organic materi-als into extremely rare minerals (like arnhemite, pyrocoproiteand pyrophospite).
PHASE CHANGEThe sixth and last minerogenetic mechanism consists sim-
ply of the solidification of seeping water, and obviously thisprocess needs nothing other than a sufficiently low tempera-ture for its activation. Ice speleothems inside most volcaniccaves are only seasonal, but sometimes they may last perenni-ally in areas where the annual average temperature is higherthan 0°C. The lava, behaving as a very efficient thermal insu-lator, easily transforms caves with a single entrance and a gen-eral descending slope into “cold traps” where ice may accu-mulate in the wintertime without melting during the hot sea-son. One very famous example of this is the Grotta del Gelo(Ice Cave) on Mt. Etna which has been renowned since antiq-uity because its ice deposits were exploited to supply Cataniawith ice cream even during summer months (Recupero 1815).Ironically, the Grotta del Gelo has become such a populartourist attraction that the excessive amount of visitors, withconsequent sharp alteration of the cave microclimate, may leadto the complete melting of its permanent ice formations in afew years (Centro Speleologico Etneo 1999).
It must be stressed that some of the just-outlined sixminerogenetic processes may be active simultaneously.Moreover, if the environmental conditions change (forinstance if a new eruption supplies new lava) all of them maybe reactivated.
CAVE MINERALS IN THE VOLCANIC ENVIRONMENT
Even though thousands of volcanic caves have alreadybeen explored, cave minerals have only been reported from afew tens of them. Presently, less than 20 cavities have beenfully investigated from the mineralogical point of view andmost of them just in the last few years. Specific studies on vol-canic cave minerals have been performed on all five conti-nents.
Despite the small number of studied caves, the observedminerals within the volcanic caves presently correspond toabout 35–40% of the whole known secondary chemicaldeposits in the cavern environment (Hill & Forti 1997). Evenif the great majority of these minerals consist of sulfates, mostof the chemical classes are represented as a consequence of thegreat number of different elements normally present within thelava. Only sulfides, arsenates, borates, and vanadates are stillmissing, but the absence of minerals from the last three class-es is not surprising because they are scarcely represented in the
10 • Journal of Cave and Karst Studies, April 2005
GENETIC PROCESSES OF CAVE MINERALS IN VOLCANIC ENVIRONMENTS
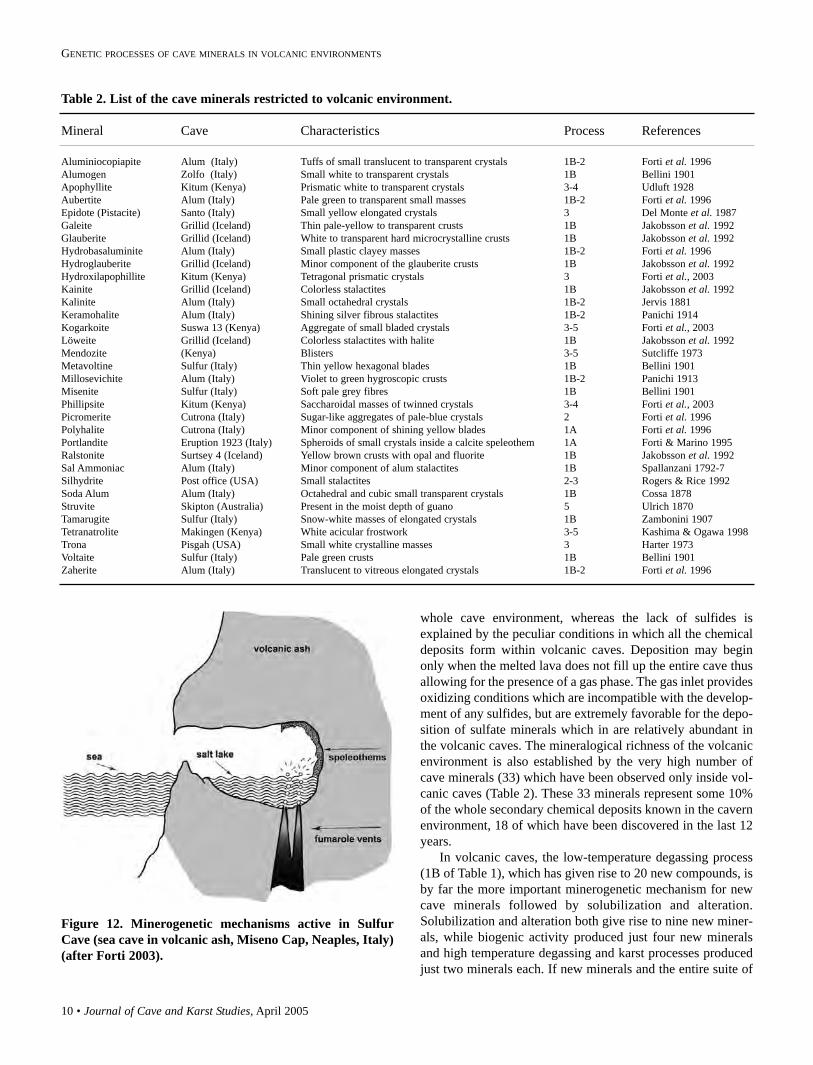
whole cave environment, whereas the lack of sulfides isexplained by the peculiar conditions in which all the chemicaldeposits form within volcanic caves. Deposition may beginonly when the melted lava does not fill up the entire cave thusallowing for the presence of a gas phase. The gas inlet providesoxidizing conditions which are incompatible with the develop-ment of any sulfides, but are extremely favorable for the depo-sition of sulfate minerals which in are relatively abundant inthe volcanic caves. The mineralogical richness of the volcanicenvironment is also established by the very high number ofcave minerals (33) which have been observed only inside vol-canic caves (Table 2). These 33 minerals represent some 10%of the whole secondary chemical deposits known in the cavernenvironment, 18 of which have been discovered in the last 12years.
In volcanic caves, the low-temperature degassing process(1B of Table 1), which has given rise to 20 new compounds, isby far the more important minerogenetic mechanism for newcave minerals followed by solubilization and alteration.Solubilization and alteration both give rise to nine new miner-als, while biogenic activity produced just four new mineralsand high temperature degassing and karst processes producedjust two minerals each. If new minerals and the entire suite of
Table 2. List of the cave minerals restricted to volcanic environment.
Mineral Cave Characteristics Process References
Aluminiocopiapite Alum (Italy) Tuffs of small translucent to transparent crystals 1B-2 Forti et al. 1996Alumogen Zolfo (Italy) Small white to transparent crystals 1B Bellini 1901Apophyllite Kitum (Kenya) Prismatic white to transparent crystals 3-4 Udluft 1928Aubertite Alum (Italy) Pale green to transparent small masses 1B-2 Forti et al. 1996Epidote (Pistacite) Santo (Italy) Small yellow elongated crystals 3 Del Monte et al. 1987Galeite Grillid (Iceland) Thin pale-yellow to transparent crusts 1B Jakobsson et al. 1992Glauberite Grillid (Iceland) White to transparent hard microcrystalline crusts 1B Jakobsson et al. 1992Hydrobasaluminite Alum (Italy) Small plastic clayey masses 1B-2 Forti et al. 1996Hydroglauberite Grillid (Iceland) Minor component of the glauberite crusts 1B Jakobsson et al. 1992Hydroxilapophillite Kitum (Kenya) Tetragonal prismatic crystals 3 Forti et al., 2003Kainite Grillid (Iceland) Colorless stalactites 1B Jakobsson et al. 1992Kalinite Alum (Italy) Small octahedral crystals 1B-2 Jervis 1881Keramohalite Alum (Italy) Shining silver fibrous stalactites 1B-2 Panichi 1914Kogarkoite Suswa 13 (Kenya) Aggregate of small bladed crystals 3-5 Forti et al., 2003Löweite Grillid (Iceland) Colorless stalactites with halite 1B Jakobsson et al. 1992Mendozite (Kenya) Blisters 3-5 Sutcliffe 1973Metavoltine Sulfur (Italy) Thin yellow hexagonal blades 1B Bellini 1901Millosevichite Alum (Italy) Violet to green hygroscopic crusts 1B-2 Panichi 1913Misenite Sulfur (Italy) Soft pale grey fibres 1B Bellini 1901Phillipsite Kitum (Kenya) Saccharoidal masses of twinned crystals 3-4 Forti et al., 2003Picromerite Cutrona (Italy) Sugar-like aggregates of pale-blue crystals 2 Forti et al. 1996Polyhalite Cutrona (Italy) Minor component of shining yellow blades 1A Forti et al. 1996Portlandite Eruption 1923 (Italy) Spheroids of small crystals inside a calcite speleothem 1A Forti & Marino 1995Ralstonite Surtsey 4 (Iceland) Yellow brown crusts with opal and fluorite 1B Jakobsson et al. 1992Sal Ammoniac Alum (Italy) Minor component of alum stalactites 1B Spallanzani 1792-7Silhydrite Post office (USA) Small stalactites 2-3 Rogers & Rice 1992Soda Alum Alum (Italy) Octahedral and cubic small transparent crystals 1B Cossa 1878Struvite Skipton (Australia) Present in the moist depth of guano 5 Ulrich 1870Tamarugite Sulfur (Italy) Snow-white masses of elongated crystals 1B Zambonini 1907Tetranatrolite Makingen (Kenya) White acicular frostwork 3-5 Kashima & Ogawa 1998Trona Pisgah (USA) Small white crystalline masses 3 Harter 1973Voltaite Sulfur (Italy) Pale green crusts 1B Bellini 1901Zaherite Alum (Italy) Translucent to vitreous elongated crystals 1B-2 Forti et al. 1996
Figure 12. Minerogenetic mechanisms active in SulfurCave (sea cave in volcanic ash, Miseno Cap, Neaples, Italy)(after Forti 2003).
Journal of Cave and Karst Studies, April 2005 • 11
FORTI
secondary chemical deposits developed within volcanic cavesare considered collectively, the role of biogenic activityincreases noticeably in importance similar to that of low-tem-perature degassing (fumarole activity) while that of the otherprocesses remain relatively unchanged. This occurs becausemost of the reactions involving organic substances occur with-in the guano itself without contact with the host rock and there-fore most of the products are the same in solutional and/or involcanic environments. Except for some of the early research,the study of the guano deposits in volcanic environments hasbecome reestablished only in the last decade and the actualknowledge of the related minerals is far from exhaustive.Therefore, it is reasonable to suppose that in the near future theimportance of the biogenic digestion in the minerogenesis ofvolcanic minerals will become better recognized.
Finally, it is interesting to note that the three volcanic caveswhich actually host most of new cave minerals (Alum, ninenew cave minerals; Grillid, five; and Sulfur, five) have thesame environmental characteristics though not the same gene-sis. Alum and Sulfur are very small caves in volcanic ash whileGrillid is a normal-size lava tube, yet all three host fumaroleexhalations in direct contact with seawater which provides alarge amount of different dissolved ions necessary for thedevelopment of the observed minerals. In Sulfur Cave thefumarole activity directly bubbles up into a small lake filled byseawater (Fig.12). In Alum Cave the contact between the hot
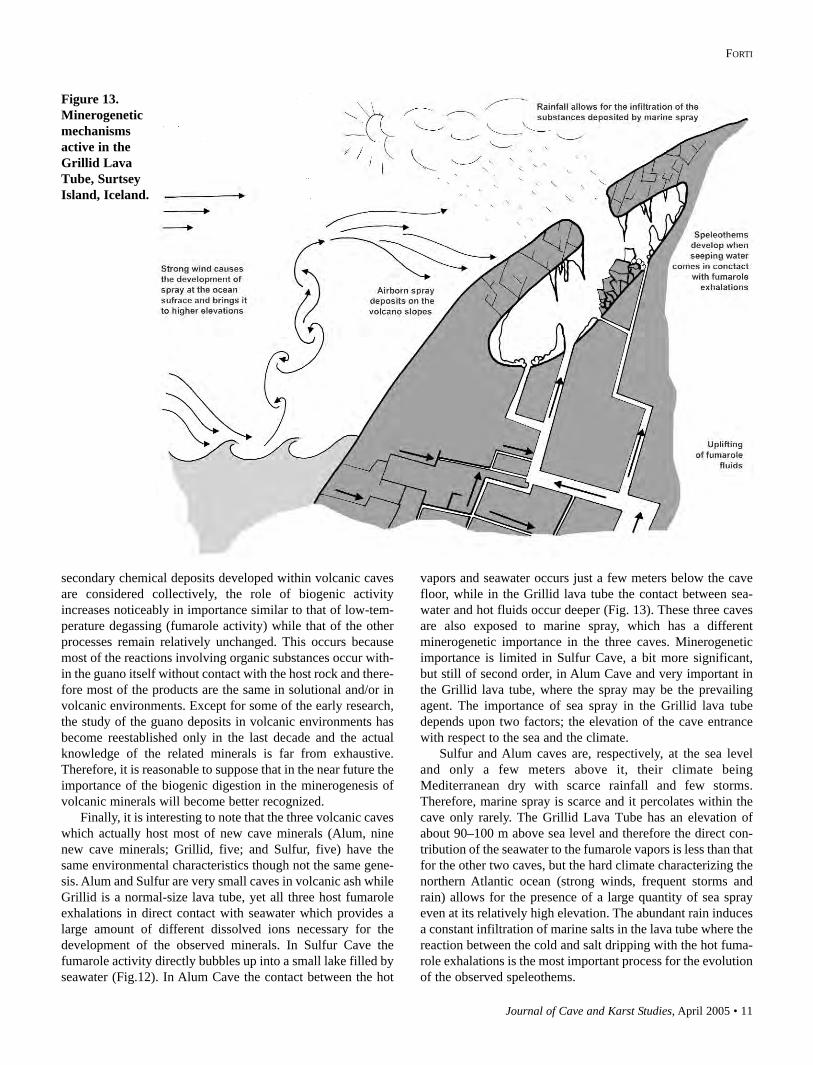
vapors and seawater occurs just a few meters below the cavefloor, while in the Grillid lava tube the contact between sea-water and hot fluids occur deeper (Fig. 13). These three cavesare also exposed to marine spray, which has a differentminerogenetic importance in the three caves. Minerogeneticimportance is limited in Sulfur Cave, a bit more significant,but still of second order, in Alum Cave and very important inthe Grillid lava tube, where the spray may be the prevailingagent. The importance of sea spray in the Grillid lava tubedepends upon two factors; the elevation of the cave entrancewith respect to the sea and the climate.
Sulfur and Alum caves are, respectively, at the sea leveland only a few meters above it, their climate beingMediterranean dry with scarce rainfall and few storms.Therefore, marine spray is scarce and it percolates within thecave only rarely. The Grillid Lava Tube has an elevation ofabout 90–100 m above sea level and therefore the direct con-tribution of the seawater to the fumarole vapors is less than thatfor the other two caves, but the hard climate characterizing thenorthern Atlantic ocean (strong winds, frequent storms andrain) allows for the presence of a large quantity of sea sprayeven at its relatively high elevation. The abundant rain inducesa constant infiltration of marine salts in the lava tube where thereaction between the cold and salt dripping with the hot fuma-role exhalations is the most important process for the evolutionof the observed speleothems.
Figure 13.Minerogeneticmechanismsactive in theGrillid LavaTube, SurtseyIsland, Iceland.
12 • Journal of Cave and Karst Studies, April 2005
GENETIC PROCESSES OF CAVE MINERALS IN VOLCANIC ENVIRONMENTS
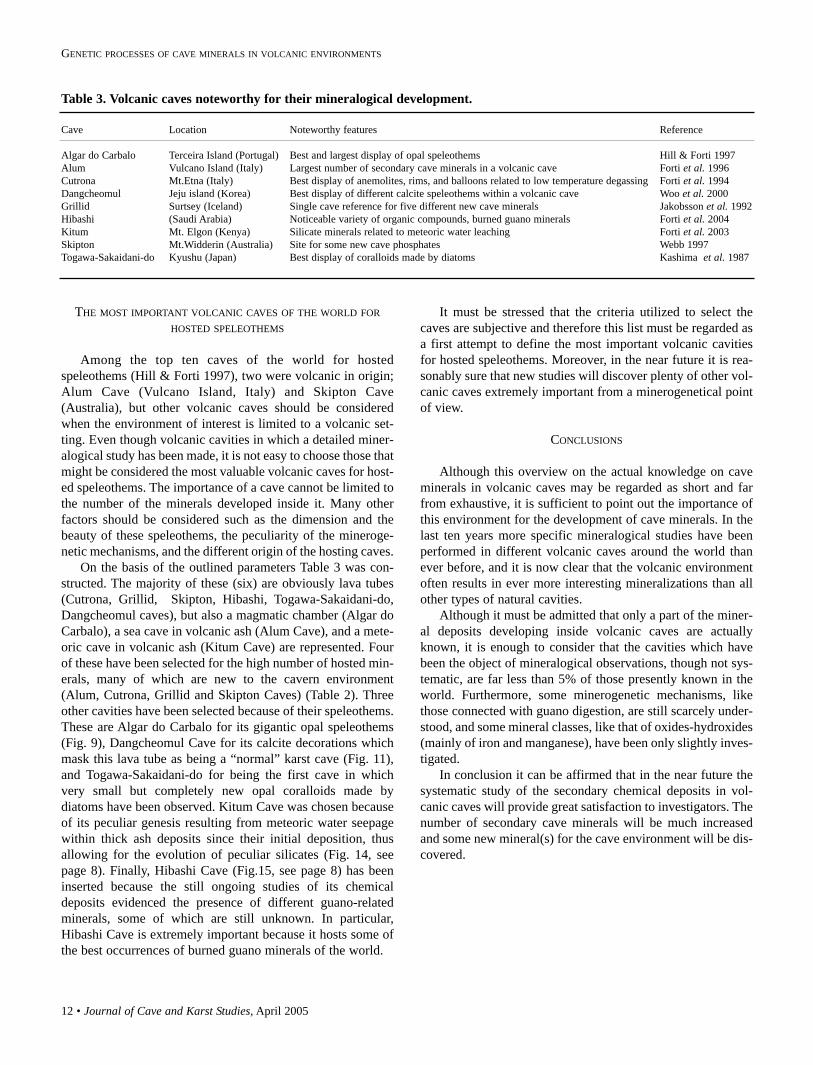
THE MOST IMPORTANT VOLCANIC CAVES OF THE WORLD FORHOSTED SPELEOTHEMS
Among the top ten caves of the world for hostedspeleothems (Hill & Forti 1997), two were volcanic in origin;Alum Cave (Vulcano Island, Italy) and Skipton Cave(Australia), but other volcanic caves should be consideredwhen the environment of interest is limited to a volcanic set-ting. Even though volcanic cavities in which a detailed miner-alogical study has been made, it is not easy to choose those thatmight be considered the most valuable volcanic caves for host-ed speleothems. The importance of a cave cannot be limited tothe number of the minerals developed inside it. Many otherfactors should be considered such as the dimension and thebeauty of these speleothems, the peculiarity of the mineroge-netic mechanisms, and the different origin of the hosting caves.
On the basis of the outlined parameters Table 3 was con-structed. The majority of these (six) are obviously lava tubes(Cutrona, Grillid, Skipton, Hibashi, Togawa-Sakaidani-do,Dangcheomul caves), but also a magmatic chamber (Algar doCarbalo), a sea cave in volcanic ash (Alum Cave), and a mete-oric cave in volcanic ash (Kitum Cave) are represented. Fourof these have been selected for the high number of hosted min-erals, many of which are new to the cavern environment(Alum, Cutrona, Grillid and Skipton Caves) (Table 2). Threeother cavities have been selected because of their speleothems.These are Algar do Carbalo for its gigantic opal speleothems(Fig. 9), Dangcheomul Cave for its calcite decorations whichmask this lava tube as being a “normal” karst cave (Fig. 11),and Togawa-Sakaidani-do for being the first cave in whichvery small but completely new opal coralloids made bydiatoms have been observed. Kitum Cave was chosen becauseof its peculiar genesis resulting from meteoric water seepagewithin thick ash deposits since their initial deposition, thusallowing for the evolution of peculiar silicates (Fig. 14, seepage 8). Finally, Hibashi Cave (Fig.15, see page 8) has beeninserted because the still ongoing studies of its chemicaldeposits evidenced the presence of different guano-relatedminerals, some of which are still unknown. In particular,Hibashi Cave is extremely important because it hosts some ofthe best occurrences of burned guano minerals of the world.
It must be stressed that the criteria utilized to select thecaves are subjective and therefore this list must be regarded asa first attempt to define the most important volcanic cavitiesfor hosted speleothems. Moreover, in the near future it is rea-sonably sure that new studies will discover plenty of other vol-canic caves extremely important from a minerogenetical pointof view.
CONCLUSIONS
Although this overview on the actual knowledge on caveminerals in volcanic caves may be regarded as short and farfrom exhaustive, it is sufficient to point out the importance ofthis environment for the development of cave minerals. In thelast ten years more specific mineralogical studies have beenperformed in different volcanic caves around the world thanever before, and it is now clear that the volcanic environmentoften results in ever more interesting mineralizations than allother types of natural cavities.
Although it must be admitted that only a part of the miner-al deposits developing inside volcanic caves are actuallyknown, it is enough to consider that the cavities which havebeen the object of mineralogical observations, though not sys-tematic, are far less than 5% of those presently known in theworld. Furthermore, some minerogenetic mechanisms, likethose connected with guano digestion, are still scarcely under-stood, and some mineral classes, like that of oxides-hydroxides(mainly of iron and manganese), have been only slightly inves-tigated.
In conclusion it can be affirmed that in the near future thesystematic study of the secondary chemical deposits in vol-canic caves will provide great satisfaction to investigators. Thenumber of secondary cave minerals will be much increasedand some new mineral(s) for the cave environment will be dis-covered.
Table 3. Volcanic caves noteworthy for their mineralogical development.
Cave Location Noteworthy features Reference
Algar do Carbalo Terceira Island (Portugal) Best and largest display of opal speleothems Hill & Forti 1997Alum Vulcano Island (Italy) Largest number of secondary cave minerals in a volcanic cave Forti et al. 1996Cutrona Mt.Etna (Italy) Best display of anemolites, rims, and balloons related to low temperature degassing Forti et al. 1994Dangcheomul Jeju island (Korea) Best display of different calcite speleothems within a volcanic cave Woo et al. 2000Grillid Surtsey (Iceland) Single cave reference for five different new cave minerals Jakobsson et al. 1992Hibashi (Saudi Arabia) Noticeable variety of organic compounds, burned guano minerals Forti et al. 2004Kitum Mt. Elgon (Kenya) Silicate minerals related to meteoric water leaching Forti et al. 2003 Skipton Mt.Widderin (Australia) Site for some new cave phosphates Webb 1997Togawa-Sakaidani-do Kyushu (Japan) Best display of coralloids made by diatoms Kashima et al. 1987
Journal of Cave and Karst Studies, April 2005 • 13
FORTI
ACKNOWLEDGEMENTS
The author thanks William Halliday, Sigurdur SveinnJónsson, John Pint and the President of theVulcanospeleological Commission of the UIS Jan PaulGustaaf Van der Pas for supplying useful information and/ormaterials. Research done within the MIUR 2002 Project“Morphological and mineralogical study of speleothems toreconstruct peculiar karst environments”
REFERENCES
Bellini, R., 1901, La Grotta dello zolfo nei Campi Flegrei: Bollettino dellaSocietà Geologica Italiana, v. 20, p. 470–475.
Borges, P.A.V., Silva, A., Pereira, F., 1991, Caves and pits from the Azoreswith some comments on their geological origin, distribution and fauna: 6th
International Symposium on Vulcanospeleology, Hawaii, p. 121–151.Centro Speleologico Etneo, 1999, Dentro il vulcano: le grotte dell’Etna: Parco
dell’Etna, 342 p.Cossa, A., 1878, Ricerche chimiche: Accademia dei Lincei, Roma, v. 3(2), p.
7.Davies, G.J., 1998, “Hades” – a remarkable cave on Oldoinyo Lengai in the
East African Rift valley: International Journal of Speleology, v. 27B(1/4),p.57–67.
Del Monte, M., Forti, P., Rabbi, E., 1987, A proposito di alcune concrezionidelle grotte di lava dell’Etna: 4th International Symposium onVulcanospeleology, Catania 1983, p.31–39.
Forti, P., 1994, Cave minerals in volcanic caves: Acta I° Incontro Internacionalde Vulcanoespeleologia das Ilhas Atlanticas, Pico, Acores, 1992, p.1–98.
Forti P., 2000, Minerogenetic mechanisms and cave minerals in the volcaniccaves of Mt. Etna (Sicily, Italy): Mitteilungen Verband DeutschenHöhlen-und-Karstforschung, v. 46(1/2), p. 37–41.
Forti P., 2001, Biogenic speleothems: an overview: International Journal ofSpeleology, v. 30A (1/4), p. 39–56.
Forti, P., 2003, Eccezionali ambienti minerogenetici: in Cicogna, F., NikeBianchi, C., Ferrari, G., Forti, P., eds., Grotte Marine: cinquant’anni diricerca in Italia: Ministero dell’Ambiente, p. 83–85.
Forti, P., Marino, A., 1995, Nota preliminare sul ritrovamento di un nuovominerale di grotta nei “Pozzi dell’Eruzione del 1923”: Atti ConvegnoSpeleleologico Regionale, Ragusa 1990, v.1, p.92–100.
Forti, P., Giudice, G., Marino, A., Rossi, A., 1994, La Grotta Cutrona (MC1)sul Monte Etna e i suoi speleotemi metastabili: Atti Congresso Regionaledi Speleologia, Catania, p.125–151.
Forti, P., Panzica La Manna, M., Rossi, A., 1996, The peculiar mineralogicalsite of the Alum cave (Vulcano, Sicily): 7th International Symposium onVulcanospeleology, Canarie 1994, p.35–44.
Forti, P., Galli, E., Rossi, A., 2003, Minerogenesis in some volcanic caves ofKenya: International Journal of Speleology, v. 32(1/4), p.1-16.
Forti, P., Galli, E., Rossi, A., Pint, J., Pint, S., 2004, The Hibashi lava tube: thebest site of Saudi Arabia for cave minerals: Acta Carsologica, accepted forpublication.
Harter, R. 1973, Secondary chemical deposits in lava tubes. Speleograph, v9(7), p. 114–116.
Hill, C.A., Forti, P., 1997, Cave minerals of the World: National SpeleologicalSociety, Huntsville, 464 p.
Jakobsson, S.B., Jónsson, S.S., Leonardsen, E., 1992, Encrustations from lavacaves in Surtsey, Iceland. A preliminary report: Surtsey Research. ProgectReport, n. 10, p.73–78.
Jervis, G., 1881, Tesori sotterranei d’Italia: Milano, v. 3, p. 197.Jónsson, S.S., 1994, Mineral encrustation in Icelandic lava caves: Acta I°
Incontro Internacional de Vulcanoespeleologia das Ilhas Atlanticas, Pico,Acores, 1992, p. 89–91.
Kashima, N., Ogawa, T. 1998, Speleo-minerals in volcanic caves of Kenya,East African Rift Zone: Journal of Speleological Society of Japan, v. 23,p.46–52.
Kashima, N., Suh, M.S., 1984, Hjeobaje cave system, a pseudo-calcareouscave in Jeju Island, South Korea: Journal of Speleological Society ofJapan, v. 9, p.23–30.
Kashima, N., Irie, T., Kinoshite, N., 1987, Diatoms, contributors of coralloidspeleothems, from Togawa-Sakaidani-do cave in Miyazaki Prefecture,Central Kyushu, Japan: International Journal of Speleology, v. 16, p.95–100.
Kashima, N., Ogawa, T., Hong, S.H., 1989, Volcanogenic speleo-minerals inCheju Island, Korea: Journal of Speleological Society of Japan, v. 14, p.32–39.
MacIvor, R.W.E., 1887, On Australia bat guano and some minerals occurringtherein: Chemical News, v. 55 (1433), p. 215–216.
Marino, A., 1994, La Buca della Martinite: Bollettino della AccademiaGioenia di Scienze Naturali v. 28 (348), p. 231–241.
Martini, J.E.J., 1994a, Two new ninerals originated from bat guano combus-tion in Arnhem Cave, Namibia: South African Speleological AssociationBulletin, v. 33, p. 66–69.
Martini, J.E.J., 1994b, The combustion of bat guano: A poorly known phe-nomenon: South African Speleological Association Bulletin, v. 33, p.70–72.
Panichi, U., 1913, Millosevichite nuovo minerale del Faraglione di Levantenell’isola di Vulcano: Rendiconti Accademia dei Lincei, p. 1–3.
Panichi, U., 1914, Contributo allo studio dei minerali dell’isola di Vulcano:Memoria della Società Italiana di Scienze, s. 3, v. 19, p. 1–55.
Recupero, G., 1815, Storia generale e naturale dell’Etna: Catania, 135 p. Rogers, B.W., Rice, P.H., 1992, Geology and mineralogy of lava tube caves of
Medicine Lake Volcano: in Re, G.T., ed., Proceedings 6th InternationalSymposium on Vulcanospeleology, Huntsville, p.45–49.
Sava, R., 1842, Sopra alcuni prodotti naturali che si formano in una speloncadell’Etna: Annali Civici del Regno Due Sicilie, v. 30 (60), p. 1–39.
Scacchi, A., 1850, Memorie mineralogiche e geologiche della Campania:Rendiconti dell’Accademia di Scienze di Napoli, v. 3, p.317–335.
Shaw, T.R., 1997, Historical introduction: in Hill, C.A., Forti, P., Cave miner-als of the World: National Speleological Society, Huntsville, p. 27–43.
Spallanzani, L., 1792–97, Viaggi alle Due Sicilie ed in alcune partidell’Appennino: S.Tommaso D’Aquino, Bologna, v. 1, p. 353–356.
Sutcliffe, A.J., 1973, Caves of East African Rift valley: Transaction of theCave Research Group of Great Britain, v. 15(1), p. 41–65.
Udluft, H., 1928, Zeolithe als Fossilizationsmaterial: Arkiv KemischenMineralogischen Geologischen, v. 9(33), p. 1–15.
Ulrich, G.H.F., 1870, Contributions to the mineralogy of Victoria: Melbourne,p. 1–33.
Webb, J.A. 1997 Skipton Lava Cave, Victoria, Australia: in Hill C.A., Forti P.,Cave Minerals of the World: National Speleological Society, Huntsville,p. 331–335.
Woo, K. S., Choi, D. W., Kim, R. and Kim, J. K., 2000, The origin of thespeleothems in Dangcheomul Cave, Jeju Island, Korea: Journal of theGeological Society of Korea, v. 36 (4), p. 411–434.
Zambonini, F., 1907, Su alcuni minerali della Grotta dello Zolfo a Misero:Rendiconti della Accademia di Scienze, s. 3, v. 13–14(12), p. 1–8.
14 • Journal of Cave and Karst Studies, April 2005
Kevin Stafford, John Mylroie, Danko Taboroši, John Jenson, and Joan Mylroie - Karst development on Tinian, Commonwealth of the Northern Mariana Islands:Controls on dissolution in relation to the carbonate island karst model. Journal of Cave and Karst Studies, v. 67, no. 1, p. 14-27.
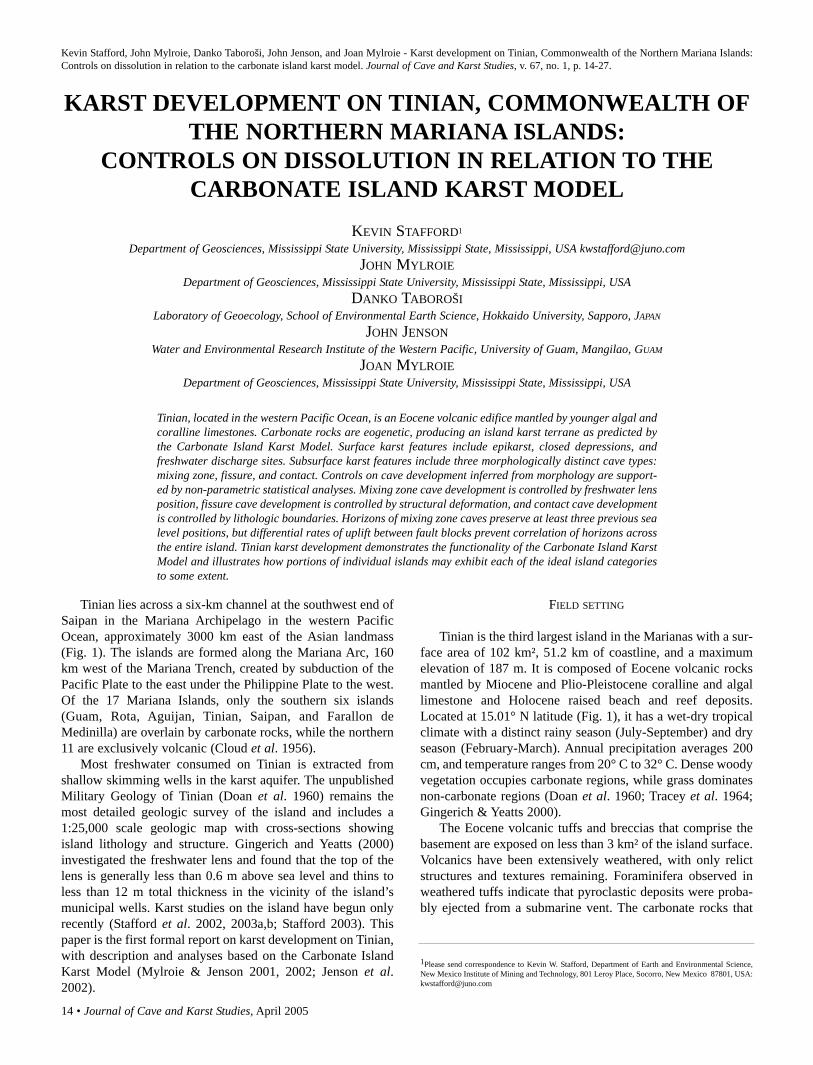
Tinian lies across a six-km channel at the southwest end ofSaipan in the Mariana Archipelago in the western PacificOcean, approximately 3000 km east of the Asian landmass(Fig. 1). The islands are formed along the Mariana Arc, 160km west of the Mariana Trench, created by subduction of thePacific Plate to the east under the Philippine Plate to the west.Of the 17 Mariana Islands, only the southern six islands(Guam, Rota, Aguijan, Tinian, Saipan, and Farallon deMedinilla) are overlain by carbonate rocks, while the northern11 are exclusively volcanic (Cloud et al. 1956).
Most freshwater consumed on Tinian is extracted fromshallow skimming wells in the karst aquifer. The unpublishedMilitary Geology of Tinian (Doan et al. 1960) remains themost detailed geologic survey of the island and includes a1:25,000 scale geologic map with cross-sections showingisland lithology and structure. Gingerich and Yeatts (2000)investigated the freshwater lens and found that the top of thelens is generally less than 0.6 m above sea level and thins toless than 12 m total thickness in the vicinity of the island’smunicipal wells. Karst studies on the island have begun onlyrecently (Stafford et al. 2002, 2003a,b; Stafford 2003). Thispaper is the first formal report on karst development on Tinian,with description and analyses based on the Carbonate IslandKarst Model (Mylroie & Jenson 2001, 2002; Jenson et al.2002).
FIELD SETTING
Tinian is the third largest island in the Marianas with a sur-face area of 102 km², 51.2 km of coastline, and a maximumelevation of 187 m. It is composed of Eocene volcanic rocksmantled by Miocene and Plio-Pleistocene coralline and algallimestone and Holocene raised beach and reef deposits.Located at 15.01° N latitude (Fig. 1), it has a wet-dry tropicalclimate with a distinct rainy season (July-September) and dryseason (February-March). Annual precipitation averages 200cm, and temperature ranges from 20° C to 32° C. Dense woodyvegetation occupies carbonate regions, while grass dominatesnon-carbonate regions (Doan et al. 1960; Tracey et al. 1964;Gingerich & Yeatts 2000).
The Eocene volcanic tuffs and breccias that comprise thebasement are exposed on less than 3 km² of the island surface.Volcanics have been extensively weathered, with only relictstructures and textures remaining. Foraminifera observed inweathered tuffs indicate that pyroclastic deposits were proba-bly ejected from a submarine vent. The carbonate rocks that
KARST DEVELOPMENT ON TINIAN, COMMONWEALTH OFTHE NORTHERN MARIANA ISLANDS:
CONTROLS ON DISSOLUTION IN RELATION TO THECARBONATE ISLAND KARST MODEL
KEVIN STAFFORD1
Department of Geosciences, Mississippi State University, Mississippi State, Mississippi, USA [email protected] MYLROIE
Department of Geosciences, Mississippi State University, Mississippi State, Mississippi, USADANKO TABOROŠI
Laboratory of Geoecology, School of Environmental Earth Science, Hokkaido University, Sapporo, JAPAN
JOHN JENSONWater and Environmental Research Institute of the Western Pacific, University of Guam, Mangilao, GUAM
JOAN MYLROIEDepartment of Geosciences, Mississippi State University, Mississippi State, Mississippi, USA
Tinian, located in the western Pacific Ocean, is an Eocene volcanic edifice mantled by younger algal andcoralline limestones. Carbonate rocks are eogenetic, producing an island karst terrane as predicted bythe Carbonate Island Karst Model. Surface karst features include epikarst, closed depressions, andfreshwater discharge sites. Subsurface karst features include three morphologically distinct cave types:mixing zone, fissure, and contact. Controls on cave development inferred from morphology are support-ed by non-parametric statistical analyses. Mixing zone cave development is controlled by freshwater lensposition, fissure cave development is controlled by structural deformation, and contact cave developmentis controlled by lithologic boundaries. Horizons of mixing zone caves preserve at least three previous sealevel positions, but differential rates of uplift between fault blocks prevent correlation of horizons acrossthe entire island. Tinian karst development demonstrates the functionality of the Carbonate Island KarstModel and illustrates how portions of individual islands may exhibit each of the ideal island categoriesto some extent.
1Please send correspondence to Kevin W. Stafford, Department of Earth and Environmental Science,New Mexico Institute of Mining and Technology, 801 Leroy Place, Socorro, New Mexico 87801, USA:[email protected]
Journal of Cave and Karst Studies, April 2005 • 15
STAFFORD, MYLROIE, TABOROŠI, JENSON AND MYLROIE
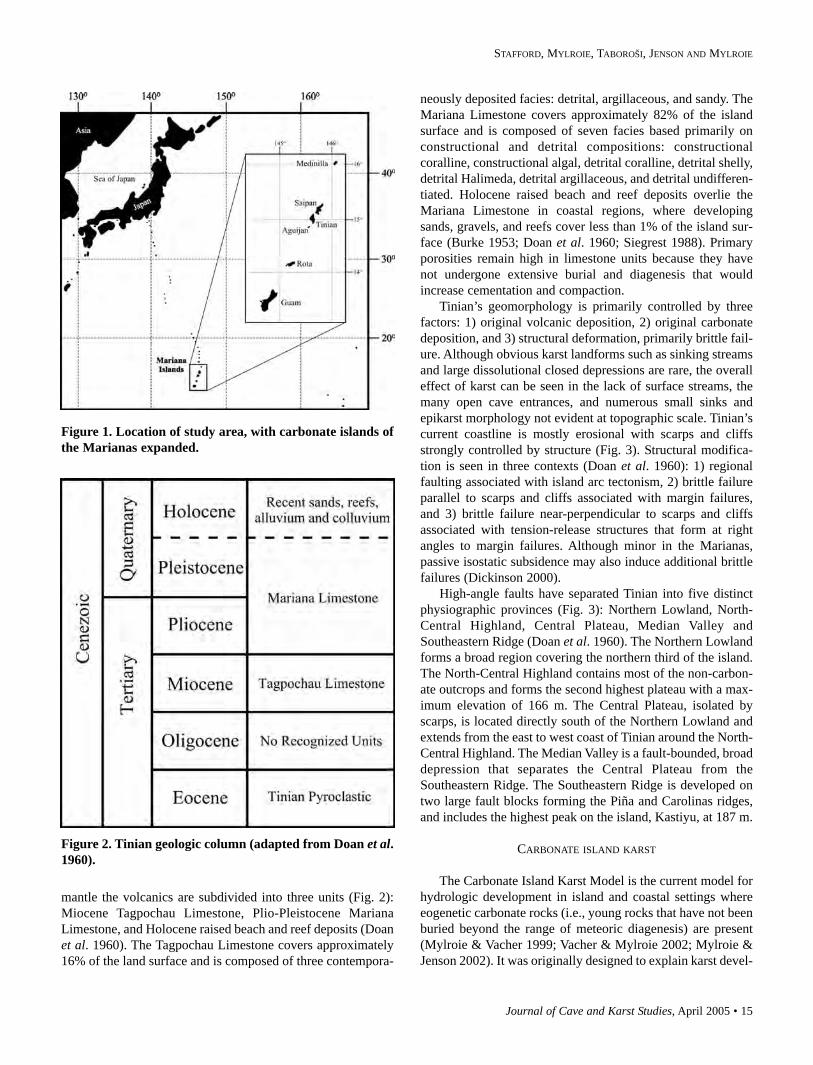
mantle the volcanics are subdivided into three units (Fig. 2):Miocene Tagpochau Limestone, Plio-Pleistocene MarianaLimestone, and Holocene raised beach and reef deposits (Doanet al. 1960). The Tagpochau Limestone covers approximately16% of the land surface and is composed of three contempora-
neously deposited facies: detrital, argillaceous, and sandy. TheMariana Limestone covers approximately 82% of the islandsurface and is composed of seven facies based primarily onconstructional and detrital compositions: constructionalcoralline, constructional algal, detrital coralline, detrital shelly,detrital Halimeda, detrital argillaceous, and detrital undifferen-tiated. Holocene raised beach and reef deposits overlie theMariana Limestone in coastal regions, where developingsands, gravels, and reefs cover less than 1% of the island sur-face (Burke 1953; Doan et al. 1960; Siegrest 1988). Primaryporosities remain high in limestone units because they havenot undergone extensive burial and diagenesis that wouldincrease cementation and compaction.
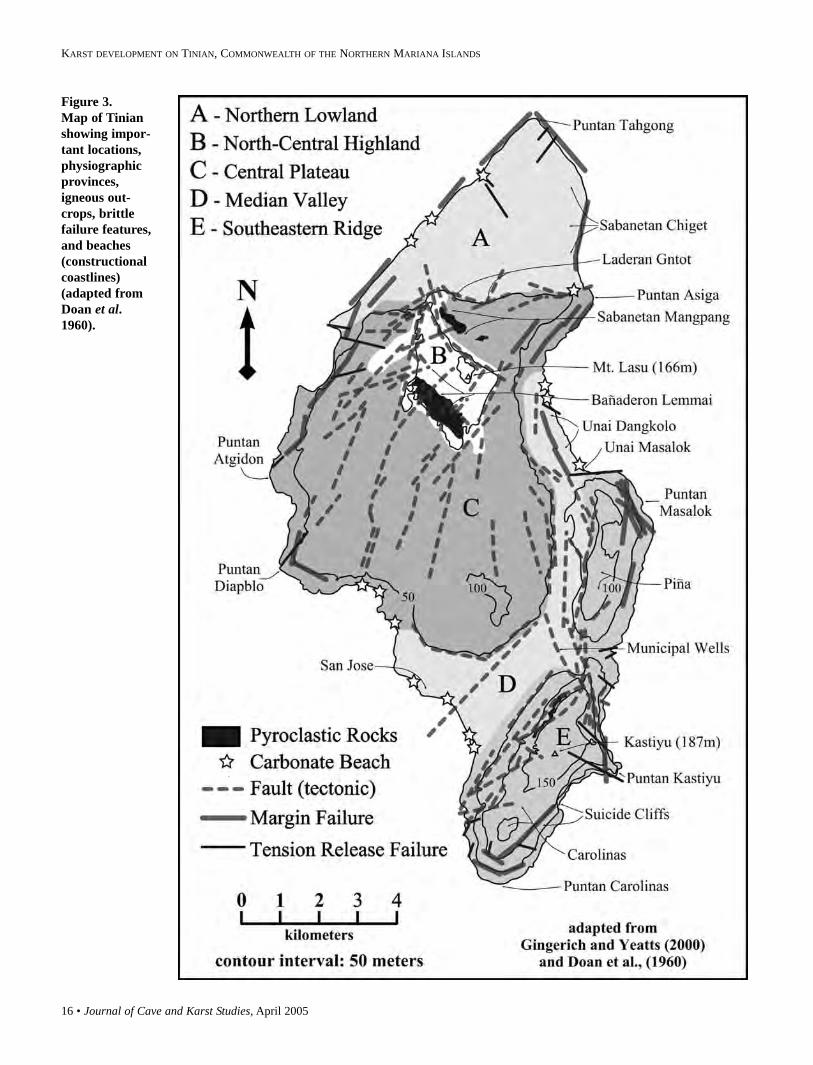
Tinian’s geomorphology is primarily controlled by threefactors: 1) original volcanic deposition, 2) original carbonatedeposition, and 3) structural deformation, primarily brittle fail-ure. Although obvious karst landforms such as sinking streamsand large dissolutional closed depressions are rare, the overalleffect of karst can be seen in the lack of surface streams, themany open cave entrances, and numerous small sinks andepikarst morphology not evident at topographic scale. Tinian’scurrent coastline is mostly erosional with scarps and cliffsstrongly controlled by structure (Fig. 3). Structural modifica-tion is seen in three contexts (Doan et al. 1960): 1) regionalfaulting associated with island arc tectonism, 2) brittle failureparallel to scarps and cliffs associated with margin failures,and 3) brittle failure near-perpendicular to scarps and cliffsassociated with tension-release structures that form at rightangles to margin failures. Although minor in the Marianas,passive isostatic subsidence may also induce additional brittlefailures (Dickinson 2000).
High-angle faults have separated Tinian into five distinctphysiographic provinces (Fig. 3): Northern Lowland, North-Central Highland, Central Plateau, Median Valley andSoutheastern Ridge (Doan et al. 1960). The Northern Lowlandforms a broad region covering the northern third of the island.The North-Central Highland contains most of the non-carbon-ate outcrops and forms the second highest plateau with a max-imum elevation of 166 m. The Central Plateau, isolated byscarps, is located directly south of the Northern Lowland andextends from the east to west coast of Tinian around the North-Central Highland. The Median Valley is a fault-bounded, broaddepression that separates the Central Plateau from theSoutheastern Ridge. The Southeastern Ridge is developed ontwo large fault blocks forming the Piña and Carolinas ridges,and includes the highest peak on the island, Kastiyu, at 187 m.
CARBONATE ISLAND KARST
The Carbonate Island Karst Model is the current model forhydrologic development in island and coastal settings whereeogenetic carbonate rocks (i.e., young rocks that have not beenburied beyond the range of meteoric diagenesis) are present(Mylroie & Vacher 1999; Vacher & Mylroie 2002; Mylroie &Jenson 2002). It was originally designed to explain karst devel-
Figure 1. Location of study area, with carbonate islands ofthe Marianas expanded.
Figure 2. Tinian geologic column (adapted from Doan et al.1960).
16 • Journal of Cave and Karst Studies, April 2005
KARST DEVELOPMENT ON TINIAN, COMMONWEALTH OF THE NORTHERN MARIANA ISLANDS
Figure 3. Map of Tinianshowing impor-tant locations,physiographicprovinces,igneous out-crops, brittlefailure features,and beaches(constructionalcoastlines)(adapted fromDoan et al.1960).
Journal of Cave and Karst Studies, April 2005 • 17
STAFFORD, MYLROIE, TABOROŠI, JENSON AND MYLROIE
opment in the Bahamas and Bermuda, and later expandedbased on observations in the Pacific. Karst on small carbonateislands and coasts composed of young limestones is uniquefrom karst in continental settings because of the extensiveinteraction between fresh and saline groundwater in young,highly porous carbonate rocks. On carbonate islands, a fresh-water lens develops as a result of the density differencebetween fresh and saline waters, as defined by the Ghyben-Herzberg-Dupuit Principle (Raeisi & Mylroie 1995; Mink &Vacher 1997).
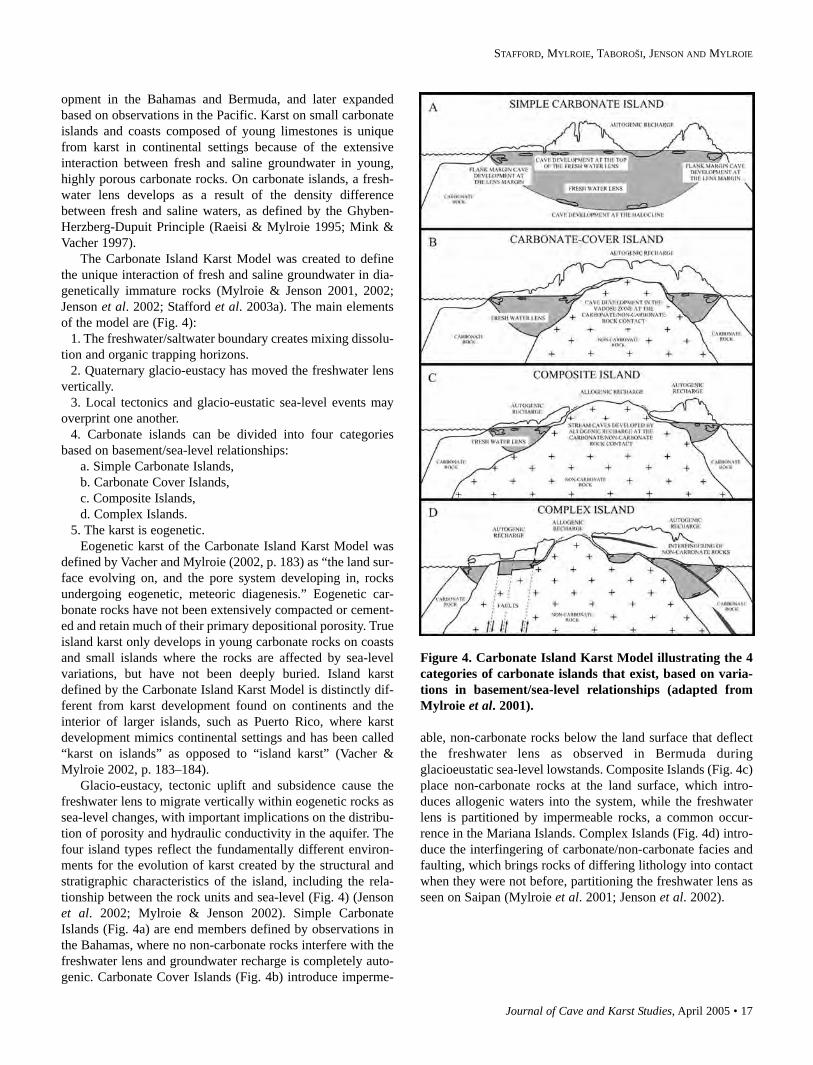
The Carbonate Island Karst Model was created to definethe unique interaction of fresh and saline groundwater in dia-genetically immature rocks (Mylroie & Jenson 2001, 2002;Jenson et al. 2002; Stafford et al. 2003a). The main elementsof the model are (Fig. 4):
1. The freshwater/saltwater boundary creates mixing dissolu-tion and organic trapping horizons.
2. Quaternary glacio-eustacy has moved the freshwater lensvertically.
3. Local tectonics and glacio-eustatic sea-level events mayoverprint one another.
4. Carbonate islands can be divided into four categoriesbased on basement/sea-level relationships:
a. Simple Carbonate Islands,b. Carbonate Cover Islands,c. Composite Islands,d. Complex Islands.
5. The karst is eogenetic.Eogenetic karst of the Carbonate Island Karst Model was
defined by Vacher and Mylroie (2002, p. 183) as “the land sur-face evolving on, and the pore system developing in, rocksundergoing eogenetic, meteoric diagenesis.” Eogenetic car-bonate rocks have not been extensively compacted or cement-ed and retain much of their primary depositional porosity. Trueisland karst only develops in young carbonate rocks on coastsand small islands where the rocks are affected by sea-levelvariations, but have not been deeply buried. Island karstdefined by the Carbonate Island Karst Model is distinctly dif-ferent from karst development found on continents and theinterior of larger islands, such as Puerto Rico, where karstdevelopment mimics continental settings and has been called“karst on islands” as opposed to “island karst” (Vacher &Mylroie 2002, p. 183–184).
Glacio-eustacy, tectonic uplift and subsidence cause thefreshwater lens to migrate vertically within eogenetic rocks assea-level changes, with important implications on the distribu-tion of porosity and hydraulic conductivity in the aquifer. Thefour island types reflect the fundamentally different environ-ments for the evolution of karst created by the structural andstratigraphic characteristics of the island, including the rela-tionship between the rock units and sea-level (Fig. 4) (Jensonet al. 2002; Mylroie & Jenson 2002). Simple CarbonateIslands (Fig. 4a) are end members defined by observations inthe Bahamas, where no non-carbonate rocks interfere with thefreshwater lens and groundwater recharge is completely auto-genic. Carbonate Cover Islands (Fig. 4b) introduce imperme-
able, non-carbonate rocks below the land surface that deflectthe freshwater lens as observed in Bermuda duringglacioeustatic sea-level lowstands. Composite Islands (Fig. 4c)place non-carbonate rocks at the land surface, which intro-duces allogenic waters into the system, while the freshwaterlens is partitioned by impermeable rocks, a common occur-rence in the Mariana Islands. Complex Islands (Fig. 4d) intro-duce the interfingering of carbonate/non-carbonate facies andfaulting, which brings rocks of differing lithology into contactwhen they were not before, partitioning the freshwater lens asseen on Saipan (Mylroie et al. 2001; Jenson et al. 2002).
Figure 4. Carbonate Island Karst Model illustrating the 4categories of carbonate islands that exist, based on varia-tions in basement/sea-level relationships (adapted fromMylroie et al. 2001).
18 • Journal of Cave and Karst Studies, April 2005
KARST DEVELOPMENT ON TINIAN, COMMONWEALTH OF THE NORTHERN MARIANA ISLANDS
KARST DEVELOPMENT ON TINIANKarst development on Tinian is reported here in terms of
surface and subsurface features. Surface features includeepikarst, closed depressions, and freshwater discharge fea-tures. Subsurface features include three general cave types:mixing zone, fissure and contact. For a thorough description ofTinian karst development, including statistical analyses anddetailed maps, the reader is directed to Stafford (2003).
SURFACE KARST FEATURES
Epikarst occurs in all carbonate rocks on Tinian and can beobserved at all elevations with morphological variations asso-ciated with coastal proximity. In areas proximal to coasts,where limestone is constantly wetted by sea-spray, karrenforms extremely jagged, centimeter to meter-scale pinnacles,variously defined as phytokarst (Folk et al. 1973), biokarst(Viles 1988), and littoral eogenetic karren (Taboroši et al.2004). The rugged coastal karren on Tinian is attributed to apolygenetic origin that includes the interaction of meteoricwater with salt spray, salt weathering, dissolution by meteoricwaters, and biological weathering. When joints and fracturesare present, coastal epikarst develops into enlarged planar fea-tures and shallow solution pans (kamenitzas). In more inlandregions, where soil is present, surface karren features becomemore subdued, suggesting that salt weathering and the interac-tion of salt spray and meteoric water is largely responsible forthe unique karren forms in coastal settings, although some ofthe variation likely results from soil processes. Inland karrengenerally expresses little relief but in highly fractured regions,closely-spaced, meter-scale canyons produce a highly irregularsurface (Taboroši et al. 2004).
Closed depressions on Tinian are localized and representthree genetic types: dissolutional, constructional, and humanmade and modified (Mylroie et al. 2001). Interpretation ofclosed depressions can be problematic, because specific fea-tures may be polygenetic, having been one type of depressionthat was subsequently modified by dissolution, tectonics, orhuman activity (Mylroie et al. 1999). Twenty closed depres-sions greater than ten meters in diameter were identified onTinian: seven dissolutional, eight constructional, and fiveanthropogenic.
Dissolutional depressions are associated withcarbonate/non-carbonate contacts where allogenic waters fromephemeral streams in small valleys have increased dissolutionalong the contact between carbonate bedrock and non-carbon-ate basement. Two such depressions exhibited small caves atthe recharge sites, while another two contained ponded water.Constructional depressions were present in regions more distalto volcanic terranes and showed no evidence of associatedallogenic recharge. They appear to be either primary depres-sions formed during original carbonate deposition, or sec-ondary structural basins from faulting. In the NorthernLowland, a large closed depression that contains a freshwaterpond approximately two meters above sea-level appears to be
a primary depositional feature. On the other hand, a largeclosed depression in the Median Valley, where the TinianMunicipal Well is located, is bounded by faults, which sug-gests a tectonic origin. Anthropogenic depressions are theresult of the excavation of quarries, borrow pits and landfills.Only one active quarry remains on Tinian, while several aban-doned quarries may be relicts from construction projects asso-ciated with World War II.
Coastal discharge features identified on Tinian at low tideinclude seeps and springs. Seeps are diffuse discharge featuresthat emerge through carbonate sands along beaches, whereassprings are focused discharge features that occur along bed-ding planes and fractures on scarped coastlines (Jenson et al.1997; Mylroie et al. 1999, 2001). Although coastal conditionsprevented a complete examination of the entire coastline, seepswere observed at three beaches on Tinian, and fourteensprings, commonly associated with fissure caves, were locatedalong coastal scarps. Additional springs and seeps are expect-ed to exist in coastal regions that were not accessible becauseof high wave energies.
SUBSURFACE KARST FEATURES
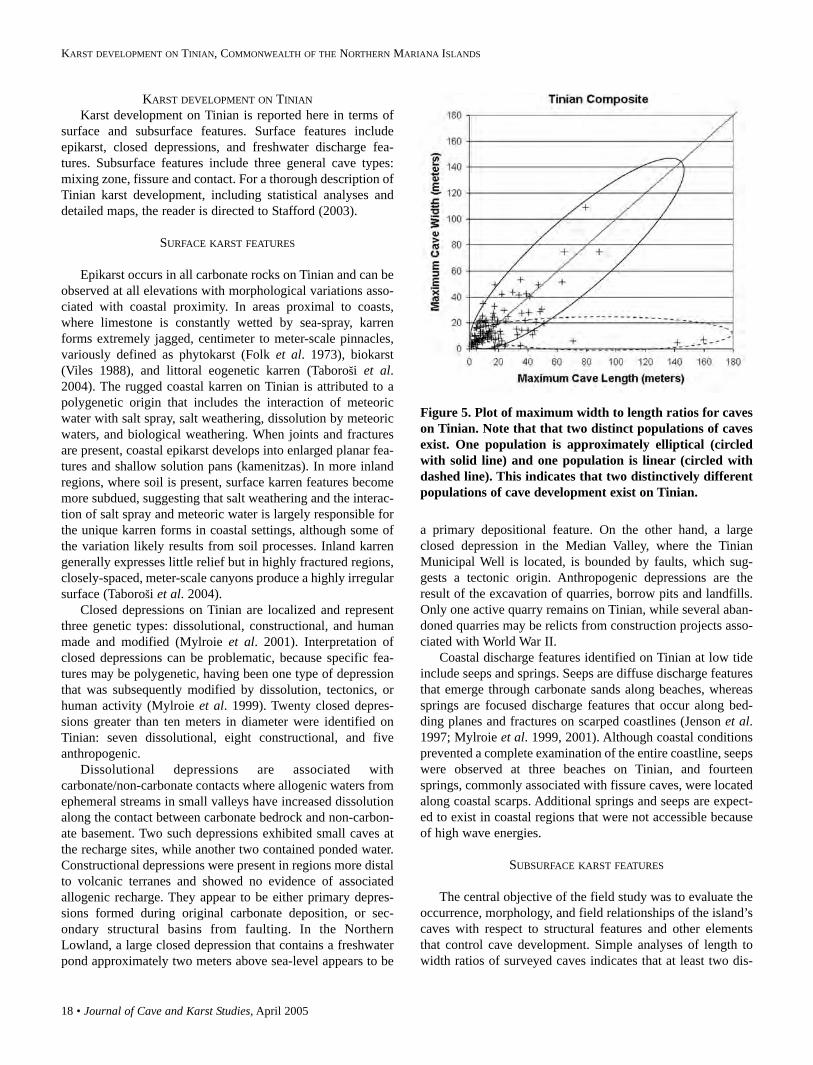
The central objective of the field study was to evaluate theoccurrence, morphology, and field relationships of the island’scaves with respect to structural features and other elementsthat control cave development. Simple analyses of length towidth ratios of surveyed caves indicates that at least two dis-
Figure 5. Plot of maximum width to length ratios for caveson Tinian. Note that that two distinct populations of cavesexist. One population is approximately elliptical (circledwith solid line) and one population is linear (circled withdashed line). This indicates that two distinctively differentpopulations of cave development exist on Tinian.
Journal of Cave and Karst Studies, April 2005 • 19
STAFFORD, MYLROIE, TABOROŠI, JENSON AND MYLROIE
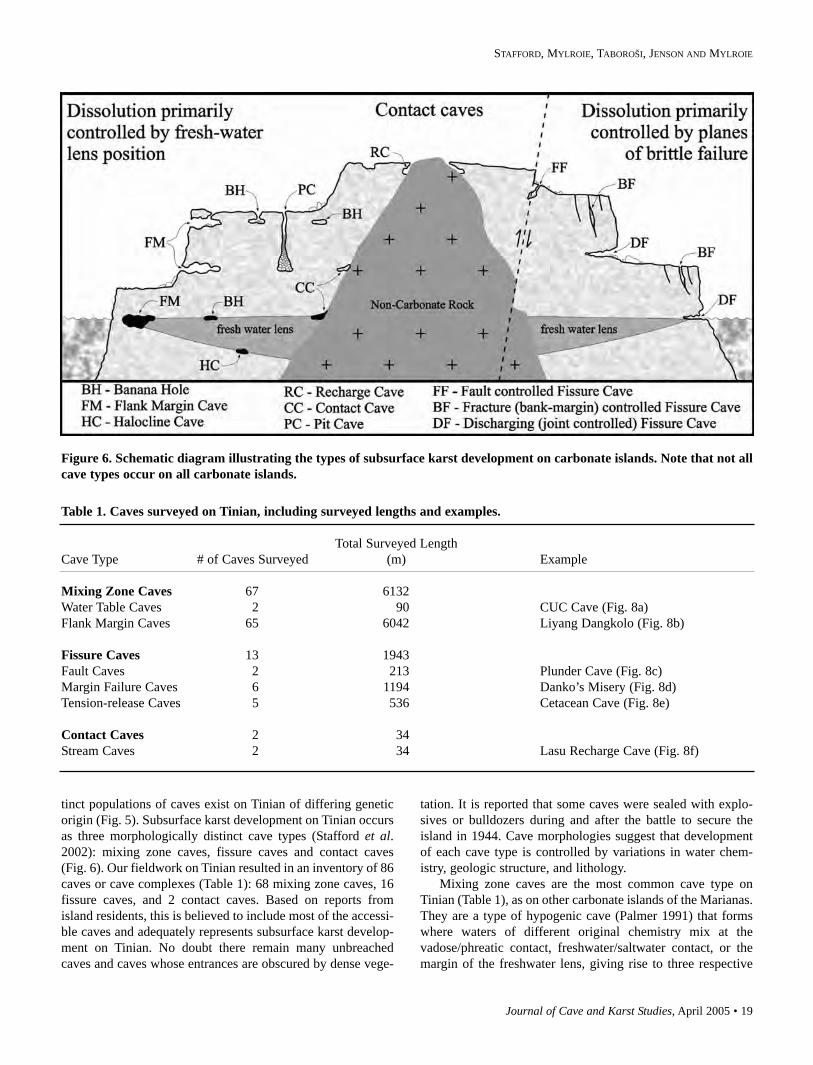
tinct populations of caves exist on Tinian of differing geneticorigin (Fig. 5). Subsurface karst development on Tinian occursas three morphologically distinct cave types (Stafford et al.2002): mixing zone caves, fissure caves and contact caves(Fig. 6). Our fieldwork on Tinian resulted in an inventory of 86caves or cave complexes (Table 1): 68 mixing zone caves, 16fissure caves, and 2 contact caves. Based on reports fromisland residents, this is believed to include most of the accessi-ble caves and adequately represents subsurface karst develop-ment on Tinian. No doubt there remain many unbreachedcaves and caves whose entrances are obscured by dense vege-
tation. It is reported that some caves were sealed with explo-sives or bulldozers during and after the battle to secure theisland in 1944. Cave morphologies suggest that developmentof each cave type is controlled by variations in water chem-istry, geologic structure, and lithology.
Mixing zone caves are the most common cave type onTinian (Table 1), as on other carbonate islands of the Marianas.They are a type of hypogenic cave (Palmer 1991) that formswhere waters of different original chemistry mix at thevadose/phreatic contact, freshwater/saltwater contact, or themargin of the freshwater lens, giving rise to three respective
Figure 6. Schematic diagram illustrating the types of subsurface karst development on carbonate islands. Note that not allcave types occur on all carbonate islands.
Table 1. Caves surveyed on Tinian, including surveyed lengths and examples.
Total Surveyed LengthCave Type # of Caves Surveyed (m) Example
Mixing Zone Caves 67 6132Water Table Caves 2 90 CUC Cave (Fig. 8a)Flank Margin Caves 65 6042 Liyang Dangkolo (Fig. 8b)
Fissure Caves 13 1943Fault Caves 2 213 Plunder Cave (Fig. 8c)Margin Failure Caves 6 1194 Danko’s Misery (Fig. 8d)Tension-release Caves 5 536 Cetacean Cave (Fig. 8e)
Contact Caves 2 34Stream Caves 2 34 Lasu Recharge Cave (Fig. 8f)
20 • Journal of Cave and Karst Studies, April 2005
KARST DEVELOPMENT ON TINIAN, COMMONWEALTH OF THE NORTHERN MARIANA ISLANDS
subcategories: water table caves, halocline caves, and flankmargin caves (Mylroie & Carew 1988; Mylroie et al. 1995a,b).Mixing zone caves form interconnected, globular chambers(Fig. 7). They are hydrologically interconnected and providereliable indicators of former relative sea level because of theirassociation with the freshwater lens position (Carew &Mylroie 1995; Mylroie et al. 1995a,b).
Small lenticular to oblate chambers, termed water table andhalocline caves, have been reported to develop at the top andbottom of the lens (Mylroie & Carew 1995). Halocline cavesform at the bottom of the lens where speleogenesis is enhancedby the decay of organics trapped at the water-density boundaryand by the mixing of fresh and saline groundwater. Water tablecaves, commonly referred to as banana holes when breached atthe land surface (Harris et al. 1995), are the result of increaseddissolution induced by the mixing of vadose and phreaticwaters, and the decay of organics trapped at the surface of thefreshwater lens (Mylroie & Carew 1988). Small, lenticular fea-tures on Tinian (Fig. 8a) are interpreted as water table caves,because caves formed at the top of the modern or paleo-fresh-water lens are more likely to be expressed by collapse at theland surface. However, if surface denudation completelyremoves the shallowest water table caves, then it is difficult todetermine whether the caves formed at the top or bottom of thelens because multiple horizons of halocline and water tablecaves result from sea level change. Water table caves are rareon Tinian, but common on some carbonate islands. In theBahamas, where the majority of the land surface is less than 10m above sea level, only minor surface denudation is requiredto breach a water table cave (Harris et al. 1995); however, car-bonate rocks crop out at 187 m on the Southeastern Ridge ofTinian, which could require significant denudation to breachcaves formed at the top of the modern and other paleo-fresh-water lens positions.
Flank margin caves are the most common and largest caveson Tinian (Table 1). They are reported to form at the distalmargin of the freshwater lens where the mixing of fresh andsaline waters and organic trapping horizons are in close prox-imity as the freshwater lens thins (Mylroie & Carew 1995).Flank margin caves tend to be globular with large, intercon-nected chambers. Small flank margin caves on Tinian consistof a single main chamber with several small alcoves radiatingoutward. Larger caves have more complicated morphologiesand more extensive interconnected passages (Fig. 8b). Thesecaves are commonly found along cliffs and scarps at consistenthorizons (Fig. 9), because their position at the margin of thefreshwater lens makes them highly susceptible to breachingfrom cliff retreat and erosion (Mylroie et al. 1999).
Fissure caves are the second most common cave type onTinian (Table 1). They are linear features that appear to devel-op along faults, fractures, and joints (Stafford et al. 2003b).The planar surfaces created by brittle deformation providepaths for increased flow of groundwater, which results in pref-erential dissolution of vadose fast-flow routes that can locallydistort the freshwater lens morphology (Aby 1994; Mylroie etal. 1995c). On Tinian, we have identified three distinctly dif-ferent fissure caves, each associated with a different type ofbrittle deformation: faults, margin failures, and tension-releasefractures.
Fissure caves associated with faults form linear featuresthat descend at moderate slopes and show horizontal widening,
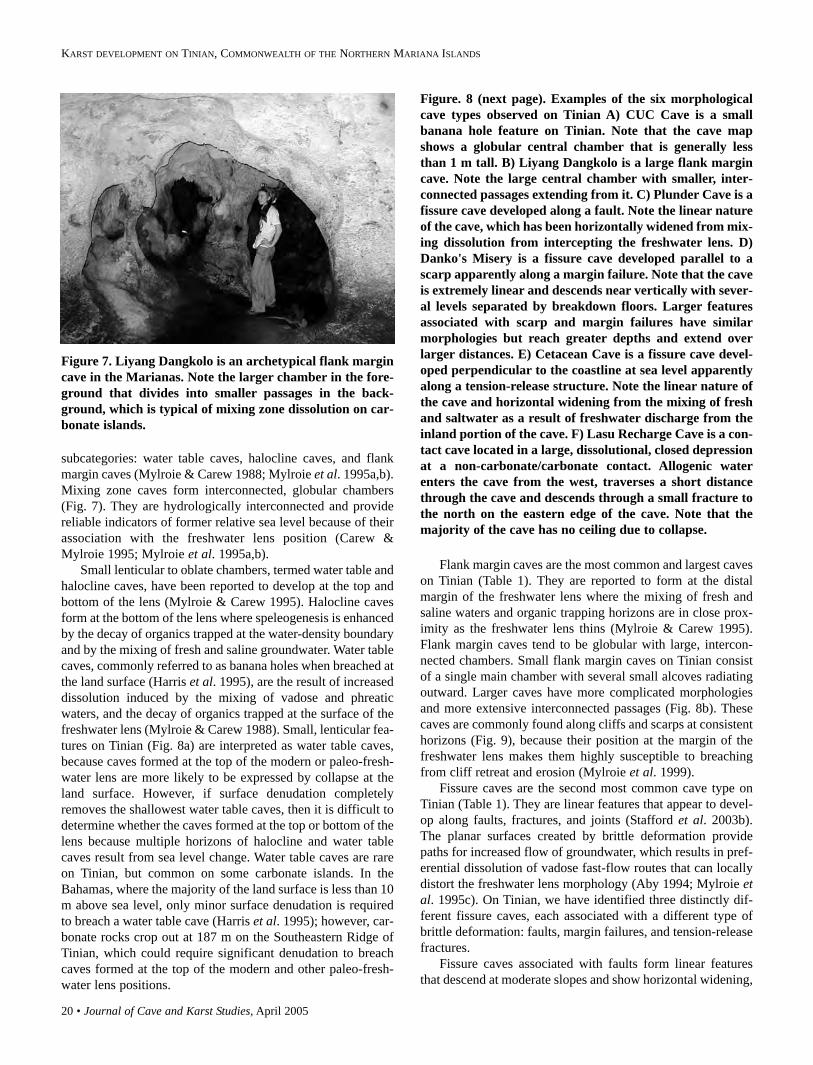
Figure 7. Liyang Dangkolo is an archetypical flank margincave in the Marianas. Note the larger chamber in the fore-ground that divides into smaller passages in the back-ground, which is typical of mixing zone dissolution on car-bonate islands.
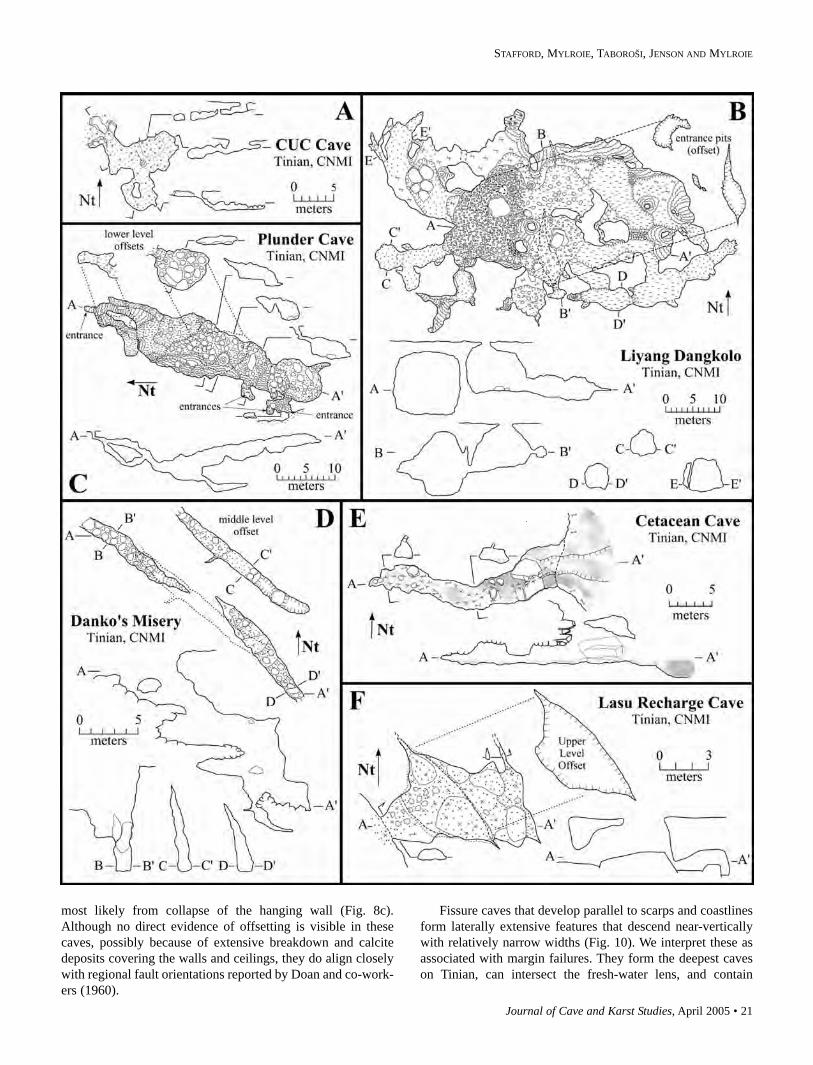
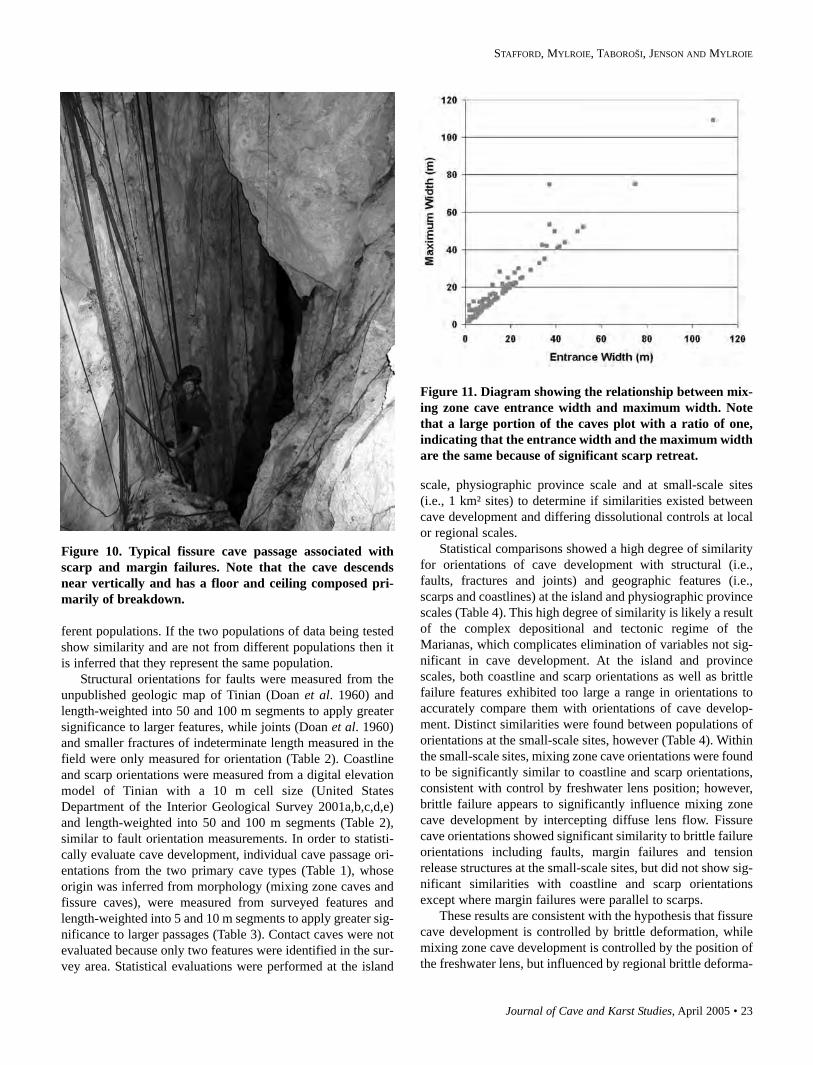
Figure. 8 (next page). Examples of the six morphologicalcave types observed on Tinian A) CUC Cave is a smallbanana hole feature on Tinian. Note that the cave mapshows a globular central chamber that is generally lessthan 1 m tall. B) Liyang Dangkolo is a large flank margincave. Note the large central chamber with smaller, inter-connected passages extending from it. C) Plunder Cave is afissure cave developed along a fault. Note the linear natureof the cave, which has been horizontally widened from mix-ing dissolution from intercepting the freshwater lens. D)Danko's Misery is a fissure cave developed parallel to ascarp apparently along a margin failure. Note that the caveis extremely linear and descends near vertically with sever-al levels separated by breakdown floors. Larger featuresassociated with scarp and margin failures have similarmorphologies but reach greater depths and extend overlarger distances. E) Cetacean Cave is a fissure cave devel-oped perpendicular to the coastline at sea level apparentlyalong a tension-release structure. Note the linear nature ofthe cave and horizontal widening from the mixing of freshand saltwater as a result of freshwater discharge from theinland portion of the cave. F) Lasu Recharge Cave is a con-tact cave located in a large, dissolutional, closed depressionat a non-carbonate/carbonate contact. Allogenic waterenters the cave from the west, traverses a short distancethrough the cave and descends through a small fracture tothe north on the eastern edge of the cave. Note that themajority of the cave has no ceiling due to collapse.
Journal of Cave and Karst Studies, April 2005 • 21
STAFFORD, MYLROIE, TABOROŠI, JENSON AND MYLROIE
most likely from collapse of the hanging wall (Fig. 8c).Although no direct evidence of offsetting is visible in thesecaves, possibly because of extensive breakdown and calcitedeposits covering the walls and ceilings, they do align closelywith regional fault orientations reported by Doan and co-work-ers (1960).
Fissure caves that develop parallel to scarps and coastlinesform laterally extensive features that descend near-verticallywith relatively narrow widths (Fig. 10). We interpret these asassociated with margin failures. They form the deepest caveson Tinian, can intersect the fresh-water lens, and contain
22 • Journal of Cave and Karst Studies, April 2005
KARST DEVELOPMENT ON TINIAN, COMMONWEALTH OF THE NORTHERN MARIANA ISLANDS
extensive breakdown, which forms the majority of the floorand ceiling when present (Fig. 8d). Large portions of the cavesare often unroofed but show evidence of being closed for sig-nificant periods in the past, based on the presence of calcitespeleothem deposits on the walls.
Fissure caves oriented perpendicular and sub-perpendicu-lar to scarps and coastlines (hence near-perpendicular to mar-gin failures) are interpreted to be associated with tension-release structures. These features can extend inland for over 30m with distinct joints or fractures located along the central axisof the ceilings and floors (Fig. 8e). When found at sea-level,they commonly discharge freshwater from their inland por-tions and show evidence of horizontal widening from the mix-ing of fresh and saline water. When found inland along scarps,they frequently show morphological evidence of past freshwa-ter discharge and are interpreted as paleo-discharge features.
Contact caves, often referred to as stream caves, form at thecarbonate/non-carbonate contact where allogenic waterdescending off surface igneous outcrops is funnelled into thesubsurface. These features are generally associated with disso-lutional closed depressions and are fed by perennial streams(Mylroie et al. 2001). Only two small contact caves were iden-tified (Table 1). Mount Lasu Recharge Cave (Fig. 8f) showsevidence of rapid recharge with significant detritus accumula-tion in the vicinity of the cave, but little sediment coating thecave walls. Allogenic water enters the cave and after a shortdistance descends through a fracture less than ten centimeterswide. Although these features are rare on Tinian because oflimited volcanic exposures, they have a significant role in sub-surface recharge of allogenic waters.
STATISTICAL ANALYSES OF CAVE DEVELOPMENT
Previous studies of island karst suggest that mixing disso-lution is the primary origin for cave development in eogeneticrocks on carbonate islands. In continental settings, variationsin geologic structure and lithology provide primary controlsfor dissolution in diagenetically mature rocks (White 1988;Palmer 1991). Barlow and Ogden (1982) and Nelson (1988)showed that in continental settings cave development is signif-icantly similar to regional brittle failure features whenKolmogorov-Smirnov statistical comparisons of cave passageorientations and regional geologic structure were evaluated. Asimilar study was conducted on Tinian (Stafford 2003) toinvestigate the possible relationships between cave develop-ment, geologic structure, and freshwater lens position.
Non-parametric, statistical comparisons for populations oforientation data from mixing zone caves and fissure caveswere evaluated with respect to orientations for structural,coastline and scarp orientations (Stafford 2003). Populationsof orientation data were evaluated using Kolmogorov-Smirnovstatistical analyses because they are not normally distributedand because non-parametric analysis enable the comparison oftwo populations of data that contain large differences in thenumber of data samples within individual populations. Biasescan be introduced into statistical comparisons based on the ori-gin of data; therefore, orientation data was length-weightedinto two length classes when available in order to reduce theamount of error introduced by using only one sample set foreach population of data. Statistical comparisons were onlyconsidered to be similar if they showed a high degree of simi-larity amongst all length classes evaluated (p < 0.01) (i.e., 99%confidence). The use of non-parametric statistical analysesdoes not prove that the two populations of data are the same,but instead can only be used to show that they are not from dif-
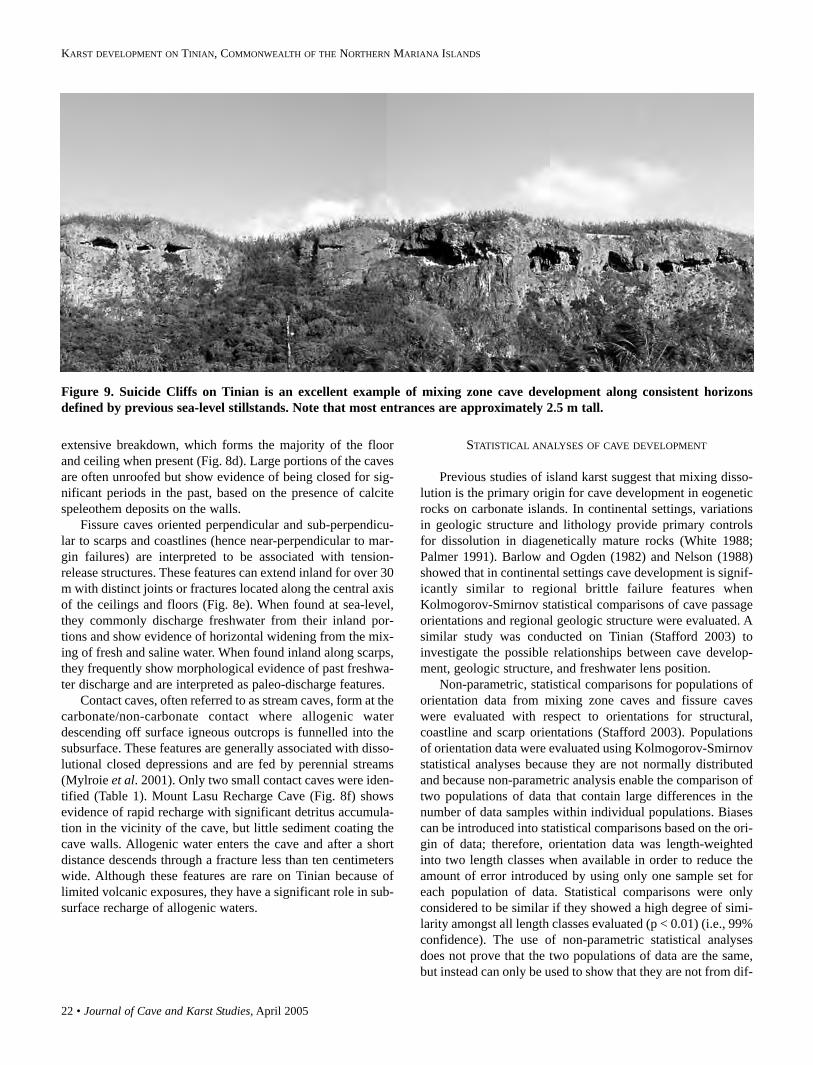
Figure 9. Suicide Cliffs on Tinian is an excellent example of mixing zone cave development along consistent horizonsdefined by previous sea-level stillstands. Note that most entrances are approximately 2.5 m tall.
Journal of Cave and Karst Studies, April 2005 • 23
STAFFORD, MYLROIE, TABOROŠI, JENSON AND MYLROIE
ferent populations. If the two populations of data being testedshow similarity and are not from different populations then itis inferred that they represent the same population.
Structural orientations for faults were measured from theunpublished geologic map of Tinian (Doan et al. 1960) andlength-weighted into 50 and 100 m segments to apply greatersignificance to larger features, while joints (Doan et al. 1960)and smaller fractures of indeterminate length measured in thefield were only measured for orientation (Table 2). Coastlineand scarp orientations were measured from a digital elevationmodel of Tinian with a 10 m cell size (United StatesDepartment of the Interior Geological Survey 2001a,b,c,d,e)and length-weighted into 50 and 100 m segments (Table 2),similar to fault orientation measurements. In order to statisti-cally evaluate cave development, individual cave passage ori-entations from the two primary cave types (Table 1), whoseorigin was inferred from morphology (mixing zone caves andfissure caves), were measured from surveyed features andlength-weighted into 5 and 10 m segments to apply greater sig-nificance to larger passages (Table 3). Contact caves were notevaluated because only two features were identified in the sur-vey area. Statistical evaluations were performed at the island
scale, physiographic province scale and at small-scale sites(i.e., 1 km² sites) to determine if similarities existed betweencave development and differing dissolutional controls at localor regional scales.
Statistical comparisons showed a high degree of similarityfor orientations of cave development with structural (i.e.,faults, fractures and joints) and geographic features (i.e.,scarps and coastlines) at the island and physiographic provincescales (Table 4). This high degree of similarity is likely a resultof the complex depositional and tectonic regime of theMarianas, which complicates elimination of variables not sig-nificant in cave development. At the island and provincescales, both coastline and scarp orientations as well as brittlefailure features exhibited too large a range in orientations toaccurately compare them with orientations of cave develop-ment. Distinct similarities were found between populations oforientations at the small-scale sites, however (Table 4). Withinthe small-scale sites, mixing zone cave orientations were foundto be significantly similar to coastline and scarp orientations,consistent with control by freshwater lens position; however,brittle failure appears to significantly influence mixing zonecave development by intercepting diffuse lens flow. Fissurecave orientations showed significant similarity to brittle failureorientations including faults, margin failures and tensionrelease structures at the small-scale sites, but did not show sig-nificant similarities with coastline and scarp orientationsexcept where margin failures were parallel to scarps.
These results are consistent with the hypothesis that fissurecave development is controlled by brittle deformation, whilemixing zone cave development is controlled by the position ofthe freshwater lens, but influenced by regional brittle deforma-
Figure 10. Typical fissure cave passage associated withscarp and margin failures. Note that the cave descendsnear vertically and has a floor and ceiling composed pri-marily of breakdown.
Figure 11. Diagram showing the relationship between mix-ing zone cave entrance width and maximum width. Notethat a large portion of the caves plot with a ratio of one,indicating that the entrance width and the maximum widthare the same because of significant scarp retreat.
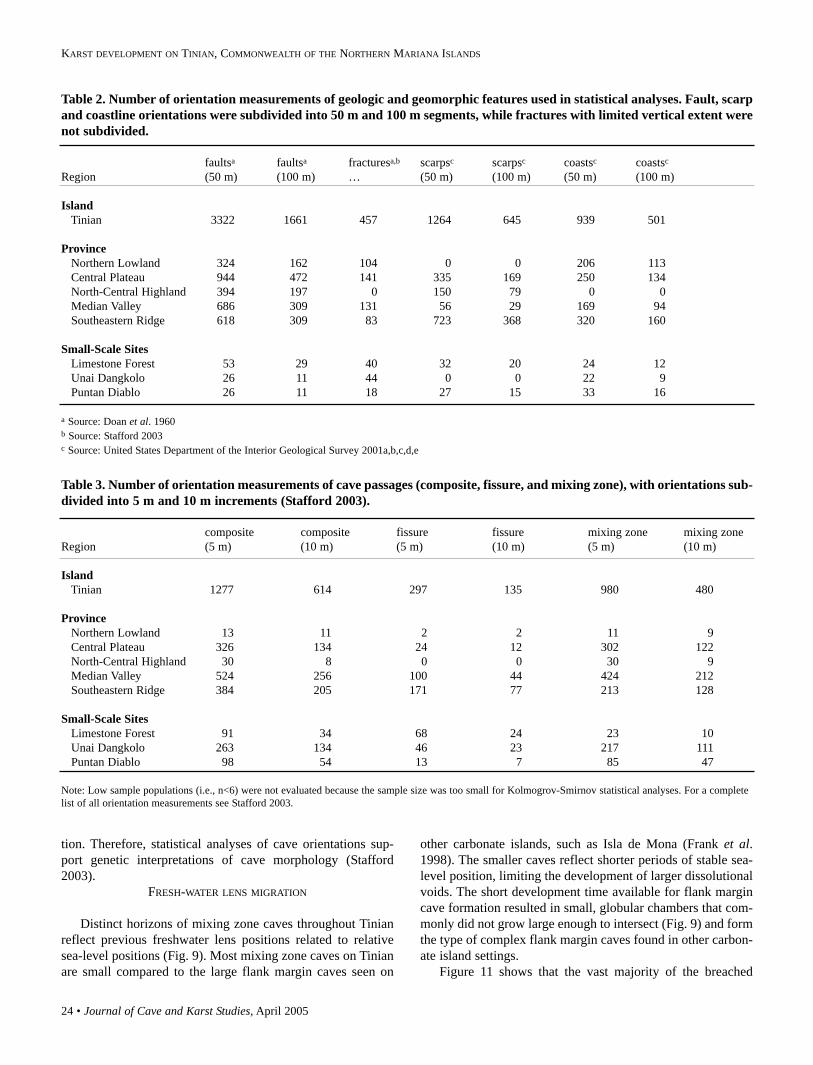
24 • Journal of Cave and Karst Studies, April 2005
KARST DEVELOPMENT ON TINIAN, COMMONWEALTH OF THE NORTHERN MARIANA ISLANDS
tion. Therefore, statistical analyses of cave orientations sup-port genetic interpretations of cave morphology (Stafford2003).
FRESH-WATER LENS MIGRATION
Distinct horizons of mixing zone caves throughout Tinianreflect previous freshwater lens positions related to relativesea-level positions (Fig. 9). Most mixing zone caves on Tinianare small compared to the large flank margin caves seen on
other carbonate islands, such as Isla de Mona (Frank et al.1998). The smaller caves reflect shorter periods of stable sea-level position, limiting the development of larger dissolutionalvoids. The short development time available for flank margincave formation resulted in small, globular chambers that com-monly did not grow large enough to intersect (Fig. 9) and formthe type of complex flank margin caves found in other carbon-ate island settings.
Figure 11 shows that the vast majority of the breached
Table 2. Number of orientation measurements of geologic and geomorphic features used in statistical analyses. Fault, scarpand coastline orientations were subdivided into 50 m and 100 m segments, while fractures with limited vertical extent werenot subdivided.
faultsa faultsa fracturesa,b scarpsc scarpsc coastsc coastsc
Region (50 m) (100 m) … (50 m) (100 m) (50 m) (100 m)
IslandTinian 3322 1661 457 1264 645 939 501
ProvinceNorthern Lowland 324 162 104 0 0 206 113Central Plateau 944 472 141 335 169 250 134North-Central Highland 394 197 0 150 79 0 0Median Valley 686 309 131 56 29 169 94Southeastern Ridge 618 309 83 723 368 320 160
Small-Scale SitesLimestone Forest 53 29 40 32 20 24 12Unai Dangkolo 26 11 44 0 0 22 9Puntan Diablo 26 11 18 27 15 33 16
a Source: Doan et al. 1960b Source: Stafford 2003c Source: United States Department of the Interior Geological Survey 2001a,b,c,d,e
Table 3. Number of orientation measurements of cave passages (composite, fissure, and mixing zone), with orientations sub-divided into 5 m and 10 m increments (Stafford 2003).
composite composite fissure fissure mixing zone mixing zoneRegion (5 m) (10 m) (5 m) (10 m) (5 m) (10 m)
IslandTinian 1277 614 297 135 980 480
ProvinceNorthern Lowland 13 11 2 2 11 9Central Plateau 326 134 24 12 302 122North-Central Highland 30 8 0 0 30 9Median Valley 524 256 100 44 424 212Southeastern Ridge 384 205 171 77 213 128
Small-Scale SitesLimestone Forest 91 34 68 24 23 10Unai Dangkolo 263 134 46 23 217 111Puntan Diablo 98 54 13 7 85 47
Note: Low sample populations (i.e., n<6) were not evaluated because the sample size was too small for Kolmogrov-Smirnov statistical analyses. For a completelist of all orientation measurements see Stafford 2003.
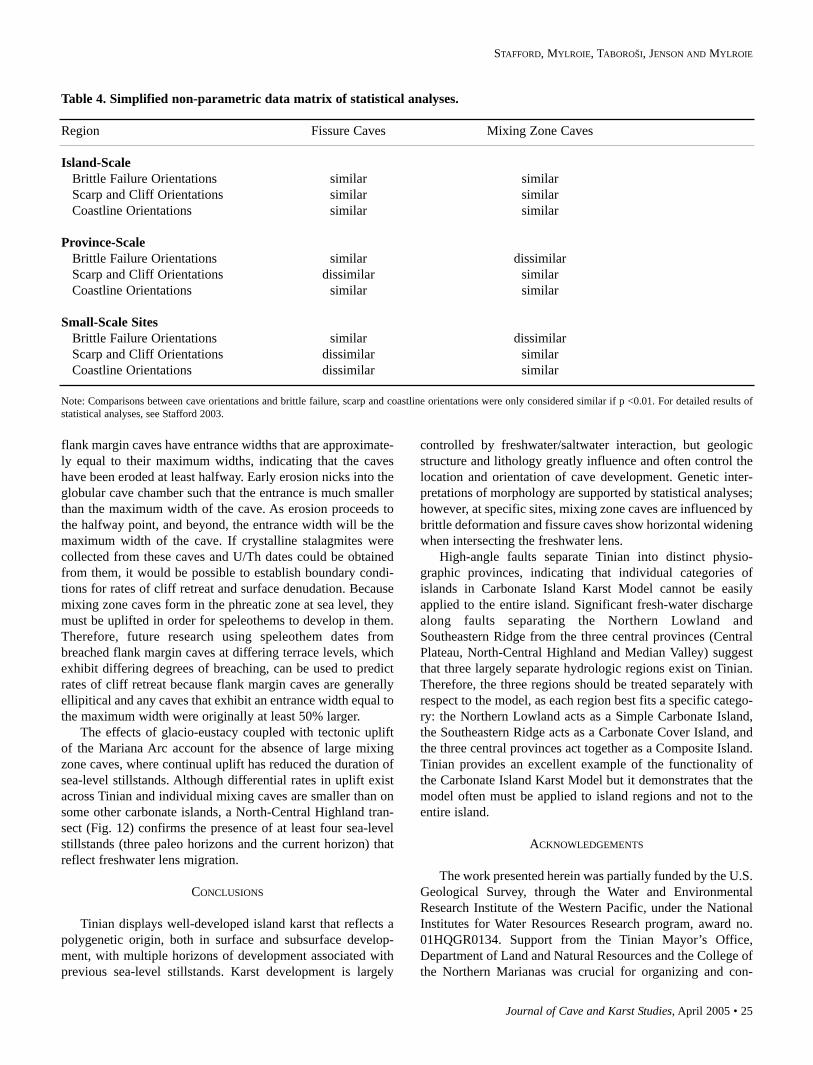
Journal of Cave and Karst Studies, April 2005 • 25
STAFFORD, MYLROIE, TABOROŠI, JENSON AND MYLROIE
flank margin caves have entrance widths that are approximate-ly equal to their maximum widths, indicating that the caveshave been eroded at least halfway. Early erosion nicks into theglobular cave chamber such that the entrance is much smallerthan the maximum width of the cave. As erosion proceeds tothe halfway point, and beyond, the entrance width will be themaximum width of the cave. If crystalline stalagmites werecollected from these caves and U/Th dates could be obtainedfrom them, it would be possible to establish boundary condi-tions for rates of cliff retreat and surface denudation. Becausemixing zone caves form in the phreatic zone at sea level, theymust be uplifted in order for speleothems to develop in them.Therefore, future research using speleothem dates frombreached flank margin caves at differing terrace levels, whichexhibit differing degrees of breaching, can be used to predictrates of cliff retreat because flank margin caves are generallyellipitical and any caves that exhibit an entrance width equal tothe maximum width were originally at least 50% larger.
The effects of glacio-eustacy coupled with tectonic upliftof the Mariana Arc account for the absence of large mixingzone caves, where continual uplift has reduced the duration ofsea-level stillstands. Although differential rates in uplift existacross Tinian and individual mixing caves are smaller than onsome other carbonate islands, a North-Central Highland tran-sect (Fig. 12) confirms the presence of at least four sea-levelstillstands (three paleo horizons and the current horizon) thatreflect freshwater lens migration.
CONCLUSIONS
Tinian displays well-developed island karst that reflects apolygenetic origin, both in surface and subsurface develop-ment, with multiple horizons of development associated withprevious sea-level stillstands. Karst development is largely
controlled by freshwater/saltwater interaction, but geologicstructure and lithology greatly influence and often control thelocation and orientation of cave development. Genetic inter-pretations of morphology are supported by statistical analyses;however, at specific sites, mixing zone caves are influenced bybrittle deformation and fissure caves show horizontal wideningwhen intersecting the freshwater lens.
High-angle faults separate Tinian into distinct physio-graphic provinces, indicating that individual categories ofislands in Carbonate Island Karst Model cannot be easilyapplied to the entire island. Significant fresh-water dischargealong faults separating the Northern Lowland andSoutheastern Ridge from the three central provinces (CentralPlateau, North-Central Highland and Median Valley) suggestthat three largely separate hydrologic regions exist on Tinian.Therefore, the three regions should be treated separately withrespect to the model, as each region best fits a specific catego-ry: the Northern Lowland acts as a Simple Carbonate Island,the Southeastern Ridge acts as a Carbonate Cover Island, andthe three central provinces act together as a Composite Island.Tinian provides an excellent example of the functionality ofthe Carbonate Island Karst Model but it demonstrates that themodel often must be applied to island regions and not to theentire island.
ACKNOWLEDGEMENTS
The work presented herein was partially funded by the U.S.Geological Survey, through the Water and EnvironmentalResearch Institute of the Western Pacific, under the NationalInstitutes for Water Resources Research program, award no.01HQGR0134. Support from the Tinian Mayor’s Office,Department of Land and Natural Resources and the College ofthe Northern Marianas was crucial for organizing and con-
Table 4. Simplified non-parametric data matrix of statistical analyses.
Region Fissure Caves Mixing Zone Caves
Island-ScaleBrittle Failure Orientations similar similarScarp and Cliff Orientations similar similarCoastline Orientations similar similar
Province-ScaleBrittle Failure Orientations similar dissimilarScarp and Cliff Orientations dissimilar similarCoastline Orientations similar similar
Small-Scale SitesBrittle Failure Orientations similar dissimilarScarp and Cliff Orientations dissimilar similarCoastline Orientations dissimilar similar
Note: Comparisons between cave orientations and brittle failure, scarp and coastline orientations were only considered similar if p <0.01. For detailed results ofstatistical analyses, see Stafford 2003.
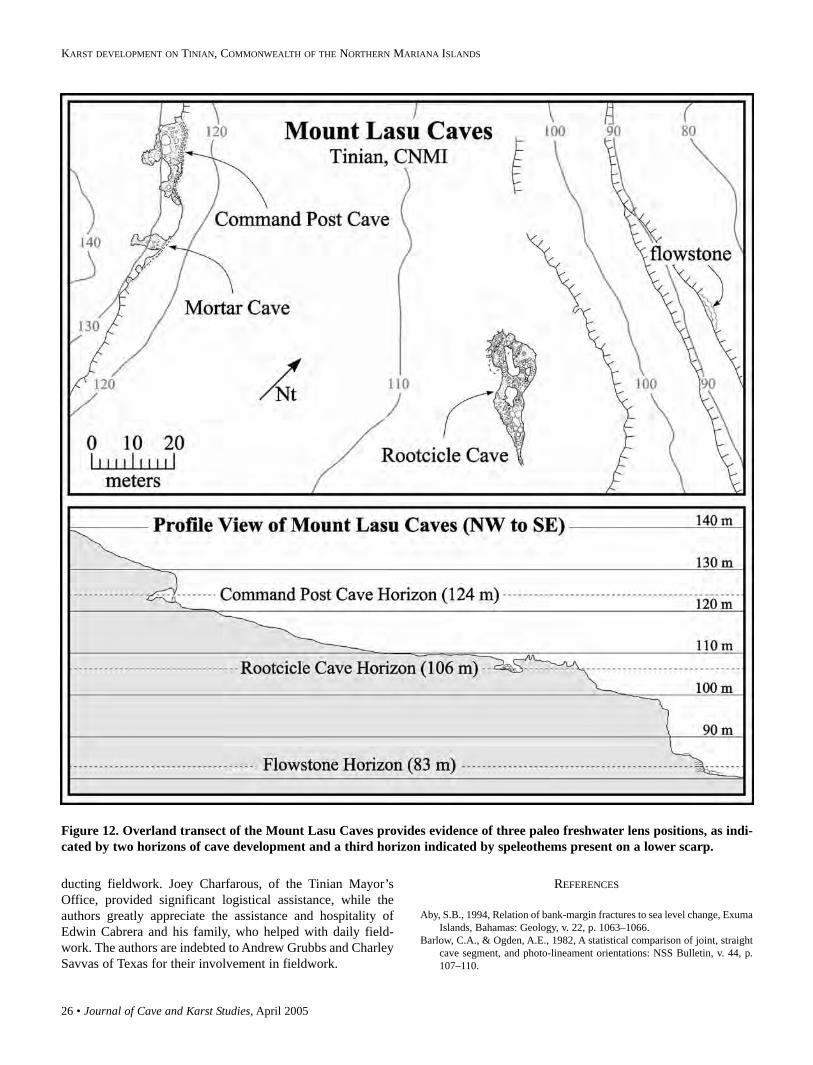
26 • Journal of Cave and Karst Studies, April 2005
KARST DEVELOPMENT ON TINIAN, COMMONWEALTH OF THE NORTHERN MARIANA ISLANDS
ducting fieldwork. Joey Charfarous, of the Tinian Mayor’sOffice, provided significant logistical assistance, while theauthors greatly appreciate the assistance and hospitality ofEdwin Cabrera and his family, who helped with daily field-work. The authors are indebted to Andrew Grubbs and CharleySavvas of Texas for their involvement in fieldwork.
REFERENCES
Aby, S.B., 1994, Relation of bank-margin fractures to sea level change, ExumaIslands, Bahamas: Geology, v. 22, p. 1063–1066.
Barlow, C.A., & Ogden, A.E., 1982, A statistical comparison of joint, straightcave segment, and photo-lineament orientations: NSS Bulletin, v. 44, p.107–110.
Figure 12. Overland transect of the Mount Lasu Caves provides evidence of three paleo freshwater lens positions, as indi-cated by two horizons of cave development and a third horizon indicated by speleothems present on a lower scarp.
Journal of Cave and Karst Studies, April 2005 • 27
STAFFORD, MYLROIE, TABOROŠI, JENSON AND MYLROIE
Mylroie, J.E., & Jenson, J.W., 2001, The carbonate island karst model appliedto Guam: Theoretical and Applied Karstology, v. 13-14, p. 51–56.
Mylroie, J.E., Jenson, J.W., Taboroši, D., Jocson, J.M.U., Vann, D., & Wexel,C., 2001, Karst features of Guam in terms of a general model of carbon-ate island karst: Journal of Cave and Karst Studies, v. 63, no. 1, p. 9–22.
Mylroie, J.E., & Jenson, J.W., 2002, Karst flow systems in young carbonateislands, in Martin, J.B., Wicks, C.M., & Sasowsky, I.D., eds.,Hydrogeology and biology of post-Paleozoic carbonate aquifers, KarstWaters Institute Special Publication Number 7: Karst Waters Institute,Inc., Charles Town, WV, p. 107–110.
Nelson, J.W., 1988, Structural and Geomorphic Controls of the KarstHydrogeology of Franklin County, Alabama [MS Thesis]: MississippiState University, MS, 165 p.
Palmer, A.N., 1991, Origin and morphology of limestone caves: GeologicalSociety of America Bulletin, v. 103, p. 1–21.
Raeisi, E., & Mylroie, J.E., 1995, Hydrodynamic behavior of caves formed inthe fresh-water lens of carbonate islands: Carbonates and Evaporites, v.10, no. 2, p. 207–214
Siegrest, H.G., 1988, Miocene reef carbonates of the Mariana Islands:American Association of Petroleum Geologists Bulletin, v. 72, no. 2, p.248.
Stafford, K.W., 2003, Structural Controls on Megaporosity in EogeneticCarbonate Rocks: Tinian, CNMI [MS Thesis]: Mississippi StateUniversity, MS, 340 p.
Stafford, K.W., Mylroie, J.E., & Jenson, J.W., 2002, Karst Geology andHydrology of Tinian and Rota (Luta), CNMI: Technical Report No. 96:Water and Environmental Institute of the Western Pacific, University ofGuam, Mangilao, 31 p.
Stafford, K.W., Mylroie, J.E., Mylroie, J.R., & Jenson, J.W., 2003a, Tinian,CNMI: A carbonate island karst model evaluation: Geological Society ofAmerica Abstracts and Programs, v. 35, no. 1, p. 3.
Stafford, K.W., Mylroie, J.E., Taboroši, D., Mylroie, J.R., Keel, T.M., &Jenson, J. W., 2003b, Structurally controlled eogenetic karst: MarianaIslands: Geological Society of American abstracts with programs, v. 4, no.7, p. 452.
Taboroši, D., Jenson, J.W., & Mylroie, J.E., 2004, Karren features in islandkarst: Guam, Mariana Islands: Zeitschrift fur Geomorphologie.
Tracey, J.I., Jr., Schlanger, S.O., Stark, J.T., Doan, D.B., & May, H.G., 1964,General Geology of Guam, 403-A: U.S. Geological Survey ProfessionalPaper, U.S. Government Printing Office, Washington, D.C., 104 p.
United States Department of the Interior Geological Survey, 2001a,1697184.DEM.SDTS.TAR.GZ: National Mapping program of the U.S.Geological Survey, ftp://sdts.er.usgs.gov/pub/sdts/datasets/raster/dem/.
United States Department of the Interior Geological Survey, 2001b,1697335.DEM.SDTS.TAR.GZ: National Mapping program of the U.S.Geological Survey, ftp://sdts.er.usgs.gov/pub/sdts/datasets/raster/dem/.
United States Department of the Interior Geological Survey, 2001c,1697336.DEM.SDTS.TAR.GZ: National Mapping program of the U.S.Geological Survey, ftp://sdts.er.usgs.gov/pub/sdts/datasets/raster/dem/.
United States Department of the Interior Geological Survey, 2001d,1697337.DEM.SDTS.TAR.GZ: National Mapping program of the U.S.Geological Survey, ftp://sdts.er.usgs.gov/pub/sdts/datasets/raster/dem/.
United States Department of the Interior Geological Survey, 2001e,1697338.DEM.SDTS.TAR.GZ: National Mapping program of the U.S.Geological Survey, ftp://sdts.er.usgs.gov/pub/sdts/datasets/raster/dem/.
Vacher, H.L., & Mylroie, J.E., 2002, Eogenetic karst from the perspective ofan equivalent porous medium: Carbonates and Evaporites, v. 17, no. 2, p.182–196.
Viles, H.A., 1988, Biogeomorphology: Basil Blackwell, Oxford, UnitedKingdom.
White, W.B., 1988, Geomorphology and Hydrology of Karst Terrains: OxfordUniversity Press, New York, 464 p.
Burke, H.W., 1953, The Petrography of the Mariana Limestone, Tinian,Mariana Islands [PhD Dissertation]: Stanford University, 111 p.
Carew, J.L., & Mylroie, J.E., 1995, Quaternary tectonic stability of theBahamian Archipelago: evidence from fossil coral reefs and flank margincaves: Quaternary Science Reviews, v. 14, p. 145–153.
Cloud, P.E., Jr., Schmidt, R.G., & Burke, H.W., 1956, Geology of Saipan,Mariana Islands, Part 1, General Geology, 280-A: U.S. Geological SurveyProfessional Paper, U.S. Government Printing Office, Washington, D.C.,126 p.
Dickinson, W.R., 2000, Hydro-isostatic and tectonic in influences on emergentHolocene paleoshorelines in the Mariana Islands, Western Pacific Ocean:Journal of Coastal Research, v. 16, no. 3, p. 735–746.
Doan, D.B., Burke, H.W., May, H.G., Stensland, C.H., & Blumenstock, D.I.,1960, Military Geology of Tinian, Mariana Islands: Chief of Engineers,U.S. Army, 149 p.
Frank, E.F., Mylroie, J.E., Troester, J., Alexander, E.C., & Carew, J.L., 1998,Karst development and speleologenesis, Isla de Mona, Puerto Rico:Journal of Cave and Karst Studies, v. 60, no. 2, p. 73–83.
Folk, R.L., Roberts, H.H., & Moore, C.C., 1973, Black phytokarst from Hell,Cayman Islands, British West Indies: Geological Society of AmericaBulletin, v. 84, p. 2351–2360.
Gingerich, S.B., & Yeatts, D.S., 2000, Ground-Water Resources of Tinian,Commonwealth of the Northern Mariana Islands, Water-resourcesInvestigations Report 00-4068: U.S. Department of the Interior, 2 sheets.
Harris, J.F., Mylroie, J.E., & Carew, J.L., 1995, Banana holes: Unique karstfeatures of the Bahamas: Carbonates and Evaporites, v. 10, no. 2, p.215–224.
Jenson, J.W., Jocson, J.M.U., and Siegrist, H.G., 1997, Groundwater dischargestyles from an uplifted Pleistocene island karst aquifer, Guam, MarianaIslands, in Beck, B.F., & Stephenson, J.B. (eds.), The EngineeringGeology of Karst Terraines: Balkema, Springfield, Missouri. p. 27–32.
Jenson, J.W., Mylroie, J.E., Mylroie, J.R., & Wexel, C., 2002, Revisiting thecarbonate island karst model: Geological Society of America Abstractswith Program, v. 34, no. 6, p. 226.
Mink, J.F., & Vacher, H.L., 1997, Hydrogeology of northern Guam, in Vacher,H.L., & Quinn, T. (eds.), Geology and Hydrogeology of CarbonateIslands, Developments in Sedimentology 54: Elsevier Science, p.743–761.
Mylroie, J. E., & Carew, J. L., 1988, Solution conduits as indicators of lateQuaternary sea level position: Quaternary Science Reviews, v. 7, p.55–64.
Mylroie, J.E., & Carew, J.L., 1995, Karst development on carbonate islands,in Budd, D.A., Harris, P.M., & Staller, A. eds., Unconformities andPorosity in Carbonate Strata: American Association of PetroleumGeologists, p. 55–76.
Mylroie, J.E., Carew, J.L., & Vacher, H.L., 1995a, Karst development in theBahamas and Bermuda, in: Curran, H.A., & White, B., eds., Terrestrialand Shallow Marine Geology of the Bahamas and Bermuda: p. 251–267.
Mylroie, J.E., Panuska, B.C., Carew, J.L., Frank, E., Taggart, B.E., Troester,J.W., & Carrasquillo, R., 1995b, Development of flank margin caves onSan Salvador Island, Bahamas and Isla de Mona, Puerto Rico, inBoardman, M., ed., Proceedings of the Seventh Symposium on theGeology of the Bahamas: Bahamian Field Station, San Salvador,Bahamas, p. 49–81.
Mylroie, J.E., Carew, J.L., & Moore, A.I., 1995c, Blue hole: Definition andgenesis: Carbonates and Evaporites, v. 10, no. 2, p. 225–233.
Mylroie, J.E., Jenson, J.W., Jocson, J.M.U., & Lander, M., 1999, KarstGeology and Hydrology of Guam: A Preliminary Report, TechnicalReport #89: Water and Environmental Institute of the Western Pacific,University of Guam, Mangilao.
Mylroie, J.E., & Vacher, H.L., 1999, A conceptual view of carbonate islandkarst, in Palmer, A.N., Palmer, M.V., & Sasowsky, I.D., eds., KarstModeling, Karst Waters Institute Special Publication 5: Karst WatersInstitute, Inc., Charles Town, WV, p. 48–57.
28 • Journal of Cave and Karst Studies, April 2005
Hazel Barton and Frederick Luiszer - Microbial metabolic structure in a sulfidic cave hot spring: Potential mechanisms of biospeleogenesis. Journal of Cave andKarst Studies, v. 67, no. 1, p. 28-38.
The theory of hypogenic cave formation through hydrogensulfide-rich groundwater and subsequent sulfuric acid dissolu-tion was first proposed by Egemeier (1981, 1987) in the early1970s, with further refinement by Jagnow (1978), Davis(1980), Palmer (1991) and Queen et al. (1977). This theoryproposes that, given an appropriate geological setting, cavescan form through the dissolution activity of ascending hydro-gen sulfide (H2S)-rich ground water (Palmer 1991; Palmer &Palmer 2000). As the dissolved H2S approaches the oxic zoneat the water table, the gas reacts with oxygen to form sulfuricacid (H2SO4) which subsequently dissolves the carbonaterocks, producing carbon dioxide and gypsum (CaSO4•2H2O)(Hill 1987; Palmer & Palmer 2000). This hypothesis is sup-ported in caves, such as Carlsbad Cavern, New Mexico, by thepresence of numerous minerals known to be formed throughsulfuric acid dissolution, including endellite and gypsum (Hill1990). The fact that gypsum in these caves is also isotopicallylight suggests a biogenic component to the sulfuric acidspeleogenesis theory (Canfield 2001; Canfield et al. 1998; Hill1990; Klimchouk et al. 2000).
As the theory of sulfuric acid dissolution for caves in theGuadalupe Mountains of New Mexico became accepted as avalid process of speleogenesis, the number of such cave sys-tems being similarly described around the world began to rise.Caves formed through sulfuric acid dissolution have now been
described in countries as geographically diverse as Italy,Mexico, Romania and Turkmenistan (Hose & Pisarowicz1999; Klimchouk et al. 2000; Klimchouk et al. 1995; Maltsev& Malishevsky 1990; Sarbu et al. 1996). Included within thisgroup are caves such as Movile Cave, Romania, and Cueva deVilla Luz, Mexico, that are still undergoing active sulfuric acidspeleogenesis. Of note is that both these caves demonstrateactive microbial activity, with chemolithotrophic microbialcommunities growing within the cave systems (Hose et al.2000; Sarbu et al. 1996; Sarbu et al. 1994). In these systems,acid production by the microbial communities may have a sig-nificant impact on the cave environment, leading to localizeddissolution of the carbonate bedrock (Hose et al. 2000).Interestingly, within Movile Cave, such activity is occurringwithin a geologically confined area without a conduit to allowfor the exchange of oxygen with the surface atmosphere.However, the inorganic interaction of oxygen with hydrogensulfide is widely thought to be an important factor for cavernenlargement in sulfuric acid speleogenesis (Egemeier 1981,1987; Hill 1987; Palmer & Palmer 2000; Sarbu et al. 1996).This would therefore suggest that microbial dissolution inthese systems results in a localized secondary speleogenesis
MICROBIAL METABOLIC STRUCTURE IN A SULFIDICCAVE HOT SPRING: POTENTIAL MECHANISMS OF
BIOSPELEOGENESISHAZEL A. BARTON1
Department of Biological Science, Northern Kentucky University, Highland Heights, KY 41099, USAFREDERICK LUISZER
Department of Geological Sciences, University of Colorado, Boulder, Colorado 80309, USA
Glenwood Hot Springs, Colorado, is a sulfidic hot-spring that issues from numerous sites. These watersare partially responsible for speleogenesis of the nearby Fairy Cave system, through hypogenic sulfuric-acid dissolution. To examine whether there may have been microbial involvement in the dissolution ofthis cave system we examined the present-day microbial flora of a cave created by the hot spring. Usingmolecular phylogenetic analysis of the 16S small subunit ribosomal RNA gene and scanning electronmicroscopy, we examined the microbial community structure within the spring. The microbial communi-ty displayed a high level of microbial diversity, with 25 unique phylotypes representing nine divisions ofthe Bacteria and a division of the Archaea previously not identified under the conditions of temperatureand pH found in the spring. By determining a putative metabolic network for the microbial species foundin the spring, it appears that the community is carrying out both sulfate reduction and sulfide oxidation.Significantly, the sulfate reduction in the spring appears to be generating numerous organic acids as wellas reactive sulfur species, such as sulfite. Even in the absence of oxygen, this sulfite can interact withwater directly to produce sulfuric acid. Consequently, such metabolic activity may represent a mecha-nism by which biospeleogenesis can lead to passage enlargement through sulfuric acid production with-out the influx of oxygen or oxygen-rich waters. Such activity may lead to higher levels of sulfuric acidproduction than could be accounted for by inorganic hydrogen sulfide oxidation. Therefore, rather thangenerating localized pockets of speleogenesis within cave systems, such biogenic sulfuric acid produc-tion may have a regional impact on water chemistry and subsequent speleogenesis of large cave systems.
1Hazel A. Barton, Department of Biological Science, Northern Kentucky University, SC 344, NunnDrive, Highland Heights, KY 41099, Ph: 859-572-5303, Fax: 859-572-5639, Email: [email protected],www.cavescience.com
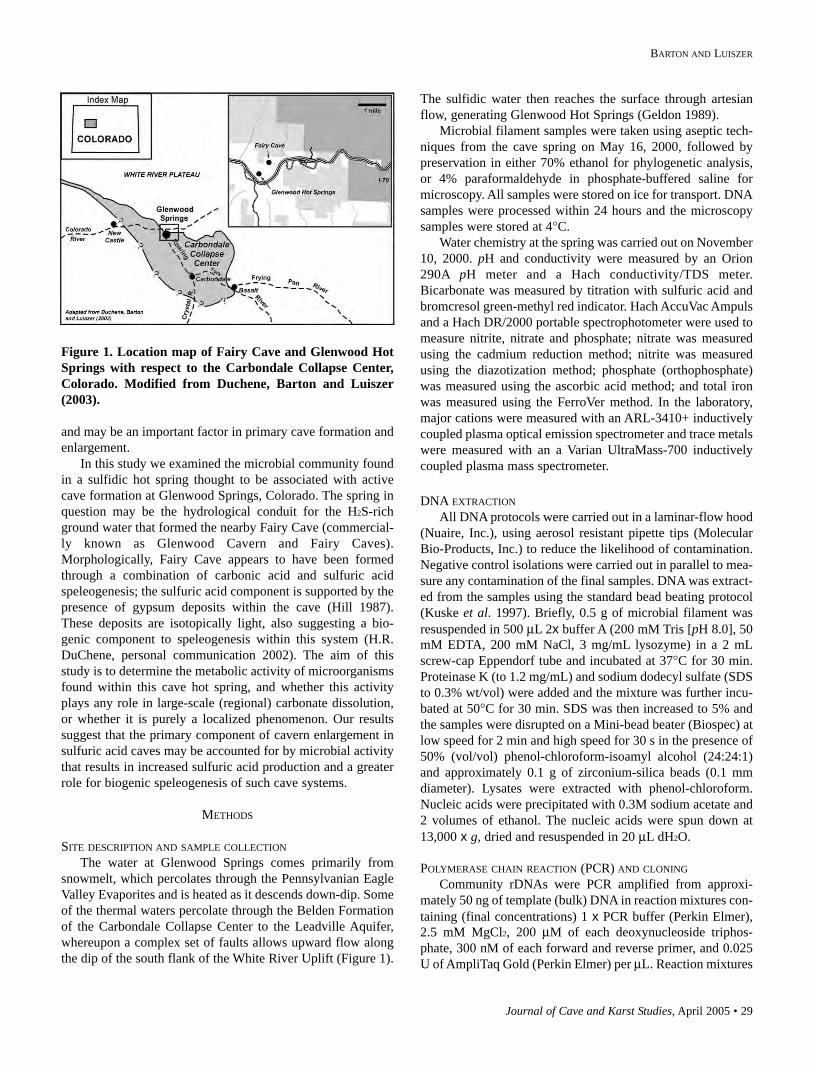
Journal of Cave and Karst Studies, April 2005 • 29
BARTON AND LUISZER
and may be an important factor in primary cave formation andenlargement.
In this study we examined the microbial community foundin a sulfidic hot spring thought to be associated with activecave formation at Glenwood Springs, Colorado. The spring inquestion may be the hydrological conduit for the H2S-richground water that formed the nearby Fairy Cave (commercial-ly known as Glenwood Cavern and Fairy Caves).Morphologically, Fairy Cave appears to have been formedthrough a combination of carbonic acid and sulfuric acidspeleogenesis; the sulfuric acid component is supported by thepresence of gypsum deposits within the cave (Hill 1987).These deposits are isotopically light, also suggesting a bio-genic component to speleogenesis within this system (H.R.DuChene, personal communication 2002). The aim of thisstudy is to determine the metabolic activity of microorganismsfound within this cave hot spring, and whether this activityplays any role in large-scale (regional) carbonate dissolution,or whether it is purely a localized phenomenon. Our resultssuggest that the primary component of cavern enlargement insulfuric acid caves may be accounted for by microbial activitythat results in increased sulfuric acid production and a greaterrole for biogenic speleogenesis of such cave systems.
METHODS
SITE DESCRIPTION AND SAMPLE COLLECTIONThe water at Glenwood Springs comes primarily from
snowmelt, which percolates through the Pennsylvanian EagleValley Evaporites and is heated as it descends down-dip. Someof the thermal waters percolate through the Belden Formationof the Carbondale Collapse Center to the Leadville Aquifer,whereupon a complex set of faults allows upward flow alongthe dip of the south flank of the White River Uplift (Figure 1).
The sulfidic water then reaches the surface through artesianflow, generating Glenwood Hot Springs (Geldon 1989).
Microbial filament samples were taken using aseptic tech-niques from the cave spring on May 16, 2000, followed bypreservation in either 70% ethanol for phylogenetic analysis,or 4% paraformaldehyde in phosphate-buffered saline formicroscopy. All samples were stored on ice for transport. DNAsamples were processed within 24 hours and the microscopysamples were stored at 4°C.
Water chemistry at the spring was carried out on November10, 2000. pH and conductivity were measured by an Orion290A pH meter and a Hach conductivity/TDS meter.Bicarbonate was measured by titration with sulfuric acid andbromcresol green-methyl red indicator. Hach AccuVac Ampulsand a Hach DR/2000 portable spectrophotometer were used tomeasure nitrite, nitrate and phosphate; nitrate was measuredusing the cadmium reduction method; nitrite was measuredusing the diazotization method; phosphate (orthophosphate)was measured using the ascorbic acid method; and total ironwas measured using the FerroVer method. In the laboratory,major cations were measured with an ARL-3410+ inductivelycoupled plasma optical emission spectrometer and trace metalswere measured with an a Varian UltraMass-700 inductivelycoupled plasma mass spectrometer.
DNA EXTRACTIONAll DNA protocols were carried out in a laminar-flow hood
(Nuaire, Inc.), using aerosol resistant pipette tips (MolecularBio-Products, Inc.) to reduce the likelihood of contamination.Negative control isolations were carried out in parallel to mea-sure any contamination of the final samples. DNA was extract-ed from the samples using the standard bead beating protocol(Kuske et al. 1997). Briefly, 0.5 g of microbial filament wasresuspended in 500 µL 2x buffer A (200 mM Tris [pH 8.0], 50mM EDTA, 200 mM NaCl, 3 mg/mL lysozyme) in a 2 mLscrew-cap Eppendorf tube and incubated at 37°C for 30 min.Proteinase K (to 1.2 mg/mL) and sodium dodecyl sulfate (SDSto 0.3% wt/vol) were added and the mixture was further incu-bated at 50°C for 30 min. SDS was then increased to 5% andthe samples were disrupted on a Mini-bead beater (Biospec) atlow speed for 2 min and high speed for 30 s in the presence of50% (vol/vol) phenol-chloroform-isoamyl alcohol (24:24:1)and approximately 0.1 g of zirconium-silica beads (0.1 mmdiameter). Lysates were extracted with phenol-chloroform.Nucleic acids were precipitated with 0.3M sodium acetate and2 volumes of ethanol. The nucleic acids were spun down at13,000 x g, dried and resuspended in 20 µL dH2O.
POLYMERASE CHAIN REACTION (PCR) AND CLONINGCommunity rDNAs were PCR amplified from approxi-
mately 50 ng of template (bulk) DNA in reaction mixtures con-taining (final concentrations) 1 x PCR buffer (Perkin Elmer),2.5 mM MgCl2, 200 µM of each deoxynucleoside triphos-phate, 300 nM of each forward and reverse primer, and 0.025U of AmpliTaq Gold (Perkin Elmer) per µL. Reaction mixtures
Figure 1. Location map of Fairy Cave and Glenwood HotSprings with respect to the Carbondale Collapse Center,Colorado. Modified from Duchene, Barton and Luiszer(2003).
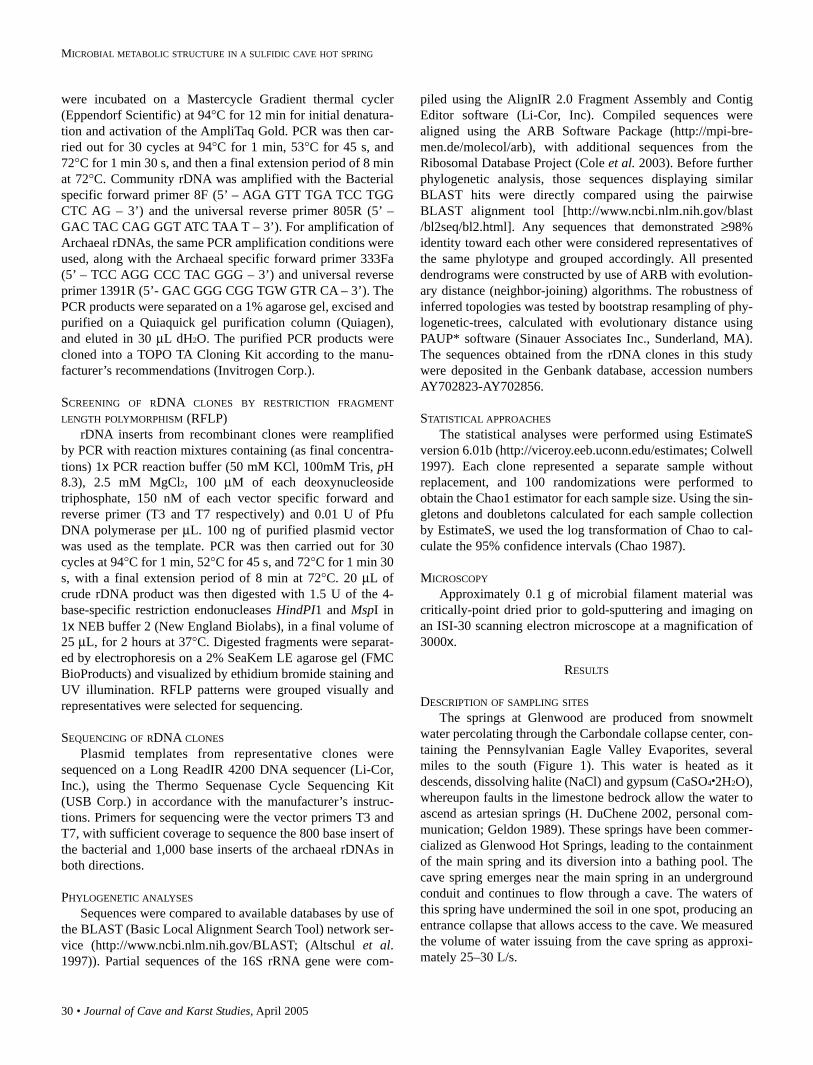
30 • Journal of Cave and Karst Studies, April 2005
MICROBIAL METABOLIC STRUCTURE IN A SULFIDIC CAVE HOT SPRING
were incubated on a Mastercycle Gradient thermal cycler(Eppendorf Scientific) at 94°C for 12 min for initial denatura-tion and activation of the AmpliTaq Gold. PCR was then car-ried out for 30 cycles at 94°C for 1 min, 53°C for 45 s, and72°C for 1 min 30 s, and then a final extension period of 8 minat 72°C. Community rDNA was amplified with the Bacterialspecific forward primer 8F (5’ – AGA GTT TGA TCC TGGCTC AG – 3’) and the universal reverse primer 805R (5’ –GAC TAC CAG GGT ATC TAA T – 3’). For amplification ofArchaeal rDNAs, the same PCR amplification conditions wereused, along with the Archaeal specific forward primer 333Fa(5’ – TCC AGG CCC TAC GGG – 3’) and universal reverseprimer 1391R (5’- GAC GGG CGG TGW GTR CA – 3’). ThePCR products were separated on a 1% agarose gel, excised andpurified on a Quiaquick gel purification column (Quiagen),and eluted in 30 µL dH2O. The purified PCR products werecloned into a TOPO TA Cloning Kit according to the manu-facturer’s recommendations (Invitrogen Corp.).
SCREENING OF RDNA CLONES BY RESTRICTION FRAGMENTLENGTH POLYMORPHISM (RFLP)
rDNA inserts from recombinant clones were reamplifiedby PCR with reaction mixtures containing (as final concentra-tions) 1x PCR reaction buffer (50 mM KCl, 100mM Tris, pH8.3), 2.5 mM MgCl2, 100 µM of each deoxynucleosidetriphosphate, 150 nM of each vector specific forward andreverse primer (T3 and T7 respectively) and 0.01 U of PfuDNA polymerase per µL. 100 ng of purified plasmid vectorwas used as the template. PCR was then carried out for 30cycles at 94°C for 1 min, 52°C for 45 s, and 72°C for 1 min 30s, with a final extension period of 8 min at 72°C. 20 µL ofcrude rDNA product was then digested with 1.5 U of the 4-base-specific restriction endonucleases HindPI1 and MspI in1x NEB buffer 2 (New England Biolabs), in a final volume of25 µL, for 2 hours at 37°C. Digested fragments were separat-ed by electrophoresis on a 2% SeaKem LE agarose gel (FMCBioProducts) and visualized by ethidium bromide staining andUV illumination. RFLP patterns were grouped visually andrepresentatives were selected for sequencing.
SEQUENCING OF RDNA CLONESPlasmid templates from representative clones were
sequenced on a Long ReadIR 4200 DNA sequencer (Li-Cor,Inc.), using the Thermo Sequenase Cycle Sequencing Kit(USB Corp.) in accordance with the manufacturer’s instruc-tions. Primers for sequencing were the vector primers T3 andT7, with sufficient coverage to sequence the 800 base insert ofthe bacterial and 1,000 base inserts of the archaeal rDNAs inboth directions.
PHYLOGENETIC ANALYSESSequences were compared to available databases by use of
the BLAST (Basic Local Alignment Search Tool) network ser-vice (http://www.ncbi.nlm.nih.gov/BLAST; (Altschul et al.1997)). Partial sequences of the 16S rRNA gene were com-
piled using the AlignIR 2.0 Fragment Assembly and ContigEditor software (Li-Cor, Inc). Compiled sequences werealigned using the ARB Software Package (http://mpi-bre-men.de/molecol/arb), with additional sequences from theRibosomal Database Project (Cole et al. 2003). Before furtherphylogenetic analysis, those sequences displaying similarBLAST hits were directly compared using the pairwiseBLAST alignment tool [http://www.ncbi.nlm.nih.gov/blast/bl2seq/bl2.html]. Any sequences that demonstrated ≥98%identity toward each other were considered representatives ofthe same phylotype and grouped accordingly. All presenteddendrograms were constructed by use of ARB with evolution-ary distance (neighbor-joining) algorithms. The robustness ofinferred topologies was tested by bootstrap resampling of phy-logenetic-trees, calculated with evolutionary distance usingPAUP* software (Sinauer Associates Inc., Sunderland, MA).The sequences obtained from the rDNA clones in this studywere deposited in the Genbank database, accession numbersAY702823-AY702856.
STATISTICAL APPROACHESThe statistical analyses were performed using EstimateS
version 6.01b (http://viceroy.eeb.uconn.edu/estimates; Colwell1997). Each clone represented a separate sample withoutreplacement, and 100 randomizations were performed toobtain the Chao1 estimator for each sample size. Using the sin-gletons and doubletons calculated for each sample collectionby EstimateS, we used the log transformation of Chao to cal-culate the 95% confidence intervals (Chao 1987).
MICROSCOPYApproximately 0.1 g of microbial filament material was
critically-point dried prior to gold-sputtering and imaging onan ISI-30 scanning electron microscope at a magnification of3000x.
RESULTS
DESCRIPTION OF SAMPLING SITESThe springs at Glenwood are produced from snowmelt
water percolating through the Carbondale collapse center, con-taining the Pennsylvanian Eagle Valley Evaporites, severalmiles to the south (Figure 1). This water is heated as itdescends, dissolving halite (NaCl) and gypsum (CaSO4•2H2O),whereupon faults in the limestone bedrock allow the water toascend as artesian springs (H. DuChene 2002, personal com-munication; Geldon 1989). These springs have been commer-cialized as Glenwood Hot Springs, leading to the containmentof the main spring and its diversion into a bathing pool. Thecave spring emerges near the main spring in an undergroundconduit and continues to flow through a cave. The waters ofthis spring have undermined the soil in one spot, producing anentrance collapse that allows access to the cave. We measuredthe volume of water issuing from the cave spring as approxi-mately 25–30 L/s.
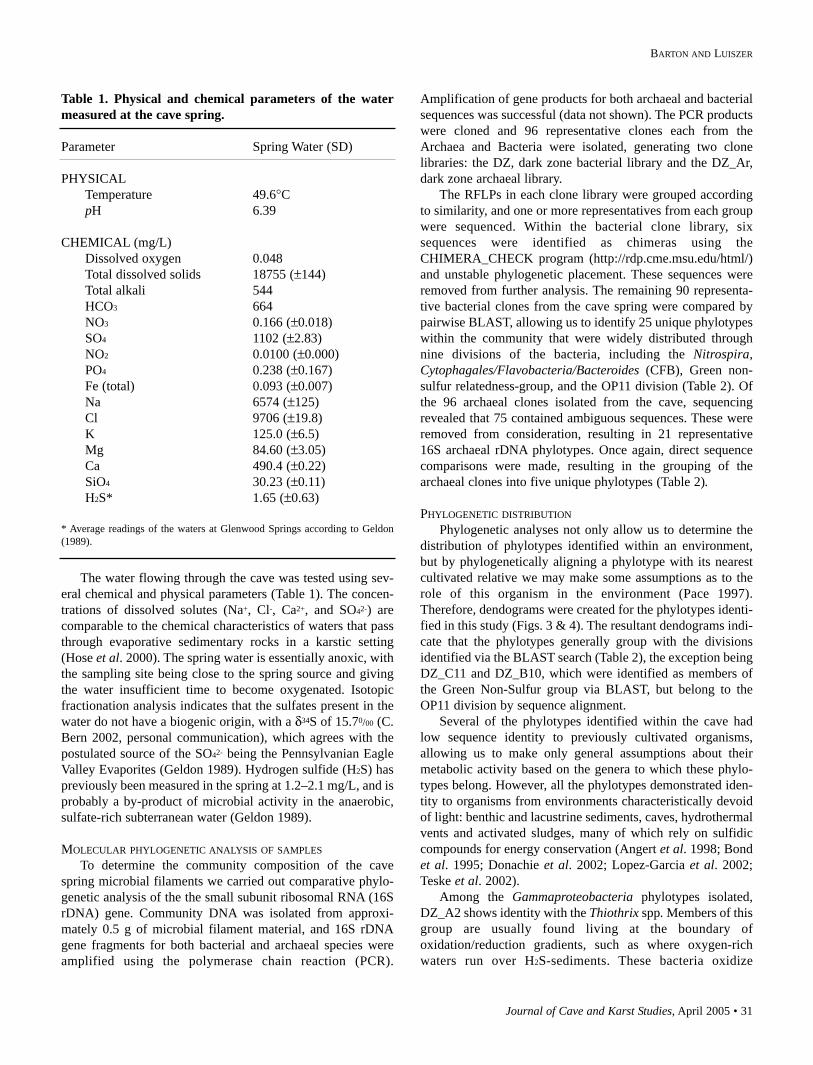
Journal of Cave and Karst Studies, April 2005 • 31
BARTON AND LUISZER
The water flowing through the cave was tested using sev-eral chemical and physical parameters (Table 1). The concen-trations of dissolved solutes (Na+, Cl-, Ca2+, and SO42-) arecomparable to the chemical characteristics of waters that passthrough evaporative sedimentary rocks in a karstic setting(Hose et al. 2000). The spring water is essentially anoxic, withthe sampling site being close to the spring source and givingthe water insufficient time to become oxygenated. Isotopicfractionation analysis indicates that the sulfates present in thewater do not have a biogenic origin, with a δ34S of 15.70/00 (C.Bern 2002, personal communication), which agrees with thepostulated source of the SO42- being the Pennsylvanian EagleValley Evaporites (Geldon 1989). Hydrogen sulfide (H2S) haspreviously been measured in the spring at 1.2–2.1 mg/L, and isprobably a by-product of microbial activity in the anaerobic,sulfate-rich subterranean water (Geldon 1989).
MOLECULAR PHYLOGENETIC ANALYSIS OF SAMPLESTo determine the community composition of the cave
spring microbial filaments we carried out comparative phylo-genetic analysis of the the small subunit ribosomal RNA (16SrDNA) gene. Community DNA was isolated from approxi-mately 0.5 g of microbial filament material, and 16S rDNAgene fragments for both bacterial and archaeal species wereamplified using the polymerase chain reaction (PCR).
Amplification of gene products for both archaeal and bacterialsequences was successful (data not shown). The PCR productswere cloned and 96 representative clones each from theArchaea and Bacteria were isolated, generating two clonelibraries: the DZ, dark zone bacterial library and the DZ_Ar,dark zone archaeal library.
The RFLPs in each clone library were grouped accordingto similarity, and one or more representatives from each groupwere sequenced. Within the bacterial clone library, sixsequences were identified as chimeras using theCHIMERA_CHECK program (http://rdp.cme.msu.edu/html/)and unstable phylogenetic placement. These sequences wereremoved from further analysis. The remaining 90 representa-tive bacterial clones from the cave spring were compared bypairwise BLAST, allowing us to identify 25 unique phylotypeswithin the community that were widely distributed throughnine divisions of the bacteria, including the Nitrospira,Cytophagales/Flavobacteria/Bacteroides (CFB), Green non-sulfur relatedness-group, and the OP11 division (Table 2). Ofthe 96 archaeal clones isolated from the cave, sequencingrevealed that 75 contained ambiguous sequences. These wereremoved from consideration, resulting in 21 representative16S archaeal rDNA phylotypes. Once again, direct sequencecomparisons were made, resulting in the grouping of thearchaeal clones into five unique phylotypes (Table 2).
PHYLOGENETIC DISTRIBUTIONPhylogenetic analyses not only allow us to determine the
distribution of phylotypes identified within an environment,but by phylogenetically aligning a phylotype with its nearestcultivated relative we may make some assumptions as to therole of this organism in the environment (Pace 1997).Therefore, dendograms were created for the phylotypes identi-fied in this study (Figs. 3 & 4). The resultant dendograms indi-cate that the phylotypes generally group with the divisionsidentified via the BLAST search (Table 2), the exception beingDZ_C11 and DZ_B10, which were identified as members ofthe Green Non-Sulfur group via BLAST, but belong to theOP11 division by sequence alignment.
Several of the phylotypes identified within the cave hadlow sequence identity to previously cultivated organisms,allowing us to make only general assumptions about theirmetabolic activity based on the genera to which these phylo-types belong. However, all the phylotypes demonstrated iden-tity to organisms from environments characteristically devoidof light: benthic and lacustrine sediments, caves, hydrothermalvents and activated sludges, many of which rely on sulfidiccompounds for energy conservation (Angert et al. 1998; Bondet al. 1995; Donachie et al. 2002; Lopez-Garcia et al. 2002;Teske et al. 2002).
Among the Gammaproteobacteria phylotypes isolated,DZ_A2 shows identity with the Thiothrix spp. Members of thisgroup are usually found living at the boundary ofoxidation/reduction gradients, such as where oxygen-richwaters run over H2S-sediments. These bacteria oxidize
Table 1. Physical and chemical parameters of the watermeasured at the cave spring.
Parameter Spring Water (SD)
PHYSICALTemperature 49.6°CpH 6.39
CHEMICAL (mg/L)Dissolved oxygen 0.048Total dissolved solids 18755 (±144)Total alkali 544HCO3 664NO3 0.166 (±0.018)SO4 1102 (±2.83)NO2 0.0100 (±0.000)PO4 0.238 (±0.167)Fe (total) 0.093 (±0.007)Na 6574 (±125)Cl 9706 (±19.8)K 125.0 (±6.5)Mg 84.60 (±3.05)Ca 490.4 (±0.22)SiO4 30.23 (±0.11)H2S* 1.65 (±0.63)
* Average readings of the waters at Glenwood Springs according to Geldon(1989).
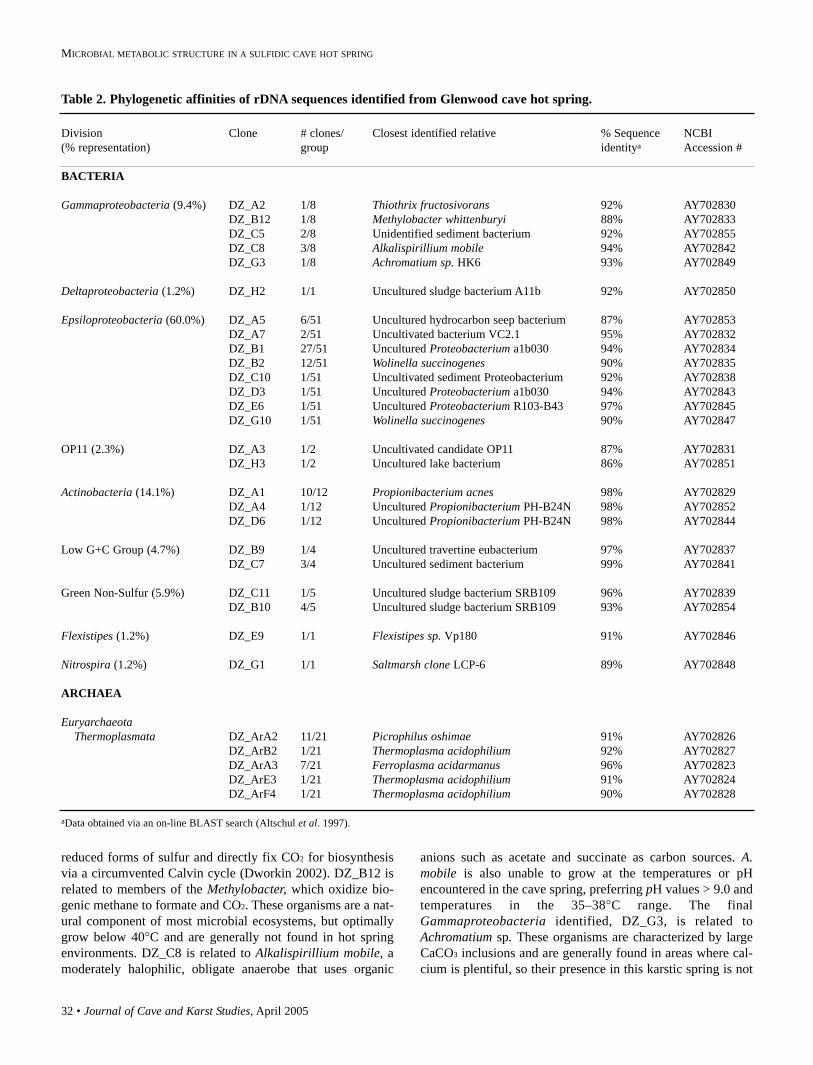
32 • Journal of Cave and Karst Studies, April 2005
MICROBIAL METABOLIC STRUCTURE IN A SULFIDIC CAVE HOT SPRING
reduced forms of sulfur and directly fix CO2 for biosynthesisvia a circumvented Calvin cycle (Dworkin 2002). DZ_B12 isrelated to members of the Methylobacter, which oxidize bio-genic methane to formate and CO2. These organisms are a nat-ural component of most microbial ecosystems, but optimallygrow below 40°C and are generally not found in hot springenvironments. DZ_C8 is related to Alkalispirillium mobile, amoderately halophilic, obligate anaerobe that uses organic
anions such as acetate and succinate as carbon sources. A.mobile is also unable to grow at the temperatures or pHencountered in the cave spring, preferring pH values > 9.0 andtemperatures in the 35–38°C range. The finalGammaproteobacteria identified, DZ_G3, is related toAchromatium sp. These organisms are characterized by largeCaCO3 inclusions and are generally found in areas where cal-cium is plentiful, so their presence in this karstic spring is not
Table 2. Phylogenetic affinities of rDNA sequences identified from Glenwood cave hot spring.
Division Clone # clones/ Closest identified relative % Sequence NCBI(% representation) group identitya Accession #
BACTERIA
Gammaproteobacteria (9.4%) DZ_A2 1/8 Thiothrix fructosivorans 92% AY702830DZ_B12 1/8 Methylobacter whittenburyi 88% AY702833DZ_C5 2/8 Unidentified sediment bacterium 92% AY702855DZ_C8 3/8 Alkalispirillium mobile 94% AY702842DZ_G3 1/8 Achromatium sp. HK6 93% AY702849
Deltaproteobacteria (1.2%) DZ_H2 1/1 Uncultured sludge bacterium A11b 92% AY702850
Epsiloproteobacteria (60.0%) DZ_A5 6/51 Uncultured hydrocarbon seep bacterium 87% AY702853DZ_A7 2/51 Uncultivated bacterium VC2.1 95% AY702832DZ_B1 27/51 Uncultured Proteobacterium a1b030 94% AY702834DZ_B2 12/51 Wolinella succinogenes 90% AY702835DZ_C10 1/51 Uncultivated sediment Proteobacterium 92% AY702838DZ_D3 1/51 Uncultured Proteobacterium a1b030 94% AY702843DZ_E6 1/51 Uncultured Proteobacterium R103-B43 97% AY702845DZ_G10 1/51 Wolinella succinogenes 90% AY702847
OP11 (2.3%) DZ_A3 1/2 Uncultivated candidate OP11 87% AY702831DZ_H3 1/2 Uncultured lake bacterium 86% AY702851
Actinobacteria (14.1%) DZ_A1 10/12 Propionibacterium acnes 98% AY702829DZ_A4 1/12 Uncultured Propionibacterium PH-B24N 98% AY702852DZ_D6 1/12 Uncultured Propionibacterium PH-B24N 98% AY702844
Low G+C Group (4.7%) DZ_B9 1/4 Uncultured travertine eubacterium 97% AY702837DZ_C7 3/4 Uncultured sediment bacterium 99% AY702841
Green Non-Sulfur (5.9%) DZ_C11 1/5 Uncultured sludge bacterium SRB109 96% AY702839DZ_B10 4/5 Uncultured sludge bacterium SRB109 93% AY702854
Flexistipes (1.2%) DZ_E9 1/1 Flexistipes sp. Vp180 91% AY702846
Nitrospira (1.2%) DZ_G1 1/1 Saltmarsh clone LCP-6 89% AY702848
ARCHAEA
EuryarchaeotaThermoplasmata DZ_ArA2 11/21 Picrophilus oshimae 91% AY702826
DZ_ArB2 1/21 Thermoplasma acidophilium 92% AY702827DZ_ArA3 7/21 Ferroplasma acidarmanus 96% AY702823DZ_ArE3 1/21 Thermoplasma acidophilium 91% AY702824DZ_ArF4 1/21 Thermoplasma acidophilium 90% AY702828
aData obtained via an on-line BLAST search (Altschul et al. 1997).
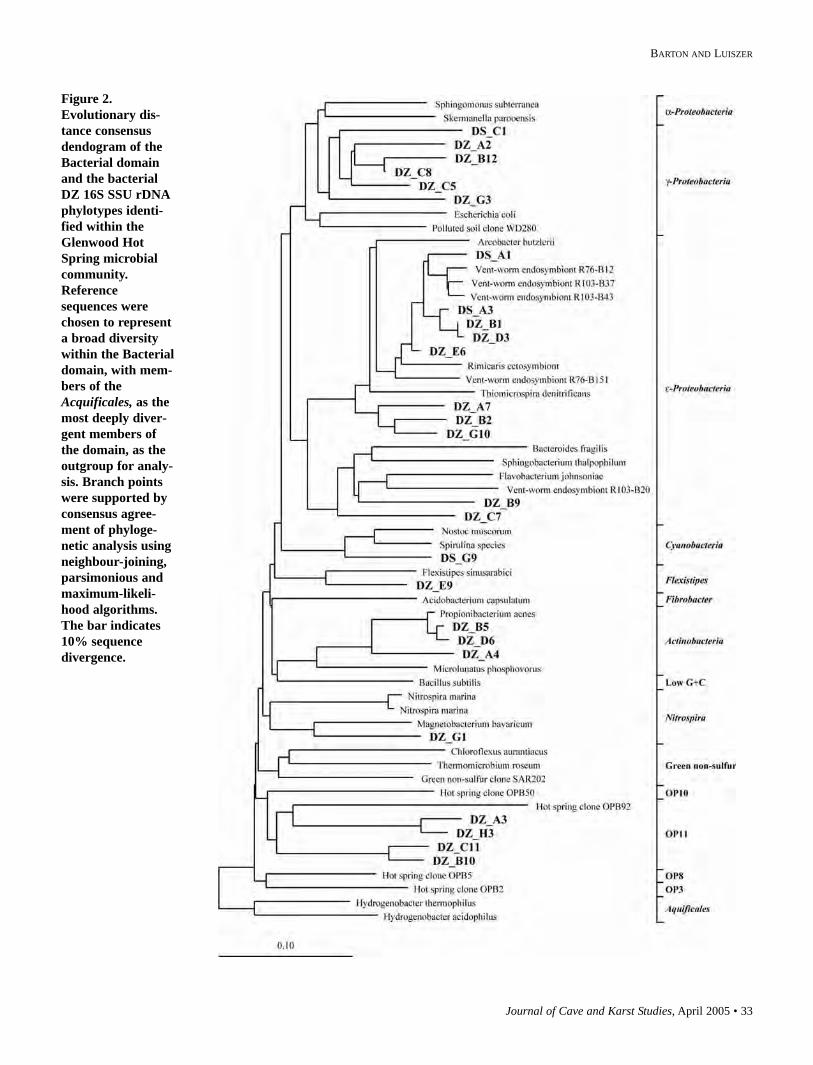
Journal of Cave and Karst Studies, April 2005 • 33
BARTON AND LUISZER
Figure 2.Evolutionary dis-tance consensusdendogram of theBacterial domainand the bacterialDZ 16S SSU rDNAphylotypes identi-fied within theGlenwood HotSpring microbialcommunity.Referencesequences werechosen to representa broad diversitywithin the Bacterialdomain, with mem-bers of theAcquificales, as themost deeply diver-gent members ofthe domain, as theoutgroup for analy-sis. Branch pointswere supported byconsensus agree-ment of phyloge-netic analysis usingneighbour-joining,parsimonious andmaximum-likeli-hood algorithms.The bar indicates10% sequencedivergence.
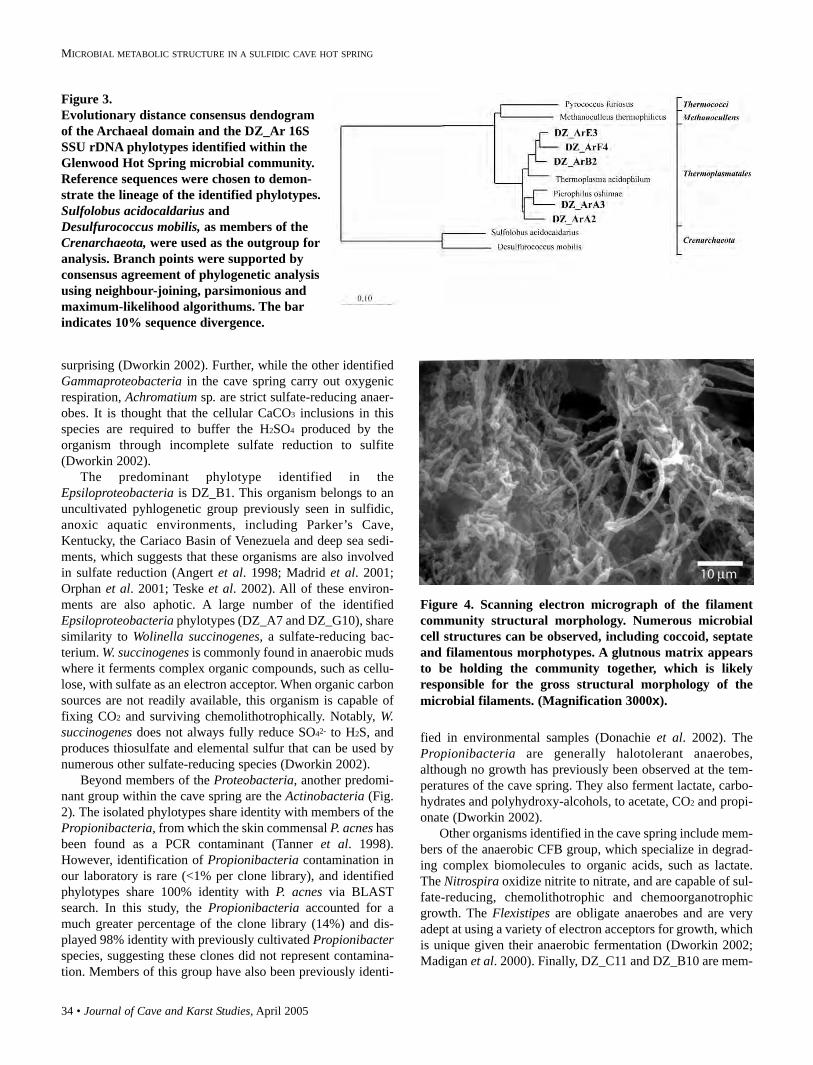
34 • Journal of Cave and Karst Studies, April 2005
MICROBIAL METABOLIC STRUCTURE IN A SULFIDIC CAVE HOT SPRING
surprising (Dworkin 2002). Further, while the other identifiedGammaproteobacteria in the cave spring carry out oxygenicrespiration, Achromatium sp. are strict sulfate-reducing anaer-obes. It is thought that the cellular CaCO3 inclusions in thisspecies are required to buffer the H2SO4 produced by theorganism through incomplete sulfate reduction to sulfite(Dworkin 2002).
The predominant phylotype identified in theEpsiloproteobacteria is DZ_B1. This organism belongs to anuncultivated pyhlogenetic group previously seen in sulfidic,anoxic aquatic environments, including Parker’s Cave,Kentucky, the Cariaco Basin of Venezuela and deep sea sedi-ments, which suggests that these organisms are also involvedin sulfate reduction (Angert et al. 1998; Madrid et al. 2001;Orphan et al. 2001; Teske et al. 2002). All of these environ-ments are also aphotic. A large number of the identifiedEpsiloproteobacteria phylotypes (DZ_A7 and DZ_G10), sharesimilarity to Wolinella succinogenes, a sulfate-reducing bac-terium. W. succinogenes is commonly found in anaerobic mudswhere it ferments complex organic compounds, such as cellu-lose, with sulfate as an electron acceptor. When organic carbonsources are not readily available, this organism is capable offixing CO2 and surviving chemolithotrophically. Notably, W.succinogenes does not always fully reduce SO42- to H2S, andproduces thiosulfate and elemental sulfur that can be used bynumerous other sulfate-reducing species (Dworkin 2002).
Beyond members of the Proteobacteria, another predomi-nant group within the cave spring are the Actinobacteria (Fig.2). The isolated phylotypes share identity with members of thePropionibacteria, from which the skin commensal P. acnes hasbeen found as a PCR contaminant (Tanner et al. 1998).However, identification of Propionibacteria contamination inour laboratory is rare (<1% per clone library), and identifiedphylotypes share 100% identity with P. acnes via BLASTsearch. In this study, the Propionibacteria accounted for amuch greater percentage of the clone library (14%) and dis-played 98% identity with previously cultivated Propionibacterspecies, suggesting these clones did not represent contamina-tion. Members of this group have also been previously identi-
fied in environmental samples (Donachie et al. 2002). ThePropionibacteria are generally halotolerant anaerobes,although no growth has previously been observed at the tem-peratures of the cave spring. They also ferment lactate, carbo-hydrates and polyhydroxy-alcohols, to acetate, CO2 and propi-onate (Dworkin 2002).
Other organisms identified in the cave spring include mem-bers of the anaerobic CFB group, which specialize in degrad-ing complex biomolecules to organic acids, such as lactate.The Nitrospira oxidize nitrite to nitrate, and are capable of sul-fate-reducing, chemolithotrophic and chemoorganotrophicgrowth. The Flexistipes are obligate anaerobes and are veryadept at using a variety of electron acceptors for growth, whichis unique given their anaerobic fermentation (Dworkin 2002;Madigan et al. 2000). Finally, DZ_C11 and DZ_B10 are mem-
Figure 3. Evolutionary distance consensus dendogramof the Archaeal domain and the DZ_Ar 16SSSU rDNA phylotypes identified within theGlenwood Hot Spring microbial community.Reference sequences were chosen to demon-strate the lineage of the identified phylotypes.Sulfolobus acidocaldarius andDesulfurococcus mobilis, as members of theCrenarchaeota, were used as the outgroup foranalysis. Branch points were supported byconsensus agreement of phylogenetic analysisusing neighbour-joining, parsimonious andmaximum-likelihood algorithums. The barindicates 10% sequence divergence.
Figure 4. Scanning electron micrograph of the filamentcommunity structural morphology. Numerous microbialcell structures can be observed, including coccoid, septateand filamentous morphotypes. A glutnous matrix appearsto be holding the community together, which is likelyresponsible for the gross structural morphology of themicrobial filaments. (Magnification 3000x).
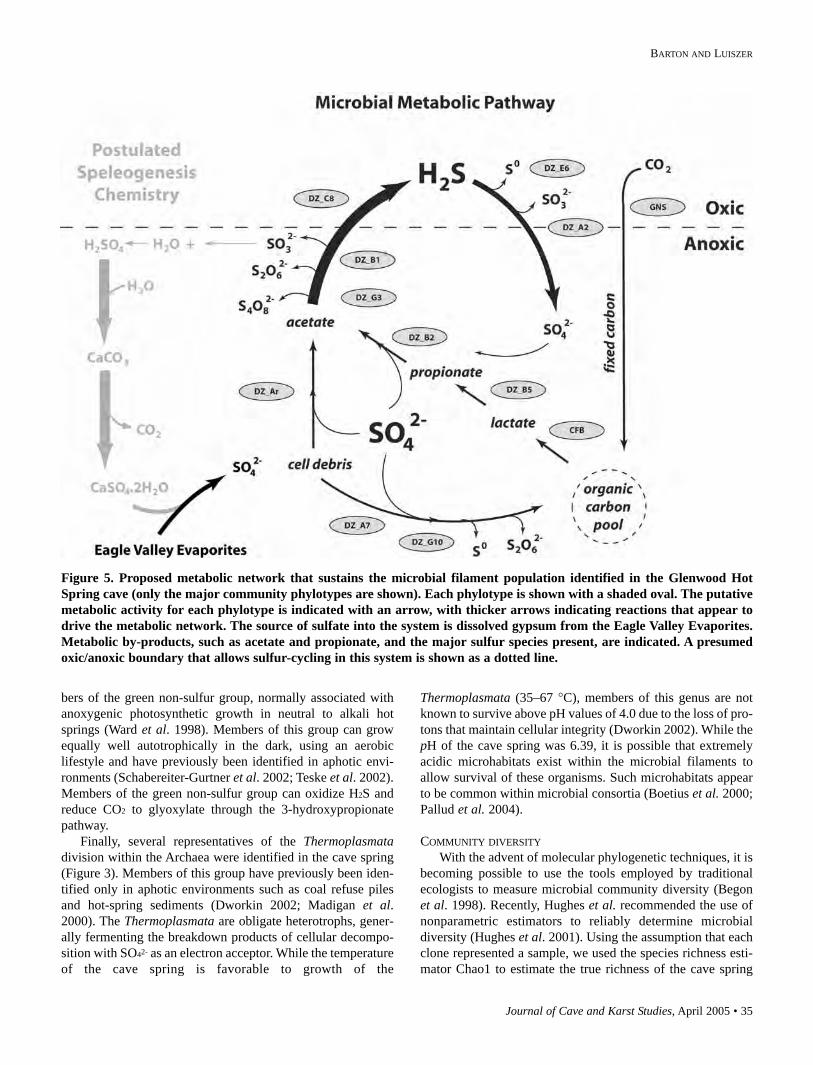
Journal of Cave and Karst Studies, April 2005 • 35
BARTON AND LUISZER
bers of the green non-sulfur group, normally associated withanoxygenic photosynthetic growth in neutral to alkali hotsprings (Ward et al. 1998). Members of this group can growequally well autotrophically in the dark, using an aerobiclifestyle and have previously been identified in aphotic envi-ronments (Schabereiter-Gurtner et al. 2002; Teske et al. 2002).Members of the green non-sulfur group can oxidize H2S andreduce CO2 to glyoxylate through the 3-hydroxypropionatepathway.
Finally, several representatives of the Thermoplasmatadivision within the Archaea were identified in the cave spring(Figure 3). Members of this group have previously been iden-tified only in aphotic environments such as coal refuse pilesand hot-spring sediments (Dworkin 2002; Madigan et al.2000). The Thermoplasmata are obligate heterotrophs, gener-ally fermenting the breakdown products of cellular decompo-sition with SO42- as an electron acceptor. While the temperatureof the cave spring is favorable to growth of the
Thermoplasmata (35–67 °C), members of this genus are notknown to survive above pH values of 4.0 due to the loss of pro-tons that maintain cellular integrity (Dworkin 2002). While thepH of the cave spring was 6.39, it is possible that extremelyacidic microhabitats exist within the microbial filaments toallow survival of these organisms. Such microhabitats appearto be common within microbial consortia (Boetius et al. 2000;Pallud et al. 2004).
COMMUNITY DIVERSITYWith the advent of molecular phylogenetic techniques, it is
becoming possible to use the tools employed by traditionalecologists to measure microbial community diversity (Begonet al. 1998). Recently, Hughes et al. recommended the use ofnonparametric estimators to reliably determine microbialdiversity (Hughes et al. 2001). Using the assumption that eachclone represented a sample, we used the species richness esti-mator Chao1 to estimate the true richness of the cave spring
Figure 5. Proposed metabolic network that sustains the microbial filament population identified in the Glenwood HotSpring cave (only the major community phylotypes are shown). Each phylotype is shown with a shaded oval. The putativemetabolic activity for each phylotype is indicated with an arrow, with thicker arrows indicating reactions that appear todrive the metabolic network. The source of sulfate into the system is dissolved gypsum from the Eagle Valley Evaporites.Metabolic by-products, such as acetate and propionate, and the major sulfur species present, are indicated. A presumedoxic/anoxic boundary that allows sulfur-cycling in this system is shown as a dotted line.
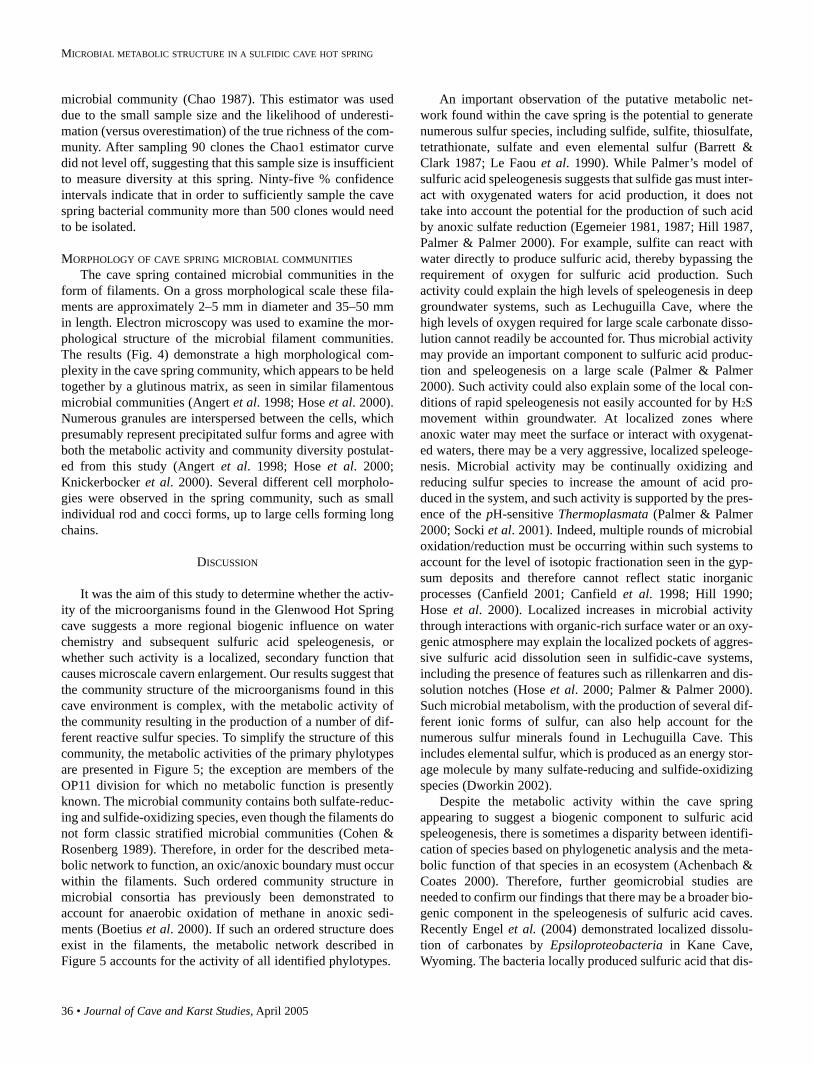
36 • Journal of Cave and Karst Studies, April 2005
MICROBIAL METABOLIC STRUCTURE IN A SULFIDIC CAVE HOT SPRING
microbial community (Chao 1987). This estimator was useddue to the small sample size and the likelihood of underesti-mation (versus overestimation) of the true richness of the com-munity. After sampling 90 clones the Chao1 estimator curvedid not level off, suggesting that this sample size is insufficientto measure diversity at this spring. Ninty-five % confidenceintervals indicate that in order to sufficiently sample the cavespring bacterial community more than 500 clones would needto be isolated.
MORPHOLOGY OF CAVE SPRING MICROBIAL COMMUNITIESThe cave spring contained microbial communities in the
form of filaments. On a gross morphological scale these fila-ments are approximately 2–5 mm in diameter and 35–50 mmin length. Electron microscopy was used to examine the mor-phological structure of the microbial filament communities.The results (Fig. 4) demonstrate a high morphological com-plexity in the cave spring community, which appears to be heldtogether by a glutinous matrix, as seen in similar filamentousmicrobial communities (Angert et al. 1998; Hose et al. 2000).Numerous granules are interspersed between the cells, whichpresumably represent precipitated sulfur forms and agree withboth the metabolic activity and community diversity postulat-ed from this study (Angert et al. 1998; Hose et al. 2000;Knickerbocker et al. 2000). Several different cell morpholo-gies were observed in the spring community, such as smallindividual rod and cocci forms, up to large cells forming longchains.
DISCUSSION
It was the aim of this study to determine whether the activ-ity of the microorganisms found in the Glenwood Hot Springcave suggests a more regional biogenic influence on waterchemistry and subsequent sulfuric acid speleogenesis, orwhether such activity is a localized, secondary function thatcauses microscale cavern enlargement. Our results suggest thatthe community structure of the microorganisms found in thiscave environment is complex, with the metabolic activity ofthe community resulting in the production of a number of dif-ferent reactive sulfur species. To simplify the structure of thiscommunity, the metabolic activities of the primary phylotypesare presented in Figure 5; the exception are members of theOP11 division for which no metabolic function is presentlyknown. The microbial community contains both sulfate-reduc-ing and sulfide-oxidizing species, even though the filaments donot form classic stratified microbial communities (Cohen &Rosenberg 1989). Therefore, in order for the described meta-bolic network to function, an oxic/anoxic boundary must occurwithin the filaments. Such ordered community structure inmicrobial consortia has previously been demonstrated toaccount for anaerobic oxidation of methane in anoxic sedi-ments (Boetius et al. 2000). If such an ordered structure doesexist in the filaments, the metabolic network described inFigure 5 accounts for the activity of all identified phylotypes.
An important observation of the putative metabolic net-work found within the cave spring is the potential to generatenumerous sulfur species, including sulfide, sulfite, thiosulfate,tetrathionate, sulfate and even elemental sulfur (Barrett &Clark 1987; Le Faou et al. 1990). While Palmer’s model ofsulfuric acid speleogenesis suggests that sulfide gas must inter-act with oxygenated waters for acid production, it does nottake into account the potential for the production of such acidby anoxic sulfate reduction (Egemeier 1981, 1987; Hill 1987,Palmer & Palmer 2000). For example, sulfite can react withwater directly to produce sulfuric acid, thereby bypassing therequirement of oxygen for sulfuric acid production. Suchactivity could explain the high levels of speleogenesis in deepgroundwater systems, such as Lechuguilla Cave, where thehigh levels of oxygen required for large scale carbonate disso-lution cannot readily be accounted for. Thus microbial activitymay provide an important component to sulfuric acid produc-tion and speleogenesis on a large scale (Palmer & Palmer2000). Such activity could also explain some of the local con-ditions of rapid speleogenesis not easily accounted for by H2Smovement within groundwater. At localized zones whereanoxic water may meet the surface or interact with oxygenat-ed waters, there may be a very aggressive, localized speleoge-nesis. Microbial activity may be continually oxidizing andreducing sulfur species to increase the amount of acid pro-duced in the system, and such activity is supported by the pres-ence of the pH-sensitive Thermoplasmata (Palmer & Palmer2000; Socki et al. 2001). Indeed, multiple rounds of microbialoxidation/reduction must be occurring within such systems toaccount for the level of isotopic fractionation seen in the gyp-sum deposits and therefore cannot reflect static inorganicprocesses (Canfield 2001; Canfield et al. 1998; Hill 1990;Hose et al. 2000). Localized increases in microbial activitythrough interactions with organic-rich surface water or an oxy-genic atmosphere may explain the localized pockets of aggres-sive sulfuric acid dissolution seen in sulfidic-cave systems,including the presence of features such as rillenkarren and dis-solution notches (Hose et al. 2000; Palmer & Palmer 2000).Such microbial metabolism, with the production of several dif-ferent ionic forms of sulfur, can also help account for thenumerous sulfur minerals found in Lechuguilla Cave. Thisincludes elemental sulfur, which is produced as an energy stor-age molecule by many sulfate-reducing and sulfide-oxidizingspecies (Dworkin 2002).
Despite the metabolic activity within the cave springappearing to suggest a biogenic component to sulfuric acidspeleogenesis, there is sometimes a disparity between identifi-cation of species based on phylogenetic analysis and the meta-bolic function of that species in an ecosystem (Achenbach &Coates 2000). Therefore, further geomicrobial studies areneeded to confirm our findings that there may be a broader bio-genic component in the speleogenesis of sulfuric acid caves.Recently Engel et al. (2004) demonstrated localized dissolu-tion of carbonates by Epsiloproteobacteria in Kane Cave,Wyoming. The bacteria locally produced sulfuric acid that dis-
Journal of Cave and Karst Studies, April 2005 • 37
BARTON AND LUISZER
solved the host rock, leaving behind obvious solution pocketsfrom the microbial metabolic activity. Further, these investiga-tors demonstrated that dissolved H2S in the cave spring waterentering the cave was quickly consumed by sulfide-oxidizingbacteria before it could generate inorganic sulfuric acid.However, our results are based on a free-floating microbialcommunity that does not interact with the host rock, suggest-ing that reactive sulfur species produced by these organismsmust enter the water directly. It should be noted that in cavessuch as Cueva de Villa Luz, Mexico, the anoxic water enteringthe cave system, where the dissolved H2S has not yet had theopportunity to interact with O2, is slightly acidic, while oxy-genated inlets into the system have a pH above 7. As the mostoxygenated waters entering this system have the highest pH,this suggests that the oxygen does not sufficiently interact withthe hydrogen sulfide to acidify the water in these inlets (A.Palmer, personal communication 2004). Further, the largenumber of microbial filaments found within the Cueva de VillaLuz inlets indicates an active subsurface microbial communitybelow the cave, with the anoxic nature of the water reflectingthe microbial consumption of available oxygen (Lavoie, per-sonal communication 2004). Such observations are in agree-ment with our hypothesis as, after the oxygen has been con-sumed within this system, sulfate will continue to be reducedto sulfite with the associated production of sulfuric acid.
Our results remain a preliminary, descriptive investigationof the metabolic activity of a microbial cave community thatmay be involved in biospeleogenesis. While comparisons aremade with other sulfuric-acid cave systems, all these systemswere formed through the activity of sulfidic waters well belowthe conditions of temperature found in Glenwood Hot Springs.While there may be significant differences in communitystructure between these systems, many of the identified phylo-types in our study are also capable of growth in more temper-ate conditions. Therefore, additional investigations are neededto confirm our hypothesis, including comparative studies withother springs, the distinct observation of reactive sulfur speciesproduction by such communities, and the direct observation ofcalcium carbonate dissolution by metabolic by-products ofcommunity growth.
ACKNOWLEDGEMENTS
The authors wish to thank the staff of Glenwood HotSprings for their support and access to the sampling area,Harvey DuChene for his expert knowledge of the geology ofGlenwood Springs, Jennifer Hughes for much-needed guid-ance with the statistical analysis, and Drs. Kathleen Lavoie,Diana Northup and Arthur Palmer for critical evaluations thatgreatly improved the quality of this manuscript. This work wassupported in part by a grant from the National ScienceFoundation EPSCoR Program, The Kentucky Academy ofScience and the National Speleological Society to HAB.
REFERENCES
Achenbach, L.A., & Coates, J.D., 2000, Disparity between bacterial phyloge-ny and physiology: American Society for Microbiology News, v. 66, p.714–715.
Altschul, S.F., Madden, T.L., Schaffer, A.J., Zhang, J., Zhang, Z., Miller, W.,& Lipman, D.J., 1997, Gapped BLAST and PSI-BLAST: a new genera-tion of protein database search programs: Nucleic Acids Research, v. 25,p. 3389–3402.
Amann, R.I., Ludwig, W., & Schleifer, K.H., 1995, Phylogenetic identificationand in situ detection of individual microbial cells without cultivation:Microbiological Reviews, v. 59, p. 143–169.
Angert, E.R., Northup, D.E., Reysenbach, A.-L., Peek, A.S., Goebel, B.M., &Pace, N.R., 1998, Molecular phylogenetic analysis of a bacterial commu-nity in Sulphur River, Parker Cave, Kentucky: American Mineralogist, v.83, p. 1583–1592.
Barrett, E.L., & Clark, M.A., 1987, Tetrathionate reduction and production ofhydrogen sulfide from thiosulfate: Microbiological Reviews, v. 51, p.192–205.
Begon, M., Harper, J.L., & Townsend, C.R., 1998, Ecology: individuals, pop-ulations and communities: Blackwell Scientific Publications, Cambridge,Massachusetts, p. 1068.
Boetius, A., Ravenschlag, K., Schubert, C.J., Rickert, D., Widdle, F., Gieseke,A., Amann, R., Jorgensen, B.B., Witte, U., & Pfannkuche, O., 2000, Amarine microbial consortium apparently mediating anaerobic oxidation ofmethane: Nature, v. 407, p. 623–626.
Bond, P.L., Hugenholtz, P., Keller, J., & Blackall, L.L., 1995, Bacterial com-munity structures of phosphate-removing and non-phosphate-removingactivated sludges from sequencing batch reactors: Applied andEnvironmental Microbiology, v. 61, p. 1910–1916.
Canfield, D.E., 2001, Isotope fractionation by natural populations of sulfate-reducing bacteria: Geochemica et Cosmochimica Acta, v .65, p.1117–1124.
Canfield, D.E., Thamdrup, B., & Fleischer, S., 1998, Isotope fractionation andsulfur metabolism by pure and enriched cultures of elemental sulfur-dis-proportioning bacteria: Limnology and Oceanography, v. 43, p. 253–264.
Chao, A., 1987, Estimating the population size for capture-recapture data withunequal catchability: Biometrics, v. 43, p. 783–791.
Cohen, Y., & Rosenberg, E., 1989, Microbial Mats: Physiological ecology ofbenthic microbial communities: American Society for Microbiology,Washington, D.C.
Cole, J.R., Chai, B., Marsh, T.L., Farris, R.J., Wang, Q., Kulam, S.A.,Chandra, S., McGarrell, D.M., Schmidt, T.M., Garrity, G.M. & Tiedje,J.M., 2003, The Ribosomal Database Project (RDP-II): Previewing a newautoaligner that allows regular updates and the new prokaryotic taxono-my. Nucleic Acids Research, v. 31, p. 442–443.
Colwell, R.K., 1997, EstimateS: Statistical estimation of species richness andshared species from samples.
Davis, D.G., 1980, Cave development in the Guadalupe Mountains: A criticalreview of recent hypotheses: NSS Bulletin, v. 42, p. 42–48
Donachie, S.P., Hou, S., & Alam, M., 2002, Diverse uncultured and culturedbacteria in inland waters of remote Hawaiian islands: Hypersaline LakeLaysan and a brackish pond on Pearl and Hermes Atoll: Unpublishedresults.
Dworkin, M., 2002, The Prokaryotes: An evolving electronic resource for themicrobiological community. Springer-Verlag, New York.http://link.springer-ny.com/link/service/books/ 10125
Duchene, H.R., Barton, H.A. & Luiszer, F.G., 2003, Geological and biologicalfeatures of Glenwood Cavern, Glenwood Springs, Colorado. in Peterson,K.M., Olson, T.M., & Anderson, D.S., eds., Piceance Basin 2003 GuideBook: Denver, Colorado, The Rocky Mountain Association of Geologists,460 p.
Egemeier, S.J., 1981, Cavern development by thermal waters: NSS Bulletin, v.43, p. 31–51.
Egemeier, S.J., 1987, A theory for the origin of Calsbad Cavern: NSS Bulletin,v. 49, p. 73–76.
Engel, A.S., Stern, L.A., & Bennett, P.C., 2004, Microbial contributions tocave formation: New insights into sulfuric acid speleogenesis: Geology, v.32, p. 369–372.
38 • Journal of Cave and Karst Studies, April 2005
MICROBIAL METABOLIC STRUCTURE IN A SULFIDIC CAVE HOT SPRING
Geldon, A.L., 1989, Hydrogeology of the Leadville Limestone and other pale-ozoic rocks in northwestern Colorado, with results of aquifer tests atGlenwood Springs: US Geological Survey, p. 96.
Hill, C.A., 1987, Geology of Carlsbad Cavern and other caves in theGuadalupe Mountains, New Mexico and Texas: New Mexico Bureau ofMines and Mineral Resources Bulletin, 117, p. 150.
Hill, C.A., 1990, Sulfuric acid speleogenesis of Carlsbad Cavern and its rela-tionship to hydrocarbons, Delaware Basin, New Mexico and Texas:American Association of Petrol. Geologists Bulletin, v. 74, p. 1685–1694.
Hose, L.D., & Pisarowicz, J.A., 1999, Cueva de Villa Luz, Tabasco, Mexico:Reconnaissance study of an active sulfur spring cave and ecosystem:Journal of Cave and Karst Studies, v .61, p. 13–21.
Hose, L.D., Palmer, A.N., Palmer, M.V., Northup, D.E., Boston, P.J., &DuChene, H.R., 2000, Microbiology and geochemistry in a hydrogen-sul-fide-rich karst environment: Chemical Geology, v. 169, p. 399–423.
Hughes, J.B., Hellmann, J.J., Ricketts, T.H., & Bohannan, B.J.M., 2001,Counting the uncountable: Statistical approaches to estimating microbialdiversity: Applied and Environmental Microbiology, v.67, p. 4399–4406.
Jagnow, D.H., 1978, Geology and speleogenesis of Ogle Cave, New Mexico:NSS Bulletin, v. 40, p. 7–18.
Klimchouk, A.B., Ford, D.C., Palmer, A.N., & Dreybrodt, W., 2000,Speleogenesis: Evolution of Karstic Aquifers: National SpeleologicalSociety, Huntsville, AL, p. 528.
Klimchouk, A.B., Nasedkin, V.M., & Cunningham, K.I., 1995, Speleothems ofaerosol origin. National Speleological Society Bulletin, v. 57, p. 31–42.
Knickerbocker, C., Nordstrom, D.K., & Southam, G., 2000, The role of ‘bleb-bing’ in overcoming the hydrophobic barrier during biooxidation of ele-mental sulfur by Thiobacillus thiooxidans: Chemical Geology, v. 169, p.425–433.
Kuske, C.R., Barnes, S.M., & Busch, J.D., 1997, Diverse uncultivated bacter-ial groups from soils of the arid Southwestern United States that are pre-sent in many geographic regions: Applied and EnvironmentalMicrobiology, v. 63, p. 3614–3621.
Le Faou, A., Rajagopal, B.S., Daniels, L., & Faugue, G., 1990, Thiosulfate,polythionates and elemental sulfur assimilation and reduction in the bac-terial world: FEMS Microbiology Reviews, v. 75, p. 351–382.
Lopez-Garcia, P., Gaill, F., & Moreira, D., 2002, Wide bacterial diversity asso-ciated with tubes of the vent worm Riftia pachyptila: EnvironmentalMicrobiology, v. 4, p. 204–215.
Madigan, M.T., Matinko, J.M., & Parker, J., 2000, Brock: Biology ofMicroorganisms. Prentice-Hall Inc., Upper Saddle River, N. J.
Madrid, V.M., Taylor, G.T., Scranton, M.I., & Chistoserdov, A.Y., 2001,Phylogenetic diversity of Bacterial and Archaeal communities in theanoxic zone of the Cariaco Basin: Applied and EnvironmentalMicrobiology, v. 67, p. 1663–1674.
Maltsev, V.A., & Malishevsky, D.I., 1990, On hydrothermal phases duringlater stages of the evolution of Cupp Coutunn Cave System, Turkmenia,USSR: National Speleological Society Bulletin, v. 52, p. 95–98.
Orphan, V.J., Hinrichs, K.-U., Ussler, W., Paull, C.K., Taylor, L.T., Sylva, S.P.,Hayes, J.M., & DeLong, E.F., 2001, Comparative analysis of methane-oxidizing Archaea and sulfate-reducing bacteria in anoxic marine sedi-ments: Applied and Environmental Microbiology, v. 67, p. 1922–1934.
Pace, N.R., 1997, A molecular view of microbial diversity and the biosphere:Science, v .276, p. 734–740.
Pallud, C., Dechesne, A., Gaudet, J.P., Debouzie, D. & Grundmann, G.L.,2004, Modification of spatial distribution of 2,4-dichlorophenoxyaceticacid degrader microhabitats during growth in soil columns: Applied andEnvironmental Microbiology, v. 70, p. 2709–2716.
Palmer, A.N., 1991, Origin and morphology of limestone caves: GeologicalSociety of America Bulletin, v. 103, p. 1–21.
Palmer, A.N. & Palmer, M., 2000. Hydrochemical interpretation of cave pat-terns in the Guadalupe Mountains, New Mexico: Journal of Cave andKarst Studies, v. 62, p. 91–108.
Queen, J.M., Palmer, A.N., & Palmer, M.V., 1977, Speleogenesis in theGuadalupe Mountains, New Mexico: Gypsum replacement of carbonateby brine mixing: Proceedings of the 7th International Congress ofSpeleology, Sheffield, England, p. 333–336.
Sarbu, S.M., Kane, T.C., & Kinkle, B.K., 1996, A chemoautotrophically basedcave ecosystem: Science, v. 272, p. 1953–1955.
Sarbu, S.M., Kinkle, B.K., Vlasceanu, L., Kane, T.C., & Popa, R., 1994,Microbiological characterization of a sulfide-rich groundwater ecosys-tem: Geomicrobiology Journal, v. 12, p. 175–182.
Schabereiter-Gurtner, C., Saiz-Jimenez, C., Pinar, G., Lubitz, W., & Rolleke,S., 2002, Altamira cave Paleolithic paintings harbor partly unknown bac-terial communities: FEMS Microbiology Letters, v. 211, p. 7–11.
Socki, R.A., Perry, E.C., & Romanek, C.S, 2001, Stable isotope systematics oftwo cenotes from Northern Yucatan, Mexico: Limnology andOceanography, Submitted.
Tanner, M.A., Goebel, B.M., Dojka, M.A., & Pace, N.R., 1998, Specific ribo-somal DNA sequences from diverse environmental settings correlate withexperimental contaminants: Applied and Environmental Microbiology, v.64, p. 3110–3113.
Teske, A., Hinrichs, K.-U., Edgcomb, V., de Vera Gomez, A., Kysela, D.,Sylva, S.P., Sogin, M.L., & Jannasch, H.W., 2002, Microbial diversity ofhydrothermal sediments in the Guaymas Basin: Evidence for anaerobicmethanotrophic communities: Applied and Environmental Microbiology,v. 68, p. 1994–2007.
Ward, D.M., Ferris, M.J., Nold, S.C., & Bateson, M.M., 1998, A natural viewof microbial diversity within hot spring cyanobacterial mat communities:Microbiology and Molecular Microbiological Reviews, v. 62, p.1353–1370.
Journal of Cave and Karst Studies, April 2005 • 39
Donald A. McFarlane and Joyce Lundberg - The 19th century excavation of Kent’s Cavern, England. Journal of Cave and Karst Studies, v. 67, no. 1, p. 39-47.
In the mid-19th century, the preeminent philosophical ques-tion facing the emergent archaeological and paleontologicalcommunity was the contentious issue of the “Antiquity ofMan”, and the controversial but apparent co-occurrence ofanthropogenic artifacts with the remains of extinct mega-fau-nal mammals. As early as 1771 Johann Esper had found humanbones intermingled with those of cave bear (Ursus spelaeus) inthe excavations at Zoolithenhöhle, Burggaillenreuth, Germany(Esper 1774). In 1792, John Frere reported stone hand-axesdeeply buried in gravels at Hoxne, England, commenting that [these axes] may tempt us to refer them to a very remote peri-od indeed; even beyond that of the present world (letter to theSociety of Antiquities, London, quoted in Daniel 1959).
Since the publication of James Hutton’s Theory of theEarth (1785), informed scientific opinion had consistentlypushed the presumed age of the Earth back in time, whereasthe tenure of Homo sapiens was still widely considered to beconstrained by the Ussherian timescale of ~6000 years whichhad been the foundation of Thomas Burnet’s influential SacredTheory of the Earth (1681).
When William Buckland published Reliquiae Diluvianae(Buckland 1823), he advanced an influential case for the tradi-tional Catastrophist view, interpreting cave deposits as directevidence of the Noachian Flood that had incorporated thebones of those doomed “antediluvian” species swept away inthe great Catastrophe. Buckland’s own excavations had uncov-ered human remains; most famously the “Red Lady” ofPaviland Cave, but Buckland argued that “she” (now known tobe “he”; North 1942) was…clearly not coeval with the ante-diluvian extinct species… (Buckland 1823, p. 89). Similarly,Buckland interpreted human remains from a cave atBurrington, England, as the remains of …wretches that per-ished in it, when the country was suffering under one of ournumerous military operations. (Buckland 1823, p. 164).Nevertheless, by 1838 Boucher de Perthes had reported “ante-diluvian” artifacts from gravels in the Somme Valley of north-ern France (de Perthes 1838).
Between 1825 and 1829, Father John MacEnery of TorreAbbey conducted a series of excavations in Kent’s Cavern, awell known site in Wellswood (now a suburb of Torquay),England. MacEnery broke through a laterally extensive flow-stone floor and recovered bones of extinct mammals and flintartifacts from the “cave earth” beneath. Because the flowstonefloor sealed the bones from modern intrusions, MacEnery rec-ognized that their co-occurrence with flint tools was signifi-cant. Buckland, however, disagreed, considering the tools tohave entered the cave earth in post-Diluvian times through“oven pits” dug through the flowstone by Celtic inhabitants(Kennard 1945). In light of MacEnery’s lack of experience ingeology and cave excavation, and the fact that the Great(entrance) Chamber of Kent’s Cavern had been extensivelymodified by centuries of use and souvenir hunting,MacEnery’s views carried little weight and did not appear until1859 (MacEnery 1859), 18 years after his death and by thensuperseded by work at Brixham Cave.
William Pengelly became intrigued with the problem of the“antiquity of Man” in the mid-1800s, and conducted someadditional excavations at Kent’s Cavern under the auspices ofthe Torquay Natural History Society in 1846. However, in1858 the discovery of Brixham Cave provided him–and theBritish geological community–with a unique opportunity. Thecave, which had no open entrance, was discovered duringquarrying operations on January 15, 1858. The owner, JohnPhilp, enlarged a small hole through which a quarryman’s“jumper” (crow-bar) had been lost and entered a cave with apristine flowstone floor which was embedded with a reindeer(Rangifer tarandus) antler. Breaking the floor, Philp discov-ered more fossil bones and within days had secured the sitewith a locked gate and opened it as a tourist attraction. WhenPengelly visited the site shortly afterwards he recognized thepotential for an excavation through a largely undisturbed flow-stone floor in a previously sealed cave: any artifacts that mightbe recovered from the bone stratum would be undeniably
THE 19TH CENTURY EXCAVATIONOF KENT’S CAVERN, ENGLAND
DONALD A. MCFARLANE
W. M. Keck Science Center, The Claremont Colleges, Claremont CA 91711, USA. [email protected] LUNDBERG
Department of Geography and Environmental Studies, Carleton University, Ottawa, ON K1S 5B6, CANADA
Between 1858 and 1880, William Pengelly developed revolutionary new techniques for the archeologi-cal and paleontological excavation of cave deposits. His work at Brixham Cave and Kent’s Cavern,England, yielded tens of thousands of specimens from the mid-Pleistocene to the Holocene, settled theintellectual debate over the co-existence of humans and extinct mammals, and accumulated an unparal-leled resource for continued study. Although the Brixham Cave work was thoroughly summarized inprint, Pengelly never published the plans of his much more thorough and extensive excavations at Kent’sCavern. Here we present a reconstructed plan of the Pengelly excavations that we hope will be a valu-able resource for future analyses of the archaeological and paleontological collections.
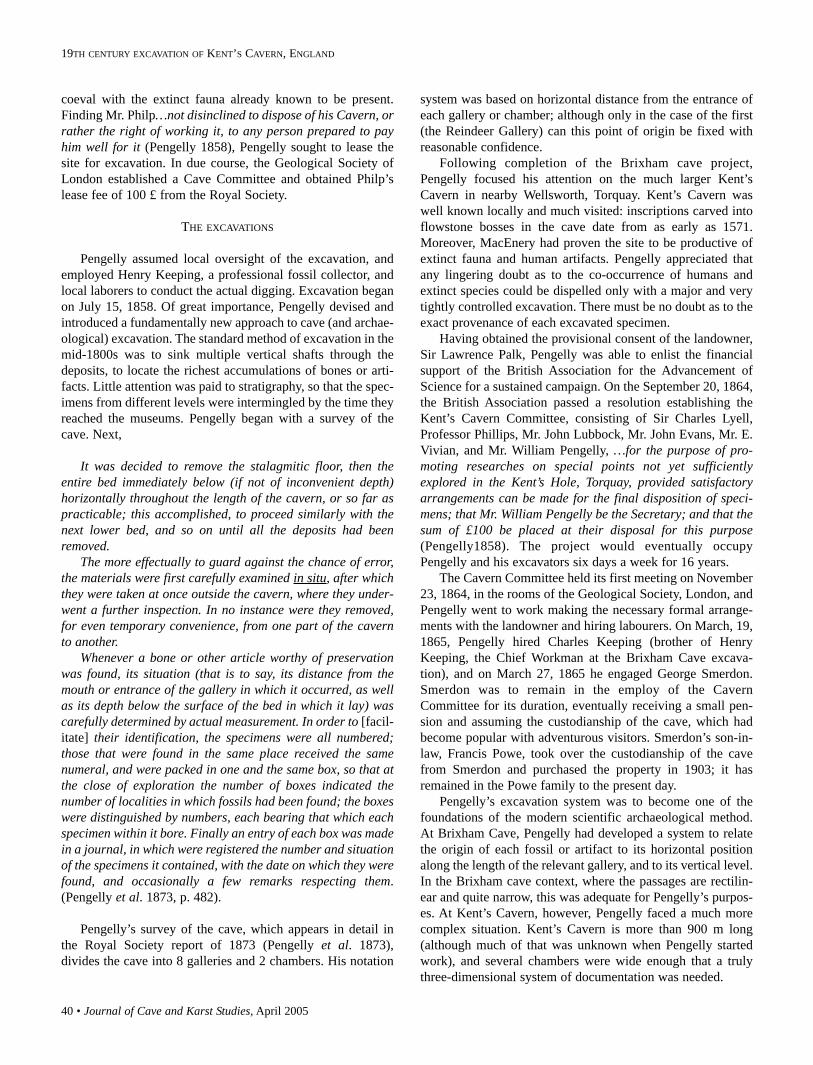
40 • Journal of Cave and Karst Studies, April 2005
19TH CENTURY EXCAVATION OF KENT’S CAVERN, ENGLAND
coeval with the extinct fauna already known to be present.Finding Mr. Philp…not disinclined to dispose of his Cavern, orrather the right of working it, to any person prepared to payhim well for it (Pengelly 1858), Pengelly sought to lease thesite for excavation. In due course, the Geological Society ofLondon established a Cave Committee and obtained Philp’slease fee of 100 £ from the Royal Society.
THE EXCAVATIONS
Pengelly assumed local oversight of the excavation, andemployed Henry Keeping, a professional fossil collector, andlocal laborers to conduct the actual digging. Excavation beganon July 15, 1858. Of great importance, Pengelly devised andintroduced a fundamentally new approach to cave (and archae-ological) excavation. The standard method of excavation in themid-1800s was to sink multiple vertical shafts through thedeposits, to locate the richest accumulations of bones or arti-facts. Little attention was paid to stratigraphy, so that the spec-imens from different levels were intermingled by the time theyreached the museums. Pengelly began with a survey of thecave. Next,
It was decided to remove the stalagmitic floor, then theentire bed immediately below (if not of inconvenient depth)horizontally throughout the length of the cavern, or so far aspracticable; this accomplished, to proceed similarly with thenext lower bed, and so on until all the deposits had beenremoved.
The more effectually to guard against the chance of error,the materials were first carefully examined in situ, after whichthey were taken at once outside the cavern, where they under-went a further inspection. In no instance were they removed,for even temporary convenience, from one part of the cavernto another.
Whenever a bone or other article worthy of preservationwas found, its situation (that is to say, its distance from themouth or entrance of the gallery in which it occurred, as wellas its depth below the surface of the bed in which it lay) wascarefully determined by actual measurement. In order to [facil-itate] their identification, the specimens were all numbered;those that were found in the same place received the samenumeral, and were packed in one and the same box, so that atthe close of exploration the number of boxes indicated thenumber of localities in which fossils had been found; the boxeswere distinguished by numbers, each bearing that which eachspecimen within it bore. Finally an entry of each box was madein a journal, in which were registered the number and situationof the specimens it contained, with the date on which they werefound, and occasionally a few remarks respecting them.(Pengelly et al. 1873, p. 482).
Pengelly’s survey of the cave, which appears in detail inthe Royal Society report of 1873 (Pengelly et al. 1873),divides the cave into 8 galleries and 2 chambers. His notation
system was based on horizontal distance from the entrance ofeach gallery or chamber; although only in the case of the first(the Reindeer Gallery) can this point of origin be fixed withreasonable confidence.
Following completion of the Brixham cave project,Pengelly focused his attention on the much larger Kent’sCavern in nearby Wellsworth, Torquay. Kent’s Cavern waswell known locally and much visited: inscriptions carved intoflowstone bosses in the cave date from as early as 1571.Moreover, MacEnery had proven the site to be productive ofextinct fauna and human artifacts. Pengelly appreciated thatany lingering doubt as to the co-occurrence of humans andextinct species could be dispelled only with a major and verytightly controlled excavation. There must be no doubt as to theexact provenance of each excavated specimen.
Having obtained the provisional consent of the landowner,Sir Lawrence Palk, Pengelly was able to enlist the financialsupport of the British Association for the Advancement ofScience for a sustained campaign. On the September 20, 1864,the British Association passed a resolution establishing theKent’s Cavern Committee, consisting of Sir Charles Lyell,Professor Phillips, Mr. John Lubbock, Mr. John Evans, Mr. E.Vivian, and Mr. William Pengelly, …for the purpose of pro-moting researches on special points not yet sufficientlyexplored in the Kent’s Hole, Torquay, provided satisfactoryarrangements can be made for the final disposition of speci-mens; that Mr. William Pengelly be the Secretary; and that thesum of £100 be placed at their disposal for this purpose(Pengelly1858). The project would eventually occupyPengelly and his excavators six days a week for 16 years.
The Cavern Committee held its first meeting on November23, 1864, in the rooms of the Geological Society, London, andPengelly went to work making the necessary formal arrange-ments with the landowner and hiring labourers. On March, 19,1865, Pengelly hired Charles Keeping (brother of HenryKeeping, the Chief Workman at the Brixham Cave excava-tion), and on March 27, 1865 he engaged George Smerdon.Smerdon was to remain in the employ of the CavernCommittee for its duration, eventually receiving a small pen-sion and assuming the custodianship of the cave, which hadbecome popular with adventurous visitors. Smerdon’s son-in-law, Francis Powe, took over the custodianship of the cavefrom Smerdon and purchased the property in 1903; it hasremained in the Powe family to the present day.
Pengelly’s excavation system was to become one of thefoundations of the modern scientific archaeological method.At Brixham Cave, Pengelly had developed a system to relatethe origin of each fossil or artifact to its horizontal positionalong the length of the relevant gallery, and to its vertical level.In the Brixham cave context, where the passages are rectilin-ear and quite narrow, this was adequate for Pengelly’s purpos-es. At Kent’s Cavern, however, Pengelly faced a much morecomplex situation. Kent’s Cavern is more than 900 m long(although much of that was unknown when Pengelly startedwork), and several chambers were wide enough that a trulythree-dimensional system of documentation was needed.
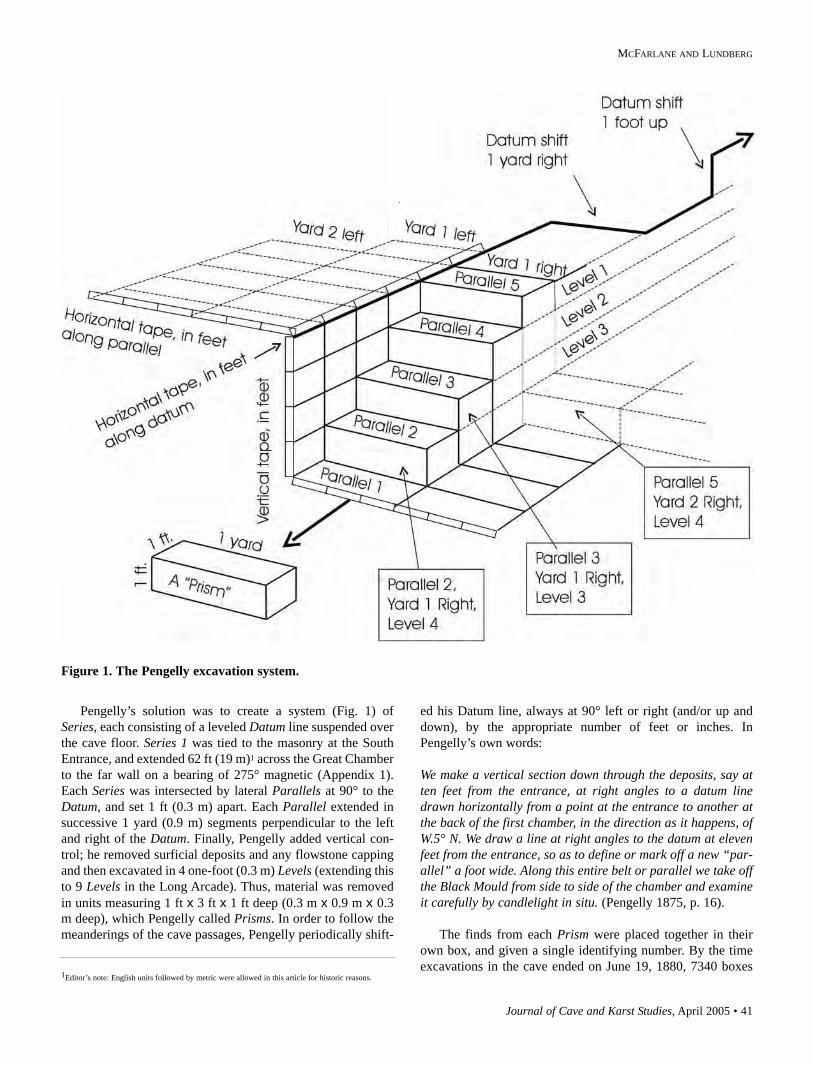
Journal of Cave and Karst Studies, April 2005 • 41
MCFARLANE AND LUNDBERG
Pengelly’s solution was to create a system (Fig. 1) ofSeries, each consisting of a leveled Datum line suspended overthe cave floor. Series 1 was tied to the masonry at the SouthEntrance, and extended 62 ft (19 m)1 across the Great Chamberto the far wall on a bearing of 275° magnetic (Appendix 1).Each Series was intersected by lateral Parallels at 90° to theDatum, and set 1 ft (0.3 m) apart. Each Parallel extended insuccessive 1 yard (0.9 m) segments perpendicular to the leftand right of the Datum. Finally, Pengelly added vertical con-trol; he removed surficial deposits and any flowstone cappingand then excavated in 4 one-foot (0.3 m) Levels (extending thisto 9 Levels in the Long Arcade). Thus, material was removedin units measuring 1 ft x 3 ft x 1 ft deep (0.3 m x 0.9 m x 0.3m deep), which Pengelly called Prisms. In order to follow themeanderings of the cave passages, Pengelly periodically shift-
ed his Datum line, always at 90° left or right (and/or up anddown), by the appropriate number of feet or inches. InPengelly’s own words:
We make a vertical section down through the deposits, say atten feet from the entrance, at right angles to a datum linedrawn horizontally from a point at the entrance to another atthe back of the first chamber, in the direction as it happens, ofW.5° N. We draw a line at right angles to the datum at elevenfeet from the entrance, so as to define or mark off a new “par-allel” a foot wide. Along this entire belt or parallel we take offthe Black Mould from side to side of the chamber and examineit carefully by candlelight in situ. (Pengelly 1875, p. 16).
The finds from each Prism were placed together in theirown box, and given a single identifying number. By the timeexcavations in the cave ended on June 19, 1880, 7340 boxes
Figure 1. The Pengelly excavation system.
1Editor’s note: English units followed by metric were allowed in this article for historic reasons.
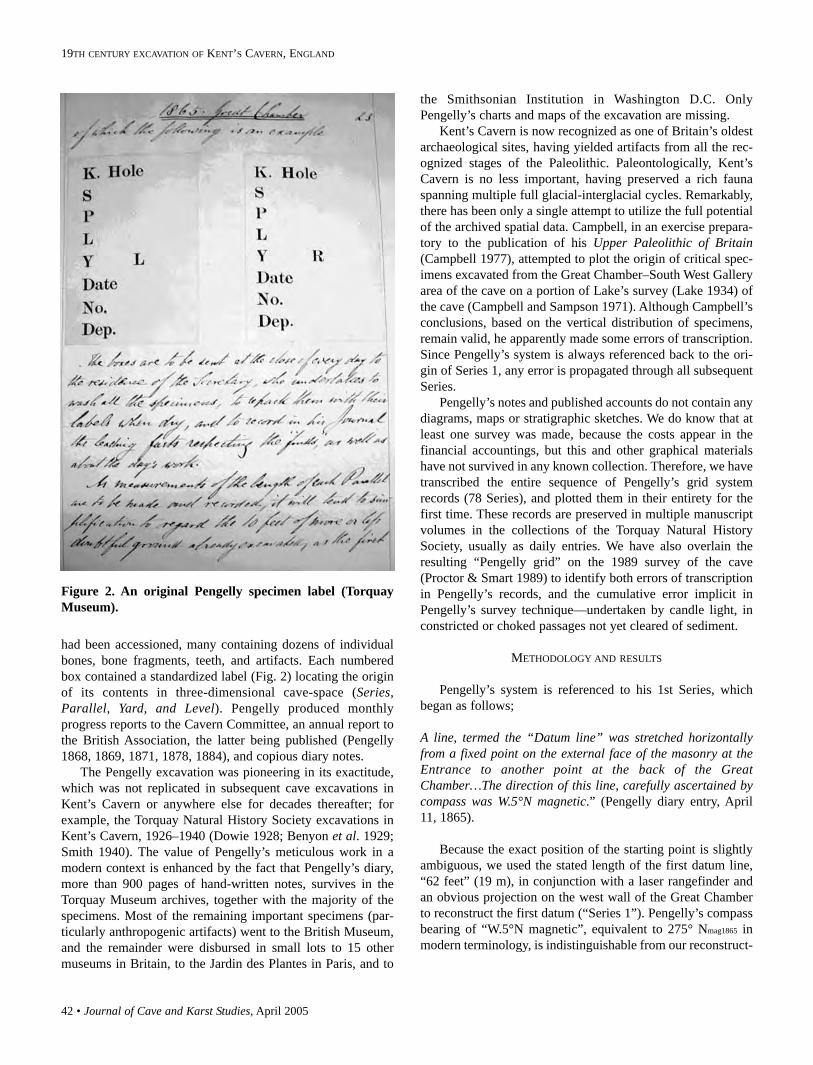
42 • Journal of Cave and Karst Studies, April 2005
19TH CENTURY EXCAVATION OF KENT’S CAVERN, ENGLAND
had been accessioned, many containing dozens of individualbones, bone fragments, teeth, and artifacts. Each numberedbox contained a standardized label (Fig. 2) locating the originof its contents in three-dimensional cave-space (Series,Parallel, Yard, and Level). Pengelly produced monthlyprogress reports to the Cavern Committee, an annual report tothe British Association, the latter being published (Pengelly1868, 1869, 1871, 1878, 1884), and copious diary notes.
The Pengelly excavation was pioneering in its exactitude,which was not replicated in subsequent cave excavations inKent’s Cavern or anywhere else for decades thereafter; forexample, the Torquay Natural History Society excavations inKent’s Cavern, 1926–1940 (Dowie 1928; Benyon et al. 1929;Smith 1940). The value of Pengelly’s meticulous work in amodern context is enhanced by the fact that Pengelly’s diary,more than 900 pages of hand-written notes, survives in theTorquay Museum archives, together with the majority of thespecimens. Most of the remaining important specimens (par-ticularly anthropogenic artifacts) went to the British Museum,and the remainder were disbursed in small lots to 15 othermuseums in Britain, to the Jardin des Plantes in Paris, and to
the Smithsonian Institution in Washington D.C. OnlyPengelly’s charts and maps of the excavation are missing.
Kent’s Cavern is now recognized as one of Britain’s oldestarchaeological sites, having yielded artifacts from all the rec-ognized stages of the Paleolithic. Paleontologically, Kent’sCavern is no less important, having preserved a rich faunaspanning multiple full glacial-interglacial cycles. Remarkably,there has been only a single attempt to utilize the full potentialof the archived spatial data. Campbell, in an exercise prepara-tory to the publication of his Upper Paleolithic of Britain(Campbell 1977), attempted to plot the origin of critical spec-imens excavated from the Great Chamber–South West Galleryarea of the cave on a portion of Lake’s survey (Lake 1934) ofthe cave (Campbell and Sampson 1971). Although Campbell’sconclusions, based on the vertical distribution of specimens,remain valid, he apparently made some errors of transcription.Since Pengelly’s system is always referenced back to the ori-gin of Series 1, any error is propagated through all subsequentSeries.
Pengelly’s notes and published accounts do not contain anydiagrams, maps or stratigraphic sketches. We do know that atleast one survey was made, because the costs appear in thefinancial accountings, but this and other graphical materialshave not survived in any known collection. Therefore, we havetranscribed the entire sequence of Pengelly’s grid systemrecords (78 Series), and plotted them in their entirety for thefirst time. These records are preserved in multiple manuscriptvolumes in the collections of the Torquay Natural HistorySociety, usually as daily entries. We have also overlain theresulting “Pengelly grid” on the 1989 survey of the cave(Proctor & Smart 1989) to identify both errors of transcriptionin Pengelly’s records, and the cumulative error implicit inPengelly’s survey technique—undertaken by candle light, inconstricted or choked passages not yet cleared of sediment.
METHODOLOGY AND RESULTS
Pengelly’s system is referenced to his 1st Series, whichbegan as follows;
A line, termed the “Datum line” was stretched horizontallyfrom a fixed point on the external face of the masonry at theEntrance to another point at the back of the GreatChamber…The direction of this line, carefully ascertained bycompass was W.5°N magnetic.” (Pengelly diary entry, April11, 1865).
Because the exact position of the starting point is slightlyambiguous, we used the stated length of the first datum line,“62 feet” (19 m), in conjunction with a laser rangefinder andan obvious projection on the west wall of the Great Chamberto reconstruct the first datum (“Series 1”). Pengelly’s compassbearing of “W.5°N magnetic”, equivalent to 275° Nmag1865 inmodern terminology, is indistinguishable from our reconstruct-
Figure 2. An original Pengelly specimen label (TorquayMuseum).
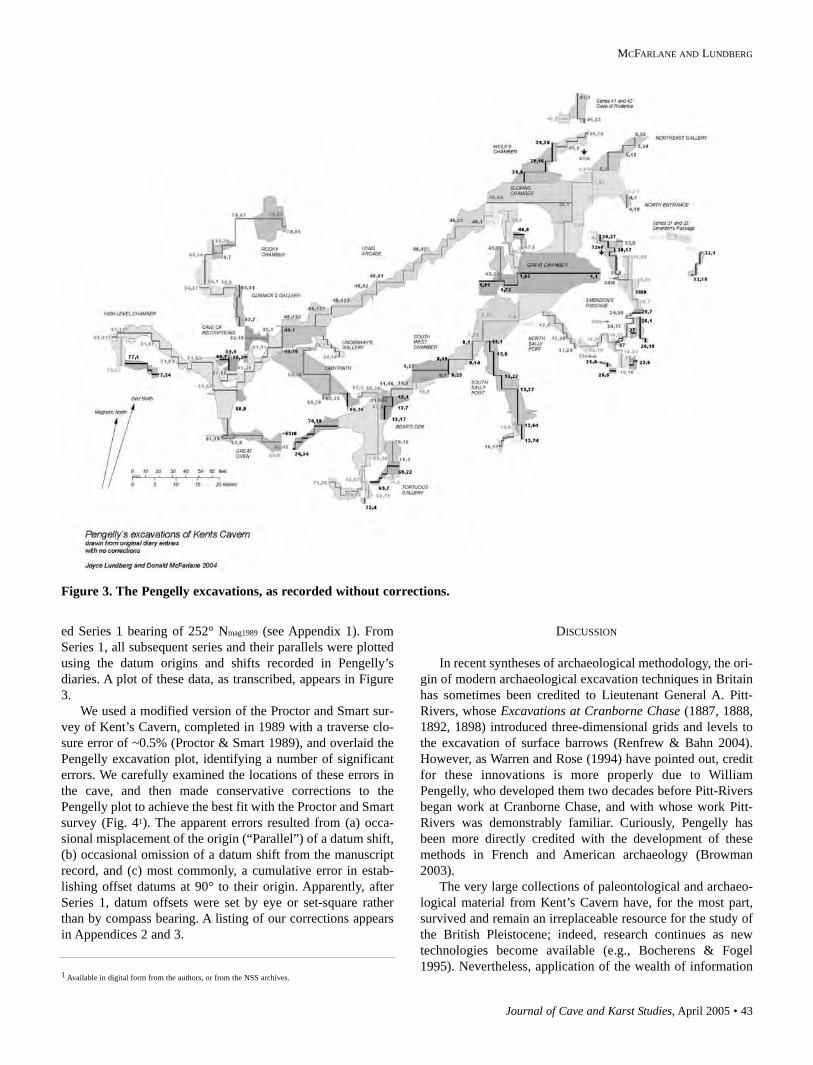
Journal of Cave and Karst Studies, April 2005 • 43
MCFARLANE AND LUNDBERG
ed Series 1 bearing of 252° Nmag1989 (see Appendix 1). FromSeries 1, all subsequent series and their parallels were plottedusing the datum origins and shifts recorded in Pengelly’sdiaries. A plot of these data, as transcribed, appears in Figure3.
We used a modified version of the Proctor and Smart sur-vey of Kent’s Cavern, completed in 1989 with a traverse clo-sure error of ~0.5% (Proctor & Smart 1989), and overlaid thePengelly excavation plot, identifying a number of significanterrors. We carefully examined the locations of these errors inthe cave, and then made conservative corrections to thePengelly plot to achieve the best fit with the Proctor and Smartsurvey (Fig. 41). The apparent errors resulted from (a) occa-sional misplacement of the origin (“Parallel”) of a datum shift,(b) occasional omission of a datum shift from the manuscriptrecord, and (c) most commonly, a cumulative error in estab-lishing offset datums at 90° to their origin. Apparently, afterSeries 1, datum offsets were set by eye or set-square ratherthan by compass bearing. A listing of our corrections appearsin Appendices 2 and 3.
DISCUSSION
In recent syntheses of archaeological methodology, the ori-gin of modern archaeological excavation techniques in Britainhas sometimes been credited to Lieutenant General A. Pitt-Rivers, whose Excavations at Cranborne Chase (1887, 1888,1892, 1898) introduced three-dimensional grids and levels tothe excavation of surface barrows (Renfrew & Bahn 2004).However, as Warren and Rose (1994) have pointed out, creditfor these innovations is more properly due to WilliamPengelly, who developed them two decades before Pitt-Riversbegan work at Cranborne Chase, and with whose work Pitt-Rivers was demonstrably familiar. Curiously, Pengelly hasbeen more directly credited with the development of thesemethods in French and American archaeology (Browman2003).
The very large collections of paleontological and archaeo-logical material from Kent’s Cavern have, for the most part,survived and remain an irreplaceable resource for the study ofthe British Pleistocene; indeed, research continues as newtechnologies become available (e.g., Bocherens & Fogel1995). Nevertheless, application of the wealth of information
Figure 3. The Pengelly excavations, as recorded without corrections.
1 Available in digital form from the authors, or from the NSS archives.
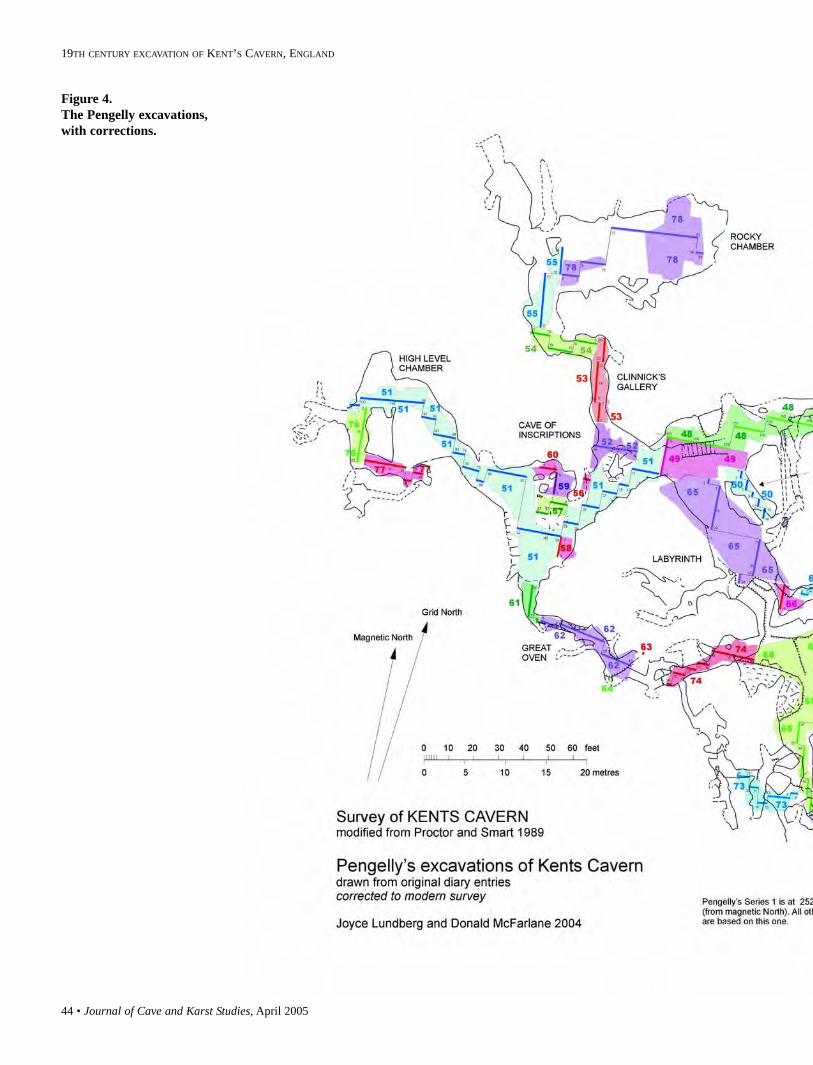
44 • Journal of Cave and Karst Studies, April 2005
19TH CENTURY EXCAVATION OF KENT’S CAVERN, ENGLAND
Figure 4. The Pengelly excavations, with corrections.
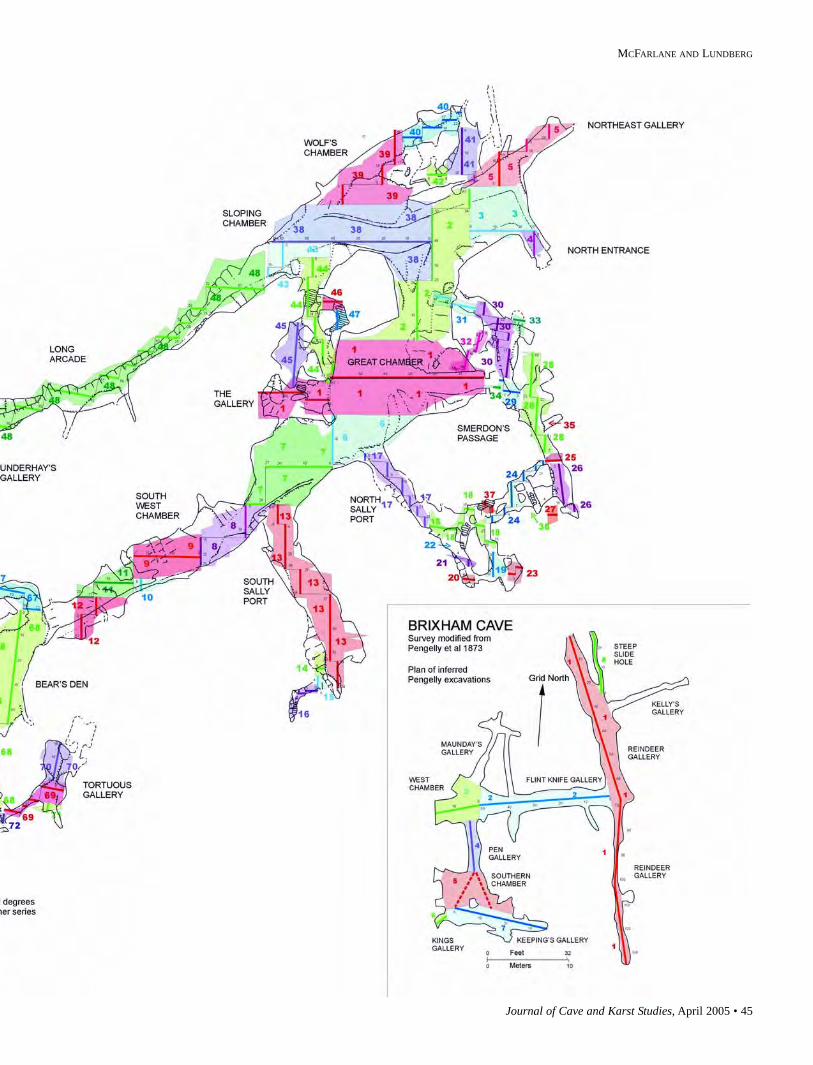
Journal of Cave and Karst Studies, April 2005 • 45
MCFARLANE AND LUNDBERG
46 • Journal of Cave and Karst Studies, April 2005
19TH CENTURY EXCAVATION OF KENT’S CAVERN, ENGLAND
preserved in Pengelly’s records has been hindered by the diffi-culty of extracting this information in the absence of a sum-mary report and plan of the excavations. The presentation ofsuch a plan in this study opens up new possibilities for theanalysis of the spatial information in the Kent’s Cavern collec-tions.
ACKOWLEDGEMENTS
We would like to thank Mr. Nick Powe, owner and manag-er of Kent’s Cavern, and Mr. Barry Chandler, AssistantCurator, Torquay Museum, for their support, encouragement,and unfettered access to the site and records under their care.Messrs Duncan Coe and Ian Morrison of English Nature kind-ly arranged for the necessary permissions at the national level.Dr. Andrew Currant of the Natural History Museum, London,assisted in the early planning. P. J. Watson and an anonymousreviewer provided useful comments on the manuscript. Theproject was funded in significant part by a grant to McFarlanethrough a Mellon Foundation faculty development grant toScripps and Harvey Mudd Colleges, and we thank LisaSullivan and Michael Lamkin for their support in this context.
REFERENCES
Benyon, F., Dowie, H.G., & Ogilvie, A.H., 1929, Report on the excavations atKent’s Cavern: Proceedings of the Torquay Natural History Society, v. 5,p. 237.
Bocherens, H. & Fogel, M.L., 1995, Trophic structure and climatic informa-tion from isotopic signatures in Pleistocene cave fauna of southernEngland: Journal of Archaeological Science, v. 22, p. 327–340.
Browman, D.L., 2003, Origins of Americanist stratigraphic excavation meth-ods, in J. Truncer, ed., Picking the Lock of Time: Gainesville, UniversityPress of Florida, p. 22–39.
Buckland, W., 1823, Reliquiae Diluvianae; or, observations on the organicremains contained in caves, fissures, and diluvial gravel, and other geo-logical phenomena, attesting to the action of an universal deluge. Murray,London, 303 p.
Burnet, T, 1681, Telluris Theoria Sacra; orbis nostril originem & mutationsgenerales, quas aut jam subiit, aut olim subiturus est, complectens. G.Kettilby, London.
Boucher de Perthes, J., 1838, De L’Homme Antèdiluvian et ses oeuvresTreuttel, Paris.
Campbell, J.B., 1977, The Upper Paleolithic of Britain. A study of man andnature in the Ice Age, vols I and II: Clarendon Press. Oxford.
Campbell, J. B. & Sampson, C. G., 1971, A new analysis of Kent’s Cavern,Devonshire, England: University of Oregon Anthropological Papers,No.3, 40 p.
Daniel, G E., 1959, The idea of Man’s antiquity: Scientific American, v. 201,p. 167–176
Dowie, H.G., 1928, Note on excavations in Kent’s cavern: Proceedings of thePrehistoric Society (East Anglia), v. 5, p. 306–307.
Esper, J.F., 1774, Ausführliche Nachricht von neuentdeckten Zoolithenunbekannter vierfüsiger Thiere, und denen sie enthaltenden, so wie ver-schiedenen andern, denkwürdigen Grüften der Obergebürgischen Landedes Marggrafthums Bayreuth: Knorr. Nuremberg. 148 p.
Hutton, J., 1785, Theory of the Earth; or an investigation of the Laws observ-able in the Composition, Dissolution, and Restoration of Land upon theGlobe: Transactions of the Royal Society of Edinburgh, v. 1, p. 209–304.
Kennard, A.S. 1945, The early digs in Kent’s Hole, Torquay. Proceedings ofthe Geologists Association 56, p. 156–213.
Lake, P.M.B., 1934, Map of Kent’s Cavern, in Rogers, E.H., Stratification ofthe cave earth in Kent’s Cavern: Proceedings of the DevonshireArchaeological Exploration Society 1954-1955, p. 1–25.
MacEnery, J., 1859, Cavern Researches. Simpkin, Marshall. London.NOAA, 2004, National Geophysical Data Center. http://www.ngdc.noaa.gov
/seg/potfld/declination.shtmlNorth, F.J., 1942, Paviland Cave, the “Red lady,” the deluge and William
Buckland: Annales of Science v. 5(2), p. 91–128.Pengelly, W., 1858, Manuscript notebook: Torquay Museum, England.Pengelly, W., 1868, The literature of Kent’s Cavern, Part 1: Transactions of the
Devonshire Association for the Advancement of Science, Literature andArt, v. 1, p. 469–522.
Pengelly, W., 1869, The literature of Kent’s Cavern, Part II: Transactions of theDevonshire Association for the Advancement of Science, Literature andArt, v. 3, p. 191–482.
Pengelly, W., 1871, The literature of Kent’s Cavern, Part III: Transactions ofthe Devonshire Association for the Advancement of Science, Literatureand Art, v. 4, p. 467–490.
Pengelly, W., 1875, Manuscript notebook: Torquay Museum.Pengelly, W., 1878, The literature of Kent’s Cavern, Part IV: Transactions of
the Devonshire Association for the Advancement of Science, Literatureand Art v. 10, p. 141–181.
Pengelly, W., 1884, The literature of Kent’s Cavern, Part V: Transactions of theDevonshire Association for the Advancement of Science, Literature andArt, v. 14, p. 189–434.
Pengelly, W., Busk, G., Evans, J., Prestwick, J., Falconer, H., & Ramsay A.,1873, Report on the exploration of Brixham Cave, conducted by a com-mittee of the Geological Society, and under the superintendence of Wm.Pengelly, Esq., FRS., aided by a local committee; with descriptions of theanimal remains by George Busk, Esq., F.R.S., and of the flint implementsby John Evans, Esq., F.R.S., Joseph Prestwich, F.R.S., F.G.S., &c.,Reporter: Philosophical Transactions of the Royal Society of London, v.163, p. 471–572.
Pitt-Rivers, A.H.L.F., 1887, Excavations in Cranborne Chase. Vol 1: PrivatelyPrinted.
Pitt-Rivers, A.H.L.F., 1888, Excavations in Cranborne Chase. Vol 2: PrivatelyPrinted.
Pitt-Rivers, A.H.L.F., 1892,. Excavations in Cranborne Chase. Vol 3: PrivatelyPrinted.
Pitt-Rivers, A.H.L.F., 1898, Excavations in Cranborne Chase. Vol 4: PrivatelyPrinted.
Proctor, C.J. & Smart, P.L., 1989, A new survey of Kent’s Cavern, Devon:Proceedings of the University of Bristol Spelaeological Society, v. 18(3)p. 422-429.
Renfrew, C. & Bahn, P., 2004, Archaeology, Theories, Methods, and Practice,4th Ed: Thames and Hudson Press.
Smith, R.A., 1940., Some recent finds in Kent’s Cavern: Proceedings of theTorquay Natural History Society, v. 8 p.59–73.
Warren, C.N. & Rose, S., 1994, William Pengelly’s techniques of archaeolog-ical excavation: Torquay Natural History Society, Publication No. 5. 40 p.

Journal of Cave and Karst Studies, April 2005 • 47
MCFARLANE AND LUNDBERG
Appendix 1. Series 1 Bearings
Pengelly 1865 “W. 5°N magnetic.”Magnetic declination at Kent’s Cavern in 1865 was -22.333° (pers. comm.
Susan MacMillan, British Geological Survey), making Pengelly’s bearingequivalent to 252.67° NGrid. Our plot of Series 1 from Pengelly’s notes andin-cave ground truthing is 252° Ngrid
Magnetic north on our survey is plotted for 1989, as per the Proctor andSmart (1989) survey. Nmag1989 was -5.816°, or 354.18° Ngrid (NOAA2004).
Appendix 2.
Corrections to the Pengelly Plot.
Series 1 drawn at 252 N° magnetic.
At 12th Series there is a cumulative offset of ~2 ft (0.6 m); Series 8 through 12corrected +1.2°.
Series 11and 12 shifted North 3 ft (0.9 m).
Series 14-15 overlap Series 13; Series 14-16 corrected with a shift 3.6 ft (1.1m) southwest.
North Sally Port.Origin of the 17th Series in the 6th Series is too far east. Corrected with a shiftof Series 17 through 35 of 5 ft (1.5 m) West (changes 6S/14P from an offset of18 ft (5.5 m) to offset of 13 ft (4.0 m))
Parallelogram shift of 17th Series by 6° S. (no change in E/W). This ends 17th
Series at the correct known landmark.
18th Series moved 3 ft (0.9 m) South.
Smerdon’s Passage–each series individually tied to passage.
24th Series; penultimate datum shifts recorded as Left (west) but MUST beRight (east).
Exact position of 37th Series relative to its origin in the 24th Series is veryambiguous in Pengelly’s notes; we have fitted it to available unexcavated pas-sage on left of 24th Series.
No obvious modification possible to 28th Series to make it fit. UNRE-SOLVED.
38th Series (and subsequent connected series) shifted 1.5 ft (0.5 m) North toeliminate overlap of excavations with 2nd Series.
Origin of 48th Series is ambiguous, leading to an error (impossible zig-zag inexcavation) at 48th Series. Possible unrecorded datum shift at 48th Series, 47th
Parallel. We have inserted a datum shift of 3ft (0.9 m) South.
Rocky Chamber offset, listed as 20 feet left, is too wide for passage (25 ft (8m) max) – reset to 15ft (5 m).
77th Series, final datum shift switched from Right to Left.
65th Series 1st datum shift moved 5 ft (1.5 m) left instead of right.
68th Series, 2nd datum shift switched from left to Right to bring end into pas-sage and connect line with 69th Series.
48th Series (Long Arcade) progressively deviates from the curvature of thepassage; we have corrected for this mis-alignment which therefore affects allsubsequent series.
29th Series has to start in the 23rd Parallel instead of 22nd Parallel.
37th Series; origin and directions ambiguous; fitted to passage.
41st series moved to 24th Parallel, 7 ft (2.1 m) right (from 22nd Parallel, 9 ft (3m) right)
46th direction not indicated in Pengelly notes- must be East
Appendix 3.
Since the position of each Series is dependent on the position of each preced-ing Series in the sequence, we list these sequences here. {Example; an error orcorrection in the 9th Series would affect the 10th, 11th and 12th Series but notthe 13th Series whose origin is in Sequence 3.} Series underlined and bold-faced are points of origin for subsequent Series.
Pengelly’s Series sequences:
1-2-3-4-5
1-6-7-8-9-10-11-12
7-13-14-15-16
6-17-18-19-20-21-22-23
18-24-25-26-27
25-28-29-30-31-32-33-34
2-38-39-40-41-42
38-43-44-45-46-47
43-48-49-50-51-76-77
51-52-53-54-55-78
51-56
51-57-59-60
51-58
51-76
51-58
51-61-62-63-64
49-65-66-67-68-69-70-71-72
68-73
68-74
48 • Journal of Cave and Karst Studies, April 2005
James P. Terry - Karst distribution and controls on Yoron-Jima, an emerged reef island in sub-tropical Japan. Journal of Cave and Karst Studies, v. 67, no. 1, p. 48-54.
Although there are a large number of both wholly carbon-ate and composite carbonate/volcanic islands in the humidtropical Pacific, there has been less attention given to Oceaniain the karst literature than elsewhere. This is, in part, a functionof the remoteness for research purposes of most of the small“outer” islands of the Pacific. The work by Ollier (1975) on theTrobriand Islands of Papua New Guinea, Montaggioni et al.(1985) on Makatea in French Polynesia, Strecker et al. (1986)on Santo island in Vanuatu, Mylroie et al. (2001) on Guam andTerry & Nunn (2003) on Niue are some exceptions. This paperdescribes Yoron Island of southwest Japan, a small raised lime-stone island in the center of the Ryukyu Island Arc chain (Fig.1). Yoron’s geology mainly comprises Miocene to Holoceneage carbonate rocks and deposits, uplifted to different eleva-tions above sea level. The island is partially karstified,although the distribution of karst features across the island isuneven. Yoron therefore presents an interesting opportunity forthe study of karst geomorphology on a small emerged carbon-ate island. The aim here is to examine the form and distribu-tion of closed depressions on Yoron Island and to interprettheir occurrence in terms of geological influences.
PHYSICAL SETTING
Yoron’s location is 27°01'N, 128°24'E, near the large vol-canic island of Okinawa to the southwest. The circumferencemeasures approximately 23 km and the land area covers just21 km². The resident population numbers around 6000. Mostof the native sub-tropical forest cover has been cleared. Sugarcane farming and beef cattle grazing are now the two predom-inant agricultural land uses. Yoron’s climate is subtropical,
with a mean annual temperature of 23°C and an annual pre-cipitation of approximately 2200 mm. Typhoons often bringtorrential rains during the summer and early autumn seasonsfrom July to September.
Yoron Island was slowly raised above sea level during thePleistocene (Omura 1972). Inland Yoron can be divided intoseveral main geomorphic zones, reflecting the influences ofuplift and structural geology. The western peninsula is a flatlimestone lowland between 5 m and 20 m above sea level.Traversing the island from NNW to SSE is an escarpmentoccurring along a pair of parallel faults. The scarp slope risesto 50–90 m elevation. The highest point of the island at 97 melevation lies along the top of the escarpment near its southernend. The north and eastern topography of Yoron, east of the topof the escarpment, is a series of low undulating hills, whichgradually lose altitude towards the east coast. These may rep-resent a series of denuded marine terraces indicating intermit-tent uplift processes or still-stands of paleo-sea level. Inlandfrom the eastern coast is an area of Holocene coralline depositsforming low relief dunes. The subdued relief in the easternsegment is broken by an unusual narrow arcuate ridge of out-cropping reef limestone called Uro Yama. The ridge is 20–100m wide, rising 10–20 m above the surrounding terrain.
Since Yoron’s bedrock geology mostly comprises perme-able carbonates, there are no permanent surface watercourses.Ephemeral streams drain the area below and to the west of thefault escarpment into Haki Bay and Chahana Bay. Within thelimestone bedrock beneath the surface, there exists a largefreshwater aquifer. In the eastern segment of the island, Momiiet al. (2001) calculated that this aquifer is 30–40 m thick, usinga numerical approach based upon measurements of the fresh-
KARST DISTRIBUTION AND CONTROLS ON YORON-JIMA,AN EMERGED REEF ISLAND IN SUB-TROPICAL JAPAN
JAMES P. TERRYHead of Geography Department, The University of the South Pacific, Private Mail Bag, Suva, FIJI ISLANDS
Yoron-jima is a small carbonate island located in the central Ryukyu Island Arc of southern Japan. Theisland was raised above sea level in the Quaternary period, and most of the 21 km² land area is under-lain by carbonate rock types associated with the regional Ryukyu Limestone Group. The island’s land-scape is characterized by many surface depressions. This paper describes Yoron’s closed depressions andinterprets their uneven spatial distribution. Some areas covered by unconsolidated Holocene deposits arealmost free of closed depressions. Elsewhere, depression clusters are observed on a variety of carbonaterocks. Small depressions (average long axis 76 m, area 2320 m²) tend to be shallow with regular ellipti-cal morphologies, and are densely clustered. These have developed on a low elevation, emerged marineplatform on the island’s western peninsula, where there has been minimal structural deformation of thecoral limestone bedrock. In contrast, larger (average long axis 103 m, area 4060 m²) and deeper closeddepressions (5–10 m), more often with irregular or star-shaped plans, have developed across the northand east-central region of Yoron, in association with 1.) outcrops of rhodolith limestone geology, 2.)major fault escarpments, and 3.) carbonate/non-carbonate geological boundaries. Aggressive dissolu-tion has also produced large elongated closed depressions trending along the northeast coast of Yoronclose to sea level, where tidal fluctuations control the salinity and surface height of the water table.Correlation with depressions elsewhere in the Ryukyu Islands on similar geology suggests that limestonesurface denudation rates on Yoron may be 5–10 mm/1000 yrs.
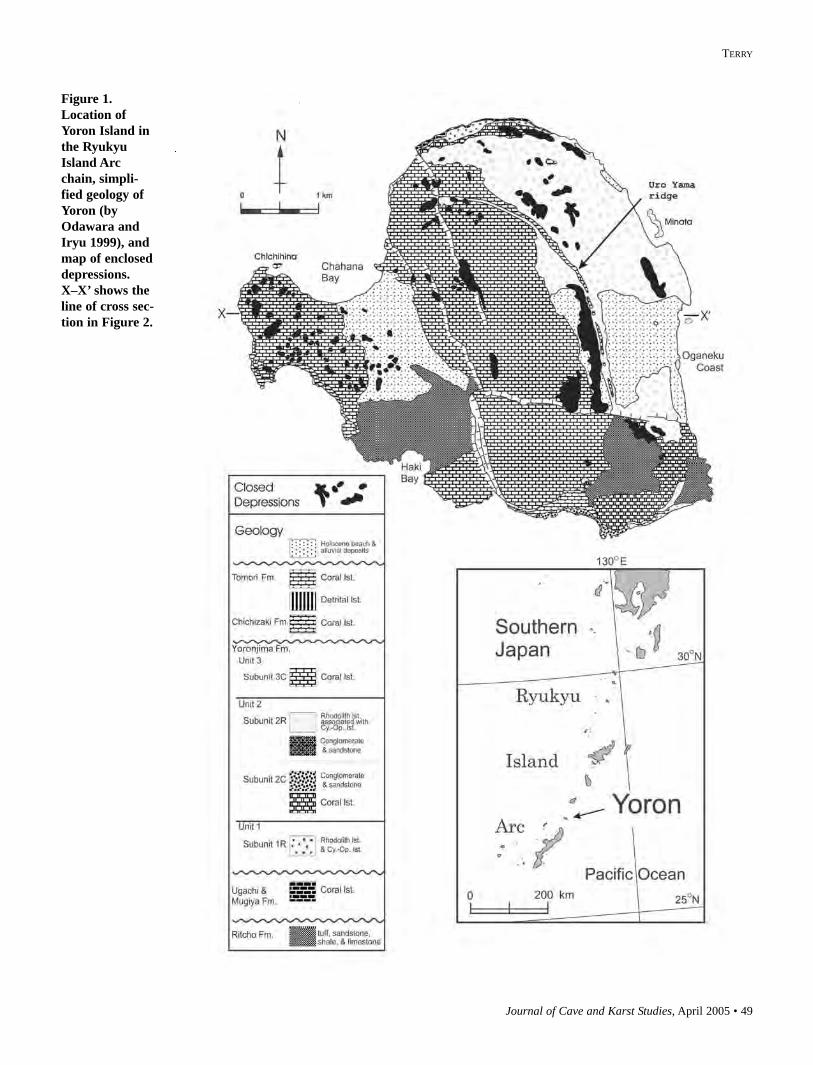
Journal of Cave and Karst Studies, April 2005 • 49
TERRY
Figure 1. Location ofYoron Island inthe RyukyuIsland Arcchain, simpli-fied geology ofYoron (byOdawara andIryu 1999), andmap of encloseddepressions.X–X’ shows theline of cross sec-tion in Figure 2.
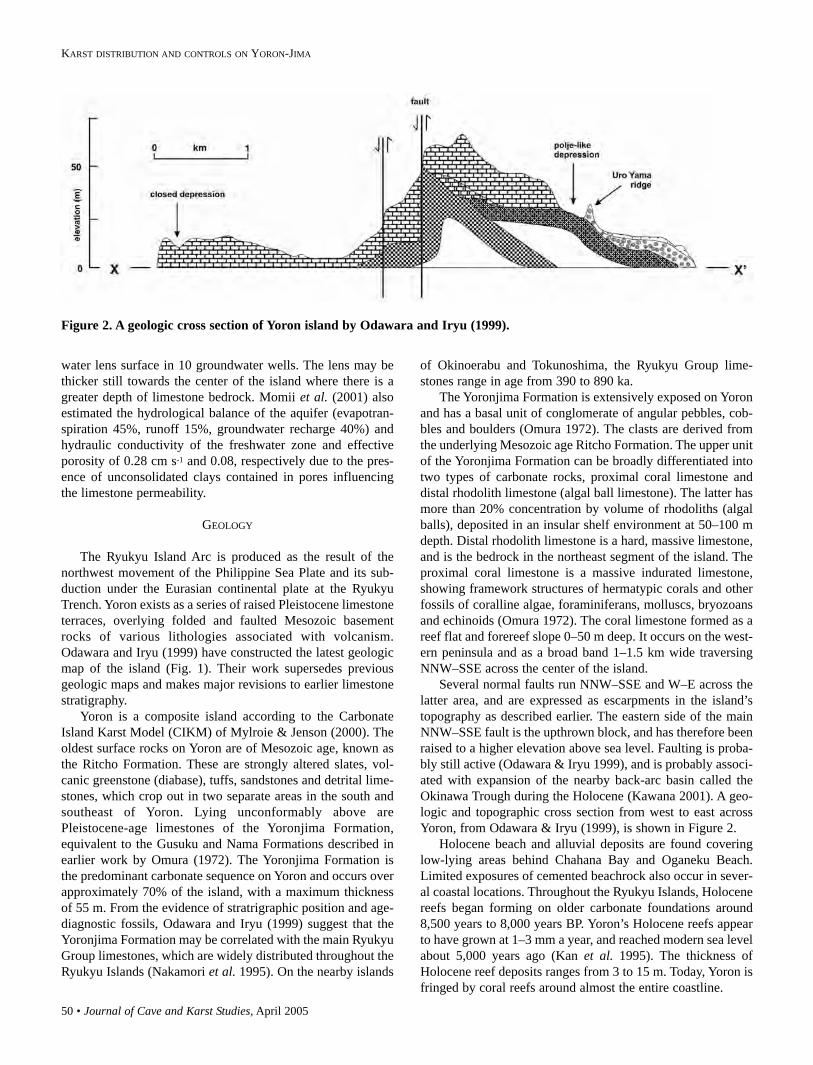
50 • Journal of Cave and Karst Studies, April 2005
KARST DISTRIBUTION AND CONTROLS ON YORON-JIMA
water lens surface in 10 groundwater wells. The lens may bethicker still towards the center of the island where there is agreater depth of limestone bedrock. Momii et al. (2001) alsoestimated the hydrological balance of the aquifer (evapotran-spiration 45%, runoff 15%, groundwater recharge 40%) andhydraulic conductivity of the freshwater zone and effectiveporosity of 0.28 cm s-1 and 0.08, respectively due to the pres-ence of unconsolidated clays contained in pores influencingthe limestone permeability.
GEOLOGY
The Ryukyu Island Arc is produced as the result of thenorthwest movement of the Philippine Sea Plate and its sub-duction under the Eurasian continental plate at the RyukyuTrench. Yoron exists as a series of raised Pleistocene limestoneterraces, overlying folded and faulted Mesozoic basementrocks of various lithologies associated with volcanism.Odawara and Iryu (1999) have constructed the latest geologicmap of the island (Fig. 1). Their work supersedes previousgeologic maps and makes major revisions to earlier limestonestratigraphy.
Yoron is a composite island according to the CarbonateIsland Karst Model (CIKM) of Mylroie & Jenson (2000). Theoldest surface rocks on Yoron are of Mesozoic age, known asthe Ritcho Formation. These are strongly altered slates, vol-canic greenstone (diabase), tuffs, sandstones and detrital lime-stones, which crop out in two separate areas in the south andsoutheast of Yoron. Lying unconformably above arePleistocene-age limestones of the Yoronjima Formation,equivalent to the Gusuku and Nama Formations described inearlier work by Omura (1972). The Yoronjima Formation isthe predominant carbonate sequence on Yoron and occurs overapproximately 70% of the island, with a maximum thicknessof 55 m. From the evidence of stratrigraphic position and age-diagnostic fossils, Odawara and Iryu (1999) suggest that theYoronjima Formation may be correlated with the main RyukyuGroup limestones, which are widely distributed throughout theRyukyu Islands (Nakamori et al. 1995). On the nearby islands
of Okinoerabu and Tokunoshima, the Ryukyu Group lime-stones range in age from 390 to 890 ka.
The Yoronjima Formation is extensively exposed on Yoronand has a basal unit of conglomerate of angular pebbles, cob-bles and boulders (Omura 1972). The clasts are derived fromthe underlying Mesozoic age Ritcho Formation. The upper unitof the Yoronjima Formation can be broadly differentiated intotwo types of carbonate rocks, proximal coral limestone anddistal rhodolith limestone (algal ball limestone). The latter hasmore than 20% concentration by volume of rhodoliths (algalballs), deposited in an insular shelf environment at 50–100 mdepth. Distal rhodolith limestone is a hard, massive limestone,and is the bedrock in the northeast segment of the island. Theproximal coral limestone is a massive indurated limestone,showing framework structures of hermatypic corals and otherfossils of coralline algae, foraminiferans, molluscs, bryozoansand echinoids (Omura 1972). The coral limestone formed as areef flat and forereef slope 0–50 m deep. It occurs on the west-ern peninsula and as a broad band 1–1.5 km wide traversingNNW–SSE across the center of the island.
Several normal faults run NNW–SSE and W–E across thelatter area, and are expressed as escarpments in the island’stopography as described earlier. The eastern side of the mainNNW–SSE fault is the upthrown block, and has therefore beenraised to a higher elevation above sea level. Faulting is proba-bly still active (Odawara & Iryu 1999), and is probably associ-ated with expansion of the nearby back-arc basin called theOkinawa Trough during the Holocene (Kawana 2001). A geo-logic and topographic cross section from west to east acrossYoron, from Odawara & Iryu (1999), is shown in Figure 2.
Holocene beach and alluvial deposits are found coveringlow-lying areas behind Chahana Bay and Oganeku Beach.Limited exposures of cemented beachrock also occur in sever-al coastal locations. Throughout the Ryukyu Islands, Holocenereefs began forming on older carbonate foundations around8,500 years to 8,000 years BP. Yoron’s Holocene reefs appearto have grown at 1–3 mm a year, and reached modern sea levelabout 5,000 years ago (Kan et al. 1995). The thickness ofHolocene reef deposits ranges from 3 to 15 m. Today, Yoron isfringed by coral reefs around almost the entire coastline.
Figure 2. A geologic cross section of Yoron island by Odawara and Iryu (1999).
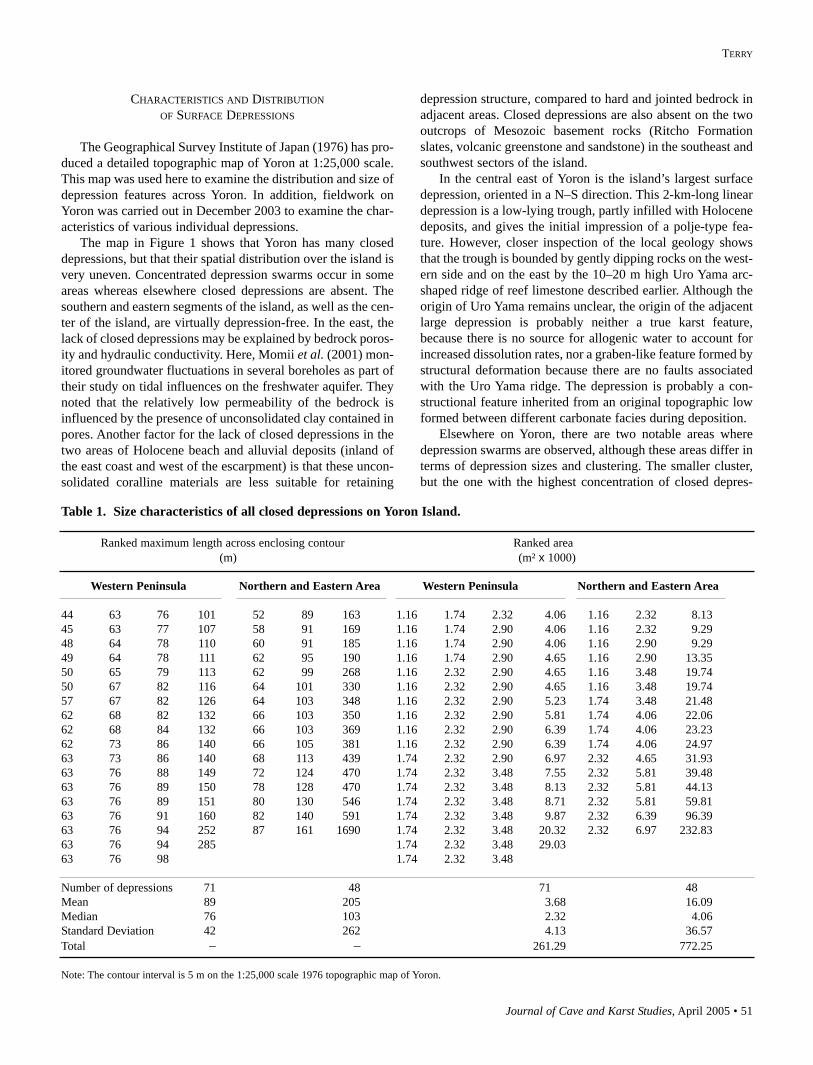
Journal of Cave and Karst Studies, April 2005 • 51
TERRY
CHARACTERISTICS AND DISTRIBUTIONOF SURFACE DEPRESSIONS
The Geographical Survey Institute of Japan (1976) has pro-duced a detailed topographic map of Yoron at 1:25,000 scale.This map was used here to examine the distribution and size ofdepression features across Yoron. In addition, fieldwork onYoron was carried out in December 2003 to examine the char-acteristics of various individual depressions.
The map in Figure 1 shows that Yoron has many closeddepressions, but that their spatial distribution over the island isvery uneven. Concentrated depression swarms occur in someareas whereas elsewhere closed depressions are absent. Thesouthern and eastern segments of the island, as well as the cen-ter of the island, are virtually depression-free. In the east, thelack of closed depressions may be explained by bedrock poros-ity and hydraulic conductivity. Here, Momii et al. (2001) mon-itored groundwater fluctuations in several boreholes as part oftheir study on tidal influences on the freshwater aquifer. Theynoted that the relatively low permeability of the bedrock isinfluenced by the presence of unconsolidated clay contained inpores. Another factor for the lack of closed depressions in thetwo areas of Holocene beach and alluvial deposits (inland ofthe east coast and west of the escarpment) is that these uncon-solidated coralline materials are less suitable for retaining
depression structure, compared to hard and jointed bedrock inadjacent areas. Closed depressions are also absent on the twooutcrops of Mesozoic basement rocks (Ritcho Formationslates, volcanic greenstone and sandstone) in the southeast andsouthwest sectors of the island.
In the central east of Yoron is the island’s largest surfacedepression, oriented in a N–S direction. This 2-km-long lineardepression is a low-lying trough, partly infilled with Holocenedeposits, and gives the initial impression of a polje-type fea-ture. However, closer inspection of the local geology showsthat the trough is bounded by gently dipping rocks on the west-ern side and on the east by the 10–20 m high Uro Yama arc-shaped ridge of reef limestone described earlier. Although theorigin of Uro Yama remains unclear, the origin of the adjacentlarge depression is probably neither a true karst feature,because there is no source for allogenic water to account forincreased dissolution rates, nor a graben-like feature formed bystructural deformation because there are no faults associatedwith the Uro Yama ridge. The depression is probably a con-structional feature inherited from an original topographic lowformed between different carbonate facies during deposition.
Elsewhere on Yoron, there are two notable areas wheredepression swarms are observed, although these areas differ interms of depression sizes and clustering. The smaller cluster,but the one with the highest concentration of closed depres-
Table 1. Size characteristics of all closed depressions on Yoron Island.
Ranked maximum length across enclosing contour Ranked area(m) (m² x 1000)
Western Peninsula Northern and Eastern Area Western Peninsula Northern and Eastern Area
44 63 76 101 52 89 163 1.16 1.74 2.32 4.06 1.16 2.32 8.1345 63 77 107 58 91 169 1.16 1.74 2.90 4.06 1.16 2.32 9.2948 64 78 110 60 91 185 1.16 1.74 2.90 4.06 1.16 2.90 9.2949 64 78 111 62 95 190 1.16 1.74 2.90 4.65 1.16 2.90 13.3550 65 79 113 62 99 268 1.16 2.32 2.90 4.65 1.16 3.48 19.7450 67 82 116 64 101 330 1.16 2.32 2.90 4.65 1.16 3.48 19.7457 67 82 126 64 103 348 1.16 2.32 2.90 5.23 1.74 3.48 21.4862 68 82 132 66 103 350 1.16 2.32 2.90 5.81 1.74 4.06 22.0662 68 84 132 66 103 369 1.16 2.32 2.90 6.39 1.74 4.06 23.2362 73 86 140 66 105 381 1.16 2.32 2.90 6.39 1.74 4.06 24.9763 73 86 140 68 113 439 1.74 2.32 2.90 6.97 2.32 4.65 31.9363 76 88 149 72 124 470 1.74 2.32 3.48 7.55 2.32 5.81 39.4863 76 89 150 78 128 470 1.74 2.32 3.48 8.13 2.32 5.81 44.1363 76 89 151 80 130 546 1.74 2.32 3.48 8.71 2.32 5.81 59.8163 76 91 160 82 140 591 1.74 2.32 3.48 9.87 2.32 6.39 96.3963 76 94 252 87 161 1690 1.74 2.32 3.48 20.32 2.32 6.97 232.8363 76 94 285 1.74 2.32 3.48 29.0363 76 98 1.74 2.32 3.48
Number of depressions 71 48 71 48Mean 89 205 3.68 16.09Median 76 103 2.32 4.06Standard Deviation 42 262 4.13 36.57Total – – 261.29 772.25
Note: The contour interval is 5 m on the 1:25,000 scale 1976 topographic map of Yoron.
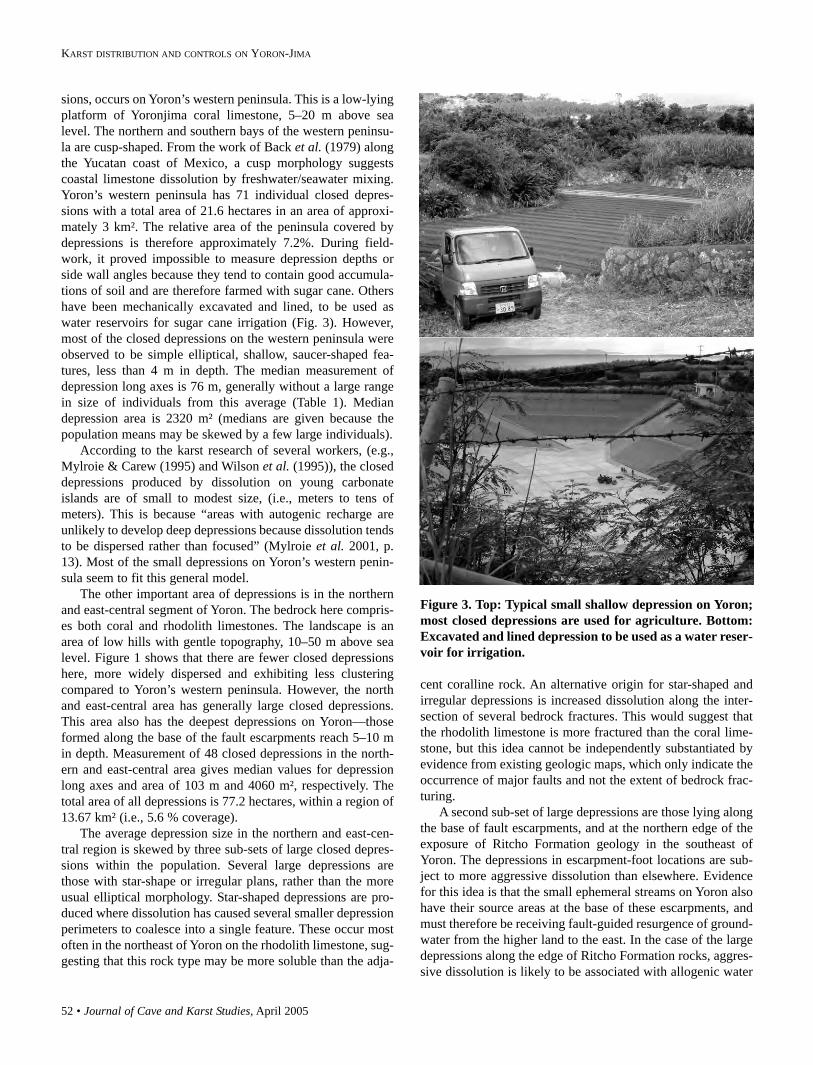
52 • Journal of Cave and Karst Studies, April 2005
KARST DISTRIBUTION AND CONTROLS ON YORON-JIMA
sions, occurs on Yoron’s western peninsula. This is a low-lyingplatform of Yoronjima coral limestone, 5–20 m above sealevel. The northern and southern bays of the western peninsu-la are cusp-shaped. From the work of Back et al. (1979) alongthe Yucatan coast of Mexico, a cusp morphology suggestscoastal limestone dissolution by freshwater/seawater mixing.Yoron’s western peninsula has 71 individual closed depres-sions with a total area of 21.6 hectares in an area of approxi-mately 3 km². The relative area of the peninsula covered bydepressions is therefore approximately 7.2%. During field-work, it proved impossible to measure depression depths orside wall angles because they tend to contain good accumula-tions of soil and are therefore farmed with sugar cane. Othershave been mechanically excavated and lined, to be used aswater reservoirs for sugar cane irrigation (Fig. 3). However,most of the closed depressions on the western peninsula wereobserved to be simple elliptical, shallow, saucer-shaped fea-tures, less than 4 m in depth. The median measurement ofdepression long axes is 76 m, generally without a large rangein size of individuals from this average (Table 1). Mediandepression area is 2320 m² (medians are given because thepopulation means may be skewed by a few large individuals).
According to the karst research of several workers, (e.g.,Mylroie & Carew (1995) and Wilson et al. (1995)), the closeddepressions produced by dissolution on young carbonateislands are of small to modest size, (i.e., meters to tens ofmeters). This is because “areas with autogenic recharge areunlikely to develop deep depressions because dissolution tendsto be dispersed rather than focused” (Mylroie et al. 2001, p.13). Most of the small depressions on Yoron’s western penin-sula seem to fit this general model.
The other important area of depressions is in the northernand east-central segment of Yoron. The bedrock here compris-es both coral and rhodolith limestones. The landscape is anarea of low hills with gentle topography, 10–50 m above sealevel. Figure 1 shows that there are fewer closed depressionshere, more widely dispersed and exhibiting less clusteringcompared to Yoron’s western peninsula. However, the northand east-central area has generally large closed depressions.This area also has the deepest depressions on Yoron—thoseformed along the base of the fault escarpments reach 5–10 min depth. Measurement of 48 closed depressions in the north-ern and east-central area gives median values for depressionlong axes and area of 103 m and 4060 m², respectively. Thetotal area of all depressions is 77.2 hectares, within a region of13.67 km² (i.e., 5.6 % coverage).
The average depression size in the northern and east-cen-tral region is skewed by three sub-sets of large closed depres-sions within the population. Several large depressions arethose with star-shape or irregular plans, rather than the moreusual elliptical morphology. Star-shaped depressions are pro-duced where dissolution has caused several smaller depressionperimeters to coalesce into a single feature. These occur mostoften in the northeast of Yoron on the rhodolith limestone, sug-gesting that this rock type may be more soluble than the adja-
cent coralline rock. An alternative origin for star-shaped andirregular depressions is increased dissolution along the inter-section of several bedrock fractures. This would suggest thatthe rhodolith limestone is more fractured than the coral lime-stone, but this idea cannot be independently substantiated byevidence from existing geologic maps, which only indicate theoccurrence of major faults and not the extent of bedrock frac-turing.
A second sub-set of large depressions are those lying alongthe base of fault escarpments, and at the northern edge of theexposure of Ritcho Formation geology in the southeast ofYoron. The depressions in escarpment-foot locations are sub-ject to more aggressive dissolution than elsewhere. Evidencefor this idea is that the small ephemeral streams on Yoron alsohave their source areas at the base of these escarpments, andmust therefore be receiving fault-guided resurgence of ground-water from the higher land to the east. In the case of the largedepressions along the edge of Ritcho Formation rocks, aggres-sive dissolution is likely to be associated with allogenic water
Figure 3. Top: Typical small shallow depression on Yoron;most closed depressions are used for agriculture. Bottom:Excavated and lined depression to be used as a water reser-voir for irrigation.
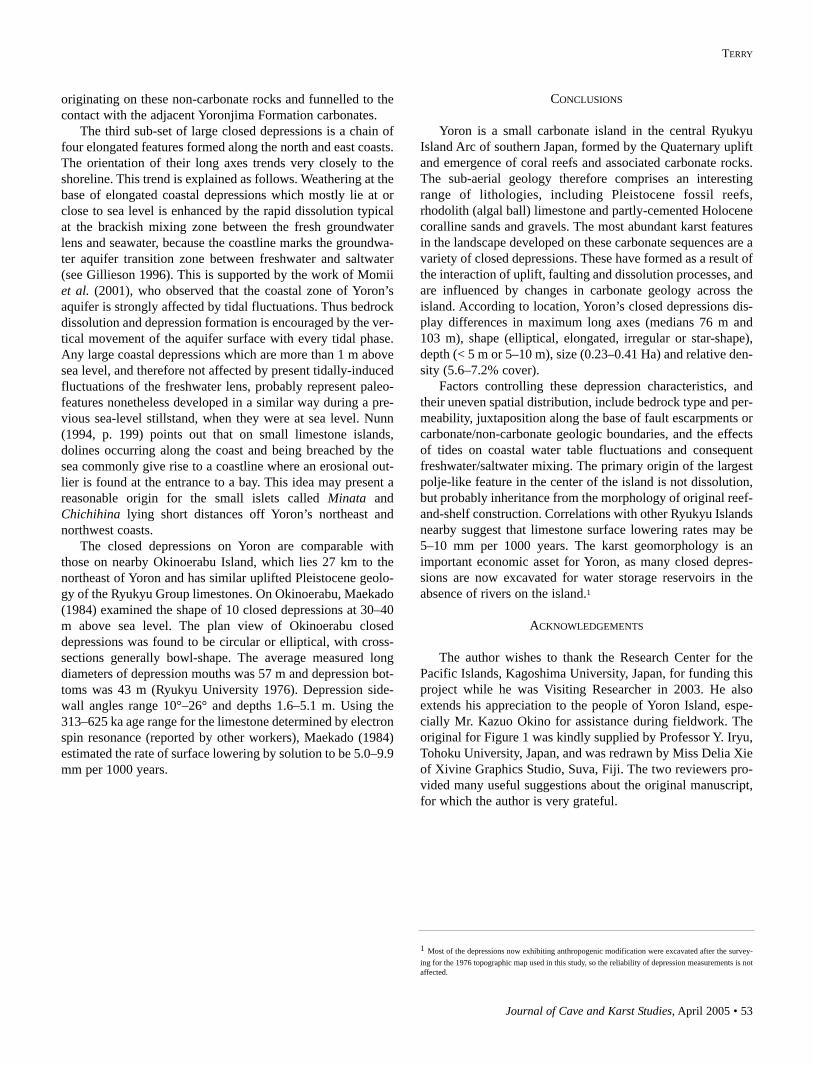
Journal of Cave and Karst Studies, April 2005 • 53
TERRY
originating on these non-carbonate rocks and funnelled to thecontact with the adjacent Yoronjima Formation carbonates.
The third sub-set of large closed depressions is a chain offour elongated features formed along the north and east coasts.The orientation of their long axes trends very closely to theshoreline. This trend is explained as follows. Weathering at thebase of elongated coastal depressions which mostly lie at orclose to sea level is enhanced by the rapid dissolution typicalat the brackish mixing zone between the fresh groundwaterlens and seawater, because the coastline marks the groundwa-ter aquifer transition zone between freshwater and saltwater(see Gillieson 1996). This is supported by the work of Momiiet al. (2001), who observed that the coastal zone of Yoron’saquifer is strongly affected by tidal fluctuations. Thus bedrockdissolution and depression formation is encouraged by the ver-tical movement of the aquifer surface with every tidal phase.Any large coastal depressions which are more than 1 m abovesea level, and therefore not affected by present tidally-induced fluctuations of the freshwater lens, probably represent paleo-features nonetheless developed in a similar way during a pre-vious sea-level stillstand, when they were at sea level. Nunn(1994, p. 199) points out that on small limestone islands,dolines occurring along the coast and being breached by thesea commonly give rise to a coastline where an erosional out-lier is found at the entrance to a bay. This idea may present areasonable origin for the small islets called Minata andChichihina lying short distances off Yoron’s northeast andnorthwest coasts.
The closed depressions on Yoron are comparable withthose on nearby Okinoerabu Island, which lies 27 km to thenortheast of Yoron and has similar uplifted Pleistocene geolo-gy of the Ryukyu Group limestones. On Okinoerabu, Maekado(1984) examined the shape of 10 closed depressions at 30–40m above sea level. The plan view of Okinoerabu closeddepressions was found to be circular or elliptical, with cross-sections generally bowl-shape. The average measured longdiameters of depression mouths was 57 m and depression bot-toms was 43 m (Ryukyu University 1976). Depression side-wall angles range 10°–26° and depths 1.6–5.1 m. Using the313–625 ka age range for the limestone determined by electronspin resonance (reported by other workers), Maekado (1984)estimated the rate of surface lowering by solution to be 5.0–9.9mm per 1000 years.
CONCLUSIONS
Yoron is a small carbonate island in the central RyukyuIsland Arc of southern Japan, formed by the Quaternary upliftand emergence of coral reefs and associated carbonate rocks.The sub-aerial geology therefore comprises an interestingrange of lithologies, including Pleistocene fossil reefs,rhodolith (algal ball) limestone and partly-cemented Holocenecoralline sands and gravels. The most abundant karst featuresin the landscape developed on these carbonate sequences are avariety of closed depressions. These have formed as a result ofthe interaction of uplift, faulting and dissolution processes, andare influenced by changes in carbonate geology across theisland. According to location, Yoron’s closed depressions dis-play differences in maximum long axes (medians 76 m and103 m), shape (elliptical, elongated, irregular or star-shape),depth (< 5 m or 5–10 m), size (0.23–0.41 Ha) and relative den-sity (5.6–7.2% cover).
Factors controlling these depression characteristics, andtheir uneven spatial distribution, include bedrock type and per-meability, juxtaposition along the base of fault escarpments orcarbonate/non-carbonate geologic boundaries, and the effectsof tides on coastal water table fluctuations and consequentfreshwater/saltwater mixing. The primary origin of the largestpolje-like feature in the center of the island is not dissolution,but probably inheritance from the morphology of original reef-and-shelf construction. Correlations with other Ryukyu Islandsnearby suggest that limestone surface lowering rates may be5–10 mm per 1000 years. The karst geomorphology is animportant economic asset for Yoron, as many closed depres-sions are now excavated for water storage reservoirs in theabsence of rivers on the island.1
ACKNOWLEDGEMENTS
The author wishes to thank the Research Center for thePacific Islands, Kagoshima University, Japan, for funding thisproject while he was Visiting Researcher in 2003. He alsoextends his appreciation to the people of Yoron Island, espe-cially Mr. Kazuo Okino for assistance during fieldwork. Theoriginal for Figure 1 was kindly supplied by Professor Y. Iryu,Tohoku University, Japan, and was redrawn by Miss Delia Xieof Xivine Graphics Studio, Suva, Fiji. The two reviewers pro-vided many useful suggestions about the original manuscript,for which the author is very grateful.
1 Most of the depressions now exhibiting anthropogenic modification were excavated after the survey-ing for the 1976 topographic map used in this study, so the reliability of depression measurements is notaffected.
54 • Journal of Cave and Karst Studies, April 2005
KARST DISTRIBUTION AND CONTROLS ON YORON-JIMA
REFERENCES
Mylroie, J. E., Jenson, J. W., Taboroši, D., Jocson, J.M.U., Vann, D.T., &Wexel, C., 2001, Karst features of Guam in terms of a general model ofcarbonate island karst: Journal of Cave and Karst Studies, v. 63, no. 1, p.9–22.
Nakamori, T., Iryu, Y. & Yamada, T., 1995, Development of coral reefs of theRyukyu Islands (southwest Japan, east China Sea) during Pleistocene sea-level change: Sedimentary Geology, v. 99, p. 215–231.
Nunn, P.D. 1994, Oceanic Islands: Blackwell, Oxford, 413 p.Odawara, K. & Iryu, Y., 1999, Pleistocene coral reef deposits (the Ryukyu
Group) on Yoron-jima, Kagoshima Prefecture: Japanese Journal of theGeological Society of Japan, v. 105, p. 273–288 (in Japanese with Englishabstract).
Ollier, C.D., 1975, Coral island geomorphology – the Trobriand Islands:Zeitschrift für Geomorphologie, v. 19, p. 164–190.
Omura, A., 1972, Stratigraphic notes on Yoron-jima: with special reference tothe Quaternary deposits: Science Reports of Kanazawa University, v. 17,p. 33–42.
Ryukyu University 1976, Geographical Research Group unpublished data.Strecker, M.R., Bloom, A.L. Gilpin, L.M. & Taylor, F.W., 1986, Karst mor-
phology of uplifted Quaternary coral limestone terraces: Santo Island,Vanuatu: Zeitschrift für Geomorphologie, v. 30, p. 387–405.
Terry, J.P. & Nunn, P.D., 2003, Interpreting features of carbonate geomor-phology on Niue Island, a raised coral atoll: Zeitschrift fürGeomorphologie, Supplementary Volume 131, p. 43–57.
Wilson, W.L., Mylroie, J.E. & Carew, J.L., 1995, Quantitative analysis ofcaves as a geologic hazard on San Salvador Island, Bahamas, inProceedings of the 7th Symposium on the Geology of the Bahamas, SanSalvador Island, Bahamian Field Station, p. 103–121.
Back, W., Hanshaw, B.B., Pyle, T.E., Plummer, L.N. & Weidie, A.E., 1979,Geotechnical significance of groundwater discharge and carbonate disso-lution to the formation of Caleta Xel Ha, Quintana Roo, Mexico: WaterResources Research, v. 15, p. 1521–1535.
Geographical Survey Institute of Japan, 1976, 1:25,000 Topographic Map ofYoron (in Japanese).
Gillieson, D., 1996, Caves. Processes, Development, Management: Blackwell,Oxford, 324pp.
Kan, H., Hori, N., Nahashima, Y., & Ichikawa, K., 1995, The evolution of nar-row reef flats at high-latitude in the Ryukyu Islands: Coral Reefs, v. 14, p.123–130.
Kawana, T., 2001, Holocene tilting in the northern and central Ryukyu Islands,as deduced from expansion of the Okinawa Trough: Journal ofGeography, v. 110, p. 433–438 (in Japanese).
Maekado, A., 1984, Solution rate of the Ryukyu Limestone in Okinoerabu-jima, Ryukyu Islands: Annual Report, Institute of Geosciences, Universityof Tsukuba, Japan, no. 10, p. 57–58.
Montaggioni, L.F., Richard, G., Bourrouilh, F., Gabrié, C., Humbert, L.,Monteforte, M., Naim, O., Payri, C. & Salvat, B., 1985, Geology andmarine biology of Makatea, an uplifted atoll, Tuamotu archipelago, cen-tral Pacific Ocean: Journal of Coastal Research v. 1, p. 165–172.
Momii, K., Shoji, J., Jinno, K. & Nakagawa, K., 2001, Application of sharpinterface approach to seawater intrusion and groundwater analysis in asmall island, Japan, in Proceedings of the 3rd International Conference onFuture Groundwater Resources at Risk, 25–27 June 2001: Lisbon,Portugal, p. 649–656.
Mylroie, J.E. & Carew, J.L., 1995, Karst development on carbonate islands, inBudd, D.A., Harris, P.M. & Saller, A., ed., Unconformities and Porosity inCarbonate Strata, American Association of Petroleum Geologists, p.55–76.
Mylroie, J. & Jenson, J., 2000, The Carbonate Island Karst Model, inBallweber, J.A., ed., 2000 Proceedings, Mississippi Water ResourcesConference. Water Resources Research Institute, Mississippi StateUniversity, p. 371–375.
Journal of Cave and Karst Studies, April 2005 • 55
DISCUSSION
Hunter et al. (2005) recently reported, based on crude pre-sumptive tests, that Escherichia coli is present within many ofthe drinking pools of Lechuguilla Cave, indicating fecal cont-amination of these pools by explorers. We believe that theseresults are misrepresented and do not accurately reflect thepresence of fecal contamination within these pools.
The bacterium E. coli is a common resident of the intesti-nal system of most mammals, but is generally not known topersist for more than about 2–3 weeks in the environment(Neidhardt et al. 1996). E. coli is also easily identified by itsability to grow in the absence of oxygen (referred to as fer-mentation) on lactose with the production of acid and gas. Thesource of E. coli in the mammalian intestinal tract, its easyidentification and rapid loss from the environment allows thisbacterium to be used in the rapid identification of fecal conta-mination incidents (Edberg et al. 2000). Although the conceptof using E. coli as an indirect indicator of water quality andhealth risk is sound, it is complicated in practice. This is due tothe presence of other enteric bacteria such as Citrobacter,Klebsiella and Enterobacter that can also ferment lactose andare similar to E. coli in phenotypic characteristics (Holt et al.2000). As a result, the term “coliform” was coined to describethis group of enteric bacteria. Coliform is therefore not a taxo-nomic classication, but rather a working definition to describea group of Gram-negative, facultative anaerobic rod-shapedbacteria that ferment lactose to produce acid and gas.Consequently, while the presence of coliforms in the environ-ment may be indicative of fecal contamination, it is by nomeans a confirmation of the presence of E. coli or direct evi-dence of fecal contamination itself. Rather, these tests are con-sidered presumptive and must be followed by additional exper-iments to either conclusively confirm or rule out the presenceof fecal E. coli strains (USEPA, 2001).
In their study, Hunter et al. used a number of presumptivetests to determine whether the lakes in Lechuguilla Cave werecontaminated with fecal coliforms. These tests included theLaMotte [sic] Company TC-5 coliform indicator test, the mostprobable number (MPN) test and the use of mENDO indicatorplates. The TC-5 coliform test is used to identify lactose fer-mentor species with the production of acid and gas (LaMotteCompany, personal communication, 2005). The most probablenumber (MPN) test contains the detergent lauryl sulfate, whichexcludes the growth of gram-positive bacteria and false posi-tives by members of the Lactobacilli, Propionibacteria,Serratia and Streptococci. Finally, the mENDO agar test is
slightly more selective for coliforms, with the addition ofdeoxycholate to limit the growth of Proteus species.Nonetheless, members of the genus Aeromonas, which are rou-tinely identified in karstic waters, display an identical growthpattern to E. coli on mENDO plates (D. Lye, EPA, personalcommunication, 2005; Legnani et al., 1998). Each of thesetests is presumptive: in order to conclusively identify fecalcontamination within this water, the presence of thermotoler-ant E. coli must be identified by growth at 44.5°C (Edberg etal. 2000; Neidhardt et al. 1996). Indeed, standard regulationsby the Environmental Protection Agency (EPA) and theAmerican Public Health Association require presumptive teststo be confirmed by the mTEC test for thermotolerant E. colibefore any statement regarding fecal contamination can bemade (USEPA, 2001).
We therefore believe that the results presented by Hunter etal. (1995), while indicative of lactose-fermenting bacterialspecies within the pools of Lechuguilla Cave, do not representconclusive evidence of fecal contamination; for example, in arecent study on bacterial species isolated from CarlsbadCavern, Barton and collaborators were able to demonstrate that23% of isolated species demonstrated sufficient lactose fer-mentation to produce a false positive coliform test (Barton,unpublished results, 2005). It is interesting to note that theMPN tests carried out by Boston failed to identify coliformswithin many of these pools during 1999 (Hunter et al. Table 1,we assume ‘ND’ corresponds to microbiological convention of‘none-detected’, although this is not claried in the paper),which may reflect the more selective nature of this test (Hunteret al., 2004).
Following the identification of lactose-fermenting specieswithin the cave pools, Hunter et al. proposed that microbialbiofilms forming on tubing support the growth and persistenceof E. coli species. Such a hypothesis, and the data presented inFigure 6, would imply that E. coli was selectively enriched bythe presence of this biofilm. Given the nature of biofilm struc-ture and formation, this enrichment would suggest that E. colidemonstrated either a grazing or predatory nature (Hall-Stoodley et al. 2004). This behavior would be the first descrip-tion of any such activity by this highly characterized organism(Neidhardt et al. 1996).
To support their biofilm hypothesis, Hunter et al. present-ed a bacterial growth curve that they propose demonstrates anenrichment of E. coli growth in the presence of biofilm mater-ial (Hunter et al. Figure 6). The investigators clearly state that
DISCUSSION: PERSISTENT COLIFORM CONTAMINATIONIN LECHUGUILLA CAVE POOLS
HAZEL A. BARTONDepartment of Biological Sciences, Northern Kentucky University, Highland Heights, KY USA
NORMAN R. PACEDepartment of Molecular, Cellular and Developmental Biology, University of Colorado, Boulder, CO USA
56 • Journal of Cave and Karst Studies, April 2005
DISCUSSION
these tubes were set up with a “loop-full” of E. coli starter cul-ture, rather than a defined number of bacterial colony formingunits. While the investigators control against the numbers oforganisms at Day 0, there is no accounting for how the vari-ability in the total number of cells added may affect the growthrate. It is known that cell density, access to nutrients and quo-rum sensing have significant effects on the growth rate of E.coli, but the investigators did not control against this variabil-ity (Neidhardt et al. 1996; Sperandio et al. 2001). There is alsono indication that the experiment was performed in triplicate(with no error or standard deviation bars on Figure 6) to con-trol against the inherent variability in growth assays. Finally,the experiment was only carried out for six days in a mediumthat was shown to support the growth of E. coli, preventing anyconclusions from being drawn regarding persistence. Thismakes it impossible to conclude from the data presented inFigure 6 whether the biofilm material is directly responsiblefor E. coli growth and long-term persistence.
It is the transient nature of E. coli in the environment thatmakes it such an ideal indicator organism of fecal contamina-tion (Edberg et al. 2000; Neidhardt et al. 1996; Sperandio et al.2001). The only exception to this rule is in highly organic-richtropical soils and effluent pools associated with animal farm-ing (Carrillo et al. 1985; Rahn et al. 1997). Numerousresearch groups have attempted to identify conditions thatwould promote E. coli long-term survival in low-nutrient con-ditions without success, while other investigators have sug-gested that E. coli may survive extended starvation by enteringthe viable but non-culturable state (Bogosian et al. 1996;Carrillo et al. 1985). However, to date it has not been possibleto demonstrate the persistence of this organism within theenvironment or entry into the VBNC state (Bogosian et al.1998; Bogosian et al. 1996). In conclusion, we believe that thework presented by Hunter et al. does not provide sufficientevidence to conclude that there is fecal contamination withinthe pools of Lechuguilla Cave, or that this paper demonstratesa dramatic shift in our understanding of the natural history andecology of E. coli.
The work carried out by Hunter et al. should be commend-ed for its goal toward understanding the impact that humanactivity has on pristine cave environments. Their demonstra-tion that certain tubing is inappropriate for long-term storagewithin the cave and should be replaced by non-biogenic for-mulations is an important step toward minimizing impact dur-ing exploration. Nonetheless, with new microbial species andphylotypes being identified on a regular basis in cave environ-ments, we should be careful when using tests that have beendeveloped for chemically defined surface environments to ana-lyze microbial communities within caves (Barns &Nierzwicki-Bauer 1997; Barton et al. 2004; Chelius & Moore2004; Kuznetsov et al. 1979; Northup et al. 2003; Pedersen2000; Sarbu et al. 1994).
Finally, while it is important to monitor and limit humanimpact in cave environments, our understanding of the struc-ture and potentially unique microbial habitats that these caves
represent is still solely dependent on the initial exploration anddescription by speleologists; there remains a delicate balancebetween the appropriate techniques to safely map and explorecave environments and the needs of minimal impact to con-serve them. As microbiologists, with a much deeper under-standing of the intricacies of microbial growth and metabolicactivity, it is essential that we take a great deal of care whenproviding material to cavers and land managers who may notbe able to objectively critique microbiological data. Such careis especially important, given that resultant management deci-sions could have profound impacts on our abilities as microbi-ologists to identify and understand microbially-important caveenvironments in the future.
REFERENCES
Barns, S.M., & Nierzwicki-Bauer, S.A., 1997, Microbial diversity in modernsubsurface, ocean, surface environments, in Baneld, J.F., & Nealson,K.H., eds., Geomicrobiology: interactions between microbes and miner-als, Volume 35: Reviews in Mineralogy: Washington, D.C., MineralogicalSociety of America, p. 35–79.
Barton, H.A., Taylor, M.R., & Pace, N.R., 2004, Molecular phylogeneticanalysis of a bacterial community in an oligotrophic cave environment:Geomicrobiology Journal, v. 21, p. 11–20.
Bogosian, G., Morris, P.J.L., & O’Neil, J.P., 1998, A mixed culture recoverymethod indicates that enteric bacteria do not enter the viable but non-cul-turable state: Applied and Environmental Microbiology, v. 64, p.1736–1742.
Bogosian, G., Sammons, L.E., Morris, P.J.L., O’Neil, J.P., Heitkamp, M.A., &Weber, D.B., 1996, Death of the Escherichia coli K-12 strain W3110 insoil and water: Applied and Environmental Microbiology, v. 62, p.4114–4120.
Carrillo, M., Estrada, E., & Hazen, T.C., 1985, Survival and enumeration ofthe fecal indicators Bifidobacterium adolescentis and Escherichia coli ina tropical rainforest watershed: Applied and Environmental Microbiology,v. 50, p. 468–476.
Chelius, M.K., & Moore, J.C., 2004, Molecular phylogenetic analysis ofArchaea and Bacteria in Wind Cave, South Dakota: GeomicrobiologyJournal, v. 21, p. 123–134.
Dworkin, M., 2002, The Prokaryotes: An evolving electronic resource for themicrobiological community: Springer-Verlag, New York.http://link.springer-ny.com/link/service /books/10125
Edberg, S.C., Rice, E.W., Karlin, R.J., & Allen, M.J., 2000, Escherichia coli:the best biological drinking water indicator for public health protection:Symposium Series Society for Applied Microbiology, v. 29, p.106S–116S.
Hall-Stoodley, L., Costerton, J.W., & Stoodley, P., 2004, Bacterial biofilms:From the natural environment to infectious diseases: Nature Reviews:Microbiology, v. 2, p. 95–108.
Holt, J.G., Krieg, N.R., Sneath, P.H.A., Staley, J.T., & Williams, S.T., 2000,Bergey’s Manual of Determinative Bacteriology: Ninth Edition:Baltimore, Maryland: Williams and Wilkins, 787 p.
Hunter, A.J., Northup, D.E., Dahm, C.N., & Boston, P.J., 2005, Persistent col-iform contamination in Lechuguilla Cave pools: Journal of Cave andKarst Studies, v. 66, p. 102–110.
Kuznetsov, S.I., Dubinina, G.A., & Lapteva, N.A., 1979, Biology of olig-otrophic bacteria: Annual Reviews of Microbiology, v. 33, p. 377–87.
Legnani, P., Leoni, E., Soppelsa, F., & Burigo, R., 1998, The occurrence ofAeromonas species in drinking water supplies of the Dolomite Mountains,Italy: Journal of Applied Microbiology, v. 85, p. 271–276.
Neidhardt, F.C., Curtis, R., Ingraham, J.L., Lin, E.C.C., Low, K.B.,Magasanik, B., Reznikoff, W.S., Riley, M., Schaechter, M., & Umbarger,H.E., 1996, Escherichia coli and Salmonella: Washington, D.C.,American Society for Microbiology Press, 2822 p.

Journal of Cave and Karst Studies, April 2005 • 57
FORUM
Northup, D.E., Barnes, S.M., Yu, L.E., Connolly, C.A., Natvig, D.O., & Dahm,C.N., 2003, Diverse microbial communities inhabiting ferromanganesedeposits in Lechuguilla and Spider Caves: Environmental Microbiology,v. 5, p. 1071–1086.
Pedersen, K., 2000, Exploration of deep intraterrestrial microbial life: CurrentPerspectives: FEMS Microbiology Letters, v. 185, p. 9–16.
Rahn, K., Renwich, S.A., Johnson, R.P., Wilson, J.B., Clarke, R.C., Alves, D.,McEwen, S., Lior, H., & Spika, J., 1997, Persistence of Escherichia coliO157:H7 in Dairy cattle and the dairy farm environment: Epidemiologyand Infection, v. 119, p. 251–259.
Sarbu, S.M., Kinkle, B.K., Vlasceanu, L., Kane, T.C., & Popa, R., 1994,Microbiological characterization of a sufilde-rich groundwater ecosys-tem: Geomicrobiology Journal, v. 12, p. 175–182.
Sperandio, V., Torres, A.G., Giron, J.A., & Kaper, J.B., 2001, Quorum sensingis a global regulatory mechanism in enterohemorrhagic Escherichia coliO157:H7: Journal of Bacteriology, v. 183, p. 5187–5197.
USEPA (US Environmental Protection Agency), 2001, Guidelines establishingtest procedures for the analysis of pollutants: Analytical methods for bio-logical pollutants in ambient water: Federal Register, v. 66, p.45811–45829.
Journal of Cave and Karst Studies, April 2005 • 57
FORUM
FORUM: PERSISTENT COLIFORM CONTAMINATION INLECHUGUILLA CAVE POOLS
DONALD G. DAVIS441 S. Kearney St., Denver, CO 80224-1237 USA [email protected]
As an active explorer, surveyor and student of LechuguillaCave from 1986 to 1999, I am concerned about some of therecommendations in Hunter et al. (2000) (JCKS 66(3), 102-110). The paper states that “...Red Lake...has been closed forseveral years due to coliform contamination...Lechuguilla’sdrinking pools are few and far between and should be regard-ed as both valuable drinking water resources and researchstudy sites. If coliform contamination in these environmentspersists, then the resources may have to be put off limits toavoid negative human health and safety issues. Alternativemethods for controlling coliform introduction and ameliora-tion of the techniques employed to obtain drinking-water fromcave pools may make such draconian measures unnecessary.However, such management decisions are complex.”
I do not understand why any water sources should be putoff limits on the grounds of microbial risk to cavers’ health andsafety. Should not simple iodine disinfection or other waterpurification systems (recommended later in the paper in anycase) be sufficient to render any Lechuguilla Cave water safefor drinking? The continued, and in my opinion unnecessary,closure of the campsite using Red Lake water has had signifi-cant negative effects. It has made survey trips to the west endof the cave two hours longer from camp, thus reducing sur-veyor productivity, increasing physical impact on the travelroute, and increasing caver fatigue, which makes accidentsmore likely.
Some of the amelioration methods suggested by Hunter etal.’s study (notably changing water collection tubing to sili-cone or Teflon) are valuable and can be implemented withoutundesirable effects. Others are problematic—particularly“packing out all fecal and urine waste in properly sealed con-tainers would also help reduce new sources of contamination.”
Fecal waste is already routinely packed out, and has been sinceearly in the exploration. Packing out urine, however, has notbeen required because it would place an excessive burden onexplorers. Individuals’ urine-production rates vary widely, butrange up to more than a gallon per 24 hours, so on a typical six-day camp trip, a caver could need to store and haul out up to50+ pounds of urine, which is more weight than the entire loadthat most cavers carry into the cave. Such a requirement wouldoverburden or exclude those who couldn’t handle this, and/orencourage minimal fluid consumption, again with undesirableproductivity, health and safety implications.
Other recommendations, such as wearing clean boot coversand Tyvek suits when approaching pools, are less blatantlytroublesome, but nevertheless add incrementally to the alreadycomplex protocols required by the Park for work in the cave.Proposed new requirements should be critically considered,because each new one makes it more complicated and difficultto do everything properly, takes more time and effort awayfrom primary goals, and makes trips less enjoyable. I believethat this has already gone past a reasonable balance betweenprotecting the cave and expediting exploration, resulting infewer experienced personnel who remain interested in workingin Lechuguilla.
I encourage microbiologists working in the cave to focuson ways to facilitate renewed exploration. Several of the bestremaining unexplored leads would involve traversing waterand have been kept off limits for several years, on grounds thatthey must be kept microbially pristine. I propose that if noresearchers have committed to study these locations within areasonable time, they should be released to exploration.Microbiologists could assist by devising practical techniquesfor crossing water with minimal contamination.
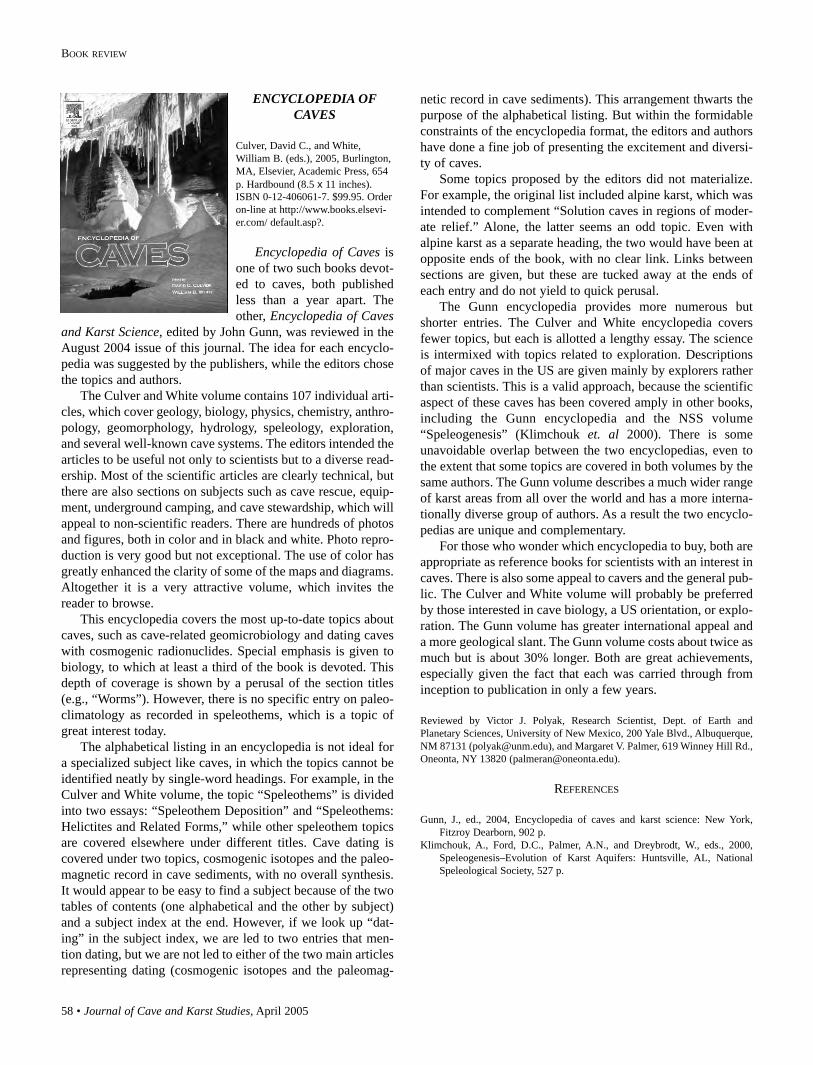
58 • Journal of Cave and Karst Studies, April 2005
BOOK REVIEW
ENCYCLOPEDIA OFCAVES
Culver, David C., and White,William B. (eds.), 2005, Burlington,MA, Elsevier, Academic Press, 654p. Hardbound (8.5 x 11 inches).ISBN 0-12-406061-7. $99.95. Orderon-line at http://www.books.elsevi-er.com/ default.asp?.
Encyclopedia of Caves isone of two such books devot-ed to caves, both publishedless than a year apart. Theother, Encyclopedia of Caves
and Karst Science, edited by John Gunn, was reviewed in theAugust 2004 issue of this journal. The idea for each encyclo-pedia was suggested by the publishers, while the editors chosethe topics and authors.
The Culver and White volume contains 107 individual arti-cles, which cover geology, biology, physics, chemistry, anthro-pology, geomorphology, hydrology, speleology, exploration,and several well-known cave systems. The editors intended thearticles to be useful not only to scientists but to a diverse read-ership. Most of the scientific articles are clearly technical, butthere are also sections on subjects such as cave rescue, equip-ment, underground camping, and cave stewardship, which willappeal to non-scientific readers. There are hundreds of photosand figures, both in color and in black and white. Photo repro-duction is very good but not exceptional. The use of color hasgreatly enhanced the clarity of some of the maps and diagrams.Altogether it is a very attractive volume, which invites thereader to browse.
This encyclopedia covers the most up-to-date topics aboutcaves, such as cave-related geomicrobiology and dating caveswith cosmogenic radionuclides. Special emphasis is given tobiology, to which at least a third of the book is devoted. Thisdepth of coverage is shown by a perusal of the section titles(e.g., “Worms”). However, there is no specific entry on paleo-climatology as recorded in speleothems, which is a topic ofgreat interest today.
The alphabetical listing in an encyclopedia is not ideal fora specialized subject like caves, in which the topics cannot beidentified neatly by single-word headings. For example, in theCulver and White volume, the topic “Speleothems” is dividedinto two essays: “Speleothem Deposition” and “Speleothems:Helictites and Related Forms,” while other speleothem topicsare covered elsewhere under different titles. Cave dating iscovered under two topics, cosmogenic isotopes and the paleo-magnetic record in cave sediments, with no overall synthesis.It would appear to be easy to find a subject because of the twotables of contents (one alphabetical and the other by subject)and a subject index at the end. However, if we look up “dat-ing” in the subject index, we are led to two entries that men-tion dating, but we are not led to either of the two main articlesrepresenting dating (cosmogenic isotopes and the paleomag-
netic record in cave sediments). This arrangement thwarts thepurpose of the alphabetical listing. But within the formidableconstraints of the encyclopedia format, the editors and authorshave done a fine job of presenting the excitement and diversi-ty of caves.
Some topics proposed by the editors did not materialize.For example, the original list included alpine karst, which wasintended to complement “Solution caves in regions of moder-ate relief.” Alone, the latter seems an odd topic. Even withalpine karst as a separate heading, the two would have been atopposite ends of the book, with no clear link. Links betweensections are given, but these are tucked away at the ends ofeach entry and do not yield to quick perusal.
The Gunn encyclopedia provides more numerous butshorter entries. The Culver and White encyclopedia coversfewer topics, but each is allotted a lengthy essay. The scienceis intermixed with topics related to exploration. Descriptionsof major caves in the US are given mainly by explorers ratherthan scientists. This is a valid approach, because the scientificaspect of these caves has been covered amply in other books,including the Gunn encyclopedia and the NSS volume“Speleogenesis” (Klimchouk et. al 2000). There is someunavoidable overlap between the two encyclopedias, even tothe extent that some topics are covered in both volumes by thesame authors. The Gunn volume describes a much wider rangeof karst areas from all over the world and has a more interna-tionally diverse group of authors. As a result the two encyclo-pedias are unique and complementary.
For those who wonder which encyclopedia to buy, both areappropriate as reference books for scientists with an interest incaves. There is also some appeal to cavers and the general pub-lic. The Culver and White volume will probably be preferredby those interested in cave biology, a US orientation, or explo-ration. The Gunn volume has greater international appeal anda more geological slant. The Gunn volume costs about twice asmuch but is about 30% longer. Both are great achievements,especially given the fact that each was carried through frominception to publication in only a few years.
Reviewed by Victor J. Polyak, Research Scientist, Dept. of Earth andPlanetary Sciences, University of New Mexico, 200 Yale Blvd., Albuquerque,NM 87131 ([email protected]), and Margaret V. Palmer, 619 Winney Hill Rd.,Oneonta, NY 13820 ([email protected]).
REFERENCES
Gunn, J., ed., 2004, Encyclopedia of caves and karst science: New York,Fitzroy Dearborn, 902 p.
Klimchouk, A., Ford, D.C., Palmer, A.N., and Dreybrodt, W., eds., 2000,Speleogenesis–Evolution of Karst Aquifers: Huntsville, AL, NationalSpeleological Society, 527 p.
Journal of Cave and Karst Studies, April 2005 • 59
BOOK REVIEW
RECOMMENDATIONSAND GUIDELINES FORMANAGING CAVES ON
PROTECTED LANDS
Jones, W.K., Hobbs, H.H., Wicks,C.M., Currie, R.R., Hose, L.D.,Kerbo, R.C., Goodbar, J.R. andTrout, J., eds., 2003, Karst WatersInstitute, Special Publication 8, 95p. Softbound, 8.5 x 11 inches.ISBN 0-9640258-7-6. $16.00 plusshipping. Order on-line athttp://www.karstwaters.org or fromPublication Sales, c/o E.L. White,4538 Miller Rd., Petersburg, PA16669-9211 ([email protected]).
The stated intent of this publication is to provide federalland managers with guidelines for the development of cave-management plans and policies based upon the Federal CaveResources Protection Act (FCRPA). It is a useful introductionto cave management (more appropriately, cave stewardship) inthe United States but is far from the definitive text on the sub-ject. While the intent is excellent, the execution has someweaknesses.
The manual is divided into three parts: Part one describesthe features to be protected and gives an overview of the sci-ence behind management guidelines. Part two describes typi-cal problems in protecting karst. Part three, which is relativelyshort, outlines management and investigative methods. In all,these three sections comprise a total of 52 pages, of which 32are devoted to the first section, which gives the impression thatthe science is more important than the recommendations andguidelines. The manual concludes with a two-page summary,references, a glossary of terms, and six appendices totaling 18pages. The appendices outline the Federal Cave ResourcesProtection Act of 1988 (FCRPA), cave management resources,the National Park Service’s criteria for significant cave desig-nation, NPS management policies, regulations and legislationrelated to NPS cave resources management, and the Bureau ofLand Management Cave and Karst circular.
Perhaps because of multiple authors, Part 1 contains somelapses and contradictions. It gives the impression that cavemanagement (more appropriately cave stewardship) deals onlywith physical cave resources, as it does not discuss the humandimension. After a statement that the goal of the FCRPA is toprotect caves and their resources, there is a comment that theFCRPA should not only be applied to “proper caves,” but alsoto other natural geologic features including natural bridges andarches, which is not in the scope of the legislation. A separatesection on limitations of the Act and how to address themwould have been useful. Citations are lacking for much of theinformation presented, a curious fact considering the emphasison scientific backing for management plans. Part 1 includesmany black-and-white photos, which are clear and well print-ed. Some show karst features in countries other than America,
which may not be appropriate for a book whose focus is onfederal land stewardship.
Parts 2 and 3 could have used more attention and space.For example, the book would have benefited from examples ofcave management plans. The preface indicates that such plansare included in an appendix, but none are given. Although cita-tions are given for what I consider some of the best texts oncave stewardship, they do not do justice to the full value theyoffer to cave stewards. It would have been useful to summarizeguiding principles and concepts, and to provide an annotatedlist of recommended readings for each subject category. Thebook does not mention the National Cave and KarstManagement Symposia, a valuable resource in the constantlyevolving field of cave and karst stewardship. It would alsohave been nice to see something from the US Fish and WildlifeService regarding their cave management plans and policies.
With such a large number of authors, more careful editingwould have been helpful in avoiding overlaps and contradic-tions. However, this is still a valuable reference for those fed-eral land managers who know little about the stewardship ofcaves and karst. I certainly recommend it as a useful introduc-tion to the subject and hope that an expanded and moredetailed volume will be forthcoming.
Reviewed by Patricia E. Seiser, Cave Stewardship Specialist, National Caveand Karst Research Institute, 1400 University Drive, Carlsbad, NM 88220([email protected]).
60 • Journal of Cave and Karst Studies, April 2005
BOOK REVIEW
WATER RESOURCESENGINEERING IN KARST
Milanovic, Petar T., 2004, BocaRaton, Florida, CRC Press, 312 p.Hardbound, 6.4 x 9.5 inches. ISBN 1-56670-671-8. $129.95. Order on-lineat http://www.crcpress.com.
This book is third in aseries by one of the world’sauthorities on engineering inkarst. Its stated goal is toguide engineers in the “geo-technical improvement ofkarstfied rock masses at damsites, around tunnels, andalong river banks.” His previ-
ous books, Karst Hydrogeology (1981) and GeologicalEngineering in Karst (2000), cover similar ground but withdifferent emphasis.
His third, the subject of this review, concerns water supply,dams, reservoirs, and tunneling in karst. A lengthy first chap-ter sets the stage with a broad introduction to karst geomor-phology and hydrology. The main chapters are aimed at prac-tical applications, with case studies that draw heavily on theauthor’s field experience in the Balkan karst as a consultantand university professor. Many other examples are drawn fromaround the world. More than 70 pages are devoted to fieldexamples of dams and reservoirs alone. The last few chaptersare short reviews of groundwater protection zoning, water trac-ing, and geophysical field methods.
Detailed instructions are given for such topics as grouting,construction of cutoff walls, determining local hydraulic con-ductivity with packer tests, and detecting the presence of con-duits. Among the most unusual and interesting techniques arethe use of PVC foil liners on reservoir bottoms, which rise andburst where underwater springs are present, and the “geo-bomb,” which is set to explode during its travel through awater-filled cave so that its whereabouts can be detected seis-mically. Only brief descriptions of tracing and geophysics aregiven, and many of the techniques are out of date. For exam-ple, there is no discussion of quantititative dye tracing. Thebook is well illustrated with diagrams and maps, most of themto support the case studies. Some diagrams could have usedmore labeling. Grayscale photographs show specialized tech-niques and some impressive effects of land and structural fail-ures in karst.
To the engineer, caves are mainly threats to structuralintegrity, and this book provides an important background thatis often lacking. Those who view karst aesthetically may betaken aback by the many descriptions of how caves can befilled with rubble, cement, or asphalt. This is not a book for thecave enthusiast, although it describes examples where “spele-ologists” are called in–rather like ghost-busters–to help withprojects.
The presentation stays at a general and somewhat non-quantitative level. This largely descriptive approach is appro-priate because it avoids the impression that karst problems canbe solved from behind a desk. There is no mention of numeri-cal analysis or computer applications, and there are few of theequations, graphs, and tables that pepper the typical engineer-ing book. One exception, carried over from previous volumes,is a curious equation for “karstification vs. depth” based onpermeability tests (p. 10). The karstification factor has no unitsand yet includes a coefficient with six significant figures.
Some case studies are included mainly for the sake of com-pleteness, as they provide sketchy details and little newinsight. A few references are so incomplete that their sourcesare difficult to track down. Outside the engineering realm afew facts have gone astray. The “deepest known shaft” is iden-tified as Gouffre Mirolda (France) at “-1773 m,” a statementthat is wrong on all counts.
There are also some idiosyncrasies in wording, as is under-standable when an author writes in a language not his own.Some are distracting but not difficult to decipher, such as“overabstraction of aquifer,” “momentarily actual base of ero-sion” (i.e., present base level), “molted asphalt,” and use of theword “dip” for water-table gradient. Some are puzzling, suchas the statement that “caves are less frequent than shafts.” Butwe are fortunate that the author has overcome the languagebarrier to share his insight. Still, more careful editing at theAmerican end would have been appropriate.
This book is best suited for the engineer who knows littleabout karst but is forced to deal with it at the professionallevel. The main overlap is with the several books emanatingfrom the Multidisciplinary Conferences on Sinkholes and theEngineering and Environmental Impacts of Karst, which areoffered biennially in the US. These volumes include moredetail on a broader range of subjects, but they do not focus soexclusively on hydrologic problems, as the Milanovic bookdoes.
General readers may find this book expensive for its size,but the cost is typical for a technical book written for special-ists. Those who own one or both of the earlier Milanovic bookswill find the new one to have considerable overlap but differ-ent emphasis. The first (1981) deals mainly with water supplyand the hydrologic function of karst and is a good complementto the third volume. The second (2000) covers many of thesame topics as the third, and they do not make as versatile apairing.
Reviewed by Arthur N. Palmer, Dept. of Earth Sciences, State University ofNew York, Oneonta, NY 13820 ([email protected]).
REFERENCES
Milanovic, P.T., 1981, Karst Hydrogeology: Littleton, Colorado, WaterResources Publications, 434 p.
Milanovic, P.T., 2000, Geological Engineering in Karst: Belgrade, Zebra, 350p.
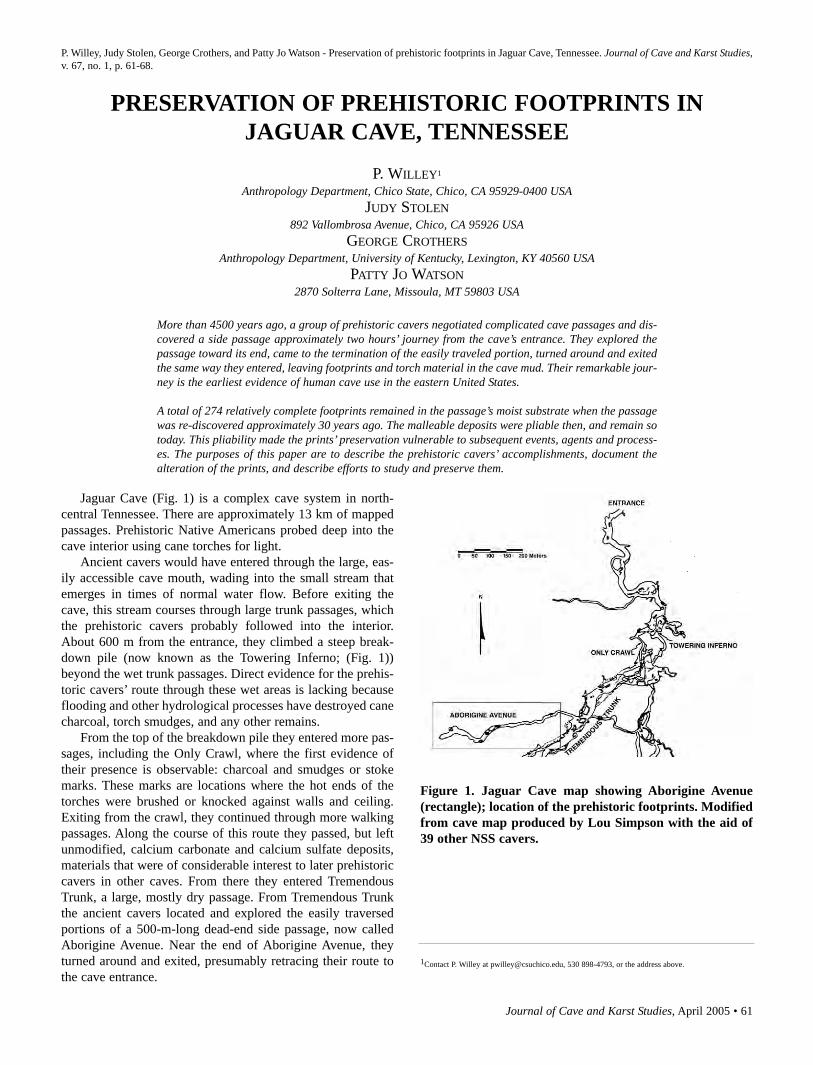
Journal of Cave and Karst Studies, April 2005 • 61
P. Willey, Judy Stolen, George Crothers, and Patty Jo Watson - Preservation of prehistoric footprints in Jaguar Cave, Tennessee. Journal of Cave and Karst Studies,v. 67, no. 1, p. 61-68.
Jaguar Cave (Fig. 1) is a complex cave system in north-central Tennessee. There are approximately 13 km of mappedpassages. Prehistoric Native Americans probed deep into thecave interior using cane torches for light.
Ancient cavers would have entered through the large, eas-ily accessible cave mouth, wading into the small stream thatemerges in times of normal water flow. Before exiting thecave, this stream courses through large trunk passages, whichthe prehistoric cavers probably followed into the interior.About 600 m from the entrance, they climbed a steep break-down pile (now known as the Towering Inferno; (Fig. 1))beyond the wet trunk passages. Direct evidence for the prehis-toric cavers’ route through these wet areas is lacking becauseflooding and other hydrological processes have destroyed canecharcoal, torch smudges, and any other remains.
From the top of the breakdown pile they entered more pas-sages, including the Only Crawl, where the first evidence oftheir presence is observable: charcoal and smudges or stokemarks. These marks are locations where the hot ends of thetorches were brushed or knocked against walls and ceiling.Exiting from the crawl, they continued through more walkingpassages. Along the course of this route they passed, but leftunmodified, calcium carbonate and calcium sulfate deposits,materials that were of considerable interest to later prehistoriccavers in other caves. From there they entered TremendousTrunk, a large, mostly dry passage. From Tremendous Trunkthe ancient cavers located and explored the easily traversedportions of a 500-m-long dead-end side passage, now calledAborigine Avenue. Near the end of Aborigine Avenue, theyturned around and exited, presumably retracing their route tothe cave entrance.
PRESERVATION OF PREHISTORIC FOOTPRINTS INJAGUAR CAVE, TENNESSEE
P. WILLEY1
Anthropology Department, Chico State, Chico, CA 95929-0400 USAJUDY STOLEN
892 Vallombrosa Avenue, Chico, CA 95926 USAGEORGE CROTHERS
Anthropology Department, University of Kentucky, Lexington, KY 40560 USAPATTY JO WATSON
2870 Solterra Lane, Missoula, MT 59803 USA
More than 4500 years ago, a group of prehistoric cavers negotiated complicated cave passages and dis-covered a side passage approximately two hours’ journey from the cave’s entrance. They explored thepassage toward its end, came to the termination of the easily traveled portion, turned around and exitedthe same way they entered, leaving footprints and torch material in the cave mud. Their remarkable jour-ney is the earliest evidence of human cave use in the eastern United States.
A total of 274 relatively complete footprints remained in the passage’s moist substrate when the passagewas re-discovered approximately 30 years ago. The malleable deposits were pliable then, and remain sotoday. This pliability made the prints’ preservation vulnerable to subsequent events, agents and process-es. The purposes of this paper are to describe the prehistoric cavers’ accomplishments, document thealteration of the prints, and describe efforts to study and preserve them.
1Contact P. Willey at [email protected], 530 898-4793, or the address above.
Figure 1. Jaguar Cave map showing Aborigine Avenue(rectangle); location of the prehistoric footprints. Modifiedfrom cave map produced by Lou Simpson with the aid of39 other NSS cavers.
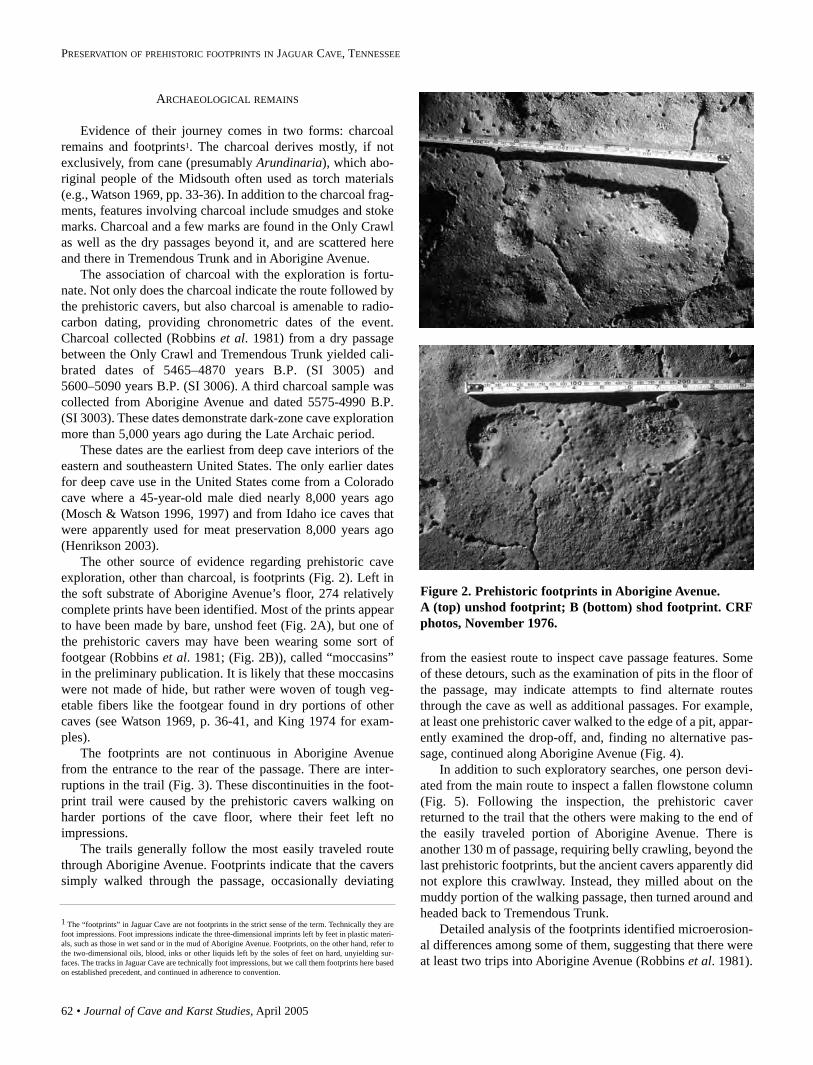
62 • Journal of Cave and Karst Studies, April 2005
PRESERVATION OF PREHISTORIC FOOTPRINTS IN JAGUAR CAVE, TENNESSEE
ARCHAEOLOGICAL REMAINS
Evidence of their journey comes in two forms: charcoalremains and footprints1. The charcoal derives mostly, if notexclusively, from cane (presumably Arundinaria), which abo-riginal people of the Midsouth often used as torch materials(e.g., Watson 1969, pp. 33-36). In addition to the charcoal frag-ments, features involving charcoal include smudges and stokemarks. Charcoal and a few marks are found in the Only Crawlas well as the dry passages beyond it, and are scattered hereand there in Tremendous Trunk and in Aborigine Avenue.
The association of charcoal with the exploration is fortu-nate. Not only does the charcoal indicate the route followed bythe prehistoric cavers, but also charcoal is amenable to radio-carbon dating, providing chronometric dates of the event.Charcoal collected (Robbins et al. 1981) from a dry passagebetween the Only Crawl and Tremendous Trunk yielded cali-brated dates of 5465–4870 years B.P. (SI 3005) and5600–5090 years B.P. (SI 3006). A third charcoal sample wascollected from Aborigine Avenue and dated 5575-4990 B.P.(SI 3003). These dates demonstrate dark-zone cave explorationmore than 5,000 years ago during the Late Archaic period.
These dates are the earliest from deep cave interiors of theeastern and southeastern United States. The only earlier datesfor deep cave use in the United States come from a Coloradocave where a 45-year-old male died nearly 8,000 years ago(Mosch & Watson 1996, 1997) and from Idaho ice caves thatwere apparently used for meat preservation 8,000 years ago(Henrikson 2003).
The other source of evidence regarding prehistoric caveexploration, other than charcoal, is footprints (Fig. 2). Left inthe soft substrate of Aborigine Avenue’s floor, 274 relativelycomplete prints have been identified. Most of the prints appearto have been made by bare, unshod feet (Fig. 2A), but one ofthe prehistoric cavers may have been wearing some sort offootgear (Robbins et al. 1981; (Fig. 2B)), called “moccasins”in the preliminary publication. It is likely that these moccasinswere not made of hide, but rather were woven of tough veg-etable fibers like the footgear found in dry portions of othercaves (see Watson 1969, p. 36-41, and King 1974 for exam-ples).
The footprints are not continuous in Aborigine Avenuefrom the entrance to the rear of the passage. There are inter-ruptions in the trail (Fig. 3). These discontinuities in the foot-print trail were caused by the prehistoric cavers walking onharder portions of the cave floor, where their feet left noimpressions.
The trails generally follow the most easily traveled routethrough Aborigine Avenue. Footprints indicate that the caverssimply walked through the passage, occasionally deviating
from the easiest route to inspect cave passage features. Someof these detours, such as the examination of pits in the floor ofthe passage, may indicate attempts to find alternate routesthrough the cave as well as additional passages. For example,at least one prehistoric caver walked to the edge of a pit, appar-ently examined the drop-off, and, finding no alternative pas-sage, continued along Aborigine Avenue (Fig. 4).
In addition to such exploratory searches, one person devi-ated from the main route to inspect a fallen flowstone column(Fig. 5). Following the inspection, the prehistoric caverreturned to the trail that the others were making to the end ofthe easily traveled portion of Aborigine Avenue. There isanother 130 m of passage, requiring belly crawling, beyond thelast prehistoric footprints, but the ancient cavers apparently didnot explore this crawlway. Instead, they milled about on themuddy portion of the walking passage, then turned around andheaded back to Tremendous Trunk.
Detailed analysis of the footprints identified microerosion-al differences among some of them, suggesting that there wereat least two trips into Aborigine Avenue (Robbins et al. 1981).
Figure 2. Prehistoric footprints in Aborigine Avenue. A (top) unshod footprint; B (bottom) shod footprint. CRFphotos, November 1976.
1 The “footprints” in Jaguar Cave are not footprints in the strict sense of the term. Technically they arefoot impressions. Foot impressions indicate the three-dimensional imprints left by feet in plastic materi-als, such as those in wet sand or in the mud of Aborigine Avenue. Footprints, on the other hand, refer tothe two-dimensional oils, blood, inks or other liquids left by the soles of feet on hard, unyielding sur-faces. The tracks in Jaguar Cave are technically foot impressions, but we call them footprints here basedon established precedent, and continued in adherence to convention.
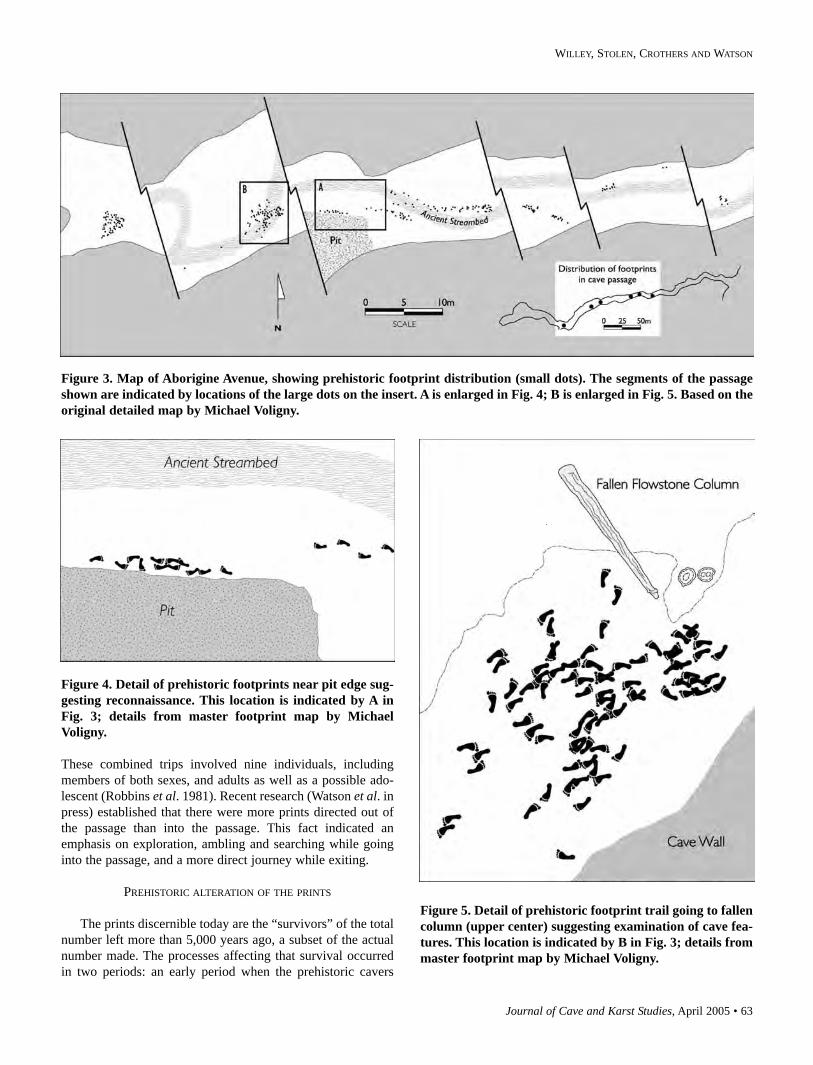
Journal of Cave and Karst Studies, April 2005 • 63
WILLEY, STOLEN, CROTHERS AND WATSON
These combined trips involved nine individuals, includingmembers of both sexes, and adults as well as a possible ado-lescent (Robbins et al. 1981). Recent research (Watson et al. inpress) established that there were more prints directed out ofthe passage than into the passage. This fact indicated anemphasis on exploration, ambling and searching while goinginto the passage, and a more direct journey while exiting.
PREHISTORIC ALTERATION OF THE PRINTS
The prints discernible today are the “survivors” of the totalnumber left more than 5,000 years ago, a subset of the actualnumber made. The processes affecting that survival occurredin two periods: an early period when the prehistoric cavers
Figure 3. Map of Aborigine Avenue, showing prehistoric footprint distribution (small dots). The segments of the passageshown are indicated by locations of the large dots on the insert. A is enlarged in Fig. 4; B is enlarged in Fig. 5. Based on theoriginal detailed map by Michael Voligny.
Figure 4. Detail of prehistoric footprints near pit edge sug-gesting reconnaissance. This location is indicated by A inFig. 3; details from master footprint map by MichaelVoligny.
Figure 5. Detail of prehistoric footprint trail going to fallencolumn (upper center) suggesting examination of cave fea-tures. This location is indicated by B in Fig. 3; details frommaster footprint map by Michael Voligny.
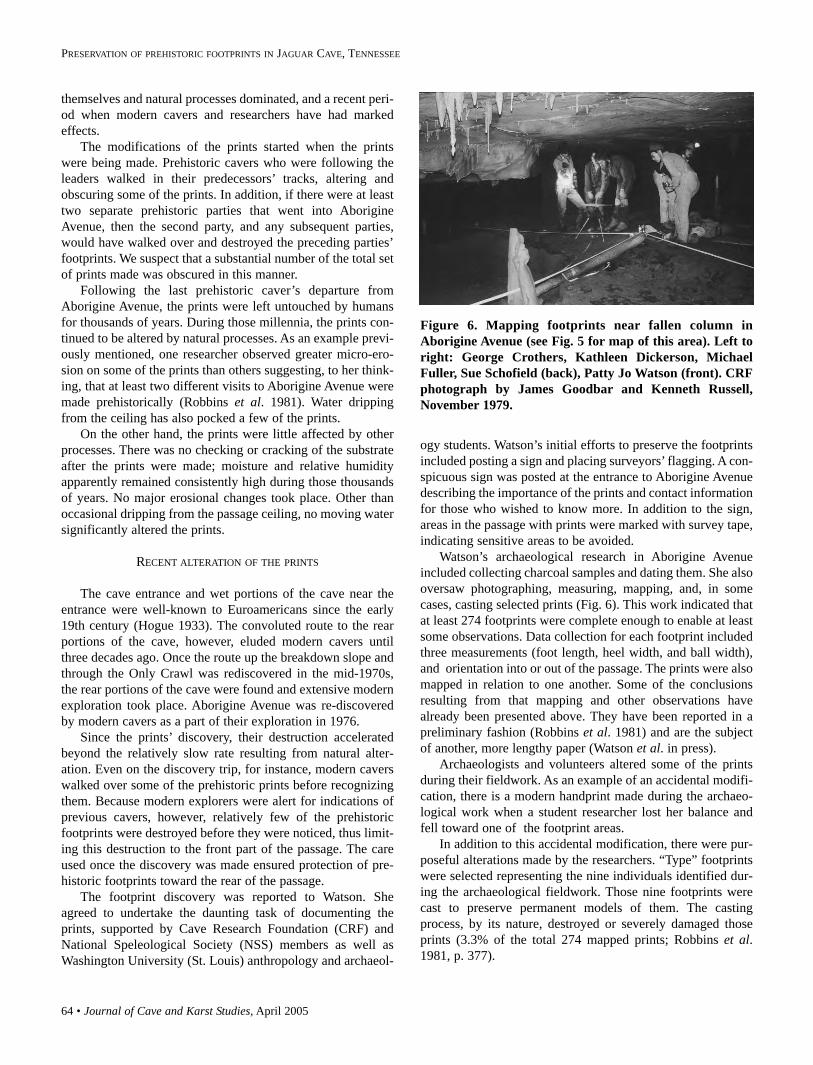
64 • Journal of Cave and Karst Studies, April 2005
PRESERVATION OF PREHISTORIC FOOTPRINTS IN JAGUAR CAVE, TENNESSEE
themselves and natural processes dominated, and a recent peri-od when modern cavers and researchers have had markedeffects.
The modifications of the prints started when the printswere being made. Prehistoric cavers who were following theleaders walked in their predecessors’ tracks, altering andobscuring some of the prints. In addition, if there were at leasttwo separate prehistoric parties that went into AborigineAvenue, then the second party, and any subsequent parties,would have walked over and destroyed the preceding parties’footprints. We suspect that a substantial number of the total setof prints made was obscured in this manner.
Following the last prehistoric caver’s departure fromAborigine Avenue, the prints were left untouched by humansfor thousands of years. During those millennia, the prints con-tinued to be altered by natural processes. As an example previ-ously mentioned, one researcher observed greater micro-ero-sion on some of the prints than others suggesting, to her think-ing, that at least two different visits to Aborigine Avenue weremade prehistorically (Robbins et al. 1981). Water drippingfrom the ceiling has also pocked a few of the prints.
On the other hand, the prints were little affected by otherprocesses. There was no checking or cracking of the substrateafter the prints were made; moisture and relative humidityapparently remained consistently high during those thousandsof years. No major erosional changes took place. Other thanoccasional dripping from the passage ceiling, no moving watersignificantly altered the prints.
RECENT ALTERATION OF THE PRINTS
The cave entrance and wet portions of the cave near theentrance were well-known to Euroamericans since the early19th century (Hogue 1933). The convoluted route to the rearportions of the cave, however, eluded modern cavers untilthree decades ago. Once the route up the breakdown slope andthrough the Only Crawl was rediscovered in the mid-1970s,the rear portions of the cave were found and extensive modernexploration took place. Aborigine Avenue was re-discoveredby modern cavers as a part of their exploration in 1976.
Since the prints’ discovery, their destruction acceleratedbeyond the relatively slow rate resulting from natural alter-ation. Even on the discovery trip, for instance, modern caverswalked over some of the prehistoric prints before recognizingthem. Because modern explorers were alert for indications ofprevious cavers, however, relatively few of the prehistoricfootprints were destroyed before they were noticed, thus limit-ing this destruction to the front part of the passage. The careused once the discovery was made ensured protection of pre-historic footprints toward the rear of the passage.
The footprint discovery was reported to Watson. Sheagreed to undertake the daunting task of documenting theprints, supported by Cave Research Foundation (CRF) andNational Speleological Society (NSS) members as well asWashington University (St. Louis) anthropology and archaeol-
ogy students. Watson’s initial efforts to preserve the footprintsincluded posting a sign and placing surveyors’ flagging. A con-spicuous sign was posted at the entrance to Aborigine Avenuedescribing the importance of the prints and contact informationfor those who wished to know more. In addition to the sign,areas in the passage with prints were marked with survey tape,indicating sensitive areas to be avoided.
Watson’s archaeological research in Aborigine Avenueincluded collecting charcoal samples and dating them. She alsooversaw photographing, measuring, mapping, and, in somecases, casting selected prints (Fig. 6). This work indicated thatat least 274 footprints were complete enough to enable at leastsome observations. Data collection for each footprint includedthree measurements (foot length, heel width, and ball width),and orientation into or out of the passage. The prints were alsomapped in relation to one another. Some of the conclusionsresulting from that mapping and other observations havealready been presented above. They have been reported in apreliminary fashion (Robbins et al. 1981) and are the subjectof another, more lengthy paper (Watson et al. in press).
Archaeologists and volunteers altered some of the printsduring their fieldwork. As an example of an accidental modifi-cation, there is a modern handprint made during the archaeo-logical work when a student researcher lost her balance andfell toward one of the footprint areas.
In addition to this accidental modification, there were pur-poseful alterations made by the researchers. “Type” footprintswere selected representing the nine individuals identified dur-ing the archaeological fieldwork. Those nine footprints werecast to preserve permanent models of them. The castingprocess, by its nature, destroyed or severely damaged thoseprints (3.3% of the total 274 mapped prints; Robbins et al.1981, p. 377).
Figure 6. Mapping footprints near fallen column inAborigine Avenue (see Fig. 5 for map of this area). Left toright: George Crothers, Kathleen Dickerson, MichaelFuller, Sue Schofield (back), Patty Jo Watson (front). CRFphotograph by James Goodbar and Kenneth Russell,November 1979.
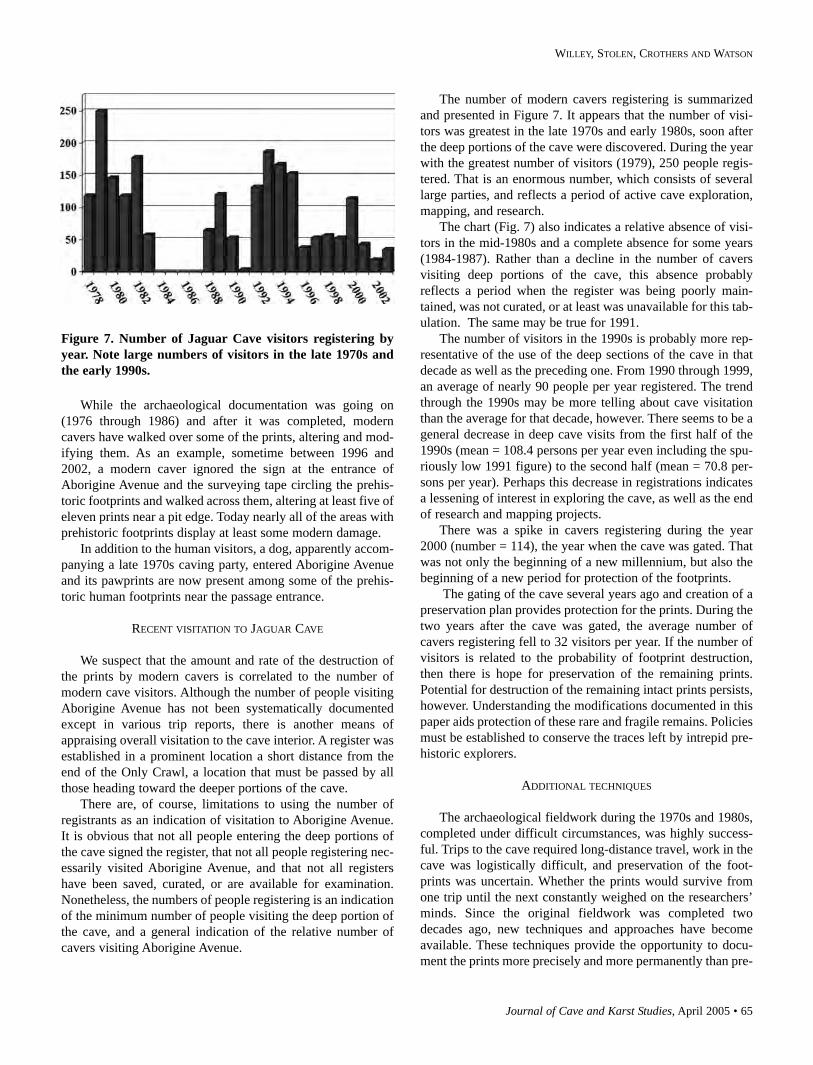
Journal of Cave and Karst Studies, April 2005 • 65
WILLEY, STOLEN, CROTHERS AND WATSON
While the archaeological documentation was going on(1976 through 1986) and after it was completed, moderncavers have walked over some of the prints, altering and mod-ifying them. As an example, sometime between 1996 and2002, a modern caver ignored the sign at the entrance ofAborigine Avenue and the surveying tape circling the prehis-toric footprints and walked across them, altering at least five ofeleven prints near a pit edge. Today nearly all of the areas withprehistoric footprints display at least some modern damage.
In addition to the human visitors, a dog, apparently accom-panying a late 1970s caving party, entered Aborigine Avenueand its pawprints are now present among some of the prehis-toric human footprints near the passage entrance.
RECENT VISITATION TO JAGUAR CAVE
We suspect that the amount and rate of the destruction ofthe prints by modern cavers is correlated to the number ofmodern cave visitors. Although the number of people visitingAborigine Avenue has not been systematically documentedexcept in various trip reports, there is another means ofappraising overall visitation to the cave interior. A register wasestablished in a prominent location a short distance from theend of the Only Crawl, a location that must be passed by allthose heading toward the deeper portions of the cave.
There are, of course, limitations to using the number ofregistrants as an indication of visitation to Aborigine Avenue.It is obvious that not all people entering the deep portions ofthe cave signed the register, that not all people registering nec-essarily visited Aborigine Avenue, and that not all registershave been saved, curated, or are available for examination.Nonetheless, the numbers of people registering is an indicationof the minimum number of people visiting the deep portion ofthe cave, and a general indication of the relative number ofcavers visiting Aborigine Avenue.
The number of modern cavers registering is summarizedand presented in Figure 7. It appears that the number of visi-tors was greatest in the late 1970s and early 1980s, soon afterthe deep portions of the cave were discovered. During the yearwith the greatest number of visitors (1979), 250 people regis-tered. That is an enormous number, which consists of severallarge parties, and reflects a period of active cave exploration,mapping, and research.
The chart (Fig. 7) also indicates a relative absence of visi-tors in the mid-1980s and a complete absence for some years(1984-1987). Rather than a decline in the number of caversvisiting deep portions of the cave, this absence probablyreflects a period when the register was being poorly main-tained, was not curated, or at least was unavailable for this tab-ulation. The same may be true for 1991.
The number of visitors in the 1990s is probably more rep-resentative of the use of the deep sections of the cave in thatdecade as well as the preceding one. From 1990 through 1999,an average of nearly 90 people per year registered. The trendthrough the 1990s may be more telling about cave visitationthan the average for that decade, however. There seems to be ageneral decrease in deep cave visits from the first half of the1990s (mean = 108.4 persons per year even including the spu-riously low 1991 figure) to the second half (mean = 70.8 per-sons per year). Perhaps this decrease in registrations indicatesa lessening of interest in exploring the cave, as well as the endof research and mapping projects.
There was a spike in cavers registering during the year2000 (number = 114), the year when the cave was gated. Thatwas not only the beginning of a new millennium, but also thebeginning of a new period for protection of the footprints.
The gating of the cave several years ago and creation of apreservation plan provides protection for the prints. During thetwo years after the cave was gated, the average number ofcavers registering fell to 32 visitors per year. If the number ofvisitors is related to the probability of footprint destruction,then there is hope for preservation of the remaining prints.Potential for destruction of the remaining intact prints persists,however. Understanding the modifications documented in thispaper aids protection of these rare and fragile remains. Policiesmust be established to conserve the traces left by intrepid pre-historic explorers.
ADDITIONAL TECHNIQUES
The archaeological fieldwork during the 1970s and 1980s,completed under difficult circumstances, was highly success-ful. Trips to the cave required long-distance travel, work in thecave was logistically difficult, and preservation of the foot-prints was uncertain. Whether the prints would survive fromone trip until the next constantly weighed on the researchers’minds. Since the original fieldwork was completed twodecades ago, new techniques and approaches have becomeavailable. These techniques provide the opportunity to docu-ment the prints more precisely and more permanently than pre-
Figure 7. Number of Jaguar Cave visitors registering byyear. Note large numbers of visitors in the late 1970s andthe early 1990s.
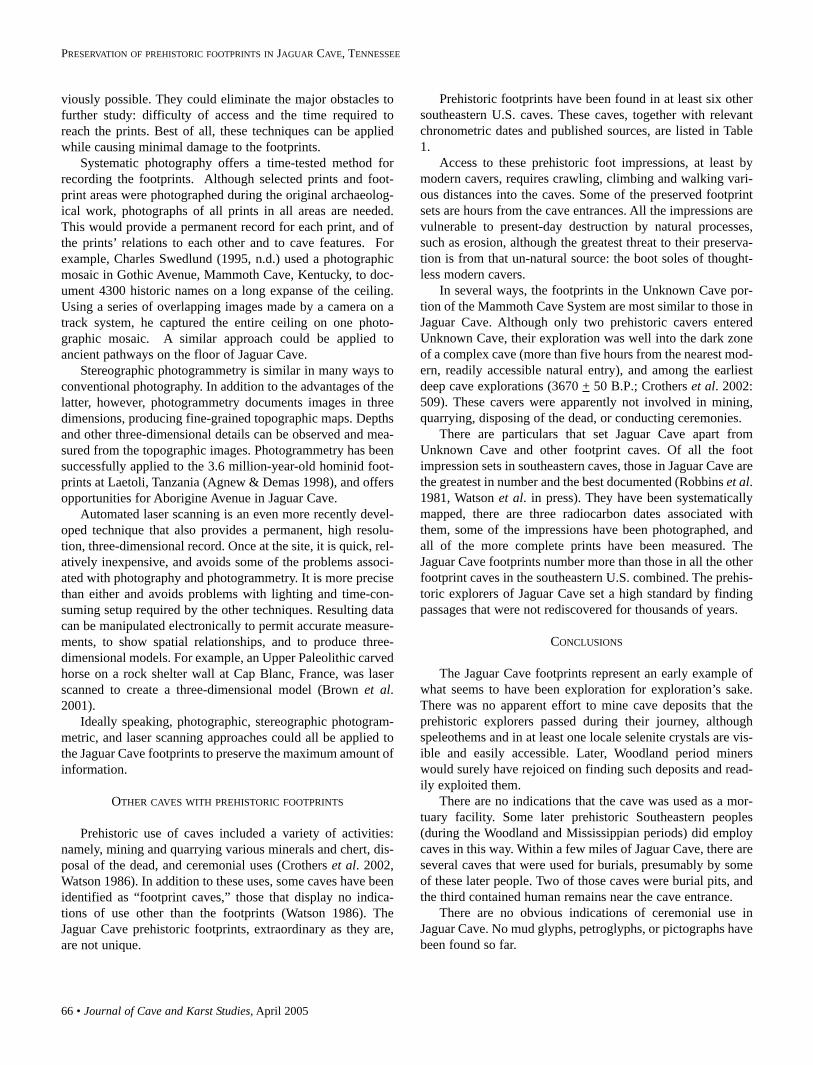
66 • Journal of Cave and Karst Studies, April 2005
PRESERVATION OF PREHISTORIC FOOTPRINTS IN JAGUAR CAVE, TENNESSEE
viously possible. They could eliminate the major obstacles tofurther study: difficulty of access and the time required toreach the prints. Best of all, these techniques can be appliedwhile causing minimal damage to the footprints.
Systematic photography offers a time-tested method forrecording the footprints. Although selected prints and foot-print areas were photographed during the original archaeolog-ical work, photographs of all prints in all areas are needed.This would provide a permanent record for each print, and ofthe prints’ relations to each other and to cave features. Forexample, Charles Swedlund (1995, n.d.) used a photographicmosaic in Gothic Avenue, Mammoth Cave, Kentucky, to doc-ument 4300 historic names on a long expanse of the ceiling.Using a series of overlapping images made by a camera on atrack system, he captured the entire ceiling on one photo-graphic mosaic. A similar approach could be applied toancient pathways on the floor of Jaguar Cave.
Stereographic photogrammetry is similar in many ways toconventional photography. In addition to the advantages of thelatter, however, photogrammetry documents images in threedimensions, producing fine-grained topographic maps. Depthsand other three-dimensional details can be observed and mea-sured from the topographic images. Photogrammetry has beensuccessfully applied to the 3.6 million-year-old hominid foot-prints at Laetoli, Tanzania (Agnew & Demas 1998), and offersopportunities for Aborigine Avenue in Jaguar Cave.
Automated laser scanning is an even more recently devel-oped technique that also provides a permanent, high resolu-tion, three-dimensional record. Once at the site, it is quick, rel-atively inexpensive, and avoids some of the problems associ-ated with photography and photogrammetry. It is more precisethan either and avoids problems with lighting and time-con-suming setup required by the other techniques. Resulting datacan be manipulated electronically to permit accurate measure-ments, to show spatial relationships, and to produce three-dimensional models. For example, an Upper Paleolithic carvedhorse on a rock shelter wall at Cap Blanc, France, was laserscanned to create a three-dimensional model (Brown et al.2001).
Ideally speaking, photographic, stereographic photogram-metric, and laser scanning approaches could all be applied tothe Jaguar Cave footprints to preserve the maximum amount ofinformation.
OTHER CAVES WITH PREHISTORIC FOOTPRINTS
Prehistoric use of caves included a variety of activities:namely, mining and quarrying various minerals and chert, dis-posal of the dead, and ceremonial uses (Crothers et al. 2002,Watson 1986). In addition to these uses, some caves have beenidentified as “footprint caves,” those that display no indica-tions of use other than the footprints (Watson 1986). TheJaguar Cave prehistoric footprints, extraordinary as they are,are not unique.
Prehistoric footprints have been found in at least six othersoutheastern U.S. caves. These caves, together with relevantchronometric dates and published sources, are listed in Table1.
Access to these prehistoric foot impressions, at least bymodern cavers, requires crawling, climbing and walking vari-ous distances into the caves. Some of the preserved footprintsets are hours from the cave entrances. All the impressions arevulnerable to present-day destruction by natural processes,such as erosion, although the greatest threat to their preserva-tion is from that un-natural source: the boot soles of thought-less modern cavers.
In several ways, the footprints in the Unknown Cave por-tion of the Mammoth Cave System are most similar to those inJaguar Cave. Although only two prehistoric cavers enteredUnknown Cave, their exploration was well into the dark zoneof a complex cave (more than five hours from the nearest mod-ern, readily accessible natural entry), and among the earliestdeep cave explorations (3670 + 50 B.P.; Crothers et al. 2002:509). These cavers were apparently not involved in mining,quarrying, disposing of the dead, or conducting ceremonies.
There are particulars that set Jaguar Cave apart fromUnknown Cave and other footprint caves. Of all the footimpression sets in southeastern caves, those in Jaguar Cave arethe greatest in number and the best documented (Robbins et al.1981, Watson et al. in press). They have been systematicallymapped, there are three radiocarbon dates associated withthem, some of the impressions have been photographed, andall of the more complete prints have been measured. TheJaguar Cave footprints number more than those in all the otherfootprint caves in the southeastern U.S. combined. The prehis-toric explorers of Jaguar Cave set a high standard by findingpassages that were not rediscovered for thousands of years.
CONCLUSIONS
The Jaguar Cave footprints represent an early example ofwhat seems to have been exploration for exploration’s sake.There was no apparent effort to mine cave deposits that theprehistoric explorers passed during their journey, althoughspeleothems and in at least one locale selenite crystals are vis-ible and easily accessible. Later, Woodland period minerswould surely have rejoiced on finding such deposits and read-ily exploited them.
There are no indications that the cave was used as a mor-tuary facility. Some later prehistoric Southeastern peoples(during the Woodland and Mississippian periods) did employcaves in this way. Within a few miles of Jaguar Cave, there areseveral caves that were used for burials, presumably by someof these later people. Two of those caves were burial pits, andthe third contained human remains near the cave entrance.
There are no obvious indications of ceremonial use inJaguar Cave. No mud glyphs, petroglyphs, or pictographs havebeen found so far.
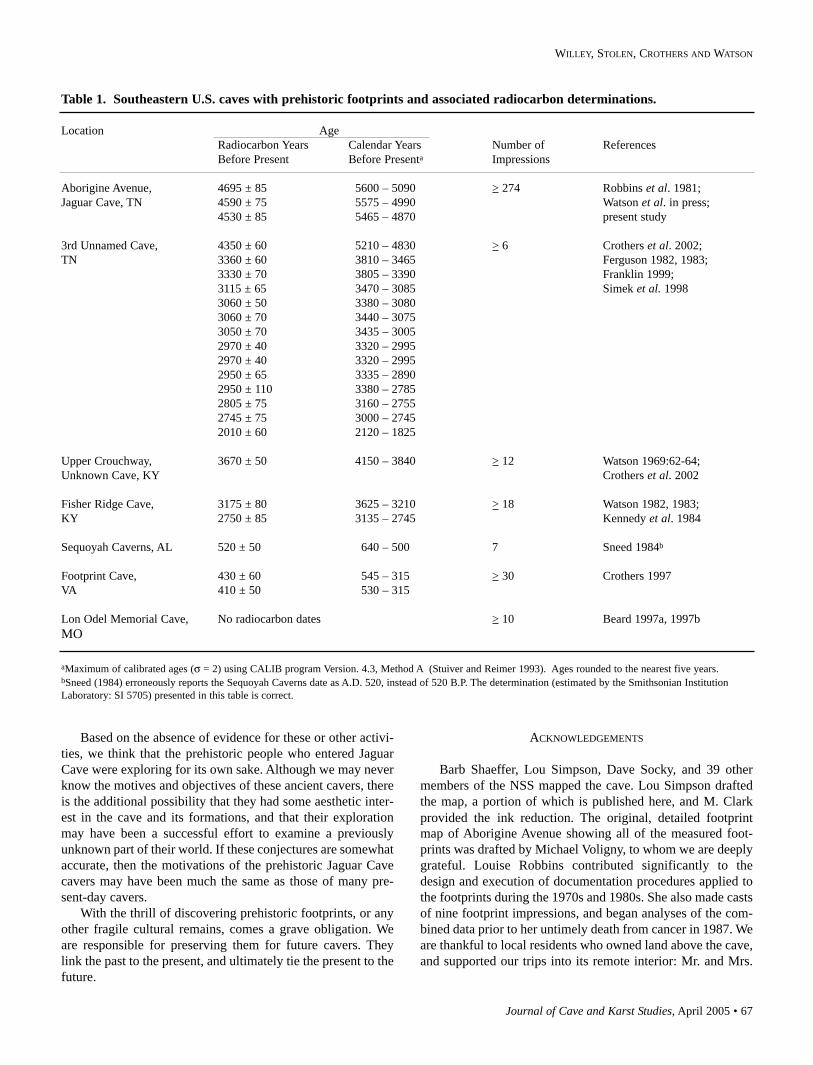
Journal of Cave and Karst Studies, April 2005 • 67
WILLEY, STOLEN, CROTHERS AND WATSON
Based on the absence of evidence for these or other activi-ties, we think that the prehistoric people who entered JaguarCave were exploring for its own sake. Although we may neverknow the motives and objectives of these ancient cavers, thereis the additional possibility that they had some aesthetic inter-est in the cave and its formations, and that their explorationmay have been a successful effort to examine a previouslyunknown part of their world. If these conjectures are somewhataccurate, then the motivations of the prehistoric Jaguar Cavecavers may have been much the same as those of many pre-sent-day cavers.
With the thrill of discovering prehistoric footprints, or anyother fragile cultural remains, comes a grave obligation. Weare responsible for preserving them for future cavers. Theylink the past to the present, and ultimately tie the present to thefuture.
ACKNOWLEDGEMENTS
Barb Shaeffer, Lou Simpson, Dave Socky, and 39 othermembers of the NSS mapped the cave. Lou Simpson draftedthe map, a portion of which is published here, and M. Clarkprovided the ink reduction. The original, detailed footprintmap of Aborigine Avenue showing all of the measured foot-prints was drafted by Michael Voligny, to whom we are deeplygrateful. Louise Robbins contributed significantly to thedesign and execution of documentation procedures applied tothe footprints during the 1970s and 1980s. She also made castsof nine footprint impressions, and began analyses of the com-bined data prior to her untimely death from cancer in 1987. Weare thankful to local residents who owned land above the cave,and supported our trips into its remote interior: Mr. and Mrs.
Table 1. Southeastern U.S. caves with prehistoric footprints and associated radiocarbon determinations.
Location AgeRadiocarbon Years Calendar Years Number of ReferencesBefore Present Before Presenta Impressions
Aborigine Avenue, 4695 ± 85 5600 – 5090 > 274 Robbins et al. 1981;Jaguar Cave, TN 4590 ± 75 5575 – 4990 Watson et al. in press;
4530 ± 85 5465 – 4870 present study
3rd Unnamed Cave, 4350 ± 60 5210 – 4830 > 6 Crothers et al. 2002; TN 3360 ± 60 3810 – 3465 Ferguson 1982, 1983;
3330 ± 70 3805 – 3390 Franklin 1999; 3115 ± 65 3470 – 3085 Simek et al. 19983060 ± 50 3380 – 30803060 ± 70 3440 – 30753050 ± 70 3435 – 30052970 ± 40 3320 – 29952970 ± 40 3320 – 29952950 ± 65 3335 – 28902950 ± 110 3380 – 27852805 ± 75 3160 – 27552745 ± 75 3000 – 27452010 ± 60 2120 – 1825
Upper Crouchway, 3670 ± 50 4150 – 3840 > 12 Watson 1969:62-64;Unknown Cave, KY Crothers et al. 2002
Fisher Ridge Cave, 3175 ± 80 3625 – 3210 > 18 Watson 1982, 1983; KY 2750 ± 85 3135 – 2745 Kennedy et al. 1984
Sequoyah Caverns, AL 520 ± 50 640 – 500 7 Sneed 1984b
Footprint Cave, 430 ± 60 545 – 315 > 30 Crothers 1997VA 410 ± 50 530 – 315
Lon Odel Memorial Cave, No radiocarbon dates > 10 Beard 1997a, 1997bMO
aMaximum of calibrated ages (σ = 2) using CALIB program Version. 4.3, Method A (Stuiver and Reimer 1993). Ages rounded to the nearest five years.bSneed (1984) erroneously reports the Sequoyah Caverns date as A.D. 520, instead of 520 B.P. The determination (estimated by the Smithsonian InstitutionLaboratory: SI 5705) presented in this table is correct.
68 • Journal of Cave and Karst Studies, April 2005
PRESERVATION OF PREHISTORIC FOOTPRINTS IN JAGUAR CAVE, TENNESSEE
Juan Copley, the Misses Lera and Loma Pile, and Mr. and Mrs.James Williams. Three people, who must remain anonymousfor reasons of cave confidentiality, provided copies of the caveregisters. CRF cavers Roger Brucker, Mark Elliott, JamesGoodbar, and Kenneth Russell provided photographs.Washington University students, CRF and NSS members, aswell as other volunteers aided the archaeological investiga-tions. Byron Wolfe, of Chico State’s Communication DesignDepartment, provided access to and instruction in scanningequipment and software. Joseph Douglas invited us to presenta paper in his Cultural Resources in Caves Symposium at the2003 NSS Convention, Porterville, CA, on which this article isbased. We also owe him a debt of gratitude for reviewing thedraft of this manuscript and generously sharing his knowledgeof Tennessee caves.
REFERENCES
Agnew, N., & Demas, M., 1998, Preserving the Laetoli footprints: ScientificAmerican, v. 279, n. 3, p. 44–55.
Beard, J.B., 1997a, Lon Odell Memorial Cave, in Taylor, R.L., ed., ExploringMissouri Caves, A Guidebook for the 1997 NSS Convention: Springfield,MO, Colorgraphic Publishing, p. 214–218.
Beard, J.B., 1997b, Lon Odell Memorial Cave, a Dade County treasure:Missouri Cave and Karst Conservancy Digest, v. 4, p. 43–48.
Brown, K.A.R., Chalmers, A., Saigol, T., Green, C., & d’Errico, F., 2001, Anautomated laser scan survey of the Upper Paleolithic rock shelter of CapBlanc: Journal of Archaeological Science, v. 28, p. 283–289.
Crothers, G.M., 1997, Archaeological site inventory form 40RU0090.Submitted to Virginia Department of Historic Resources, Richmond,Virginia.
Crothers, G.M., Faulkner, C.H., Simek, J.F., Watson, P.J., & Willey, P., 2002,Woodland cave archaeology in Eastern North America, in Anderson, D.G.,& Mainfort, R.C., Jr., eds., The Woodland Southeast: Tuscaloosa,University of Alabama Press, p. 502–524.
Ferguson, L.G., 1982, A preliminary report of archaeological investigations ata chert quarry cave in Fentress County, Tennessee. Unpublished manu-script on file, Department of Anthropology, University of Tennessee,Knoxville.
Ferguson, L.G., 1983, Abstract: An archaeological investigation of TCS#FE60: A cave in northern central Tennessee: National SpeleologicalSociety Bulletin, v. 45, p. 35.
Franklin, J.D., 1999, The rime of the ancient miners [MA thesis]: Knoxville,University of Tennessee.
Henrikson, L.S., 2003, Bison freezers and hunter-gatherer mobility:Archaeological analysis of cold lava tube caves on Idaho’s Snake RiverPlain: Plains Anthropologist, v. 48, p. 263–285.
Hogue, A.R., 1933, One Hundred Years in the Cumberland Mountains: Alongthe Continental Line: McMinnville, TN, Standard Printing Co.
Kennedy, M.C., Hensley-Martin, C., & Watson, P.J., 1984, CRF archeologicalproject —1983: Cave Research Foundation Annual Report, p. 22–23.
King, M.E., 1974, The Salts Cave textiles: A preliminary account, in Watson,P.J., ed., Archaeology of the Mammoth Cave Area: New York, AcademicPress, p. 31–40.
Mosch, C., & Watson, P., 1996, The ancient explorer of Hourglass Cave:Evolutionary Anthropology, v. 5, p. 111–114.
Mosch, C., & Watson, P., 1997, An ancient Rocky Mountain caver: Journal ofCave and Karst Studies, v. 59, p. 10–14.
Robbins, L.M., Wilson, R.C., & Watson, P.J., 1981, Paleontology and archeol-ogy of Jaguar Cave, Tennessee: Proceedings of the Eighth InternationalCongress of Speleology, v. 1, p. 377–380.
Simek, J.F., Franklin, J.D., & Sherwood, S.C., 1998, The context of earlySoutheastern prehistoric cave art: A report on the archaeology of 3rd
Unnamed Cave: American Antiquity, v. 63, p. 663–677.
Sneed, J.M., 1984, The Sequoyah Caverns story: National SpeleologicalSociety News, v. 42, p. 178–181.
Stuiver, M., & Reimer, P.J., 1993, Extended 14C database and revised CALIBradiocarbon calibration program: Radiocarbon, v. 35, p. 215–230.
Swedlund, C.A., 1995, Names without faces: The continuing photodocumen-tation of the names in Mammoth Cave: Proceedings of Mammoth CaveNational Park’s Fourth Science Conference, Mammoth Cave, Kentucky,July 6-7, 1995, p. 1–9.
Swedlund, C.A., n.d., Photographic systems designed to document names inMammoth Cave National Park. Manuscript in possession of the author.
Watson, P.J., 1969, The prehistory of Salts Cave, Kentucky: Springfield,Illinois State Museum Reports of Investigations, n. 16, 86 p.
Watson, P.J., 1982, Notes on a visit to Fisher Ridge Cave. Unpublished fieldnotes dated June 27, 1982.
Watson, P.J., 1983, CRF archeological project and shellmound archeologicalproject—1982: Cave Research Foundation Annual Report, p. 13–15.
Watson, P.J., 1986, Prehistoric cavers in the Eastern Woodlands, in Faulkner,C.H., ed., The Prehistoric Native American Art of Mud Glyph Cave:Knoxville, University of Tennessee Press, p. 109–122.
Watson, P.J., Kennedy, M.C., Willey, P., Robbins, L., & Wilson, R.C., In press,Prehistoric footprints in Jaguar Cave, Tennessee. Journal of FieldArchaeology.
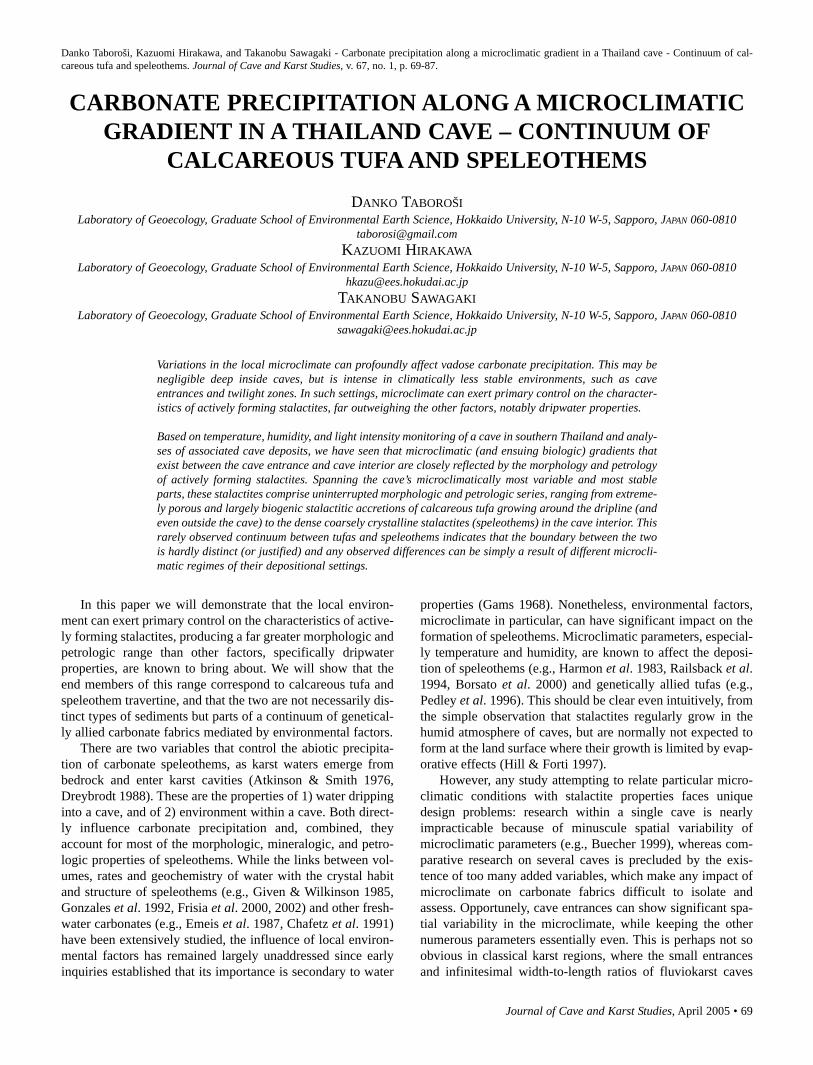
Journal of Cave and Karst Studies, April 2005 • 69
Danko Taboroši, Kazuomi Hirakawa, and Takanobu Sawagaki - Carbonate precipitation along a microclimatic gradient in a Thailand cave - Continuum of cal-careous tufa and speleothems. Journal of Cave and Karst Studies, v. 67, no. 1, p. 69-87.
In this paper we will demonstrate that the local environ-ment can exert primary control on the characteristics of active-ly forming stalactites, producing a far greater morphologic andpetrologic range than other factors, specifically dripwaterproperties, are known to bring about. We will show that theend members of this range correspond to calcareous tufa andspeleothem travertine, and that the two are not necessarily dis-tinct types of sediments but parts of a continuum of genetical-ly allied carbonate fabrics mediated by environmental factors.
There are two variables that control the abiotic precipita-tion of carbonate speleothems, as karst waters emerge frombedrock and enter karst cavities (Atkinson & Smith 1976,Dreybrodt 1988). These are the properties of 1) water drippinginto a cave, and of 2) environment within a cave. Both direct-ly influence carbonate precipitation and, combined, theyaccount for most of the morphologic, mineralogic, and petro-logic properties of speleothems. While the links between vol-umes, rates and geochemistry of water with the crystal habitand structure of speleothems (e.g., Given & Wilkinson 1985,Gonzales et al. 1992, Frisia et al. 2000, 2002) and other fresh-water carbonates (e.g., Emeis et al. 1987, Chafetz et al. 1991)have been extensively studied, the influence of local environ-mental factors has remained largely unaddressed since earlyinquiries established that its importance is secondary to water
properties (Gams 1968). Nonetheless, environmental factors,microclimate in particular, can have significant impact on theformation of speleothems. Microclimatic parameters, especial-ly temperature and humidity, are known to affect the deposi-tion of speleothems (e.g., Harmon et al. 1983, Railsback et al.1994, Borsato et al. 2000) and genetically allied tufas (e.g.,Pedley et al. 1996). This should be clear even intuitively, fromthe simple observation that stalactites regularly grow in thehumid atmosphere of caves, but are normally not expected toform at the land surface where their growth is limited by evap-orative effects (Hill & Forti 1997).
However, any study attempting to relate particular micro-climatic conditions with stalactite properties faces uniquedesign problems: research within a single cave is nearlyimpracticable because of minuscule spatial variability ofmicroclimatic parameters (e.g., Buecher 1999), whereas com-parative research on several caves is precluded by the exis-tence of too many added variables, which make any impact ofmicroclimate on carbonate fabrics difficult to isolate andassess. Opportunely, cave entrances can show significant spa-tial variability in the microclimate, while keeping the othernumerous parameters essentially even. This is perhaps not soobvious in classical karst regions, where the small entrancesand infinitesimal width-to-length ratios of fluviokarst caves
CARBONATE PRECIPITATION ALONG A MICROCLIMATICGRADIENT IN A THAILAND CAVE – CONTINUUM OF
CALCAREOUS TUFA AND SPELEOTHEMSDANKO TABOROŠI
Laboratory of Geoecology, Graduate School of Environmental Earth Science, Hokkaido University, N-10 W-5, Sapporo, JAPAN [email protected]
KAZUOMI HIRAKAWALaboratory of Geoecology, Graduate School of Environmental Earth Science, Hokkaido University, N-10 W-5, Sapporo, JAPAN 060-0810
[email protected] SAWAGAKI
Laboratory of Geoecology, Graduate School of Environmental Earth Science, Hokkaido University, N-10 W-5, Sapporo, JAPAN [email protected]
Variations in the local microclimate can profoundly affect vadose carbonate precipitation. This may benegligible deep inside caves, but is intense in climatically less stable environments, such as caveentrances and twilight zones. In such settings, microclimate can exert primary control on the character-istics of actively forming stalactites, far outweighing the other factors, notably dripwater properties.
Based on temperature, humidity, and light intensity monitoring of a cave in southern Thailand and analy-ses of associated cave deposits, we have seen that microclimatic (and ensuing biologic) gradients thatexist between the cave entrance and cave interior are closely reflected by the morphology and petrologyof actively forming stalactites. Spanning the cave’s microclimatically most variable and most stableparts, these stalactites comprise uninterrupted morphologic and petrologic series, ranging from extreme-ly porous and largely biogenic stalactitic accretions of calcareous tufa growing around the dripline (andeven outside the cave) to the dense coarsely crystalline stalactites (speleothems) in the cave interior. Thisrarely observed continuum between tufas and speleothems indicates that the boundary between the twois hardly distinct (or justified) and any observed differences can be simply a result of different microcli-matic regimes of their depositional settings.
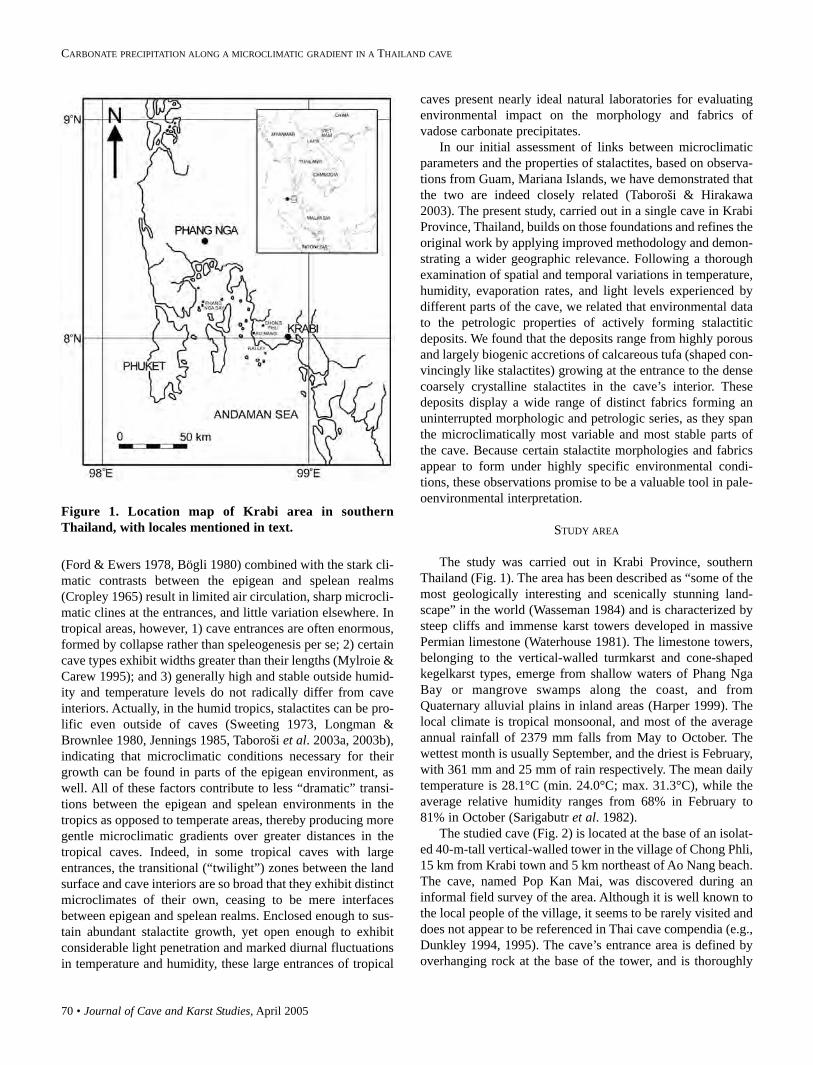
70 • Journal of Cave and Karst Studies, April 2005
CARBONATE PRECIPITATION ALONG A MICROCLIMATIC GRADIENT IN A THAILAND CAVE
(Ford & Ewers 1978, Bögli 1980) combined with the stark cli-matic contrasts between the epigean and spelean realms(Cropley 1965) result in limited air circulation, sharp microcli-matic clines at the entrances, and little variation elsewhere. Intropical areas, however, 1) cave entrances are often enormous,formed by collapse rather than speleogenesis per se; 2) certaincave types exhibit widths greater than their lengths (Mylroie &Carew 1995); and 3) generally high and stable outside humid-ity and temperature levels do not radically differ from caveinteriors. Actually, in the humid tropics, stalactites can be pro-lific even outside of caves (Sweeting 1973, Longman &Brownlee 1980, Jennings 1985, Taboroši et al. 2003a, 2003b),indicating that microclimatic conditions necessary for theirgrowth can be found in parts of the epigean environment, aswell. All of these factors contribute to less “dramatic” transi-tions between the epigean and spelean environments in thetropics as opposed to temperate areas, thereby producing moregentle microclimatic gradients over greater distances in thetropical caves. Indeed, in some tropical caves with largeentrances, the transitional (“twilight”) zones between the landsurface and cave interiors are so broad that they exhibit distinctmicroclimates of their own, ceasing to be mere interfacesbetween epigean and spelean realms. Enclosed enough to sus-tain abundant stalactite growth, yet open enough to exhibitconsiderable light penetration and marked diurnal fluctuationsin temperature and humidity, these large entrances of tropical
caves present nearly ideal natural laboratories for evaluatingenvironmental impact on the morphology and fabrics ofvadose carbonate precipitates.
In our initial assessment of links between microclimaticparameters and the properties of stalactites, based on observa-tions from Guam, Mariana Islands, we have demonstrated thatthe two are indeed closely related (Taboroši & Hirakawa2003). The present study, carried out in a single cave in KrabiProvince, Thailand, builds on those foundations and refines theoriginal work by applying improved methodology and demon-strating a wider geographic relevance. Following a thoroughexamination of spatial and temporal variations in temperature,humidity, evaporation rates, and light levels experienced bydifferent parts of the cave, we related that environmental datato the petrologic properties of actively forming stalactiticdeposits. We found that the deposits range from highly porousand largely biogenic accretions of calcareous tufa (shaped con-vincingly like stalactites) growing at the entrance to the densecoarsely crystalline stalactites in the cave’s interior. Thesedeposits display a wide range of distinct fabrics forming anuninterrupted morphologic and petrologic series, as they spanthe microclimatically most variable and most stable parts ofthe cave. Because certain stalactite morphologies and fabricsappear to form under highly specific environmental condi-tions, these observations promise to be a valuable tool in pale-oenvironmental interpretation.
STUDY AREA
The study was carried out in Krabi Province, southernThailand (Fig. 1). The area has been described as “some of themost geologically interesting and scenically stunning land-scape” in the world (Wasseman 1984) and is characterized bysteep cliffs and immense karst towers developed in massivePermian limestone (Waterhouse 1981). The limestone towers,belonging to the vertical-walled turmkarst and cone-shapedkegelkarst types, emerge from shallow waters of Phang NgaBay or mangrove swamps along the coast, and fromQuaternary alluvial plains in inland areas (Harper 1999). Thelocal climate is tropical monsoonal, and most of the averageannual rainfall of 2379 mm falls from May to October. Thewettest month is usually September, and the driest is February,with 361 mm and 25 mm of rain respectively. The mean dailytemperature is 28.1°C (min. 24.0°C; max. 31.3°C), while theaverage relative humidity ranges from 68% in February to81% in October (Sarigabutr et al. 1982).
The studied cave (Fig. 2) is located at the base of an isolat-ed 40-m-tall vertical-walled tower in the village of Chong Phli,15 km from Krabi town and 5 km northeast of Ao Nang beach.The cave, named Pop Kan Mai, was discovered during aninformal field survey of the area. Although it is well known tothe local people of the village, it seems to be rarely visited anddoes not appear to be referenced in Thai cave compendia (e.g.,Dunkley 1994, 1995). The cave’s entrance area is defined byoverhanging rock at the base of the tower, and is thoroughly
Figure 1. Location map of Krabi area in southernThailand, with locales mentioned in text.
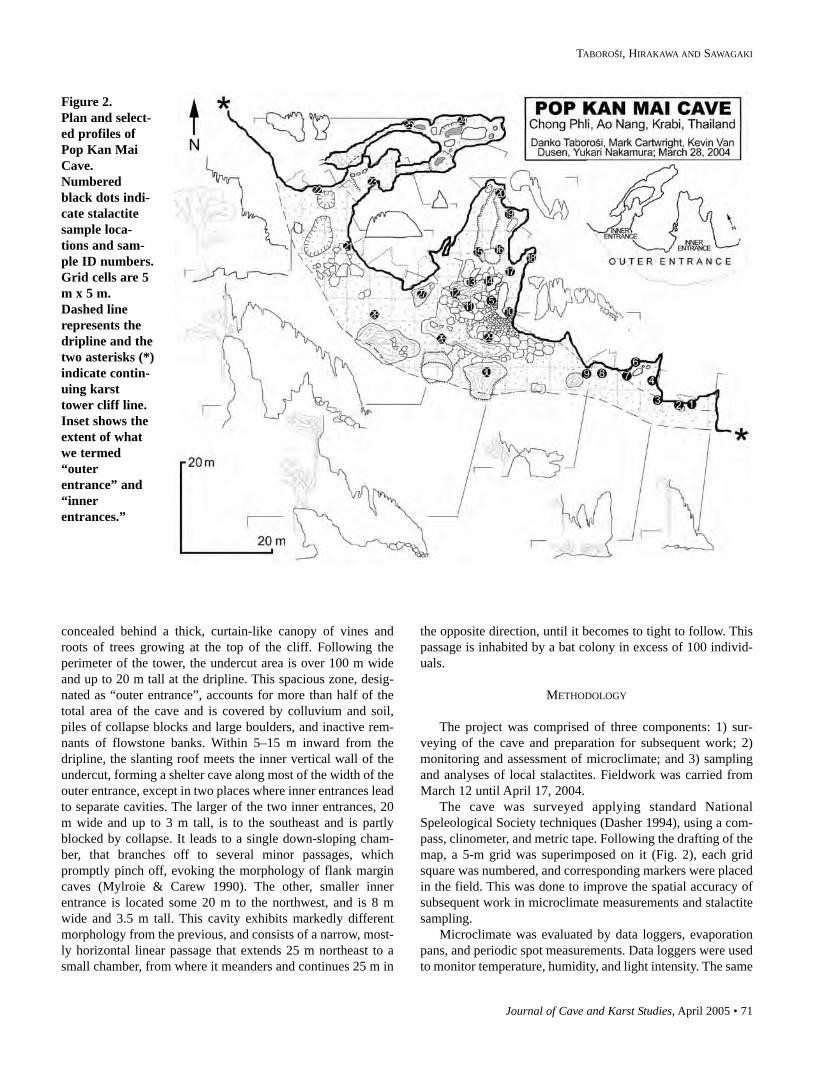
Journal of Cave and Karst Studies, April 2005 • 71
TABOROŠI, HIRAKAWA AND SAWAGAKI
concealed behind a thick, curtain-like canopy of vines androots of trees growing at the top of the cliff. Following theperimeter of the tower, the undercut area is over 100 m wideand up to 20 m tall at the dripline. This spacious zone, desig-nated as “outer entrance”, accounts for more than half of thetotal area of the cave and is covered by colluvium and soil,piles of collapse blocks and large boulders, and inactive rem-nants of flowstone banks. Within 5–15 m inward from thedripline, the slanting roof meets the inner vertical wall of theundercut, forming a shelter cave along most of the width of theouter entrance, except in two places where inner entrances leadto separate cavities. The larger of the two inner entrances, 20m wide and up to 3 m tall, is to the southeast and is partlyblocked by collapse. It leads to a single down-sloping cham-ber, that branches off to several minor passages, whichpromptly pinch off, evoking the morphology of flank margincaves (Mylroie & Carew 1990). The other, smaller innerentrance is located some 20 m to the northwest, and is 8 mwide and 3.5 m tall. This cavity exhibits markedly differentmorphology from the previous, and consists of a narrow, most-ly horizontal linear passage that extends 25 m northeast to asmall chamber, from where it meanders and continues 25 m in
the opposite direction, until it becomes to tight to follow. Thispassage is inhabited by a bat colony in excess of 100 individ-uals.
METHODOLOGY
The project was comprised of three components: 1) sur-veying of the cave and preparation for subsequent work; 2)monitoring and assessment of microclimate; and 3) samplingand analyses of local stalactites. Fieldwork was carried fromMarch 12 until April 17, 2004.
The cave was surveyed applying standard NationalSpeleological Society techniques (Dasher 1994), using a com-pass, clinometer, and metric tape. Following the drafting of themap, a 5-m grid was superimposed on it (Fig. 2), each gridsquare was numbered, and corresponding markers were placedin the field. This was done to improve the spatial accuracy ofsubsequent work in microclimate measurements and stalactitesampling.
Microclimate was evaluated by data loggers, evaporationpans, and periodic spot measurements. Data loggers were usedto monitor temperature, humidity, and light intensity. The same
Figure 2. Plan and select-ed profiles ofPop Kan MaiCave.Numberedblack dots indi-cate stalactitesample loca-tions and sam-ple ID numbers.Grid cells are 5m x 5 m.Dashed linerepresents thedripline and thetwo asterisks (*)indicate contin-uing karsttower cliff line.Inset shows theextent of whatwe termed“outerentrance” and“innerentrances.”
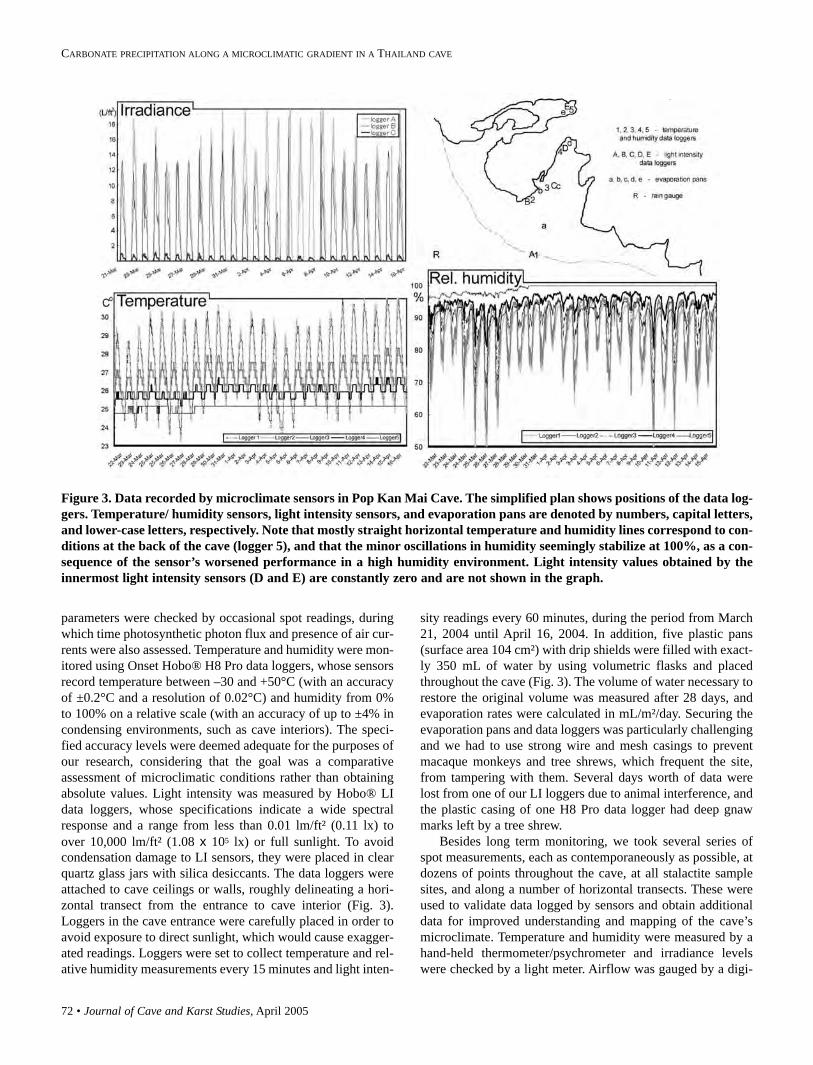
72 • Journal of Cave and Karst Studies, April 2005
CARBONATE PRECIPITATION ALONG A MICROCLIMATIC GRADIENT IN A THAILAND CAVE
parameters were checked by occasional spot readings, duringwhich time photosynthetic photon flux and presence of air cur-rents were also assessed. Temperature and humidity were mon-itored using Onset Hobo® H8 Pro data loggers, whose sensorsrecord temperature between –30 and +50°C (with an accuracyof ±0.2°C and a resolution of 0.02°C) and humidity from 0%to 100% on a relative scale (with an accuracy of up to ±4% incondensing environments, such as cave interiors). The speci-fied accuracy levels were deemed adequate for the purposes ofour research, considering that the goal was a comparativeassessment of microclimatic conditions rather than obtainingabsolute values. Light intensity was measured by Hobo® LIdata loggers, whose specifications indicate a wide spectralresponse and a range from less than 0.01 lm/ft² (0.11 lx) toover 10,000 lm/ft² (1.08 x 10⁵ lx) or full sunlight. To avoidcondensation damage to LI sensors, they were placed in clearquartz glass jars with silica desiccants. The data loggers wereattached to cave ceilings or walls, roughly delineating a hori-zontal transect from the entrance to cave interior (Fig. 3).Loggers in the cave entrance were carefully placed in order toavoid exposure to direct sunlight, which would cause exagger-ated readings. Loggers were set to collect temperature and rel-ative humidity measurements every 15 minutes and light inten-
sity readings every 60 minutes, during the period from March21, 2004 until April 16, 2004. In addition, five plastic pans(surface area 104 cm²) with drip shields were filled with exact-ly 350 mL of water by using volumetric flasks and placedthroughout the cave (Fig. 3). The volume of water necessary torestore the original volume was measured after 28 days, andevaporation rates were calculated in mL/m²/day. Securing theevaporation pans and data loggers was particularly challengingand we had to use strong wire and mesh casings to preventmacaque monkeys and tree shrews, which frequent the site,from tampering with them. Several days worth of data werelost from one of our LI loggers due to animal interference, andthe plastic casing of one H8 Pro data logger had deep gnawmarks left by a tree shrew.
Besides long term monitoring, we took several series ofspot measurements, each as contemporaneously as possible, atdozens of points throughout the cave, at all stalactite samplesites, and along a number of horizontal transects. These wereused to validate data logged by sensors and obtain additionaldata for improved understanding and mapping of the cave’smicroclimate. Temperature and humidity were measured by ahand-held thermometer/psychrometer and irradiance levelswere checked by a light meter. Airflow was gauged by a digi-
Figure 3. Data recorded by microclimate sensors in Pop Kan Mai Cave. The simplified plan shows positions of the data log-gers. Temperature/ humidity sensors, light intensity sensors, and evaporation pans are denoted by numbers, capital letters,and lower-case letters, respectively. Note that mostly straight horizontal temperature and humidity lines correspond to con-ditions at the back of the cave (logger 5), and that the minor oscillations in humidity seemingly stabilize at 100%, as a con-sequence of the sensor’s worsened performance in a high humidity environment. Light intensity values obtained by theinnermost light intensity sensors (D and E) are constantly zero and are not shown in the graph.
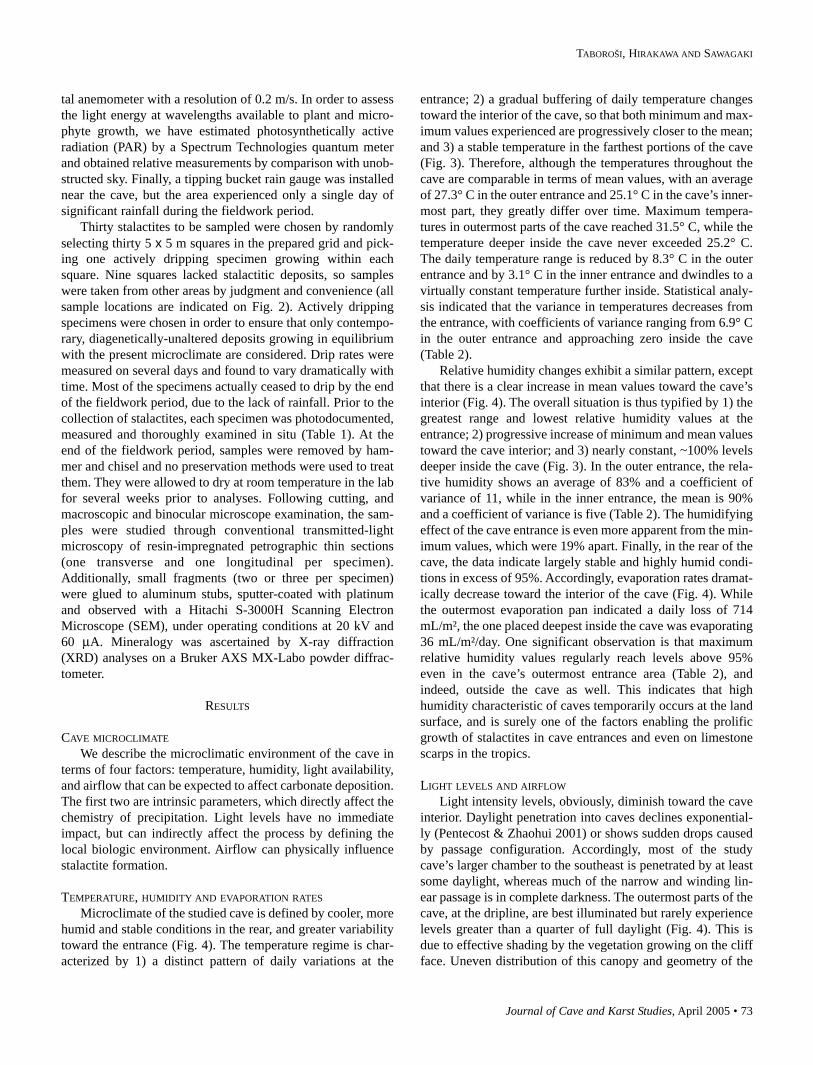
Journal of Cave and Karst Studies, April 2005 • 73
TABOROŠI, HIRAKAWA AND SAWAGAKI
tal anemometer with a resolution of 0.2 m/s. In order to assessthe light energy at wavelengths available to plant and micro-phyte growth, we have estimated photosynthetically activeradiation (PAR) by a Spectrum Technologies quantum meterand obtained relative measurements by comparison with unob-structed sky. Finally, a tipping bucket rain gauge was installednear the cave, but the area experienced only a single day ofsignificant rainfall during the fieldwork period.
Thirty stalactites to be sampled were chosen by randomlyselecting thirty 5 x 5 m squares in the prepared grid and pick-ing one actively dripping specimen growing within eachsquare. Nine squares lacked stalactitic deposits, so sampleswere taken from other areas by judgment and convenience (allsample locations are indicated on Fig. 2). Actively drippingspecimens were chosen in order to ensure that only contempo-rary, diagenetically-unaltered deposits growing in equilibriumwith the present microclimate are considered. Drip rates weremeasured on several days and found to vary dramatically withtime. Most of the specimens actually ceased to drip by the endof the fieldwork period, due to the lack of rainfall. Prior to thecollection of stalactites, each specimen was photodocumented,measured and thoroughly examined in situ (Table 1). At theend of the fieldwork period, samples were removed by ham-mer and chisel and no preservation methods were used to treatthem. They were allowed to dry at room temperature in the labfor several weeks prior to analyses. Following cutting, andmacroscopic and binocular microscope examination, the sam-ples were studied through conventional transmitted-lightmicroscopy of resin-impregnated petrographic thin sections(one transverse and one longitudinal per specimen).Additionally, small fragments (two or three per specimen)were glued to aluminum stubs, sputter-coated with platinumand observed with a Hitachi S-3000H Scanning ElectronMicroscope (SEM), under operating conditions at 20 kV and60 µA. Mineralogy was ascertained by X-ray diffraction(XRD) analyses on a Bruker AXS MX-Labo powder diffrac-tometer.
RESULTS
CAVE MICROCLIMATEWe describe the microclimatic environment of the cave in
terms of four factors: temperature, humidity, light availability,and airflow that can be expected to affect carbonate deposition.The first two are intrinsic parameters, which directly affect thechemistry of precipitation. Light levels have no immediateimpact, but can indirectly affect the process by defining thelocal biologic environment. Airflow can physically influencestalactite formation.
TEMPERATURE, HUMIDITY AND EVAPORATION RATESMicroclimate of the studied cave is defined by cooler, more
humid and stable conditions in the rear, and greater variabilitytoward the entrance (Fig. 4). The temperature regime is char-acterized by 1) a distinct pattern of daily variations at the
entrance; 2) a gradual buffering of daily temperature changestoward the interior of the cave, so that both minimum and max-imum values experienced are progressively closer to the mean;and 3) a stable temperature in the farthest portions of the cave(Fig. 3). Therefore, although the temperatures throughout thecave are comparable in terms of mean values, with an averageof 27.3° C in the outer entrance and 25.1° C in the cave’s inner-most part, they greatly differ over time. Maximum tempera-tures in outermost parts of the cave reached 31.5° C, while thetemperature deeper inside the cave never exceeded 25.2° C.The daily temperature range is reduced by 8.3° C in the outerentrance and by 3.1° C in the inner entrance and dwindles to avirtually constant temperature further inside. Statistical analy-sis indicated that the variance in temperatures decreases fromthe entrance, with coefficients of variance ranging from 6.9° Cin the outer entrance and approaching zero inside the cave(Table 2).
Relative humidity changes exhibit a similar pattern, exceptthat there is a clear increase in mean values toward the cave’sinterior (Fig. 4). The overall situation is thus typified by 1) thegreatest range and lowest relative humidity values at theentrance; 2) progressive increase of minimum and mean valuestoward the cave interior; and 3) nearly constant, ~100% levelsdeeper inside the cave (Fig. 3). In the outer entrance, the rela-tive humidity shows an average of 83% and a coefficient ofvariance of 11, while in the inner entrance, the mean is 90%and a coefficient of variance is five (Table 2). The humidifyingeffect of the cave entrance is even more apparent from the min-imum values, which were 19% apart. Finally, in the rear of thecave, the data indicate largely stable and highly humid condi-tions in excess of 95%. Accordingly, evaporation rates dramat-ically decrease toward the interior of the cave (Fig. 4). Whilethe outermost evaporation pan indicated a daily loss of 714mL/m², the one placed deepest inside the cave was evaporating36 mL/m²/day. One significant observation is that maximumrelative humidity values regularly reach levels above 95%even in the cave’s outermost entrance area (Table 2), andindeed, outside the cave as well. This indicates that highhumidity characteristic of caves temporarily occurs at the landsurface, and is surely one of the factors enabling the prolificgrowth of stalactites in cave entrances and even on limestonescarps in the tropics.
LIGHT LEVELS AND AIRFLOWLight intensity levels, obviously, diminish toward the cave
interior. Daylight penetration into caves declines exponential-ly (Pentecost & Zhaohui 2001) or shows sudden drops causedby passage configuration. Accordingly, most of the studycave’s larger chamber to the southeast is penetrated by at leastsome daylight, whereas much of the narrow and winding lin-ear passage is in complete darkness. The outermost parts of thecave, at the dripline, are best illuminated but rarely experiencelevels greater than a quarter of full daylight (Fig. 4). This isdue to effective shading by the vegetation growing on the cliffface. Uneven distribution of this canopy and geometry of the
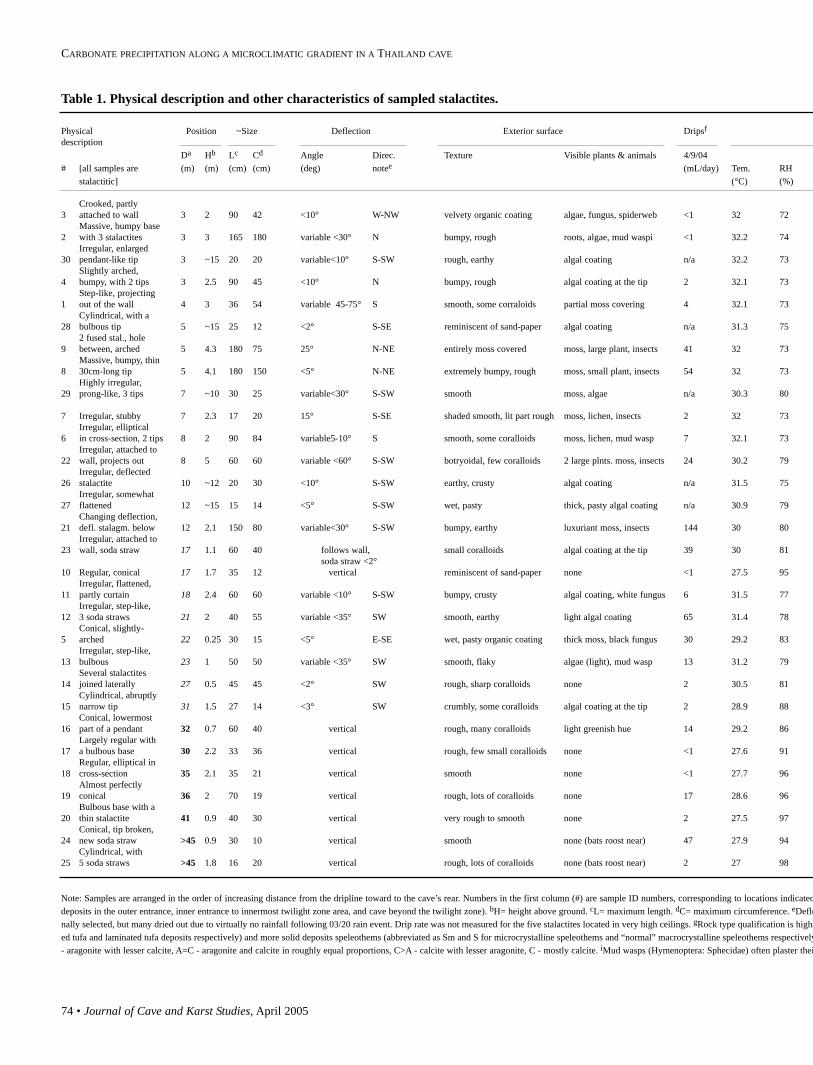
Table 1. Physical description and other characteristics of sampled stalactites.
Physical Position ~Size Deflection Exterior surface Dripsf
descriptionDa Hb Lc Cd Angle Direc. Texture Visible plants & animals 4/9/04
# [all samples are (m) (m) (cm) (cm) (deg) notee (mL/day) Tem. RH stalactitic] (°C) (%)
Crooked, partly3 attached to wall 3 2 90 42 <10° W-NW velvety organic coating algae, fungus, spiderweb <1 32 72
Massive, bumpy base2 with 3 stalactites 3 3 165 180 variable <30° N bumpy, rough roots, algae, mud waspi <1 32.2 74
Irregular, enlarged30 pendant-like tip 3 ~15 20 20 variable<10° S-SW rough, earthy algal coating n/a 32.2 73
Slightly arched,4 bumpy, with 2 tips 3 2.5 90 45 <10° N bumpy, rough algal coating at the tip 2 32.1 73
Step-like, projecting1 out of the wall 4 3 36 54 variable 45-75° S smooth, some corraloids partial moss covering 4 32.1 73
Cylindrical, with a28 bulbous tip 5 ~15 25 12 <2° S-SE reminiscent of sand-paper algal coating n/a 31.3 75
2 fused stal., hole9 between, arched 5 4.3 180 75 25° N-NE entirely moss covered moss, large plant, insects 41 32 73
Massive, bumpy, thin8 30cm-long tip 5 4.1 180 150 <5° N-NE extremely bumpy, rough moss, small plant, insects 54 32 73
Highly irregular, 29 prong-like, 3 tips 7 ~10 30 25 variable<30° S-SW smooth moss, algae n/a 30.3 80
7 Irregular, stubby 7 2.3 17 20 15° S-SE shaded smooth, lit part rough moss, lichen, insects 2 32 73Irregular, elliptical
6 in cross-section, 2 tips 8 2 90 84 variable5-10° S smooth, some coralloids moss, lichen, mud wasp 7 32.1 73Irregular, attached to
22 wall, projects out 8 5 60 60 variable <60° S-SW botryoidal, few coralloids 2 large plnts. moss, insects 24 30.2 79Irregular, deflected
26 stalactite 10 ~12 20 30 <10° S-SW earthy, crusty algal coating n/a 31.5 75Irregular, somewhat
27 flattened 12 ~15 15 14 <5° S-SW wet, pasty thick, pasty algal coating n/a 30.9 79Changing deflection,
21 defl. stalagm. below 12 2.1 150 80 variable<30° S-SW bumpy, earthy luxuriant moss, insects 144 30 80Irregular, attached to
23 wall, soda straw 17 1.1 60 40 follows wall, small coralloids algal coating at the tip 39 30 81soda straw <2°
10 Regular, conical 17 1.7 35 12 vertical reminiscent of sand-paper none <1 27.5 95Irregular, flattened,
11 partly curtain 18 2.4 60 60 variable <10° S-SW bumpy, crusty algal coating, white fungus 6 31.5 77Irregular, step-like,
12 3 soda straws 21 2 40 55 variable <35° SW smooth, earthy light algal coating 65 31.4 78Conical, slightly-
5 arched 22 0.25 30 15 <5° E-SE wet, pasty organic coating thick moss, black fungus 30 29.2 83Irregular, step-like,
13 bulbous 23 1 50 50 variable <35° SW smooth, flaky algae (light), mud wasp 13 31.2 79Several stalactites
14 joined laterally 27 0.5 45 45 <2° SW rough, sharp coralloids none 2 30.5 81Cylindrical, abruptly
15 narrow tip 31 1.5 27 14 <3° SW crumbly, some coralloids algal coating at the tip 2 28.9 88Conical, lowermost
16 part of a pendant 32 0.7 60 40 vertical rough, many coralloids light greenish hue 14 29.2 86Largely regular with
17 a bulbous base 30 2.2 33 36 vertical rough, few small coralloids none <1 27.6 91Regular, elliptical in
18 cross-section 35 2.1 35 21 vertical smooth none <1 27.7 96Almost perfectly
19 conical 36 2 70 19 vertical rough, lots of coralloids none 17 28.6 96Bulbous base with a
20 thin stalactite 41 0.9 40 30 vertical very rough to smooth none 2 27.5 97Conical, tip broken,
24 new soda straw >45 0.9 30 10 vertical smooth none (bats roost near) 47 27.9 94Cylindrical, with
25 5 soda straws >45 1.8 16 20 vertical rough, lots of coralloids none (bats roost near) 2 27 98
Note: Samples are arranged in the order of increasing distance from the dripline toward to the cave’s rear. Numbers in the first column (#) are sample ID numbers, corresponding to locations indicateddeposits in the outer entrance, inner entrance to innermost twilight zone area, and cave beyond the twilight zone). bH= height above ground. cL= maximum length. dC= maximum circumference. eDeflenally selected, but many dried out due to virtually no rainfall following 03/20 rain event. Drip rate was not measured for the five stalactites located in very high ceilings. gRock type qualification is highled tufa and laminated tufa deposits respectively) and more solid deposits speleothems (abbreviated as Sm and S for microcrystalline speleothems and “normal” macrocrystalline speleothems respectively- aragonite with lesser calcite, A=C - aragonite and calcite in roughly equal proportions, C>A - calcite with lesser aragonite, C - mostly calcite. iMud wasps (Hymenoptera: Sphecidae) often plaster thei
74 • Journal of Cave and Karst Studies, April 2005
CARBONATE PRECIPITATION ALONG A MICROCLIMATIC GRADIENT IN A THAILAND CAVE
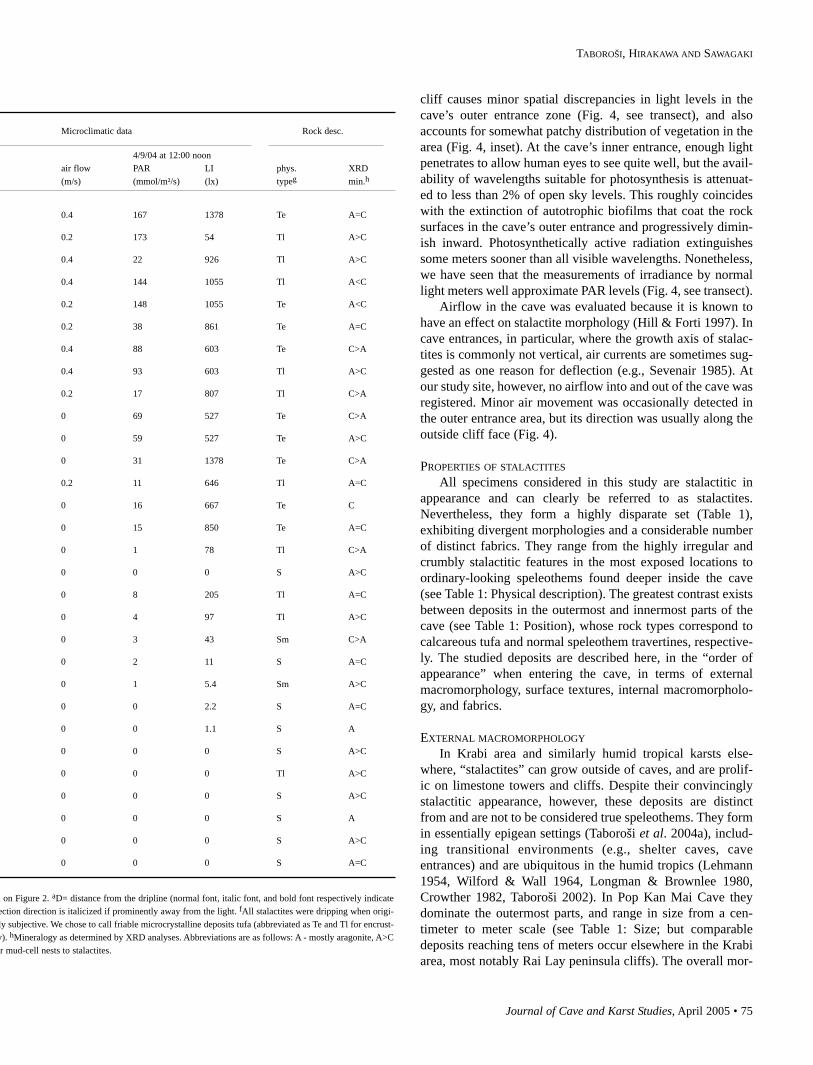
Microclimatic data Rock desc.
4/9/04 at 12:00 noonair flow PAR LI phys. XRD(m/s) (mmol/m²/s) (lx) typeg min.h
0.4 167 1378 Te A=C
0.2 173 54 Tl A>C
0.4 22 926 Tl A>C
0.4 144 1055 Tl A<C
0.2 148 1055 Te A<C
0.2 38 861 Te A=C
0.4 88 603 Te C>A
0.4 93 603 Tl A>C
0.2 17 807 Tl C>A
0 69 527 Te C>A
0 59 527 Te A>C
0 31 1378 Te C>A
0.2 11 646 Tl A=C
0 16 667 Te C
0 15 850 Te A=C
0 1 78 Tl C>A
0 0 0 S A>C
0 8 205 Tl A=C
0 4 97 Tl A>C
0 3 43 Sm C>A
0 2 11 S A=C
0 1 5.4 Sm A>C
0 0 2.2 S A=C
0 0 1.1 S A
0 0 0 S A>C
0 0 0 Tl A>C
0 0 0 S A>C
0 0 0 S A
0 0 0 S A>C
0 0 0 S A=C
d on Figure 2. aD= distance from the dripline (normal font, italic font, and bold font respectively indicateection direction is italicized if prominently away from the light. fAll stalactites were dripping when origi-ly subjective. We chose to call friable microcrystalline deposits tufa (abbreviated as Te and Tl for encrust-y). hMineralogy as determined by XRD analyses. Abbreviations are as follows: A - mostly aragonite, A>Cr mud-cell nests to stalactites.
Journal of Cave and Karst Studies, April 2005 • 75
TABOROŠI, HIRAKAWA AND SAWAGAKI
cliff causes minor spatial discrepancies in light levels in thecave’s outer entrance zone (Fig. 4, see transect), and alsoaccounts for somewhat patchy distribution of vegetation in thearea (Fig. 4, inset). At the cave’s inner entrance, enough lightpenetrates to allow human eyes to see quite well, but the avail-ability of wavelengths suitable for photosynthesis is attenuat-ed to less than 2% of open sky levels. This roughly coincideswith the extinction of autotrophic biofilms that coat the rocksurfaces in the cave’s outer entrance and progressively dimin-ish inward. Photosynthetically active radiation extinguishessome meters sooner than all visible wavelengths. Nonetheless,we have seen that the measurements of irradiance by normallight meters well approximate PAR levels (Fig. 4, see transect).
Airflow in the cave was evaluated because it is known tohave an effect on stalactite morphology (Hill & Forti 1997). Incave entrances, in particular, where the growth axis of stalac-tites is commonly not vertical, air currents are sometimes sug-gested as one reason for deflection (e.g., Sevenair 1985). Atour study site, however, no airflow into and out of the cave wasregistered. Minor air movement was occasionally detected inthe outer entrance area, but its direction was usually along theoutside cliff face (Fig. 4).
PROPERTIES OF STALACTITESAll specimens considered in this study are stalactitic in
appearance and can clearly be referred to as stalactites.Nevertheless, they form a highly disparate set (Table 1),exhibiting divergent morphologies and a considerable numberof distinct fabrics. They range from the highly irregular andcrumbly stalactitic features in the most exposed locations toordinary-looking speleothems found deeper inside the cave(see Table 1: Physical description). The greatest contrast existsbetween deposits in the outermost and innermost parts of thecave (see Table 1: Position), whose rock types correspond tocalcareous tufa and normal speleothem travertines, respective-ly. The studied deposits are described here, in the “order ofappearance” when entering the cave, in terms of externalmacromorphology, surface textures, internal macromorpholo-gy, and fabrics.
EXTERNAL MACROMORPHOLOGYIn Krabi area and similarly humid tropical karsts else-
where, “stalactites” can grow outside of caves, and are prolif-ic on limestone towers and cliffs. Despite their convincinglystalactitic appearance, however, these deposits are distinctfrom and are not to be considered true speleothems. They formin essentially epigean settings (Taboroši et al. 2004a), includ-ing transitional environments (e.g., shelter caves, caveentrances) and are ubiquitous in the humid tropics (Lehmann1954, Wilford & Wall 1964, Longman & Brownlee 1980,Crowther 1982, Taboroši 2002). In Pop Kan Mai Cave theydominate the outermost parts, and range in size from a cen-timeter to meter scale (see Table 1: Size; but comparabledeposits reaching tens of meters occur elsewhere in the Krabiarea, most notably Rai Lay peninsula cliffs). The overall mor-
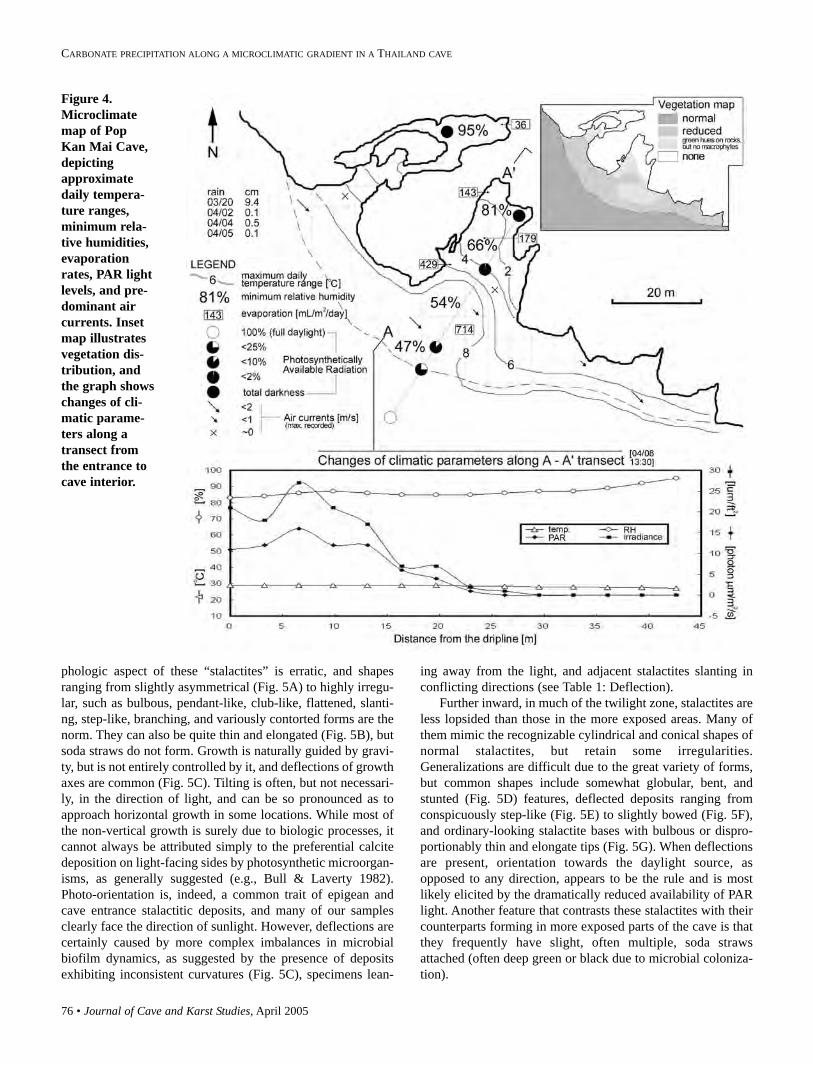
76 • Journal of Cave and Karst Studies, April 2005
CARBONATE PRECIPITATION ALONG A MICROCLIMATIC GRADIENT IN A THAILAND CAVE
phologic aspect of these “stalactites” is erratic, and shapesranging from slightly asymmetrical (Fig. 5A) to highly irregu-lar, such as bulbous, pendant-like, club-like, flattened, slanti-ng, step-like, branching, and variously contorted forms are thenorm. They can also be quite thin and elongated (Fig. 5B), butsoda straws do not form. Growth is naturally guided by gravi-ty, but is not entirely controlled by it, and deflections of growthaxes are common (Fig. 5C). Tilting is often, but not necessari-ly, in the direction of light, and can be so pronounced as toapproach horizontal growth in some locations. While most ofthe non-vertical growth is surely due to biologic processes, itcannot always be attributed simply to the preferential calcitedeposition on light-facing sides by photosynthetic microorgan-isms, as generally suggested (e.g., Bull & Laverty 1982).Photo-orientation is, indeed, a common trait of epigean andcave entrance stalactitic deposits, and many of our samplesclearly face the direction of sunlight. However, deflections arecertainly caused by more complex imbalances in microbialbiofilm dynamics, as suggested by the presence of depositsexhibiting inconsistent curvatures (Fig. 5C), specimens lean-
ing away from the light, and adjacent stalactites slanting inconflicting directions (see Table 1: Deflection).
Further inward, in much of the twilight zone, stalactites areless lopsided than those in the more exposed areas. Many ofthem mimic the recognizable cylindrical and conical shapes ofnormal stalactites, but retain some irregularities.Generalizations are difficult due to the great variety of forms,but common shapes include somewhat globular, bent, andstunted (Fig. 5D) features, deflected deposits ranging fromconspicuously step-like (Fig. 5E) to slightly bowed (Fig. 5F),and ordinary-looking stalactite bases with bulbous or dispro-portionably thin and elongate tips (Fig. 5G). When deflectionsare present, orientation towards the daylight source, asopposed to any direction, appears to be the rule and is mostlikely elicited by the dramatically reduced availability of PARlight. Another feature that contrasts these stalactites with theircounterparts forming in more exposed parts of the cave is thatthey frequently have slight, often multiple, soda strawsattached (often deep green or black due to microbial coloniza-tion).
Figure 4.Microclimatemap of PopKan Mai Cave,depictingapproximatedaily tempera-ture ranges,minimum rela-tive humidities,evaporationrates, PAR lightlevels, and pre-dominant aircurrents. Insetmap illustratesvegetation dis-tribution, andthe graph showschanges of cli-matic parame-ters along atransect fromthe entrance tocave interior.
Journal of Cave and Karst Studies, April 2005 • 77
TABOROŠI, HIRAKAWA AND SAWAGAKI
Proceeding deeper into the cave, in the inner parts of thetwilight zone and beyond, the morphology of stalactites grad-ually becomes no different from typical speleothems knownfrom elsewhere. Reaching about 1.5 meters in length, theyexhibit the familiar conical shapes (Fig. 5H), well developedsoda straws, and strictly vertical growth axes (Fig. 5I).
SURFACE TEXTURESThe outer surfaces of stalactitic deposits in areas exposed
to daylight exhibit a unique “organic” feel and distinctive paleto deep dark green, brownish, gray, and black coloration (Fig.5A). Specimens found in the most exposed portions of the cave(as well as those outside it) are covered by moist and velvetycoatings of algae, lichens, and especially mosses (Fig. 5B; 5C;also see Table 1: Exterior surface). In some cases, these outsidelayers can be dry and exhibit desiccation cracks, wrinkles, andflaking. Such dehydrated stages are probably a part of theannual cycle. Also evident can be roots of higher plants, whichgrow nearby or emerge from the stalactites themselves (Fig.5B).
Further into the twilight zone, the obvious growths ofbryophytes and higher plants are replaced by epilithic micro-bial biofilms, resulting in wet and pasty or powdery or earthy
coatings (Fig. 5D; 5E; 5F). These organic layers can vary sig-nificantly in composition, causing sundry coloration: white,gray, yellowish, light to dark green and brown, purplish, andblack. The biofilms are particularly pronounced on the sidesfacing the light (Fig. 5E), and support prolific colonies ofprokaryotes and microphytes. The portions of the stalactitesfacing the darkness of the cave generally lack such biologicconsistency and their surfaces are flat and smooth, rough orbotryoidal, or exhibit jagged coralloid textures.
In the innermost twilight zone and deeper into the cave,significant biofilms gradually diminish, receding to the mostdamp areas near the stalactites’ growing tips (Fig. 5G) andeventually dying out. As abiotic surfaces take over, stalactitesgradually gain the crystalline luster of typical speleothems.They are colored white, yellowish, light gray, or brown, andtheir most common textures are coralloid, slightly rough (Fig.5H), and smooth surfaces (Fig. 5I).
INTERNAL MACROMORPHOLOGYInternal structure of stalactitic deposits found around the
dripline is in stark contrast with usual cave speleothems. Theyare generally lightweight, porous, and friable, and many areweak enough to be plucked by hand. When broken, they revealvuggy interiors, white to gray or brown, and composed ofmouldy or layered calcareous tufa. They often contain soil andplant material (Fig. 6A), and almost invariably lack sparrycrystals. Some of the most typical structures result frombryophyte encrustation and are composed of extremely porousspongy frameworks which may entirely lack (Fig. 6B) or dis-play only rudimentary layering (Fig. 6C). Also common arelaminated tufa deposits, which may be combined with encrust-ed fabrics (Fig. 6D) or concentrically layered and homoge-neous, but nonetheless highly porous (Fig. 6E). Finally, insome cases, the laminae are surprisingly fine and ordered andconvincingly resemble normal speleothems, but the depositscrumble easily and are fragile and powdery, reminiscent moreof chalk than travertine (Fig. 6F).
Inside much of the cave’s twilight zone, stalactites aredenser and less porous than their analogues from the moreexposed locations, but are still generally flimsy and can con-tain prominent voids (Fig. 6G). Classification is difficult dueto the great diversity of morphologies and fabrics exhibited byindividual specimens, but mostly microcrystalline makeup,with fairly irregular layering and some coarsely crystalline cal-cite, is the norm recognizable in most hand samples (Fig. 6H).Essentially, these deposits are transitional forms between theextremely irregular epigean tufa stalactites and normal cavespeleothems. Some specimens can be heterogeneous, exhibit-ing discrepancies between light-facing sides (more tufa-like)and darkness-facing portions (more speleothem-like). In gen-eral, the former are vuggy and less organized, whereas the lat-ter are denser and evenly laminated.
Further into the cave, stalactites are progressively dominat-ed by solid, regular, concentrically layered coarsely crystallinestructures (Fig. 6I). At the rear parts of the twilight zone, the
Table 2. Descriptive statistics for the microclimate of PopKan Mai Cave. Note that maximum humidity levels expe-rienced at the dripline (and probably outside the cave aswell) are comparable to those deep inside the cave. This iscertainly one of the factors allowing stalactite growth inepigean settings in the tropics. Also note that data logger 2exhibits a greater temperature range and maximum valuethan logger 1, even though it was placed more inward fromthe dripline. This is probably due to uneven shading by thecanopy.
Cave area Outermost Outer Twilight Twilight Cavedripline entrance zone front zone rear interior
Data logger ID 1 2 3 4 5
Temperature (°C)Mean 27.3 27.3 26.7 25.9 25.1 Minimum 23.6 23.2 25.2 25.2 24.8 Maximum 31.1 31.5 28.3 26.7 25.2 Range 7.5 8.3 3.1 1.6 0.4 Standard deviation 1.8 1.9 0.6 0.3 0.1 Variance 3.1 3.6 0.4 0.1 0.0 Coeff. of variance 6.4 6.9 2.3 1.2 0.5
Relative humidity (%)Mean 83 87 90 95 99 Minimum 47 54 66 81 95 Maximum 96 97 96 98 100 Range 49 43 29 18 5 Standard deviation 9 9 4 3 1 Variance 79 74 19 7 2 Coeff. of variance 11 10 5 3 1
Data logger ID A B C D E
Light intensity (lx)Maximum 275.5 212.1 12.9 0.0 0.0
78 • Journal of Cave and Karst Studies, April 2005
CARBONATE PRECIPITATION ALONG A MICROCLIMATIC GRADIENT IN A THAILAND CAVE
familiar dense laminae and sparry crystals are the standardcomposition, although some micritic material remains locallyenclosed. The latter gradually recedes in specimens beyond thetwilight zone, as stalactites assume the macrocrystalline make-up and consistent structure of typical speleothems.
STALACTITE FABRICSPetrology of the stalactites we investigated is extremely
varied. Containing both calcite and aragonite, they exhibit abewildering array of fabrics, which contrast considerablyamong, but also within, individual specimens. As a prelimi-nary classification, they can be broadly grouped into predomi-nantly microcrystalline and macrocrystalline fabrics, in theorder of progression from the most exposed to best enclosedparts of the cave (Table 3).
In general, microcrystalline fabrics correspond to calcare-ous tufa (or rather, an unusual subaerial, stalactitic form of it)and many are comparable to those well known from aquatic,traditional tufa deposits. They characterize the relatively openand microclimatically variable parts of the cave, with encrust-ed macrophyte fabrics (Fig. 7A; 7B) dominating the mostexposed areas, and encrusted microbial fabrics (Fig. 7C; 7D)and amorphous (Fig. 7D; 7E) and laminated microcrystallinefabrics (Fig. 7E; 7F) typifying the twilight zone. In the innerreaches of the twilight zone, the fabrics become progressivelyordered, less porous, and gradually dominated by spar (Fig.7G; 7H). Within the stable and humid conditions beyond thetwilight zone, the fabrics come to reflect ordinary speleothems(Fig. 7I).
The end member found in the cave’s outermost parts isencrusted fabrics almost entirely bioconstructed by calcite pre-cipitation on plant structures. They develop by deposition ofmicrocrystalline CaCO3 on exposed plant surfaces, resulting inhighly porous (exceeding 90% porosity) fragile structures. Arepresentative example is extremely vuggy lace-like networks(Fig. 7A) that have evidently formed by encrustation ofbryophytes, which colonize vadose water drip points andwhose living shrubs continue to grow as older parts becomeincorporated into incipient stalactitic deposits. The characteris-tic morphologies display well-defined molds and remains ofmoss stems and protonema (which also occur within other fab-rics; Fig. 7E - top right) and are quite comparable to biogenicfabrics observed in conventional tufa (e.g., Weijermars et al.1986). Similarly irregular, porous and easily recognizable tufafabrics (Fig. 7B) form when hanging plant roots influence andguide the deposition of calcite by providing support and nucle-ation sites (resulting in tufaceous equivalents of cave rootsi-cles; see Taboroši et al. 2004b).
Microbial structures can also become encrusted by calcite(Fig. 8A), resulting in yet another series of distinct fabrics.One of the most fascinating encrusted microbial morphologiesdevelops by calcification of colonies of filamentous cyanobac-teria (Fig. 7C), which grow on the surfaces of stalactitesreached by sufficient light to enable photosynthesis. Calcite isprecipitated on the surfaces of cyanobacterial filaments, creat-
ing hollow tubes surrounded by one to several layers of calcite.Groups of filaments may be oriented along consistent axes orbe randomly tangled, and the pore space between them may beempty or infilled by secondary calcite. In addition to filamen-tous cyanobacteria, numerous other calcified and uncalcifiedmicrobes and microbial structures (Fig. 8B) are exceedinglycommon in the twilight zone.
Alongside encrusted morphologies, stalactitic deposits atthe entrance and in the twilight zone comprise other micro-crystalline fabrics, both amorphous and layered. Amorphousfabrics are characterized by microcrystalline groundmass (Fig.7D; 7E), often with interspersed organic-rich material (Fig.7D), microbial structures (Fig. 8C; 8D), detrital grains andinterred invertebrate and plant fragments (Fig. 7E–top right).Pore spaces can be infilled partly or completely by secondarycalcite and aragonite (Fig. 7E–bottom right). Layered fabricsare analogous to laminated tufas and appear as highly porouslayers of optically unresolvable crystallites (Fig. 7F). In manyspecimens, the white or transparent microcrystalline laminaeare intercalated with brown and opaque organic material (Fig.7F; 7G). Equivalent structures recognized by Chafetz &Meredith (1983), Chafetz & Folk (1984) and Folk et al. (1985)in various travertine deposits are attributed to bacterial activi-ty. The laminae are seldom regular as in normal stalactites, andare generally undulatory, convoluted, and even discontinuous.They can also include layers of microsparitic or sparry calciteflanked by microcrystalline laminae, producing polycyclicspar/micrite couplets (Fig. 7G). This arrangement, as well, hasbeen previously reported from normal, aquatic tufas (e.g.,Jannsen et al. 1999, Pavlovic et al. 2002).
As the distance from the entrance increases, biogenic andamorphous structures become rare, and most deposits are orga-nized as concentrically layered microcrystalline aggregates(Fig. 8E). They are progressively less porous and more order-ly, exhibiting greater proportions of macrocrystals whileretaining some microcrystalline material (Fig. 7H; 8F; 8G).Beyond the twilight zone, most fabrics are composed of equantand columnar calcite and acicular aragonite, initially poorlyarranged (Fig. 8H) but progressively better organized anddensely layered. They come to contain no significant micro-crystalline or organic material and reflect quintessentialspeleothems (Fig. 7I; 8I).
DISCUSSION
CAVE MICROCLIMATEClimatic data from tropical caves are limited, as the major-
ity of relevant research was carried out in temperate regions. Inthe most comprehensive bibliography of spelean microclima-tology to date only a few references are related to tropicalcaves (see Wefer 1991 and references therein). The distinc-tiveness of tropical cave microclimates as opposed to those oftemperate caves was examined by Gamble et al. (2000). Byidentifying a number of idiosyncrasies that may be unique totropical caves, they showed that extant cave microclimate
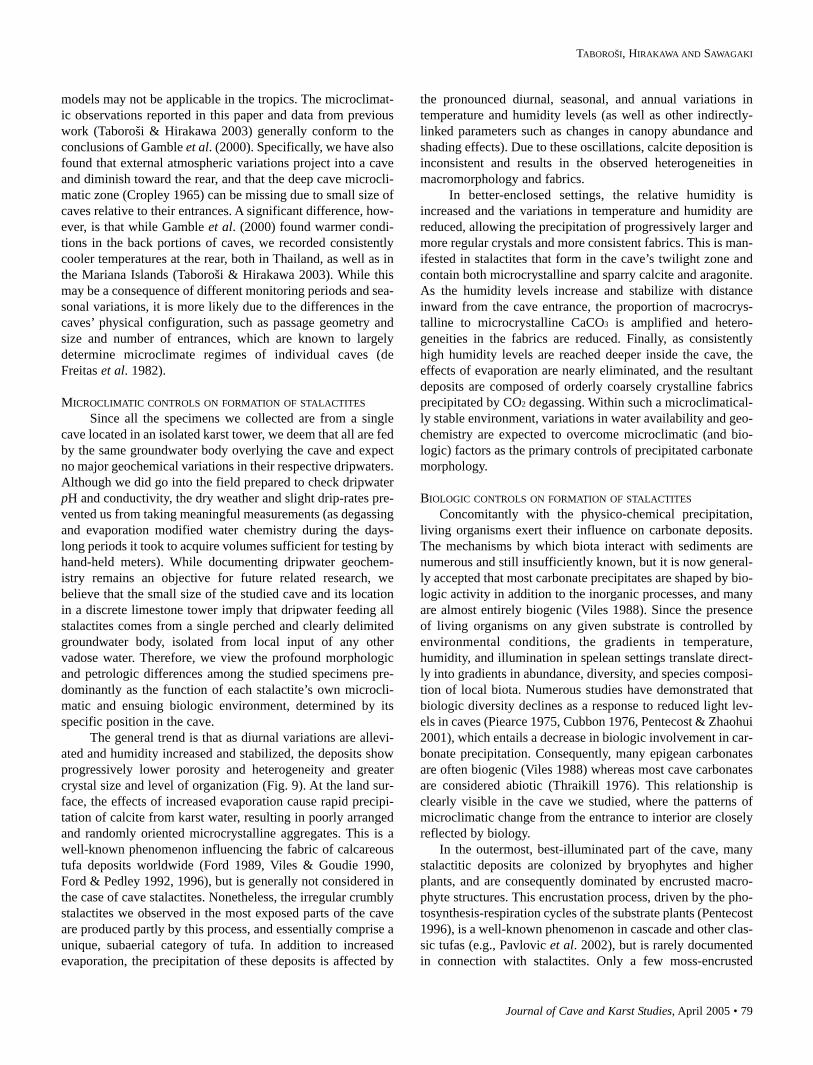
Journal of Cave and Karst Studies, April 2005 • 79
TABOROŠI, HIRAKAWA AND SAWAGAKI
models may not be applicable in the tropics. The microclimat-ic observations reported in this paper and data from previouswork (Taboroši & Hirakawa 2003) generally conform to theconclusions of Gamble et al. (2000). Specifically, we have alsofound that external atmospheric variations project into a caveand diminish toward the rear, and that the deep cave microcli-matic zone (Cropley 1965) can be missing due to small size ofcaves relative to their entrances. A significant difference, how-ever, is that while Gamble et al. (2000) found warmer condi-tions in the back portions of caves, we recorded consistentlycooler temperatures at the rear, both in Thailand, as well as inthe Mariana Islands (Taboroši & Hirakawa 2003). While thismay be a consequence of different monitoring periods and sea-sonal variations, it is more likely due to the differences in thecaves’ physical configuration, such as passage geometry andsize and number of entrances, which are known to largelydetermine microclimate regimes of individual caves (deFreitas et al. 1982).
MICROCLIMATIC CONTROLS ON FORMATION OF STALACTITESSince all the specimens we collected are from a single
cave located in an isolated karst tower, we deem that all are fedby the same groundwater body overlying the cave and expectno major geochemical variations in their respective dripwaters.Although we did go into the field prepared to check dripwaterpH and conductivity, the dry weather and slight drip-rates pre-vented us from taking meaningful measurements (as degassingand evaporation modified water chemistry during the days-long periods it took to acquire volumes sufficient for testing byhand-held meters). While documenting dripwater geochem-istry remains an objective for future related research, webelieve that the small size of the studied cave and its locationin a discrete limestone tower imply that dripwater feeding allstalactites comes from a single perched and clearly delimitedgroundwater body, isolated from local input of any othervadose water. Therefore, we view the profound morphologicand petrologic differences among the studied specimens pre-dominantly as the function of each stalactite’s own microcli-matic and ensuing biologic environment, determined by itsspecific position in the cave.
The general trend is that as diurnal variations are allevi-ated and humidity increased and stabilized, the deposits showprogressively lower porosity and heterogeneity and greatercrystal size and level of organization (Fig. 9). At the land sur-face, the effects of increased evaporation cause rapid precipi-tation of calcite from karst water, resulting in poorly arrangedand randomly oriented microcrystalline aggregates. This is awell-known phenomenon influencing the fabric of calcareoustufa deposits worldwide (Ford 1989, Viles & Goudie 1990,Ford & Pedley 1992, 1996), but is generally not considered inthe case of cave stalactites. Nonetheless, the irregular crumblystalactites we observed in the most exposed parts of the caveare produced partly by this process, and essentially comprise aunique, subaerial category of tufa. In addition to increasedevaporation, the precipitation of these deposits is affected by
the pronounced diurnal, seasonal, and annual variations intemperature and humidity levels (as well as other indirectly-linked parameters such as changes in canopy abundance andshading effects). Due to these oscillations, calcite deposition isinconsistent and results in the observed heterogeneities inmacromorphology and fabrics.
In better-enclosed settings, the relative humidity isincreased and the variations in temperature and humidity arereduced, allowing the precipitation of progressively larger andmore regular crystals and more consistent fabrics. This is man-ifested in stalactites that form in the cave’s twilight zone andcontain both microcrystalline and sparry calcite and aragonite.As the humidity levels increase and stabilize with distanceinward from the cave entrance, the proportion of macrocrys-talline to microcrystalline CaCO3 is amplified and hetero-geneities in the fabrics are reduced. Finally, as consistentlyhigh humidity levels are reached deeper inside the cave, theeffects of evaporation are nearly eliminated, and the resultantdeposits are composed of orderly coarsely crystalline fabricsprecipitated by CO2 degassing. Within such a microclimatical-ly stable environment, variations in water availability and geo-chemistry are expected to overcome microclimatic (and bio-logic) factors as the primary controls of precipitated carbonatemorphology.
BIOLOGIC CONTROLS ON FORMATION OF STALACTITESConcomitantly with the physico-chemical precipitation,
living organisms exert their influence on carbonate deposits.The mechanisms by which biota interact with sediments arenumerous and still insufficiently known, but it is now general-ly accepted that most carbonate precipitates are shaped by bio-logic activity in addition to the inorganic processes, and manyare almost entirely biogenic (Viles 1988). Since the presenceof living organisms on any given substrate is controlled byenvironmental conditions, the gradients in temperature,humidity, and illumination in spelean settings translate direct-ly into gradients in abundance, diversity, and species composi-tion of local biota. Numerous studies have demonstrated thatbiologic diversity declines as a response to reduced light lev-els in caves (Piearce 1975, Cubbon 1976, Pentecost & Zhaohui2001), which entails a decrease in biologic involvement in car-bonate precipitation. Consequently, many epigean carbonatesare often biogenic (Viles 1988) whereas most cave carbonatesare considered abiotic (Thraikill 1976). This relationship isclearly visible in the cave we studied, where the patterns ofmicroclimatic change from the entrance to interior are closelyreflected by biology.
In the outermost, best-illuminated part of the cave, manystalactitic deposits are colonized by bryophytes and higherplants, and are consequently dominated by encrusted macro-phyte structures. This encrustation process, driven by the pho-tosynthesis-respiration cycles of the substrate plants (Pentecost1996), is a well-known phenomenon in cascade and other clas-sic tufas (e.g., Pavlovic et al. 2002), but is rarely documentedin connection with stalactites. Only a few moss-encrusted
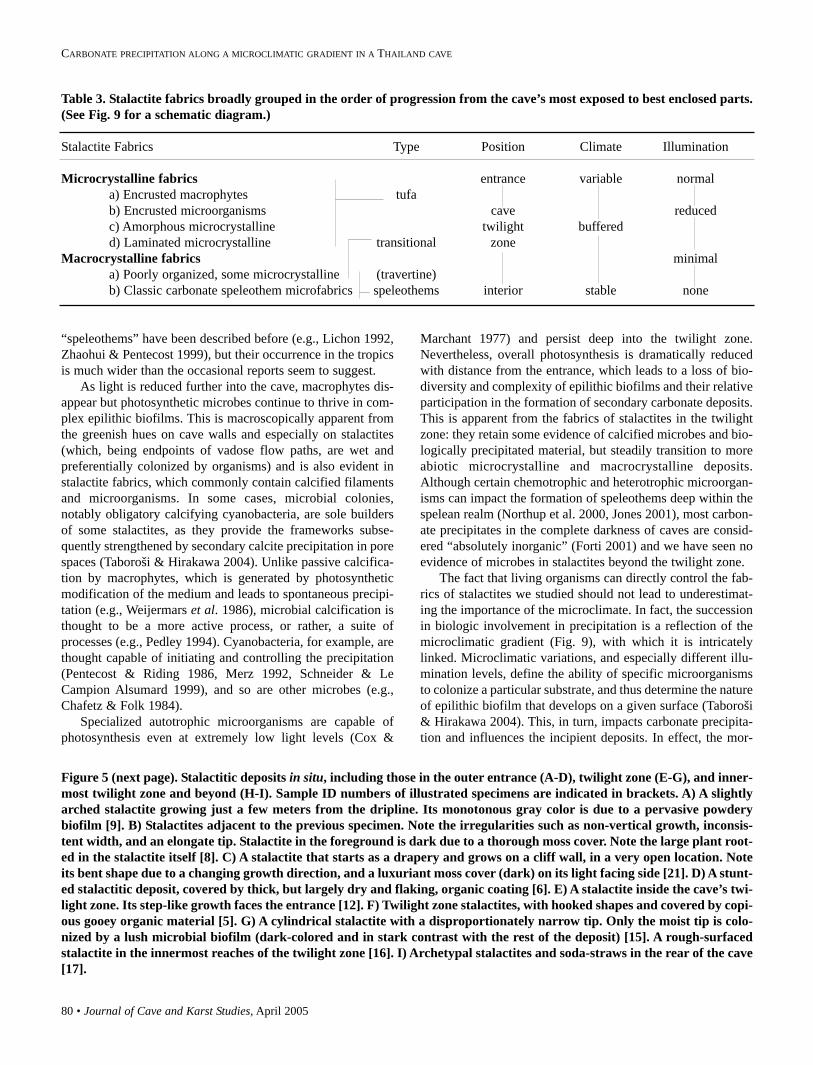
80 • Journal of Cave and Karst Studies, April 2005
CARBONATE PRECIPITATION ALONG A MICROCLIMATIC GRADIENT IN A THAILAND CAVE
“speleothems” have been described before (e.g., Lichon 1992,Zhaohui & Pentecost 1999), but their occurrence in the tropicsis much wider than the occasional reports seem to suggest.
As light is reduced further into the cave, macrophytes dis-appear but photosynthetic microbes continue to thrive in com-plex epilithic biofilms. This is macroscopically apparent fromthe greenish hues on cave walls and especially on stalactites(which, being endpoints of vadose flow paths, are wet andpreferentially colonized by organisms) and is also evident instalactite fabrics, which commonly contain calcified filamentsand microorganisms. In some cases, microbial colonies,notably obligatory calcifying cyanobacteria, are sole buildersof some stalactites, as they provide the frameworks subse-quently strengthened by secondary calcite precipitation in porespaces (Taboroši & Hirakawa 2004). Unlike passive calcifica-tion by macrophytes, which is generated by photosyntheticmodification of the medium and leads to spontaneous precipi-tation (e.g., Weijermars et al. 1986), microbial calcification isthought to be a more active process, or rather, a suite ofprocesses (e.g., Pedley 1994). Cyanobacteria, for example, arethought capable of initiating and controlling the precipitation(Pentecost & Riding 1986, Merz 1992, Schneider & LeCampion Alsumard 1999), and so are other microbes (e.g.,Chafetz & Folk 1984).
Specialized autotrophic microorganisms are capable ofphotosynthesis even at extremely low light levels (Cox &
Marchant 1977) and persist deep into the twilight zone.Nevertheless, overall photosynthesis is dramatically reducedwith distance from the entrance, which leads to a loss of bio-diversity and complexity of epilithic biofilms and their relativeparticipation in the formation of secondary carbonate deposits.This is apparent from the fabrics of stalactites in the twilightzone: they retain some evidence of calcified microbes and bio-logically precipitated material, but steadily transition to moreabiotic microcrystalline and macrocrystalline deposits.Although certain chemotrophic and heterotrophic microorgan-isms can impact the formation of speleothems deep within thespelean realm (Northup et al. 2000, Jones 2001), most carbon-ate precipitates in the complete darkness of caves are consid-ered “absolutely inorganic” (Forti 2001) and we have seen noevidence of microbes in stalactites beyond the twilight zone.
The fact that living organisms can directly control the fab-rics of stalactites we studied should not lead to underestimat-ing the importance of the microclimate. In fact, the successionin biologic involvement in precipitation is a reflection of themicroclimatic gradient (Fig. 9), with which it is intricatelylinked. Microclimatic variations, and especially different illu-mination levels, define the ability of specific microorganismsto colonize a particular substrate, and thus determine the natureof epilithic biofilm that develops on a given surface (Taboroši& Hirakawa 2004). This, in turn, impacts carbonate precipita-tion and influences the incipient deposits. In effect, the mor-
Table 3. Stalactite fabrics broadly grouped in the order of progression from the cave’s most exposed to best enclosed parts.(See Fig. 9 for a schematic diagram.)
Stalactite Fabrics Type Position Climate Illumination
Microcrystalline fabrics entrance variable normala) Encrusted macrophytes tufab) Encrusted microorganisms cave reducedc) Amorphous microcrystalline twilight bufferedd) Laminated microcrystalline transitional zone
Macrocrystalline fabrics minimala) Poorly organized, some microcrystalline (travertine)b) Classic carbonate speleothem microfabrics speleothems interior stable none
Figure 5 (next page). Stalactitic deposits in situ, including those in the outer entrance (A-D), twilight zone (E-G), and inner-most twilight zone and beyond (H-I). Sample ID numbers of illustrated specimens are indicated in brackets. A) A slightlyarched stalactite growing just a few meters from the dripline. Its monotonous gray color is due to a pervasive powderybiofilm [9]. B) Stalactites adjacent to the previous specimen. Note the irregularities such as non-vertical growth, inconsis-tent width, and an elongate tip. Stalactite in the foreground is dark due to a thorough moss cover. Note the large plant root-ed in the stalactite itself [8]. C) A stalactite that starts as a drapery and grows on a cliff wall, in a very open location. Noteits bent shape due to a changing growth direction, and a luxuriant moss cover (dark) on its light facing side [21]. D) A stunt-ed stalactitic deposit, covered by thick, but largely dry and flaking, organic coating [6]. E) A stalactite inside the cave’s twi-light zone. Its step-like growth faces the entrance [12]. F) Twilight zone stalactites, with hooked shapes and covered by copi-ous gooey organic material [5]. G) A cylindrical stalactite with a disproportionately narrow tip. Only the moist tip is colo-nized by a lush microbial biofilm (dark-colored and in stark contrast with the rest of the deposit) [15]. A rough-surfacedstalactite in the innermost reaches of the twilight zone [16]. I) Archetypal stalactites and soda-straws in the rear of the cave[17].
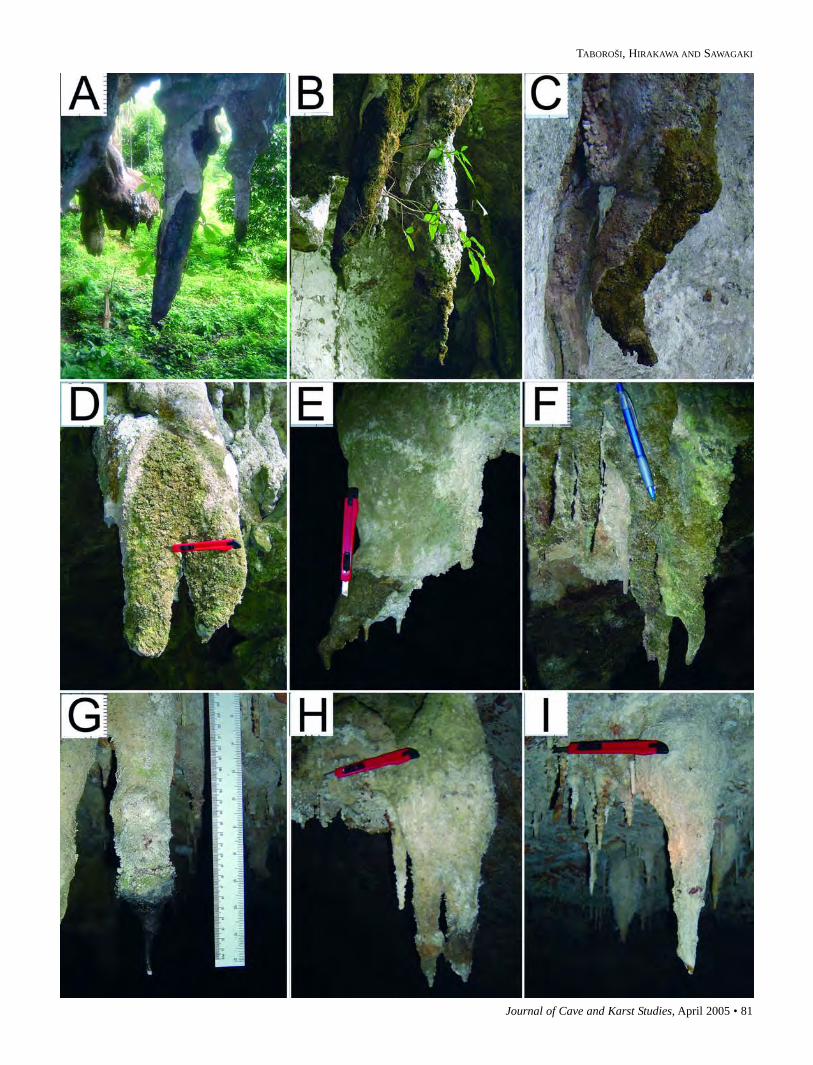
Journal of Cave and Karst Studies, April 2005 • 81
TABOROŠI, HIRAKAWA AND SAWAGAKI
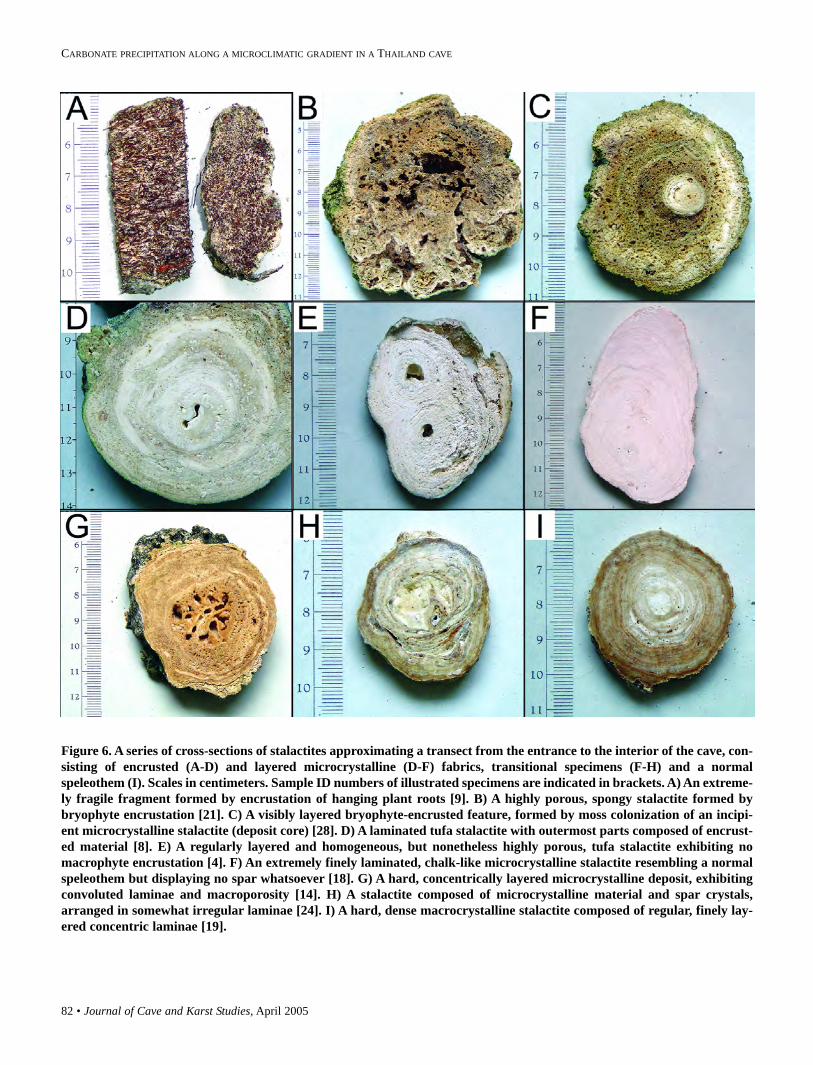
82 • Journal of Cave and Karst Studies, April 2005
CARBONATE PRECIPITATION ALONG A MICROCLIMATIC GRADIENT IN A THAILAND CAVE
Figure 6. A series of cross-sections of stalactites approximating a transect from the entrance to the interior of the cave, con-sisting of encrusted (A-D) and layered microcrystalline (D-F) fabrics, transitional specimens (F-H) and a normalspeleothem (I). Scales in centimeters. Sample ID numbers of illustrated specimens are indicated in brackets. A) An extreme-ly fragile fragment formed by encrustation of hanging plant roots [9]. B) A highly porous, spongy stalactite formed bybryophyte encrustation [21]. C) A visibly layered bryophyte-encrusted feature, formed by moss colonization of an incipi-ent microcrystalline stalactite (deposit core) [28]. D) A laminated tufa stalactite with outermost parts composed of encrust-ed material [8]. E) A regularly layered and homogeneous, but nonetheless highly porous, tufa stalactite exhibiting nomacrophyte encrustation [4]. F) An extremely finely laminated, chalk-like microcrystalline stalactite resembling a normalspeleothem but displaying no spar whatsoever [18]. G) A hard, concentrically layered microcrystalline deposit, exhibitingconvoluted laminae and macroporosity [14]. H) A stalactite composed of microcrystalline material and spar crystals,arranged in somewhat irregular laminae [24]. I) A hard, dense macrocrystalline stalactite composed of regular, finely lay-ered concentric laminae [19].
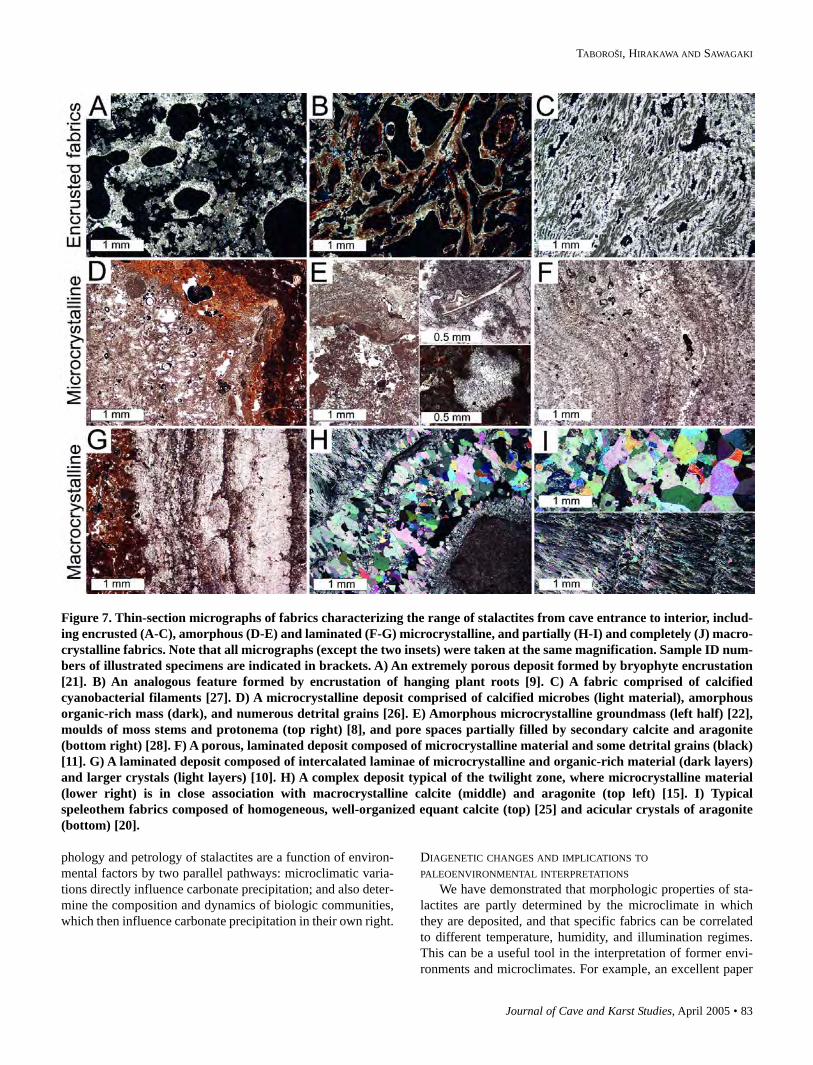
Journal of Cave and Karst Studies, April 2005 • 83
TABOROŠI, HIRAKAWA AND SAWAGAKI
phology and petrology of stalactites are a function of environ-mental factors by two parallel pathways: microclimatic varia-tions directly influence carbonate precipitation; and also deter-mine the composition and dynamics of biologic communities,which then influence carbonate precipitation in their own right.
DIAGENETIC CHANGES AND IMPLICATIONS TOPALEOENVIRONMENTAL INTERPRETATIONS
We have demonstrated that morphologic properties of sta-lactites are partly determined by the microclimate in whichthey are deposited, and that specific fabrics can be correlatedto different temperature, humidity, and illumination regimes.This can be a useful tool in the interpretation of former envi-ronments and microclimates. For example, an excellent paper
Figure 7. Thin-section micrographs of fabrics characterizing the range of stalactites from cave entrance to interior, includ-ing encrusted (A-C), amorphous (D-E) and laminated (F-G) microcrystalline, and partially (H-I) and completely (J) macro-crystalline fabrics. Note that all micrographs (except the two insets) were taken at the same magnification. Sample ID num-bers of illustrated specimens are indicated in brackets. A) An extremely porous deposit formed by bryophyte encrustation[21]. B) An analogous feature formed by encrustation of hanging plant roots [9]. C) A fabric comprised of calcifiedcyanobacterial filaments [27]. D) A microcrystalline deposit comprised of calcified microbes (light material), amorphousorganic-rich mass (dark), and numerous detrital grains [26]. E) Amorphous microcrystalline groundmass (left half) [22],moulds of moss stems and protonema (top right) [8], and pore spaces partially filled by secondary calcite and aragonite(bottom right) [28]. F) A porous, laminated deposit composed of microcrystalline material and some detrital grains (black)[11]. G) A laminated deposit composed of intercalated laminae of microcrystalline and organic-rich material (dark layers)and larger crystals (light layers) [10]. H) A complex deposit typical of the twilight zone, where microcrystalline material(lower right) is in close association with macrocrystalline calcite (middle) and aragonite (top left) [15]. I) Typicalspeleothem fabrics composed of homogeneous, well-organized equant calcite (top) [25] and acicular crystals of aragonite(bottom) [20].
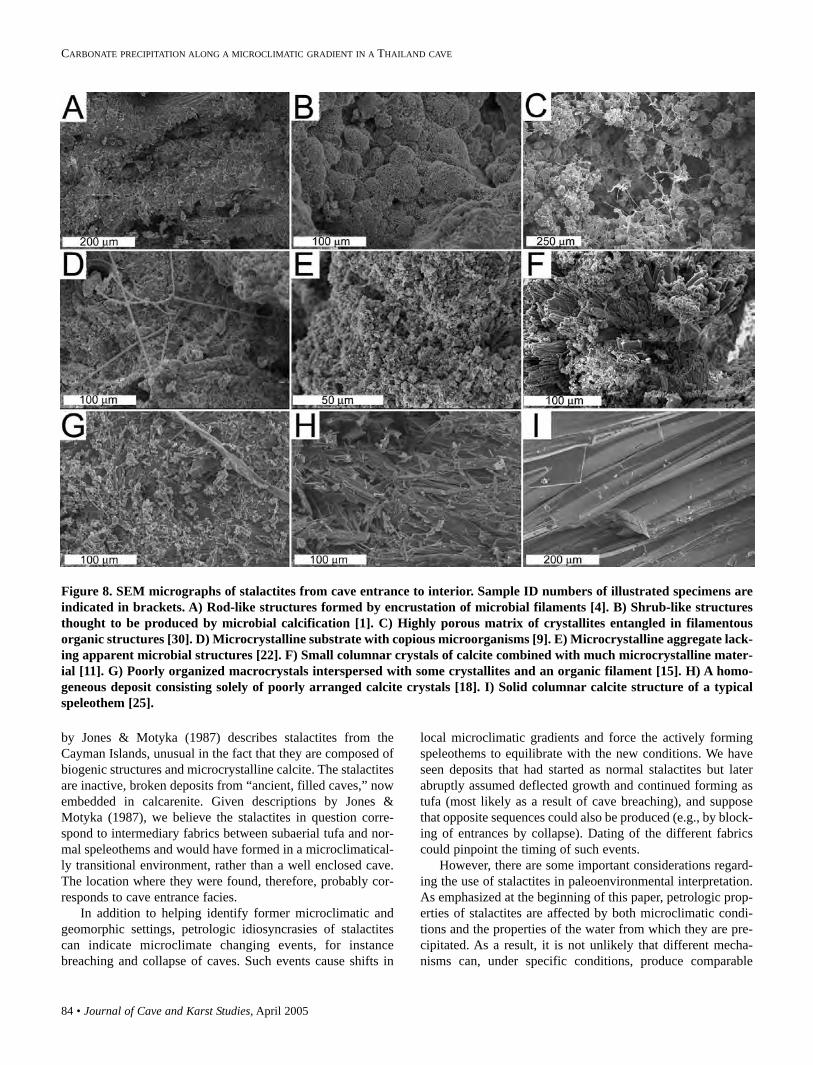
84 • Journal of Cave and Karst Studies, April 2005
CARBONATE PRECIPITATION ALONG A MICROCLIMATIC GRADIENT IN A THAILAND CAVE
by Jones & Motyka (1987) describes stalactites from theCayman Islands, unusual in the fact that they are composed ofbiogenic structures and microcrystalline calcite. The stalactitesare inactive, broken deposits from “ancient, filled caves,” nowembedded in calcarenite. Given descriptions by Jones &Motyka (1987), we believe the stalactites in question corre-spond to intermediary fabrics between subaerial tufa and nor-mal speleothems and would have formed in a microclimatical-ly transitional environment, rather than a well enclosed cave.The location where they were found, therefore, probably cor-responds to cave entrance facies.
In addition to helping identify former microclimatic andgeomorphic settings, petrologic idiosyncrasies of stalactitescan indicate microclimate changing events, for instancebreaching and collapse of caves. Such events cause shifts in
local microclimatic gradients and force the actively formingspeleothems to equilibrate with the new conditions. We haveseen deposits that had started as normal stalactites but laterabruptly assumed deflected growth and continued forming astufa (most likely as a result of cave breaching), and supposethat opposite sequences could also be produced (e.g., by block-ing of entrances by collapse). Dating of the different fabricscould pinpoint the timing of such events.
However, there are some important considerations regard-ing the use of stalactites in paleoenvironmental interpretation.As emphasized at the beginning of this paper, petrologic prop-erties of stalactites are affected by both microclimatic condi-tions and the properties of the water from which they are pre-cipitated. As a result, it is not unlikely that different mecha-nisms can, under specific conditions, produce comparable
Figure 8. SEM micrographs of stalactites from cave entrance to interior. Sample ID numbers of illustrated specimens areindicated in brackets. A) Rod-like structures formed by encrustation of microbial filaments [4]. B) Shrub-like structuresthought to be produced by microbial calcification [1]. C) Highly porous matrix of crystallites entangled in filamentousorganic structures [30]. D) Microcrystalline substrate with copious microorganisms [9]. E) Microcrystalline aggregate lack-ing apparent microbial structures [22]. F) Small columnar crystals of calcite combined with much microcrystalline mater-ial [11]. G) Poorly organized macrocrystals interspersed with some crystallites and an organic filament [15]. H) A homo-geneous deposit consisting solely of poorly arranged calcite crystals [18]. I) Solid columnar calcite structure of a typicalspeleothem [25].
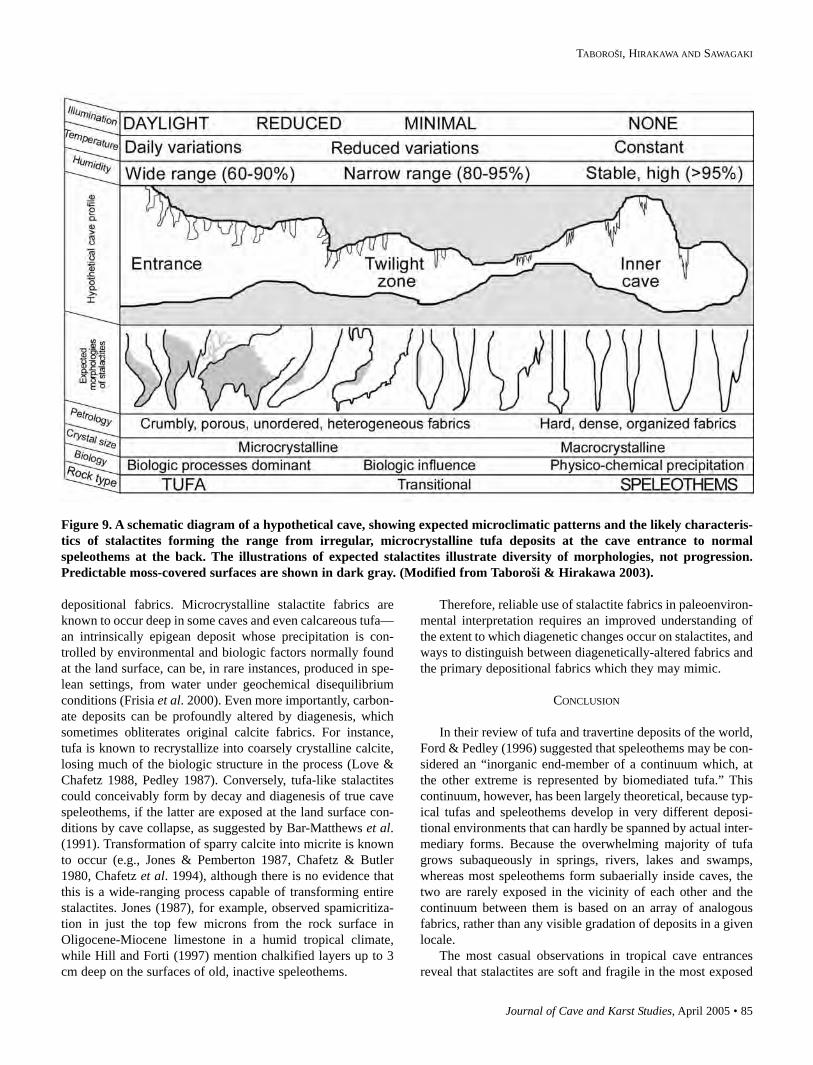
Journal of Cave and Karst Studies, April 2005 • 85
TABOROŠI, HIRAKAWA AND SAWAGAKI
depositional fabrics. Microcrystalline stalactite fabrics areknown to occur deep in some caves and even calcareous tufa—an intrinsically epigean deposit whose precipitation is con-trolled by environmental and biologic factors normally foundat the land surface, can be, in rare instances, produced in spe-lean settings, from water under geochemical disequilibriumconditions (Frisia et al. 2000). Even more importantly, carbon-ate deposits can be profoundly altered by diagenesis, whichsometimes obliterates original calcite fabrics. For instance,tufa is known to recrystallize into coarsely crystalline calcite,losing much of the biologic structure in the process (Love &Chafetz 1988, Pedley 1987). Conversely, tufa-like stalactitescould conceivably form by decay and diagenesis of true cavespeleothems, if the latter are exposed at the land surface con-ditions by cave collapse, as suggested by Bar-Matthews et al.(1991). Transformation of sparry calcite into micrite is knownto occur (e.g., Jones & Pemberton 1987, Chafetz & Butler1980, Chafetz et al. 1994), although there is no evidence thatthis is a wide-ranging process capable of transforming entirestalactites. Jones (1987), for example, observed spamicritiza-tion in just the top few microns from the rock surface inOligocene-Miocene limestone in a humid tropical climate,while Hill and Forti (1997) mention chalkified layers up to 3cm deep on the surfaces of old, inactive speleothems.
Therefore, reliable use of stalactite fabrics in paleoenviron-mental interpretation requires an improved understanding ofthe extent to which diagenetic changes occur on stalactites, andways to distinguish between diagenetically-altered fabrics andthe primary depositional fabrics which they may mimic.
CONCLUSION
In their review of tufa and travertine deposits of the world,Ford & Pedley (1996) suggested that speleothems may be con-sidered an “inorganic end-member of a continuum which, atthe other extreme is represented by biomediated tufa.” Thiscontinuum, however, has been largely theoretical, because typ-ical tufas and speleothems develop in very different deposi-tional environments that can hardly be spanned by actual inter-mediary forms. Because the overwhelming majority of tufagrows subaqueously in springs, rivers, lakes and swamps,whereas most speleothems form subaerially inside caves, thetwo are rarely exposed in the vicinity of each other and thecontinuum between them is based on an array of analogousfabrics, rather than any visible gradation of deposits in a givenlocale.
The most casual observations in tropical cave entrancesreveal that stalactites are soft and fragile in the most exposed
Figure 9. A schematic diagram of a hypothetical cave, showing expected microclimatic patterns and the likely characteris-tics of stalactites forming the range from irregular, microcrystalline tufa deposits at the cave entrance to normalspeleothems at the back. The illustrations of expected stalactites illustrate diversity of morphologies, not progression.Predictable moss-covered surfaces are shown in dark gray. (Modified from Taboroši & Hirakawa 2003).
86 • Journal of Cave and Karst Studies, April 2005
CARBONATE PRECIPITATION ALONG A MICROCLIMATIC GRADIENT IN A THAILAND CAVE
locations, and more dense and solid in better-enclosed areas. Adetailed look at a single cave in Krabi Province, Thailand,clearly demonstrated the full range of progressively denser andmore organized deposits, from calcareous tufa stalactites at thedripline to classic speleothems deeper inside caves, and theveritable sequence of fabrics, from biogenic microcrystallineforms to densely layered travertines. While the most porousand friable “stalactites” at the land surface and in caveentrances exhibit much more in common with typical (aquatic)calcareous tufas than with speleothems, they are geneticallyclear analogues of spelean dripstone: just like their equivalentsdeeper inside caves, these stalactites are precipitated fromepikarstic water dripping from bedrock ceilings. The underly-ing physical and chemical mechanisms involved in their pre-cipitation are, thus, no different from normal cave stalactites,and it is the microclimate of their depositional setting andsuperimposed biologic processes that are responsible for theobserved morphologic and petrologic idiosyncrasies.
ACKNOWLEDGEMENTS
We are grateful to Dr. John E. Mylroie (Mississippi StateUniversity), Dr. John W. Jenson (University of Guam), and Mr.Kevin Stafford (New Mexico Institute of Mining andTechnology) whose collaboration over the years and numerousrelevant discussions helped shape our ideas. We deeply appre-ciate the help of Mr. Mark Cartwright, Mr. Kevin Van Dusen,and Ms. Yukari Nakamura during fieldwork in Thailand andthe kindness of the Thai family living in Chong Phli village,near the cave we studied. At Hokkaido University, we arethankful to Dr. Tomohisa Irino, Dr. Mitsuhiro Nakagawa, Dr.Hisatake Okada, Mr. Kesiuke Nagai, Ms. Akiko Matsumoto,and the faculty and students of the Geoecology Lab at theGraduate School of Earth and Environmental Science for theirhelp and support. Finally, we are indebted to Dr. BruceRailsback (University of Georgia) and Dr. Darlene Anthony(Purdue) whose reviews of the original manuscript helpedimprove this paper and gave us much encouragement.
REFERENCES
Atkinson, T.C. & Smith, D.I., 1976, The erosion of limestones, in Ford, T.D.& Cullingford, C.H.D., eds., The Science of Speleology: London,Academic Press, p. 157–177.
Bar-Matthews, M., Matthews, A. & Ayalon, A., 1991, Environmental controlsof speleothem mineralogy in a karstic dolomitic terrain (Soreq Cave,Israel): J. Geol., v. 99, p. 189–207.
Borsato, A., Frisia, S., Jones, B. & Van Der Borg, K., 2000, Calcite moonmilk:crystal morphology and environment of formation in caves in the ItalianAlps: Journal of Sedimentary Research, v. 70, p. 1171–1182.
Buecher, R.H., 1999, Microclimate study of Kartchner Caverns, Arizona:Journal of Cave and Karst Studies, v. 61, p. 108–120.
Bull, P. A. & Laverty, M., 1982, Observations on phytokarst: Zeitschrift fürGeomorphologie, v. 26, p. 437–457.
Bögli, A., 1980, Karst hydrology and physical speleology: Berlin, Springer-Verlag, 284 p.
Chafetz, H. & Butler, J. C., 1980, Petrology of recent caliche pisolites,spherulites, and speleothem deposits from central Texas: Sedimentology,v. 27, p. 492–518.
Chafetz, H.S. & Folk, R.L., 1984, Travertines: Depositional morphology andthe bacterially controlled constituents: Journal of Sedimentary Petrology,v. 54, p. 289–316.
Chafetz, H.S. & Meredith, J.S., 1983, Recent travertine pisoliths (pisoids)from southeastern Idaho, USA, in Peryt, T.M., ed., Coated grains: Berlin,Springer-Verlag, p. 450–455.
Chafetz, H.S., Rush, P.F. & Utech, N.M., 1991, Microenvironmental controlson mineralogy and habit of CaCO3 precipitates: an example from anactive travertine system: Sedimentology, v. 38, p. 107–126.
Chafetz, H., Srdov, D. & Horvatinnic, N., 1994, Early diagenesis of PlitviceLakes waterfall and barrier travertine deposits: Geographie Physique etQuaternaire, v. 48, p. 245–255.
Cox, G. & Marchant, H., 1977, Photosynthesis in the deep twilight zone:micro-organisms with extreme structural adaptations to low light, in Ford,T. D., ed., Proceedings of the 7th International Speleological Congress:Sheffield, British Cave Research Association, p. 131–133.
Cropley, J.B., 1965, The influences of surface conditions on temperatures inlarge cave systems: Nat. Speleol. Soc. Bull., v. 27, p. 1–10.
Crowther, J., 1982, Ecological observations in a tropical karst terrain, WestMalaysia. J. Biogeog., v. 9, p. 65–78.
Cubbon, B.D., 1976, Cave flora, in Ford, D. T., & Cullingford, C. H. D., (eds.),The science of speleology: London, Academic Press, p. 423–452.
Dasher, G.R., 1994, On Station: A Complete Handbook for Surveying andMapping Caves: Huntsville, Alabama, National Speleological Society,242 p.
Dreybrodt, W., 1988, Processes in Karst Systems: Physics, Chemistry, andGeology: Berlin, Springer-Verlag, 288 p.
Dunkley, J.R., 1994, Thailand Caves Catalogue: Sydney, Australia,Speleological Research Council, Australian Speleological Federation, 44p.
Dunkley, J.R., 1995, The Caves of Thailand: Sydney, Australia, SpeleologicalResearch Council, Australian Speleological Federation, 124 p.
Emeis, K.C., Richnow, H.H. & Kempe, S., 1987, Travertine formation inPlitvice National Park, Yugoslavia: chemical versus biological control:Sedimentology, v. 34, p. 595–609.
Folk, R.L., Chafetz, H.S. & Tiezzi, P.A., 1985, Bizarre forms of depositionaland diagenetic calcite in hot-spring travertines, central Italy, inSchneidermann, N. & Harris, P.M., eds., Carbonate cements (SpecialPublication 36): Society of Economic Paleontologists and Mineralogists,p. 349–369.
Ford, D.C. & Ewers, R.O., 1978, The development of limestone cave systemsin the dimensions of length and depth: Can. J. Earth Sci., v. 15, p.1783–1798.
Ford, T.D., 1989, Tufa - the whole dam story: Cave Science, v. 16, p. 39-50.Ford, T.D. & Pedley, H.M., 1992, Tufa deposits of the world: J. Speleol. Soc.
Japan, v. 17, p. 46–63.Ford, T.D. & Pedley, H.M., 1996, A review of tufa and travertine deposits of
the world: Earth-Science Reviews, v. 41, p. 117–175.Forti, P., 2001, Biogenic speleothems: an overview: International Journal of
Speleology, v. 30A(1), p. 39–56.de Freitas, C.R., Littlejohn, R.N., Clarkson, T.S. & Kristament, I.S., 1982,
Cave climate: assessment of airflow and ventilation: J. Climatol., v. 2, p.383–397.
Frisia, S., Borsato, A., Fairchild, I.J. & McDermott, F., 2000, Calcite fabrics,growth mechanisms, and environments of formation in speleothems fromthe Italian Alps and southwestern Ireland: Journal of SedimentaryResearch, v. 70, p. 1183–1196.
Frisia, S., Borsato, A., Fairchild, I.J., McDermott, F. & Selmo, E.M., 2002,Aragonite–calcite relationships in speleothems (Grotte de Clamous,France): Environment, fabrics, and carbonate geochemistry: Journal ofSedimentary Research, v. 72, p. 687–699.
Gamble, D.W., Dogwiler, J.T. & Mylroie, J.E., 2000, Field assessment of themicroclimatology of tropical flank margin caves: Climate Research, v. 16,p. 37–50.
Gams, I., 1968, Über die factoren die Intensität der Sintersedimantation bes-timmen, in Proc. 4th International Congress of Speleology, v. 3, p. 107-15.
Given, R.K. & Wilkinson, B.H., 1985, Kinetic control of morphology, com-position, and mineralogy of abiotic sedimentary carbonates: Journal ofSedimentary Petrology, v. 55, p. 109–119.
Journal of Cave and Karst Studies, April 2005 • 87
TABOROŠI, HIRAKAWA AND SAWAGAKI
Gonzales, L.A., Carpenter, C.J. & Lohmann, K.C., 1992, Inorganic calcitemorphology: roles of fluid chemistry and fluid flow: Journal ofSedimentary Petrology, v. 62, p. 382–399.
Harmon, R.S., Atkinson, T.C. & Atkinson, J.L., 1983, The mineralogy ofCastleguard Cave, Columbia Icefields, Alberta, Canada: Arctic and AlpineResearch, v. 15, p. 503–506.
Harper, S. B., 1999, Morphology of tower karst in Krabi, southern Thailand:Geological Society of America Abstracts with Programs, v. 31, p. A-52.
Hill, C. A. & Forti, P., 1997, Cave Minerals of the World: Huntsville, Alabama,National Speleological Society, 380 p.
Jannsen, A., Swennen, R., Podoor, N. & Keppens, E., 1999, Biological anddiagenetic influence in Recent and fossil tufa deposits from Belgium:Sedimentary Geology, v. 126, p. 75–95.
Jennings, J. N., 1985, Karst geomorphology: Oxford, Basil Blackwell, 293 p.Jones, B., 1987, The alteration of sparry calcite crystals in a vadose setting,
Grand Cayman Island: Canadian Journal of Earth Science: v. 24, p.2292–2304.
Jones, B., 2001, Microbial Activity in Caves: A Geological Perspective:Geomicrobiology Journal, v. 18, p. 345–357.
Jones, B. & Motyka, A., 1987, Biogenic structures and micrite in stalactitesfrom Grand Cayman Island, British West Indies: Canadian Journal ofEarth Sciences, v. 24, p. 1402–1411.
Jones, B. & Pemberton, S. G., 1987, The role of fungi in the diagenetic alter-ation of spar calcite: Canadian Journal of Earth Science: v. 24, p.903–914.
Lehmann, H., 1954, Der tropische Kegelkarst auf den Grossen Antillen:Erdkunde, v. 8, p. 130–139.
Lichon, M.J., 1992, The phototropic phytospeleothems of Moss Palace, MoleCreek, Tasmania: Helictite, v. 30, p. 8–10.
Longman, M. W. & Brownlee, D. N., 1980, Characteristics of karst topogra-phy, Palawan, Philippines: Zeitschrift für Geomorphologie, v. 24, p.299–317.
Love, K.M. & Chafetz, H.S., 1988, Diagenesis of laminated travertine crusts,Arbuckle Mountains, Oklahoma: Journal of Sedimentary Petrology, v. 58,p. 441–445.
Merz, M.U., 1992, The biology of carbonate precipitation by cyanobacteria:Facies, v. 26, p. 81–101.
Mylroie, J.E. & Carew, J.L., 1990, The flank margin model for dissolutioncave development in carbonate platforms: Earth Surface Processes andLandforms, v. 15, p. 413–424.
Mylroie, J.E. & Carew, J.L., 1995, Geology and karst geomorphology of SanSalvador Island, Bahamas: Carbonates and Evaporites, v. 10, p. 193–206.
Northup, D.E., Dahm, C.N., Melim, L.A., Spilde, M.N., Crossey, L.J., Lavoie,K.H., Mallory, L.M., Boston, P.J., Cunningham, K.I. & Barns, S.M., 2000,Evidence for geomicrobiological interactions in Guadalupe caves: Journalof Cave and Karst Studies, v. 6, p. 80–90.
Pavlovic, G., Zupanic, G., Prohic, E. & Tibljaš, D., 2002, Impressions of thebiota associated with waterfalls and cascades: Geologia Croatica, v. 55, p.25–37.
Pedley, H.M., 1987, The Flandrian (Quaternary) Caerwys Tufa, North Wales;an ancient barrage tufa deposit: Proceedings of the Yorkshire GeologicalSociety, v. 46, p. 141–152.
Pedley, H.M., 1994, Prokaryote-microphyte biofilms and tufas: a sedimento-logical perspective: Kaupia (Darmstadler Beitr. Naturgesch.), v. 4, p.45–60.
Pedley, H.M., Andrews, J., Ordonez, S., Garcia del Cura, M.A., GonzalesMartin, J.A. & Taylor, D., 1996, Does climate control the morphologicalfabrics of freshwater carbonates? A comparative study of Holocene bar-rage tufas from Spain and Britain: Palaeogeography, Palaeoclimatology,Palaeoecology, v. 121, p. 239–257.
Pentecost, A., 1996, Moss growth and travertine deposition: the significanceof photosynthesis, evaporation and degassing of carbon dioxide: Journalof Bryology, v. 19, p. 229–234.
Pentecost, A. & Riding, R., 1986, Calcification in Cyanobacteria, inLeadbeater, B.S.C. & Riding, R., eds., Biomineralization in Lower Plantsand Animals: Oxford, Clarendon Press, p. 73–86.
Pentecost, A. & Zhaohui, Z., 2001, The distribution of plants in Scoska Cave,North Yorkshire, and their relationship to light intensity: InternationalJournal of Speleology, v. 30A, p. 27–37.
Piearce, T., 1975, Observations on the fauna and flora of Ingleborough Cavern,Yorkshire: Transactions of the British Cave Research Association, v. 2, p.107–115.
Railsback, L.B., Brook, G.A., Chen, J., Kalin, R. & Fleisher, C.J., 1994,Environmental controls on the petrology of a Late Holocene speleothemfrom Botswana with annual layers of aragonite and calcite: Journal ofSedimentary Research, v. A64, p. 147–155.
Sarigabutr, D., Thummanond, M., Iempairote, T. & Baimoung, S., 1982,Climate in southern Thailand, in Proceedings of the RattanakosinBicentennial Joint Seminar on Science and Mangrove Resources: Phuket,Thailand, National Research Council of Thailand and Japan Society forthe Promotion of Science, p. 36–46.
Schneider, J. & Le Campion Alsumard, T., 1999, Construction and destructionof carbonates by marine and freshwater cyanobacteria: European Journalof Phycology, v. 34, p. 417–426.
Sevenair, J.P., 1985, The deflected stalactites of Dan-Yr-Ogaf: A hypothesis:NSS Bulletin, v. 47, p. 29–31.
Sweeting, M.M., 1973, Karst Landforms: New York, NY, ColumbiaUniversity Press, 362 p.
Taboroši, D., 2002, Biokarst on a tropical carbonate island: Guam, MarianaIslands: Theoretical and Applied Karstology, v. 15, p. 73–91.
Taboroši, D. & Hirakawa, K., 2003, Microclimate controls of vadose carbon-ate precipitation: Evidence from stalactite morphology: Theoretical andApplied Karstology, v. 16, p. 25–40.
Taboroši, D. & Hirakawa, K., 2004, Biota and biologic processes associatedwith subaerial tufa stalactites in the tropics: Cave and Karst Science, v. 31,in press.
Taboroši, D., Hirakawa, K. & Stafford, K.W., 2003a, Speleothem-like calciteand aragonite deposits on a tropical carbonate coast: Cave and KarstScience, v. 30, p. 23–32.
Taboroši, D., Stafford, K.W., Mylroie, J.E. & Hirakawa, K. 2003b. Littoraldripstone and flowstone: Speleothem-like precipitates on a tropical car-bonate coast, Tinian and Rota, Mariana Islands: GSA Abstracts andPrograms, v. 35, p. 452.
Taboroši, D., Hirakawa, K. & Stafford, K.W., 2004a, Subaerial tufa in theMariana Islands and its depositional settings: Studies in Speleology, v. 13,p. 27–41.
Taboroši, D., Hirakawa, K. & Stafford, K., 2004b, Interactions of plant rootsand speleothems: Journal of Subterranean Biology, v. 2, p. 43–51.
Thrailkill, J., 1976, Speleothems, in Walter, M.R., ed., Stromatolites:Amsterdam, Elsevier, p. 73–86.
Viles, H.A., 1988, Organisms and karst geomorphology, in Viles, H.A., ed.,Biogeomorphology: New York, NY, Basil Blackwell, p. 319–350.
Viles, H.A. & Goudie, A.S., 1990, Tufas, travertines and allied carbonatedeposits: Progress in Physical Geography, v. 14, p. 19–41.
Wasseman, B., 1984, Tiger Cave Monastery: Sawasdee, v. 13, p. 32–38.Waterhouse, J.B., 1981, Age of the Ratburi Limestone of southern Thailand
(the Permian stratigraphy and paleontology of southern Thailand):Bangkok, Thailand, Geological Survey Division, Department of MineralResources.
Wefer, F.L., 1991, An annotated bibliography of cave meteorology: CaveGeol., v. 2, p. 84–119.
Weijermars, R., Mulder-Blanken, C.W. & Wiegers, J., 1986, Growth rateobservation from the moss-built Checa travertine terrace, central Spain:Geological Magazine, v. 123, p. 279–286.
Wilford, G.E. & Wall, J.R.D., 1964, Karst topography in Sarawak: Journal ofTropical Geography, v. 18, p. 44–70.
Zhaohui Z. & Pentecost, A., 1999, Bryophyte communities associated withtravertine formation at Yorkshire National Park, UK: Carsologia Sinica, v.18, p. 366–374.