Embed Size (px)
Citation preview
Journal of Environmental Science and Sustainable Development Journal of Environmental Science and Sustainable Development
Volume 3 Issue 1 July Article 2
7-31-2020
LIFE CYCLE ASSESSMENT IN SUPPLY CHAIN MANAGEMENT LIFE CYCLE ASSESSMENT IN SUPPLY CHAIN MANAGEMENT
GAME GAME
Natalia Hartono Department of Industrial Engineering, Universitas Pelita Harapan, Tangerang, Banten 15811, Indonesia, [email protected]
Laurence Laurence Department of Industrial Engineering, Universitas Pelita Harapan, Tangerang, Banten 15811, Indonesia
Giovanni Hezekiah Chandra Department of Industrial Engineering, Universitas Pelita Harapan, Tangerang, Banten 15811, Indonesia
Follow this and additional works at: https://scholarhub.ui.ac.id/jessd
Part of the Other Education Commons, and the Social and Behavioral Sciences Commons
Recommended Citation Recommended Citation Hartono, Natalia; Laurence, Laurence; and Chandra, Giovanni Hezekiah (2020). LIFE CYCLE ASSESSMENT IN SUPPLY CHAIN MANAGEMENT GAME. Journal of Environmental Science and Sustainable Development, 3(1), 1-29. Available at: https://doi.org/10.7454/jessd.v3i1.1045
This Original Research Article is brought to you for free and open access by the School of Environmental Science at UI Scholars Hub. It has been accepted for inclusion in Journal of Environmental Science and Sustainable Development by an authorized editor of UI Scholars Hub.

Journal of Environmental Science and Sustainable Development
Volume 3, Issue 1, Page 1-29
ISSN: 2655-6847
Homepage: http://scholarhub.ui.ac.id/jessd
DOI: https://doi.org/10.7454/jessd.v3i1.1045 1
LIFE CYCLE ASSESSMENT IN SUPPLY CHAIN MANAGEMENT GAME
Natalia Hartono1*, Laurence1, and Giovanni Hezekiah Chandra1 1Department of Industrial Engineering, Universitas Pelita Harapan, Tangerang, Banten 15811,
Indonesia
*Corresponding author: e-mail: [email protected]
(Received: 4 June 2020; Accepted: 20 July 2020; Published: 31 July 2020)
Abstract
Educational games are essential in explaining theories to students as such activities create a fun
learning environment. Most educational games in supply chain management (SCM) are
focused on SCM or logistics theories. In the last decades, the research in environmentally
conscious SCM has increased. However, the educational games related to such SCM are
limited. This work is the first to use the detailed life cycle assessment (LCA) approach in
teaching students SCM. The research output is a game called “Robo Factory,” which involves
a simulation of a robot production supply chain. The research objective is to educate
undergraduate students about the SCM structure, the duties and responsibilities of SCM actors,
the LCA approach, and the cost types in SCM and LCA. The paper describes the game design
process. The game design entails three steps: (1) game conceptualization and prototype design;
(2) prototype trial, evaluation, and finalization of game rules; and (3) final games. Evaluation
results indicate that the game successfully teaches undergraduate students about the theory of
LCA in SCM in an enjoyable manner. The posttest shows an overall increase in students’
knowledge. The paper presents the future research directions and implications for scholars to
enhance their contributions.
Keywords: educational game; life cycle assessment; supply chain management.
1. Introduction
The industrial world is in an unprecedented competitive environment where technological
development, globalization, and limited resources provide new standards for companies to
create products and services that exceed consumer expectations. Efficiency in production,
enhanced management, and other factors are crucial in winning any competition. A company
must consider the environmental impacts connecting suppliers, distributors, partners, and
customers (Su et al., 2015). Supply chain management (SCM) is a coordination process in
which resources are converted and utilized to fulfill specific orders in manufacturing or service
Journal of Environmental Science and Sustainable Development 3(1): 1-29
DOI: https://doi.org/10.7454/jessd.v3i1.1045 2
companies (Onu & Mbohwa, 2019). The role of supply chain managers is crucial as it involves
planning and managing existing resources for the survival of their companies.
In the academic community in the field of SCM, a common issue is the development of
teaching methods for SCM courses (Vanany & Syamil, 2016). In the last four decades,
simulation, gaming, and other sources have been shown to serve as excellent tools for
experimentation and learning (Mayer, 2009). Games can be an effective tool to engage college
students and help them understand the processes in a supply chain. A classroom lecture is not
enough for students to understand the concepts of SCM; educational games may be used to
enrich student experience (Shovityakool et al., 2019).
The concept of SCM could be enforced through play (Kuijpers, 2009), and the complexity
of SCM can be understood by experiment-based learning (Mehring, 2000; Hofstede, 2006).
According to Engler (2012), Clark Abt first introduced the term “serious game” in 1968.
Relative to traditional games, serious games are used for military training, advertising,
simulation, and education. Serious games were initially used for flight simulation. Sawyer
(2002) in Noemi and Maximo (2014) said that a serious game is a simulation of real events
aimed at solving a problem. The game can be used as an analytical tool because it is flexible
and adaptable; game formats can be scenario-based games, simulation games, and seminar
games (Mayer, 2009).
The “beer game” is the oldest and most popular game in SCM; it is useful in understanding
the “bullwhip effect” (Vanany & Syamil, 2016). This game was designed by Professor John
Sterman of the Massachusetts Institute of Technology (MIT) and was a continuation of the
ideas of Jay Forrester, a professor at MIT who conducted many studies on dynamic systems
(Pujawan & Er, 2017). The original game was a board game developed in the 1960s as a role-
playing simulation that simplifies a supply chain (Hieber & Hartel, 2003). The beer game itself
has evolved from a board game into a computer simulation. The beer game provides lessons
on the bullwhip effect, the advantages of reducing lead time, and the benefits of information
sharing (Anderson & Morrice, 2000). The bullwhip effect is described as information
distortion; under this effect, the demand that is relatively stable at the final customer level can
fluctuate in the upstream supply chain, at which point it could increase considerably (Pujawan
& Er, 2017).
The bullwhip effect occurs when the number of orders increasingly varies as the process
flows in the upstream of the supply chain (Lee et al., 1997). The beer game physically and
digitally simulates the workflow of a distribution center, in which each player can manipulate
Journal of Environmental Science and Sustainable Development 3(1): 1-29
DOI: https://doi.org/10.7454/jessd.v3i1.1045 3
the inventory as a retailer, wholesaler, distributor, or manufacturer. Other SCM games include
the innovative practical games published by Vanany and Syamil in 2016 (Vanany & Syamil,
2016). This board game uses Lego® blocks to emphasize the role of a supply chain manager,
which is crucial in determining the victory of a team. The supply chain manager is responsible
for ordering, calculating, and assigning jobs to the operator. The game uses supply chain costs,
which are calculated to determine the winning team, which reports the least cost. A summary
of previous research on teaching SCM is available in the work of Vanany and Syamil (2016),
where they collected 24 papers from 1998 to 2013; 62.5% of these papers used or developed
games while 37.5% developed contents (curriculum) for teaching SCM subjects. The summary
itself highlights the wide use of the beer game and other simulation games. Grandzol and
Grandzol (2018) designed the “Chantey Castings” Simulation to teach SCM with a focus on a
demand-driven approach and constraint management.
The game uses Play-Doh to teach students to match customer demand while learning the
concept of SCM. Sato et al. (2017) designed a specific SCM game for milk to increase the
awareness of food waste among university students in Japan. Liu (2017) used an open-source
simulation video game to teach supply chain and logistics management. The educational games
in SCM are based on different objectives. Hence, how lecturers develop educational materials
to reinforce students’ learning and enrich their hands-on experience is an interesting topic.
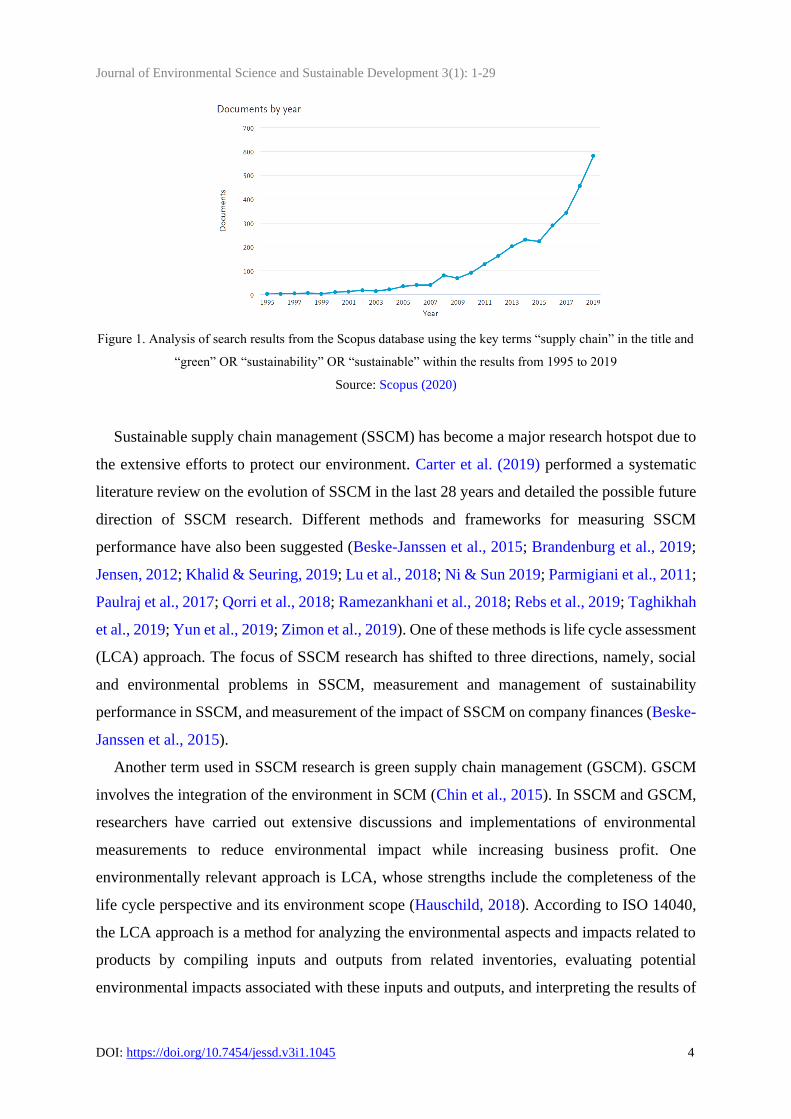
In the Scopus database, a search for papers written in English and those in the final
publication stage by using key terms such as “Supply Chain Management” in the title and
“green” OR “sustainability” OR “sustainable” within the results yields 3,041 documents from
1995 to 2019. The key terms used in the search are based on how research papers usually refer
to the environment using word such as “green,” “sustainable,” or “sustainability.” The analysis
of the results shows a sharp rise in the consideration of the environment in the field of SCM in
the past 10 years (Figure 1). This trend implies the growing importance of the environment in
SCM.
Journal of Environmental Science and Sustainable Development 3(1): 1-29
DOI: https://doi.org/10.7454/jessd.v3i1.1045 4
Figure 1. Analysis of search results from the Scopus database using the key terms “supply chain” in the title and
“green” OR “sustainability” OR “sustainable” within the results from 1995 to 2019
Source: Scopus (2020)
Sustainable supply chain management (SSCM) has become a major research hotspot due to
the extensive efforts to protect our environment. Carter et al. (2019) performed a systematic
literature review on the evolution of SSCM in the last 28 years and detailed the possible future
direction of SSCM research. Different methods and frameworks for measuring SSCM
performance have also been suggested (Beske-Janssen et al., 2015; Brandenburg et al., 2019;
Jensen, 2012; Khalid & Seuring, 2019; Lu et al., 2018; Ni & Sun 2019; Parmigiani et al., 2011;
Paulraj et al., 2017; Qorri et al., 2018; Ramezankhani et al., 2018; Rebs et al., 2019; Taghikhah
et al., 2019; Yun et al., 2019; Zimon et al., 2019). One of these methods is life cycle assessment
(LCA) approach. The focus of SSCM research has shifted to three directions, namely, social
and environmental problems in SSCM, measurement and management of sustainability
performance in SSCM, and measurement of the impact of SSCM on company finances (Beske-
Janssen et al., 2015).
Another term used in SSCM research is green supply chain management (GSCM). GSCM
involves the integration of the environment in SCM (Chin et al., 2015). In SSCM and GSCM,
researchers have carried out extensive discussions and implementations of environmental
measurements to reduce environmental impact while increasing business profit. One
environmentally relevant approach is LCA, whose strengths include the completeness of the
life cycle perspective and its environment scope (Hauschild, 2018). According to ISO 14040,
the LCA approach is a method for analyzing the environmental aspects and impacts related to
products by compiling inputs and outputs from related inventories, evaluating potential
environmental impacts associated with these inputs and outputs, and interpreting the results of

Journal of Environmental Science and Sustainable Development 3(1): 1-29
DOI: https://doi.org/10.7454/jessd.v3i1.1045 5
the inventory analysis and the impact assessment phase in relation to research objectives (ISO
14040:2006, 2016).
In LCA, the potential impact of certain factors on the environment is evaluated using groups
of data obtained at the inventory analysis stage. IMPACT 2002+ is one of the most commonly
used methods. This method uses transactions between industry sectors, including
environmental data emissions (e.g., sulfur dioxide, particle matter, and carbon dioxide) and
consumption of natural resources (e.g., coal, natural gas, and petroleum products), to determine
the environmental impact of the entire supply chain within the economy. The integration of
LCA in SCM was proposed by Fornasiero et al. (2017), Genovese et al. (2017), and Blass and
Corbett (2018).
A serious game that teaches university students about environmental decisions in enterprises
and supply chains was created by Qualters et al. (2006), Zhang and Zwolinski (2015), and
Cuesta and Nakano (2017). The environmental issues in supply chains have gained popularity
among researchers, who have thus designed education games related to environmental
decisions in SCM. However, to the best of our knowledge, no educational game includes a
detailed LCA in SCM. Hence, the current work attempts to fill the research gap by creating a
game called the “Robo Factory,” which is expected to help explain the importance of
environmental aspects in SCM. The study considers the “life cycle assessment” course offered
by the University of Pelita Harapan.
In the SCM course, the Robo Factory game could be used as an introduction for students
and as a bridge to understand the relation of LCA and SCM. Through this game, undergraduate
students can distinguish the link between sustainability issues in SCM. The proposed game is
designed to educate players about the SCM structure, the duties and responsibilities of SCM
actors, the LCA approach, and types of costs in SCM and LCA. This research focuses only on
LCA as a performance measurement of SCM. The paper is structured as follows. Following
the introduction, the research methodology for game design and development is discussed, and
the final game is analyzed. Conclusions are then presented, along with suggestions for further
research.
2. Methods
In this part of the study, the literature related to SCM and its games is reviewed. Previous
studies employed different approaches in developing games, but their goals are essentially the
same, that is, to engage students’ interest and to enrich their experience. The purposes of
Journal of Environmental Science and Sustainable Development 3(1): 1-29
DOI: https://doi.org/10.7454/jessd.v3i1.1045 6
educational games vary for game developers. In particular, educational games should not only
be entertaining but also be capable of addressing the specific requirements of learning
objectives. Educational games should be carefully and systematically designed to ensure the
accuracy of the process.
Bloom’ s taxonomy is widely used in the design of learning objectives for cognitive learning
skills and in the measurement of learning outcomes for educational purposes (Adams, 2015;
Adesoji, 2018; Ramirez, 2016). Bloom’s taxonomy can connect the conceptual aspects of a
game to the cognitive level (Brewer & Brewer, 2010). Moreover, it helps ensure that the steps
for measuring the specifications of learning objectives are being followed. However, the only
previous work related to SCM games based on Bloom’s taxonomy is that by Vanany & Syamil
(2016).
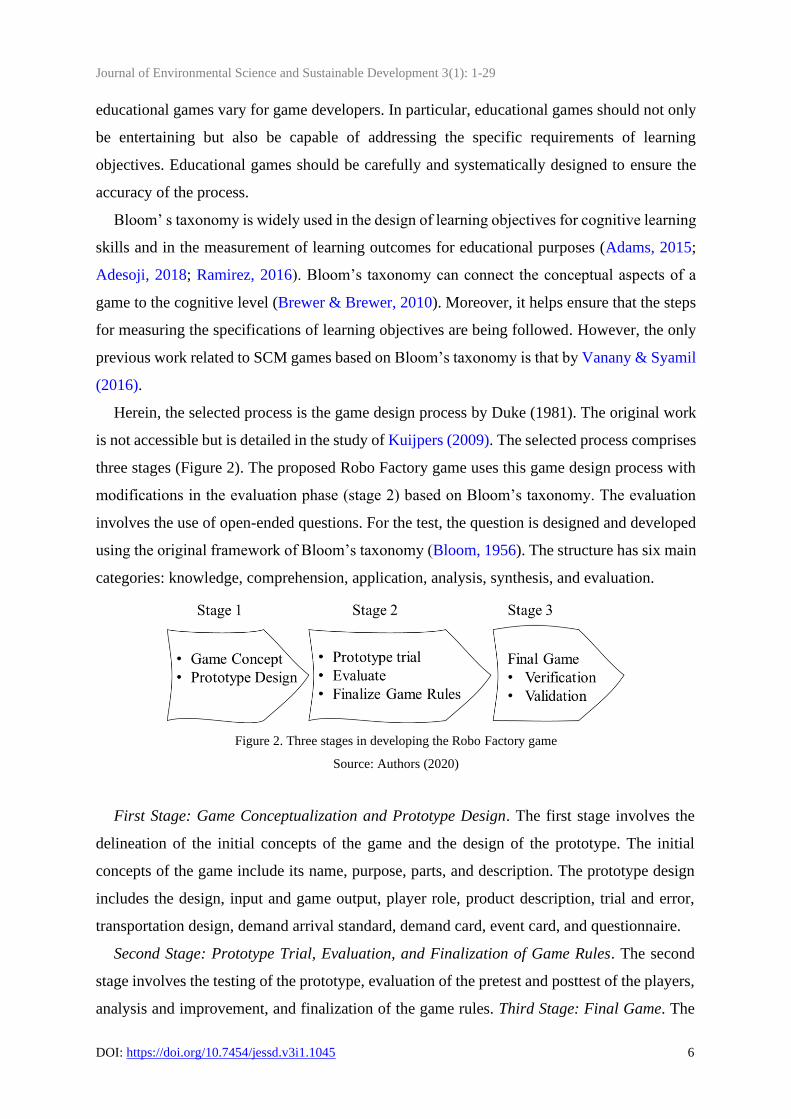
Herein, the selected process is the game design process by Duke (1981). The original work
is not accessible but is detailed in the study of Kuijpers (2009). The selected process comprises
three stages (Figure 2). The proposed Robo Factory game uses this game design process with
modifications in the evaluation phase (stage 2) based on Bloom’s taxonomy. The evaluation
involves the use of open-ended questions. For the test, the question is designed and developed
using the original framework of Bloom’s taxonomy (Bloom, 1956). The structure has six main
categories: knowledge, comprehension, application, analysis, synthesis, and evaluation.
Figure 2. Three stages in developing the Robo Factory game
Source: Authors (2020)
First Stage: Game Conceptualization and Prototype Design. The first stage involves the
delineation of the initial concepts of the game and the design of the prototype. The initial
concepts of the game include its name, purpose, parts, and description. The prototype design
includes the design, input and game output, player role, product description, trial and error,
transportation design, demand arrival standard, demand card, event card, and questionnaire.
Second Stage: Prototype Trial, Evaluation, and Finalization of Game Rules. The second
stage involves the testing of the prototype, evaluation of the pretest and posttest of the players,
analysis and improvement, and finalization of the game rules. Third Stage: Final Game. The
Journal of Environmental Science and Sustainable Development 3(1): 1-29
DOI: https://doi.org/10.7454/jessd.v3i1.1045 7
final game design covers the improvement of the prototype and the verification and validation
of the final game.
3. Results and Discussions
3.1. First Stage: Game Conceptualization and Prototype Design
Initial conceptualization is the heart of game development; it is the most crucial stage. It
involves naming the game, defining its purpose, identifying its parts, and deriving its
description. In this work, the proposed game is the SCM in a robot factory, hence the name
“Robo Factory.” Previous games in SCM are played differently. The beer game is played based
on turns, whereas the innovative practical games are based on time. A time-based game requires
a large number of players serving as timekeepers. As the Robo Factor game is intended to
educate all players, it is designed to be a turn-based game. The purpose of this game is to inform
players about the structure of SCM, the duties and responsibilities of SCM actors, the LCA
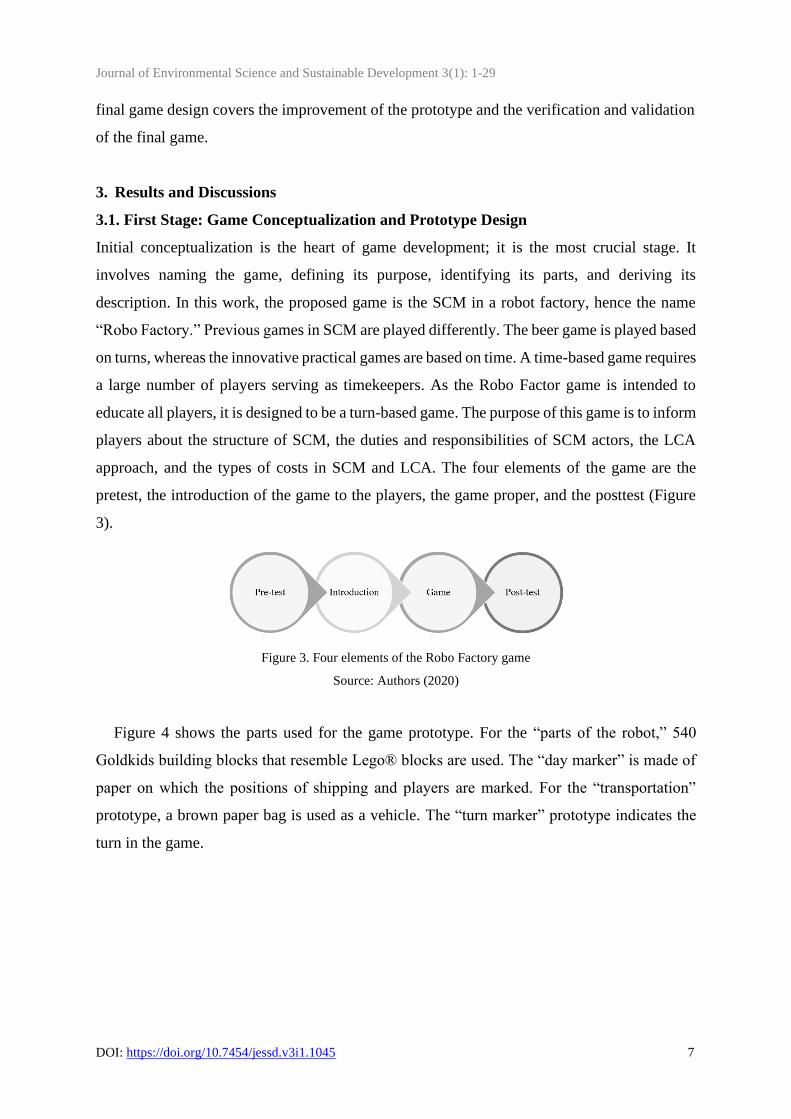
approach, and the types of costs in SCM and LCA. The four elements of the game are the
pretest, the introduction of the game to the players, the game proper, and the posttest (Figure
3).
Figure 3. Four elements of the Robo Factory game
Source: Authors (2020)
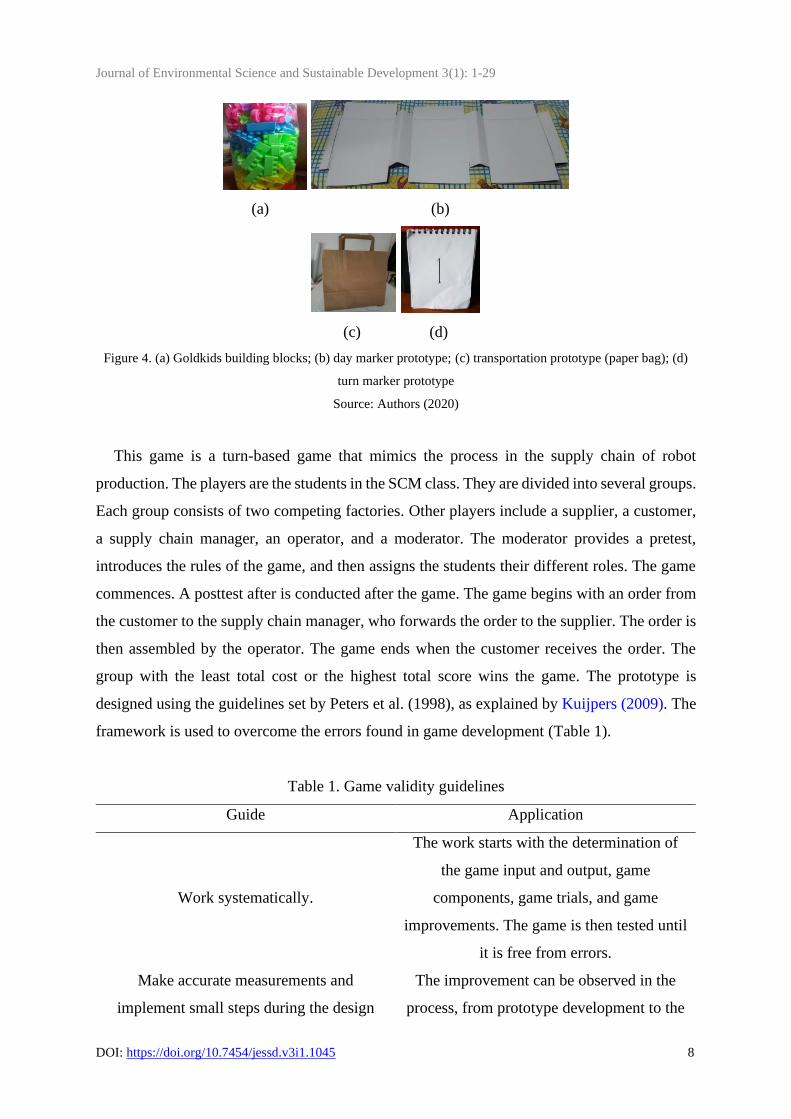
Figure 4 shows the parts used for the game prototype. For the “parts of the robot,” 540
Goldkids building blocks that resemble Lego® blocks are used. The “day marker” is made of
paper on which the positions of shipping and players are marked. For the “transportation”
prototype, a brown paper bag is used as a vehicle. The “turn marker” prototype indicates the
turn in the game.
Journal of Environmental Science and Sustainable Development 3(1): 1-29
DOI: https://doi.org/10.7454/jessd.v3i1.1045 8
(a) (b)
(c) (d)
Figure 4. (a) Goldkids building blocks; (b) day marker prototype; (c) transportation prototype (paper bag); (d)
turn marker prototype
Source: Authors (2020)
This game is a turn-based game that mimics the process in the supply chain of robot
production. The players are the students in the SCM class. They are divided into several groups.
Each group consists of two competing factories. Other players include a supplier, a customer,
a supply chain manager, an operator, and a moderator. The moderator provides a pretest,
introduces the rules of the game, and then assigns the students their different roles. The game
commences. A posttest after is conducted after the game. The game begins with an order from
the customer to the supply chain manager, who forwards the order to the supplier. The order is
then assembled by the operator. The game ends when the customer receives the order. The
group with the least total cost or the highest total score wins the game. The prototype is
designed using the guidelines set by Peters et al. (1998), as explained by Kuijpers (2009). The
framework is used to overcome the errors found in game development (Table 1).
Table 1. Game validity guidelines
Guide Application
Work systematically.
The work starts with the determination of
the game input and output, game
components, game trials, and game
improvements. The game is then tested until
it is free from errors.
Make accurate measurements and
implement small steps during the design
The improvement can be observed in the
process, from prototype development to the

Journal of Environmental Science and Sustainable Development 3(1): 1-29
DOI: https://doi.org/10.7454/jessd.v3i1.1045 9
Guide Application
phase. final game.
Check the validity of the game by informing
the players about the concept. Ask their
opinions about the concepts and theories.
The evaluation results are explained to the
players after the game.
Source: Authors (2020)
In designing the game, the input and output of the game must be described. Meijer (2009)
described the input and output of a game session (Figure 5). The input is the game design, game
situation, and players. The game design consists of the roles, rules, and objectives of the game.
The game situation refers to the event card, which provides several delivery scenarios; it is
explained further in the next section. The output of the game session is a player with knowledge
and data to be processed (pretest and posttest data).
Figure 5. Game’s input and output
Source: Authors (2020)
The details of the game are presented in the final phase of game development. They are
explained briefly in this section to shorten the length of the paper. As the process is a step-by-
step improvement, discussing all details may be redundant. This prototype comprises one
customer, two factory teams (each team consists of one supply chain manager and one
operator), two suppliers (supplier X and supplier Y), and one moderator. The customer takes a
demand card and checks whether or not the demand that arrives has the right specifications or
whether the delivery is delayed or on time. The supply chain manager is responsible for
determining the number of orders, size of inventory, number of shipments, and transportation
used. The supply chain manager also supervises the operator. The operator assembles the

Journal of Environmental Science and Sustainable Development 3(1): 1-29
DOI: https://doi.org/10.7454/jessd.v3i1.1045 10
products quickly and accurately and then sends the demand according to the instructions of the
supply chain manager. The supplier is responsible for fulfilling the orders of the supply chain
manager according to the sequence of the teams’ orders, starting from those that were placed
first. The moderator oversees monitoring the players and changing the turn marker in each turn.
For this game, the two products are the Alpha and Beta, which are represented by the
Goldkids building blocks and serve as the basic ingredients of acrylonitrile butadiene styrene.
The product Alpha consists of one A part, two C parts, one D part, one E part, three F parts,
five G parts, and one J part. The product Beta consists of one B part, three C parts, one D part,
three F parts, one G part, one H part, one I part, one J part, and one K part. The bills of materials
of Alpha and Beta are shown in Figure 6.
A truck, a ship, and an airplane are used as the vehicles for the game. The design covers the
demand arrival standard, holding cost calculation, and LCA score. The details of the final
prototype design are provided after the trial and error phase. The trial and error is carried out
by simulating the game with three different scenarios. After the game trial, the researcher and
players discuss the results to improve the game further.
Figure 6. Bills of materials of Robo Factory for products Alpha and Beta
Source: Authors (2020)
Journal of Environmental Science and Sustainable Development 3(1): 1-29
DOI: https://doi.org/10.7454/jessd.v3i1.1045 11
The results of the trial and error of the Robo Factory prototype are analyzed to improve the
game. First, the order from the supply chain manager to the supplier, with the product as a
reference, is converted into parts, the numbers of which are limited as follows: three head parts
for Alpha and three head parts for Beta in one turn. This limit is set to help the supplier in
checking the availability of goods and the supply chain manager in devising strategies to win
the game (i.e., the manager may want to deplete the supplier’s stock so that the opponent cannot
fulfill its product requirements). Second, three types of vehicles are used: trucks, ships, and
aircraft. As the experiment progresses, only trucks and ships are used to simplify the game.
The aircraft is excluded because the transportation time is classified as too fast (one turn), and
540 parts are not enough (they may run out too quickly).
Third, the initial plan is to provide additional scores for players who successfully fulfill
orders that arrive earlier than the demand arrival standard. However, any additional score is no
longer provided to simplify the calculation. The scores remain subject to reduction for each
late-arriving demand, the value of which is one. Fourth, the initial plan is to provide additional
scores for players who successfully match the orders with the bill of materials. However, this
idea is abandoned to simplify the calculation. Nonmatching of orders for each product receives
a one-point reduction. Fifth, the holding score is initially classified on the basis of the number
of parts available at the end of the game. To provide knowledge about the holding cost, the
conversion of the number of components to the holding score is performed by multiplying the
number of parts with the holding cost. Finally, the calculation unit of the transportation score
is changed from CO2e to rupiah. This step is to add knowledge about LCA conversion from
CO2e to kilowatt/hour (kWh). The results are then converted to rupiah.
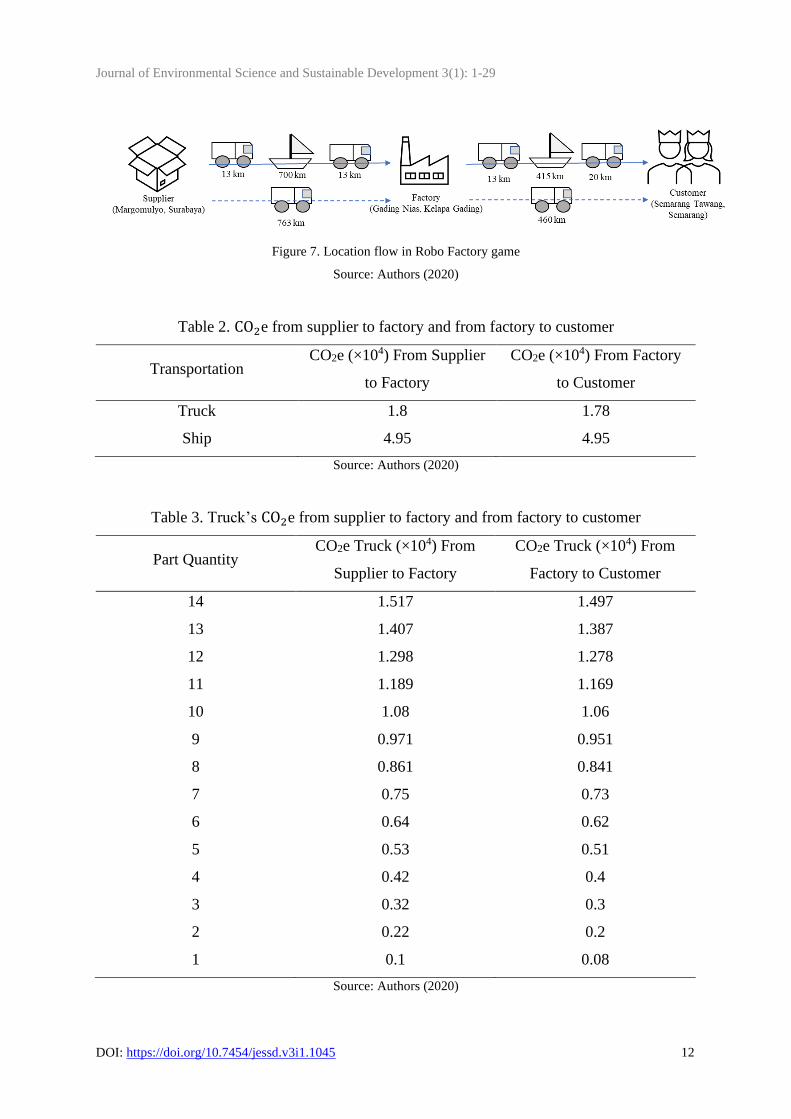
The details of the game parts after the trial and error are presented in this section. Trucks
and ships serve as the modes of transportation to ship parts and products. The travel time of
trucks takes two turns, and that of ships takes three turns. A truck can hold 15 parts, and a ship
can hold 45 parts. The CO2e of each truck changes on the basis of the number of parts it holds.
The CO2e of each ship remains the same regardless of the number of components it holds.
However, if the ship only holds fewer than 39 parts, then the shipment is made in the next turn.
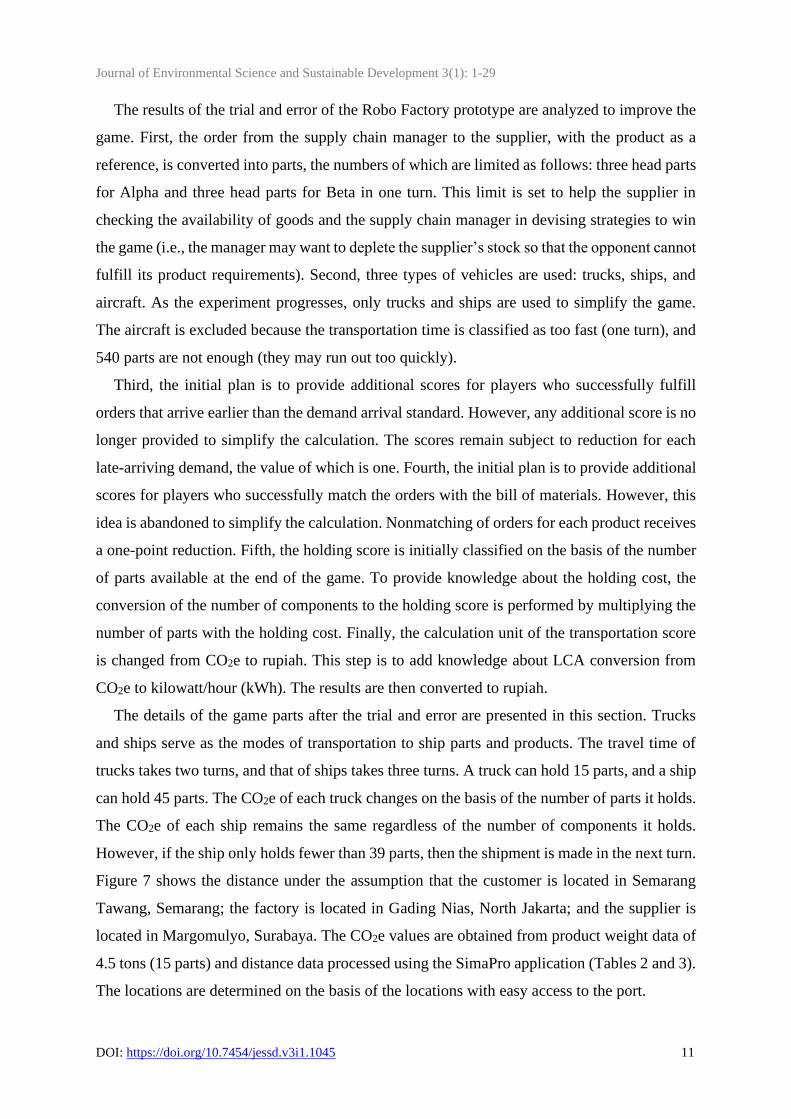
Figure 7 shows the distance under the assumption that the customer is located in Semarang
Tawang, Semarang; the factory is located in Gading Nias, North Jakarta; and the supplier is
located in Margomulyo, Surabaya. The CO2e values are obtained from product weight data of
4.5 tons (15 parts) and distance data processed using the SimaPro application (Tables 2 and 3).
The locations are determined on the basis of the locations with easy access to the port.
Journal of Environmental Science and Sustainable Development 3(1): 1-29
DOI: https://doi.org/10.7454/jessd.v3i1.1045 12
Figure 7. Location flow in Robo Factory game
Source: Authors (2020)
Table 2. CO2e from supplier to factory and from factory to customer
Transportation CO2e (×104) From Supplier
to Factory
CO2e (×104) From Factory
to Customer
Truck 1.8 1.78
Ship 4.95 4.95
Source: Authors (2020)
Table 3. Truck’s CO2e from supplier to factory and from factory to customer
Part Quantity CO2e Truck (×104) From
Supplier to Factory
CO2e Truck (×104) From
Factory to Customer
14 1.517 1.497
13 1.407 1.387
12 1.298 1.278
11 1.189 1.169
10 1.08 1.06
9 0.971 0.951
8 0.861 0.841
7 0.75 0.73
6 0.64 0.62
5 0.53 0.51
4 0.42 0.4
3 0.32 0.3
2 0.22 0.2
1 0.1 0.08
Source: Authors (2020)
Journal of Environmental Science and Sustainable Development 3(1): 1-29
DOI: https://doi.org/10.7454/jessd.v3i1.1045 13
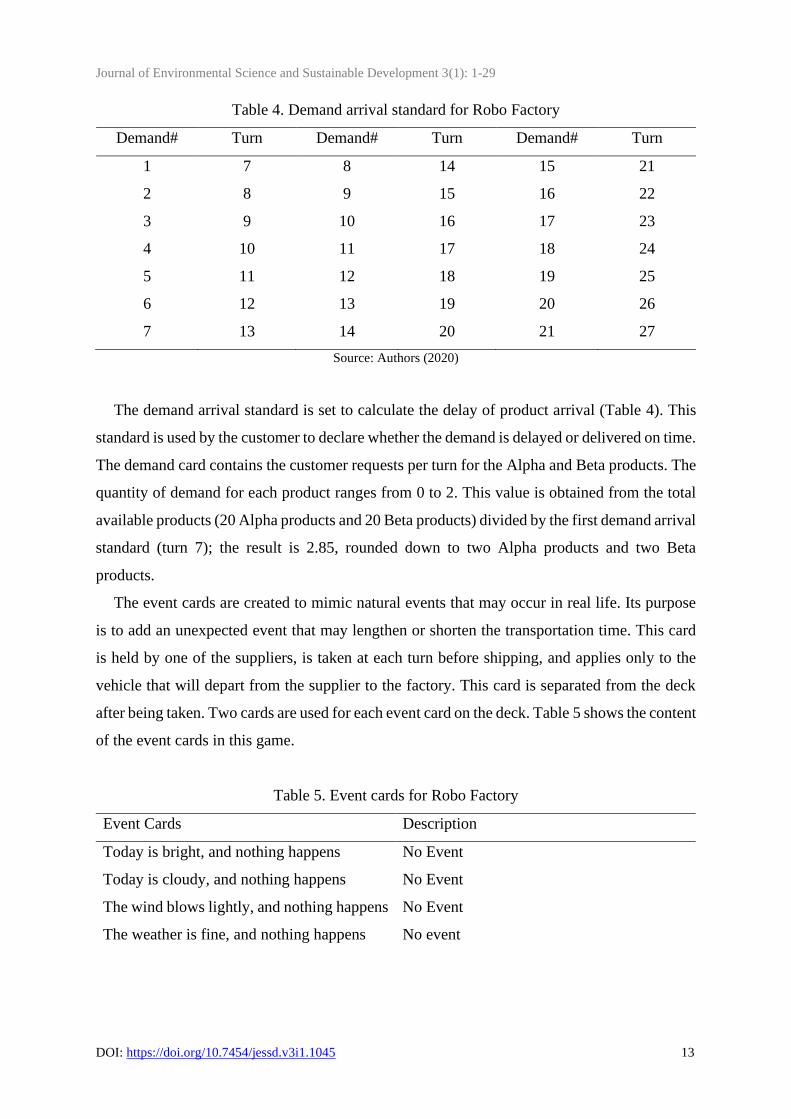
Table 4. Demand arrival standard for Robo Factory
Demand# Turn Demand# Turn Demand# Turn
1 7 8 14 15 21
2 8 9 15 16 22
3 9 10 16 17 23
4 10 11 17 18 24
5 11 12 18 19 25
6 12 13 19 20 26
7 13 14 20 21 27
Source: Authors (2020)
The demand arrival standard is set to calculate the delay of product arrival (Table 4). This
standard is used by the customer to declare whether the demand is delayed or delivered on time.
The demand card contains the customer requests per turn for the Alpha and Beta products. The
quantity of demand for each product ranges from 0 to 2. This value is obtained from the total
available products (20 Alpha products and 20 Beta products) divided by the first demand arrival
standard (turn 7); the result is 2.85, rounded down to two Alpha products and two Beta
products.
The event cards are created to mimic natural events that may occur in real life. Its purpose
is to add an unexpected event that may lengthen or shorten the transportation time. This card
is held by one of the suppliers, is taken at each turn before shipping, and applies only to the
vehicle that will depart from the supplier to the factory. This card is separated from the deck
after being taken. Two cards are used for each event card on the deck. Table 5 shows the content
of the event cards in this game.
Table 5. Event cards for Robo Factory
Event Cards Description
Today is bright, and nothing happens No Event
Today is cloudy, and nothing happens No Event
The wind blows lightly, and nothing happens No Event
The weather is fine, and nothing happens No event
Journal of Environmental Science and Sustainable Development 3(1): 1-29
DOI: https://doi.org/10.7454/jessd.v3i1.1045 14
Event Cards Description
Full harbor
Harbor check
The harbor is full; ships turn off their engines
and wait (i.e., the ships are placed on the
delay day marker).
Additional harbor check is conducted; the
ships turn off their engines and wait (i.e., the
ships are placed on the delay day marker).
Flood Flooding occurs; the truck cannot depart (i.e.,
the truck is placed on the delay day marker).
Truck maintenance
New road toll
New road
Empty harbor
New ship
Truck maintenance; the truck cannot depart
(i.e., the truck is placed on the delay day
marker).
A new toll opens; the trip is faster by one day
(i.e., the truck is placed on the day 2 marker).
A new road opens; the trip is faster by one
day (i.e., the truck is placed on the day 2
marker).
Empty harbor; the trip is faster by one day
(i.e., the ship is placed on the day 2 marker).
A new and faster ship is available; the trip is
faster by one day (i.e., the ship is placed on
the day 2 marker).
Source: Authors (2020)
The evaluation phase is designed to measure the knowledge of the players before and after
the game (pretest and posttest). In stage 1, the questionnaire for the prototype trial evaluation
consists of seven questions. Questions 1 and 2 refer to the supply chain structure; question 3
refers to tasks and responsibilities; questions 4 and 5 discuss LCA; and questions 6 and 7 refer
to the supply chain cost, LCA, and performance. The questionnaire for the prototype trial and
the final prototype based on Bloom’s taxonomy is presented in Figure 12. The game rules and
instructions are described in the finalized version (improvement after trial).
Journal of Environmental Science and Sustainable Development 3(1): 1-29
DOI: https://doi.org/10.7454/jessd.v3i1.1045 15
3.2. Second Stage: Prototype Trial, Evaluation, and Finalization of Game Rules
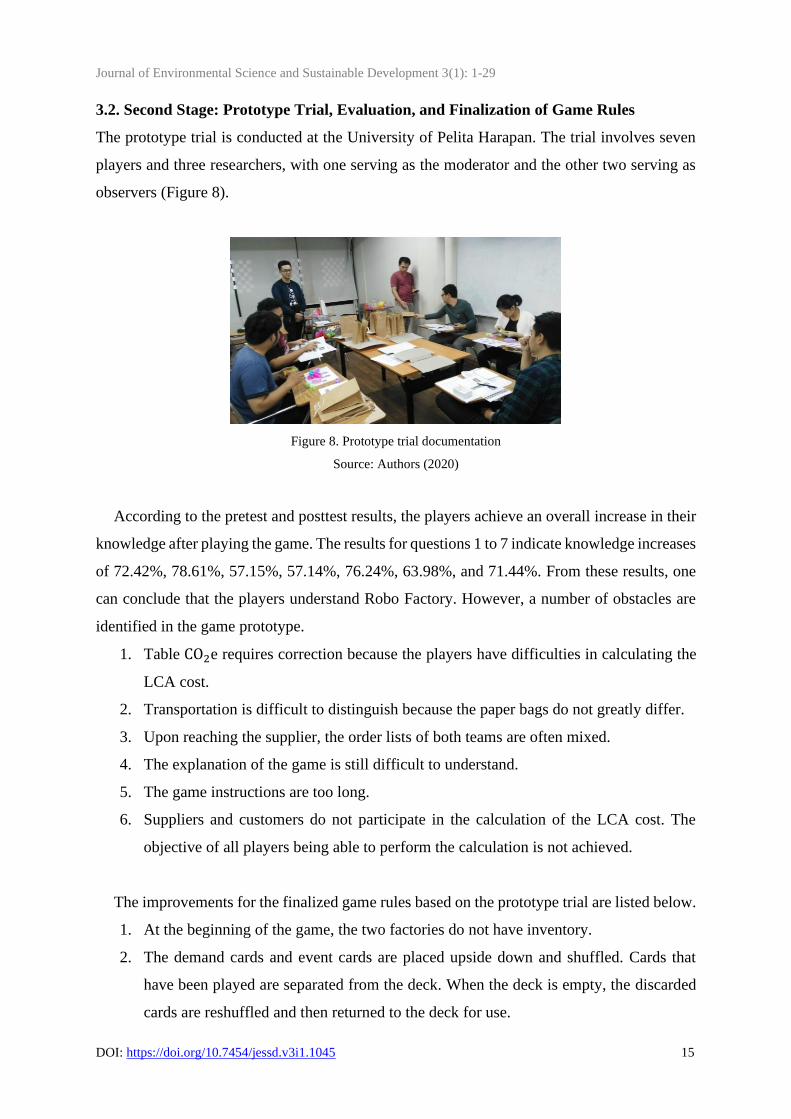
The prototype trial is conducted at the University of Pelita Harapan. The trial involves seven
players and three researchers, with one serving as the moderator and the other two serving as
observers (Figure 8).
Figure 8. Prototype trial documentation
Source: Authors (2020)
According to the pretest and posttest results, the players achieve an overall increase in their
knowledge after playing the game. The results for questions 1 to 7 indicate knowledge increases
of 72.42%, 78.61%, 57.15%, 57.14%, 76.24%, 63.98%, and 71.44%. From these results, one
can conclude that the players understand Robo Factory. However, a number of obstacles are
identified in the game prototype.
1. Table CO2e requires correction because the players have difficulties in calculating the
LCA cost.
2. Transportation is difficult to distinguish because the paper bags do not greatly differ.
3. Upon reaching the supplier, the order lists of both teams are often mixed.
4. The explanation of the game is still difficult to understand.
5. The game instructions are too long.
6. Suppliers and customers do not participate in the calculation of the LCA cost. The
objective of all players being able to perform the calculation is not achieved.
The improvements for the finalized game rules based on the prototype trial are listed below.
1. At the beginning of the game, the two factories do not have inventory.
2. The demand cards and event cards are placed upside down and shuffled. Cards that
have been played are separated from the deck. When the deck is empty, the discarded
cards are reshuffled and then returned to the deck for use.
Journal of Environmental Science and Sustainable Development 3(1): 1-29
DOI: https://doi.org/10.7454/jessd.v3i1.1045 16
3. Each shipment may only use a maximum of three vehicles.
4. Customer orders that arrive faster than the standard do not receive bonus points.
5. If the supplier cannot fulfill a factory order, then the order is declared forfeited.
6. At the end of the game, all orders that are in transit are considered as inventory.
7. In ordering parts from suppliers, supply chain managers must prioritize robot head
parts (part A for Alpha products and part B for Beta products) as every order can only
have a maximum of three A parts and three B parts. Ordering a robot body can only
be done when ordering a robot head. The body and head parts must be in the same
mode of transportation. Example: If the supply chain manager wants to order two
Alpha products (14 parts) using a truck (15 parts), then the following scenarios are
possible:
a. Order one A part: the bill of materials can only have one robot body part so that
the supplier sends one Alpha product with 14 parts.
b. Order two A parts: the bill of materials can have a maximum of two robot body
parts. However, because one maximum truckload is 15 parts, the truck contains
one Alpha product and one A part A. The remaining body parts from one Alpha
product in the bill of materials are deemed forfeited and may not be sent using
other modes of transportation.
The game boundaries are listed below.
1. The supply chain manager can choose to use a truck or a ship, and the number of
available vehicles is 20 units each.
2. The supply chain consists of the supplier, factory, and customer.
3. The LCA is limited to the calculation of CO2e and kWh.
4. The CO2e calculation is performed in Impact 2002+.
5. The calculation unit of the transportation score is changed from CO2e to rupiah. This
improvement is aimed providing knowledge about conversions in LCA. The conversion
factor of CO2e to kWh is added and then converted to rupiah.
The assumptions in this game are provided below.
1. Weight: Alpha product, 4.5 tons; Beta products 4,137 tons.
2. The truck used in this game is a double box colt diesel type with a capacity of 6.5
tons.
Journal of Environmental Science and Sustainable Development 3(1): 1-29
DOI: https://doi.org/10.7454/jessd.v3i1.1045 17
3. The holding cost is assumed to be 20% of the shipping cost.
4. Shipping cost is Rp. 11,250,000.
5. kWh to CO2e conversion factor for (1 kWh)/(0.35156 CO2e).
6. Electricity costs per kWh are used for household needs > 6,600 VA for Rp. 1,352.
7. The dividing factor in LCA cost is 109 in rupiah.
8. Each month has 20 working days; hence, one year has 240 working days.
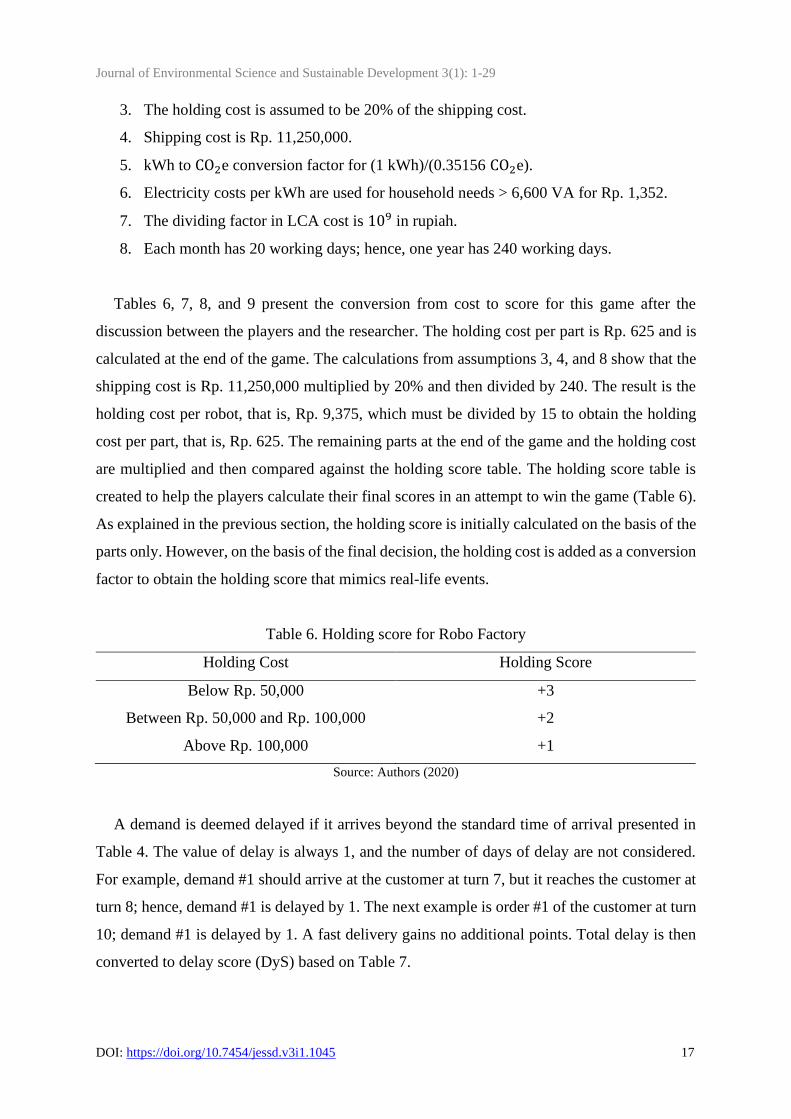
Tables 6, 7, 8, and 9 present the conversion from cost to score for this game after the
discussion between the players and the researcher. The holding cost per part is Rp. 625 and is
calculated at the end of the game. The calculations from assumptions 3, 4, and 8 show that the
shipping cost is Rp. 11,250,000 multiplied by 20% and then divided by 240. The result is the
holding cost per robot, that is, Rp. 9,375, which must be divided by 15 to obtain the holding
cost per part, that is, Rp. 625. The remaining parts at the end of the game and the holding cost
are multiplied and then compared against the holding score table. The holding score table is
created to help the players calculate their final scores in an attempt to win the game (Table 6).
As explained in the previous section, the holding score is initially calculated on the basis of the
parts only. However, on the basis of the final decision, the holding cost is added as a conversion
factor to obtain the holding score that mimics real-life events.
Table 6. Holding score for Robo Factory
Holding Cost Holding Score
Below Rp. 50,000 +3
Between Rp. 50,000 and Rp. 100,000 +2
Above Rp. 100,000 +1
Source: Authors (2020)
A demand is deemed delayed if it arrives beyond the standard time of arrival presented in
Table 4. The value of delay is always 1, and the number of days of delay are not considered.
For example, demand #1 should arrive at the customer at turn 7, but it reaches the customer at
turn 8; hence, demand #1 is delayed by 1. The next example is order #1 of the customer at turn
10; demand #1 is delayed by 1. A fast delivery gains no additional points. Total delay is then
converted to delay score (DyS) based on Table 7.

Journal of Environmental Science and Sustainable Development 3(1): 1-29
DOI: https://doi.org/10.7454/jessd.v3i1.1045 18
Table 7. Delay score for Robo Factory
Delay Cost Delay Score
≤1 +5
2–3 +4
4–5
6–7
>8
+3
+2
+1
Source: Authors (2020)
The defect score (DfS) is only counted if the customer receives a defective product. In this
game, a defect occurs when the product does not match the specifications; for example, a defect
may be a wrong color, wrong parts in the product, etc. Every mistake is counted as one defect
cost; hence, if a product received by the customer has the wrong color and wrong parts, two
defect costs are incurred. The total defect is then converted to the defect score on the basis of
Table 8. The defect score reduces the total score.
Table 8. Defect score (DfS) for Robo Factory
Defect Cost Defect Score
1–3
4–6
>7
−1
−2
−3
Source: Authors (2020)
The transportation score (TS) is obtained from the conversion of the total CO2e into rupiah.
The CO2e value is then converted to kWh using the following formula:
kWh value = CO2e × kWh to CO2e converting factor, (1)
LCA cost = value of kWh × (electricity cost per kWh)/(dividing factor). (2)
The converting factor is 0.35156 CO2e, the electricity cost per kWh is Rp. 1,352, and the
dividing factor is 109 in rupiah. Based on equations 1 and 2, LCA cost is equal to CO2e value
× 3.8457 × 10⁶. The results are converted to TS on the basis of Table 9. The total score is
obtained by adding the holding score (HS), delayed score (DyS), defect score (DS), and
transportation score (TS).
Journal of Environmental Science and Sustainable Development 3(1): 1-29
DOI: https://doi.org/10.7454/jessd.v3i1.1045 19
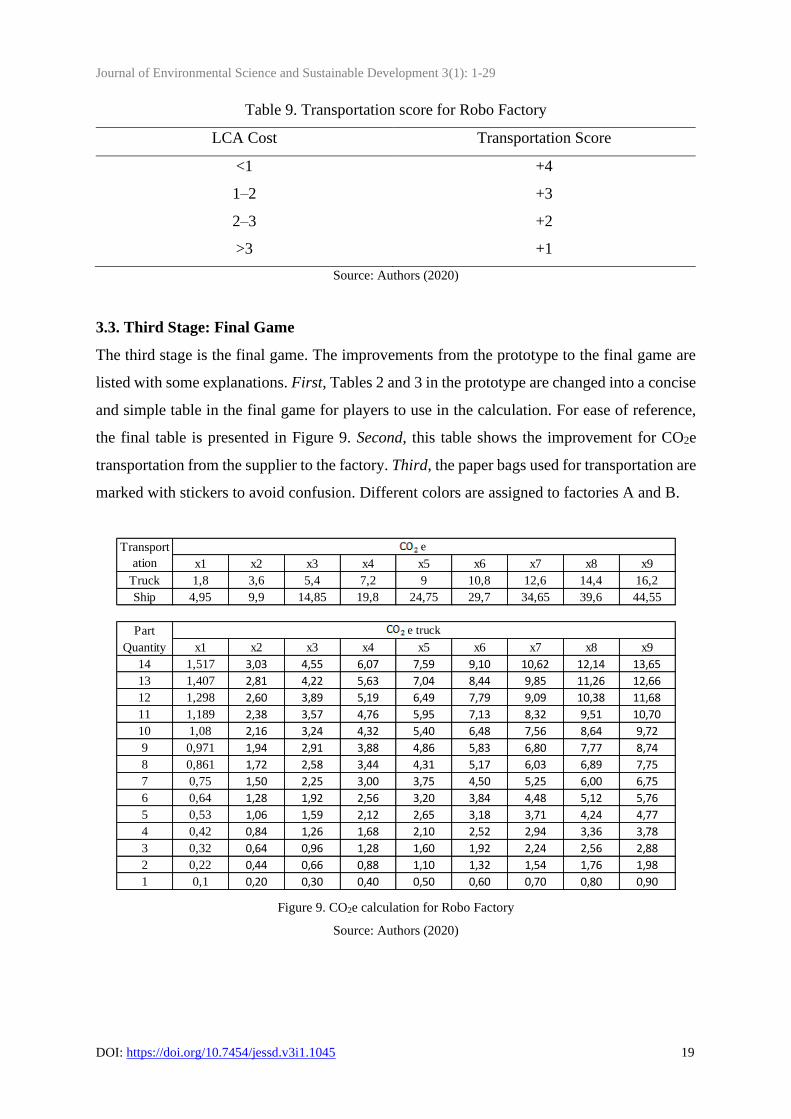
Table 9. Transportation score for Robo Factory
LCA Cost Transportation Score
<1
1–2
2–3
>3
+4
+3
+2
+1
Source: Authors (2020)
3.3. Third Stage: Final Game
The third stage is the final game. The improvements from the prototype to the final game are
listed with some explanations. First, Tables 2 and 3 in the prototype are changed into a concise
and simple table in the final game for players to use in the calculation. For ease of reference,
the final table is presented in Figure 9. Second, this table shows the improvement for CO2e
transportation from the supplier to the factory. Third, the paper bags used for transportation are
marked with stickers to avoid confusion. Different colors are assigned to factories A and B.
Figure 9. CO2e calculation for Robo Factory
Source: Authors (2020)
x1 x2 x3 x4 x5 x6 x7 x8 x9
Truck 1,8 3,6 5,4 7,2 9 10,8 12,6 14,4 16,2
Ship 4,95 9,9 14,85 19,8 24,75 29,7 34,65 39,6 44,55
Part
Quantity x1 x2 x3 x4 x5 x6 x7 x8 x9
14 1,517 3,03 4,55 6,07 7,59 9,10 10,62 12,14 13,65
13 1,407 2,81 4,22 5,63 7,04 8,44 9,85 11,26 12,66
12 1,298 2,60 3,89 5,19 6,49 7,79 9,09 10,38 11,68
11 1,189 2,38 3,57 4,76 5,95 7,13 8,32 9,51 10,70
10 1,08 2,16 3,24 4,32 5,40 6,48 7,56 8,64 9,72
9 0,971 1,94 2,91 3,88 4,86 5,83 6,80 7,77 8,74
8 0,861 1,72 2,58 3,44 4,31 5,17 6,03 6,89 7,75
7 0,75 1,50 2,25 3,00 3,75 4,50 5,25 6,00 6,75
6 0,64 1,28 1,92 2,56 3,20 3,84 4,48 5,12 5,76
5 0,53 1,06 1,59 2,12 2,65 3,18 3,71 4,24 4,77
4 0,42 0,84 1,26 1,68 2,10 2,52 2,94 3,36 3,78
3 0,32 0,64 0,96 1,28 1,60 1,92 2,24 2,56 2,88
2 0,22 0,44 0,66 0,88 1,10 1,32 1,54 1,76 1,98
1 0,1 0,20 0,30 0,40 0,50 0,60 0,70 0,80 0,90
Transport
ation
e
e truck

Journal of Environmental Science and Sustainable Development 3(1): 1-29
DOI: https://doi.org/10.7454/jessd.v3i1.1045 20
Figure 10. Final day marker for Robo Factory
Source: Authors (2020)
Fourth, the day marker is fixed and printed in a 250 cm × 160 cm banner (Figure 10).
Previous day marker could be seen in Figure 4 (b). Fifth, the game rules are simplified from a
five-page document to a one-page document. Sixth, player role has been through some changes
based on evaluation in stage 2. In this article, the final role of a player is presented in Figure
11.
Figure 11. Player roles and descriptions
Source: Authors (2020)
Role Number of player Description
Customer Customer (2)Responsible to read the demand card and check the
delay and product defect
Factory
(2 team)
Operator (2)
Took product from warehouse and assembly the
product using the Bill of Material and send the
finished product to customer as instructed by SCM
manager
Supplier
(2 Supplier)
Moderator Moderator (1)Giving explanation of the game, observed the game,
giving instruction, change the turn marker
Supply Chain
Manager (1)
Planning the supply with considering every boundary,
planning the shipment strategy to customer, choose
the transportation, and give order to operator
Supplier (4)Send the part to factory as demand from SCM
Manager, took and read the event cards.
Journal of Environmental Science and Sustainable Development 3(1): 1-29
DOI: https://doi.org/10.7454/jessd.v3i1.1045 21
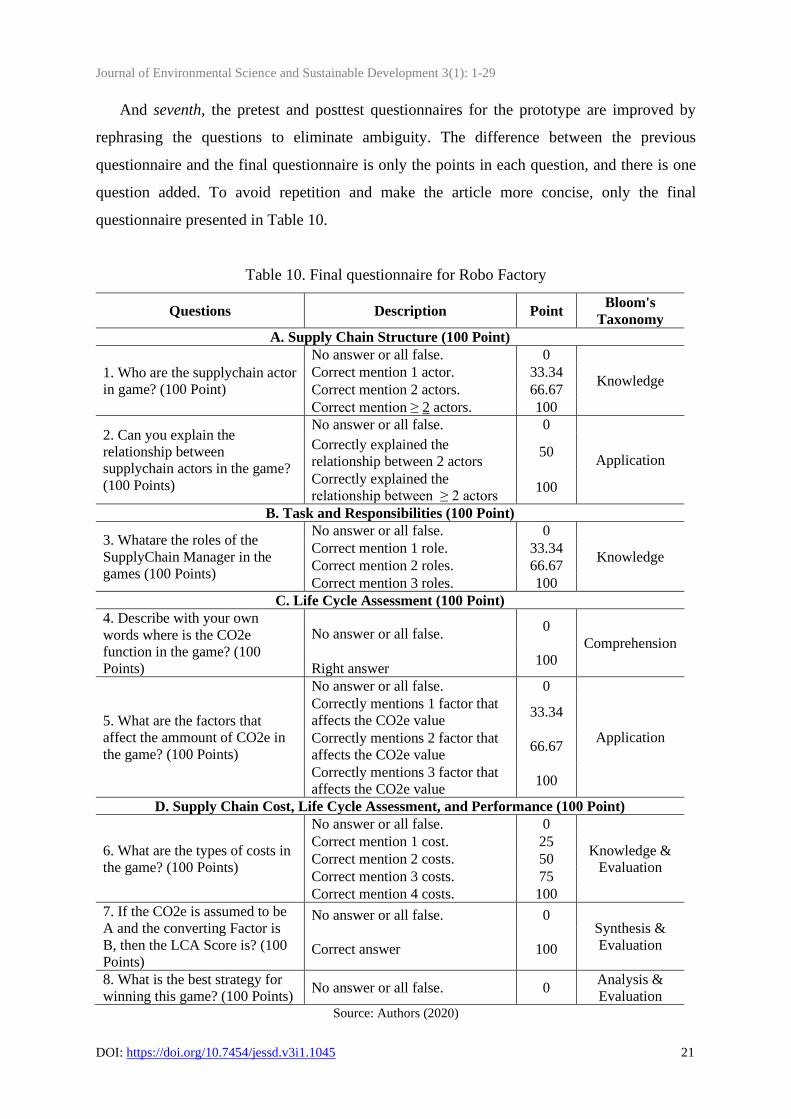
And seventh, the pretest and posttest questionnaires for the prototype are improved by
rephrasing the questions to eliminate ambiguity. The difference between the previous
questionnaire and the final questionnaire is only the points in each question, and there is one
question added. To avoid repetition and make the article more concise, only the final
questionnaire presented in Table 10.
Table 10. Final questionnaire for Robo Factory
Questions Description Point Bloom's
Taxonomy
A. Supply Chain Structure (100 Point)
1. Who are the supplychain actor
in game? (100 Point)
No answer or all false. 0
Knowledge Correct mention 1 actor. 33.34
Correct mention 2 actors. 66.67
Correct mention ≥ 2 actors. 100
2. Can you explain the
relationship between
supplychain actors in the game?
(100 Points)
No answer or all false. 0
Application Correctly explained the
relationship between 2 actors 50
Correctly explained the
relationship between ≥ 2 actors 100
B. Task and Responsibilities (100 Point)
3. Whatare the roles of the
SupplyChain Manager in the
games (100 Points)
No answer or all false. 0
Knowledge Correct mention 1 role. 33.34
Correct mention 2 roles. 66.67
Correct mention 3 roles. 100
C. Life Cycle Assessment (100 Point)
4. Describe with your own
words where is the CO2e
function in the game? (100
Points)
No answer or all false. 0
Comprehension
Right answer 100
5. What are the factors that
affect the ammount of CO2e in
the game? (100 Points)
No answer or all false. 0
Application
Correctly mentions 1 factor that
affects the CO2e value 33.34
Correctly mentions 2 factor that
affects the CO2e value 66.67
Correctly mentions 3 factor that
affects the CO2e value 100
D. Supply Chain Cost, Life Cycle Assessment, and Performance (100 Point)
6. What are the types of costs in
the game? (100 Points)
No answer or all false. 0
Knowledge &
Evaluation
Correct mention 1 cost. 25
Correct mention 2 costs. 50
Correct mention 3 costs. 75
Correct mention 4 costs. 100
7. If the CO2e is assumed to be
A and the converting Factor is
B, then the LCA Score is? (100
Points)
No answer or all false. 0 Synthesis &
Evaluation Correct answer 100
8. What is the best strategy for
winning this game? (100 Points) No answer or all false. 0
Analysis &
Evaluation Source: Authors (2020)
Journal of Environmental Science and Sustainable Development 3(1): 1-29
DOI: https://doi.org/10.7454/jessd.v3i1.1045 22
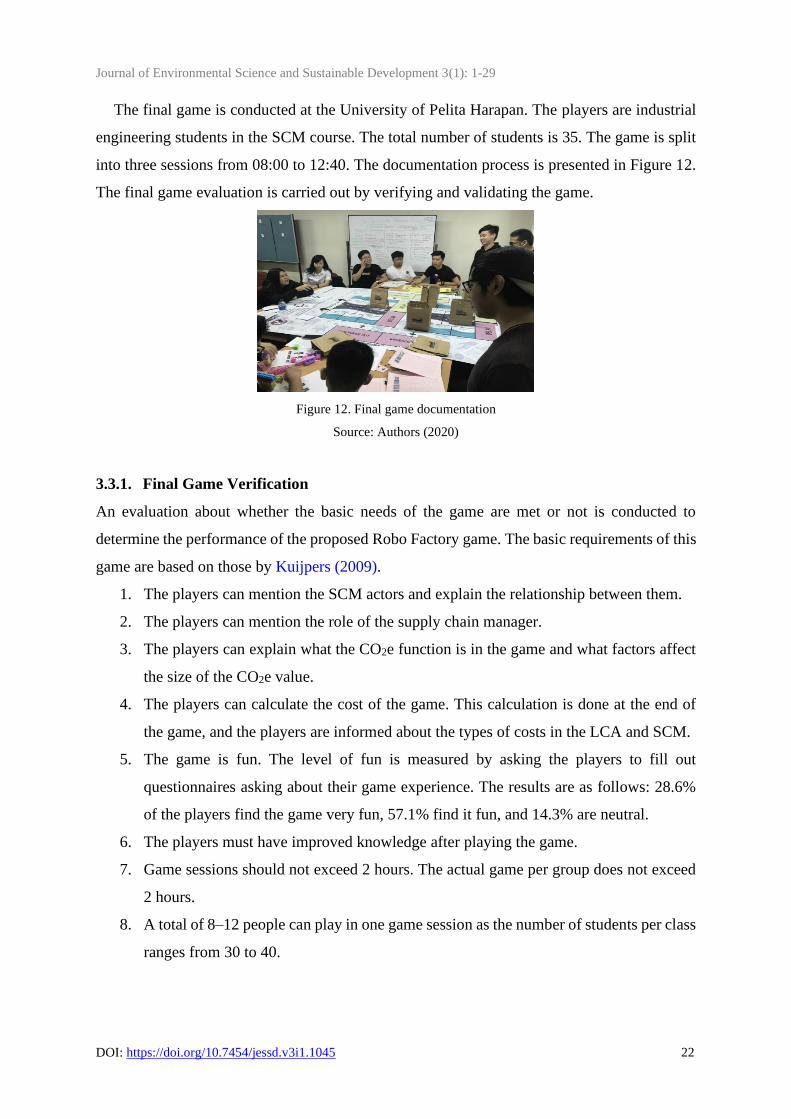
The final game is conducted at the University of Pelita Harapan. The players are industrial
engineering students in the SCM course. The total number of students is 35. The game is split
into three sessions from 08:00 to 12:40. The documentation process is presented in Figure 12.
The final game evaluation is carried out by verifying and validating the game.
Figure 12. Final game documentation
Source: Authors (2020)
3.3.1. Final Game Verification
An evaluation about whether the basic needs of the game are met or not is conducted to
determine the performance of the proposed Robo Factory game. The basic requirements of this
game are based on those by Kuijpers (2009).
1. The players can mention the SCM actors and explain the relationship between them.
2. The players can mention the role of the supply chain manager.
3. The players can explain what the CO2e function is in the game and what factors affect
the size of the CO2e value.
4. The players can calculate the cost of the game. This calculation is done at the end of
the game, and the players are informed about the types of costs in the LCA and SCM.
5. The game is fun. The level of fun is measured by asking the players to fill out
questionnaires asking about their game experience. The results are as follows: 28.6%
of the players find the game very fun, 57.1% find it fun, and 14.3% are neutral.
6. The players must have improved knowledge after playing the game.
7. Game sessions should not exceed 2 hours. The actual game per group does not exceed
2 hours.
8. A total of 8–12 people can play in one game session as the number of students per class
ranges from 30 to 40.

Journal of Environmental Science and Sustainable Development 3(1): 1-29
DOI: https://doi.org/10.7454/jessd.v3i1.1045 23
9. The introduction and briefing before playing the game are conducted using a
PowerPoint presentation. The players can raise questions during the session until they
understand the game rules.
Basic needs numbers 1, 2, 3, 4, and 6 are measured in the pretest and posttest.
3.3.2. Final Game Validation
The guidelines (Table 1) for ensuring game validity are followed in the process of developing
the game; hence, the game has no errors. The process of developing a game is not a pure
sequential order, and some steps need to cycle back to the previous step to improve the final
game. The "Robo Factory" has followed the steps and using the guideline to eliminate error
while ensuring the objective of the game is achieved.
The objective is to improve the knowledge of students, which is measured using a
questionnaire in the pretest and posttest. The game is deemed satisfactory if it improves at least
50% of the students’ knowledge. Table 11 shows the increasing percentage from the pretest to
the posttest; the minimum percentage is 51.43%. The percentage is calculated from the mean
difference between the posttest and the pretest.
Table 11. Validation for final Robo Factory Game
Game Objectives Pretest mean Posttest mean Percentage
Supply Chain Structure 48.58 100 51.43%
Tasks & Responsibilities 11.91 92.38 80.47%
Life Cycle Assessment 0 89.53 89.53%
SCM & LCA Costs 13.16 91.43 78.27%
Source: Authors (2020)
An increase in knowledge is noted for every objective. The knowledge targets related to
supply chain structure, tasks & responsibilities, LCA, and SCM & LCA cost increase by
51.43%, 80.47%, 89.53%, and 78.27%, respectively. The smallest percentage is that for the
supply chain structure, with the pretest average being higher than the averages of the other
indicators. This result is due to the final game being conducted among students in the middle
of their SCM courses. The other objective shows improvement by around 80% except for LCA.
All the players have no knowledge about LCA and improve almost 90%.
The game design process is a repetitive cycle that calls for improvement in every stage, and
it involves a step-by-step approach to creating a successful educational game design. The

Journal of Environmental Science and Sustainable Development 3(1): 1-29
DOI: https://doi.org/10.7454/jessd.v3i1.1045 24
verification and validation are a subjective task, and the researcher should follow the steps
carefully to ensure the whole process could be somewhat more objective. This process also
gives a direction for the goal of the game and improvement in the developing process.
4. Conclusion
The results of this research are satisfactory. The Robo Factory successfully teaches
undergraduate students about LCA in SCM within an enjoyable environment. The game proves
to increase the knowledge of students and is deemed enjoyable. The knowledge target related
to supply chain structure increases by 51.43%, and the highest improvement is that for LCA at
89.53%. The game is rated to be fun and very fun by 85.7% of the students. Meanwhile, 14.3%
of the students are neutral about the game. The contribution of this research is the Robo Factory
game, which is expected to enrich the area of supply chain games with LCA to achieve an
environmentally conscious SCM. The intellectual property rights of the Robo Factory game
were registered in Indonesia on 21 March 2019 (no. EC00201933456).
The game design process and the parts of the game are described thoroughly in this work to
help other researchers who are interested in developing the proposed game further. Further
research can improve the game by extending its application, adding other actors in the game,
adding other elements in the LCA, and adding or changing an environmental aspect in the
game.
Acknowledgement
Universitas Pelita Harapan fully supports the research and the registration of intellectual
property rights. The authors were thankful to support from LPPM-UPH with grant no P-007-
FaST/VI/2018 for this work. The intellectual property rights of Robo Factory were registered
in Indonesia on March 21, 2019 (no. EC00201933456).
Author Contribution
Natalia Hartono conceived the idea. Natalia Hartono, Laurence and Giovanni Hezekiah
Chandra developed the theory. Giovanni Hezekiah Chandra developed the experiments.
Natalia Hartono and Laurence check the method and the process of the experiments. Natalia
Hartono and Laurence supervised the results. Natalia Hartono and Giovanni Hezekiah Chandra
prepare the documents for intellectual property rights. Natalia Hartono prepares the final
manuscript.
Journal of Environmental Science and Sustainable Development 3(1): 1-29
DOI: https://doi.org/10.7454/jessd.v3i1.1045 25
References
Adams, N. E. (2015). Bloom's taxonomy of cognitive learning objectives. Journal of the
Medical Library Association, 103(3), 152–153. https://doi.org/10.3163/1536-
5050.103.3.010
Adesoji, F. A. (2018). Bloom taxonomy of educational objectives and the modification of
cognitive levels. Advances in Social Sciences Research Journal, 5(5).
https://doi.org/10.14738/assrj.55.4233
Anderson Jr, E. G., & Morrice, D. J. (2000). A simulation game for teaching service-oriented
supply chain management: Does information sharing help managers with service capacity
decisions? Production and Operations Management, 9(1), 40–55.
https://doi.org/10.1111/j.1937-5956.2000.tb00322.x
Beske-Janssen, P., Johnson, M. P., & Schaltegger, S. (2015). 20 years of performance
measurement in sustainable supply chain management–what has been achieved? Supply
Chain Management, 20(6), 664–680. https://doi.org/10.1108/SCM-06-2015-0216
Blass, V., & Corbett, C. J. (2018). Same supply chain, different models: Integrating
perspectives from life cycle assessment and supply chain management. Journal of
Industrial Ecology, 22(1), 18–30. https://doi.org/10.1111/jiec.12550
Bloom, B. S. (1956). Taxonomy of educational objectives: The classification of educational
goals. Cognitive Domain.
Brandenburg, M., Gruchmann, T., & Oelze, N. (2019). Sustainable supply chain
management—A conceptual framework and future research perspectives. Sustainability,
11(24), 7239. https://doi.org/10.3390/su11247239
Brewer, P. D., & Brewer, K. L. (2010). Knowledge management, human resource management,
and higher education: A theoretical model. Journal of Education for Business, 85(6), 330–
335. https://doi.org/10.1080/08832321003604938
Carter, C. R., Hatton, M. R., Wu, C., & Chen, X. (2019). Sustainable supply chain management:
continuing evolution and future directions. International Journal of Physical Distribution
& Logistics Management, 50(1), 122–146. https://doi.org/10.1108/IJPDLM-02-2019-0056
Chin, T. A., Tat, H. H., & Sulaiman, Z. (2015). Green supply chain management, environmental
collaboration and sustainability performance. Procedia CIRP, 26, 695–699.
https://doi.org/10.1016/j.procir.2014.07.035
Journal of Environmental Science and Sustainable Development 3(1): 1-29
DOI: https://doi.org/10.7454/jessd.v3i1.1045 26
Cuesta, V., & Nakano, M. (2017). Chain of command: A sustainable supply chain management
serious game. International Journal of Automation Technology, 11(4), 552–562.
https://doi.org/10.20965/ijat.2017.p0552
Engler, R. (2012). Serious Games–Gamification of Education. Amsterdam: Vrije Universiteit
Amsterdam.
Fornasiero, R., Brondi, C., & Collatina, D. (2017). Proposing an integrated LCA-SCM model
to evaluate the sustainability of customisation strategies. International Journal of Computer
Integrated Manufacturing, 30(7), 768–781.
https://doi.org/10.1080/0951192X.2016.1268716
Genovese, A., Acquaye, A. A., Figueroa, A., & Koh, S. L. (2017). Sustainable supply chain
management and the transition towards a circular economy: Evidence and some
applications. Omega, 66, 344–357. https://doi.org/10.1016/j.omega.2015.05.015
Grandzol, C. J., & Grandzol, J. R. (2018). Chantey castings: A hands-on simulation to teach
constraint management and demand-driven supply chain approaches. Decision Sciences
Journal of Innovative Education, 16(1), 6–22. https://doi.org/10.1111/dsji.12142
Hauschild, M. Z., Rosenbaum, R. K., & Olsen, S. (2018). Life cycle assessment. Springer.
Hieber, R., & Hartel, I. (2003). Impacts of SCM order strategies evaluated by simulation-
based'Beer Game'approach: The model, concept, and initial experiences. Production
Planning & Control, 14(2), 122–134. https://doi.org/10.1080/0953728031000107680
Hofstede, G.J. (2006). Experimental learning in chains and networks. Production Planning and
Control, 17, 543–546. https://doi.org/10.1080/09537280600866561
ISO 14040:2006. (2016). Environmental management - Life cycle assessment - Principles and
framework. https://www.iso.org/standard/37456.html
Jensen, J. K. (2012). Product carbon footprint developments and gaps. International Journal of
Physical Distribution & Logistics Management, 42(4), 338–354.
https://doi.org/10.1108/09600031211231326
Khalid, R. U., & Seuring, S. (2019). Analysing base-of-the-pyramid research from a
(sustainable) supply chain perspective. Journal of Business Ethics, 155(3), 663–686.
https://doi.org/10.1007/s10551-017-3474-x
Kuijpers, R. P. (2009). Supply chain risk management game: The design, construction, testing
and evaluation of a serious game that facilitates learning about Supply Chain Risk
Management (Master of Science). Delft: Delft University of Technology.
http://resolver.tudelft.nl/uuid:5d678557-669f-4c34-bac5-2a861454bc0e

Journal of Environmental Science and Sustainable Development 3(1): 1-29
DOI: https://doi.org/10.7454/jessd.v3i1.1045 27
Lee, H. L., Padmanabhan, V., & Whang, S. (1997). The bullwhip effect in supply chains. Sloan
Management Review, 38, 93–102. https://sloanreview.mit.edu/wp-
content/uploads/1997/04/633ecdb037.pdf
Liu, C. L. (2017). Using a video game to teach supply chain and logistics management.
Interactive Learning Environments, 25(8), 1009–1024.
https://doi.org/10.1080/10494820.2016.1242503
Lu, H. E., Potter, A., Rodrigues, V. S., & Walker, H. (2018). Exploring sustainable supply chain
management: A social network perspective. Supply Chain Management, 23(4), 257–277.
https://doi.org/10.1108/SCM-11-2016-0408
Mayer, I. S. (2009). The gaming of policy and the politics of gaming: A review. Simulation &
Gaming, 40(6), 825–862. https://doi.org/10.1177/1046878109346456
Mehring, J.S. (2000). A Practical setting for experimental learning about supply chains:
Siemens brief case game supply chain simulator. Production and Operations Management,
9, 56–65. https://doi.org/10.1111/j.1937-5956.2000.tb00323.x
Meijer, S. (2009). The organisation of transactions: Studying supply networks using gaming
simulation. Wageningen: Wageningen Academic Pub.
Ni, W., & Sun, H. (2019). The effect of sustainable supply chain management on business
performance: Implications for integrating the entire supply chain in the Chinese
manufacturing sector. Journal of Cleaner Production, 232, 1176–1186.
https://doi.org/10.1016/j.jclepro.2019.05.384
Noemí, P. M., & Máximo, S. H. (2014). Educational games for learning. Universal Journal of
Educational Research, 2(3), 230–238. https://doi.org/10.13189/ujer.2014.020305
Onu, P., & Mbohwa, C. (2019). Sustainable supply chain management: Impact of practice on
manufacturing and industry development. Journal of Physics: Conference Series, 1378(2),
022073. https://doi.org/10.1088/1742-6596/1378/2/022073
Parmigiani, A., Klassen, R. D., & Russo, M. V. (2011). Efficiency meets accountability:
Performance implications of supply chain configuration, control, and capabilities. Journal
of Operations Management, 29(3), 212–223. https://doi.org/10.1016/j.jom.2011.01.001
Paulraj, A., Chen, I. J., & Blome, C. (2017). Motives and performance outcomes of sustainable
supply chain management practices: A multi-theoretical perspective. Journal of Business
Ethics, 145(2), 239–258. https://doi.org/10.1007/s10551-015-2857-0

Journal of Environmental Science and Sustainable Development 3(1): 1-29
DOI: https://doi.org/10.7454/jessd.v3i1.1045 28
Pujawan, N., & Er, M. (2017). Supply Chain Management, 3rd Edition. Jogjakarta: Andi.
Qorri, A., Mujkić, Z., & Kraslawski, A. (2018). A conceptual framework for measuring
sustainability performance of supply chains. Journal of Cleaner Production, 189, 570–584.
https://doi.org/10.1016/j.jclepro.2018.04.073
Qualters, D., Isaacs, J., Cullinane, T., McDonald, A., & Laird, J. (2006). Assessment of
shortfall: A board game on environmental decisionmaking. Proceedings of ASEE 2006
Annual Conference and Exposition, 18–21. https://peer.asee.org/assessment-of-shortfall-a-
board-game-on-environmental-decisionmaking.pdf
Ramezankhani, M. J., Torabi, S. A., & Vahidi, F. (2018). Supply chain performance
measurement and evaluation: A mixed sustainability and resilience approach. Computers
& Industrial Engineering, 126, 531–548. https://doi.org/10.1016/j.cie.2018.09.054
Ramirez, T. V. (2017). On pedagogy of personality assessment: Application of Bloom's
taxonomy of educational objectives. Journal of Personality Assessment, 99(2), 146–152.
https://doi.org/10.1080/00223891.2016.1167059
Rebs, T., Brandenburg, M., & Seuring, S. (2019). System dynamics modeling for sustainable
supply chain management: A literature review and systems thinking approach. Journal of
Cleaner Production, 208, 1265–1280. https://doi.org/10.1016/j.jclepro.2018.10.100
Sato, M., Tsunoda, M., Imamura, H., Mizuyama, H., & Nakano, M. (2017). The design and
evaluation of a multi-player milk supply chain management game. In H. Lukosch,G.
Bekebrede, R. Kortmann (Eds.), Simulation Gaming. Applications for Sustainable Cities
and Smart Infrastructures. ISAGA 2017. Lecture Notes in Computer Science (pp. 110–118).
Cham: Springer. https://doi.org/10.1007/978-3-319-91902-7_11
Scopus. (2020).
https://www.scopus.com/term/analyzer.uri?sid=6ce8870e4ceb2095230ae3a6757aebd1&origi
n=resultslist&src=s&s=TITLE%28supply+chain%29&sort=plf-
f&sdt=sisr&sot=b&sl=19&count=16056&analyzeResults=Analyze+results&ref=%28green+
OR+sustainability+OR+sustainable%29&txGid=25bc6996da632439eeb58306dacc4b17
Shovityakool, P., Jittam, P., Sriwattanarothai, N., & Laosinchai, P. (2019). A flexible supply
chain management game. Simulation & Gaming, 50(4), 461–482.
https://doi.org/10.1177/1046878119857119
Journal of Environmental Science and Sustainable Development 3(1): 1-29
DOI: https://doi.org/10.7454/jessd.v3i1.1045 29
Su, C. M., Horng, D. J., Tseng, M. L., Chiu, A. S., Wu, K. J., & Chen, H. P. (2016). Improving
sustainable supply chain management using a novel hierarchical grey-DEMATEL
approach. Journal of Cleaner Production, 134, 469–481.
https://doi.org/10.1016/j.jclepro.2015.05.080
Taghikhah, F., Voinov, A., & Shukla, N. (2019). Extending the supply chain to address
sustainability. Journal of Cleaner Production, 229, 652–666.
https://doi.org/10.1016/j.jclepro.2019.05.051
Vanany, I., & Syamil, A. (2016). Teaching supply chain management using an innovative
practical game. International Journal of Information Systems and Supply Chain
Management, 9(4), 82–99. https://doi.org/10.4018/978-1-7998-0945-6.ch039
Yun, G., Yalcin, M. G., Hales, D. N., & Kwon, H. Y. (2019). Interactions in sustainable supply
chain management: A framework review. The International Journal of Logistics
Management, 30(1), 140–173. https://doi.org/10.1108/IJLM-05-2017-0112
Zhang, F., & Zwolinski, P. (2015). SimGreen: a serious game to learn how to improve
environmental integration into companies. Procedia CIRP, 29(2015), 281–286.
https://doi.org/10.1016/j.procir.2015.04.094
Zimon, D., Tyan, J., & Sroufe, R. (2019). Implementing sustainable supply chain management:
Reactive, cooperative, and dynamic models. Sustainability, 11(24), 7227.
https://doi.org/10.3390/su11247227


![Danielle Changala - Vermont Journal of Environmental Lawvjel.vermontlaw.edu/...to...Architecture-and-Green-Building-Design.pdf2013] Legal Impediments to Sustainable Architecture 613](https://img.pdfslide.net/doc/110x75/5afbb1697f8b9ad22090f001/danielle-changala-vermont-journal-of-environmental-legal-impediments-to-sustainable.jpg)