Embed Size (px)
Citation preview
JOURNAL OF LATEX CLASS FILES, VOL. , NO. , AUGUST 2016 1
Adaptively Exploring Population Mobility Patternsin Flow Visualization
Fei Wang, Wei Chen, Ye Zhao, Tianyu Gu, Siyuan Gao, and Hujun Bao
Abstract—Thanks to the ubiquitous cell phone use, we havenever been so close to uncover population mobility patterns inurban area. While some researches utilize cellphone call recordsto mine population patterns, few works aim to depict populationmovement in adaptively spatial and temporal representations,i.e., from a community, a district in the city over an hour, a dayto a week. In this paper, we construct a system which deciphers,transforms, queries and visualizes the records from millionsof users in a city. In particular, we design a data structure,namely MobiHash, which collects phone call records over basestations and indexes them by utilizing a Voronoi division ofthe urban space. MobiHash supports responsive data queriesso that users can interactively retrieve trajectories reflectingpopulation flows in areas of interest. Moreover, populationmovement are represented as vector fields to reduce visual clutterand occlusions. Because of sparse moving points, a novel radiationmodel is proposed to interpolate population passing zones. Casestudies and experts’ feedback validate the utility and efficiencyby comparing population moving patterns in different times byusing our system.
Index Terms—Population Mobility Pattern, Visual Query, FlowVisualization, Cell Phone Data.
I. INTRODUCTION
APopulation mobility pattern (e.g., the gathering and scat-tering pattern) informally represents a event or incident
that involves a large group of people, which form durableand stable areas with a comparable high or low density.Population mobility patterns are well studied in many aspects,for example, predicting non-trivial group incidents (e.g., trafficjams, earth quakes, public gatherings) [1], modeling transportservices [2]–[4], analyzing functional areas of a city [5], andeven designing and evaluating mobile applications.
The rapid expansion of wireless infrastructure in recentyears has offered opportunities to record population mobilitybehaviors. In this paper, we utilize a real big data set of phonecall records with base station information in a city to designa system for a study of city-wide population mobility. Ourdata comprises both the city’s base stations and movementof cell phone holders among these stations. Therefore, our
Fei Wang is with Key Laboratory of High Performance Computing andStochastic Information Processing (MOE), College of Mathematics and Com-puter Science, Hunan Normal University, Changsha, P. R. China. He is alsowith Smart System Institute, National University of Singapore.E-mail:[email protected]
Wei Chen (corresponding author), Tianyu Gu, Siyuan Gao, and Hujun Baoare with the State Key Lab of CAD&CG, Zhejiang University, Hangzhou, P.R. China.E-mail: {[email protected], [email protected]}
Ye Zhao is with Department of Computer Science, Kent State University,Kent, Ohio, United States.E-mail:[email protected]
data reflects spatial locations of cell phones as well as humantrajectories which reflecting urban population dynamics.
Displays showing a large amount of trajectories may sufferfrom visual clutter and occlusions. Simplifying or aggregatingthe spatial data are widely used to reduce visual clutter bydecreasing the opacity of minor flows [6] or the size of therepresented data [7], [8]. Density fields with different radiikernels can be combined to expose simultaneously large-scalepatterns and fine features [9], [10]. These approaches mainlypresent global patterns of movement, however, local detailswhich impact traffic situations may be omitted. Vector fieldtechniques used in fluid dynamics have been well employed inmigration and general movement mapping [11], [12] becausesmooth and continuous lines of vector fields are able to outlinemovement details and specific topological patterns such assources, sinks and vortexes, etc.
In this paper, the idea is utilizing vector fields to adaptivelyrepresent the mobility patterns of population in a city andin communities or districts inside the city. The vector fieldsare visualized through flow visualization tools so that mobilitybehaviors in different sizes of space and time can be identified.For example, if an expert cares about traffic situations on abridge in one day, s/he can brush the bridge on map and filterdata of that day. While s/he wants to know the populationmovement for a big area in a specific hour, s/he can selectthe big area (up to the whole city) and filter the data of thespecific hour. While the generated raw vector fields have highresolution, by using vector visualization tools with differentvisual resolutions (e.g., density of streamlines), both detailedmovement in the former scenario and global flows in the latterscenario would be presented.
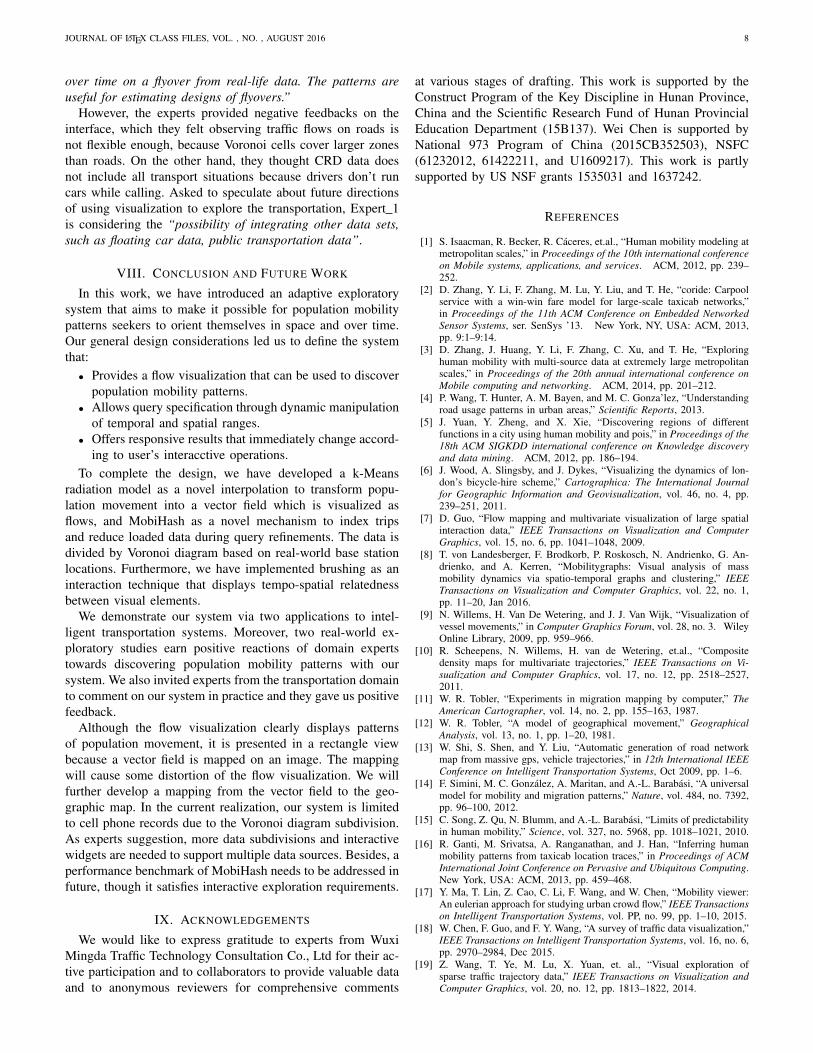
Fig. 1. Left: Crowd congregating into the red square could be detected in theflow visualization; Right: Traffic flows outlining a flyover in the red rectanglecould be identified.
The adaptive approach to uncovering population mobilitypatterns potentially has twofold challenges, i.e., querying thebig, spatial and dynamic data sets and visualizing sparsephone records in various space and time. To overcome thesechallenges, we first design a dynamic spatial data structureMobiHash to manage the calling records on the spatial do-
JOURNAL OF LATEX CLASS FILES, VOL. , NO. , AUGUST 2016 2
mains of the city. In particular, we split the city’s space intocells through a Voronoi diagram, given the locations of all themobile stations. In fact, it provides an effective spatial partitionof the city, since the distribution of mobile stations reflects thecity’s structural and human activity features. For example, itis dense in heavily used area and sparse in suburbs.
Additionally, we provide two visualization techniques toallow users explore data: (1) the dynamic flows of populationmovement on the map; (2) the statistics of cell phone usageover time in interested city regions. Flows among spatialdivisions represent spatial patterns of population movement.
We demonstrate and evaluate the proposed method in real-world applications if applied in intelligent transportation sys-tems. For example, if population congregates at a square dur-ing a short time, traffic situation forecasting should be reportedimmediately to avoid dangerous events from congestions, e.g.,2014 Shaihai stampede. Map errors (missing roads, junctions,etc.) are great challenges in automatic generation of roadnetwork map [13]. The flow detecting application considersflows variation to present local situations of traffic sensitiveareas. People in all directions crowding into the red squareof Fig. 1(left) could be detected by our flow visualization. Inthe field of road network map, we address similarity betweenflows and the road network. Fig. 1(right) displays a flowvisualization, whose outline in the red rectangle well matchesa flyover on map.
We summarize our main contributions as follows:• Designing new representation and visualization tech-
niques to utilize the cell-phone-data-based movement datafor exploring population mobility patterns;
• Dividing the city domain by Voronoi diagram basedon real-world base station locations, so that the data isefficiently managed via a spatial structure;
• Utilizing an efficient data structure, MobiHash, to offerimmediately data query.
The rest of this paper is organized as follows. Related workis summarized in Section II. Then we introduce our data andsystem architecture in Section III. Section IV gives definitionsfor basic concepts and describes how to manage movementdata with MobiHash index. The proposed interpolation methodis given in Section V and our visual interface is described inSection VI. We present case studies and experts’ feedbacksin Section VII, followed by a conclusion and future work inSection VIII.
II. RELATED WORK
Existing approaches to discovering population mobility pat-terns cover three categories: statistical methods [14], [15],data-mining methods [16], and visual analytics methods [8],[17]. Statistical methods and data-mining methods are typi-cally used to investigate specific mobility models in a city.Numerous data mining methods have also been proposed forthe study of human mobility, e.g., modeling cellphone usersmovement; predicting where cellphone users will travel next;and identifying cell-phone users’ important locations. Mostworks relevant to our approach locate in visual analytics anddata management areas.
A. Visual Analytics of Movement
A wide variety of studies in transportation and visualanalytics for analysis of movement data have been proposed.A recent survey summarizes existing visualization methodsfor traffic data analysis [18]. Global and local traffic patternsare uncovered and traffic situations behind the patterns areanalyzed, such as major traffic routes detection [19], trafficjams analysis [20], and tidal flows reasoning [21]. Andrienkoet.al. [22] review existing methods, tools, and procedures andpresent an illustrated structured survey of the state of theart concerning the analysis of movement data. In particu-lar, AllAboard [23] uses cellphone data to support visuallyexploring urban mobility for transit optimization. Wang etal. [24] study human travel patterns on mobile phone records.Both works employ many visualization technics, such as ODmaps, density maps, vector field maps and particle graphs tocomplete different tasks.
Movement between regions can be represented as a graph,where regions are graph nodes and flows between them aretreated as weighted directed edges [25]. Displays showingmultiple trajectories may suffer from visual clutter and occlu-sions. Simplifying or aggregating techniques are proposed toreduce visual clutter [6]–[8], [26]. Edge bundling groups spa-tially close trajectories [27], [28] to show origin-to-destinationmovement.
While the graph model is widely employed, density fieldsbuilt using kernels with different radii can be combined intoone field to expose simultaneously large-scale patterns and finefeatures. Willems et al. [9] propose a specific kernel densityestimation method for trajectories, which interpolates trajec-tory points involving the speed and acceleration. Scheepenset al. [10] further process multiple density field and suggesta scripting-based architecture for creation, transformation,combination, and enhancement of movement density fields.
Flow maps modeling movement as vector fields have beenwell employed in migration and general movement map-ping [11], [12], [29]. Researchers on trajectory clusteringanalysis utilize flow visualization to show speed and directionof movement [30]. Related problems of deriving flow datasetshave been studied based on computer vision and geometricalgorithms [31], [32]. Although we employ the vector fieldmodel, we point out that their contexts are different becauseour dataset is irregular and experts need to observe dataadaptively.
B. Data Models for Query
Researchers have used various methods to organize andquery trajectory data. Ferreira et al. [33] propose a visualizedtool to query trip records with spatial, temporal and other user-specified attributes. Nanocubes [34] can also be used to revealreal-time spatio-temporal data sets. However, those methodsare developed for large region origin-destination (OD) queries.SemanticTraj [35] textulizes trajectories into documents andemploys text search engine to query with semantic hints.
Moreover, using approximations as minimum boundingrectangles (MBRs), octagons and regular grid cells are widelyused in indexing spatial-temporal data. At the cost of more
JOURNAL OF LATEX CLASS FILES, VOL. , NO. , AUGUST 2016 3
computational resources, high resolution of spatial grid canprovide better matches on querying trajectories over spa-tial division. Multidimensional indexing methods like 3DR-Tree [36] and HR-Tree [37] are popular approaches totrajectory indexing. On the other hand, systems like SETI [38]and TrajStore [39] notably reduce the size of bounding boxesfor large trajectories through building time index for dividedgrids.
In this paper, we propose a novel data model to topologicallylink phone records in flows and could support querying datain unequal time spans.
III. DATA AND SYSTEM OVERVIEW
A. Cell-phone Call DataWith the help of our collaborator, one of China mobile
communication service companies, we have an opportunity tostudy cell-phone data from a city in China from December 1,2013 to March 31, 2014. The city is covered by 28,000 basestations serving for 9 million 18-64 years old users (ChinaNational Bureau of Statistics, 2010). Therefore, the availabledata are sufficient to represent the main population mobilitypatterns of the city. Even though cell phone’s locations areinaccurate, base station’s locations are always accurate andwe can infer the covering region of a base station. Thus, abase station is regarded as a minimum observation unit todistinguish a user’s position, called a cell. And two kindsof data, namely, call detail record (CDR) and cell detail list(CDL), are studied in this work.
Call Detail Record (CDR) When a mobile phone holdercalling in a cell, entering or leaving a cell, a CDR will bestored. A CDR comprises phone ID, station ID, record time,and state, i.e. <phone id, station id, time, state>, where thestate attribute indicates a user’s behavior, i.e. entering orleaving a station. The size of CDR is very large, and morethan 100 million records are generated in one day. Moreover,the granularity of CDR differs severely both in time and inspace because some citizens call frequently in movement whileothers do not call even during a day.
Cell Detail List (CDL) A CDL record lists the cell relatedinformation, formally <cell id, cell latitude, cell longitude,direction, city id>.
For the mobile network, mobile devices usually connectto the closest station regarding the strength of signal [40].Due to the Voronoi tessellation rules, base stations from CDLare specified as seeds to generate a Voronoi diagram. Thecity is partitioned into Voronoi cells based on distances toseeds (see Fig.1). A interesting pattern is that base stations aremore dense in the downtown than in the countryside, whichis consistent with the population density.
To further verify the reasonability of the space division, weaggregate phone records on one day in cells of one functionalzone. We find that the data size of each cell of the functionalzone is almost equivalent, therefore, we call the Voronoitessellation an adaptive division of the city in space domain.
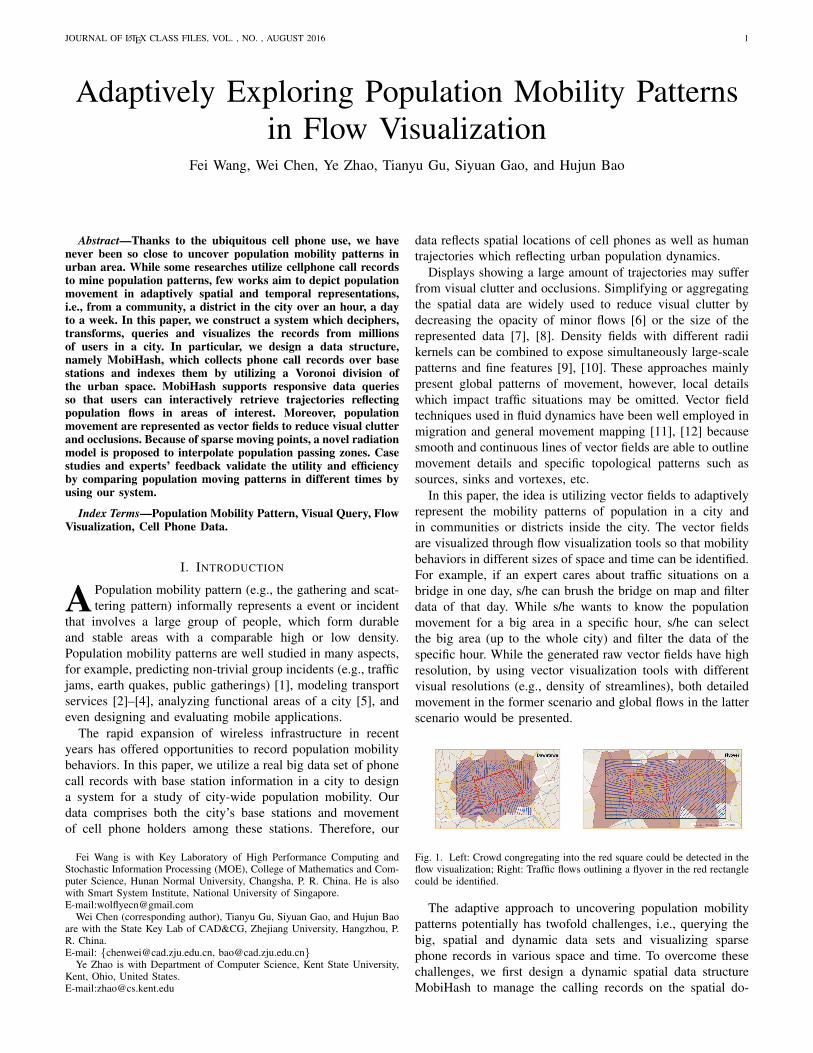
B. System Architecture and OverviewOur system’s architecture, shown in Fig. 2 consists of
two components: a user interface for data visualization and
Time Copy Region Brush
Data Visualization
Interactive Visualization Data Service
Data
Analysis
Visual
Encoding
...
Trips
Mo
biH
ash
Filt
ers
Trip
Qu
eryH
T
T
P
D
istr
ibu
ted
Da
taB
ase
Se
rvic
e In
terf
ace
Trips
Trips
Fig. 2. System overview. Our system includes two parts: Interactive Visual-ization and Data Service.
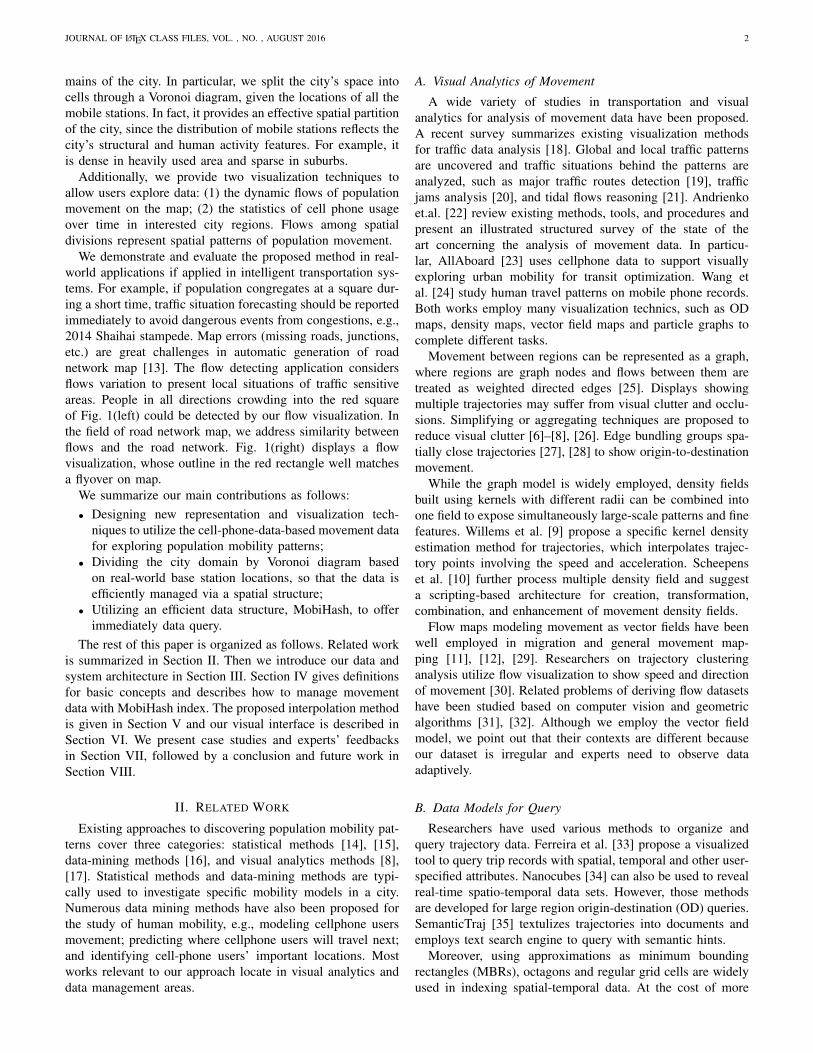
Fig. 3. User interface. (a) Time copy widget; (b) Flow visualization instreamlines; (c) Interaction tools; (d) Temporal stack graph
interaction, and a data service part for data management, queryprocessing and data analysis. Firstly, experts select relevanttime and region items. The data service interface receives thosesettings and dispatch them to a trip query module. The tripquery module transforms settings into query constraints andexecute querying on a distributed data management module viaour novel index. Then the querying results are analyzed andencoded into graphic nodes to transfer into the visualizationmodule, which will display the graphic nodes to representmobility patterns. Experts can investigate views and carry oniterative interactions.
Interactive Visualization. Mobility patterns in temporaland spatial spaces are visualized in two fashions. A flowvisualization (See Fig. 3(b)) is employed to accentuate peoplemovement characters on map, e.g., moving directions, mov-ing regions, and numbers of moving populations. Trips aretransformed into vector fields not only to highlight populationmovement but also to reduce clutter and occlusions. On theother hand, trends of moving population are depicted in a stackgraph (See Fig. 3(d)). For interactive query, a temporal filter(See Fig. 3(a)) and a spatial filter (See Fig. 3(c)) are introducedin Section V and VI.
Data Service. Our sample CDR data exceeds 25 GB in oneday. For the trip query module, it needs transforming settingsfrom query widgets into query constraints, and searching tripsfrom the massive amount of CDR data as well. Therefore, itstill needs to shape an efficient data model to manage the bigdata of 4 months.
Three measures are carried out: 1) a population movementdata model is abstracted from the sparse and irregular cell-phone records; 2) a bi-directional linking hash index is builtto find flows under query constraints within hundreds of mil-
JOURNAL OF LATEX CLASS FILES, VOL. , NO. , AUGUST 2016 4
liseconds; 3) a distributed column-based in-memory databaseis employed to store and retrieve the original data.
IV. IDENTIFYING POPULATION MOVEMENT ANDMANAGING FLOWS
We identify cell phone users who are moving from one cellto another and model movement in one day as trips. Flowsare managed by a hash index to support efficient queries overpossibly selected cells and time slots.
A. Definitions
The major challenge when identifying movement in mobilephone data lies in the sparse and irregular records, whereuser displacements (consecutive distinct recorded locations)are usually observed in a long period (e.g., the first location isobserved at 8:00 am and next location is observed at 6:00 pm).To extract population movement more accurately, we onlyrecord displacements occurring within an appropriate timewindow. Formally, population mobility items can be definedas follows.Definition 1 (Population Movement) Population Movementmeans a group of objects M = o1, o2, · · · , ok shifting togetherfrom one place to another, where k > N and N is a parameter(default as 15 based on the characteristics of our data set).Definition 2 (Movement Point) A Movement Point p is afour tuple, i.e., p = (o, loc, t, s), where each point consists ofa moving object id, a geospatial coordinate set, a timestamp,and a state.Definition 3 (Trip) A Trip T is a sequence of time-seriesmovement points, which records consecutive locations andstates of a moving object. Regarding population movementin real life, We assume people move from one station toanother station in a short period (60 minutes), following anobservation from [4]. A flow can be described as T: p1→ p2 → · · · → pn, where pi+1.t − pi.t < 60 minutesand pi.loc 6= pi+1.loc. Therefore, population mobility meansa group of objects passing the same stations during a timeinterval.
B. Identifying Population Movement
As stated before, CDRs are irregular both in time andin space. Time intervals between consecutive CDRs variesseverely from a few seconds to several days. A two-phaseapproach is taken to identify a movement. In the first phase,points frequently (<6 seconds) switching between 2 stations,called ping-pong handover in telecommunication, are removedfrom the raw data. In the second phase, points that don’t satisfythe definition of a trip, i.e. pi+1.t − pi.t < 60 minutes andpi.loc 6= pi+1.loc, would be removed because they are notmovement points of a trip. Points that are beyond the cityarea are also removed regarding the station’s locations whichthey belong to.
divide map store points
link points to a trip sp
ilt/
me
rge
po
ints
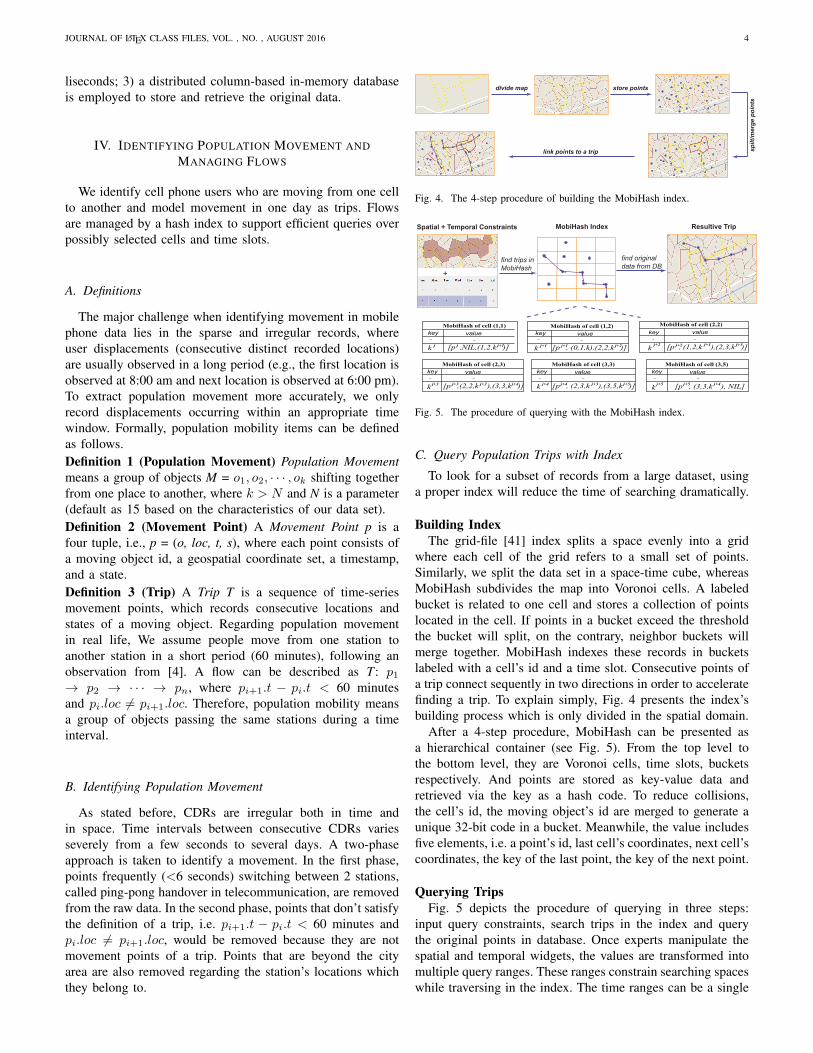
Fig. 4. The 4-step procedure of building the MobiHash index.
Spatial + Temporal Constraints
+
MobiHash Index Resultive Trip
find trips in
MobiHash
find original
data from DB
MobiHash of cell (3,3)
key value
k [p , (2,3,k ),(3,5,k )]
- -
j+4 j+5j+4
MobiHash of cell (2,2)
key value
k [p , (1,2,k ),(2,3,k )]
- -
j+2 j+3j+2 j+1
MobiHash of cell (1,2)
key value
k [p , (0,1,k),(2,2,k )]
- -
j+1 j+2j+1
j+3
MobiHash of cell (2,3)
key value
k [p ,(2,2,k ),(3,3,k )]
- -
j+3 j+4j+3 j+2
MobiHash of cell (3,5)
key value
k [p , (3,3,k ), NIL]
- -
j+5 j+5 j+4
MobiHash of cell (1,1)
key value
k [p ,NIL,(1,2,k )]
- -
j j+1j
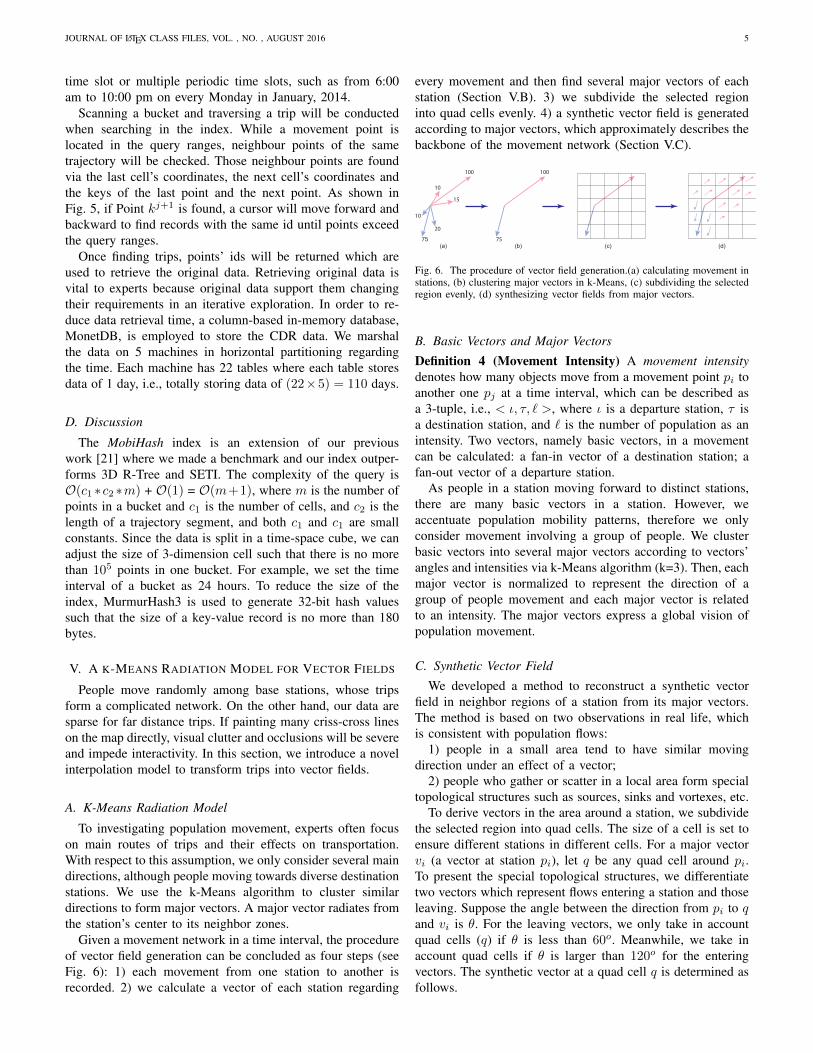
Fig. 5. The procedure of querying with the MobiHash index.
C. Query Population Trips with Index
To look for a subset of records from a large dataset, usinga proper index will reduce the time of searching dramatically.
Building IndexThe grid-file [41] index splits a space evenly into a grid
where each cell of the grid refers to a small set of points.Similarly, we split the data set in a space-time cube, whereasMobiHash subdivides the map into Voronoi cells. A labeledbucket is related to one cell and stores a collection of pointslocated in the cell. If points in a bucket exceed the thresholdthe bucket will split, on the contrary, neighbor buckets willmerge together. MobiHash indexes these records in bucketslabeled with a cell’s id and a time slot. Consecutive points ofa trip connect sequently in two directions in order to acceleratefinding a trip. To explain simply, Fig. 4 presents the index’sbuilding process which is only divided in the spatial domain.
After a 4-step procedure, MobiHash can be presented asa hierarchical container (see Fig. 5). From the top level tothe bottom level, they are Voronoi cells, time slots, bucketsrespectively. And points are stored as key-value data andretrieved via the key as a hash code. To reduce collisions,the cell’s id, the moving object’s id are merged to generate aunique 32-bit code in a bucket. Meanwhile, the value includesfive elements, i.e. a point’s id, last cell’s coordinates, next cell’scoordinates, the key of the last point, the key of the next point.
Querying TripsFig. 5 depicts the procedure of querying in three steps:
input query constraints, search trips in the index and querythe original points in database. Once experts manipulate thespatial and temporal widgets, the values are transformed intomultiple query ranges. These ranges constrain searching spaceswhile traversing in the index. The time ranges can be a single
JOURNAL OF LATEX CLASS FILES, VOL. , NO. , AUGUST 2016 5
time slot or multiple periodic time slots, such as from 6:00am to 10:00 pm on every Monday in January, 2014.
Scanning a bucket and traversing a trip will be conductedwhen searching in the index. While a movement point islocated in the query ranges, neighbour points of the sametrajectory will be checked. Those neighbour points are foundvia the last cell’s coordinates, the next cell’s coordinates andthe keys of the last point and the next point. As shown inFig. 5, if Point kj+1 is found, a cursor will move forward andbackward to find records with the same id until points exceedthe query ranges.
Once finding trips, points’ ids will be returned which areused to retrieve the original data. Retrieving original data isvital to experts because original data support them changingtheir requirements in an iterative exploration. In order to re-duce data retrieval time, a column-based in-memory database,MonetDB, is employed to store the CDR data. We marshalthe data on 5 machines in horizontal partitioning regardingthe time. Each machine has 22 tables where each table storesdata of 1 day, i.e., totally storing data of (22×5) = 110 days.
D. Discussion
The MobiHash index is an extension of our previouswork [21] where we made a benchmark and our index outper-forms 3D R-Tree and SETI. The complexity of the query isO(c1 ∗c2 ∗m) + O(1) = O(m+1), where m is the number ofpoints in a bucket and c1 is the number of cells, and c2 is thelength of a trajectory segment, and both c1 and c1 are smallconstants. Since the data is split in a time-space cube, we canadjust the size of 3-dimension cell such that there is no morethan 105 points in one bucket. For example, we set the timeinterval of a bucket as 24 hours. To reduce the size of theindex, MurmurHash3 is used to generate 32-bit hash valuessuch that the size of a key-value record is no more than 180bytes.
V. A K-MEANS RADIATION MODEL FOR VECTOR FIELDS
People move randomly among base stations, whose tripsform a complicated network. On the other hand, our data aresparse for far distance trips. If painting many criss-cross lineson the map directly, visual clutter and occlusions will be severeand impede interactivity. In this section, we introduce a novelinterpolation model to transform trips into vector fields.
A. K-Means Radiation Model
To investigating population movement, experts often focuson main routes of trips and their effects on transportation.With respect to this assumption, we only consider several maindirections, although people moving towards diverse destinationstations. We use the k-Means algorithm to cluster similardirections to form major vectors. A major vector radiates fromthe station’s center to its neighbor zones.
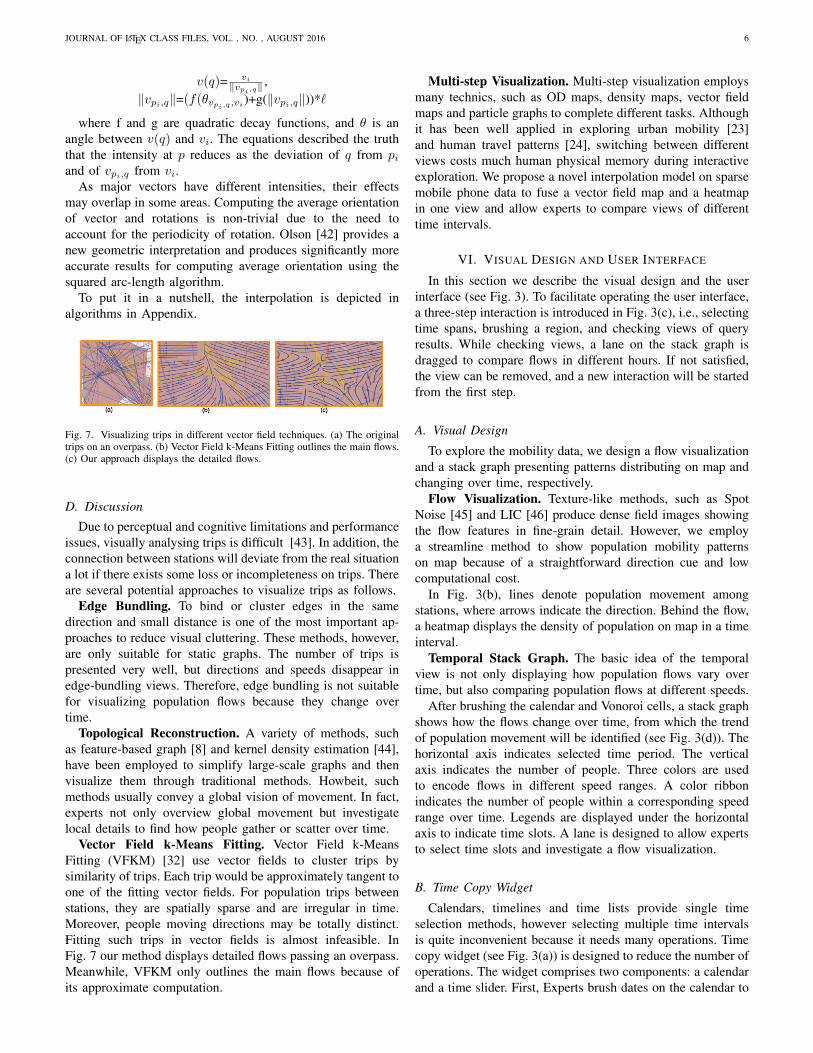
Given a movement network in a time interval, the procedureof vector field generation can be concluded as four steps (seeFig. 6): 1) each movement from one station to another isrecorded. 2) we calculate a vector of each station regarding
every movement and then find several major vectors of eachstation (Section V.B). 3) we subdivide the selected regioninto quad cells evenly. 4) a synthetic vector field is generatedaccording to major vectors, which approximately describes thebackbone of the movement network (Section V.C).
100
10
15
10
20
75
100
75
(a) (b) (c) (d)
Fig. 6. The procedure of vector field generation.(a) calculating movement instations, (b) clustering major vectors in k-Means, (c) subdividing the selectedregion evenly, (d) synthesizing vector fields from major vectors.
B. Basic Vectors and Major Vectors
Definition 4 (Movement Intensity) A movement intensitydenotes how many objects move from a movement point pi toanother one pj at a time interval, which can be described asa 3-tuple, i.e., < ι, τ, ` >, where ι is a departure station, τ isa destination station, and ` is the number of population as anintensity. Two vectors, namely basic vectors, in a movementcan be calculated: a fan-in vector of a destination station; afan-out vector of a departure station.
As people in a station moving forward to distinct stations,there are many basic vectors in a station. However, weaccentuate population mobility patterns, therefore we onlyconsider movement involving a group of people. We clusterbasic vectors into several major vectors according to vectors’angles and intensities via k-Means algorithm (k=3). Then, eachmajor vector is normalized to represent the direction of agroup of people movement and each major vector is relatedto an intensity. The major vectors express a global vision ofpopulation movement.
C. Synthetic Vector Field
We developed a method to reconstruct a synthetic vectorfield in neighbor regions of a station from its major vectors.The method is based on two observations in real life, whichis consistent with population flows:
1) people in a small area tend to have similar movingdirection under an effect of a vector;
2) people who gather or scatter in a local area form specialtopological structures such as sources, sinks and vortexes, etc.
To derive vectors in the area around a station, we subdividethe selected region into quad cells. The size of a cell is set toensure different stations in different cells. For a major vectorvi (a vector at station pi), let q be any quad cell around pi.To present the special topological structures, we differentiatetwo vectors which represent flows entering a station and thoseleaving. Suppose the angle between the direction from pi to qand vi is θ. For the leaving vectors, we only take in accountquad cells (q) if θ is less than 60o. Meanwhile, we take inaccount quad cells if θ is larger than 120o for the enteringvectors. The synthetic vector at a quad cell q is determined asfollows.
JOURNAL OF LATEX CLASS FILES, VOL. , NO. , AUGUST 2016 6
v(q)= vi‖vpi,q‖
,‖vpi,q‖=(f(θvpi,q,vi
)+g(‖vpi,q‖))*`
where f and g are quadratic decay functions, and θ is anangle between v(q) and vi. The equations described the truththat the intensity at p reduces as the deviation of q from piand of vpi,q from vi.
As major vectors have different intensities, their effectsmay overlap in some areas. Computing the average orientationof vector and rotations is non-trivial due to the need toaccount for the periodicity of rotation. Olson [42] provides anew geometric interpretation and produces significantly moreaccurate results for computing average orientation using thesquared arc-length algorithm.
To put it in a nutshell, the interpolation is depicted inalgorithms in Appendix.
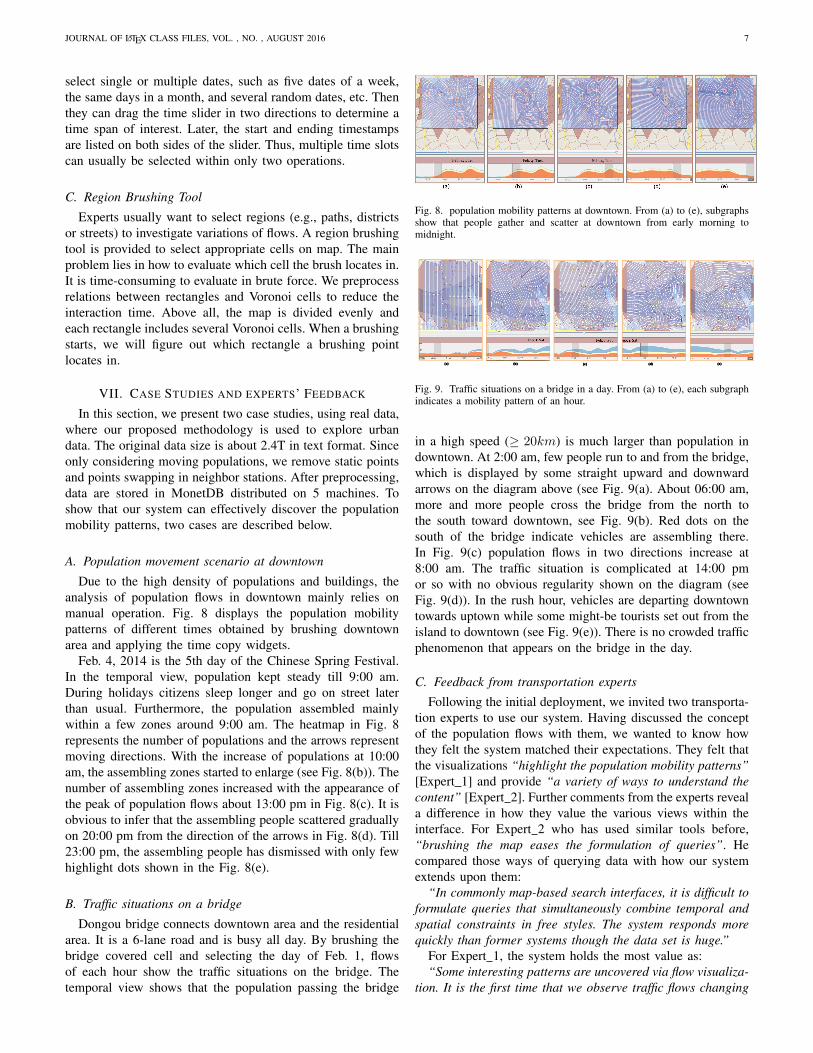
Fig. 7. Visualizing trips in different vector field techniques. (a) The originaltrips on an overpass. (b) Vector Field k-Means Fitting outlines the main flows.(c) Our approach displays the detailed flows.
D. Discussion
Due to perceptual and cognitive limitations and performanceissues, visually analysing trips is difficult [43]. In addition, theconnection between stations will deviate from the real situationa lot if there exists some loss or incompleteness on trips. Thereare several potential approaches to visualize trips as follows.
Edge Bundling. To bind or cluster edges in the samedirection and small distance is one of the most important ap-proaches to reduce visual cluttering. These methods, however,are only suitable for static graphs. The number of trips ispresented very well, but directions and speeds disappear inedge-bundling views. Therefore, edge bundling is not suitablefor visualizing population flows because they change overtime.
Topological Reconstruction. A variety of methods, suchas feature-based graph [8] and kernel density estimation [44],have been employed to simplify large-scale graphs and thenvisualize them through traditional methods. Howbeit, suchmethods usually convey a global vision of movement. In fact,experts not only overview global movement but investigatelocal details to find how people gather or scatter over time.
Vector Field k-Means Fitting. Vector Field k-MeansFitting (VFKM) [32] use vector fields to cluster trips bysimilarity of trips. Each trip would be approximately tangent toone of the fitting vector fields. For population trips betweenstations, they are spatially sparse and are irregular in time.Moreover, people moving directions may be totally distinct.Fitting such trips in vector fields is almost infeasible. InFig. 7 our method displays detailed flows passing an overpass.Meanwhile, VFKM only outlines the main flows because ofits approximate computation.
Multi-step Visualization. Multi-step visualization employsmany technics, such as OD maps, density maps, vector fieldmaps and particle graphs to complete different tasks. Althoughit has been well applied in exploring urban mobility [23]and human travel patterns [24], switching between differentviews costs much human physical memory during interactiveexploration. We propose a novel interpolation model on sparsemobile phone data to fuse a vector field map and a heatmapin one view and allow experts to compare views of differenttime intervals.
VI. VISUAL DESIGN AND USER INTERFACE
In this section we describe the visual design and the userinterface (see Fig. 3). To facilitate operating the user interface,a three-step interaction is introduced in Fig. 3(c), i.e., selectingtime spans, brushing a region, and checking views of queryresults. While checking views, a lane on the stack graph isdragged to compare flows in different hours. If not satisfied,the view can be removed, and a new interaction will be startedfrom the first step.
A. Visual Design
To explore the mobility data, we design a flow visualizationand a stack graph presenting patterns distributing on map andchanging over time, respectively.
Flow Visualization. Texture-like methods, such as SpotNoise [45] and LIC [46] produce dense field images showingthe flow features in fine-grain detail. However, we employa streamline method to show population mobility patternson map because of a straightforward direction cue and lowcomputational cost.
In Fig. 3(b), lines denote population movement amongstations, where arrows indicate the direction. Behind the flow,a heatmap displays the density of population on map in a timeinterval.
Temporal Stack Graph. The basic idea of the temporalview is not only displaying how population flows vary overtime, but also comparing population flows at different speeds.
After brushing the calendar and Vonoroi cells, a stack graphshows how the flows change over time, from which the trendof population movement will be identified (see Fig. 3(d)). Thehorizontal axis indicates selected time period. The verticalaxis indicates the number of people. Three colors are usedto encode flows in different speed ranges. A color ribbonindicates the number of people within a corresponding speedrange over time. Legends are displayed under the horizontalaxis to indicate time slots. A lane is designed to allow expertsto select time slots and investigate a flow visualization.
B. Time Copy Widget
Calendars, timelines and time lists provide single timeselection methods, however selecting multiple time intervalsis quite inconvenient because it needs many operations. Timecopy widget (see Fig. 3(a)) is designed to reduce the number ofoperations. The widget comprises two components: a calendarand a time slider. First, Experts brush dates on the calendar to
JOURNAL OF LATEX CLASS FILES, VOL. , NO. , AUGUST 2016 7
select single or multiple dates, such as five dates of a week,the same days in a month, and several random dates, etc. Thenthey can drag the time slider in two directions to determine atime span of interest. Later, the start and ending timestampsare listed on both sides of the slider. Thus, multiple time slotscan usually be selected within only two operations.
C. Region Brushing Tool
Experts usually want to select regions (e.g., paths, districtsor streets) to investigate variations of flows. A region brushingtool is provided to select appropriate cells on map. The mainproblem lies in how to evaluate which cell the brush locates in.It is time-consuming to evaluate in brute force. We preprocessrelations between rectangles and Voronoi cells to reduce theinteraction time. Above all, the map is divided evenly andeach rectangle includes several Voronoi cells. When a brushingstarts, we will figure out which rectangle a brushing pointlocates in.
VII. CASE STUDIES AND EXPERTS’ FEEDBACK
In this section, we present two case studies, using real data,where our proposed methodology is used to explore urbandata. The original data size is about 2.4T in text format. Sinceonly considering moving populations, we remove static pointsand points swapping in neighbor stations. After preprocessing,data are stored in MonetDB distributed on 5 machines. Toshow that our system can effectively discover the populationmobility patterns, two cases are described below.
A. Population movement scenario at downtown
Due to the high density of populations and buildings, theanalysis of population flows in downtown mainly relies onmanual operation. Fig. 8 displays the population mobilitypatterns of different times obtained by brushing downtownarea and applying the time copy widgets.
Feb. 4, 2014 is the 5th day of the Chinese Spring Festival.In the temporal view, population kept steady till 9:00 am.During holidays citizens sleep longer and go on street laterthan usual. Furthermore, the population assembled mainlywithin a few zones around 9:00 am. The heatmap in Fig. 8represents the number of populations and the arrows representmoving directions. With the increase of populations at 10:00am, the assembling zones started to enlarge (see Fig. 8(b)). Thenumber of assembling zones increased with the appearance ofthe peak of population flows about 13:00 pm in Fig. 8(c). It isobvious to infer that the assembling people scattered graduallyon 20:00 pm from the direction of the arrows in Fig. 8(d). Till23:00 pm, the assembling people has dismissed with only fewhighlight dots shown in the Fig. 8(e).
B. Traffic situations on a bridge
Dongou bridge connects downtown area and the residentialarea. It is a 6-lane road and is busy all day. By brushing thebridge covered cell and selecting the day of Feb. 1, flowsof each hour show the traffic situations on the bridge. Thetemporal view shows that the population passing the bridge
Fig. 8. population mobility patterns at downtown. From (a) to (e), subgraphsshow that people gather and scatter at downtown from early morning tomidnight.
Fig. 9. Traffic situations on a bridge in a day. From (a) to (e), each subgraphindicates a mobility pattern of an hour.
in a high speed (≥ 20km) is much larger than population indowntown. At 2:00 am, few people run to and from the bridge,which is displayed by some straight upward and downwardarrows on the diagram above (see Fig. 9(a). About 06:00 am,more and more people cross the bridge from the north tothe south toward downtown, see Fig. 9(b). Red dots on thesouth of the bridge indicate vehicles are assembling there.In Fig. 9(c) population flows in two directions increase at8:00 am. The traffic situation is complicated at 14:00 pmor so with no obvious regularity shown on the diagram (seeFig. 9(d)). In the rush hour, vehicles are departing downtowntowards uptown while some might-be tourists set out from theisland to downtown (see Fig. 9(e)). There is no crowded trafficphenomenon that appears on the bridge in the day.
C. Feedback from transportation experts
Following the initial deployment, we invited two transporta-tion experts to use our system. Having discussed the conceptof the population flows with them, we wanted to know howthey felt the system matched their expectations. They felt thatthe visualizations “highlight the population mobility patterns”[Expert 1] and provide “a variety of ways to understand thecontent” [Expert 2]. Further comments from the experts reveala difference in how they value the various views within theinterface. For Expert 2 who has used similar tools before,“brushing the map eases the formulation of queries”. Hecompared those ways of querying data with how our systemextends upon them:
“In commonly map-based search interfaces, it is difficult toformulate queries that simultaneously combine temporal andspatial constraints in free styles. The system responds morequickly than former systems though the data set is huge.”
For Expert 1, the system holds the most value as:“Some interesting patterns are uncovered via flow visualiza-
tion. It is the first time that we observe traffic flows changing
JOURNAL OF LATEX CLASS FILES, VOL. , NO. , AUGUST 2016 8
over time on a flyover from real-life data. The patterns areuseful for estimating designs of flyovers.”
However, the experts provided negative feedbacks on theinterface, which they felt observing traffic flows on roads isnot flexible enough, because Voronoi cells cover larger zonesthan roads. On the other hand, they thought CRD data doesnot include all transport situations because drivers don’t runcars while calling. Asked to speculate about future directionsof using visualization to explore the transportation, Expert 1is considering the “possibility of integrating other data sets,such as floating car data, public transportation data”.
VIII. CONCLUSION AND FUTURE WORK
In this work, we have introduced an adaptive exploratorysystem that aims to make it possible for population mobilitypatterns seekers to orient themselves in space and over time.Our general design considerations led us to define the systemthat:• Provides a flow visualization that can be used to discover
population mobility patterns.• Allows query specification through dynamic manipulation
of temporal and spatial ranges.• Offers responsive results that immediately change accord-
ing to user’s interacctive operations.To complete the design, we have developed a k-Means
radiation model as a novel interpolation to transform popu-lation movement into a vector field which is visualized asflows, and MobiHash as a novel mechanism to index tripsand reduce loaded data during query refinements. The data isdivided by Voronoi diagram based on real-world base stationlocations. Furthermore, we have implemented brushing as aninteraction technique that displays tempo-spatial relatednessbetween visual elements.
We demonstrate our system via two applications to intel-ligent transportation systems. Moreover, two real-world ex-ploratory studies earn positive reactions of domain expertstowards discovering population mobility patterns with oursystem. We also invited experts from the transportation domainto comment on our system in practice and they gave us positivefeedback.
Although the flow visualization clearly displays patternsof population movement, it is presented in a rectangle viewbecause a vector field is mapped on an image. The mappingwill cause some distortion of the flow visualization. We willfurther develop a mapping from the vector field to the geo-graphic map. In the current realization, our system is limitedto cell phone records due to the Voronoi diagram subdivision.As experts suggestion, more data subdivisions and interactivewidgets are needed to support multiple data sources. Besides, aperformance benchmark of MobiHash needs to be addressed infuture, though it satisfies interactive exploration requirements.
IX. ACKNOWLEDGEMENTS
We would like to express gratitude to experts from WuxiMingda Traffic Technology Consultation Co., Ltd for their ac-tive participation and to collaborators to provide valuable dataand to anonymous reviewers for comprehensive comments
at various stages of drafting. This work is supported by theConstruct Program of the Key Discipline in Hunan Province,China and the Scientific Research Fund of Hunan ProvincialEducation Department (15B137). Wei Chen is supported byNational 973 Program of China (2015CB352503), NSFC(61232012, 61422211, and U1609217). This work is partlysupported by US NSF grants 1535031 and 1637242.
REFERENCES
[1] S. Isaacman, R. Becker, R. Caceres, et.al., “Human mobility modeling atmetropolitan scales,” in Proceedings of the 10th international conferenceon Mobile systems, applications, and services. ACM, 2012, pp. 239–252.
[2] D. Zhang, Y. Li, F. Zhang, M. Lu, Y. Liu, and T. He, “coride: Carpoolservice with a win-win fare model for large-scale taxicab networks,”in Proceedings of the 11th ACM Conference on Embedded NetworkedSensor Systems, ser. SenSys ’13. New York, NY, USA: ACM, 2013,pp. 9:1–9:14.
[3] D. Zhang, J. Huang, Y. Li, F. Zhang, C. Xu, and T. He, “Exploringhuman mobility with multi-source data at extremely large metropolitanscales,” in Proceedings of the 20th annual international conference onMobile computing and networking. ACM, 2014, pp. 201–212.
[4] P. Wang, T. Hunter, A. M. Bayen, and M. C. Gonza’lez, “Understandingroad usage patterns in urban areas,” Scientific Reports, 2013.
[5] J. Yuan, Y. Zheng, and X. Xie, “Discovering regions of differentfunctions in a city using human mobility and pois,” in Proceedings of the18th ACM SIGKDD international conference on Knowledge discoveryand data mining. ACM, 2012, pp. 186–194.
[6] J. Wood, A. Slingsby, and J. Dykes, “Visualizing the dynamics of lon-don’s bicycle-hire scheme,” Cartographica: The International Journalfor Geographic Information and Geovisualization, vol. 46, no. 4, pp.239–251, 2011.
[7] D. Guo, “Flow mapping and multivariate visualization of large spatialinteraction data,” IEEE Transactions on Visualization and ComputerGraphics, vol. 15, no. 6, pp. 1041–1048, 2009.
[8] T. von Landesberger, F. Brodkorb, P. Roskosch, N. Andrienko, G. An-drienko, and A. Kerren, “Mobilitygraphs: Visual analysis of massmobility dynamics via spatio-temporal graphs and clustering,” IEEETransactions on Visualization and Computer Graphics, vol. 22, no. 1,pp. 11–20, Jan 2016.
[9] N. Willems, H. Van De Wetering, and J. J. Van Wijk, “Visualization ofvessel movements,” in Computer Graphics Forum, vol. 28, no. 3. WileyOnline Library, 2009, pp. 959–966.
[10] R. Scheepens, N. Willems, H. van de Wetering, et.al., “Compositedensity maps for multivariate trajectories,” IEEE Transactions on Vi-sualization and Computer Graphics, vol. 17, no. 12, pp. 2518–2527,2011.
[11] W. R. Tobler, “Experiments in migration mapping by computer,” TheAmerican Cartographer, vol. 14, no. 2, pp. 155–163, 1987.
[12] W. R. Tobler, “A model of geographical movement,” GeographicalAnalysis, vol. 13, no. 1, pp. 1–20, 1981.
[13] W. Shi, S. Shen, and Y. Liu, “Automatic generation of road networkmap from massive gps, vehicle trajectories,” in 12th International IEEEConference on Intelligent Transportation Systems, Oct 2009, pp. 1–6.
[14] F. Simini, M. C. Gonzalez, A. Maritan, and A.-L. Barabasi, “A universalmodel for mobility and migration patterns,” Nature, vol. 484, no. 7392,pp. 96–100, 2012.
[15] C. Song, Z. Qu, N. Blumm, and A.-L. Barabasi, “Limits of predictabilityin human mobility,” Science, vol. 327, no. 5968, pp. 1018–1021, 2010.
[16] R. Ganti, M. Srivatsa, A. Ranganathan, and J. Han, “Inferring humanmobility patterns from taxicab location traces,” in Proceedings of ACMInternational Joint Conference on Pervasive and Ubiquitous Computing.New York, USA: ACM, 2013, pp. 459–468.
[17] Y. Ma, T. Lin, Z. Cao, C. Li, F. Wang, and W. Chen, “Mobility viewer:An eulerian approach for studying urban crowd flow,” IEEE Transactionson Intelligent Transportation Systems, vol. PP, no. 99, pp. 1–10, 2015.
[18] W. Chen, F. Guo, and F. Y. Wang, “A survey of traffic data visualization,”IEEE Transactions on Intelligent Transportation Systems, vol. 16, no. 6,pp. 2970–2984, Dec 2015.
[19] Z. Wang, T. Ye, M. Lu, X. Yuan, et. al., “Visual exploration ofsparse traffic trajectory data,” IEEE Transactions on Visualization andComputer Graphics, vol. 20, no. 12, pp. 1813–1822, 2014.
JOURNAL OF LATEX CLASS FILES, VOL. , NO. , AUGUST 2016 9
[20] Z. Wang, M. Lu, X. Yuan, et. al., “Visual traffic jam analysis basedon trajectory data,” IEEE Transactions on Visualization and ComputerGraphics, vol. 19, no. 12, pp. 2159–2168, 2013.
[21] F. Wang, W. Chen, F. Wu, Y. Zhao, et. al., “A visual reasoning approachfor data-driven transport assessment on urban roads,” in 2014 IEEEConference on Visual Analytics Science and Technology (VAST). IEEE,2014, pp. 103–112.
[22] N. Andrienko and G. Andrienko, “Visual analytics of movement: Anoverview of methods, tools and procedures,” Information Visualization,vol. 12, no. 1, pp. 3–24, 2013.
[23] G. Di Lorenzo, M. Sbodio, F. Calabrese, et. al., “Allaboard: visualexploration of cellphone mobility data to optimise public transport,”IEEE Transactions on Visualization and Computer Graphics, vol. 22,no. 2, pp. 1036–1050, 2016.
[24] Y. Wang, Z. Li, L. Li, Y. Zhang, J. Hu, J. Zhang, and W. Guo, “Visu-alization analysis for urban human traveling behavior based on mobilephone data,” in 15th COTA International Conference of TransportationProfessionals, 2015.
[25] G. Andrienko, N. Andrienko, P. Bak, D. Keim, and S. Wrobel, Visualanalytics of movement. Springer Science & Business Media, 2013.
[26] S. Van Den Elzen and J. J. Van Wijk, “Multivariate network explorationand presentation: From detail to overview via selections and aggre-gations,” IEEE Transactions on Visualization and Computer Graphics,vol. 20, no. 12, pp. 2310–2319, 2014.
[27] O. Ersoy, C. Hurter, F. Paulovich, G. Cantareiro, and A. Telea,“Skeleton-based edge bundling for graph visualization,” IEEE Trans-actions on Visualization and Computer Graphics, vol. 17, no. 12, pp.2364–2373, 2011.
[28] D. Holten and J. J. Van Wijk, “Force-directed edge bundling for graphvisualization,” in Computer graphics forum, vol. 28, no. 3. WileyOnline Library, 2009, pp. 983–990.
[29] D. Phan, L. Xiao, R. Yeh, P. Hanrahan, and T. Winograd, “Flow maplayout,” in Proceedings of the 2005 IEEE Symposium on Information Vi-sualization, ser. INFOVIS ’05. Washington, DC, USA: IEEE ComputerSociety, 2005, pp. 29–37.
[30] D. R. Brillinger, H. K. Preisler, A. A. Ager, and J. G. Kie, “Anexploratory data analysis (eda) of the paths of moving animals,” Journalof statistical planning and inference, vol. 122, no. 1, pp. 43–63, 2004.
[31] J. C. Nascimento, M. A. Figueiredo, and J. S. Marques, “Trajectoryanalysis in natural images using mixtures of vector fields,” in 2009 IEEEInternational Conference on Image Processing (ICIP). IEEE, 2009, pp.4353–4356.
[32] N. Ferreira, J. T. Klosowski, C. E. Scheidegger, and C. T. Silva, “Vectorfield k-means: Clustering trajectories by fitting multiple vector fields,”in Computer Graphics Forum, vol. 32, no. 3pt2. Wiley Online Library,2013, pp. 201–210.
[33] N. Ferreira and J. e. a. Poco, “Visual exploration of big spatio-temporalurban data: A study of new york city taxi trips,” IEEE Transactions onVisualization and Computer Graphics, vol. 19, no. 12, pp. 2149–2158,2013.
[34] L. Lins, J. T. Klosowski, and C. Scheidegger, “Nanocubes for real-time exploration of spatiotemporal datasets,” IEEE Transactions onVisualization and Computer Graphics, vol. 19, no. 12, pp. 2456–2465,2013.
[35] S. Al-Dohuki, Y. Wu, F. Kamw, J. Yang, et. al., “Semantictraj: A newapproach to interacting with massive taxi trajectories,” IEEE Transac-tions on Visualization and Computer Graphics, vol. 23, no. 1, pp. 11–20,2017.
[36] Y. Theodoridis, M. Vazirgiannis, and T. Sellis, “Spatio-temporal index-ing for large multimedia applications,” in Proceedings of the Third IEEEInternational Conference on Multimedia Computing and Systems, 1996,pp. 441–448.
[37] M. A. Nascimento and J. R. Silva, “Towards historical r-trees,” inProceedings of the 1998 ACM symposium on Applied Computing.ACM, 1998, pp. 235–240.
[38] V. P. Chakka, A. C. Everspaugh, and J. M. Patel, “Indexing largetrajectory data sets with seti,” Ann Arbor, vol. 1001, no. 48109-2122,p. 12, 2003.
[39] P. Cudre-Mauroux, E. Wu, and S. Madden, “Trajstore: An adaptivestorage system for very large trajectory data sets,” in 2010 IEEE 26thInternational Conference on Data Engineering (ICDE 2010). IEEE,2010, pp. 109–120.
[40] A. Sevtsuk and C. Ratti, “Does urban mobility have a daily routine?learning from the aggregate data of mobile networks,” Journal of UrbanTechnology, vol. 17, no. 1, pp. 41–60, 2010.
[41] J. Nievergelt, H. Hinterberger, and K. C. Sevcik, “The grid file: Anadaptable, symmetric multikey file structure,” ACM Transactions onDatabase Systems (TODS), vol. 9, no. 1, pp. 38–71, 1984.
[42] E. Olson, “On computing the average orientation of vectors and lines,”in 2011 IEEE International Conference on Robotics and Automation(ICRA). IEEE, 2011, pp. 3869–3874.
[43] K. Vrotsou, H. Janetzko, C. Navarra, G. Fuchs, D. Spretke, F. Mans-mann, N. Andrienko, and G. Andrienko, “Simplifly: A methodologyfor simplification and thematic enhancement of trajectories,” IEEETransactions on Visualization and Computer Graphics, vol. 21, no. 1,pp. 107–121, Jan 2015.
[44] O. D. Lampe and H. Hauser, “Interactive visualization of streamingdata with kernel density estimation,” in 2011 IEEE Pacific VisualizationSymposium. IEEE, 2011, pp. 171–178.
[45] J. J. Van Wijk, “Spot noise texture synthesis for data visualization,”ACM Siggraph Computer Graphics, vol. 25, no. 4, pp. 309–318, 1991.
[46] B. Cabral and L. C. Leedom, “Imaging vector fields using line integralconvolution,” in Proceedings of the 20th annual conference on Computergraphics and interactive techniques. ACM, 1993, pp. 263–270.
Fei Wang received the Ph.D. degree in ComputerScience and Technology from Zhejiang University,China, in 2016. His research interests include infor-mation visualization and visual analytics.
Wei Chen is a professor in State Key Lab ofComputer Aided Design and Computer Graphics atZhejiang University, P.R.China. From June 2000 toJune 2002, he was a joint Ph.D student in FraunhoferInstitute for Graphics, Darmstadt, Germany and re-ceived his Ph.D degree in July 2002. His Ph.D ad-visors were Prof.Qunsheng Peng, and Prof.GeorgiosSakas. From July. 2006 to Sep. 2008, Dr. Wei Chenwas a visiting scholar at Purdue University, workingin PURPL with Prof.David S. Ebert. In December2009, Dr.Wei Chen was promoted as a full professor
of Zhejiang University. He has performed research in visualization and visualanalysis and published 27 IEEE/ACM Transactions and IEEE VIS papers.His current research interests include visualization, visual analytics and bio-medical image computing.
Ye Zhao received B.S. and M.S. degrees in com-puter science from the Tsinghua University of Chinain 1997 and 2000. He further received his PhDdegree in computer science from the Stony BrookUniversity in 2006. He is an associate professor inthe Department of Computer Science at the KentState University, Ohio, USA. He received GoogleFaculty Research Award in 2011. In Oct 2015, hewas honored as Scholar of the Month by KSU.His current research projects include visual analyt-ics of urban transportation data, multidimensional,
text, and animated information visualization, patient-specific computationalhemodynamics modeling, etc.

JOURNAL OF LATEX CLASS FILES, VOL. , NO. , AUGUST 2016 10
Tianyu Gu received the B.E.E. degree from Zhe-jiang University, China, in 2016. His research in-terests include quantitative social science and visualanalytics.
Siyuan Gao received the B.S. degree from ZhejiangUniversity, China, in 2016. He is a Ph.D. student ofYale University. His research focuses on a broad as-pects including machine learning, data visualizationand biomedical imaging.
Hujun Bao is a professor in the State Key Lab-oratory of Computer Aided Design and ComputerGraphics and college of Computer Science and Tech-nology, Zhejiang University. He received a B.Sc.degree in mathematics and Ph.D. degree in appliedmathematics from Zhejiang University in 1987 and1993 respectively. Prof. Bao lead the 3D graphicscomputing group in the lab, which mainly makesresearches on geometry computing, 3D visual com-puting, real-time rendering, and their applications.His research goal is to investigate the fundamental
theories and algorithms to achieve good visual perception for interactive digitalenvironments, and develop related systems.
APPENDIX
In this section, we introduce the procedure of interpolationin 3 algorithms. Algorithm 1 illustrates main steps, i.e.,calculating movement intensities (line 2 - 5), finding majorvectors, and synthesizing a vector field. Algorithm 2 presentshow to construct major vectors at each station. We considerboth population entering and leaving, and only movementintensities greater than 15 are population movement (line 4- 9). Here we set 15 as default, but it can be changed byexperts regarding their requirements. We use k-Means (k = 3)to cluster vectors in one station as main vectors. Algorithm 3describes how to form a vector field from main vectors. Asnoted in Section V, main routes will impact their neighborzones. We first divide the brushed region into rectangle cells(line 1). Then, we calculate a main vector’s impacting zonesregrading angles (< 60) between the main vector and thevector from rectangle cells to the station (line 3 - 10).
algorithm 1 Interpolation Using a k-Means Radiation ModelInput: ∆ = {T}, // a trip set
bbx, // the geo-location bounding box of selected stations(ω, h), // the grid sizeκ // the number of cluster
Output: a vector field of ω × h1: I ← {} // initialize the movement intensity set// sij is a movement intensity from station i to station j
2: for each trip T in ∆ do3: calculate every movement intensity sij of each station4: add sij into I5: end for6: [V in, V out]←find major vectors(I), S, κ)7: V F←synthesize vector field(V in, V out, bbx (ω, h))
algorithm 2 find major vectorsInput: I , // intensity set
S, // ID set of stationsκ // the number of cluster
Output: V in and V out
// determine basic vectors regarding movement1: for each station k do2: add λink into V in, add λoutk into V out
3: end for4: for each intensity sij in I do5: if sij .ell ≥ 15 then6: calculate a vector α regarding station i and j7: add α into λouti , add α into λinj8: end if9: end for
10: find major vectors via κ-Means of λini and λouti , κ = 311: return V in, V out
algorithm 3 synthesize vector fieldInput: V in, V out, bbx
(ω, h), // the grid sizeOutput: V F , // a vector field of ω × h
1: divide the region into ω × h cells via bbx2: initialize ω × h arrays, V F , Λ// radiate vectors from major vectors
3: for each major vector ν in V in and V out do4: for each quad cell q around pi do5: if (ν is a move out vector ∧ cos(θ) > 0.5)
|| (ν is a move in vector ∧ cos(θ) < −0.5) then6: vq ← ν/‖vpiq‖7: end if8: add vq into Λi+q
9: end for10: end for
// calculate vectors at overlapping quad cells11: for each Λi do12: calculate a mean value $ using the squared arc-length
algorithm13: V Fi ← $14: end for15: return V F