Embed Size (px)
Citation preview
JPMorgan Global Growth & Income plcAnnual Report & Financial Statements for the year ended 30th June 2017
Global Growth & Income cover A4 19/09/2017 13:26 Page FC1
ObjectiveTotal returns from world stockmarkets.
Investment PolicyTo provide a diversified portfolio of approximately 50-90 stocksin which the investment manager has a high degree ofconviction.
Investment Strategy To provide superior total returns and outperform the MSCI AllCountries World Index over the long-term by investing incompanies based around the world. The manager is focused onbuilding a high conviction portfolio of typically 50-90 stocks,drawing on an investment process underpinned by fundamentalresearch. Portfolio construction is driven by bottom-up stockselection rather than geographical or sector allocation.Currency exposure is predominantly hedged back towards thebenchmark. The Company uses borrowing to gear the portfoliowithin a range of 5% cash to 20% geared under normal marketconditions.
Dividend Policy As of 1st July 2016, the Company adopted a new distributionpolicy whereby at the start of each financial year the Companywill announce the distribution it intends to pay to shareholdersin the forthcoming year in quarterly instalments. On aggregate,the intention is to pay dividends totalling at least 4% of the netasset value of the Company as at the end of the precedingfinancial year.
Gearing A flexible, low cost £25 million borrowing facility is in place andavailable for the investment manager to utilise at times of lowabsolute valuation or for short term borrowing to financeinvestment decisions.
Benchmark The Company’s benchmark is the MSCI All Countries WorldIndex in sterling terms (total return with net dividendsreinvested).
Company NameThe Company changed its name from JPMorgan OverseasInvestment Trust plc to JPMorgan Global Growth & Income plcon 8th July 2016.
Capital Structure At 30th June 2017, the company’s issued share capitalcomprised 154,905,500 ordinary shares of 5p each including31,244,215 shares held in Treasury.
Share Repurchase and Issuance Policy In order for the Company’s shares to trade at a relativelynarrow discount, the Company has a long-term policy ofrepurchasing its shares with the aim of maintaining an averagediscount of around 5% calculated with debt at par value. Anyshares repurchased under this policy may be held in Treasuryor cancelled. Shares held in Treasury and new shares will onlybe reissued/issued at a premium to net asset value.
Management Company and Company SecretaryThe Company employs JPMorgan Funds Limited (‘JPMF’ or the‘Manager’), as the Company’s Alternative Investment FundManager (‘AIFM’) and the Company Secretary. JPMF delegatesthe management of the Company’s portfolio to JPMorgan AssetManagement (UK) Limited (‘JPMAM’).
FCA regulation of ‘non-mainstream pooledinvestments’The Company currently conducts its affairs so that the sharesissued by JPMorgan Global Growth & Income plc can berecommended by Independent Financial Advisers to ordinaryretail investors in accordance with the FCA’s rules in relation tonon-mainstream investment products and intends to continueto do so for the foreseeable future.
The shares are excluded from the FCA’s restrictions which applyto non-mainstream investment products because they areshares in an investment trust.
AICThe Company is a member of the Association of InvestmentCompanies.
WebsiteThe Company’s website, which can be found atwww.jpmglobalgrowthandincome.co.uk, includes usefulinformation on the Company, such as daily prices, factsheetsand current and historic half year and annual reports.
Features
Global Growth & Income cover A4 19/09/2017 13:26 Page IFC2
1
Contents
2 FINANCIAL RESULTS
STRATEGIC REPORT
3 Chairman’s Statement
6 Investment Manager’s Report
9 Summary of Results
10 Performance
11 Ten Year Financial Record
12 Ten Largest Equity Investments
13 Portfolio Analyses
15 List of Investments
17 Business Review
DIRECTORS’ REPORT
22 Board of Directors
24 Directors’ Report
26 Corporate Governance Statement
31 Audit and Management Engagement Committee Report
32 DIRECTORS’ REMUNERATION REPORT
35 STATEMENT OF DIRECTORS’ RESPONSIBILITIES
36 INDEPENDENT AUDITORS’ REPORT
FINANCIAL STATEMENTS
41 Statement of Comprehensive Income
42 Statement of Changes in Equity
43 Statement of Financial Position
44 Notes to the Financial Statements
REGULATORY DISCLOSURES
62 Securities Financing Transactions Regulation (‘SFTR’) Disclosure (Unaudited)
64 Alternative Investment Fund Managers’ Directive (‘AIFMD’) Disclosure (Unaudited)
SHAREHOLDER INFORMATION
65 Notice of Annual General Meeting
68 Glossary of Terms and Alternative Performance Measures
69 Where to buy J.P. Morgan Investment Trusts
71 Information about the Company
Global Growth & Income_pp01_21 19/09/2017 12:30 Page 1
2 JPMORGAN GLOBAL GROWTH & INCOME PLC. ANNUAL REPORT & FINANCIAL STATEMENTS 2017
Financial Results
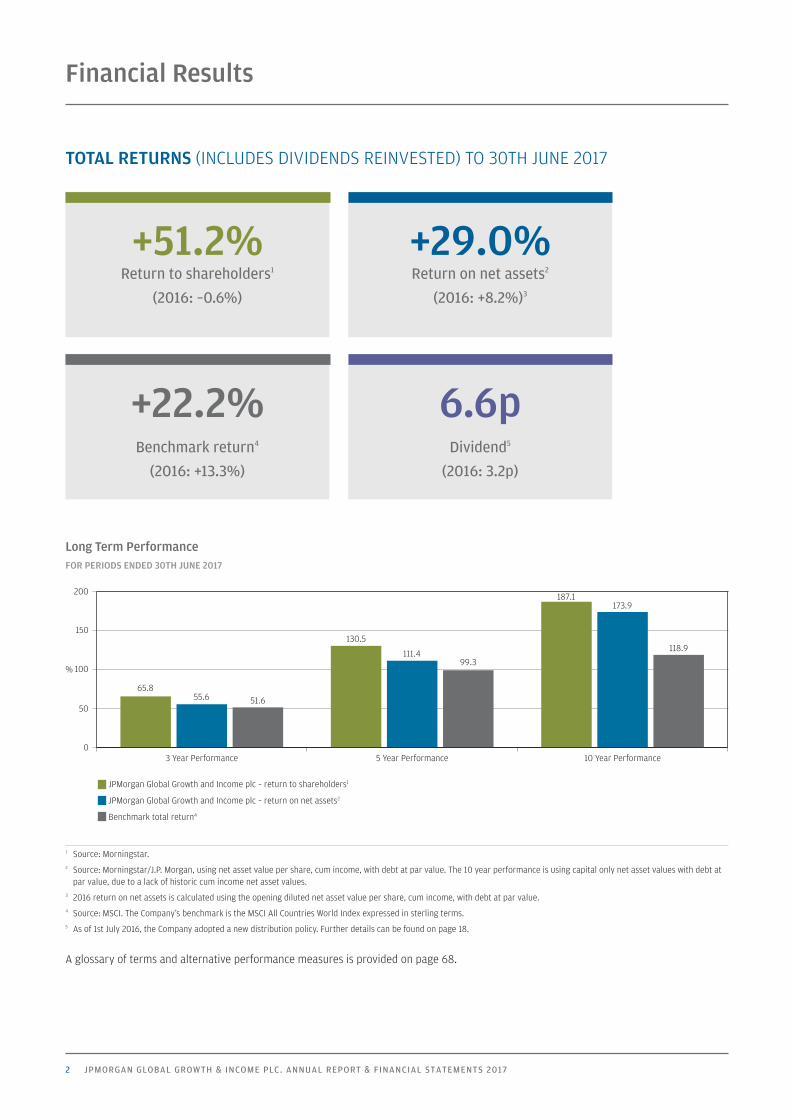
TOTAL RETURNS (INCLUDES DIVIDENDS REINVESTED) TO 30TH JUNE 2017
+22.2%Benchmark return4
(2016: +13.3%)
Long Term PerformanceFOR PERIODS ENDED 30TH JUNE 2017
1 Source: Morningstar.2 Source: Morningstar/J.P. Morgan, using net asset value per share, cum income, with debt at par value. The 10 year performance is using capital only net asset values with debt at
par value, due to a lack of historic cum income net asset values.3 2016 return on net assets is calculated using the opening diluted net asset value per share, cum income, with debt at par value.4 Source: MSCI. The Company’s benchmark is the MSCI All Countries World Index expressed in sterling terms.5 As of 1st July 2016, the Company adopted a new distribution policy. Further details can be found on page 18.
A glossary of terms and alternative performance measures is provided on page 68.
JPMorgan Global Growth and Income plc – return to shareholders1
JPMorgan Global Growth and Income plc – return on net assets2
Benchmark total return4
65.855.6 51.6
130.5
111.499.3
187.1173.9
118.9
%
0
50
100
150
200
10 Year Performance5 Year Performance3 Year Performance
6.6pDividend5
(2016: 3.2p)
+51.2%Return to shareholders1
(2016: –0.6%)
+29.0%Return on net assets2
(2016: +8.2%)3
Global Growth & Income_pp01_21 19/09/2017 12:30 Page 2
3
Strategic Report
CHAIRMAN’S STATEMENT
I am pleased to report on a very rewarding year for shareholders of the Company. Globalequity markets were strong, leading to a rise in our benchmark – the MSCI AC World Indexexpressed in sterling terms – of 22.2%. Against this positive background our InvestmentManager, Jeroen Huysinga, was able to add further to returns through excellent stockselection, with the result that the return on net assets was 29.0%.
Finally, the discount at which the share price trades relative to the net assets narrowedsharply from 14.4% to 2.0%. I discuss further below this very encouraging development.The combination of all these factors meant that the total return to shareholders over theyear was 51.2%.
PERFORMANCE ATTRIBUTION FOR THE YEAR ENDED 30TH JUNE 2017
% %
Contributions to total returns
Benchmark return 22.2
Asset allocation –0.1
Stock selection 7.2
Currency effect 0.2
Gearing/cash 0.9
Investment Manager contribution 8.2
Portfolio total return 30.4
Management fee/other expenses –0.6
Performance fee –0.8
Net asset value total return – priorto structural effects 29.0
Structural effectsShare buy-backs/issuance 0.0
Net asset value total return 29.0
Share price total return 51.2
Source: JPMAM and Morningstar.
All figures are on a total return basis.
Performance attribution analyses how the Company achieved its recorded performancerelative to its benchmark index.
A glossary of terms and alternative performance measures is provided on page 68.
Distribution and Dividends PolicyThe Company adopted a revised distribution policy in July 2016 under which it intends to paydividends totalling at least 4% of the net asset value of the Company as at the end of thepreceding financial year.
The Board announced on 4th July 2017 that, in relation to the year commencing 1st July2017, the Company intends to pay dividends totalling 12.16p per share, which represents
Global Growth & Income_pp01_21 19/09/2017 12:30 Page 3
4 JPMORGAN GLOBAL GROWTH & INCOME PLC. ANNUAL REPORT & FINANCIAL STATEMENTS 2017
Strategic Report continued
CHAIRMAN’S STATEMENT CONTINUED
a yield of 4.01% of the unaudited net asset value as at the 30th June 2017. It is expected thatsuch dividends will be paid by way of four equal distributions, with the first distribution forthe financial year ending 30th June 2018 of 3.04p per share for the period to 30th September2017 being paid on 6th October 2017 to shareholders on the register on 8th September 2017.
The target dividends for the year commencing 1st July 2017 represents an increase of 24.1%over the total dividends of 9.8p per share payable for the prior year, reflecting the strong netasset value growth in the Company.
As a result of the revised dividend policy last year, the Company has been reclassified to theGlobal Equity Income sector by the Association of Investment Companies. It is important forinvestors to note that there has been no change in the Company’s investment policy, nor theInvestment Manager’s approach to investment or the current benchmark as a result of thisreclassification.
Fund ManagerWe are delighted to note that the fund management has been enhanced by the hire of newpersonnel. Tim Woodhouse has joined the International Research Driven Process team andwill work alongside Jeroen Huysinga who continues to be the lead portfolio manager for theCompany. There are no changes to the investment process or approach.
Share Issuance and RepurchasesDuring the year, the Company did not issue or repurchase any shares. As noted above, thediscount at which the Company’s shares trade relative to net assets has narrowed sharply inthe past year. The Board believes that this reflects a combination of the new distributionpolicy and the strong performance of the Investment Manager. The Company has a policy ofmaintaining the discount around or below 5%, but with the discount narrowing steadily theCompany did not need to repurchase shares. At the year-end the discount stood at 2.0% andat the time of this report it stands at a premium of 0.1%.
As a consequence of the share price now standing at a premium, since the year end 175,000shares have been reissued from Treasury for a total consideration of £557,000.
A resolution to renew the authority to permit the Company to continue to repurchase shareswill be proposed at the AGM in October 2017. Resolutions renewing the authorities to issueshares from Treasury and to issue new shares, in both cases at a premium to net assetvalue, and to disapply pre-emption rights over such issues, will also be proposed at the AGM.Any shares held in Treasury will only be re-issued at a premium to net asset value.
Ongoing ChargesThe Board continues to believe that the Company’s ongoing charges ratio (excludingperformance fees) of 0.57% for the year ended 30th June 2017 (2016: 0.64%) is competitivewhen compared to other trusts and savings products such as open ended funds activelyinvesting in global equities. No performance fee is actually payable for the year ended30th June 2017 (2016: Nil) notwithstanding the excellent performance this year because feesare calculated and payable over a four year period. There is an accrual included in thefinancial statements in respect of performance fees that could become payable in futureyears. The Board continues actively to monitor the Company’s management feearrangements to ensure they remain structured in the interests of shareholders.
GearingGearing is regularly discussed between the Board and the Investment Manager. A borrowingfacility of £25 million with National Australia Bank is in place until July 2018. This facility is
Global Growth & Income_pp01_21 19/09/2017 12:36 Page 4
5
flexible and can be used tactically as investment opportunities present themselves. The£25 million facility was fully drawn down at the year-end when gearing was 6.3%. Since theyear end, the Investment Manager has reduced gearing to 1.8%.
Currency HedgingThe Company continues its passive currency hedging strategy (implemented in late 2008)that aims to make stock selection the predominant driver of overall portfolio performancerelative to the benchmark, the MSCI World All Countries Index (in sterling terms). This isa risk reduction measure, designed to eliminate most of the differences between theportfolio’s currency exposure and that of the Company’s benchmark. As a result the returnsderived from, and the portfolio’s exposure to currencies may differ materially from that ofthe Company’s competitors, who generally do not undertake such a strategy.
The BoardThere have been no changes to the composition of the Board during the year. Following theBoard’s annual evaluation by the Nomination Committee, it is felt that given the recentrefreshment of the Board, its current composition and its size are all sufficient at the presenttime and no changes are anticipated over the next 12 months.
The Board supports the annual re-election for all Directors, as recommended by theUK Corporate Governance Code, and therefore all Directors will stand for re-election at theforthcoming AGM.
Annual General MeetingMy fellow Directors and I invite you to attend the Company’s Annual General Meeting whichwill be held at 60 Victoria Embankment, London EC4Y 0JP on Wednesday 25th October 2017at 2.30 p.m. An investment presentation will be made at the meeting by Jeroen Huysinga.If you have any detailed or technical questions, please submit these in advance of themeeting in writing, or via the Company’s website, to the Company Secretary whose contactdetails are shown on page 71 of this report. Shareholders who are unable to attend the AGMin person are encouraged to use their proxy votes.
There will be an opportunity for shareholders to meet the Directors and the InvestmentManager following the AGM. I hope to have the pleasure of meeting you then.
OutlookAfter such a strong year for the Company, it is natural to sound a word of caution. Althoughglobal economies are generally performing well, with an encouraging rebound in continentalEurope, the further rally in equity markets in the past year has taken valuations to quiteextended levels. At the same time, the direction of US economic and financial policybecomes ever more uncertain under the Trump presidency while, closer to home, Britainand the European Union have to negotiate the complexities of Brexit.
However, for the Company there are in my view at least two grounds for optimism. We areseeing renewed interest in the Company’s shares, as evidenced by the elimination of thediscount, with higher daily turnover and a broadening investor base. At the same time theBoard has continued confidence in the ability of our Investment Manager, Jeroen Huysinga,to find attractively priced stocks, backed as he is by the worldwide research resources ofJPMorgan.
Nigel WightmanChairman 19th September 2017
Global Growth & Income_pp01_21 19/09/2017 12:30 Page 5
6 JPMORGAN GLOBAL GROWTH & INCOME PLC. ANNUAL REPORT & FINANCIAL STATEMENTS 2017
Strategic Report continued
INVESTMENT MANAGER’S REPORT
Market EnvironmentThe MSCI All Countries World Index gained 22% in sterling terms over the 12 months to theend of June. After the initial post referendum fall, sterling’s subsequent decline relative tothe US dollar was quite mild – although it remains at multi-decade lows. While marketsmoved steadily upwards over the period, the stocks and sectors leading the market choppedand changed through the year. In the second half of 2016 we saw a sharp reversal ofprevious trends, with markets shifting towards a more risk-on, pro-cyclical, anti-bond proxyenvironment. This change started even before the Trump victory, which with its promisedtax cuts, deregulation and infrastructure spending added to the market’s optimism.Deflationary fears ebbed, the use by central banks of unconventional monetary policy‘peaked’, fiscal drag started to reverse and government bond markets were weak. Globaleconomic growth became stronger and more synchronised than over the previousfive years, the performance of the Chinese economy defied the sceptics and Europeovercame political concerns and started to enjoy economic growth.
As we moved into 2017, sentiment became more cautious about President Trump’sadministration and upward momentum was driven by a very concentrated, small group ofgrowth stocks. Inflation rates globally remained stubbornly low yet growth rates, with theexception of the UK, were robust. There was a point earlier in 2017 at which commentatorsagain became somewhat concerned about the outlook for the Chinese economy, but thisconcern has been muted, so far. Commodity prices were mixed: the crude oil remainedsubdued, principally given supply-based concerns, but other commodities such as iron ore,copper and aluminium were strong on the back of cyclical economic strength (particularly inChina) and, in some cases, optimism around cuts in supply.
Portfolio ReviewDuring the 12 months to June 2017 your Company significantly outperformed thebenchmark. Given the reversal in market leadership described above, the environment wasconstructive for our investment strategy which was pro-cyclically positioned with a biastowards higher beta (more volatile) stocks. Many of the investments that had previouslydetracted from performance rebounded strongly, notably our holdings in banks and basicindustries. We held on to, or added to, a number of stocks that had previously laggedbehind, convinced by compelling valuations underpinned by strong long-term insights fromour experienced team of research analysts. Outokumpu, for example, a Finnish stainlesssteel company undergoing significant restructuring led by an impressive new managementteam, was overlooked by the market in previous years. Despite the shares rising 88% overthe period, we still believe the comprehensive turnaround at Outokumpu is not yet properlyreflected in the stock price. Our holdings in a number of US banks proved to be veryrewarding, including Morgan Stanley and Bank of America which each saw their share pricesgain more than 70%. Again, marking a reversal of trends in previous periods, ourunderweight position in utilities was also rewarded as these performed poorly.
Other companies which contributed to performance included Suzuki, Royal CaribbeanCruises and UnitedHealth Group, the US healthcare insurance provider. Last yearI commented on our addition of Suzuki to the portfolio given the auto company’s exposureto demand in India. We have recently sold the holding in the company which saw a nearly100% return over the period.
Global Growth & Income_pp01_21 19/09/2017 12:30 Page 6
7
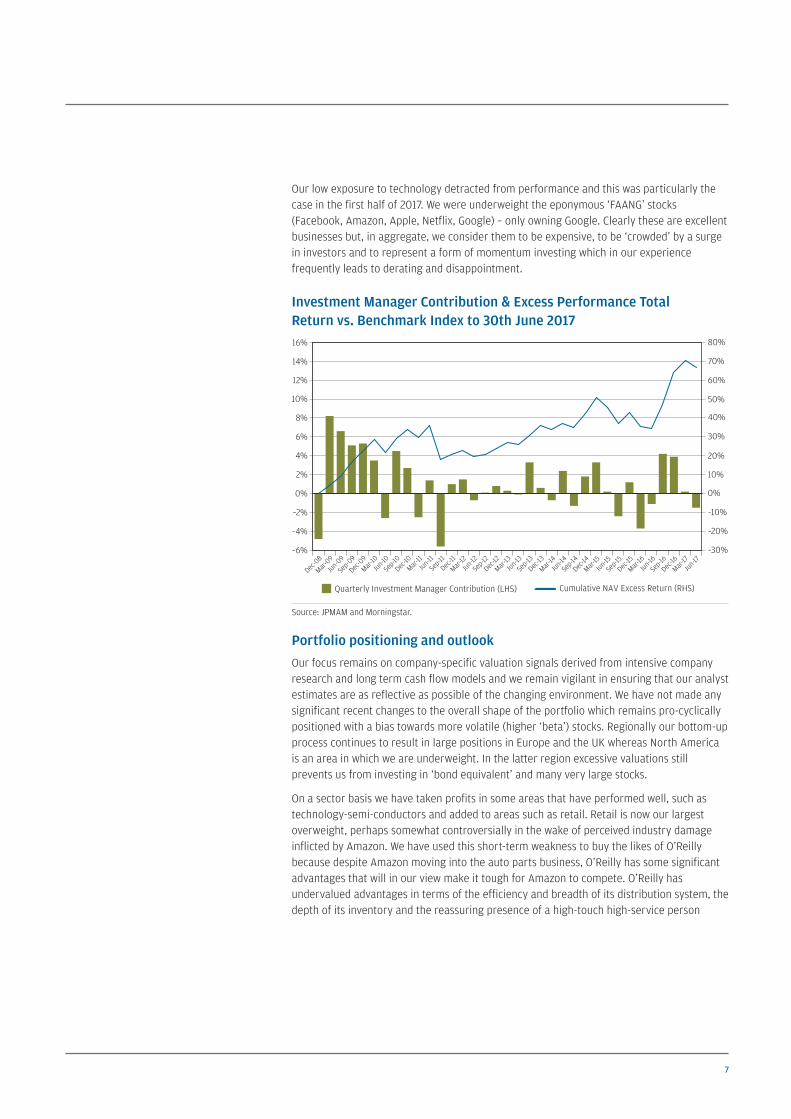
Our low exposure to technology detracted from performance and this was particularly thecase in the first half of 2017. We were underweight the eponymous ‘FAANG’ stocks(Facebook, Amazon, Apple, Netflix, Google) – only owning Google. Clearly these are excellentbusinesses but, in aggregate, we consider them to be expensive, to be ‘crowded’ by a surgein investors and to represent a form of momentum investing which in our experiencefrequently leads to derating and disappointment.
Investment Manager Contribution & Excess Performance TotalReturn vs. Benchmark Index to 30th June 2017
Source: JPMAM and Morningstar.
Portfolio positioning and outlookOur focus remains on company-specific valuation signals derived from intensive companyresearch and long term cash flow models and we remain vigilant in ensuring that our analystestimates are as reflective as possible of the changing environment. We have not made anysignificant recent changes to the overall shape of the portfolio which remains pro-cyclicallypositioned with a bias towards more volatile (higher ‘beta’) stocks. Regionally our bottom-upprocess continues to result in large positions in Europe and the UK whereas North Americais an area in which we are underweight. In the latter region excessive valuations stillprevents us from investing in ‘bond equivalent’ and many very large stocks.
On a sector basis we have taken profits in some areas that have performed well, such astechnology-semi-conductors and added to areas such as retail. Retail is now our largestoverweight, perhaps somewhat controversially in the wake of perceived industry damageinflicted by Amazon. We have used this short-term weakness to buy the likes of O’Reillybecause despite Amazon moving into the auto parts business, O’Reilly has some significantadvantages that will in our view make it tough for Amazon to compete. O’Reilly hasundervalued advantages in terms of the efficiency and breadth of its distribution system, thedepth of its inventory and the reassuring presence of a high-touch high-service person
–6%
–4%
–2%
0%
2%
4%
6%
8%
10%
12%
14%
16%
–30%
–20%
–10%
0%
10%
20%
30%
40%
50%
60%
70%
80%
Dec-0
8
Mar-09
Jun-0
9
Sep-0
9
Dec-0
9
Mar-10Jun
-10Se
p-10Dec
-10Mar-
11Jun
-11Se
p-11Dec
-11
Mar-12Jun
-12Se
p-12Dec
-12
Mar-13Jun
-13Se
p-13Dec
-13
Mar-14Jun
-14Se
p-14Dec
-14Mar-
15Jun
-15Se
p-15Dec
-15
Mar-16
Jun-1
6Se
p-16Dec
-16Mar-
17
Jun-1
7
Quarterly Investment Manager Contribution (LHS) Cumulative NAV Excess Return (RHS)
Global Growth & Income_pp01_21 19/09/2017 12:30 Page 7
8 JPMORGAN GLOBAL GROWTH & INCOME PLC. ANNUAL REPORT & FINANCIAL STATEMENTS 2017
Strategic Report continued
behind a counter. Similarly, TJX , again thought to be at risk from Amazon, operates a uniquebusiness model (low-price retailing) which is very hard to replicate online.
We have also added to an existing holding in Ping An, the Chinese insurer. Ping An’s dominantposition serving China’s mass affluent/high net worth individuals should allow them tooutgrow their key competitors in life insurance and property & casualty insurance, China’sdemographics, Government policy and low level of insurance penetration makes this anattractive sector. While we remain underweight in emerging market companies, a number ofthe developed market-listed companies we own have significant indirect exposure to growthin emerging markets.
Jeroen HuysingaInvestment Manager 19th September 2017
INVESTMENT MANAGER’S REPORT CONTINUED
Global Growth & Income_pp01_21 19/09/2017 15:53 Page 8
9
SUMMARY OF RESULTS
2017 2016
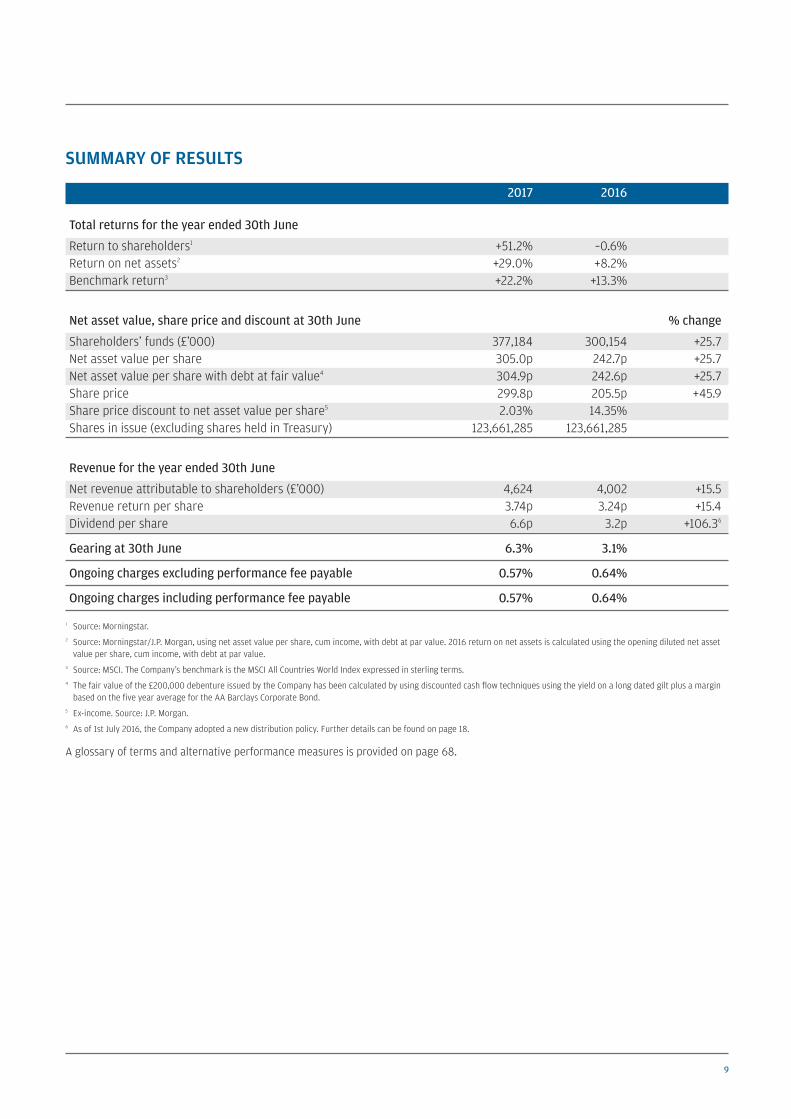
Total returns for the year ended 30th June
Return to shareholders1 +51.2% –0.6%Return on net assets2 +29.0% +8.2%Benchmark return3 +22.2% +13.3%
Net asset value, share price and discount at 30th June % change
Shareholders’ funds (£’000) 377,184 300,154 +25.7Net asset value per share 305.0p 242.7p +25.7Net asset value per share with debt at fair value4 304.9p 242.6p +25.7Share price 299.8p 205.5p +45.9Share price discount to net asset value per share5 2.03% 14.35%Shares in issue (excluding shares held in Treasury) 123,661,285 123,661,285
Revenue for the year ended 30th June
Net revenue attributable to shareholders (£’000) 4,624 4,002 +15.5Revenue return per share 3.74p 3.24p +15.4Dividend per share 6.6p 3.2p +106.36
Gearing at 30th June 6.3% 3.1%
Ongoing charges excluding performance fee payable 0.57% 0.64%
Ongoing charges including performance fee payable 0.57% 0.64%
1 Source: Morningstar.2 Source: Morningstar/J.P. Morgan, using net asset value per share, cum income, with debt at par value. 2016 return on net assets is calculated using the opening diluted net asset
value per share, cum income, with debt at par value.3 Source: MSCI. The Company’s benchmark is the MSCI All Countries World Index expressed in sterling terms.4 The fair value of the £200,000 debenture issued by the Company has been calculated by using discounted cash flow techniques using the yield on a long dated gilt plus a margin
based on the five year average for the AA Barclays Corporate Bond.5 Ex-income. Source: J.P. Morgan.6 As of 1st July 2016, the Company adopted a new distribution policy. Further details can be found on page 18.
A glossary of terms and alternative performance measures is provided on page 68.
Global Growth & Income_pp01_21 19/09/2017 12:30 Page 9
10 JPMORGAN GLOBAL GROWTH & INCOME PLC. ANNUAL REPORT & FINANCIAL STATEMENTS 2017
Strategic Report continued
PERFORMANCE
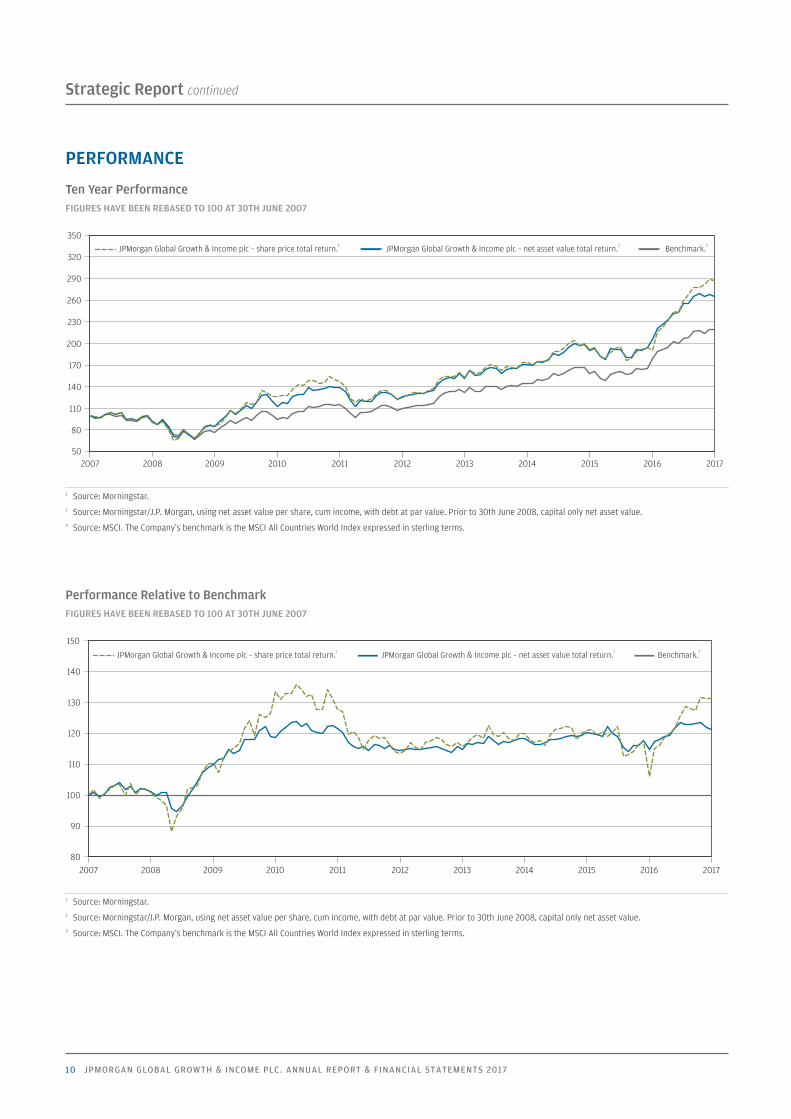
Ten Year PerformanceFIGURES HAVE BEEN REBASED TO 100 AT 30TH JUNE 2007
1 Source: Morningstar.2 Source: Morningstar/J.P. Morgan, using net asset value per share, cum income, with debt at par value. Prior to 30th June 2008, capital only net asset value.3 Source: MSCI. The Company’s benchmark is the MSCI All Countries World Index expressed in sterling terms.
JPMorgan Global Growth & Income plc – share price total return. JPMorgan Global Growth & Income plc – net asset value total return. Benchmark.
50
80
110
140
170
200
230
260
290
320
350
20172016201520142013201220112010200920082007
1 2 3
Performance Relative to BenchmarkFIGURES HAVE BEEN REBASED TO 100 AT 30TH JUNE 2007
1 Source: Morningstar.2 Source: Morningstar/J.P. Morgan, using net asset value per share, cum income, with debt at par value. Prior to 30th June 2008, capital only net asset value.3 Source: MSCI. The Company’s benchmark is the MSCI All Countries World Index expressed in sterling terms.
80
90
100
110
120
130
140
150
20172016201520142013201220112010200920082007
JPMorgan Global Growth & Income plc – share price total return. JPMorgan Global Growth & Income plc – net asset value total return. Benchmark.1 2 3
Global Growth & Income_pp01_21 19/09/2017 12:30 Page 10
11
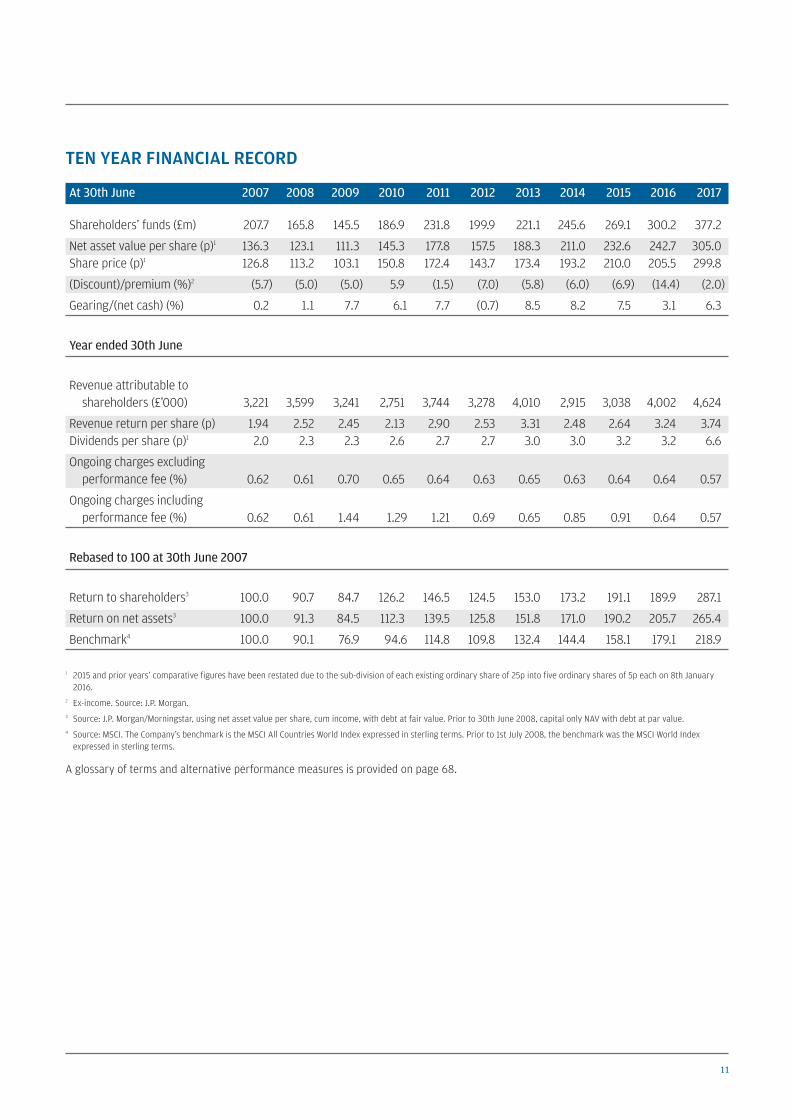
TEN YEAR FINANCIAL RECORD
At 30th June 2007 2008 2009 2010 2011 2012 2013 2014 2015 2016 2017
Shareholders’ funds (£m) 207.7 165.8 145.5 186.9 231.8 199.9 221.1 245.6 269.1 300.2 377.2
Net asset value per share (p)1 136.3 123.1 111.3 145.3 177.8 157.5 188.3 211.0 232.6 242.7 305.0Share price (p)1 126.8 113.2 103.1 150.8 172.4 143.7 173.4 193.2 210.0 205.5 299.8
(Discount)/premium (%)2 (5.7) (5.0) (5.0) 5.9 (1.5) (7.0) (5.8) (6.0) (6.9) (14.4) (2.0)
Gearing/(net cash) (%) 0.2 1.1 7.7 6.1 7.7 (0.7) 8.5 8.2 7.5 3.1 6.3
Year ended 30th June
Revenue attributable toshareholders (£’000) 3,221 3,599 3,241 2,751 3,744 3,278 4,010 2,915 3,038 4,002 4,624
Revenue return per share (p) 1.94 2.52 2.45 2.13 2.90 2.53 3.31 2.48 2.64 3.24 3.74Dividends per share (p)1 2.0 2.3 2.3 2.6 2.7 2.7 3.0 3.0 3.2 3.2 6.6
Ongoing charges excludingperformance fee (%) 0.62 0.61 0.70 0.65 0.64 0.63 0.65 0.63 0.64 0.64 0.57
Ongoing charges including performance fee (%) 0.62 0.61 1.44 1.29 1.21 0.69 0.65 0.85 0.91 0.64 0.57
Rebased to 100 at 30th June 2007
Return to shareholders3 100.0 90.7 84.7 126.2 146.5 124.5 153.0 173.2 191.1 189.9 287.1
Return on net assets3 100.0 91.3 84.5 112.3 139.5 125.8 151.8 171.0 190.2 205.7 265.4
Benchmark4 100.0 90.1 76.9 94.6 114.8 109.8 132.4 144.4 158.1 179.1 218.9
1 2015 and prior years’ comparative figures have been restated due to the sub-division of each existing ordinary share of 25p into five ordinary shares of 5p each on 8th January2016.
2 Ex-income. Source: J.P. Morgan.3 Source: J.P. Morgan/Morningstar, using net asset value per share, cum income, with debt at fair value. Prior to 30th June 2008, capital only NAV with debt at par value.4 Source: MSCI. The Company’s benchmark is the MSCI All Countries World Index expressed in sterling terms. Prior to 1st July 2008, the benchmark was the MSCI World Index
expressed in sterling terms.
A glossary of terms and alternative performance measures is provided on page 68.
Global Growth & Income_pp01_21 19/09/2017 12:30 Page 11
12 JPMORGAN GLOBAL GROWTH & INCOME PLC. ANNUAL REPORT & FINANCIAL STATEMENTS 2017
Strategic Report continued
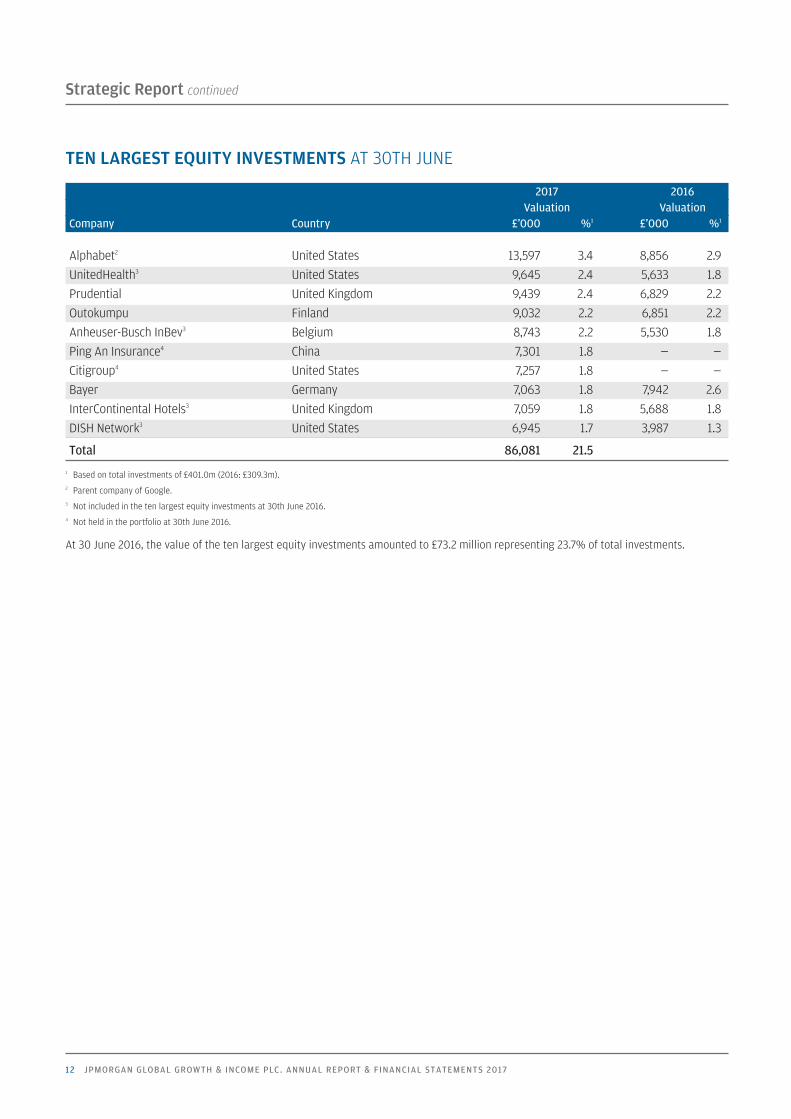
TEN LARGEST EQUITY INVESTMENTS AT 30TH JUNE
2017 2016 Valuation ValuationCompany Country £’000 %1 £’000 %1
Alphabet2 United States 13,597 3.4 8,856 2.9UnitedHealth3 United States 9,645 2.4 5,633 1.8Prudential United Kingdom 9,439 2.4 6,829 2.2Outokumpu Finland 9,032 2.2 6,851 2.2Anheuser-Busch InBev3 Belgium 8,743 2.2 5,530 1.8Ping An Insurance4 China 7,301 1.8 — —Citigroup4 United States 7,257 1.8 — —Bayer Germany 7,063 1.8 7,942 2.6InterContinental Hotels3 United Kingdom 7,059 1.8 5,688 1.8DISH Network3 United States 6,945 1.7 3,987 1.3
Total 86,081 21.51 Based on total investments of £401.0m (2016: £309.3m).2 Parent company of Google.3 Not included in the ten largest equity investments at 30th June 2016.4 Not held in the portfolio at 30th June 2016.
At 30 June 2016, the value of the ten largest equity investments amounted to £73.2 million representing 23.7% of total investments.
Global Growth & Income_pp01_21 19/09/2017 12:30 Page 12
13
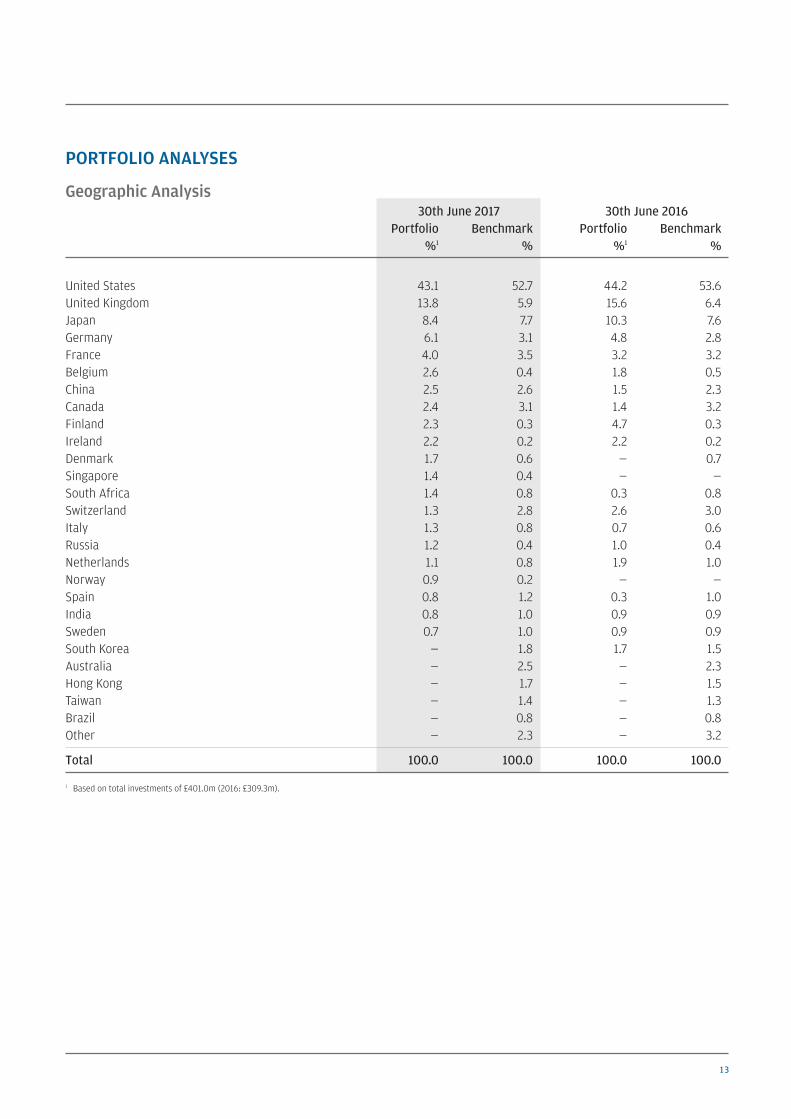
PORTFOLIO ANALYSES
Geographic Analysis 30th June 2017 30th June 2016 Portfolio Benchmark Portfolio Benchmark %1 % %1 %
United States 43.1 52.7 44.2 53.6United Kingdom 13.8 5.9 15.6 6.4Japan 8.4 7.7 10.3 7.6Germany 6.1 3.1 4.8 2.8France 4.0 3.5 3.2 3.2Belgium 2.6 0.4 1.8 0.5China 2.5 2.6 1.5 2.3Canada 2.4 3.1 1.4 3.2Finland 2.3 0.3 4.7 0.3Ireland 2.2 0.2 2.2 0.2Denmark 1.7 0.6 — 0.7Singapore 1.4 0.4 — —South Africa 1.4 0.8 0.3 0.8Switzerland 1.3 2.8 2.6 3.0Italy 1.3 0.8 0.7 0.6Russia 1.2 0.4 1.0 0.4Netherlands 1.1 0.8 1.9 1.0Norway 0.9 0.2 — —Spain 0.8 1.2 0.3 1.0India 0.8 1.0 0.9 0.9Sweden 0.7 1.0 0.9 0.9South Korea — 1.8 1.7 1.5Australia — 2.5 — 2.3Hong Kong — 1.7 — 1.5Taiwan — 1.4 — 1.3Brazil — 0.8 — 0.8Other — 2.3 — 3.2
Total 100.0 100.0 100.0 100.0
1 Based on total investments of £401.0m (2016: £309.3m).
Global Growth & Income_pp01_21 19/09/2017 12:30 Page 13
14 JPMORGAN GLOBAL GROWTH & INCOME PLC. ANNUAL REPORT & FINANCIAL STATEMENTS 2017
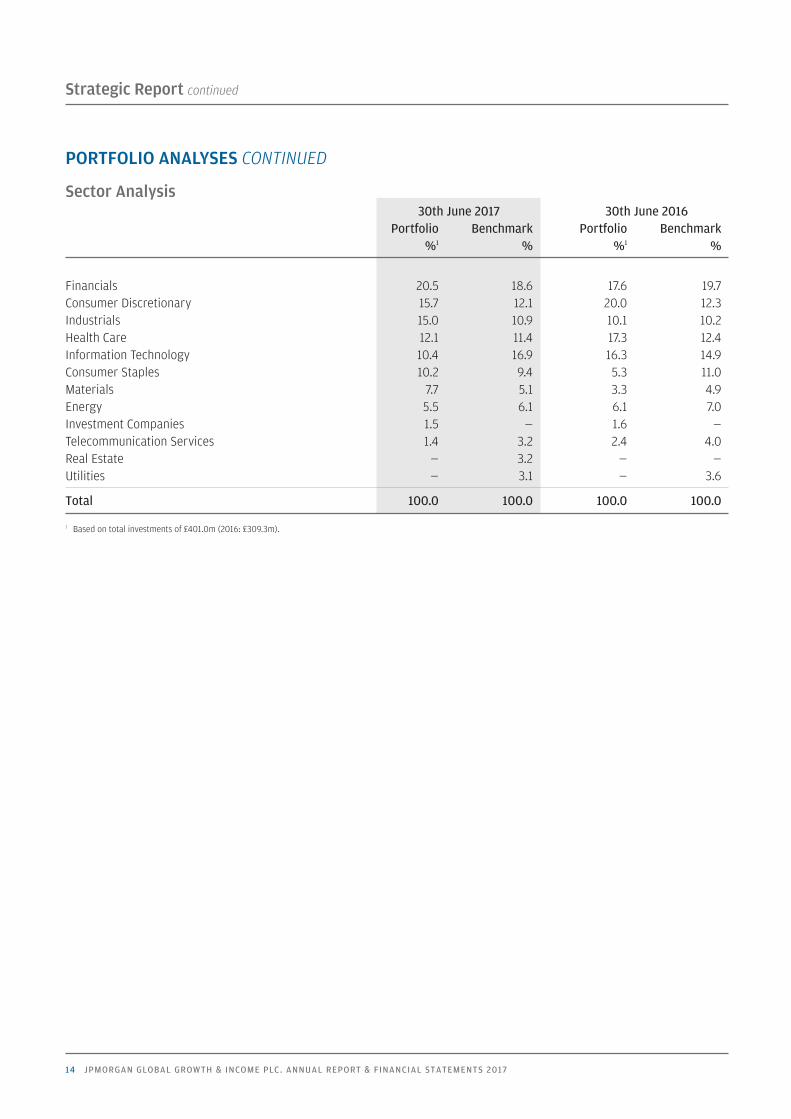
Strategic Report continued
Sector Analysis 30th June 2017 30th June 2016 Portfolio Benchmark Portfolio Benchmark %1 % %1 %
Financials 20.5 18.6 17.6 19.7Consumer Discretionary 15.7 12.1 20.0 12.3Industrials 15.0 10.9 10.1 10.2Health Care 12.1 11.4 17.3 12.4Information Technology 10.4 16.9 16.3 14.9Consumer Staples 10.2 9.4 5.3 11.0Materials 7.7 5.1 3.3 4.9Energy 5.5 6.1 6.1 7.0Investment Companies 1.5 — 1.6 —Telecommunication Services 1.4 3.2 2.4 4.0Real Estate — 3.2 — —Utilities — 3.1 — 3.6
Total 100.0 100.0 100.0 100.0
1 Based on total investments of £401.0m (2016: £309.3m).
PORTFOLIO ANALYSES CONTINUED
Global Growth & Income_pp01_21 19/09/2017 12:30 Page 14
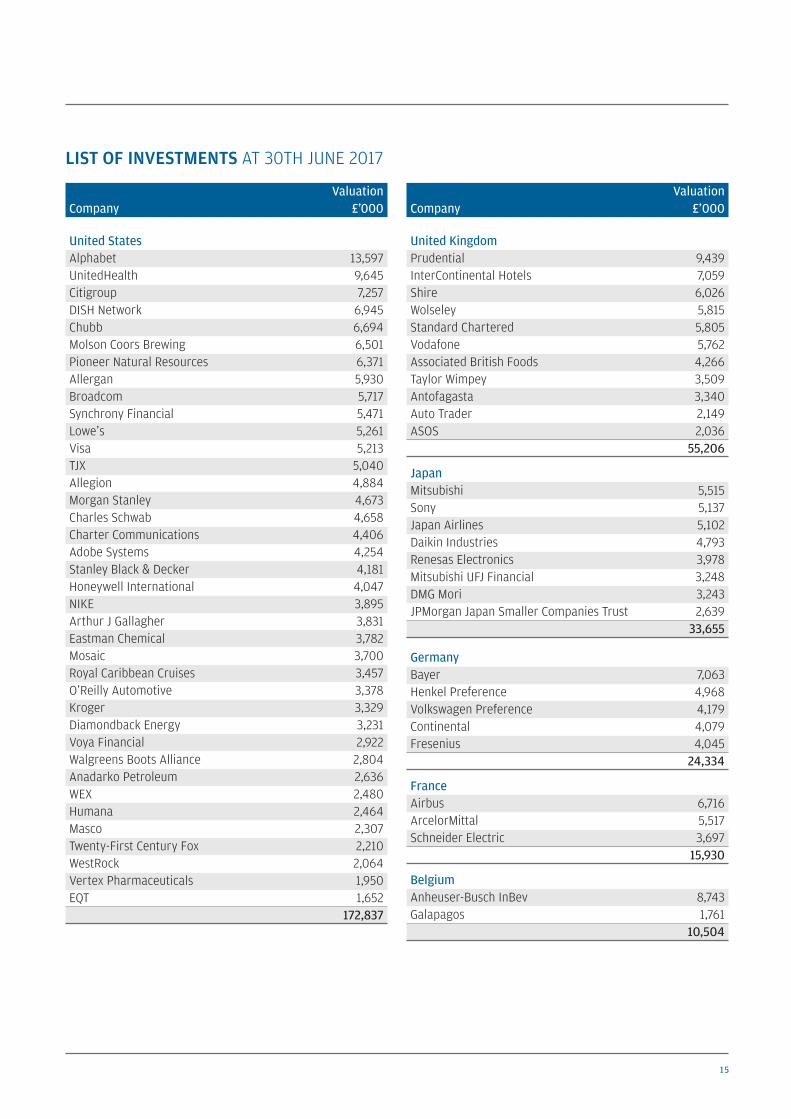
15
ValuationCompany £’000
United StatesAlphabet 13,597UnitedHealth 9,645Citigroup 7,257DISH Network 6,945Chubb 6,694Molson Coors Brewing 6,501Pioneer Natural Resources 6,371Allergan 5,930Broadcom 5,717Synchrony Financial 5,471Lowe’s 5,261Visa 5,213TJX 5,040Allegion 4,884Morgan Stanley 4,673Charles Schwab 4,658Charter Communications 4,406Adobe Systems 4,254Stanley Black & Decker 4,181Honeywell International 4,047NIKE 3,895Arthur J Gallagher 3,831Eastman Chemical 3,782Mosaic 3,700Royal Caribbean Cruises 3,457O’Reilly Automotive 3,378Kroger 3,329Diamondback Energy 3,231Voya Financial 2,922Walgreens Boots Alliance 2,804Anadarko Petroleum 2,636WEX 2,480Humana 2,464Masco 2,307Twenty-First Century Fox 2,210WestRock 2,064Vertex Pharmaceuticals 1,950EQT 1,652
172,837
ValuationCompany £’000
United KingdomPrudential 9,439InterContinental Hotels 7,059Shire 6,026Wolseley 5,815Standard Chartered 5,805Vodafone 5,762Associated British Foods 4,266Taylor Wimpey 3,509Antofagasta 3,340Auto Trader 2,149ASOS 2,036
55,206
JapanMitsubishi 5,515Sony 5,137Japan Airlines 5,102Daikin Industries 4,793Renesas Electronics 3,978Mitsubishi UFJ Financial 3,248DMG Mori 3,243JPMorgan Japan Smaller Companies Trust 2,639
33,655
GermanyBayer 7,063Henkel Preference 4,968Volkswagen Preference 4,179Continental 4,079Fresenius 4,045
24,334
FranceAirbus 6,716ArcelorMittal 5,517Schneider Electric 3,697
15,930
BelgiumAnheuser-Busch InBev 8,743Galapagos 1,761
10,504
LIST OF INVESTMENTS AT 30TH JUNE 2017
Global Growth & Income_pp01_21 19/09/2017 12:30 Page 15
16 JPMORGAN GLOBAL GROWTH & INCOME PLC. ANNUAL REPORT & FINANCIAL STATEMENTS 2017
Strategic Report continued
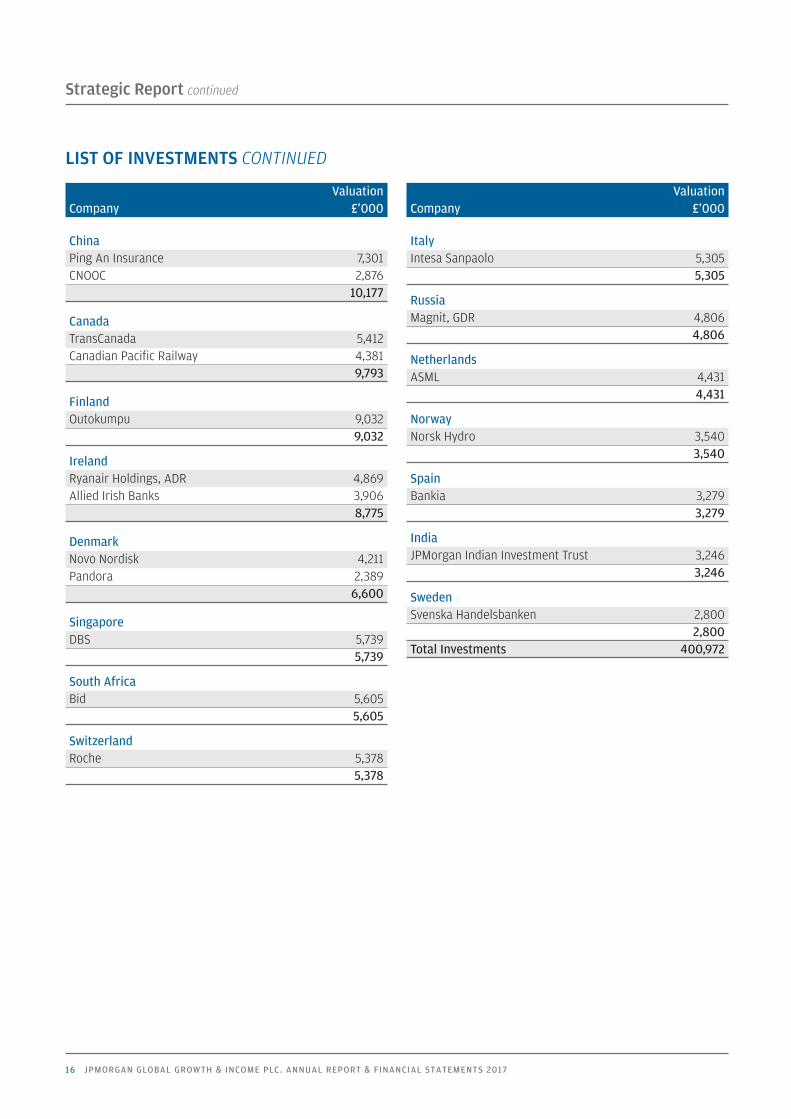
ValuationCompany £’000
ChinaPing An Insurance 7,301CNOOC 2,876
10,177
CanadaTransCanada 5,412Canadian Pacific Railway 4,381
9,793
FinlandOutokumpu 9,032
9,032
IrelandRyanair Holdings, ADR 4,869Allied Irish Banks 3,906
8,775
DenmarkNovo Nordisk 4,211Pandora 2,389
6,600
SingaporeDBS 5,739
5,739
South AfricaBid 5,605
5,605
SwitzerlandRoche 5,378
5,378
ValuationCompany £’000
ItalyIntesa Sanpaolo 5,305
5,305
RussiaMagnit, GDR 4,806
4,806
NetherlandsASML 4,431
4,431
NorwayNorsk Hydro 3,540
3,540
SpainBankia 3,279
3,279
IndiaJPMorgan Indian Investment Trust 3,246
3,246
SwedenSvenska Handelsbanken 2,800
2,800Total Investments 400,972
LIST OF INVESTMENTS CONTINUED
Global Growth & Income_pp01_21 19/09/2017 12:30 Page 16
17
The aim of the Strategic Report is to provide shareholders with theability to assess how the Directors have performed their duty topromote the success of the Company during the year under review.To assist shareholders with this assessment, the Strategic Reportsets out the structure and objective of the Company, its investmentpolicies and risk management, performance and key performanceindicators, share capital, principal risks and how the Company seeksto manage those risks, the Company’s environmental, social andethical policy and its long term viability.
Structure of the CompanyJPMorgan Global Growth & Income plc is an investment trustcompany that has a premium listing on the London Stock Exchange.With effect from 1st July 2014, JPMorgan Funds Limited (‘JPMF’ orthe ‘Manager’), an affiliate of JPMAM, has been appointed as theCompany’s Alternative Investment Fund Manager (‘AIFM’) to manageits assets and also to act as the Company Secretary. The Board hasdetermined an investment policy and related guidelines and limitsas described below.
The Company is subject to UK and European legislation andregulations including UK company law, Financial ReportingStandards, the UKLA Listing, Prospectus, Disclosure, Guidance andTransparency Rules, taxation law and the Company’s own Articles ofAssociation. The Company is an investment company within themeaning of Section 833 of the Companies Act 2006 and has beenapproved by HM Revenue & Customs as an investment trust (for thepurposes of Sections 1158 and 1159 of the Corporation Tax Act 2010)for the year ended 30th June 2013 and future years. The Directorshave no reason to believe that approval will not continue to beretained. The Company is not a close company for taxationpurposes.
The Company is also listed on the New Zealand Stock Exchange.
ObjectiveThe Company’s objective is to achieve total returns from worldstockmarkets.
Investment Policies and Risk ManagementIn order to achieve the investment objective and to seek to managerisk, the Company invests in a diversified portfolio of companies.
The Company manages liquidity and borrowings to increasepotential sterling returns to shareholders; the Board has seta normal range of 5% net cash to 20% geared.
The Company’s aim is to provide a diversified portfolio in which theInvestment Manager has a high degree of conviction. At the year
end, the number of investments held was 86. To gain theappropriate exposure, the Investment Managers are permitted toinvest in pooled funds. JPMAM is responsible for management ofthe Company’s assets. On a day-to-day basis the assets aremanaged by an Investment Manager based in London, supported bya strong equity research team.
The Company has implemented a passive currency hedging strategythat aims to make stock selection the predominant driver of overallportfolio performance relative to the benchmark, the MSCI AllCountries World Index (in sterling terms). This is a risk reductionmeasure, designed to eliminate most of the differences between theportfolio’s currency exposure and that of the Company’sbenchmark. As a result, the returns derived from and the portfolio’sexposure to currencies may materially differ from that of theCompany’s competitors who generally do not undertake sucha strategy.
Investment Restrictions and GuidelinesThe Board seeks to manage the Company’s risk by imposing variousinvestment limits and restrictions:
• In accordance with the Listing Rules of the UK Listing Authority(‘UKLA’), the Company will not invest more than 15% of its grossassets in other UK listed investment companies and will not investmore than 10% of its gross assets in companies that themselvesmay invest more than 15% of gross assets in UK listed investmentcompanies at the time of acquisition.
• The Company will not invest more than 5% of its total assets inany one individual stock at the time of acquisition. The aggregateof the Company’s top 10 holdings and top 20 holdings will notexceed 30% and 50% respectively.
• The Company does not normally invest in unquoted investmentsand to do so requires prior Board approval.
• No more than 25% of the Company’s assets may be invested innon-OECD countries.
• No more than 75% of the Company’s assets in aggregate, may beinvested in the US, Japan and the UK.
• The Company does not normally enter into derivativetransactions, other than foreign currency transactions and to doso requires prior Board approval.
These limits and restrictions may be varied by the Board at any timeat its discretion.
Compliance with the Board’s investment restrictions and guidelinesis monitored continuously by the Manager and is reported to theBoard on a monthly basis.
BUSINESS REVIEW
Global Growth & Income_pp01_21 19/09/2017 12:30 Page 17
18 JPMORGAN GLOBAL GROWTH & INCOME PLC. ANNUAL REPORT & FINANCIAL STATEMENTS 2017
Strategic Report continued
BUSINESS REVIEW CONTINUED
PerformanceIn the year to 30th June 2017, the Company produced a total returnto shareholders of +51.2% (2016: –0.6%) and a total return on netassets of +29.0% (2016: +8.2%). This compares with the return onthe Company’s benchmark index of +22.2% (2016: +13.3%). As at30th June 2017, the value of the Company’s investment portfolio was£401.0 million (2016: £309.3 million). The Investment Manager’sReport on pages 6 to 8 includes a review of developments duringthe year as well as information on investment activity within theCompany’s portfolio.
Total Return, Revenue and Dividends Gross total return for the year amounted to £91.8 million (2016:£21.2 million) and net total return after deducting management fee,performance fee, other administrative expenses, finance costs andtaxation, amounted to £86.4 million (2016: £20.4 million).Distributable income for the year amounted to £4.6 million (2016:£4.0 million).
As of 1st July 2016, the Company adopted a new distribution policywhereby at the start of each financial year the Company willannounce the distribution it intends to pay to shareholders in theforthcoming year in quarterly instalments. On aggregate, theintention is to pay dividends totalling at least 4% of the net assetvalue of the Company as at the end of the preceding financial year.These will be paid by way of four equal interim dividends in October,January, April and July. During the year, the Company has declaredthree interim dividends of 2.2p per share each. Together with thefinal dividend of 3.2p per share from the preceding financial yearended 30th June 2016, the four dividends will amount to 9.8p pershare in total, which represents a yield of 4.04% of the net assetvalue as at 30th June 2016.
Key Performance Indicators (‘KPIs’) The Board uses a number of financial KPIs to monitor and assessthe performance of the Company. The principal KPIs are:
• Performance against the benchmark index (the MSCI AllCountries World Index expressed in Sterling terms) This is the most important KPI by which performance is judged.Information on the Company’s performance is given in theChairman’s Statement and the Investment Manager’s Report.(Also please refer to the graphs on page 10).
• Performance against the Company’s peers The principal objective is to achieve total returns andout-performance relative to the benchmark. However, the Boardalso monitors the performance relative to a range of competitorfunds.
• Performance attributionThe purpose of performance attribution analysis is to assesshow the Company achieved its performance relative to itsbenchmark index, i.e. to understand the impact on theCompany’s relative performance of the various componentssuch as asset allocation and stock selection. Details of theattribution analysis for the year ended 30th June 2017 are givenin the Chairman’s Statement Report on page 3.
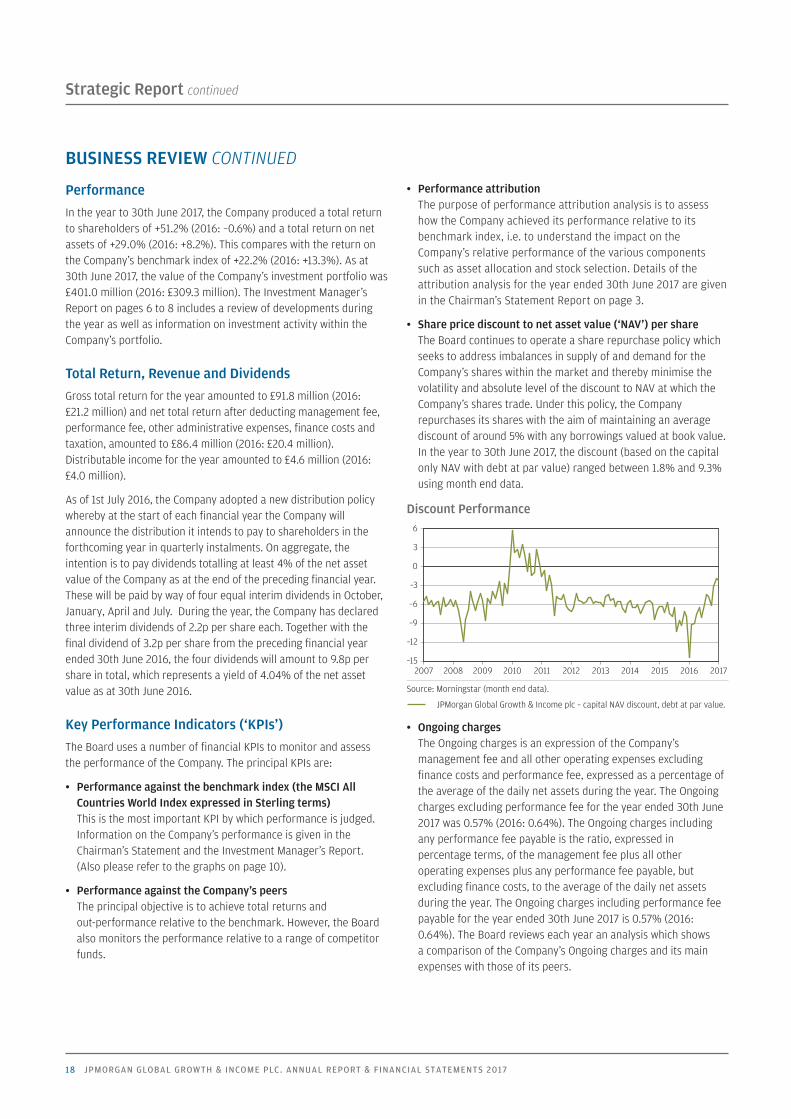
• Share price discount to net asset value (‘NAV’) per share The Board continues to operate a share repurchase policy whichseeks to address imbalances in supply of and demand for theCompany’s shares within the market and thereby minimise thevolatility and absolute level of the discount to NAV at which theCompany’s shares trade. Under this policy, the Companyrepurchases its shares with the aim of maintaining an averagediscount of around 5% with any borrowings valued at book value.In the year to 30th June 2017, the discount (based on the capitalonly NAV with debt at par value) ranged between 1.8% and 9.3%using month end data.
Discount Performance
Source: Morningstar (month end data).
JPMorgan Global Growth & Income plc – capital NAV discount, debt at par value.
• Ongoing chargesThe Ongoing charges is an expression of the Company’smanagement fee and all other operating expenses excludingfinance costs and performance fee, expressed as a percentage ofthe average of the daily net assets during the year. The Ongoingcharges excluding performance fee for the year ended 30th June2017 was 0.57% (2016: 0.64%). The Ongoing charges includingany performance fee payable is the ratio, expressed inpercentage terms, of the management fee plus all otheroperating expenses plus any performance fee payable, butexcluding finance costs, to the average of the daily net assetsduring the year. The Ongoing charges including performance feepayable for the year ended 30th June 2017 is 0.57% (2016:0.64%). The Board reviews each year an analysis which showsa comparison of the Company’s Ongoing charges and its mainexpenses with those of its peers.
–15
–12
–9
–6
–3
0
3
6
20172016201520142013201220112010200920082007
Global Growth & Income_pp01_21 19/09/2017 12:30 Page 18
19
Share CapitalThe Directors have authority to issue new Ordinary shares and torepurchase shares on behalf of the Company.
At 30th June 2017, the issued share capital comprised 154,905,500Ordinary shares of 5 pence each, including 31,244,215 shares heldin Treasury.
The Company did not reissue any shares from Treasury during theyear. Since the year end, 175,000 shares have been reissued fromTreasury.
No shares have been repurchased for cancellation or into Treasuryduring the year, or since the year end up to the date of this report.
Resolutions to renew the authority to issue new shares andrepurchase shares will be put to shareholders at the forthcomingAnnual General Meeting. The full text of these resolutions are setout in the Notice of Annual General Meeting on pages 65 and 66.
Board DiversityWhen recruiting a new Director, the Board’s policy is to appointindividuals on merit. Diversity is important in bringing anappropriate range of skills and experience to the Board and theBoard is deemed to be diverse. At 30th June 2017, there werethree male Directors and one female Director on the Board.
Employees, Social, Community and Human RightsIssuesThe Company has a management contract with the Manager. It hasno employees and all of its Directors are non-executive. The day today activities are carried out by third parties. There are thereforeno disclosures to be made in respect of employees. The Board notesthe Manager’s policy statements in respect of Social, Communityand Environmental and Human Rights issues, as highlighted initalics:
Social, Community, Environmental and Human Rights
The Manager believes that companies should act in a sociallyresponsible manner. Although our priority at all times is the besteconomic interests of our clients, we recognise that, increasingly,non-financial issues such as social and environmental factors havethe potential to impact the share price, as well as the reputation ofcompanies. Specialists within the Manager’s environmental, socialand governance (‘ESG’) team are tasked with assessing howcompanies deal with and report on social and environmental risksand issues specific to their industry.
The Manager is also a signatory to the United Nations Principles ofResponsible Investment, which commits participants to six principles,with the aim of incorporating ESG criteria into their processes whenmaking stock selection decisions and promoting ESG disclosure. Ourdetailed approach to how we implement the principles is available onrequest.
The Manager has implemented a policy which seeks to restrictinvestments in securities issued by companies that have beenidentified by an independent third party provider as being involvedin the manufacture, production or supply of cluster munitions,depleted uranium ammunition and armour and/or anti-personnelmines. Shareholders can obtain further details on the policy bycontacting the Manager.
Greenhouse Gas EmissionsThe Company is managed by the Manager. It has no employees andall of its Directors are non-executive, the day to day activities beingcarried out by third parties. There are therefore no disclosures to bemade in respect of employees. The Company itself has no premises,consumes no electricity, gas or diesel fuel and consequently doesnot have a measurable carbon footprint. The Company’s Manager, isa signatory to the Carbon Disclosure Project and JPMorgan Chase isa signatory to the Equator Principles on managing social andenvironmental risk in project finance.
The Modern Slavery Act 2015 (the ‘MSA’)The MSA requires companies to prepare a slavery and humantrafficking statement for each financial year of the organisation.As the Company has no employees and does not supply goodsand services, the MSA does not apply directly to it. The MSArequirements more appropriately relate to JPMF and JPMAM.JPMorgan’s statement on the MSA can be found on the followingwebsite: https://www.jpmorganchase.com/corporate/Corporate-Responsibility/document/modern-slavery-act.pdf
Principal RisksThe Directors confirm that they have carried out a robustassessment of the principal risks facing the Company, includingthose that would threaten its business model, future performance,solvency or liquidity.
With the assistance of the Manager, the Board has drawn up a riskmatrix, which identifies the key risks to the Company. In assessingthe risks and how they can be mitigated, the Board has givenparticular attention to those risks that might threaten the viabilityof the Company.
Global Growth & Income_pp01_21 19/09/2017 12:30 Page 19
20 JPMORGAN GLOBAL GROWTH & INCOME PLC. ANNUAL REPORT & FINANCIAL STATEMENTS 2017
Strategic Report continued
BUSINESS REVIEW CONTINUED
These key risks fall broadly under the following categories:
• Investment and Strategy: An inappropriate investment strategy,for example asset allocation or the level of gearing, may lead tounder-performance against the Company’s benchmark index andpeer companies, resulting in the Company’s shares trading ona wider discount. The Board manages these risks bydiversification of investments through its investment restrictionsand guidelines which are monitored and reported by theManager. The Manager provides the Directors with timely andaccurate management information, including performance dataand attribution analyses, revenue estimates, liquidity reports andshareholder analyses. The Board monitors the implementationand results of the investment process with the InvestmentManager, who attends all Board meetings, and reviews data whichshow statistical measures of the Company’s risk profile. TheInvestment Manager employs the Company’s gearing withina strategic range set by the Board. The Board may holda separate meeting devoted to strategy each year.
• Market: Market risk arises from uncertainty about the futureprices of the Company’s investments. It represents the potentialloss that the Company might suffer through holding investmentsin the face of negative market movements. The Board considersasset allocation, stock selection and levels of gearing on a regularbasis and has set investment restrictions and guidelines, whichare monitored and reported on by the Manager. The Boardmonitors the implementation and results of the investmentprocess with the Manager.
• Accounting, Legal and Regulatory: In order to qualify as aninvestment trust, the Company must comply with Section 1158 ofthe Corporation Tax Act 2010 (‘Section 1158’). Details of theCompany’s approval are given under ‘Structure of the Company’within the Business Review section above. Were the Company tobreach Section 1158, it might lose investment trust status and, asa consequence, gains within the Company’s portfolio could besubject to Capital Gains Tax. The Section 1158 qualification criteriaare continually monitored by the Manager and the resultsreported to the Board each month. The Company must alsocomply with the provisions of The Companies Act 2006 and, sinceits shares are listed on the London Stock Exchange, the UKLAListing Rules and Disclosure, Guidance and Transparency Rules(‘DTRs’). A breach of the Companies Act 2006 could result in theCompany and/or the Directors being fined or the subject ofcriminal proceedings. Breach of the UKLA Listing Rules or DTRscould result in the Company’s shares being suspended fromlisting, which in turn would breach Section 1158. The Board relies
on the services of its Company Secretary to ensure compliancewith the Companies Acts and The UKLA Listing Rules and DTRs.
• Corporate Governance and Shareholder Relations: Details of theCompany’s compliance with Corporate Governance best practice,including information on relations with shareholders, are set outin the Corporate Governance report on pages 26 to 30.
• Operational: Loss of key staff by the Manager, such as theInvestment Manager, could affect the performance of theCompany. Disruption to, or failure of, the Manager ’s accounting,dealing or payments systems or the depositary’s or custodian’srecords could prevent accurate reporting and monitoring of theCompany’s financial position. On 1st July 2014, the Companyappointed BNY Mellon Trust & Depositary (UK) Limited to act asthe depositary, responsible for overseeing the operations of thecustodian, JPMorgan Chase Bank, N.A., and the Company’s cashflows. Details of how the Board monitors the services provided bythe Manager and its associates and the key elements designed toprovide effective internal control are included with the RiskManagement and Internal Control section of the CorporateGovernance report on pages 28 and 29. The threat of cyberattack, in all its guises, is regarded as at least as important asmore traditional physical threats to business continuity andsecurity. The Company benefits directly or indirectly from allelements of JPMorgan’s Cyber Security programme. Theinformation technology controls around the physical security ofJPMorgan’s data centres, security of its networks and security ofits trading applications are tested by independent auditors andreported every six months against the AAF Standard.
• Going concern: Pursuant to the Sharman Report, Boards are nowadvised to consider going concern as a potential risk, whether ornot there is an apparent issue arising in relation thereto. Goingconcern is considered rigorously on an ongoing basis and theBoard’s statement on going concern is detailed on page 28.
• Financial: The financial risks faced by the Company includemarket price risk, interest rate risk, liability risk and credit risk.Further details are disclosed in note 22 on pages 55 to 61.
Long Term ViabilityTaking account of the Company’s current position, the principal risksthat it faces and their potential impact on its future developmentand prospects, the Directors have assessed the prospects of theCompany, to the extent that they are able to do so, over the nextfive years. They have made that assessment by considering thoseprincipal risks, the Company’s investment objective and strategy,
Global Growth & Income_pp01_21 19/09/2017 12:30 Page 20

21
the investment capabilities of the Manager and the current outlookfor the global economies and equity markets.
In determining the appropriate period of assessment the Directorshad regard to their view that, given the Company’s objective ofachieving long term total returns, shareholders should consider theCompany as a long term investment proposition. Thus the Directorsconsider five years to be an appropriate time horizon to assess theCompany’s viability.
The Directors confirm that they have a reasonable expectation thatthe Company will be able to continue in operation and meet itsliabilities as they fall due over the five year period of assessment.
For and on behalf of the BoardNigel WightmanChairman
19th September 2017
Global Growth & Income_pp01_21 19/09/2017 12:30 Page 21

22 JPMORGAN GLOBAL GROWTH & INCOME PLC. ANNUAL REPORT & FINANCIAL STATEMENTS 2017
BOARD OF DIRECTORS
Nigel Wightman†§ (Chairman of the Board and Nomination Committee)A Director since September 2010.
Last re-elected to the Board: 2016.
Over 35 years experience in the international asset management industry, having held seniorpositions at a number of companies including NM Rothschild and State Street. He isa non-executive Chairman of Managed Pension Funds Ltd and SSGA Ireland Unit TrustManagement Ltd and a partner of European and Global Advisers LLP. He also sits on theinvestment committees of several educational charities.
Connections with Manager: None.
Shared directorships with other Directors: None.
Shareholding in Company: 60,000 Ordinary shares.
Gay Collins*†§ (Senior Independent Director)A Director since 21st February 2012.
Last re-elected to the Board: 2016.
Founding partner of Montfort Communications, a strategic and financial communicationscompany. She has over 26 years experience in PR and specialises in advising companies in thefinancial services space. Previous experience includes selling Eurobonds at Merrill Lynch andDean Witter in London and New York.
Connections with Manager: None.
Shared directorships with other Directors: None.
Shareholding in Company: 12,173 Ordinary shares.
Jonathan Carey*†§(Chairman of the Remuneration Committee and Chairman of the Audit and ManagementEngagement Committee)A Director since September 2009.
Last re-elected to the Board: 2016.
Previously, chairman of Jupiter Investment Management Group Limited (formerly JupiterInternational Group Plc), a position held since June 2007 until his retirement from the Group inDecember 2010. Prior to this he was the Joint Group Chief Executive of Jupiter InvestmentManagement Group Limited, a position he held from May 2000. He is also a non-executiveDirector of BNY Mellon Trust and Depository (UK) Limited and WH Ireland Group plc.
Connections with Manager: None.
Shared directorships with other Directors: None.
Shareholding in Company: 16,500 Ordinary shares.
Directors’ Report
Global Growth & Income_pp22_35 19/09/2017 13:48 Page 22

23
Tristan Hillgarth*†§A Director since November 2014.
Last re-elected to the Board: 2016.
Over 30 years of experience in the asset management industry having been a director ofJupiter Asset Management for eight years. Before that he was at Invesco where he held severalsenior positions over 14 years including CEO of Invesco’s UK and European business. He iscurrently also a non-executive director of Euromoney Institutional Investor plc.
Connections with Manager: None.
Shared directorships with other Directors: None.
Shareholding in Company: 15,000 Ordinary shares.
* Member of the Audit and Management Engagement Committee.
† Member of the Nomination Committee.
§ Member of the Remuneration Committee.
Global Growth & Income_pp22_35 19/09/2017 12:29 Page 23
24 JPMORGAN GLOBAL GROWTH & INCOME PLC. ANNUAL REPORT & FINANCIAL STATEMENTS 2017
Directors’ Report continued
DIRECTORS’ REPORT
The Directors present their report and the audited financialstatements for the year ended 30th June 2017. The Companychanged its name from JPMorgan Overseas Investment Trust plcto JPMorgan Global Growth & Income plc on 8th July 2016.
Management of the CompanyThe Manager and Company Secretary is JPMorgan Funds Limited(‘JPMF’), a company authorised and regulated by the FCA.
The active management of the Company’s assets is delegated byJPMF to an affiliate, JPMorgan Asset Management (UK) Limited(‘JPMAM’).
The Manager is a wholly owned subsidiary of JPMorgan Chase Bankwhich, through other subsidiaries, also provides accounting,banking, dealing and custodian services to the Company.
The Manager is employed under a contract which can be terminatedon six months’ notice, without penalty. If the Company wishes toterminate the contract on shorter notice, the balance ofremuneration is payable by way of compensation.
The Board conducts a formal evaluation of the Manager on anannual basis. The evaluation includes consideration of theinvestment strategy and process of the Manager, notingperformance against the benchmark over the long term and thequality of the support that the Company receives from the Manager.As a result of the evaluation process, the Board confirms that it issatisfied that the continuing appointment of the Manager on theterms agreed is in the interests of the shareholders as a whole.
The Alternative Investment Fund Managers Directive(‘AIFMD’)JPMF is the Company’s alternative investment fund manager(‘AIFM’). It is approved as an AIFM by the FCA. For the purposes ofthe AIFMD the Company is an alternative investment fund (‘AIF’).
JPMF has delegated responsibility for the day to day managementof the Company’s portfolio to JPMAM. The Company has appointedBNY Mellon Trust and Depositary (UK) Limited (‘BNY’) as itsdepositary. BNY has appointed JPMorgan Chase Bank, N.A. as theCompany’s custodian. BNY is responsible for the oversight of thecustody of the Company’s assets and for monitoring its cash flows.
The AIFMD requires certain information to be made available toinvestors in AIFs before they invest and requires that materialchanges to this information be disclosed in the annual report ofeach AIF. An Investor Disclosure Document, which sets outinformation on the Company’s investment strategy and policies,leverage, risk, liquidity, administration, management, fees, conflicts
of interest and other shareholder information is available on theCompany’s website at www.jpmglobalgrowthandincome.co.uk. Therehave been no material changes (other than those reflected in thesefinancial statements) to this information requiring disclosure.
Any information requiring immediate disclosure pursuant to theAIFMD will be disclosed to the London Stock Exchange througha primary information provider.
JPMF’s remuneration disclosures are set out on page 64.
Management and Performance Fees The management fee is charged at the rate of 0.4% per annumof the Company’s assets less current liabilities. The terms of themanagement contract make allowance for the exclusion ofmanagement charges on investments held in funds on whichthe Manager earns a separate management fee.
A performance fee is payable if the total return attributable toshareholders (change in net asset value plus dividend) exceeds thetotal return of the Company’s benchmark by more than 0.5%. Theperformance fee payable is 15% of any excess of the total return(excluding the effect of share repurchases) over the benchmarktotal return. Payment of any amount earned under the performancefee in any relevant period is spread equally over four years.Performance is measured on a cumulative basis. Any performancefee accrued but not paid is reduced by any underperformance insubsequent years. Any adjustment in respect of underperformanceis deducted at the first opportunity from any amount accrued inrespect of previous years’ outperformance. The amount of anyperformance fee paid in any one year is capped at 0.8% of thepublished net assets of the Company at the end of the relevantperiod. Any excess is carried forward until paid in full (or offsetagainst subsequent underperformance).
The results for the year ended 30th June 2017 gave rise toa performance fee charge of £3,709,891 (2016: write back of£1,672,000) as the total return overperformed the benchmark plusthe hurdle of 0.5%. A performance fee of £nil (2016: £nil) will bepayable this year and £1,363,064 was offset against the negativebalance carried forward from the prior year. A balance of£2,346,827 (2016: negative balance £1,363,064) remains payablein future years but will first be reduced by any futureunderperformance.
Directors The Directors of the Company who were in office during the yearand up to the date of signing the financial statements are asdetailed on pages 22 and 23.
Global Growth & Income_pp22_35 19/09/2017 12:29 Page 24
25
Details of Directors’ beneficial shareholdings may be found in theDirectors’ Remuneration Report on page 33. No changes have beenreported to the Directors’ shareholdings since the year end.
In accordance with corporate governance best practice, all Directorswill retire at the forthcoming Annual General Meeting and, beingeligible, will offer themselves for reappointment by shareholders.The Nomination Committee, having considered their qualifications,performance and contribution to the Board and its committees,confirms that each Director continues to be effective anddemonstrates commitment to the role, and the Board recommendsto shareholders that they be re-elected.
Director Indemnification and InsuranceAs permitted by the Company’s Articles of Association, the Directorshave the benefit of a deed of indemnity which is a qualifying thirdparty indemnity, as defined by Section 234 of the CompaniesAct 2006. The indemnities were in place during the year and as atthe date of this report.
An insurance policy is maintained by the Company whichindemnifies the Directors of the Company against certain liabilitiesarising in the conduct of their duties. There is no cover againstfraudulent or dishonest actions.
Disclosure of information to Auditors In the case of each of the persons who are Directors of theCompany at the time when this report was approved:
(a) so far as each of the Directors is aware, there is no relevantaudit information (as defined in the Companies Act 2006) ofwhich the Company’s Auditors are unaware; and
(b) each of the Directors has taken all the steps that he ought tohave taken as a Director in order to make himself aware ofany relevant audit information and to establish that theCompany’s Auditors are aware of that information.
The above confirmation is given and should be interpreted inaccordance with the provision of Section 418 of the CompaniesAct 2006.
Independent AuditorsPricewaterhouseCoopers LLP have expressed their willingness tocontinue in office as Auditors, and a resolution to reappoint themand authorise the Directors to determine their remuneration forthe ensuing year will be proposed at the Annual General Meeting.
Capital Structure and Voting RightsCapital StructureThe Company’s capital structure is summarised on the inside frontcover of this report. The Ordinary shares have a premium listing onthe London Stock Exchange.
Voting Rights in the Company’s sharesDetails of the voting rights in the Company’s shares as at the date ofthis report are given in note 16 to the Notice of Annual GeneralMeeting on page 67.
Notifiable Interests in the Company’s Voting RightsAt the financial year end the following had declared a notifiableinterest in the Company’s voting rights:
Number ofShareholders shares held %
Investec Wealth & Investment 5,598,360 4.53
The Company is also aware that approximately 10.21% of theCompany’s total voting rights are held by individuals throughsavings products managed by the Manager and registered in thename of Chase Nominees Limited. If those voting rights are notexercised by the beneficial holders, in accordance with the termsand conditions of the savings products, under certain circumstancesthe Manager has the right to exercise those voting rights. That rightis subject to certain limits and restrictions and falls away at theconclusion of the relevant general meeting.
The rules concerning the appointment and replacement ofDirectors, amendment of the Articles of Association and powersto issue or buy back the Company’s shares are contained in theArticles of Association of the Company and the CompaniesAct 2006.
There are no restrictions concerning the transfer of securities inthe Company; no special rights with regard to control attached tosecurities; no agreements between holders of securities regardingtheir transfer known to the Company; no agreements which theCompany is party to that affect its control following a takeover bid;and no agreements between the Company and its Directorsconcerning compensation for loss of office.
Listing Rule 9.8.4RListing Rule 9.8.4R requires the Company to include certaininformation in a single identifiable section of the Annual Report ora cross reference table indicating where the information is set out.
The Directors confirm that there are no disclosures to be made inthis regard.
Global Growth & Income_pp22_35 19/09/2017 12:29 Page 25
26 JPMORGAN GLOBAL GROWTH & INCOME PLC. ANNUAL REPORT & FINANCIAL STATEMENTS 2017
Directors’ Report continued
DIRECTORS’ REPORT CONTINUED
Annual General MeetingNOTE: THIS SECTION IS IMPORTANT AND REQUIRES YOURIMMEDIATE ATTENTION. If you are in any doubt as to the actionyou should take, you should seek your own personal financialadvice from your stockbroker, bank manager, solicitor or otherfinancial advisor authorised under the Financial Services andMarkets Act 2000.
Resolutions relating to the following items of special business willbe proposed at the Annual General Meeting:
(i) Authority to issue new shares for cash and disapplypre-emption rights (Resolutions 9 and 10)
The Directors will seek renewal of the authority at the AGM to issueup to 12,383,628 Ordinary shares for cash or sell shares held inTreasury other than by pro rata issue to existing Shareholders up toan aggregate nominal amount of £619,181, such amount beingequivalent to approximately 10% of the present issued sharecapital. The full text of the resolutions is set out in the Notice ofAnnual General Meeting on page 65.
It is advantageous for the Company to be able to issue new sharesto participants purchasing shares through the Manager’s savingsproducts and also to other investors when the Directors considerthat it is in the best interests of shareholders to do so. Any suchissues would only be made at prices greater than the NAV, therebyincreasing the assets underlying each share and spreading theCompany’s administrative expenses, other than the managementfee which is charged on the value of the Company’s marketcapitalisation, over a greater number of shares. The issue proceedswould be available for investment in line with the Company’sinvestment policies.
(ii) Authority to repurchase the Company’s shares(Resolution 11)
The authority to repurchase up to 14.99% of the Company’s issuedshare capital, granted by shareholders at the 2016 Annual GeneralMeeting, will expire on 24th April 2018 unless renewed at theforthcoming Annual General Meeting. The Directors consider thatthe renewal of the authority is in the interests of shareholders asa whole, as the repurchase of shares at a discount to NAV enhancesthe NAV of the remaining shares. The Board will therefore seekshareholder approval at the Annual General Meeting to renew thisauthority, which will last until 24th April 2019 unless the authorityis renewed at the AGM in 2018 or at a general meeting prior to that.The full text of the resolution is set out in the Notice of AnnualGeneral Meeting on pages 65 and 66. Repurchases will be made atthe discretion of the Board and will only be made in the market atprices below the prevailing NAV per share, thereby enhancing the
NAV of the remaining shares, as and when market conditions areappropriate.
RecommendationThe Board considers that resolutions 9-11 are likely to promote thesuccess of the Company and are in the best interests of theCompany and its shareholders as a whole. The Directorsunanimously recommend that you vote in favour of the resolutionsas they intend to do in respect of their own beneficial holdingswhich amount in aggregate to 103,673 shares.
Corporate Governance
Compliance The Company is committed to high standards of corporategovernance. This statement, together with the Statement ofDirectors’ Responsibilities on page 35, indicates how the Companyhas applied the principles of good governance of the FinancialReporting Council UK Corporate Governance Code (the ‘UKCorporate Governance Code’) and the AIC’s Code of CorporateGovernance, (the ‘AIC Code’), which complements the UK CorporateGovernance Code and provides a framework of best practice forinvestment trusts.
The Board is responsible for ensuring the appropriate level ofcorporate governance and considers that the Company hascomplied with the best practice provisions of the UK CorporateGovernance Code and the AIC Code throughout the year underreview and up to the date of approval of the annual report andfinancial statements.
Role of the Board A management agreement between the Company and the Managersets out the matters over which the Manager has authority. Thisincludes management of the Company’s assets and the provision ofaccounting, company secretarial, administration, and somemarketing services. All other matters are reserved for the approvalof the Board. A formal schedule of matters reserved for Boarddecision has been approved. This includes determination andmonitoring of the Company’s investment objectives and policy andits future strategic direction, gearing policy, management of thecapital structure, appointment and removal of third party serviceproviders, review of key investment and financial data and theCompany’s corporate governance and risk control arrangements.
The Board has procedures in place to deal with potential conflicts ofinterest and, following the introduction of The Bribery Act 2010, hasadopted appropriate procedures designed to prevent bribery.
Global Growth & Income_pp22_35 19/09/2017 12:29 Page 26
27
It confirms that the procedures have operated effectively during theyear under review.
The Board meets at least quarterly during the year and additionalmeetings are arranged as necessary. Full and timely information isprovided to the Board to enable it to function effectively and toallow Directors to discharge their responsibilities.
There is an agreed procedure for Directors to take independentprofessional advice if necessary and at the Company’s expense.This is in addition to the access that every Director has to the adviceand services of the Company Secretary, which is responsible to theBoard for ensuring that Board procedures are followed and thatapplicable rules and regulations are complied with.
Board Composition The Board, chaired by Nigel Wightman, consists of fournon-executive Directors, all of whom are regarded by the Board asindependent, including the Chairman. The Directors have a breadthof investment knowledge, business and financial skills andexperience relevant to the Company’s business and briefbiographical details of each Director are set out on pages 22 and 23.There have been no changes to the Chairman’s other significantcommitments during the year under review.
A review of Board composition and balance is included as part ofthe annual performance evaluation of the Board, details of whichmay be found below. Gay Collins, as the Senior IndependentDirector, leads the evaluation of the performance of the Chairmanand he is available to shareholders if they have concerns thatcannot be resolved through discussion with the Chairman.
Tenure Directors are initially appointed until the following Annual GeneralMeeting when, under the Company’s Articles of Association, it isrequired that they be elected by shareholders. Thereafter,a Director’s appointment is subject to the performance evaluationcarried out each year and the approval of shareholders at eachannual general meeting, in accordance with corporate governancebest practice. The Board does not believe that length of service initself necessarily disqualifies a Director from seeking re-electionbut, when making a recommendation, the Board will take intoaccount the requirements of the UK Corporate Governance Code,including the need to refresh the Board and its Committees.The Board has adopted corporate governance best practice and allDirectors will stand for annual re-election.
The terms and conditions of Directors’ appointments are set out informal letters of appointment, copies of which are available for
inspection on request at the Company’s registered office and at theAnnual General Meeting.
Induction and TrainingOn appointment, the Manager and Company Secretary provide allDirectors with induction training. Thereafter, regular briefings areprovided on changes in law and regulatory requirements that affectthe Company and the Directors. Directors are encouraged to attendindustry and other seminars covering issues and developmentsrelevant to investment trust companies. Regular reviews of theDirectors’ training needs are carried out by the Chairman by meansof the evaluation process described below.
Meetings and Committees The Board delegates certain responsibilities and functions tocommittees. Details of membership of Committees are shown withthe Directors’ profiles on pages 22 and 23. Directors who are notmembers of Committees may attend at the invitation of theChairman.
The table below details the number of Board and Committeemeetings attended by each Director. During the year, there werefour full Board meetings, two Audit and Management EngagementCommittee meetings, one Nomination Committee meeting and oneRemuneration Committee meeting.
Meetings AttendedAudit and
ManagementEngagement Nomination
Board Committee CommitteeMeetings Meetings Meetings Remuneration
Director Attended Attended Attended Committee
Nigel Wightman1 4 2 1 1Jonathan Carey 4 2 1 1Gay Collins 4 2 1 1Tristan Hillgarth 4 2 1 1
1 Nigel Wightman attends the Audit and Management Engagement Committeemeetings by invitation.
Board Committees Nomination Committee The Nomination Committee, chaired by Nigel Wightman, consists ofall of the Directors and meets at least annually to ensure that theBoard has an appropriate balance of skills and experience to carryout its fiduciary duties and to select and propose suitablecandidates for appointment when necessary. A variety of sources,
Global Growth & Income_pp22_35 19/09/2017 12:29 Page 27
28 JPMORGAN GLOBAL GROWTH & INCOME PLC. ANNUAL REPORT & FINANCIAL STATEMENTS 2017
Directors’ Report continued
DIRECTORS’ REPORT CONTINUED
including the use of external search consultants, may be used toensure that a wide range of candidates is considered.
The appointment process takes account of the benefits of diversity,including gender.
The Board’s policy on diversity, including gender, is to take accountof the benefits of these during the appointment process. However,the Board remains committed to appointing the most appropriatecandidate, regardless of gender or other forms of diversity.Therefore, no targets have been set against which to report.
The Committee conducts an annual performance evaluation of theBoard, its committees and individual Directors to ensure that allDirectors have devoted sufficient time and contributed adequatelyto the work of the Board and its Committees. The evaluation of theBoard considers the balance of experience, skills, independence,corporate knowledge, its diversity, including gender, and how itworks together. Questionnaires, drawn up by the Board, with theassistance of the Manager and a firm of independent consultants,are completed by each Director. The responses are collated andthen discussed by the Committee. The evaluation of individualDirectors is led by the Chairman. The Senior Independent Directorleads the evaluation of the Chairman’s performance.
Remuneration Committee The Remuneration Committee, chaired by Jonathan Carey, consistsof all of the Directors and meets at least annually to reviewDirectors’ fees and to make recommendations to the Board as andwhen appropriate in relation to remuneration policy.
Audit and Management Engagement CommitteeThe report of the Audit and Management Engagement Committee isset out on page 31.
Terms of Reference The Audit and Management Engagement Committee, the NominationCommittee and the Remuneration Committee all have written terms ofreference which define clearly their respective responsibilities, copiesof which are available on the Company’s website, on request at theCompany’s registered office and at the Company’s Annual GeneralMeeting.
Going Concern The Directors believe that having considered the Company’sinvestment objective (see page 17), risk management policies(see pages 55 to 61), capital management policies and procedures(see page 61), the nature of the portfolio and expenditureprojections that the Company has adequate resources, anappropriate financial structure and suitable managementarrangements in place to continue in operational existence for theforeseeable future. For these reasons, they consider that there is
reasonable evidence to continue to adopt the going concern basis inpreparing the financial statements. They have not identified anymaterial uncertainties to the Company’s ability to continue to do soover a period of at least 12 months from the date of approval ofthese financial statements.
Relations with Shareholders The Board regularly monitors the shareholder profile of theCompany. It aims to provide shareholders with a full understandingof the Company’s activities and performance and reports formally toshareholders by way of the annual report and financial statementsand the half year financial report. This is supplemented by the dailypublication, through the London Stock Exchange and the NewZealand Stock Exchange, of the net asset value of the Company’sshares.
All shareholders are encouraged to attend the Company’s AnnualGeneral Meeting at which the Directors and representatives of theManager are available in person to meet shareholders and answertheir questions. In addition, a presentation is given by theInvestment Manager who reviews the Company’s performance.During the year the Company’s brokers, the Investment Managerand the Manager hold regular discussions with larger shareholders.The Directors are made fully aware of their views. The Chairmanand Directors make themselves available as and when required toaddress shareholder queries. The Directors may be contactedthrough the Company Secretary whose details are shown on page 71or via the ‘Ask a Question’ link on the Company’s website.
The Company’s annual report and financial statements is publishedin time to give shareholders at least 20 working days’ notice of theAnnual General Meeting. Shareholders wishing to raise questions inadvance of the meeting are encouraged to write to the CompanySecretary at the address shown on page 71 or via the ‘Aska Question’ link on the Company’s website.
Details of the proxy voting position on each resolution will bepublished on the Company’s website shortly after the AnnualGeneral Meeting.
Risk Management and Internal ControlThe UK Corporate Governance Code requires the Directors, at leastannually, to review the effectiveness of the Company’s system ofrisk management and internal control and to report to shareholdersthat they have done so. This encompasses a review of all controls,which the Board has identified as including business, financial,operational, compliance and risk management.
The Directors are responsible for the Company’s system of riskmanagement and internal control which is designed to safeguardthe Company’s assets, maintain proper accounting records and
Global Growth & Income_pp22_35 19/09/2017 12:29 Page 28
29
ensure that financial information used within the business, orpublished, is reliable. However, such a system can only be designedto manage rather than eliminate the risk of failure to achievebusiness objectives and therefore can only provide reasonable, butnot absolute, assurance against fraud, material misstatement orloss.
Since investment management, custody of assets and alladministrative services are provided to the Company by theManager and its associates, the Company’s system of riskmanagement and internal control mainly comprises monitoring theservices provided by the Manager and its associates, including theoperating controls established by them, to ensure that they meetthe Company’s business objectives. There is an ongoing process foridentifying, evaluating and managing the significant risks faced bythe Company (see Principal Risks on pages 19 and 20). This processhas been in place for the year under review and up to the date ofapproval of the annual report and financial statements, and itaccords with the Turnbull guidance. Whilst the Company does nothave an internal audit function of its own, the Board considers thatit is sufficient to rely on the internal audit department of theManager. This arrangement is kept under review.
The key elements designed to provide effective internal control areas follows:
Financial Reporting – Regular and comprehensive review by theBoard of key investment and financial data, including managementaccounts, revenue projections, analysis of transactions andperformance comparisons.
Management Agreement – Appointment of a manager andcustodian or depositary regulated by the Financial ConductAuthority (FCA), whose responsibilities are clearly defined ina written agreement.
Management Systems – The Manager’s system of risk managementand internal control includes organisational agreements whichclearly define the lines of responsibility, delegated authority, controlprocedures and systems. These are monitored by the Manager’sCompliance department which regularly monitors compliance withFCA rules.
Investment Strategy – Authorisation and monitoring of theCompany’s investment strategy and exposure limits by the Board.
The Board either directly or through the Audit and ManagementEngagement Committee, keeps under review the effectiveness ofthe Company’s system of risk management and internal control bymonitoring the operation of the key operating controls of theManager and its associates as follows:
• reviews the terms of the management agreement and receivesregular reports from the Manager’s Compliance department;
• reviews the reports on the risk management and internal controlsand the operations of its custodian, JPMorgan Chase Bank, whichis itself independently reviewed; and
• reviews every six months an independent report on the riskmanagement and internal controls and the operations of theManager.
By the means of the procedures set out above, the Board confirmsthat it has reviewed the effectiveness of the Company’s system ofrisk management and internal control for the year ended 30th June2017, and to the date of approval of this annual report and financialstatements.
The Board confirms that any failings or weaknesses identifiedduring the course of its review of the system of risk managementand internal control were not significant and did not impact theCompany.
Corporate Governance and Voting Policy The Company delegates responsibility for voting to JPMAM throughthe Manager. The following is a summary of the JPMAM’s policystatements on corporate governance, voting policy and social andenvironmental issues, which has been reviewed and noted by theBoard. Details on social and environmental issues are included inthe Strategic Report on page 19.
New Zealand Listing The Company is listed on the London Stock Exchange and the NewZealand Stock Exchange. The corporate governance rules andprinciples of the UK Listing Authority and London Stock Exchangemay differ materially from the New Zealand Stock Exchange’scorporate governance rules and the principles of the CorporateGovernance Best Practice Code. Investors may find out moreinformation about the corporate governance and principlesapplicable in the United Kingdom for the UK Listing Authority andLondon Stock Exchange websites:www.fca.org.uk/firms/markets/ukla andwww.londonstockexchange.com
Corporate Governance JPMAM believes that corporate governance is integral to ourinvestment process. As part of our commitment to delivering superiorinvestment performance to our clients, we expect and encourage thecompanies in which we invest to demonstrate the highest standardsof corporate governance and best business practice. We examine theshare structure and voting structure of the companies in which weinvest, as well as the board balance, oversight functions andremuneration policy. These analyses then form the basis of ourproxy voting and engagement activity.
Global Growth & Income_pp22_35 19/09/2017 12:29 Page 29
30 JPMORGAN GLOBAL GROWTH & INCOME PLC. ANNUAL REPORT & FINANCIAL STATEMENTS 2017
Directors’ Report continued
Proxy Voting The Manager manages the voting rights of the shares entrusted to itas it would manage any other asset. It is the policy of JPMAM to votein a prudent and diligent manner, based exclusively on our reasonablejudgement of what will best serve the financial interests of our clients.So far as is practicable, we will vote at all of the meetings called bycompanies in which we are invested.
Stewardship/EngagementJPMAM recognises its wider stewardship responsibilities to its clientsas a major asset owner. To this end, we support the introduction of theFRC Stewardship Code, which sets out the responsibilities ofinstitutional shareholders in respect of investee companies. Under theCode, managers should:
– publicly disclose their policy on how they will discharge theirstewardship responsibilities to their clients;
– disclose their policy on managing conflicts of interest;
– monitor their investee companies;
– establish clear guidelines on how they escalate engagement;
– be willing to act collectively with other investors whereappropriate;
– have a clear policy on proxy voting and disclose their votingrecord; and
– report to clients.
JPMAM endorses the Stewardship Code for its UK investments andsupports the principles as best practice elsewhere. We believe thatregular contact with the companies in which we invest is central to ourinvestment process and we also recognise the importance of being an‘active’ owner on behalf of our clients.
Social & EnvironmentalJPMAM’s Voting Policy and Corporate Governance Guidelines areavailable on request from the Company Secretary or can bedownloaded from The JPMAM’s website:http://www.jpmorganinvestmenttrusts.co.uk/governance, whichalso sets out its approach to the seven principles of the FRCStewardship Code, its policy relating to conflicts of interest andits detailed voting record.
By order of the Board Divya Amin for and on behalf of JPMorgan Funds Limited, Secretary
19th September 2017
DIRECTORS’ REPORT CONTINUED
Global Growth & Income_pp22_35 19/09/2017 12:29 Page 30
31
The Audit and Management Engagement Committee is chaired byJonathan Carey. The membership is set out on pages 22 and 23, andthe committee meets at least twice each year. The members of theAudit and Management Engagement Committee consider that theyhave the requisite skills and experience to fulfil the responsibilitiesof the Committee. For details of their qualifications, see pages 22and 23.
The Committee reviews the actions and judgements of the Managerin relation to the half year and annual report and financialstatements and the Company’s compliance with the UK CorporateGovernance Code.
During its review of the Company’s financial statements for the yearended 30th June 2017, the Audit Committee considered thefollowing significant issues, including those communicated by theAuditors during their reporting:
Significant issue How the issue was addressed
The valuation of investments is undertaken inaccordance with the accounting policies, disclosedin note 1 to the financial statements on page 44.Controls are in place to ensure that valuations areappropriate and existence is verified throughCustodian reconciliations. The Board monitorssignificant movements in the underlying portfolio.
Consideration is given to the methodology used tocalculate fees, matched against the criteria set outin the Investment Management Agreement. TheBoard considers the schedule of performance feesat each Board meeting.
Approval for the Company as an investment trustunder Sections 1158 and 1159 for financial yearscommencing on or after 1st July 2012 has beenobtained and ongoing compliance with the eligibilitycriteria is monitored by the Board on a regularbasis.
The recognition of investment income is undertakenin accordance with accounting policy note 1(d) to thefinancial statements on page 44. The Board reviewselements of income such as special dividends andagrees their accounting treatment.
The Board was made fully aware of any significant financialreporting issues and judgements made in connection with thepreparation of the financial statements.
Having taken all available information into consideration and havingdiscussed the content of the annual report and financial statementswith the AIFM, the Investment Manager, the Company Secretary andother third party service providers, the Committee has concluded
that the Annual Report for the year ended 30th June 2017, taken asa whole, is fair, balanced and understandable and provides theinformation necessary for shareholders to assess the Company’sposition and performance, business model and strategy, and hasreported on these findings to the Board. The Board’s conclusions inthis respect are set out in the Statement of Directors’ Responsibilitieson page 35.
The Committee assesses the Company’s ability to continue asa going concern and makes recommendations to the board toapprove the going concern concept for preparation of the financialstatements. The Directors’ Statement on Going Concern is set out onpage 28.
The Committee reviews the terms of the management agreementand examines the effectiveness of the Company’s internal controlsystems, receives information from the Manager’s Compliancedepartment and reviews the scope and results of the external audit,its effectiveness and cost effectiveness and the independence andobjectivity of the external auditors including the provision ofnon-audit services and the period of service held by the auditengagement partner. The Company’s year ended 30th June 2017 isthe current audit partner’s third of a five year maximum term. TheCommittee has reviewed the independence and objectivity of theauditors of the Company and is satisfied that the auditors areindependent. The Committee also has the primary responsibility formaking recommendations to the Board on the reappointment andthe removal of external auditors. The Committee also receivesconfirmations from the Auditors, as part of their reporting, inregard to their objectivity and independence. Representatives of theCompany’s auditors attend the Audit and Management EngagementCommittee meeting at which the draft annual report and financialstatements are considered. Having reviewed the performance of theexternal auditors including assessing the quality of work, timing ofcommunications and work with the Manager, the Committeeconsidered it appropriate to recommend their reappointment andthe Board supported this recommendation which will be put to theShareholders at this year’s Annual General Meeting. The Committeeis aware that, as PwC has been the audit firm for over 50 years, theEU regulations in relation to the statutory audits of EU listedcompanies will likely require the Company to change its audit firmby 2020. Details of the auditors’ fees charged for audit services aredisclosed in note 6 on page 47.
By order of the Board Jonathan CareyChairman of the Audit Committee
19th September 2017
Valuation, existenceand ownership ofinvestments
Calculation ofmanagement andperformance fees
Compliance withSections 1158 and1159
Recognition ofinvestment income
AUDIT AND MANAGEMENT ENGAGEMENT COMMITTEE REPORT
Global Growth & Income_pp22_35 19/09/2017 12:29 Page 31
32 JPMORGAN GLOBAL GROWTH & INCOME PLC. ANNUAL REPORT & FINANCIAL STATEMENTS 2017
Directors’ Remuneration Report
The Board has prepared this report in accordance with therequirements of Section 421 of the Companies Act 2006 asamended.
The law requires the Company’s Auditors to audit certain of thedisclosures provided. Where disclosures have been audited, they areindicated as such. The Auditors’ opinion is included in their reporton pages 36 to 40.
Remuneration of the Directors is considered by the Nomination andRemuneration Committee on a regular basis. The Committee makesrecommendations to the Board as and when appropriate.
Directors’ Remuneration Policy The Directors’ Remuneration Policy is subject to a triennial bindingvote, however, a decision has been taken to seek approval annually,and therefore an ordinary resolution to approve this policy will beput to shareholders at the forthcoming Annual General Meeting.The policy subject to the vote, is set out in full below and iscurrently in force.
The Board’s policy for this and subsequent years is that Directors’fees should properly reflect the time spent by the Directors on theCompany’s business and should be at a level to ensure thatcandidates of a high calibre are recruited to the Board. TheChairman of the Board and the Chairman of the Audit andManagement Engagement Committee are paid higher fees than theother Directors, reflecting the greater time commitment involved infulfilling those roles.
The Remuneration Committee, comprising all Directors, reviews feeson a regular basis and makes recommendations to the Board as andwhen appropriate. Reviews are based on information provided bythe Manager and industry research on the level of fees paid to thedirectors of the Company’s peers and within the investment trustindustry generally. The involvement of remuneration consultantshas not been deemed necessary as part of this review. TheCompany has no Chief Executive Officer and no employees andtherefore, no consultation of employees is required and there is noemployee comparative data to provide in relation to the setting ofthe remuneration policy for Directors.
All of the Directors are non-executive. There are no performance-related elements to their fees and the Company does not operateany type of incentive, share scheme, award or pension scheme andtherefore no Directors receive bonus payments or pensioncontributions from the Company or hold options to acquire sharesin the Company. Directors are not granted exit payments and are
not provided with compensation for loss of office. No otherpayments are made to Directors, other than the reimbursementof reasonable out-of-pocket expenses incurred in attending theCompany’s business.
In the year under review, Directors’ fees were paid at the followingrates: Chairman £37,500 per annum; Chairman of the Audit andManagement Engagement Committee £30,000 per annum; and, theother Directors £26,000 per annum. With effect from 1st July 2017,the fees have been increased to the following rates: Chairman£39,000; Chairman of the Audit Committee £31,500; and, otherDirectors £27,500.
The total Directors’ fees of £119,500 (2016: £122,116) were all paid toDirectors.
No amounts (2016: nil) were paid to third parties for makingavailable the services of Directors.
The Company’s Articles of Association stipulate that aggregate feesmust not exceed £150,000 per annum. Any increase in this themaximum aggregate amount requires both Board and shareholderapproval.
The Company has not sought shareholder views on its remunerationpolicy. The Nomination and Remuneration Committee considers anycomments received from shareholders on remuneration policy onan ongoing basis and will take account of these views if appropriate.
The Directors do not have service contracts with the Company. Theterms and conditions of Directors’ appointments are set out informal letters of appointment which are available for review at theCompany’s Annual General Meeting and the Company’s registeredoffice. Details of the Board’s policy on tenure are set out on page 27.
The Company’s Remuneration policy also applies to new Directors.
Directors’ Remuneration Policy ImplementationThe Directors’ Remuneration Policy Report is subject to an annualadvisory vote and therefore an ordinary resolution to approve thisreport will be put to shareholders at the forthcoming AnnualGeneral Meeting. There have been no changes to the policycompared with the year ended 30th June 2016 and no changes areproposed for the year ending 30th June 2018.
At the Annual General Meeting held on 1st November 2016, out ofvotes cast, 99.5% of votes cast were in favour of (or granteddiscretion to the Chairman who voted in favour of) the Resolutionsto approve the Directors’ Remuneration Policy and the Directors’
Global Growth & Income_pp22_35 19/09/2017 12:29 Page 32
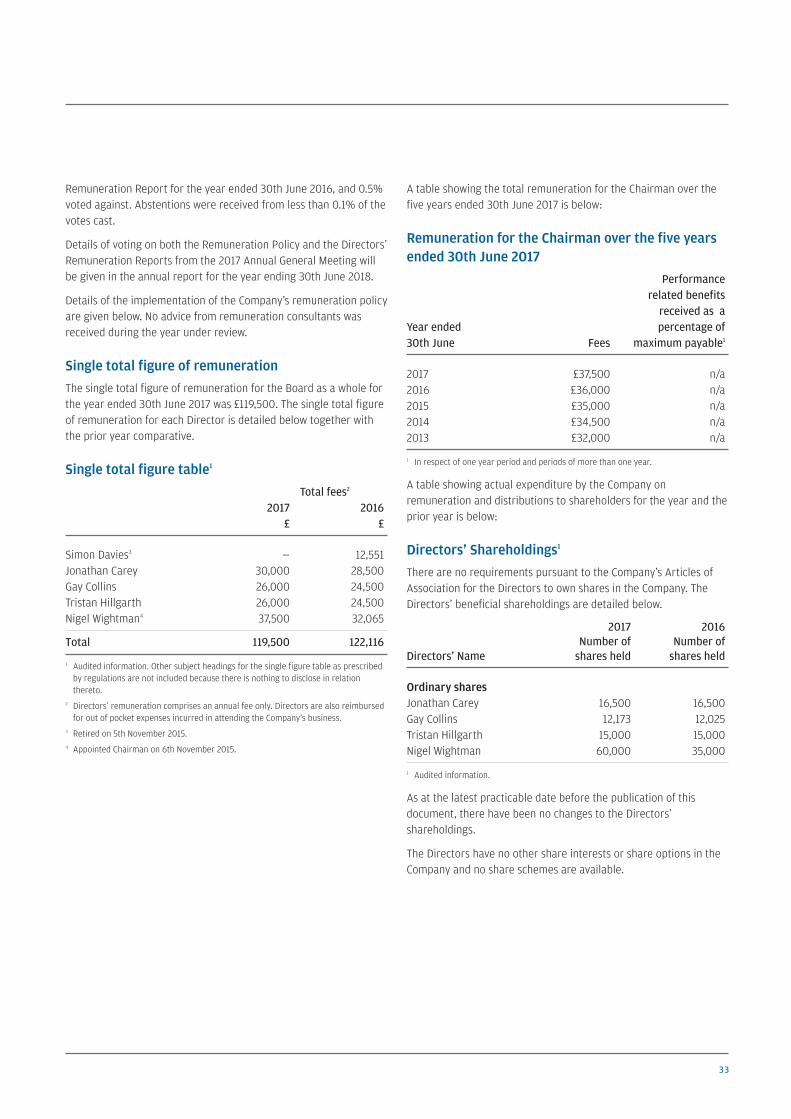
33
Remuneration Report for the year ended 30th June 2016, and 0.5%voted against. Abstentions were received from less than 0.1% of thevotes cast.
Details of voting on both the Remuneration Policy and the Directors’Remuneration Reports from the 2017 Annual General Meeting willbe given in the annual report for the year ending 30th June 2018.
Details of the implementation of the Company’s remuneration policyare given below. No advice from remuneration consultants wasreceived during the year under review.
Single total figure of remunerationThe single total figure of remuneration for the Board as a whole forthe year ended 30th June 2017 was £119,500. The single total figureof remuneration for each Director is detailed below together withthe prior year comparative.
Single total figure table1
Total fees2
2017 2016£ £
Simon Davies3 — 12,551Jonathan Carey 30,000 28,500Gay Collins 26,000 24,500Tristan Hillgarth 26,000 24,500Nigel Wightman4 37,500 32,065
Total 119,500 122,116
1 Audited information. Other subject headings for the single figure table as prescribedby regulations are not included because there is nothing to disclose in relationthereto.
2 Directors’ remuneration comprises an annual fee only. Directors are also reimbursedfor out of pocket expenses incurred in attending the Company’s business.
3 Retired on 5th November 2015.4 Appointed Chairman on 6th November 2015.
A table showing the total remuneration for the Chairman over thefive years ended 30th June 2017 is below:
Remuneration for the Chairman over the five yearsended 30th June 2017
Performancerelated benefits received as a
Year ended percentage of 30th June Fees maximum payable1
2017 £37,500 n/a2016 £36,000 n/a2015 £35,000 n/a2014 £34,500 n/a2013 £32,000 n/a
1 In respect of one year period and periods of more than one year.
A table showing actual expenditure by the Company onremuneration and distributions to shareholders for the year and theprior year is below:
Directors’ Shareholdings1
There are no requirements pursuant to the Company’s Articles ofAssociation for the Directors to own shares in the Company. TheDirectors’ beneficial shareholdings are detailed below.
2017 2016Number of Number of
Directors’ Name shares held shares held
Ordinary sharesJonathan Carey 16,500 16,500Gay Collins 12,173 12,025Tristan Hillgarth 15,000 15,000Nigel Wightman 60,000 35,000
1 Audited information.
As at the latest practicable date before the publication of thisdocument, there have been no changes to the Directors’shareholdings.
The Directors have no other share interests or share options in theCompany and no share schemes are available.
Global Growth & Income_pp22_35 19/09/2017 12:29 Page 33
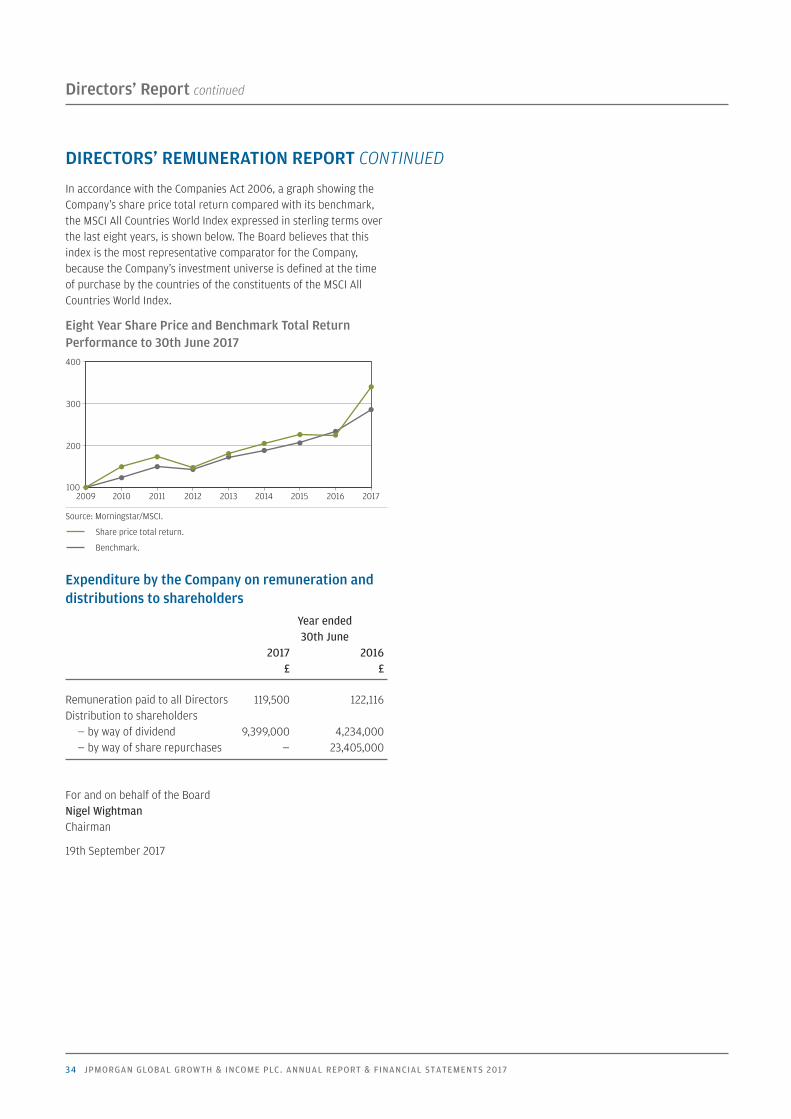
34 JPMORGAN GLOBAL GROWTH & INCOME PLC. ANNUAL REPORT & FINANCIAL STATEMENTS 2017
Directors’ Report continued
In accordance with the Companies Act 2006, a graph showing theCompany’s share price total return compared with its benchmark,the MSCI All Countries World Index expressed in sterling terms overthe last eight years, is shown below. The Board believes that thisindex is the most representative comparator for the Company,because the Company’s investment universe is defined at the timeof purchase by the countries of the constituents of the MSCI AllCountries World Index.
Eight Year Share Price and Benchmark Total ReturnPerformance to 30th June 2017
Source: Morningstar/MSCI.
Share price total return.
Benchmark.
Expenditure by the Company on remuneration anddistributions to shareholders
Year ended 30th June
2017 2016£ £
Remuneration paid to all Directors 119,500 122,116Distribution to shareholders— by way of dividend 9,399,000 4,234,000— by way of share repurchases — 23,405,000
For and on behalf of the Board Nigel WightmanChairman
19th September 2017
100
200
300
400
201720162015201420132012201120102009
DIRECTORS’ REMUNERATION REPORT CONTINUED
Global Growth & Income_pp22_35 19/09/2017 12:29 Page 34
35
The Directors are responsible for preparing the annual report andthe financial statements in accordance with applicable law andregulations.
Company law requires the Directors to prepare financial statementsfor each financial year. Under that law, the Directors have elected toprepare the financial statements in accordance with UnitedKingdom Generally Accepted Accounting Practice (United KingdomAccounting Standards and applicable law). Under Company law theDirectors must not approve the financial statements unless they aresatisfied that, taken as a whole, the annual report and financialstatements are fair, balanced and understandable, provide theinformation necessary for shareholders to assess the Company’sperformance, business model and strategy and that they give a trueand fair view of the state of affairs of the Company and of the totalreturn or loss of the Company for that period. In order to providethese confirmations, and in preparing these financial statements,the Directors are required to:
• select suitable accounting policies and then apply themconsistently;
• make judgements and estimates that are reasonable andprudent;
• state whether applicable UK Accounting Standards have beenfollowed, subject to any material departures disclosed andexplained in the financial statements; and
• prepare the financial statements on the going concern basisunless it is inappropriate to presume that the Company willcontinue in business.
The Directors confirm that they have done so.
The Directors are responsible for keeping proper accountingrecords that are sufficient to show and explain the Company’stransactions and disclose with reasonable accuracy at any time thefinancial position of the Company and to enable them to ensure thatthe financial statements comply with the Companies Act 2006. Theyare also responsible for safeguarding the assets of the Companyand hence for taking reasonable steps for the prevention anddetection of fraud and other irregularities.
The financial statements are published on thewww.jpmglobalgrowthandincome.co.uk website, which ismaintained by the Company’s Manager. The maintenance andintegrity of the website maintained by the Manager is, so far as itrelates to the Company, the responsibility of the Manager. The workcarried out by the auditors does not involve consideration of themaintenance and integrity of this website and, accordingly, theauditor accepts no responsibility for any changes that haveoccurred to the financial statements since they were initiallypresented on the website. The financial statements are prepared inaccordance with UK legislation, which may differ from legislation inother jurisdictions.
Under applicable law and regulations the Directors are alsoresponsible for preparing a Directors’ Report, Strategic Report andDirectors’ Remuneration Report that comply with that law and thoseregulations.
Each of the Directors, whose names and functions are listed onpages 22 and 23 confirm that, to the best of their knowledge:
• the financial statements, which have been prepared inaccordance with United Kingdom Generally Accepted AccountingPractice (United Kingdom Accounting Standards and applicablelaw), give a true and fair view of the assets, liabilities, financialposition and return or loss of the Company; and
• the Strategic Report includes a fair review of the developmentand performance of the business and the position of theCompany, together with a description of the principal risks anduncertainties that it faces.
The Board confirms that it is satisfied that the annual report andfinancial statements taken as a whole is fair, balanced andunderstandable and provides the information necessary forshareholders to assess the Company’s position and performance,business model and strategy.
For and on behalf of the Board Nigel WightmanChairman
19th September 2017
Statement of Directors’ Responsibilities
Global Growth & Income_pp22_35 19/09/2017 12:29 Page 35
36 JPMORGAN GLOBAL GROWTH & INCOME PLC. ANNUAL REPORT & FINANCIAL STATEMENTS 2017
Report on the audit of the financial statementsOpinionIn our opinion, JPMorgan Global Growth & Income plc’s financial statements:
• give a true and fair view of the state of the Company’s affairs as at 30th June 2017 and of its profit for the year then ended;
• have been properly prepared in accordance with United Kingdom Generally Accepted Accounting Practice (United Kingdom AccountingStandards, comprising FRS 102 ‘The Financial Reporting Standard applicable in the UK and Republic of Ireland’, and applicable law); and
• have been prepared in accordance with the requirements of the Companies Act 2006.
We have audited the financial statements, included within the Annual Report & Financial Statements (the ‘Annual Report’), which comprise:the statement of financial position, the statement of comprehensive income and the statement of changes in equity; and the notes to thefinancial statements, which include a description of the significant accounting policies.
Our opinion is consistent with our reporting to the Audit Committee.
Basis for opinionand applicable law. Our responsibilities under ISAs (UK) are further described in the Auditors’ responsibilities for the audit of the financialstatements section of our report. We believe that the audit evidence we have obtained is sufficient and appropriate to provide a basis for ouropinion.
IndependenceWe remained independent of the Company in accordance with the ethical requirements that are relevant to our audit of the financialstatements in the UK, which includes the FRC’s Ethical Standard as applicable to listed public interest entities, and we have fulfilled ourother ethical responsibilities in accordance with these requirements.
To the best of our knowledge and belief, we declare that non-audit services prohibited by the FRC’s Ethical Standard were not provided tothe Company.
We have provided no non-audit services to the Company in the period from 1st July 2016 to 30th June 2017.
Our audit approach
Overview
• £3.75 million (2016: £3.0 million) which represents 1% of net assets.
• The Company is an Investment Trust Company and engages JPMorgan Funds Limited (the ‘Manager’) tomanage its assets.
• We conducted our audit of the financial statements from information provided by JPMorgan Corporate &Investment Bank (the ‘Administrator’) to whom the Manager has, with the consent of the directors,delegated the provision of certain administrative functions.
• We tailored the scope of our audit taking into account the types of investments within the Company, theinvolvement of the third parties referred to above, the accounting processes and controls, and the industryin which the Company operates.
• Income.• Valuation and existence of investments.
The scope of our auditAs part of designing our audit, we determined materiality and assessed the risks of material misstatement in the financial statements. Inparticular, we looked at where the Directors made subjective judgements, for example in respect of significant accounting estimates thatinvolved making assumptions and considering future events that are inherently uncertain. As in all of our audits we also addressed the riskof management override of internal controls, including evaluating whether there was evidence of bias by the Directors that representeda risk of material misstatement due to fraud.
Materiality
Audit scope
Areas offocus
TO THE MEMBERS OF JPMORGAN GLOBAL GROWTH & INCOME PLC
Independent Auditors’ Report
Global Growth & Income_pp36_43 19/09/2017 12:29 Page 36
37
Key audit mattersKey audit matters are those matters that, in the auditors’ professional judgement, were of most significance in the audit of the financialstatements of the current period and include the most significant assessed risks of material misstatement (whether or not due to fraud)identified by the auditors, including those which had the greatest effect on: the overall audit strategy; the allocation of resources in theaudit; and directing the efforts of the engagement team. These matters, and any comments we make on the results of our proceduresthereon, were addressed in the context of our audit of the financial statements as a whole, and in forming our opinion thereon, and we donot provide a separate opinion on these matters. This is not a complete list of all risks identified by our audit.
Area of focus How our audit addressed the area of focus
IncomeWe focused on the accuracy and completeness of dividend incomerecognition and its presentation in the Statement of ComprehensiveIncome as set out in the requirements of The Association ofInvestment Companies Statement of Recommended Practice (the‘AIC SORP’). This is because incomplete or inaccurate income couldhave material impact on the company’s net assets value.
We also focused on the accuracy and occurrence of realised andunrealised gains or losses on the investment portfolio.
We assessed the accounting policy for income recognition forcompliance with accounting standards and the AIC SORP andperformed testing to check that income had been accounted for inaccordance with this stated accounting policy.
We found that the accounting policies implemented were inaccordance with accounting standards and the AIC SORP, and thatincome has been accounted for in accordance with the statedaccounting policy.
In addition, we tested dividend income by agreeing the dividendrates from investments to independent third party sources. Nomisstatements were identified which required reporting to thosecharged with governance.
To test for completeness, we checked that the appropriate dividendshad been received in the year by reference to independent data ofdividends declared for a sample of investment holdings in theportfolio. Our testing did not identify any unrecorded dividends.
We tested the allocation and presentation of dividend incomebetween the revenue and capital return columns of the Statementof Comprehensive Income in line with the requirements set out inthe AIC SORP. We then tested the validity of revenue and capitalspecial dividends to independent third party sources. We did notfind any special dividends that were not treated in accordance withthe AIC SORP.
We also checked that the gains or losses on investments held at fairvalue comprise realised and unrealised gains or losses. For realisedgains or losses, we tested a sample of disposal proceeds to bankstatements. For unrealised gains or losses, we tested the valuationof the portfolio at the year-end, and also tested the reconciliation ofopening and closing investments. No misstatements were identifiedby our testing.
Valuation and existence of investmentsThe investment portfolio at the year-end principally comprised oflisted equity investments.
We focused on the valuation and existence of investments becauseinvestments represent the principal element of the net asset valueas disclosed on the Statement of Financial Position in the financialstatements.
We tested the valuation of the listed investment portfolio by agreeingthe prices used in the valuation to independent third party sources.
No misstatements were identified by our testing which requiredreporting to those charged with governance.
We tested the existence of the investment portfolio by agreeing theholdings for investments to an independent custodian confirmationfrom JPMorgan Chase Bank, N.A.
No misstatements were identified by our testing which requiredreporting to those charged with governance.
Global Growth & Income_pp36_43 19/09/2017 12:29 Page 37
38 JPMORGAN GLOBAL GROWTH & INCOME PLC. ANNUAL REPORT & FINANCIAL STATEMENTS 2017
Independent Auditors’ Report continued
How we tailored the audit scope We tailored the scope of our audit to ensure that we performed enough work to be able to give an opinion on the financial statements asa whole, taking into account the structure of the Company, the accounting processes and controls, and the industry in which it operates.
We tailored the scope of our audit to ensure that we performed enough work to be able to give an opinion on the financial statements asa whole, taking into account the geographic structure of the Company, the accounting processes and controls, and the industry in which theCompany operates.
The Company’s accounting is delegated to the Administrator who maintain their own accounting records and controls and report to theManager and the Directors.
As part of our risk assessment, we assessed the control environment in place at both the Manager and the Administrator to the extentrelevant to our audit. This assessment of the operating and accounting structure in place at both organisations involved obtaining andreading the relevant control reports issued by the service auditor of the Administrator in accordance with generally accepted assurancestandards for such work. We then identified those key controls at the Administrator on which we could place reliance to provide auditevidence. We also assessed the gap period of three months between the period covered by the controls report and the year-end of theCompany. Following this assessment, we applied professional judgement to determine the extent of testing required over each balance inthe financial statements, including whether we needed to perform additional testing in respect of those key controls to support oursubstantive work. For the purposes of our audit, we determined that additional testing of controls in place at the Administrator was notrequired because additional substantive testing was performed.
MaterialityThe scope of our audit was influenced by our application of materiality. We set certain quantitative thresholds for materiality. These,together with qualitative considerations, helped us to determine the scope of our audit and the nature, timing and extent of our auditprocedures on the individual financial statement line items and disclosures and in evaluating the effect of misstatements, both individuallyand in aggregate on the financial statements as a whole.
Based on our professional judgement, we determined materiality for the financial statements as a whole as follows:
Overall materiality £3.75 million (2016: £3.0 million).
How we determined it 1% of net assets.
We have applied this benchmark, a generally accepted auditing practice for investment trust audits, in theabsence of indicators that an alternative benchmark would be appropriate and because we believe this providesan appropriate and consistent year-on-year basis for our audit.
We agreed with the Audit Committee that we would report to them misstatements identified during our audit above £187,638 (2016:£150,077) as well as misstatements below that amount that, in our view, warranted reporting for qualitative reasons.
Going concernIn accordance with ISAs (UK) we report as follows:
Reporting obligation Outcome
We are required to report if we have anything material to add or draw attention to in respect of theDirectors’ statement in the financial statements about whether the Directors considered it appropriateto adopt the going concern basis of accounting in preparing the financial statements and the Directors’identification of any material uncertainties to the Company’s ability to continue as a going concern overa period of at least twelve months from the date of approval of the financial statements.
We are required to report if the Directors’ statement relating to Going Concern in accordance withListing Rule 9.8.6R(3) is materially inconsistent with our knowledge obtained in the audit.
Rationale for benchmark applied
We have nothing material to addor to draw attention to.However, because not all futureevents or conditions can bepredicted, this statement is nota guarantee as to the company’sability to continue as a goingconcern.
We have nothing to report.
Global Growth & Income_pp36_43 19/09/2017 12:29 Page 38
39
Reporting on other information The other information comprises all of the information in the Annual Report other than the financial statements and our auditors’ report thereon.The Directors are responsible for the other information. Our opinion on the financial statements does not cover the other information and,accordingly, we do not express an audit opinion or, except to the extent otherwise explicitly stated in this report, any form of assurance thereon.
In connection with our audit of the financial statements, our responsibility is to read the other information and, in doing so, considerwhether the other information is materially inconsistent with the financial statements or our knowledge obtained in the audit, or otherwiseappears to be materially misstated. If we identify an apparent material inconsistency or material misstatement, we are required to performprocedures to conclude whether there is a material misstatement of the financial statements or a material misstatement of the otherinformation. If, based on the work we have performed, we conclude that there is a material misstatement of this other information, we arerequired to report that fact. We have nothing to report based on these responsibilities.
With respect to the Strategic Report and Directors’ Report, we also considered whether the disclosures required by the UK CompaniesAct 2006 have been included.
Based on the responsibilities described above and our work undertaken in the course of the audit, the Companies Act 2006, (CA06), ISAs(UK) and the Listing Rules of the Financial Conduct Authority (FCA) require us also to report certain opinions and matters as described below(required by ISAs (UK) unless otherwise stated).
Strategic Report and Directors’ ReportIn our opinion, based on the work undertaken in the course of the audit, the information given in the Strategic Report and Directors’ Reportfor the year ended 30th June 2017 is consistent with the financial statements and has been prepared in accordance with applicable legalrequirements. (CA06)
In light of the knowledge and understanding of the Company and its environment obtained in the course of the audit, we did not identify anymaterial misstatements in the Strategic Report and Directors’ Report. (CA06)
The Directors’ assessment of the prospects of the Company and of the principal risks that would threaten the solvency or liquidity ofthe CompanyWe have nothing material to add or draw attention to regarding:
• The Directors’ confirmation on page 19 of the Annual Report that they have carried out a robust assessment of the principal risks facingthe Company, including those that would threaten its business model, future performance, solvency or liquidity.
• The disclosures in the Annual Report that describe those risks and explain how they are being managed or mitigated.
• The Directors’ explanation on pages 20 and 21 of the Annual Report as to how they have assessed the prospects of the Company, overwhat period they have done so and why they consider that period to be appropriate, and their statement as to whether they have areasonable expectation that the Company will be able to continue in operation and meet its liabilities as they fall due over the period oftheir assessment, including any related disclosures drawing attention to any necessary qualifications or assumptions.
We have nothing to report having performed a review of the Directors’ statement that they have carried out a robust assessment of the principalrisks facing the Company and statement in relation to the longer-term viability of the Company. Our review was substantially less in scope than anaudit and only consisted of making inquiries and considering the Directors’ process supporting their statements; checking that the statements arein alignment with the relevant provisions of the UK Corporate Governance Code (the ‘Code’); and considering whether the statements areconsistent with the knowledge and understanding of the Company and its environment obtained in the course of the audit. (Listing Rules)
Other Code ProvisionsWe have nothing to report in respect of our responsibility to report when:
• The statement given by the Directors, on page 31, that they consider the Annual Report taken as a whole to be fair, balanced andunderstandable, and provides the information necessary for the members to assess the Company’s position and performance, businessmodel and strategy is materially inconsistent with our knowledge of the Company obtained in the course of performing our audit.
• The section of the Annual Report on page 31 describing the work of the Audit and Management Engagement Committee does notappropriately address matters communicated by us to the Audit and Management Engagement Committee.
• The Directors’ statement relating to the Company’s compliance with the Code does not properly disclose a departure from a relevantprovision of the Code specified, under the Listing Rules, for review by the auditors.
Global Growth & Income_pp36_43 19/09/2017 12:29 Page 39
40 JPMORGAN GLOBAL GROWTH & INCOME PLC. ANNUAL REPORT & FINANCIAL STATEMENTS 2017
Directors’ RemunerationIn our opinion, the part of the Directors’ Remuneration Report to be audited has been properly prepared in accordance with the CompaniesAct 2006. (CA06)
Responsibilities for the financial statements and the auditResponsibilities of the directors for the financial statementsAs explained more fully in the Statement of Directors’ Responsibilities, the Directors are responsible for the preparation of the financialstatements in accordance with the applicable framework and for being satisfied that they give a true and fair view. The Directors are alsoresponsible for such internal control as they determine is necessary to enable the preparation of financial statements that are free frommaterial misstatement, whether due to fraud or error.
In preparing the financial statements, the Directors are responsible for assessing the Company’s ability to continue as a going concern,disclosing as applicable, matters related to going concern and using the going concern basis of accounting unless the Directors either intendto liquidate the Company or to cease operations, or have no realistic alternative but to do so.
Auditors’ responsibilities for the audit of the financial statementsOur objectives are to obtain reasonable assurance about whether the financial statements as a whole are free from material misstatement,whether due to fraud or error, and to issue an auditors’ report that includes our opinion. Reasonable assurance is a high level of assurance,but is not a guarantee that an audit conducted in accordance with ISAs (UK) will always detect a material misstatement when it exists.Misstatements can arise from fraud or error and are considered material if, individually or in the aggregate, they could reasonably beexpected to influence the economic decisions of users taken on the basis of these financial statements.
A further description of our responsibilities for the audit of the financial statements is located on the FRC’s website at:www.frc.org.uk/auditorsresponsibilities. This description forms part of our auditors’ report.
Use of this reportThis report, including the opinions, has been prepared for and only for the Company’s members as a body in accordance with Chapter 3 ofPart 16 of the Companies Act 2006 and for no other purpose. We do not, in giving these opinions, accept or assume responsibility for anyother purpose or to any other person to whom this report is shown or into whose hands it may come save where expressly agreed by ourprior consent in writing.
Other required reportingCompanies Act 2006 exception reportingUnder the Companies Act 2006 we are required to report to you if, in our opinion:
• we have not received all the information and explanations we require for our audit; or
• adequate accounting records have not been kept by the Company, or returns adequate for our audit have not been received frombranches not visited by us; or
• certain disclosures of Directors’ remuneration specified by law are not made; or
• the financial statements and the part of the Directors’ Remuneration Report to be audited are not in agreement with the accountingrecords and returns.
We have no exceptions to report arising from this responsibility.
AppointmentBased on the records available to us, we were appointed by the Directors in 1964 to audit the financial statements for the year ended30th June 1965 and subsequent financial periods. Based on those records the period of total uninterrupted engagement is 52 years,covering the years 30th June 1965 to 30 June 2017.
Alex Bertolotti (Senior Statutory Auditor)for and on behalf of PricewaterhouseCoopers LLPChartered Accountants and Statutory AuditorsLondon
19th September 2017
Independent Auditors’ Report continued
Global Growth & Income_pp36_43 19/09/2017 12:29 Page 40
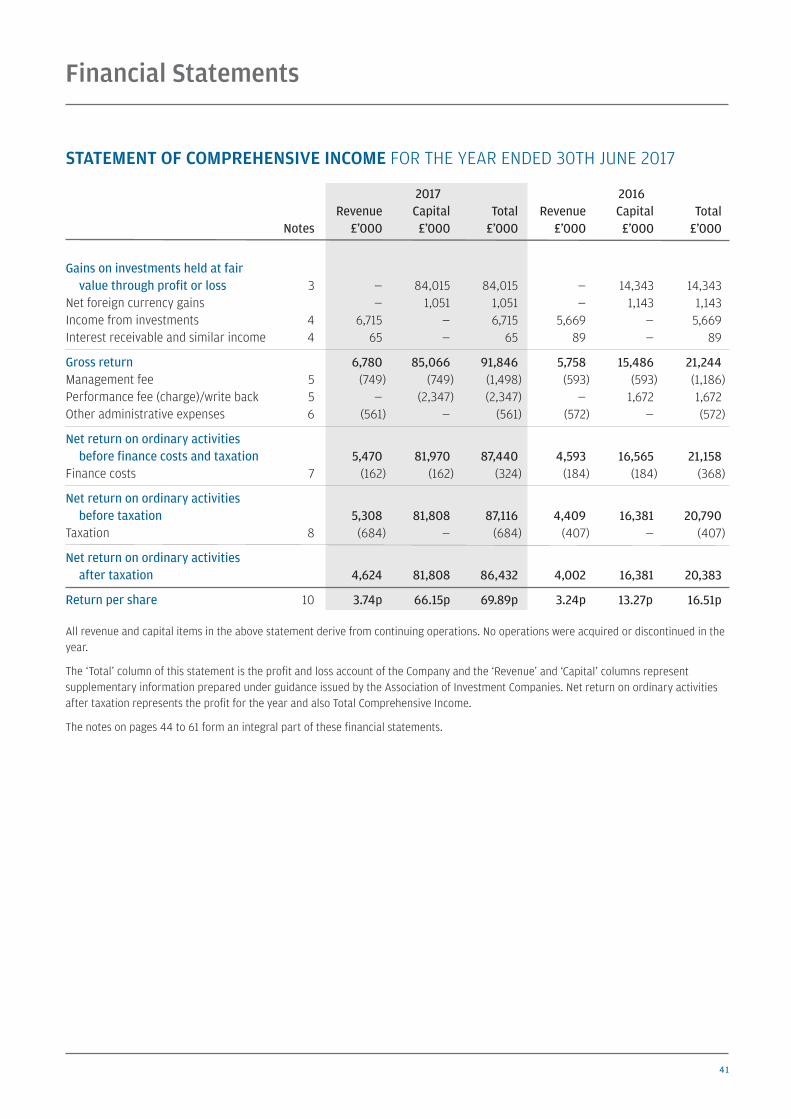
41
STATEMENT OF COMPREHENSIVE INCOME FOR THE YEAR ENDED 30TH JUNE 2017
2017 2016Revenue Capital Total Revenue Capital Total
Notes £’000 £’000 £’000 £’000 £’000 £’000
Gains on investments held at fairvalue through profit or loss 3 — 84,015 84,015 — 14,343 14,343
Net foreign currency gains — 1,051 1,051 — 1,143 1,143Income from investments 4 6,715 — 6,715 5,669 — 5,669Interest receivable and similar income 4 65 — 65 89 — 89
Gross return 6,780 85,066 91,846 5,758 15,486 21,244Management fee 5 (749) (749) (1,498) (593) (593) (1,186)Performance fee (charge)/write back 5 — (2,347) (2,347) — 1,672 1,672Other administrative expenses 6 (561) — (561) (572) — (572)
Net return on ordinary activities before finance costs and taxation 5,470 81,970 87,440 4,593 16,565 21,158
Finance costs 7 (162) (162) (324) (184) (184) (368)
Net return on ordinary activities before taxation 5,308 81,808 87,116 4,409 16,381 20,790
Taxation 8 (684) — (684) (407) — (407)
Net return on ordinary activities after taxation 4,624 81,808 86,432 4,002 16,381 20,383
Return per share 10 3.74p 66.15p 69.89p 3.24p 13.27p 16.51p
All revenue and capital items in the above statement derive from continuing operations. No operations were acquired or discontinued in theyear.
The ‘Total’ column of this statement is the profit and loss account of the Company and the ‘Revenue’ and ‘Capital’ columns representsupplementary information prepared under guidance issued by the Association of Investment Companies. Net return on ordinary activitiesafter taxation represents the profit for the year and also Total Comprehensive Income.
The notes on pages 44 to 61 form an integral part of these financial statements.
Financial Statements
Global Growth & Income_pp36_43 19/09/2017 12:29 Page 41
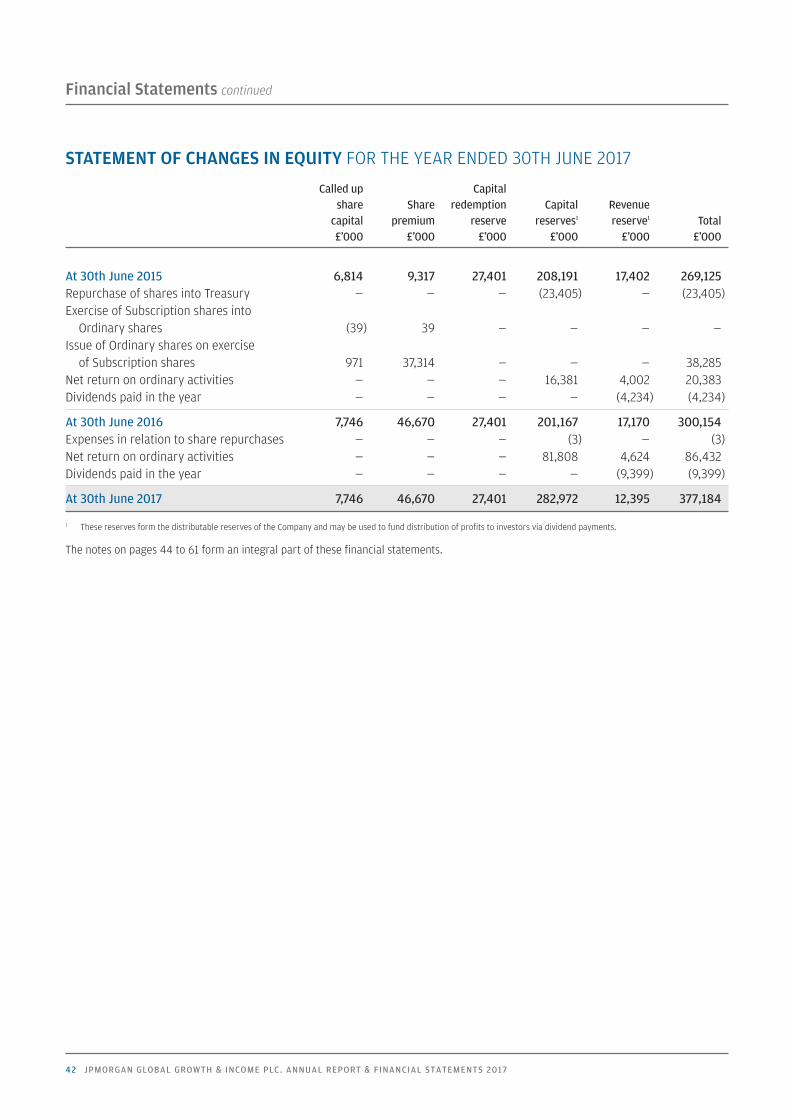
42 JPMORGAN GLOBAL GROWTH & INCOME PLC. ANNUAL REPORT & FINANCIAL STATEMENTS 2017
Financial Statements continued
STATEMENT OF CHANGES IN EQUITY FOR THE YEAR ENDED 30TH JUNE 2017
Called up Capital share Share redemption Capital Revenue capital premium reserve reserves1 reserve1 Total £’000 £’000 £’000 £’000 £’000 £’000
At 30th June 2015 6,814 9,317 27,401 208,191 17,402 269,125Repurchase of shares into Treasury — — — (23,405) — (23,405)Exercise of Subscription shares intoOrdinary shares (39) 39 — — — —
Issue of Ordinary shares on exerciseof Subscription shares 971 37,314 — — — 38,285
Net return on ordinary activities — — — 16,381 4,002 20,383Dividends paid in the year — — — — (4,234) (4,234)
At 30th June 2016 7,746 46,670 27,401 201,167 17,170 300,154Expenses in relation to share repurchases — — — (3) — (3)Net return on ordinary activities — — — 81,808 4,624 86,432Dividends paid in the year — — — — (9,399) (9,399)
At 30th June 2017 7,746 46,670 27,401 282,972 12,395 377,184
1 These reserves form the distributable reserves of the Company and may be used to fund distribution of profits to investors via dividend payments.
The notes on pages 44 to 61 form an integral part of these financial statements.
Global Growth & Income_pp36_43 19/09/2017 12:29 Page 42
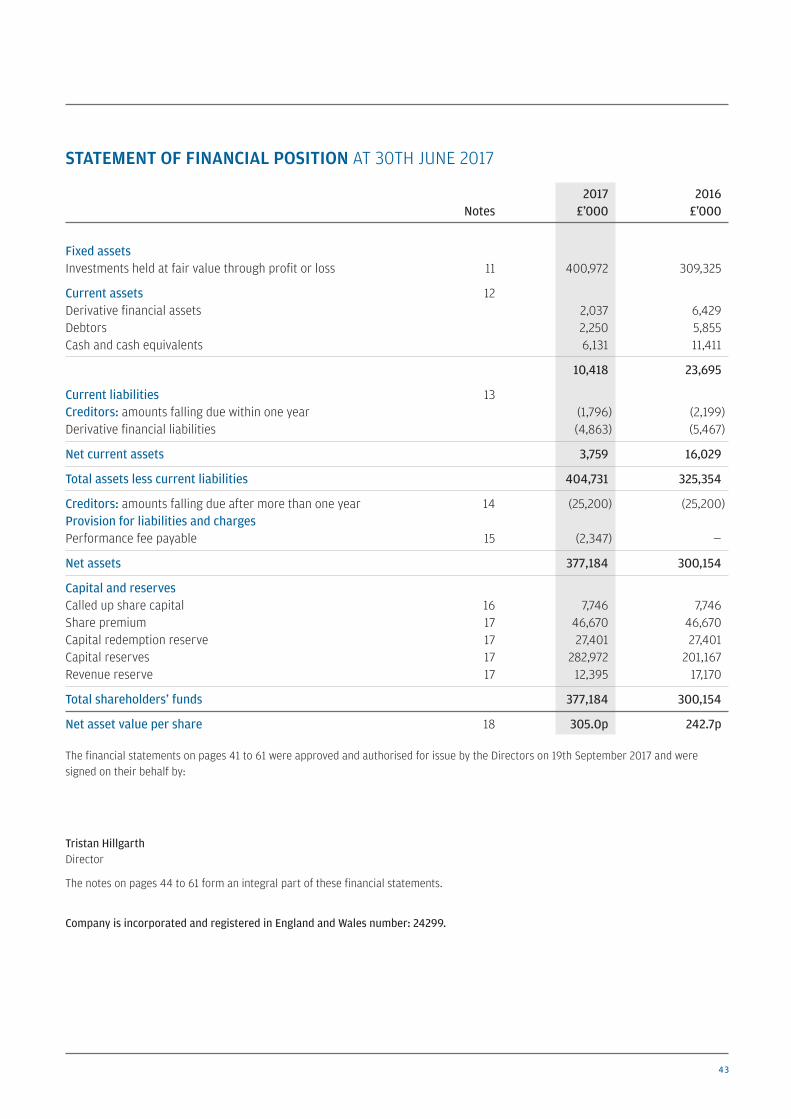
43
STATEMENT OF FINANCIAL POSITION AT 30TH JUNE 2017
2017 2016 Notes £’000 £’000
Fixed assets Investments held at fair value through profit or loss 11 400,972 309,325
Current assets 12Derivative financial assets 2,037 6,429Debtors 2,250 5,855Cash and cash equivalents 6,131 11,411
10,418 23,695
Current liabilities 13Creditors: amounts falling due within one year (1,796) (2,199)Derivative financial liabilities (4,863) (5,467)
Net current assets 3,759 16,029
Total assets less current liabilities 404,731 325,354
Creditors: amounts falling due after more than one year 14 (25,200) (25,200)Provision for liabilities and chargesPerformance fee payable 15 (2,347) —
Net assets 377,184 300,154
Capital and reserves Called up share capital 16 7,746 7,746Share premium 17 46,670 46,670Capital redemption reserve 17 27,401 27,401Capital reserves 17 282,972 201,167Revenue reserve 17 12,395 17,170
Total shareholders’ funds 377,184 300,154
Net asset value per share 18 305.0p 242.7p
The financial statements on pages 41 to 61 were approved and authorised for issue by the Directors on 19th September 2017 and weresigned on their behalf by:
Tristan HillgarthDirector
The notes on pages 44 to 61 form an integral part of these financial statements.
Company is incorporated and registered in England and Wales number: 24299.
Global Growth & Income_pp36_43 19/09/2017 12:29 Page 43
Financial Statements continued
44 JPMORGAN GLOBAL GROWTH & INCOME PLC. ANNUAL REPORT & FINANCIAL STATEMENTS 2017
NOTES TO THE FINANCIAL STATEMENTS FOR THE YEAR ENDED 30TH JUNE 2017
1. Accounting policies(a) Basis of accounting
The financial statements are prepared under the historical cost convention, modified to include fixed asset investments at fair value,and in accordance with the Companies Act 2006, United Kingdom Generally Accepted Accounting Practice (‘UK GAAP’), includingFRS 102 ‘The Financial Reporting Standard applicable in the UK and Republic of Ireland’ and with the Statement of RecommendedPractice ‘Financial Statements of Investment Trust Companies and Venture Capital Trusts’ (the ‘SORP’) issued by the Association ofInvestment Companies in November 2014 and updated in January 2017.
All of the Company’s operations are of a continuing nature.
The financial statements have been prepared on a going concern basis. The disclosures on going concern in the Directors’ Report onpage 28 form part of these financial statements.
The policies applied in these financial statements are consistent with those applied in the preceding year.
The Company has elected not to prepare a Statement of Cash Flows for the current year on the basis that substantially all of itsinvestments are liquid and carried at market value and a Statement of Changes in Equity is provided.
(b) Valuation of investments
The Company has chosen to adopt Sections 11 and 12 of FRS 102 in respect of financial instruments.
The Company’s business is investing in financial assets with a view to profiting from their total return in the form of income andcapital growth. The portfolio of financial assets is managed and its performance evaluated on a fair value basis, in accordance witha documented investment strategy and information is provided internally on that basis to the Company’s Board of Directors.
Accordingly, upon initial recognition the investments are designated by the Company as ‘held at fair value through profit or loss’. Theyare included initially at fair value which is taken to be their cost, excluding expenses incidental to purchase which are written off tocapital at the time of acquisition. Subsequently the investments are valued at fair value, which are quoted bid prices for investmentstraded in active markets. For investments which are not traded in active markets, unlisted and restricted investments, the Board takesinto account the latest traded prices, other observable market data and asset values based on the latest management accounts.
All purchases and sales are accounted for on a trade date basis.
(c) Accounting for reserves
Gains and losses on sales of investments including the related foreign exchange gains and losses, realised gains and losses on foreigncurrency contracts, any performance fee realised, management fee and finance costs allocated to capital and any other capital charges,are included in the Statement of Comprehensive Income and dealt with in capital reserves within ‘Gains and losses on sales of investments’.
The cost of repurchasing ordinary shares including stamp duty and transaction costs are included in the Statement of Changes inEquity and dealt with in capital reserves within ‘Gains and losses on sales of investments’.
Increases and decreases in the valuation of investments held at the year end including the related foreign exchange gains and losses,are included in the Statement of Comprehensive Income and dealt with in capital reserves within ‘Investment holding gains andlosses’. Unrealised gains and losses on foreign currency contracts and any performance fee provision, are included in the Statementof Comprehensive Income and dealt with in capital reserves within the ‘unrealised reserve’.
(d) Income
Dividends receivable from equity shares are included in revenue on an ex-dividend basis except where, in the opinion of the Board,the dividend is capital in nature, in which case it is included in capital.
UK dividends are included net of tax credits. Overseas dividends are included gross of any withholding tax.
Special dividends are looked at individually to ascertain the reason behind the payment. This will determine whether they are treatedas revenue or capital.
Where the Company has elected to receive scrip dividends in the form of additional shares rather than in cash, the amount of the cashdividend foregone is recognised in revenue. Any excess in the value of the shares received over the amount of the cash dividend isrecognised in capital.
Deposit interest receivable is taken to revenue on an accruals basis.
Stock lending income is taken to revenue on a receipts basis.
Global Growth & Income_pp44_64 19/09/2017 15:50 Page 44
45
(e) Expenses
All expenses are accounted for on an accruals basis. Expenses are allocated wholly to revenue with the following exceptions:
– performance fee is allocated 100% to capital;
– management fee is allocated 50% to revenue and 50% to capital in line with the Board’s expected long term split of revenue andcapital return from the Company’s investment portfolio; and
– expenses incidental to the purchase and sale of an investment are charged to capital. These expenses are commonly referred to astransaction costs and include items such as stamp duty and brokerage commissions. Details of transaction costs are given in note 11on page 50.
(f) Finance costs
Finance costs are accounted for on an accruals basis using the effective interest method.
Finance costs are allocated 50% to revenue and 50% to capital, in line with the Board’s expected long term split of revenue andcapital return from the Company’s investment portfolio.
(g) Financial instruments
Cash and cash equivalents may comprise cash including demand deposits which are readily convertible to a known amount of cashand are subject to an insignificant risk of change in value. Liquidity funds are considered cash equivalents as they are held for cashmanagement purposes as an alternative to cash.
Other debtors and creditors do not carry any interest, are short term in nature and are accordingly stated at nominal value, withdebtors reduced by appropriate allowances for estimated irrecoverable amounts.
Bank loans and debentures are classified as financial liabilities at amortised cost. They are initially measured at proceeds net of directissue costs and subsequently measured at amortised cost. Interest payable on bank loans is accounted for on an accruals basis in theStatement of Comprehensive Income. The amortisation of direct issue costs are accounted for on an accruals basis in the Statementof Comprehensive Income using the effective interest method.
Derivative financial instruments, including short term forward currency contracts are classified as 'held for trading' and are valued atfair value, which is the net unrealised gain or loss, and are included in current assets or current liabilities in the Statement ofFinancial Position. Changes in the fair value of derivative financial instruments are recognised in the Statement of ComprehensiveIncome as capital.
(h) Taxation
Current tax is provided at the amounts expected to be paid or received.
Deferred tax is provided on all timing differences that have originated but not reversed by the balance sheet date. Deferred taxliabilities are recognised for all taxable timing differences but deferred tax assets are only recognised to the extent that it is morelikely than not that taxable profits will be available against which those timing differences can be utilised.
Deferred tax is measured at the tax rate which is expected to apply in the periods in which the timing differences are expected toreverse, based on tax rates that have been enacted or substantively enacted at the balance sheet date and is measured on anundiscounted basis.
(i) Value Added Tax (‘VAT’)
Expenses are disclosed inclusive of the related irrecoverable VAT. Recoverable VAT is calculated using the partial exemption methodbased on the proportion of zero rated supplies to total supplies.
(j) Foreign currency
The Company is required to identify its functional currency, being the currency of the primary economic environment in which theCompany operates.
The Board, having regard to the currency of the Company’s share capital and the predominant currency in which its shareholders operate,has determined that sterling is the functional currency. Sterling is also the currency in which the financial statements are presented.
Global Growth & Income_pp44_64 19/09/2017 15:50 Page 45
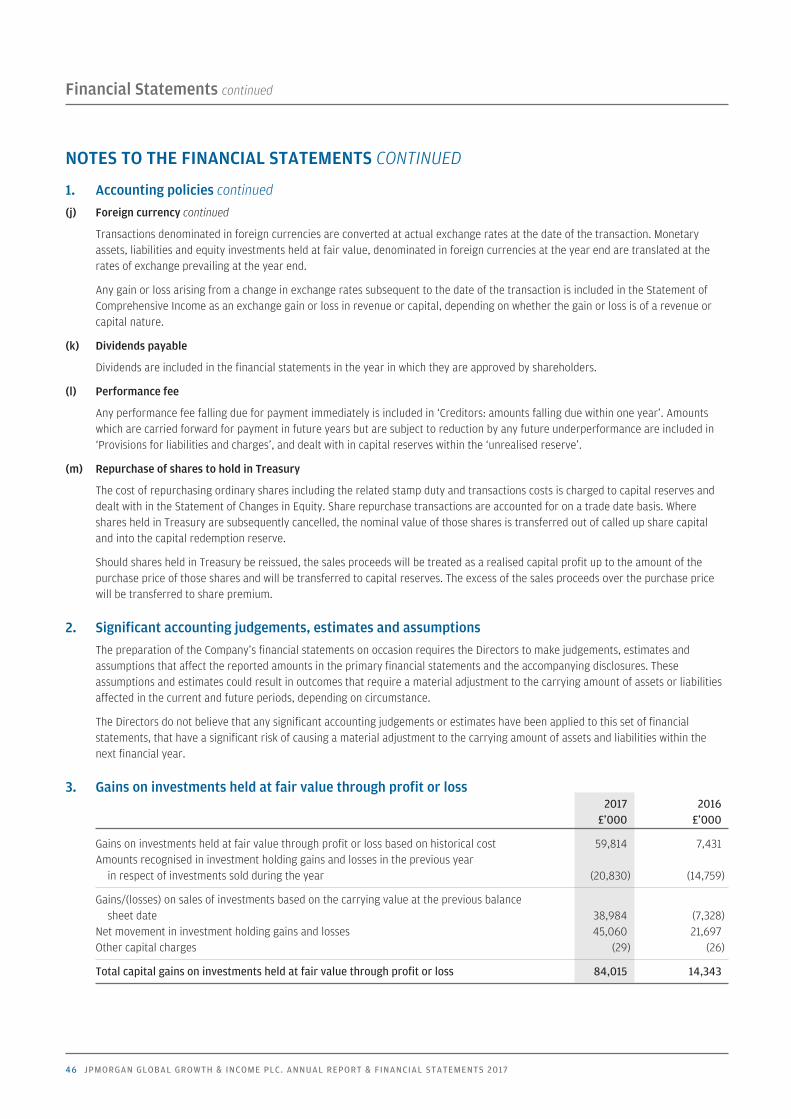
Financial Statements continued
NOTES TO THE FINANCIAL STATEMENTS CONTINUED
46 JPMORGAN GLOBAL GROWTH & INCOME PLC. ANNUAL REPORT & FINANCIAL STATEMENTS 2017
1. Accounting policies continued
(j) Foreign currency continued
Transactions denominated in foreign currencies are converted at actual exchange rates at the date of the transaction. Monetaryassets, liabilities and equity investments held at fair value, denominated in foreign currencies at the year end are translated at therates of exchange prevailing at the year end.
Any gain or loss arising from a change in exchange rates subsequent to the date of the transaction is included in the Statement ofComprehensive Income as an exchange gain or loss in revenue or capital, depending on whether the gain or loss is of a revenue orcapital nature.
(k) Dividends payable
Dividends are included in the financial statements in the year in which they are approved by shareholders.
(l) Performance fee
Any performance fee falling due for payment immediately is included in ‘Creditors: amounts falling due within one year’. Amountswhich are carried forward for payment in future years but are subject to reduction by any future underperformance are included in‘Provisions for liabilities and charges’, and dealt with in capital reserves within the ‘unrealised reserve’.
(m) Repurchase of shares to hold in Treasury
The cost of repurchasing ordinary shares including the related stamp duty and transactions costs is charged to capital reserves anddealt with in the Statement of Changes in Equity. Share repurchase transactions are accounted for on a trade date basis. Whereshares held in Treasury are subsequently cancelled, the nominal value of those shares is transferred out of called up share capitaland into the capital redemption reserve.
Should shares held in Treasury be reissued, the sales proceeds will be treated as a realised capital profit up to the amount of thepurchase price of those shares and will be transferred to capital reserves. The excess of the sales proceeds over the purchase pricewill be transferred to share premium.
2. Significant accounting judgements, estimates and assumptionsThe preparation of the Company’s financial statements on occasion requires the Directors to make judgements, estimates andassumptions that affect the reported amounts in the primary financial statements and the accompanying disclosures. Theseassumptions and estimates could result in outcomes that require a material adjustment to the carrying amount of assets or liabilitiesaffected in the current and future periods, depending on circumstance.
The Directors do not believe that any significant accounting judgements or estimates have been applied to this set of financialstatements, that have a significant risk of causing a material adjustment to the carrying amount of assets and liabilities within thenext financial year.
3. Gains on investments held at fair value through profit or loss 2017 2016£’000 £’000
Gains on investments held at fair value through profit or loss based on historical cost 59,814 7,431Amounts recognised in investment holding gains and losses in the previous year
in respect of investments sold during the year (20,830) (14,759)
Gains/(losses) on sales of investments based on the carrying value at the previous balancesheet date 38,984 (7,328)
Net movement in investment holding gains and losses 45,060 21,697Other capital charges (29) (26)
Total capital gains on investments held at fair value through profit or loss 84,015 14,343
Global Growth & Income_pp44_64 19/09/2017 15:50 Page 46
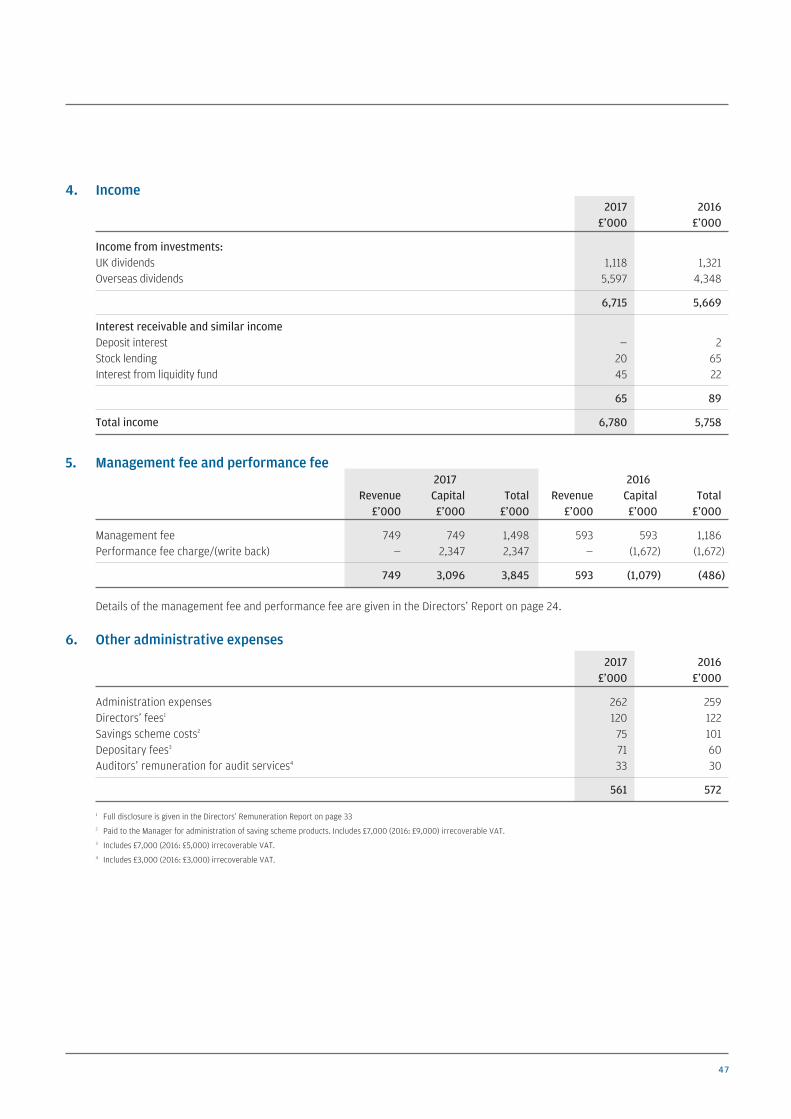
47
4. Income2017 2016£’000 £’000
Income from investments:UK dividends 1,118 1,321Overseas dividends 5,597 4,348
6,715 5,669
Interest receivable and similar incomeDeposit interest — 2Stock lending 20 65Interest from liquidity fund 45 22
65 89
Total income 6,780 5,758
5. Management fee and performance fee2017 2016
Revenue Capital Total Revenue Capital Total £’000 £’000 £’000 £’000 £’000 £’000
Management fee 749 749 1,498 593 593 1,186Performance fee charge/(write back) — 2,347 2,347 — (1,672) (1,672)
749 3,096 3,845 593 (1,079) (486)
Details of the management fee and performance fee are given in the Directors’ Report on page 24.
6. Other administrative expenses2017 2016£’000 £’000
Administration expenses 262 259Directors’ fees1 120 122Savings scheme costs2 75 101Depositary fees3 71 60Auditors’ remuneration for audit services4 33 30
561 572
1 Full disclosure is given in the Directors’ Remuneration Report on page 332 Paid to the Manager for administration of saving scheme products. Includes £7,000 (2016: £9,000) irrecoverable VAT.3 Includes £7,000 (2016: £5,000) irrecoverable VAT.4 Includes £3,000 (2016: £3,000) irrecoverable VAT.
Global Growth & Income_pp44_64 19/09/2017 15:50 Page 47
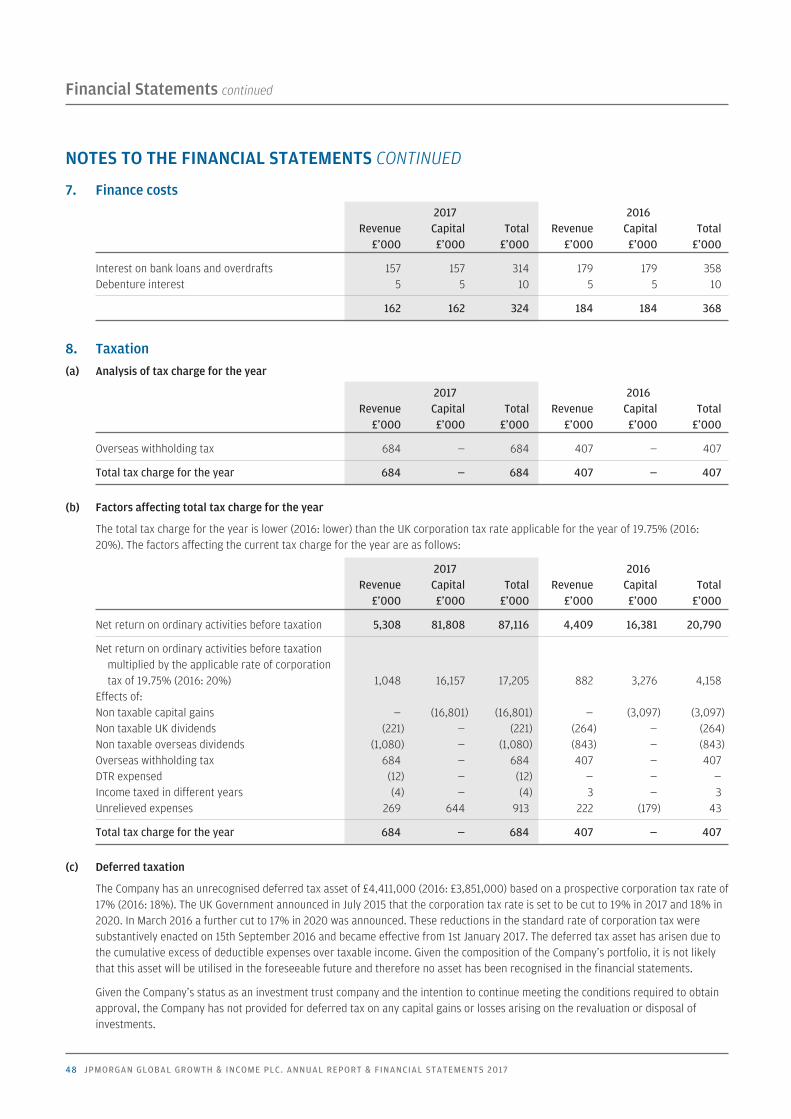
Financial Statements continued
NOTES TO THE FINANCIAL STATEMENTS CONTINUED
48 JPMORGAN GLOBAL GROWTH & INCOME PLC. ANNUAL REPORT & FINANCIAL STATEMENTS 2017
7. Finance costs2017 2016
Revenue Capital Total Revenue Capital Total £’000 £’000 £’000 £’000 £’000 £’000
Interest on bank loans and overdrafts 157 157 314 179 179 358Debenture interest 5 5 10 5 5 10
162 162 324 184 184 368
8. Taxation (a) Analysis of tax charge for the year
2017 2016Revenue Capital Total Revenue Capital Total £’000 £’000 £’000 £’000 £’000 £’000
Overseas withholding tax 684 — 684 407 — 407
Total tax charge for the year 684 — 684 407 — 407
(b) Factors affecting total tax charge for the year
The total tax charge for the year is lower (2016: lower) than the UK corporation tax rate applicable for the year of 19.75% (2016:20%). The factors affecting the current tax charge for the year are as follows:
2017 2016Revenue Capital Total Revenue Capital Total £’000 £’000 £’000 £’000 £’000 £’000
Net return on ordinary activities before taxation 5,308 81,808 87,116 4,409 16,381 20,790
Net return on ordinary activities before taxation multiplied by the applicable rate of corporation tax of 19.75% (2016: 20%) 1,048 16,157 17,205 882 3,276 4,158
Effects of:Non taxable capital gains — (16,801) (16,801) — (3,097) (3,097)Non taxable UK dividends (221) — (221) (264) — (264)Non taxable overseas dividends (1,080) — (1,080) (843) — (843)Overseas withholding tax 684 — 684 407 — 407DTR expensed (12) — (12) — — —Income taxed in different years (4) — (4) 3 — 3Unrelieved expenses 269 644 913 222 (179) 43
Total tax charge for the year 684 — 684 407 — 407
(c) Deferred taxation
The Company has an unrecognised deferred tax asset of £4,411,000 (2016: £3,851,000) based on a prospective corporation tax rate of17% (2016: 18%). The UK Government announced in July 2015 that the corporation tax rate is set to be cut to 19% in 2017 and 18% in2020. In March 2016 a further cut to 17% in 2020 was announced. These reductions in the standard rate of corporation tax weresubstantively enacted on 15th September 2016 and became effective from 1st January 2017. The deferred tax asset has arisen due tothe cumulative excess of deductible expenses over taxable income. Given the composition of the Company’s portfolio, it is not likelythat this asset will be utilised in the foreseeable future and therefore no asset has been recognised in the financial statements.
Given the Company’s status as an investment trust company and the intention to continue meeting the conditions required to obtainapproval, the Company has not provided for deferred tax on any capital gains or losses arising on the revaluation or disposal ofinvestments.
Global Growth & Income_pp44_64 19/09/2017 15:50 Page 48
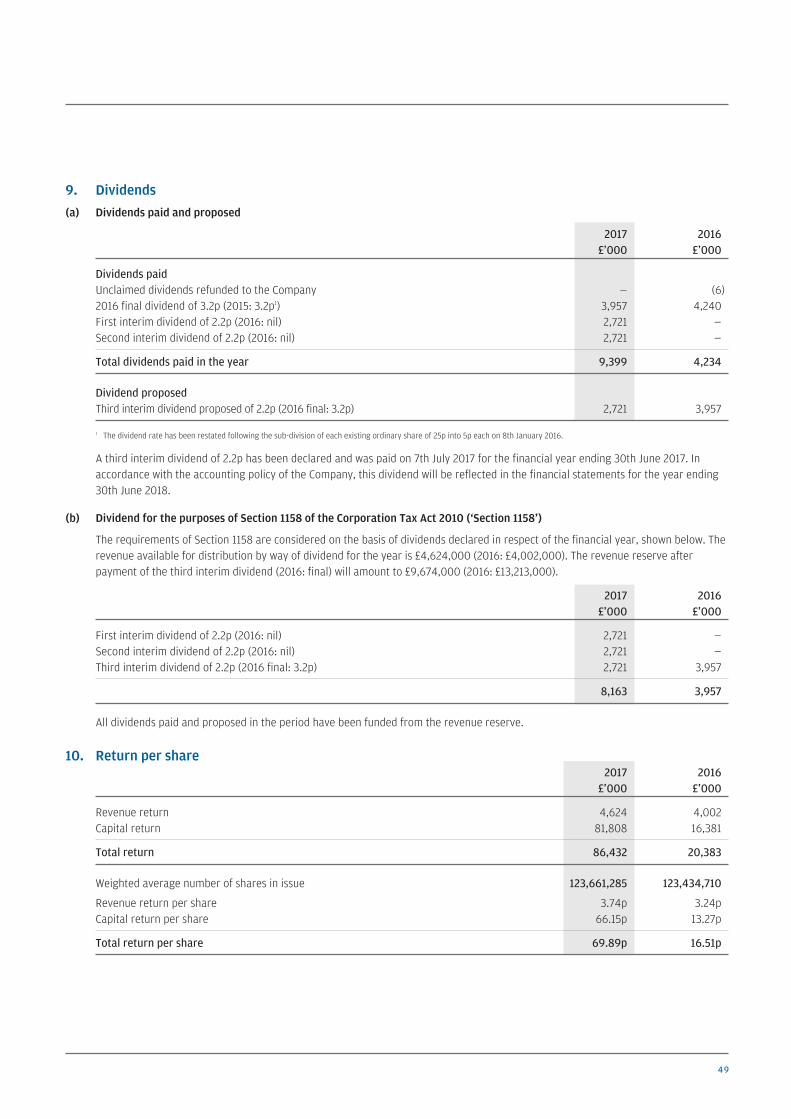
49
9. Dividends(a) Dividends paid and proposed
2017 2016£’000 £’000
Dividends paidUnclaimed dividends refunded to the Company — (6)2016 final dividend of 3.2p (2015: 3.2p1) 3,957 4,240First interim dividend of 2.2p (2016: nil) 2,721 —Second interim dividend of 2.2p (2016: nil) 2,721 —
Total dividends paid in the year 9,399 4,234
Dividend proposedThird interim dividend proposed of 2.2p (2016 final: 3.2p) 2,721 3,957
1 The dividend rate has been restated following the sub-division of each existing ordinary share of 25p into 5p each on 8th January 2016.
A third interim dividend of 2.2p has been declared and was paid on 7th July 2017 for the financial year ending 30th June 2017. Inaccordance with the accounting policy of the Company, this dividend will be reflected in the financial statements for the year ending30th June 2018.
(b) Dividend for the purposes of Section 1158 of the Corporation Tax Act 2010 (‘Section 1158’)
The requirements of Section 1158 are considered on the basis of dividends declared in respect of the financial year, shown below. Therevenue available for distribution by way of dividend for the year is £4,624,000 (2016: £4,002,000). The revenue reserve afterpayment of the third interim dividend (2016: final) will amount to £9,674,000 (2016: £13,213,000).
2017 2016£’000 £’000
First interim dividend of 2.2p (2016: nil) 2,721 —Second interim dividend of 2.2p (2016: nil) 2,721 —Third interim dividend of 2.2p (2016 final: 3.2p) 2,721 3,957
8,163 3,957
All dividends paid and proposed in the period have been funded from the revenue reserve.
10. Return per share2017 2016£’000 £’000
Revenue return 4,624 4,002Capital return 81,808 16,381
Total return 86,432 20,383
Weighted average number of shares in issue 123,661,285 123,434,710
Revenue return per share 3.74p 3.24pCapital return per share 66.15p 13.27p
Total return per share 69.89p 16.51p
Global Growth & Income_pp44_64 19/09/2017 15:50 Page 49
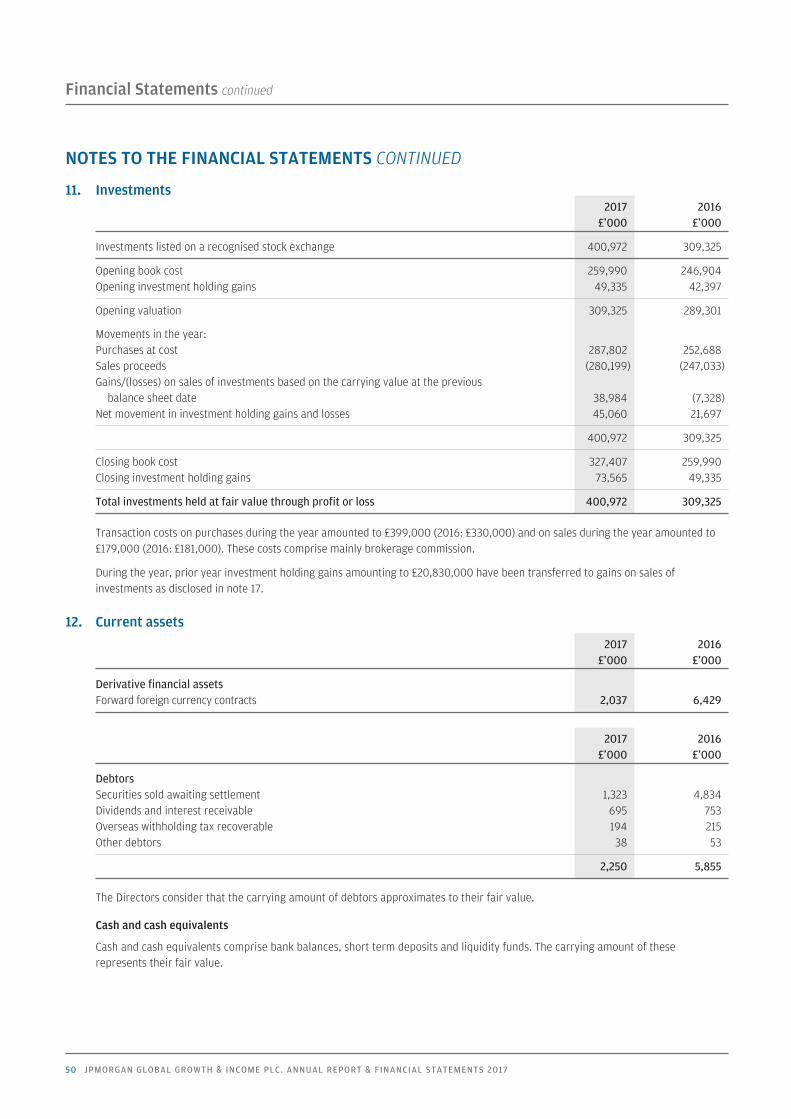
Financial Statements continued
NOTES TO THE FINANCIAL STATEMENTS CONTINUED
50 JPMORGAN GLOBAL GROWTH & INCOME PLC. ANNUAL REPORT & FINANCIAL STATEMENTS 2017
11. Investments2017 2016£’000 £’000
Investments listed on a recognised stock exchange 400,972 309,325
Opening book cost 259,990 246,904Opening investment holding gains 49,335 42,397
Opening valuation 309,325 289,301
Movements in the year:Purchases at cost 287,802 252,688Sales proceeds (280,199) (247,033)Gains/(losses) on sales of investments based on the carrying value at the previous
balance sheet date 38,984 (7,328)Net movement in investment holding gains and losses 45,060 21,697
400,972 309,325
Closing book cost 327,407 259,990Closing investment holding gains 73,565 49,335
Total investments held at fair value through profit or loss 400,972 309,325
Transaction costs on purchases during the year amounted to £399,000 (2016: £330,000) and on sales during the year amounted to£179,000 (2016: £181,000). These costs comprise mainly brokerage commission.
During the year, prior year investment holding gains amounting to £20,830,000 have been transferred to gains on sales ofinvestments as disclosed in note 17.
12. Current assets2017 2016£’000 £’000
Derivative financial assetsForward foreign currency contracts 2,037 6,429
2017 2016£’000 £’000
DebtorsSecurities sold awaiting settlement 1,323 4,834Dividends and interest receivable 695 753Overseas withholding tax recoverable 194 215Other debtors 38 53
2,250 5,855
The Directors consider that the carrying amount of debtors approximates to their fair value.
Cash and cash equivalents
Cash and cash equivalents comprise bank balances, short term deposits and liquidity funds. The carrying amount of theserepresents their fair value.
Global Growth & Income_pp44_64 19/09/2017 12:29 Page 50
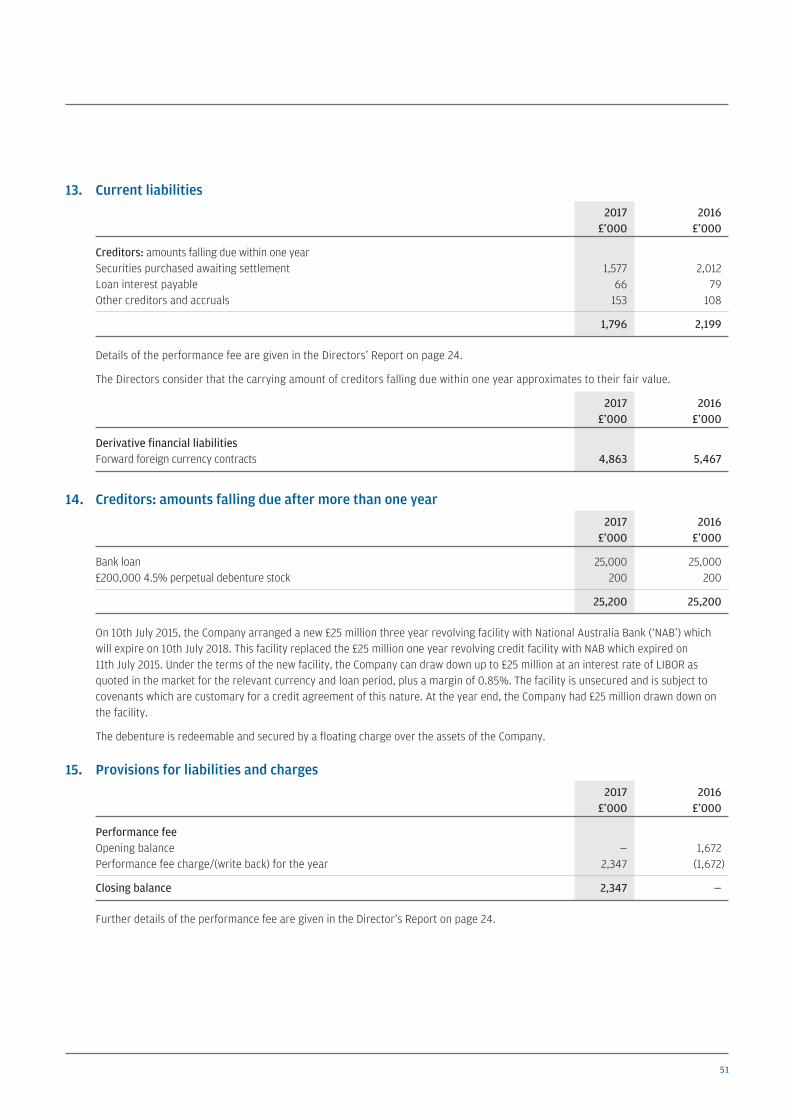
51
13. Current liabilities2017 2016£’000 £’000
Creditors: amounts falling due within one yearSecurities purchased awaiting settlement 1,577 2,012Loan interest payable 66 79Other creditors and accruals 153 108
1,796 2,199
Details of the performance fee are given in the Directors’ Report on page 24.
The Directors consider that the carrying amount of creditors falling due within one year approximates to their fair value.
2017 2016£’000 £’000
Derivative financial liabilitiesForward foreign currency contracts 4,863 5,467
14. Creditors: amounts falling due after more than one year 2017 2016£’000 £’000
Bank loan 25,000 25,000£200,000 4.5% perpetual debenture stock 200 200
25,200 25,200
On 10th July 2015, the Company arranged a new £25 million three year revolving facility with National Australia Bank (‘NAB’) whichwill expire on 10th July 2018. This facility replaced the £25 million one year revolving credit facility with NAB which expired on11th July 2015. Under the terms of the new facility, the Company can draw down up to £25 million at an interest rate of LIBOR asquoted in the market for the relevant currency and loan period, plus a margin of 0.85%. The facility is unsecured and is subject tocovenants which are customary for a credit agreement of this nature. At the year end, the Company had £25 million drawn down onthe facility.
The debenture is redeemable and secured by a floating charge over the assets of the Company.
15. Provisions for liabilities and charges2017 2016£’000 £’000
Performance feeOpening balance — 1,672Performance fee charge/(write back) for the year 2,347 (1,672)
Closing balance 2,347 —
Further details of the performance fee are given in the Director’s Report on page 24.
Global Growth & Income_pp44_64 19/09/2017 12:29 Page 51
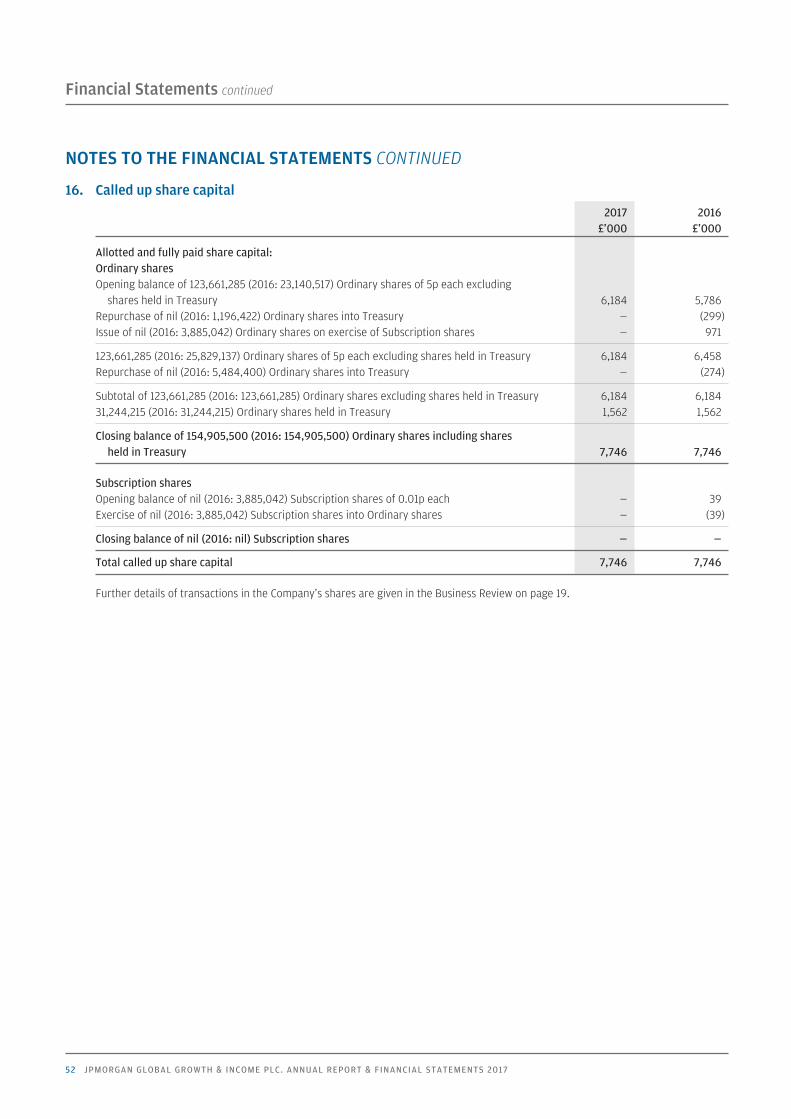
Financial Statements continued
NOTES TO THE FINANCIAL STATEMENTS CONTINUED
52 JPMORGAN GLOBAL GROWTH & INCOME PLC. ANNUAL REPORT & FINANCIAL STATEMENTS 2017
16. Called up share capital 2017 2016£’000 £’000
Allotted and fully paid share capital:Ordinary sharesOpening balance of 123,661,285 (2016: 23,140,517) Ordinary shares of 5p each excluding
shares held in Treasury 6,184 5,786Repurchase of nil (2016: 1,196,422) Ordinary shares into Treasury — (299)Issue of nil (2016: 3,885,042) Ordinary shares on exercise of Subscription shares — 971
123,661,285 (2016: 25,829,137) Ordinary shares of 5p each excluding shares held in Treasury 6,184 6,458Repurchase of nil (2016: 5,484,400) Ordinary shares into Treasury — (274)
Subtotal of 123,661,285 (2016: 123,661,285) Ordinary shares excluding shares held in Treasury 6,184 6,18431,244,215 (2016: 31,244,215) Ordinary shares held in Treasury 1,562 1,562
Closing balance of 154,905,500 (2016: 154,905,500) Ordinary shares including shares held in Treasury 7,746 7,746
Subscription sharesOpening balance of nil (2016: 3,885,042) Subscription shares of 0.01p each — 39Exercise of nil (2016: 3,885,042) Subscription shares into Ordinary shares — (39)
Closing balance of nil (2016: nil) Subscription shares — —
Total called up share capital 7,746 7,746
Further details of transactions in the Company’s shares are given in the Business Review on page 19.
Global Growth & Income_pp44_64 19/09/2017 12:29 Page 52
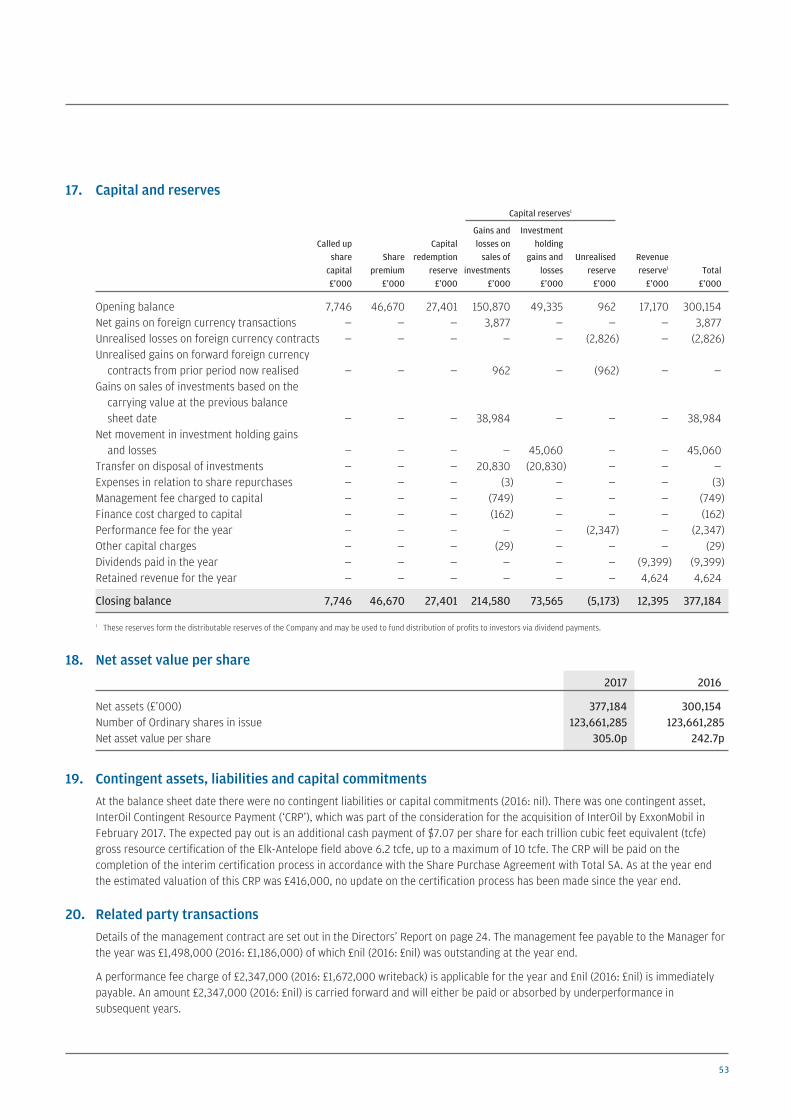
53
17. Capital and reservesCapital reserves1
Gains and Investment Called up Capital losses on holding
share Share redemption sales of gains and Unrealised Revenuecapital premium reserve investments losses reserve reserve1 Total£’000 £’000 £’000 £’000 £’000 £’000 £’000 £’000
Opening balance 7,746 46,670 27,401 150,870 49,335 962 17,170 300,154Net gains on foreign currency transactions — — — 3,877 — — — 3,877 Unrealised losses on foreign currency contracts — — — — — (2,826) — (2,826)Unrealised gains on forward foreign currency
contracts from prior period now realised — — — 962 — (962) — —Gains on sales of investments based on the
carrying value at the previous balance sheet date — — — 38,984 — — — 38,984
Net movement in investment holding gains and losses — — — — 45,060 — — 45,060
Transfer on disposal of investments — — — 20,830 (20,830) — — —Expenses in relation to share repurchases — — — (3) — — — (3)Management fee charged to capital — — — (749) — — — (749)Finance cost charged to capital — — — (162) — — — (162)Performance fee for the year — — — — — (2,347) — (2,347)Other capital charges — — — (29) — — — (29)Dividends paid in the year — — — — — — (9,399) (9,399)Retained revenue for the year — — — — — — 4,624 4,624
Closing balance 7,746 46,670 27,401 214,580 73,565 (5,173) 12,395 377,184
1 These reserves form the distributable reserves of the Company and may be used to fund distribution of profits to investors via dividend payments.
18. Net asset value per share 2017 2016
Net assets (£’000) 377,184 300,154Number of Ordinary shares in issue 123,661,285 123,661,285Net asset value per share 305.0p 242.7p
19. Contingent assets, liabilities and capital commitmentsAt the balance sheet date there were no contingent liabilities or capital commitments (2016: nil). There was one contingent asset,InterOil Contingent Resource Payment (‘CRP’), which was part of the consideration for the acquisition of InterOil by ExxonMobil inFebruary 2017. The expected pay out is an additional cash payment of $7.07 per share for each trillion cubic feet equivalent (tcfe)gross resource certification of the Elk-Antelope field above 6.2 tcfe, up to a maximum of 10 tcfe. The CRP will be paid on thecompletion of the interim certification process in accordance with the Share Purchase Agreement with Total SA. As at the year endthe estimated valuation of this CRP was £416,000, no update on the certification process has been made since the year end.
20. Related party transactionsDetails of the management contract are set out in the Directors’ Report on page 24. The management fee payable to the Manager forthe year was £1,498,000 (2016: £1,186,000) of which £nil (2016: £nil) was outstanding at the year end.
A performance fee charge of £2,347,000 (2016: £1,672,000 writeback) is applicable for the year and £nil (2016: £nil) is immediatelypayable. An amount £2,347,000 (2016: £nil) is carried forward and will either be paid or absorbed by underperformance insubsequent years.
Global Growth & Income_pp44_64 19/09/2017 12:29 Page 53
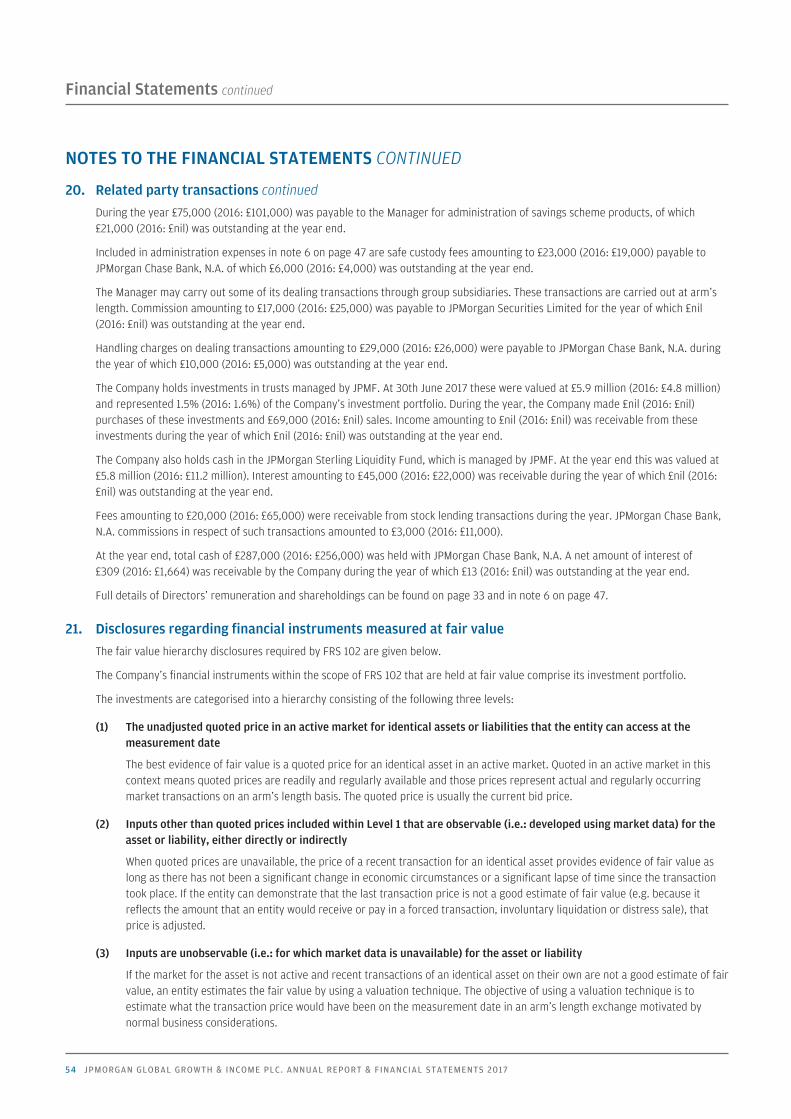
Financial Statements continued
NOTES TO THE FINANCIAL STATEMENTS CONTINUED
54 JPMORGAN GLOBAL GROWTH & INCOME PLC. ANNUAL REPORT & FINANCIAL STATEMENTS 2017
20. Related party transactions continued
During the year £75,000 (2016: £101,000) was payable to the Manager for administration of savings scheme products, of which£21,000 (2016: £nil) was outstanding at the year end.
Included in administration expenses in note 6 on page 47 are safe custody fees amounting to £23,000 (2016: £19,000) payable toJPMorgan Chase Bank, N.A. of which £6,000 (2016: £4,000) was outstanding at the year end.
The Manager may carry out some of its dealing transactions through group subsidiaries. These transactions are carried out at arm’slength. Commission amounting to £17,000 (2016: £25,000) was payable to JPMorgan Securities Limited for the year of which £nil(2016: £nil) was outstanding at the year end.
Handling charges on dealing transactions amounting to £29,000 (2016: £26,000) were payable to JPMorgan Chase Bank, N.A. duringthe year of which £10,000 (2016: £5,000) was outstanding at the year end.
The Company holds investments in trusts managed by JPMF. At 30th June 2017 these were valued at £5.9 million (2016: £4.8 million)and represented 1.5% (2016: 1.6%) of the Company’s investment portfolio. During the year, the Company made £nil (2016: £nil)purchases of these investments and £69,000 (2016: £nil) sales. Income amounting to £nil (2016: £nil) was receivable from theseinvestments during the year of which £nil (2016: £nil) was outstanding at the year end.
The Company also holds cash in the JPMorgan Sterling Liquidity Fund, which is managed by JPMF. At the year end this was valued at£5.8 million (2016: £11.2 million). Interest amounting to £45,000 (2016: £22,000) was receivable during the year of which £nil (2016:£nil) was outstanding at the year end.
Fees amounting to £20,000 (2016: £65,000) were receivable from stock lending transactions during the year. JPMorgan Chase Bank,N.A. commissions in respect of such transactions amounted to £3,000 (2016: £11,000).
At the year end, total cash of £287,000 (2016: £256,000) was held with JPMorgan Chase Bank, N.A. A net amount of interest of£309 (2016: £1,664) was receivable by the Company during the year of which £13 (2016: £nil) was outstanding at the year end.
Full details of Directors’ remuneration and shareholdings can be found on page 33 and in note 6 on page 47.
21. Disclosures regarding financial instruments measured at fair valueThe fair value hierarchy disclosures required by FRS 102 are given below.
The Company’s financial instruments within the scope of FRS 102 that are held at fair value comprise its investment portfolio.
The investments are categorised into a hierarchy consisting of the following three levels:
(1) The unadjusted quoted price in an active market for identical assets or liabilities that the entity can access at themeasurement date
The best evidence of fair value is a quoted price for an identical asset in an active market. Quoted in an active market in thiscontext means quoted prices are readily and regularly available and those prices represent actual and regularly occurringmarket transactions on an arm’s length basis. The quoted price is usually the current bid price.
(2) Inputs other than quoted prices included within Level 1 that are observable (i.e.: developed using market data) for theasset or liability, either directly or indirectly
When quoted prices are unavailable, the price of a recent transaction for an identical asset provides evidence of fair value aslong as there has not been a significant change in economic circumstances or a significant lapse of time since the transactiontook place. If the entity can demonstrate that the last transaction price is not a good estimate of fair value (e.g. because itreflects the amount that an entity would receive or pay in a forced transaction, involuntary liquidation or distress sale), thatprice is adjusted.
(3) Inputs are unobservable (i.e.: for which market data is unavailable) for the asset or liability
If the market for the asset is not active and recent transactions of an identical asset on their own are not a good estimate of fairvalue, an entity estimates the fair value by using a valuation technique. The objective of using a valuation technique is toestimate what the transaction price would have been on the measurement date in an arm’s length exchange motivated bynormal business considerations.
Global Growth & Income_pp44_64 19/09/2017 12:29 Page 54
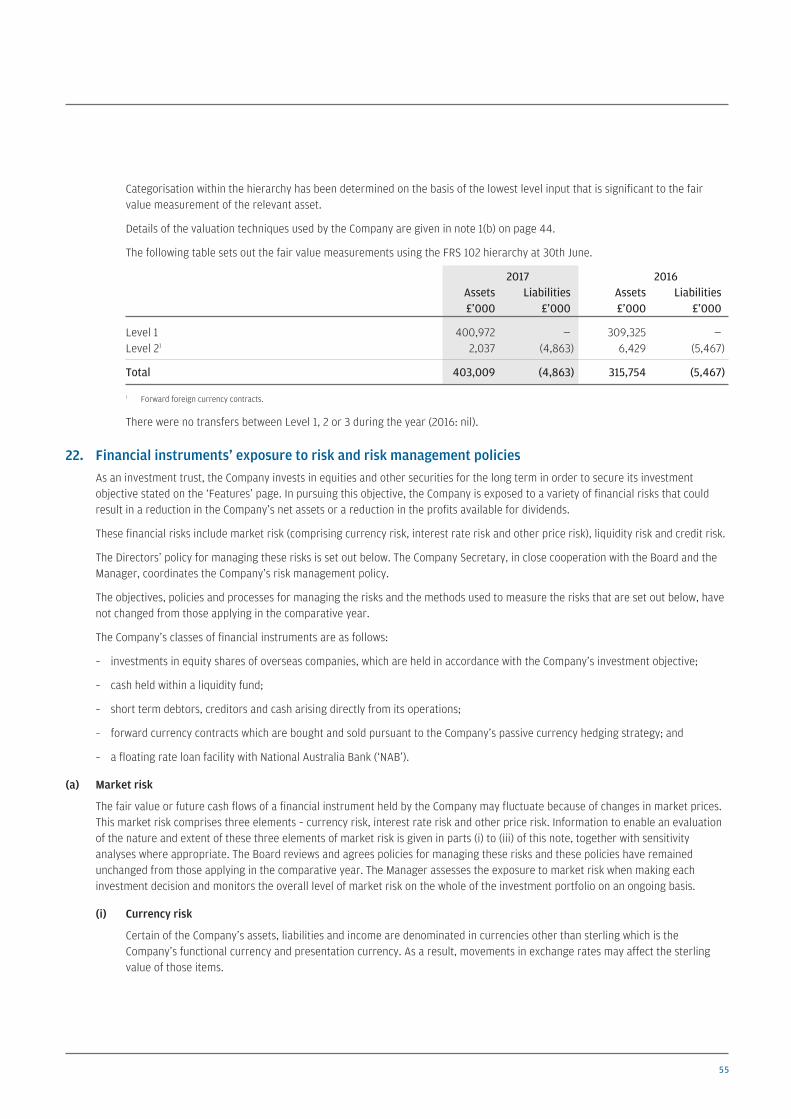
55
Categorisation within the hierarchy has been determined on the basis of the lowest level input that is significant to the fairvalue measurement of the relevant asset.
Details of the valuation techniques used by the Company are given in note 1(b) on page 44.
The following table sets out the fair value measurements using the FRS 102 hierarchy at 30th June.
2017 2016Assets Liabilities Assets Liabilities £’000 £’000 £’000 £’000
Level 1 400,972 — 309,325 —Level 21 2,037 (4,863) 6,429 (5,467)
Total 403,009 (4,863) 315,754 (5,467)
1 Forward foreign currency contracts.
There were no transfers between Level 1, 2 or 3 during the year (2016: nil).
22. Financial instruments’ exposure to risk and risk management policies As an investment trust, the Company invests in equities and other securities for the long term in order to secure its investmentobjective stated on the ‘Features’ page. In pursuing this objective, the Company is exposed to a variety of financial risks that couldresult in a reduction in the Company’s net assets or a reduction in the profits available for dividends.
These financial risks include market risk (comprising currency risk, interest rate risk and other price risk), liquidity risk and credit risk.
The Directors’ policy for managing these risks is set out below. The Company Secretary, in close cooperation with the Board and theManager, coordinates the Company’s risk management policy.
The objectives, policies and processes for managing the risks and the methods used to measure the risks that are set out below, havenot changed from those applying in the comparative year.
The Company’s classes of financial instruments are as follows:
– investments in equity shares of overseas companies, which are held in accordance with the Company’s investment objective;
– cash held within a liquidity fund;
– short term debtors, creditors and cash arising directly from its operations;
– forward currency contracts which are bought and sold pursuant to the Company’s passive currency hedging strategy; and
– a floating rate loan facility with National Australia Bank (‘NAB’).
(a) Market risk
The fair value or future cash flows of a financial instrument held by the Company may fluctuate because of changes in market prices.This market risk comprises three elements – currency risk, interest rate risk and other price risk. Information to enable an evaluationof the nature and extent of these three elements of market risk is given in parts (i) to (iii) of this note, together with sensitivityanalyses where appropriate. The Board reviews and agrees policies for managing these risks and these policies have remainedunchanged from those applying in the comparative year. The Manager assesses the exposure to market risk when making eachinvestment decision and monitors the overall level of market risk on the whole of the investment portfolio on an ongoing basis.
(i) Currency risk
Certain of the Company’s assets, liabilities and income are denominated in currencies other than sterling which is theCompany’s functional currency and presentation currency. As a result, movements in exchange rates may affect the sterlingvalue of those items.
Global Growth & Income_pp44_64 19/09/2017 12:29 Page 55
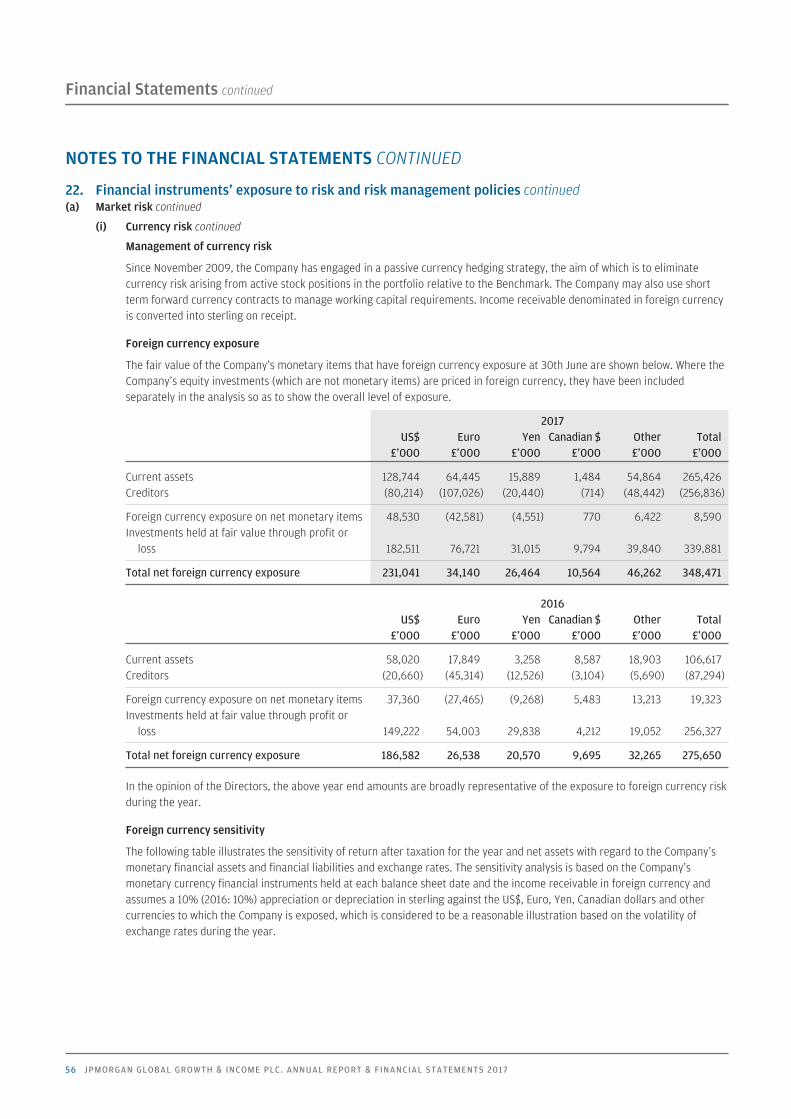
Financial Statements continued
NOTES TO THE FINANCIAL STATEMENTS CONTINUED
56 JPMORGAN GLOBAL GROWTH & INCOME PLC. ANNUAL REPORT & FINANCIAL STATEMENTS 2017
22. Financial instruments’ exposure to risk and risk management policies continued(a) Market risk continued
(i) Currency risk continued
Management of currency risk
Since November 2009, the Company has engaged in a passive currency hedging strategy, the aim of which is to eliminatecurrency risk arising from active stock positions in the portfolio relative to the Benchmark. The Company may also use shortterm forward currency contracts to manage working capital requirements. Income receivable denominated in foreign currencyis converted into sterling on receipt.
Foreign currency exposure
The fair value of the Company’s monetary items that have foreign currency exposure at 30th June are shown below. Where theCompany’s equity investments (which are not monetary items) are priced in foreign currency, they have been includedseparately in the analysis so as to show the overall level of exposure.
2017 US$ Euro Yen Canadian $ Other Total £’000 £’000 £’000 £’000 £’000 £’000
Current assets 128,744 64,445 15,889 1,484 54,864 265,426Creditors (80,214) (107,026) (20,440) (714) (48,442) (256,836)
Foreign currency exposure on net monetary items 48,530 (42,581) (4,551) 770 6,422 8,590Investments held at fair value through profit or
loss 182,511 76,721 31,015 9,794 39,840 339,881
Total net foreign currency exposure 231,041 34,140 26,464 10,564 46,262 348,471
2016 US$ Euro Yen Canadian $ Other Total £’000 £’000 £’000 £’000 £’000 £’000
Current assets 58,020 17,849 3,258 8,587 18,903 106,617 Creditors (20,660) (45,314) (12,526) (3,104) (5,690) (87,294)
Foreign currency exposure on net monetary items 37,360 (27,465) (9,268) 5,483 13,213 19,323 Investments held at fair value through profit or
loss 149,222 54,003 29,838 4,212 19,052 256,327
Total net foreign currency exposure 186,582 26,538 20,570 9,695 32,265 275,650
In the opinion of the Directors, the above year end amounts are broadly representative of the exposure to foreign currency riskduring the year.
Foreign currency sensitivity
The following table illustrates the sensitivity of return after taxation for the year and net assets with regard to the Company’smonetary financial assets and financial liabilities and exchange rates. The sensitivity analysis is based on the Company’smonetary currency financial instruments held at each balance sheet date and the income receivable in foreign currency andassumes a 10% (2016: 10%) appreciation or depreciation in sterling against the US$, Euro, Yen, Canadian dollars and othercurrencies to which the Company is exposed, which is considered to be a reasonable illustration based on the volatility ofexchange rates during the year.
Global Growth & Income_pp44_64 19/09/2017 12:29 Page 56
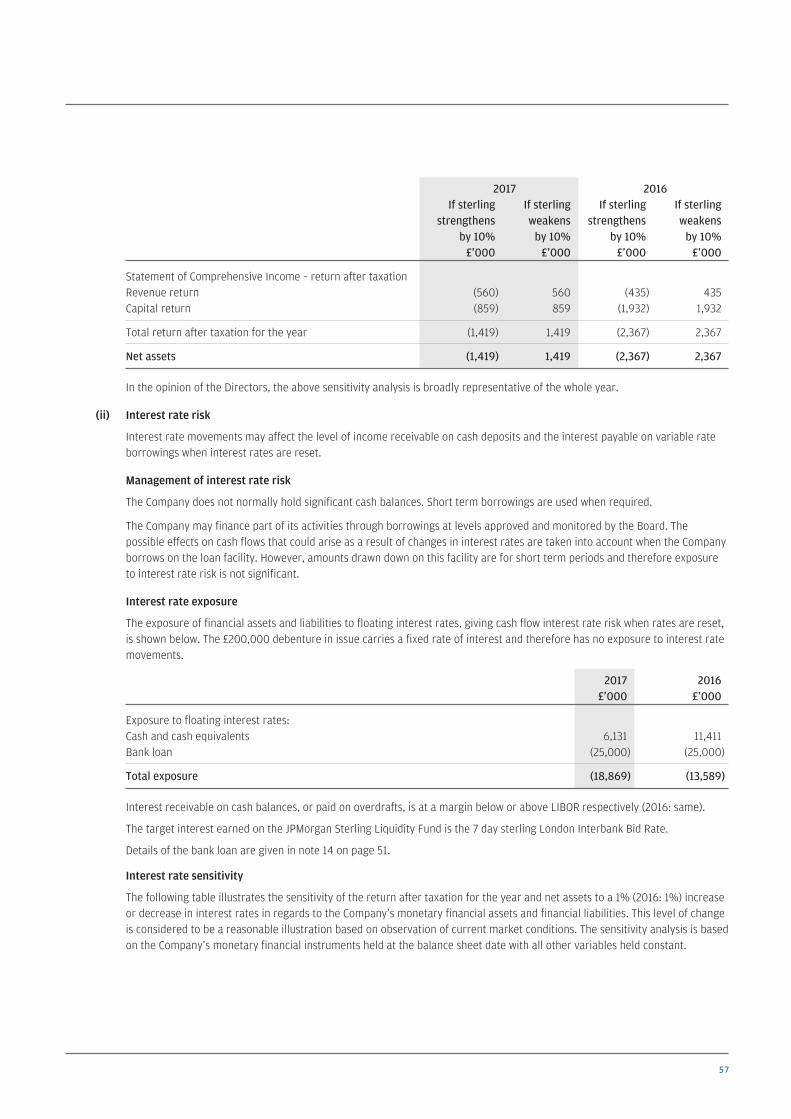
57
2017 2016If sterling If sterling If sterling If sterling
strengthens weakens strengthens weakensby 10% by 10% by 10% by 10%£’000 £’000 £’000 £’000
Statement of Comprehensive Income – return after taxationRevenue return (560) 560 (435) 435Capital return (859) 859 (1,932) 1,932
Total return after taxation for the year (1,419) 1,419 (2,367) 2,367
Net assets (1,419) 1,419 (2,367) 2,367
In the opinion of the Directors, the above sensitivity analysis is broadly representative of the whole year.
(ii) Interest rate risk
Interest rate movements may affect the level of income receivable on cash deposits and the interest payable on variable rateborrowings when interest rates are reset.
Management of interest rate risk
The Company does not normally hold significant cash balances. Short term borrowings are used when required.
The Company may finance part of its activities through borrowings at levels approved and monitored by the Board. Thepossible effects on cash flows that could arise as a result of changes in interest rates are taken into account when the Companyborrows on the loan facility. However, amounts drawn down on this facility are for short term periods and therefore exposureto interest rate risk is not significant.
Interest rate exposure
The exposure of financial assets and liabilities to floating interest rates, giving cash flow interest rate risk when rates are reset,is shown below. The £200,000 debenture in issue carries a fixed rate of interest and therefore has no exposure to interest ratemovements.
2017 2016£’000 £’000
Exposure to floating interest rates:Cash and cash equivalents 6,131 11,411Bank loan (25,000) (25,000)
Total exposure (18,869) (13,589)
Interest receivable on cash balances, or paid on overdrafts, is at a margin below or above LIBOR respectively (2016: same).
The target interest earned on the JPMorgan Sterling Liquidity Fund is the 7 day sterling London Interbank Bid Rate.
Details of the bank loan are given in note 14 on page 51.
Interest rate sensitivity
The following table illustrates the sensitivity of the return after taxation for the year and net assets to a 1% (2016: 1%) increaseor decrease in interest rates in regards to the Company’s monetary financial assets and financial liabilities. This level of changeis considered to be a reasonable illustration based on observation of current market conditions. The sensitivity analysis is basedon the Company’s monetary financial instruments held at the balance sheet date with all other variables held constant.
Global Growth & Income_pp44_64 19/09/2017 12:29 Page 57
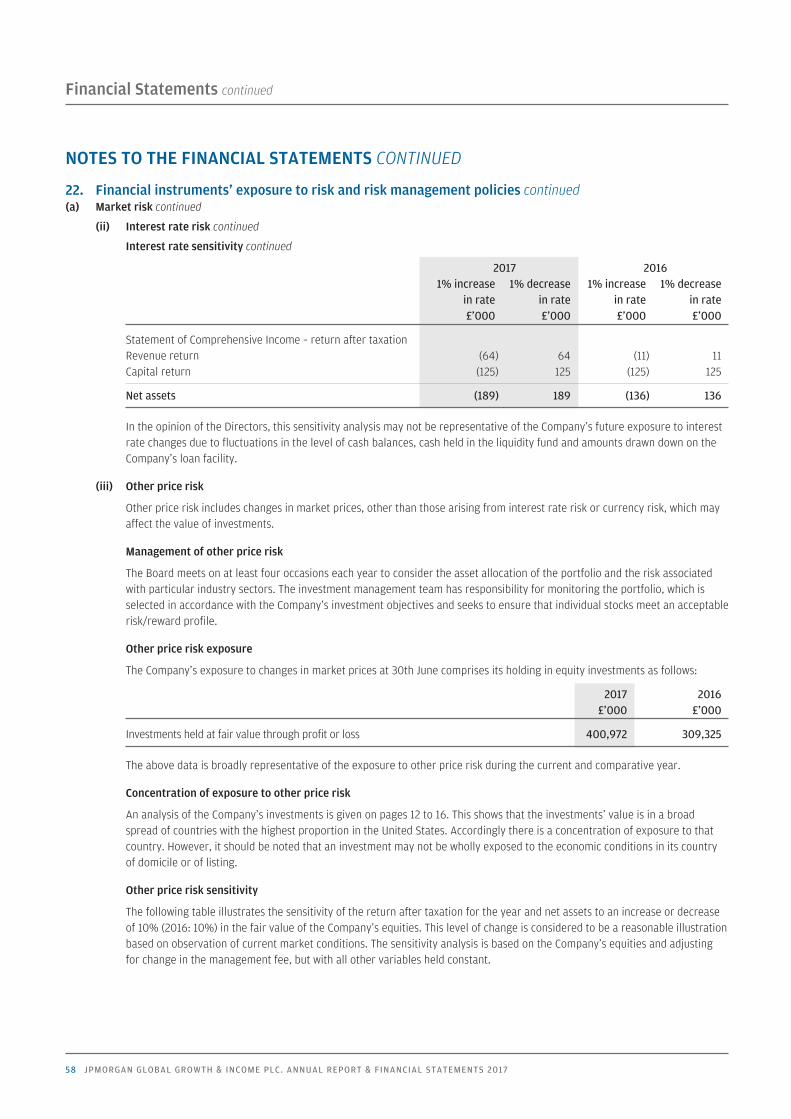
Financial Statements continued
NOTES TO THE FINANCIAL STATEMENTS CONTINUED
58 JPMORGAN GLOBAL GROWTH & INCOME PLC. ANNUAL REPORT & FINANCIAL STATEMENTS 2017
22. Financial instruments’ exposure to risk and risk management policies continued(a) Market risk continued
(ii) Interest rate risk continued
Interest rate sensitivity continued
2017 20161% increase 1% decrease 1% increase 1% decrease
in rate in rate in rate in rate £’000 £’000 £’000 £’000
Statement of Comprehensive Income – return after taxationRevenue return (64) 64 (11) 11Capital return (125) 125 (125) 125
Net assets (189) 189 (136) 136
In the opinion of the Directors, this sensitivity analysis may not be representative of the Company’s future exposure to interestrate changes due to fluctuations in the level of cash balances, cash held in the liquidity fund and amounts drawn down on theCompany’s loan facility.
(iii) Other price risk
Other price risk includes changes in market prices, other than those arising from interest rate risk or currency risk, which mayaffect the value of investments.
Management of other price risk
The Board meets on at least four occasions each year to consider the asset allocation of the portfolio and the risk associatedwith particular industry sectors. The investment management team has responsibility for monitoring the portfolio, which isselected in accordance with the Company’s investment objectives and seeks to ensure that individual stocks meet an acceptablerisk/reward profile.
Other price risk exposure
The Company’s exposure to changes in market prices at 30th June comprises its holding in equity investments as follows:
2017 2016£’000 £’000
Investments held at fair value through profit or loss 400,972 309,325
The above data is broadly representative of the exposure to other price risk during the current and comparative year.
Concentration of exposure to other price risk
An analysis of the Company’s investments is given on pages 12 to 16. This shows that the investments’ value is in a broadspread of countries with the highest proportion in the United States. Accordingly there is a concentration of exposure to thatcountry. However, it should be noted that an investment may not be wholly exposed to the economic conditions in its countryof domicile or of listing.
Other price risk sensitivity
The following table illustrates the sensitivity of the return after taxation for the year and net assets to an increase or decreaseof 10% (2016: 10%) in the fair value of the Company’s equities. This level of change is considered to be a reasonable illustrationbased on observation of current market conditions. The sensitivity analysis is based on the Company’s equities and adjustingfor change in the management fee, but with all other variables held constant.
Global Growth & Income_pp44_64 19/09/2017 12:29 Page 58
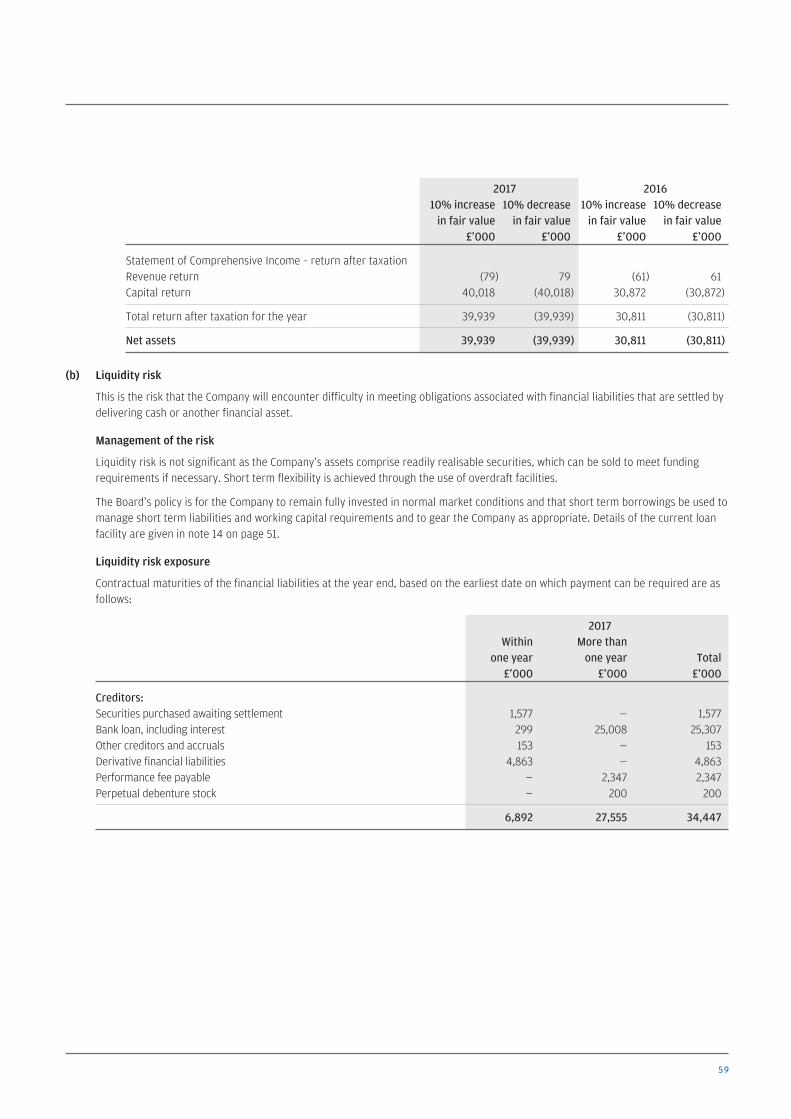
59
2017 201610% increase 10% decrease 10% increase 10% decreasein fair value in fair value in fair value in fair value
£’000 £’000 £’000 £’000
Statement of Comprehensive Income – return after taxationRevenue return (79) 79 (61) 61Capital return 40,018 (40,018) 30,872 (30,872)
Total return after taxation for the year 39,939 (39,939) 30,811 (30,811)
Net assets 39,939 (39,939) 30,811 (30,811)
(b) Liquidity risk
This is the risk that the Company will encounter difficulty in meeting obligations associated with financial liabilities that are settled bydelivering cash or another financial asset.
Management of the risk
Liquidity risk is not significant as the Company’s assets comprise readily realisable securities, which can be sold to meet fundingrequirements if necessary. Short term flexibility is achieved through the use of overdraft facilities.
The Board’s policy is for the Company to remain fully invested in normal market conditions and that short term borrowings be used tomanage short term liabilities and working capital requirements and to gear the Company as appropriate. Details of the current loanfacility are given in note 14 on page 51.
Liquidity risk exposure
Contractual maturities of the financial liabilities at the year end, based on the earliest date on which payment can be required are asfollows:
2017Within More than
one year one year Total£’000 £’000 £’000
Creditors:Securities purchased awaiting settlement 1,577 — 1,577 Bank loan, including interest 299 25,008 25,307 Other creditors and accruals 153 — 153 Derivative financial liabilities 4,863 — 4,863 Performance fee payable — 2,347 2,347Perpetual debenture stock — 200 200
6,892 27,555 34,447
Global Growth & Income_pp44_64 19/09/2017 12:29 Page 59
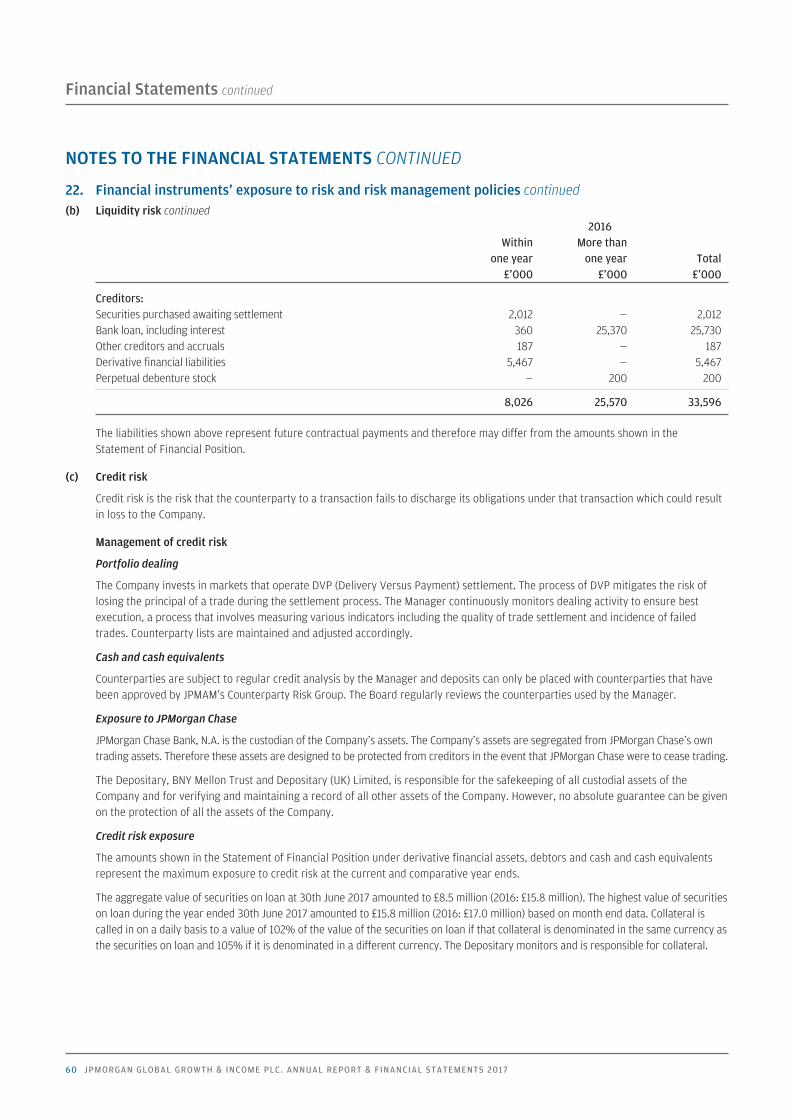
Financial Statements continued
NOTES TO THE FINANCIAL STATEMENTS CONTINUED
60 JPMORGAN GLOBAL GROWTH & INCOME PLC. ANNUAL REPORT & FINANCIAL STATEMENTS 2017
22. Financial instruments’ exposure to risk and risk management policies continued(b) Liquidity risk continued
2016Within More than
one year one year Total£’000 £’000 £’000
Creditors: Securities purchased awaiting settlement 2,012 — 2,012 Bank loan, including interest 360 25,370 25,730 Other creditors and accruals 187 — 187 Derivative financial liabilities 5,467 — 5,467 Perpetual debenture stock — 200 200
8,026 25,570 33,596
The liabilities shown above represent future contractual payments and therefore may differ from the amounts shown in theStatement of Financial Position.
(c) Credit risk
Credit risk is the risk that the counterparty to a transaction fails to discharge its obligations under that transaction which could resultin loss to the Company.
Management of credit risk
Portfolio dealing
The Company invests in markets that operate DVP (Delivery Versus Payment) settlement. The process of DVP mitigates the risk oflosing the principal of a trade during the settlement process. The Manager continuously monitors dealing activity to ensure bestexecution, a process that involves measuring various indicators including the quality of trade settlement and incidence of failedtrades. Counterparty lists are maintained and adjusted accordingly.
Cash and cash equivalents
Counterparties are subject to regular credit analysis by the Manager and deposits can only be placed with counterparties that havebeen approved by JPMAM’s Counterparty Risk Group. The Board regularly reviews the counterparties used by the Manager.
Exposure to JPMorgan Chase
JPMorgan Chase Bank, N.A. is the custodian of the Company’s assets. The Company’s assets are segregated from JPMorgan Chase’s owntrading assets. Therefore these assets are designed to be protected from creditors in the event that JPMorgan Chase were to cease trading.
The Depositary, BNY Mellon Trust and Depositary (UK) Limited, is responsible for the safekeeping of all custodial assets of theCompany and for verifying and maintaining a record of all other assets of the Company. However, no absolute guarantee can be givenon the protection of all the assets of the Company.
Credit risk exposure
The amounts shown in the Statement of Financial Position under derivative financial assets, debtors and cash and cash equivalentsrepresent the maximum exposure to credit risk at the current and comparative year ends.
The aggregate value of securities on loan at 30th June 2017 amounted to £8.5 million (2016: £15.8 million). The highest value of securitieson loan during the year ended 30th June 2017 amounted to £15.8 million (2016: £17.0 million) based on month end data. Collateral iscalled in on a daily basis to a value of 102% of the value of the securities on loan if that collateral is denominated in the same currency asthe securities on loan and 105% if it is denominated in a different currency. The Depositary monitors and is responsible for collateral.
Global Growth & Income_pp44_64 19/09/2017 12:29 Page 60
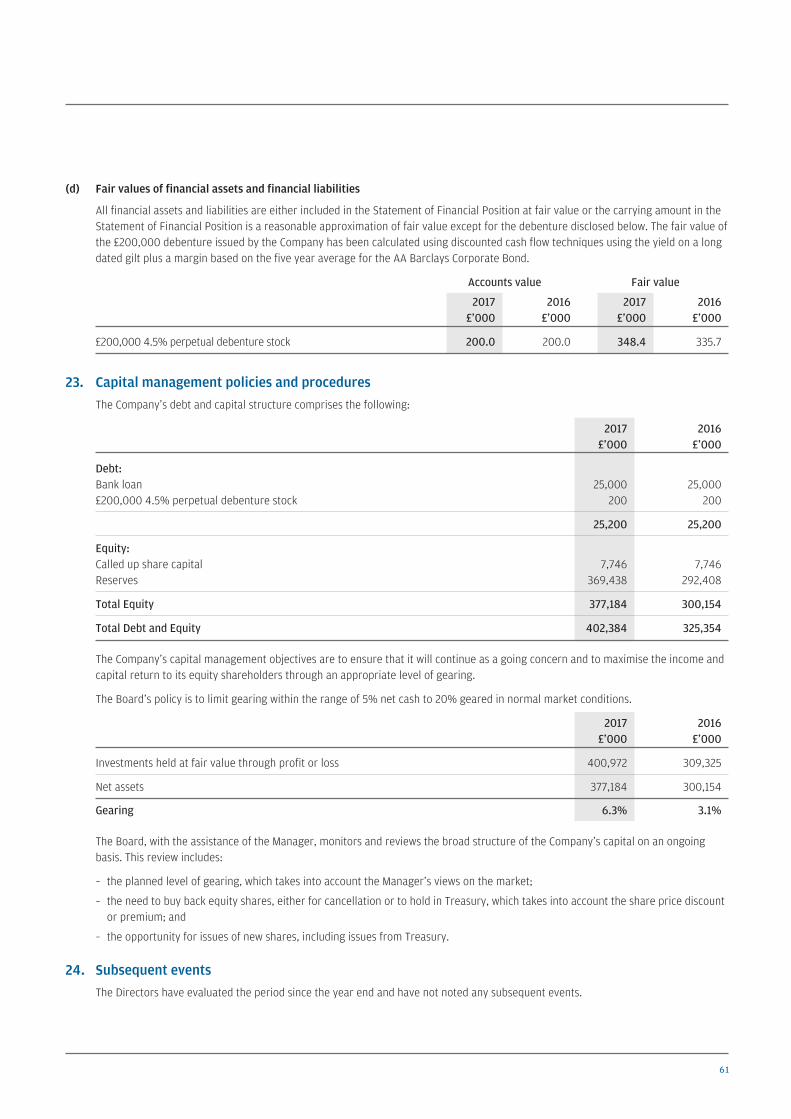
61
(d) Fair values of financial assets and financial liabilities
All financial assets and liabilities are either included in the Statement of Financial Position at fair value or the carrying amount in theStatement of Financial Position is a reasonable approximation of fair value except for the debenture disclosed below. The fair value ofthe £200,000 debenture issued by the Company has been calculated using discounted cash flow techniques using the yield on a longdated gilt plus a margin based on the five year average for the AA Barclays Corporate Bond.
Accounts value Fair value
2017 2016 2017 2016£’000 £’000 £’000 £’000
£200,000 4.5% perpetual debenture stock 200.0 200.0 348.4 335.7
23. Capital management policies and proceduresThe Company’s debt and capital structure comprises the following:
2017 2016£’000 £’000
Debt:Bank loan 25,000 25,000£200,000 4.5% perpetual debenture stock 200 200
25,200 25,200
Equity:Called up share capital 7,746 7,746Reserves 369,438 292,408
Total Equity 377,184 300,154
Total Debt and Equity 402,384 325,354
The Company’s capital management objectives are to ensure that it will continue as a going concern and to maximise the income andcapital return to its equity shareholders through an appropriate level of gearing.
The Board’s policy is to limit gearing within the range of 5% net cash to 20% geared in normal market conditions.
2017 2016£’000 £’000
Investments held at fair value through profit or loss 400,972 309,325
Net assets 377,184 300,154
Gearing 6.3% 3.1%
The Board, with the assistance of the Manager, monitors and reviews the broad structure of the Company’s capital on an ongoingbasis. This review includes:
– the planned level of gearing, which takes into account the Manager’s views on the market;
– the need to buy back equity shares, either for cancellation or to hold in Treasury, which takes into account the share price discountor premium; and
– the opportunity for issues of new shares, including issues from Treasury.
24. Subsequent eventsThe Directors have evaluated the period since the year end and have not noted any subsequent events.
Global Growth & Income_pp44_64 19/09/2017 12:29 Page 61
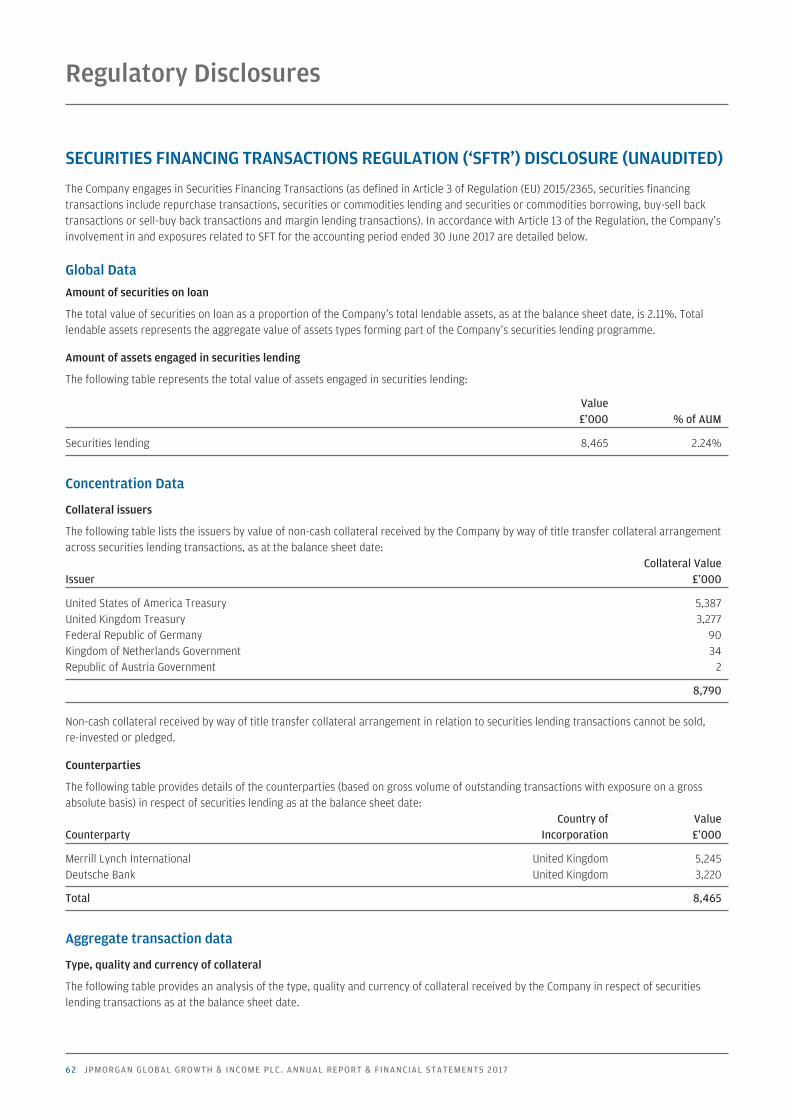
62 JPMORGAN GLOBAL GROWTH & INCOME PLC. ANNUAL REPORT & FINANCIAL STATEMENTS 2017
SECURITIES FINANCING TRANSACTIONS REGULATION (‘SFTR’) DISCLOSURE (UNAUDITED)
The Company engages in Securities Financing Transactions (as defined in Article 3 of Regulation (EU) 2015/2365, securities financingtransactions include repurchase transactions, securities or commodities lending and securities or commodities borrowing, buy-sell backtransactions or sell-buy back transactions and margin lending transactions). In accordance with Article 13 of the Regulation, the Company’sinvolvement in and exposures related to SFT for the accounting period ended 30 June 2017 are detailed below.
Global DataAmount of securities on loan
The total value of securities on loan as a proportion of the Company’s total lendable assets, as at the balance sheet date, is 2.11%. Totallendable assets represents the aggregate value of assets types forming part of the Company’s securities lending programme.
Amount of assets engaged in securities lending
The following table represents the total value of assets engaged in securities lending:
Value£’000 % of AUM
Securities lending 8,465 2.24%
Concentration Data
Collateral issuers
The following table lists the issuers by value of non-cash collateral received by the Company by way of title transfer collateral arrangementacross securities lending transactions, as at the balance sheet date:
Collateral ValueIssuer £’000
United States of America Treasury 5,387 United Kingdom Treasury 3,277 Federal Republic of Germany 90 Kingdom of Netherlands Government 34 Republic of Austria Government 2
8,790
Non-cash collateral received by way of title transfer collateral arrangement in relation to securities lending transactions cannot be sold,re-invested or pledged.
Counterparties
The following table provides details of the counterparties (based on gross volume of outstanding transactions with exposure on a grossabsolute basis) in respect of securities lending as at the balance sheet date:
Country of ValueCounterparty Incorporation £’000
Merrill Lynch International United Kingdom 5,245 Deutsche Bank United Kingdom 3,220
Total 8,465
Aggregate transaction data
Type, quality and currency of collateral
The following table provides an analysis of the type, quality and currency of collateral received by the Company in respect of securitieslending transactions as at the balance sheet date.
Regulatory Disclosures
Global Growth & Income_pp44_64 19/09/2017 12:29 Page 62
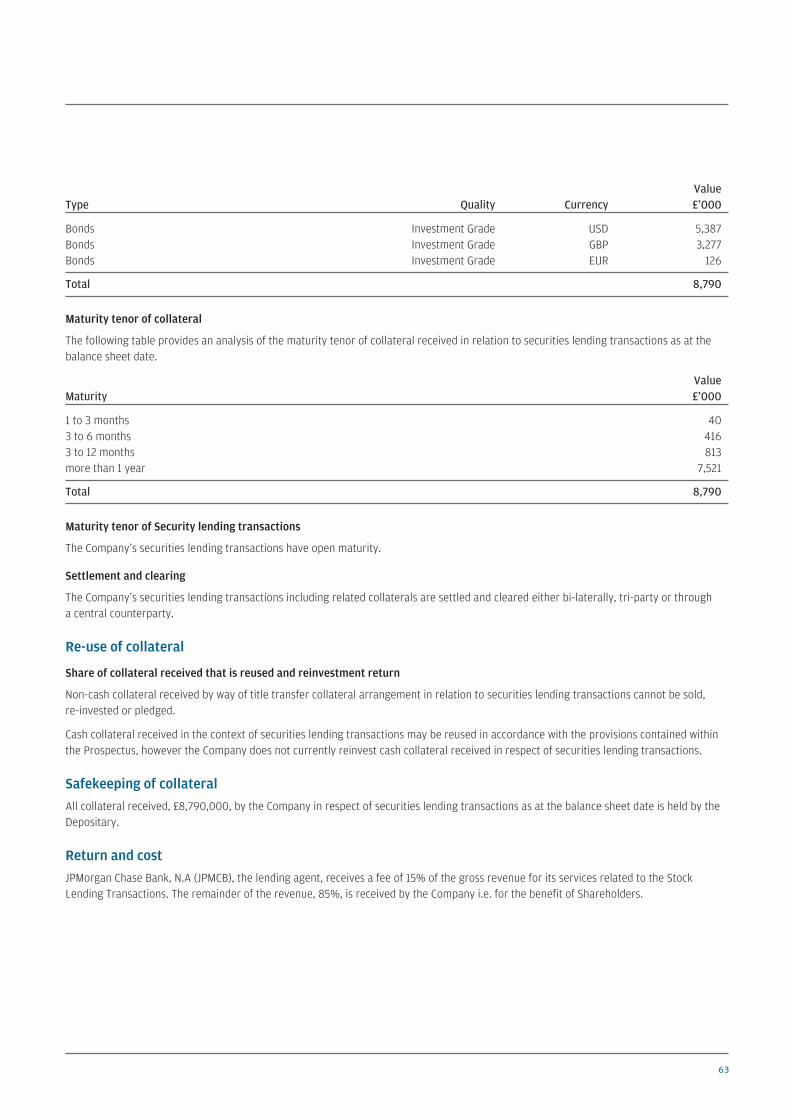
63
ValueType Quality Currency £’000
Bonds Investment Grade USD 5,387 Bonds Investment Grade GBP 3,277 Bonds Investment Grade EUR 126
Total 8,790
Maturity tenor of collateral
The following table provides an analysis of the maturity tenor of collateral received in relation to securities lending transactions as at thebalance sheet date.
ValueMaturity £’000
1 to 3 months 40 3 to 6 months 416 3 to 12 months 813 more than 1 year 7,521
Total 8,790
Maturity tenor of Security lending transactions
The Company’s securities lending transactions have open maturity.
Settlement and clearing
The Company’s securities lending transactions including related collaterals are settled and cleared either bi-laterally, tri-party or througha central counterparty.
Re-use of collateral
Share of collateral received that is reused and reinvestment return
Non-cash collateral received by way of title transfer collateral arrangement in relation to securities lending transactions cannot be sold,re-invested or pledged.
Cash collateral received in the context of securities lending transactions may be reused in accordance with the provisions contained withinthe Prospectus, however the Company does not currently reinvest cash collateral received in respect of securities lending transactions.
Safekeeping of collateralAll collateral received, £8,790,000, by the Company in respect of securities lending transactions as at the balance sheet date is held by theDepositary.
Return and cost JPMorgan Chase Bank, N.A (JPMCB), the lending agent, receives a fee of 15% of the gross revenue for its services related to the StockLending Transactions. The remainder of the revenue, 85%, is received by the Company i.e. for the benefit of Shareholders.
Global Growth & Income_pp44_64 19/09/2017 12:29 Page 63
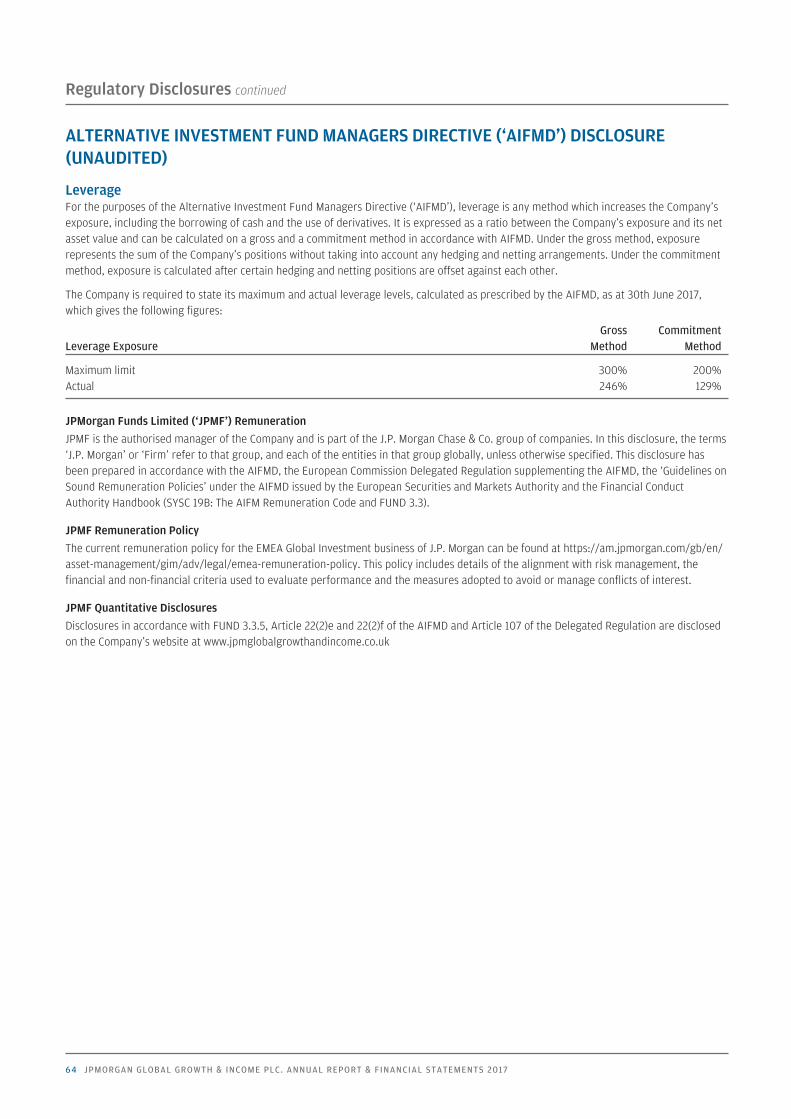
64 JPMORGAN GLOBAL GROWTH & INCOME PLC. ANNUAL REPORT & FINANCIAL STATEMENTS 2017
ALTERNATIVE INVESTMENT FUND MANAGERS DIRECTIVE (‘AIFMD’) DISCLOSURE(UNAUDITED)
LeverageFor the purposes of the Alternative Investment Fund Managers Directive (‘AIFMD’), leverage is any method which increases the Company’sexposure, including the borrowing of cash and the use of derivatives. It is expressed as a ratio between the Company’s exposure and its netasset value and can be calculated on a gross and a commitment method in accordance with AIFMD. Under the gross method, exposurerepresents the sum of the Company’s positions without taking into account any hedging and netting arrangements. Under the commitmentmethod, exposure is calculated after certain hedging and netting positions are offset against each other.
The Company is required to state its maximum and actual leverage levels, calculated as prescribed by the AIFMD, as at 30th June 2017,which gives the following figures:
Gross CommitmentLeverage Exposure Method Method
Maximum limit 300% 200%Actual 246% 129%
JPMorgan Funds Limited (‘JPMF’) Remuneration JPMF is the authorised manager of the Company and is part of the J.P. Morgan Chase & Co. group of companies. In this disclosure, the terms‘J.P. Morgan’ or ‘Firm’ refer to that group, and each of the entities in that group globally, unless otherwise specified. This disclosure hasbeen prepared in accordance with the AIFMD, the European Commission Delegated Regulation supplementing the AIFMD, the ‘Guidelines onSound Remuneration Policies’ under the AIFMD issued by the European Securities and Markets Authority and the Financial ConductAuthority Handbook (SYSC 19B: The AIFM Remuneration Code and FUND 3.3).
JPMF Remuneration PolicyThe current remuneration policy for the EMEA Global Investment business of J.P. Morgan can be found at https://am.jpmorgan.com/gb/en/asset-management/gim/adv/legal/emea-remuneration-policy. This policy includes details of the alignment with risk management, thefinancial and non-financial criteria used to evaluate performance and the measures adopted to avoid or manage conflicts of interest.
JPMF Quantitative DisclosuresDisclosures in accordance with FUND 3.3.5, Article 22(2)e and 22(2)f of the AIFMD and Article 107 of the Delegated Regulation are disclosedon the Company’s website at www.jpmglobalgrowthandincome.co.uk
Regulatory Disclosures continued
Global Growth & Income_pp44_64 19/09/2017 12:29 Page 64
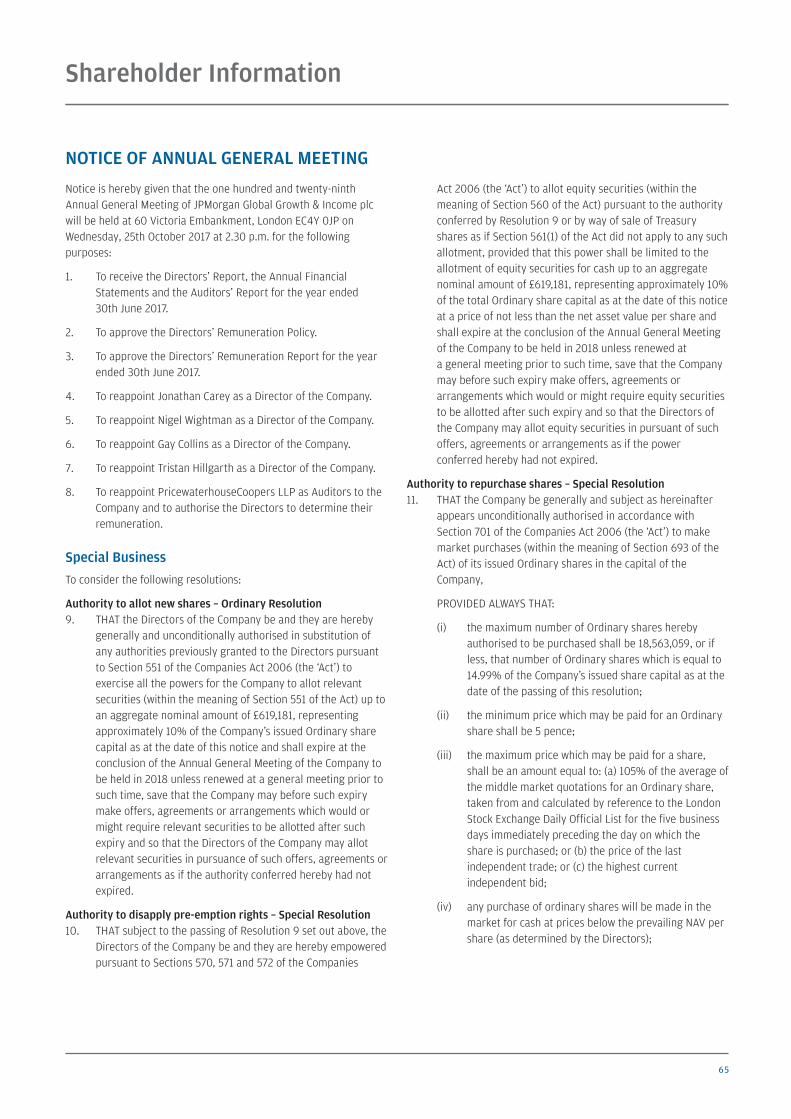
65
NOTICE OF ANNUAL GENERAL MEETING
Notice is hereby given that the one hundred and twenty-ninthAnnual General Meeting of JPMorgan Global Growth & Income plcwill be held at 60 Victoria Embankment, London EC4Y 0JP onWednesday, 25th October 2017 at 2.30 p.m. for the followingpurposes:
1. To receive the Directors’ Report, the Annual FinancialStatements and the Auditors’ Report for the year ended30th June 2017.
2. To approve the Directors’ Remuneration Policy.
3. To approve the Directors’ Remuneration Report for the yearended 30th June 2017.
4. To reappoint Jonathan Carey as a Director of the Company.
5. To reappoint Nigel Wightman as a Director of the Company.
6. To reappoint Gay Collins as a Director of the Company.
7. To reappoint Tristan Hillgarth as a Director of the Company.
8. To reappoint PricewaterhouseCoopers LLP as Auditors to theCompany and to authorise the Directors to determine theirremuneration.
Special Business To consider the following resolutions:
Authority to allot new shares – Ordinary Resolution9. THAT the Directors of the Company be and they are hereby
generally and unconditionally authorised in substitution ofany authorities previously granted to the Directors pursuantto Section 551 of the Companies Act 2006 (the ‘Act’) toexercise all the powers for the Company to allot relevantsecurities (within the meaning of Section 551 of the Act) up toan aggregate nominal amount of £619,181, representingapproximately 10% of the Company’s issued Ordinary sharecapital as at the date of this notice and shall expire at theconclusion of the Annual General Meeting of the Company tobe held in 2018 unless renewed at a general meeting prior tosuch time, save that the Company may before such expirymake offers, agreements or arrangements which would ormight require relevant securities to be allotted after suchexpiry and so that the Directors of the Company may allotrelevant securities in pursuance of such offers, agreements orarrangements as if the authority conferred hereby had notexpired.
Authority to disapply pre-emption rights – Special Resolution 10. THAT subject to the passing of Resolution 9 set out above, the
Directors of the Company be and they are hereby empoweredpursuant to Sections 570, 571 and 572 of the Companies
Act 2006 (the ‘Act’) to allot equity securities (within themeaning of Section 560 of the Act) pursuant to the authorityconferred by Resolution 9 or by way of sale of Treasuryshares as if Section 561(1) of the Act did not apply to any suchallotment, provided that this power shall be limited to theallotment of equity securities for cash up to an aggregatenominal amount of £619,181, representing approximately 10%of the total Ordinary share capital as at the date of this noticeat a price of not less than the net asset value per share andshall expire at the conclusion of the Annual General Meetingof the Company to be held in 2018 unless renewed ata general meeting prior to such time, save that the Companymay before such expiry make offers, agreements orarrangements which would or might require equity securitiesto be allotted after such expiry and so that the Directors ofthe Company may allot equity securities in pursuant of suchoffers, agreements or arrangements as if the powerconferred hereby had not expired.
Authority to repurchase shares – Special Resolution 11. THAT the Company be generally and subject as hereinafter
appears unconditionally authorised in accordance withSection 701 of the Companies Act 2006 (the ‘Act’) to makemarket purchases (within the meaning of Section 693 of theAct) of its issued Ordinary shares in the capital of theCompany,
PROVIDED ALWAYS THAT:
(i) the maximum number of Ordinary shares herebyauthorised to be purchased shall be 18,563,059, or ifless, that number of Ordinary shares which is equal to14.99% of the Company’s issued share capital as at thedate of the passing of this resolution;
(ii) the minimum price which may be paid for an Ordinaryshare shall be 5 pence;
(iii) the maximum price which may be paid for a share,shall be an amount equal to: (a) 105% of the average ofthe middle market quotations for an Ordinary share,taken from and calculated by reference to the LondonStock Exchange Daily Official List for the five businessdays immediately preceding the day on which theshare is purchased; or (b) the price of the lastindependent trade; or (c) the highest currentindependent bid;
(iv) any purchase of ordinary shares will be made in themarket for cash at prices below the prevailing NAV pershare (as determined by the Directors);
Shareholder Information
Global Growth & Income_pp65_70 19/09/2017 12:39 Page 65
66 JPMORGAN GLOBAL GROWTH & INCOME PLC. ANNUAL REPORT & FINANCIAL STATEMENTS 2017
Shareholder Information continued
NOTICE OF ANNUAL GENERAL MEETING CONTINUED
(v) the authority hereby conferred shall expire on24th April 2019 unless the authority is renewed at theCompany’s Annual General Meeting in 2018 or at anyother general meeting prior to such time; and
(vi) the Company may make a contract to purchaseordinary shares under the authority hereby conferredprior to the expiry of such authority and may makea purchase of shares pursuant to any such contractnotwithstanding such expiry.
By order of the BoardDivya Amin, for and on behalf of JPMorgan Funds Limited, Secretary
19th September 2017
Notes These notes should be read in conjunction with the notes on the reverse ofthe proxy form.
1. A member entitled to attend and vote at the Meeting may appointanother person(s) (who need not be a member of the Company) toexercise all or any of his rights to attend, speak and vote at theMeeting. A member can appoint more than one proxy in relation to theMeeting, provided that each proxy is appointed to exercise the rightsattaching to different shares held by him.
2. A proxy does not need to be a member of the Company but mustattend the Meeting to represent you. Your proxy could be theChairman, another director of the Company or another person who hasagreed to attend to represent you. Details of how to appoint theChairman or another person(s) as your proxy or proxies using theproxy form are set out in the notes to the proxy form. If a voting box onthe proxy form is left blank, the proxy or proxies will exercise his/theirdiscretion both as to how to vote and whether he/they abstain(s) fromvoting. Your proxy must attend the Meeting for your vote to count.Appointing a proxy or proxies does not preclude you from attendingthe Meeting and voting in person.
3. Any instrument appointing a proxy, to be valid, must be lodged inaccordance with the instructions given on the proxy form no later than2.30 p.m. two business days prior to the Meeting (i.e. excludingweekends and bank holidays).
4. You may change your proxy instructions by returning a new proxyappointment. The deadline for receipt of proxy appointments(see above) also applies in relation to amended instructions. Anyattempt to terminate or amend a proxy appointment received after therelevant deadline will be disregarded. Where two or more validseparate appointments of proxy are received in respect of the sameshare in respect of the same Meeting, the one which is last sent shallbe treated as replacing and revoking the other or others.
5. To be entitled to attend and vote at the Meeting (and for the purpose ofthe determination by the Company of the number of votes they maycast), members must be entered on the Company’s register ofmembers as at 6.30 p.m. two business days prior to the Meeting (the‘specified time’). If the Meeting is adjourned to a time not more than48 hours after the specified time applicable to the original Meeting,that time will also apply for the purpose of determining the entitlementof members to attend and vote (and for the purpose of determining thenumber of votes they may cast) at the adjourned Meeting. If howeverthe Meeting is adjourned for a longer period then, to be so entitled,members must be entered on the Company’s register of members as at6.30 p.m. two business days prior to the adjourned Meeting or, if theCompany gives notice of the adjourned Meeting, at the time specifiedin that notice.
Global Growth & Income_pp65_70 19/09/2017 12:29 Page 66
67
6. Entry to the Meeting will be restricted to shareholders, with guestsadmitted only by prior arrangement.
7. A corporation, which is a shareholder, may appoint an individual(s) toact as its representative(s) and to vote in person at the Meeting (seeinstructions given on the proxy form). In accordance with theprovisions of the Companies Act 2006 (as amended by the ShareholderRights Directive 2009, each such representative(s) may exercise thesame powers as the corporation could exercise if it were an individualmember of the Company, provided that they do not do so in relation tothe same shares. It is therefore no longer necessary to nominatea designated corporate representative.
Representatives should bring to the meeting evidence of theirappointment, including any authority under which it is signed.
8. Members that satisfy the thresholds in Section 527 of the CompaniesAct 2006 can require the Company to publish a statement on itswebsite setting out any matter relating to: (a) the audit of thecompany’s financial statements (including the auditors’ report and theconduct of the audit) that are to be laid before the AGM; or (b) anycircumstances connected with an auditor of the company ceasing tohold office since the previous AGM; which the members propose toraise at the meeting. The Company cannot require the membersrequesting the publication to pay its expenses. Any statement placedon the website must also be sent to the Company’s Auditors no laterthan the time it makes its statement available on the website.
9. Pursuant to Section 319A of the Companies Act 2006, the Companymust cause to be answered at the AGM any question relating to thebusiness being dealt with at the AGM which is put by a memberattending the meeting; no answer need be given if it is undesirable inthe interests of the Company or the good order of the meeting.
10. Under Sections 338 and 338A of the 2006 Act, members meeting thethreshold requirements in those sections have the right to require theCompany: (i) to give, to members of the Company entitled to receivenotice of the Meeting, notice of a resolution which those membersintend to move (and which may properly be moved) at the Meeting;and/or (ii) to include in the business to be dealt with at the Meeting anymatter (other than a proposed resolution) which may properly beincluded in the business at the Meeting. A resolution may properly bemoved, or a matter properly included in the business unless: (a) (in thecase of a resolution only) it would, if passed, be ineffective (whether byreason of any inconsistency with any enactment or the Company’sconstitution or otherwise); (b) it is defamatory of any person; or (c) it isfrivolous or vexatious. A request made pursuant to this right may be inhard copy or electronic form, must identify the resolution of whichnotice is to be given or the matter to be included in the business, mustbe accompanied by a statement setting out the grounds for therequest, must be authenticated by the person(s) making it and must bereceived by the Company not later than the date that is six clear weeksbefore the Meeting, and (in the case of a matter to be included in thebusiness only) must be accompanied by a statement setting out thegrounds for the request.
11. A copy of this notice has been sent for information only to persons whohave been nominated by a member to enjoy information rights underSection 146 of the Companies Act 2006 (a ‘Nominated Person’). Therights to appoint a proxy can not be exercised by a Nominated Person:they can only be exercised by the member. However, a NominatedPerson may have a right under an agreement between him and themember by whom he was nominated to be appointed as a proxy for theMeeting or to have someone else so appointed. If a Nominated Persondoes not have such a right or does not wish to exercise it, he may havea right under such an agreement to give instructions to the member asto the exercise of voting rights.
12. In accordance with Section 311A of the Companies Act 2006, thecontents of this notice of meeting, details of the total number of sharesin respect of which members are entitled to exercise voting rights atthe AGM, the total voting rights members are entitled to exercise at theAGM and, if applicable, any members’ statements, members’resolutions or members’ matters of business received by the Companyafter the date of this notice will be available on the Company’s websitewww.jpmglobalgrowthandincome.co.uk
13. The register of interests of the Directors and connected persons in theshare capital of the Company is available for inspection at theCompany’s registered office during usual business hours on anyweekday (Saturdays, Sundays and public holidays excepted). It will alsobe available for inspection at the Annual General Meeting.
14. You may not use any electronic address provided in this Notice ofMeeting to communicate with the Company for any purposes otherthan those expressly stated.
15. As an alternative to completing a hard copy Form of Proxy/VotingDirection Form, you can appoint a proxy or proxies electronically byvisiting www.sharevote.co.uk. You will need your Voting ID, Task ID andShareholder Reference Number (this is the series of numbers printedunder your name on the Form of Proxy/Voting Direction Form).Alternatively, if you have already registered with Equiniti Limited’sonline portfolio service, Shareview, you can submit your Form of Proxyat www.shareview.co.uk. Full instructions are given on both websites.
16. As at 15th September 2017 (being the latest business day prior to thepublication of this Notice), the Company’s issued share capital consistsof 123,836,285 Ordinary shares (excluding 31,069,215 shares held intreasury), carrying one vote for every share held. Therefore, the totalvoting rights in the Company are 123,836,285.
Electronic appointment – CREST membersCREST members who wish to appoint a proxy or proxies by utilising theCREST electronic proxy appointment service may do so for the Meeting andany adjournment(s) thereof by using the procedures described in the CRESTManual. See further instructions on the proxy form.
Global Growth & Income_pp65_70 19/09/2017 12:29 Page 67
68 JPMORGAN GLOBAL GROWTH & INCOME PLC. ANNUAL REPORT & FINANCIAL STATEMENTS 2017
Shareholder Information continued
GLOSSARY OF TERMS AND ALTERNATIVE PERFORMANCE MEASURES
Return to shareholdersTotal return to the ordinary shareholders, on a last traded price tolast traded price basis, assuming that all dividends received werereinvested, without transaction costs, in the Ordinary shares of theCompany at the time the shares were quoted ex-dividend(see page 2).
Return on net assetsTotal return on net asset value (‘NAV’) per share, on a bid value tobid value basis, assuming that all dividends paid out by theCompany were reinvested in the shares of the Company at the NAVper share at the time the shares were quoted ex-dividend.
In accordance with industry practice, dividends payable which havebeen declared but which are unpaid at the balance sheet date arededucted from the NAV per share when calculating the return onnet assets (see page 2).
Benchmark return Total return on the benchmark, on a closing-market value toclosing-market value basis, assuming that all dividends receivedwere reinvested in the shares of the underlying companies at thetime the shares were quoted ex-dividend (see page 2).
The benchmark is a recognised index of stocks which should not betaken as wholly representative of the Company’s investmentuniverse. The Company’s investment strategy does not follow or‘track’ this index and consequently, there may be some divergencebetween the Company’s performance and that of the benchmark.
Gearing/Net cashGearing represents the excess amount above shareholders’ funds oftotal investments, expressed as a percentage of the shareholders’funds and is calculated in accordance with guidance issued by theAssociation of Investment Companies (see page 9). If the amountcalculated is negative, this is shown as a ‘net cash’ position.
Ongoing charges The ongoing charges represent the Company’s management fee andall other operating expenses, excluding finance costs, expressed asa percentage of the average daily net assets during the year(see page 9).
Share price discount/premium to net asset value(‘NAV’) If the share price of an investment trust is lower than the NAV pershare, the shares are said to be trading at a discount. The discountis shown as a percentage of the NAV (see page 9). The opposite ofa discount is a premium. It is more common for an investmenttrust’s shares to trade at a discount than at a premium. The Boardcontinues to operate a share repurchase policy which seeks toaddress imbalances in supply of and demand for the Company’sshares within the market and thereby minimise the volatility andabsolute level of the discount to NAV at which the Company’s sharestrade. Under this policy, the Company repurchases its shares withthe aim of maintaining an average discount of around 5% with anyborrowings valued at book value.
Performance attribution Analysis of how the Company achieved its recorded performancerelative to its benchmark (see page 3).
Performance Attribution Definitions:Asset allocation Measures the impact of allocating assets differently from those inthe benchmark, via the portfolio’s weighting in differentcountries, sectors or asset types.
Stock selection Measures the effect of investing in securities to a greater orlesser extent than their weighting in the benchmark, or ofinvesting in securities which are not included in the benchmark.
Gearing/Cash effect Measures the impact on returns of borrowings or cash balanceson the Company’s relative performance.
Currency Measures the impact of investing in different currencies on theperformance which is measured in sterling terms.
Management fee/Other expenses The payment of fees and expenses reduces the level of totalassets, and therefore has a negative effect on relativeperformance.
Performance feeMeasures the effect of a performance fee charge or writeback.
Global Growth & Income_pp65_70 19/09/2017 12:29 Page 68

69
WHERE TO BUY J.P. MORGAN INVESTMENT TRUSTS
You can invest in a J.P. Morgan investment trust through the following;
1. Directly from J.P. MorganInvestment AccountThe Company’s shares are available in the J.P. Morgan InvestmentAccount, which facilitates both regular monthly investments andoccasional lump sum investments in the Company’s ordinary shares.Shareholders who would like information on the Investment Accountshould call J.P. Morgan Asset Management free on 0800 20 40 20 orvisit its website at am.jpmorgan.co.uk/investor
Stocks & Shares Individual Savings Accounts (ISA)The Company’s shares are eligible investments within a J.P. MorganISA. For the 2017/18 tax year, from 6th April 2017 and ending 5th April2018, the total ISA allowance is £20,000. The shares are also availablein a J.P. Morgan Junior ISA. Details are available from J.P. Morgan AssetManagement free on 0800 20 40 20 or via its website atam.jpmorgan.co.uk/investor
2. Via a third party provider Third party providers include;
Please note this list is not exhaustive and the availability of individualtrusts may vary depending on the provider. These websites are thirdparty sites and J.P. Morgan Asset Management does not endorse orrecommend any. Please observe each site’s privacy and cookie policiesas well as their platform charges structure.
3. Through a professional adviserProfessional advisers are usually able to access the products of all thecompanies in the market and can help you find an investment thatsuits your individual circumstances. An adviser will let you know thefee for their service before you go ahead. You can find an adviser atunbiased.co.uk
You may also buy investment trusts through stockbrokers, wealthmanagers and banks.
To familiarise yourself with the Financial Conduct Authority (FCA)adviser charging and commission rules, visit fca.org.uk
AJ BellAlliance Trust SavingsBarclays StockbrokersBestinvestCharles Stanley DirectFundsNetworkHargreaves Lansdown
Interactive InvestorJames BrearleyJames HaySelftradeTD DirectThe Share Centre
Avoid investment fraud1 Reject cold calls
If you’ve received unsolicited contact about an investment opportunity, chances are it’s a high risk investment or a scam. You should treat the call with extreme caution. The safest thing to do is to hang up.
2 Check the FCA Warning List The FCA Warning List is a list of �rms and individuals we know are operating without our authorisation.
3 Get impartial advice Think about getting impartial �nancial advice before you hand over any money. Seek advice from someone unconnected to the �rm that has approached you.
Report a ScamIf you suspect that you have been approached by fraudsters please tell the FCA using the reporting form at www.fca.org.uk/consumers/report-scam-unauthorised-�rm. You can also call the FCA Consumer Helpline on 0800 111 6768
If you have lost money to investment fraud, you should report it to Action Fraud on 0300 123 2040 or online at www.actionfraud.police.uk
Find out more at www.fca.org.uk/scamsmart
Investment scams are designed to look like genuine investmentsSpot the warning signs
Have you been:
• contacted out of the blue• promised tempting returns
and told the investment is safe• called repeatedly, or• told the offer is only available
for a limited time?
If so, you might have been contacted by fraudsters. Remember: if it sounds too good to be true,
it probably is!
Be ScamSmart
Global Growth & Income_pp65_70 19/09/2017 12:29 Page 69
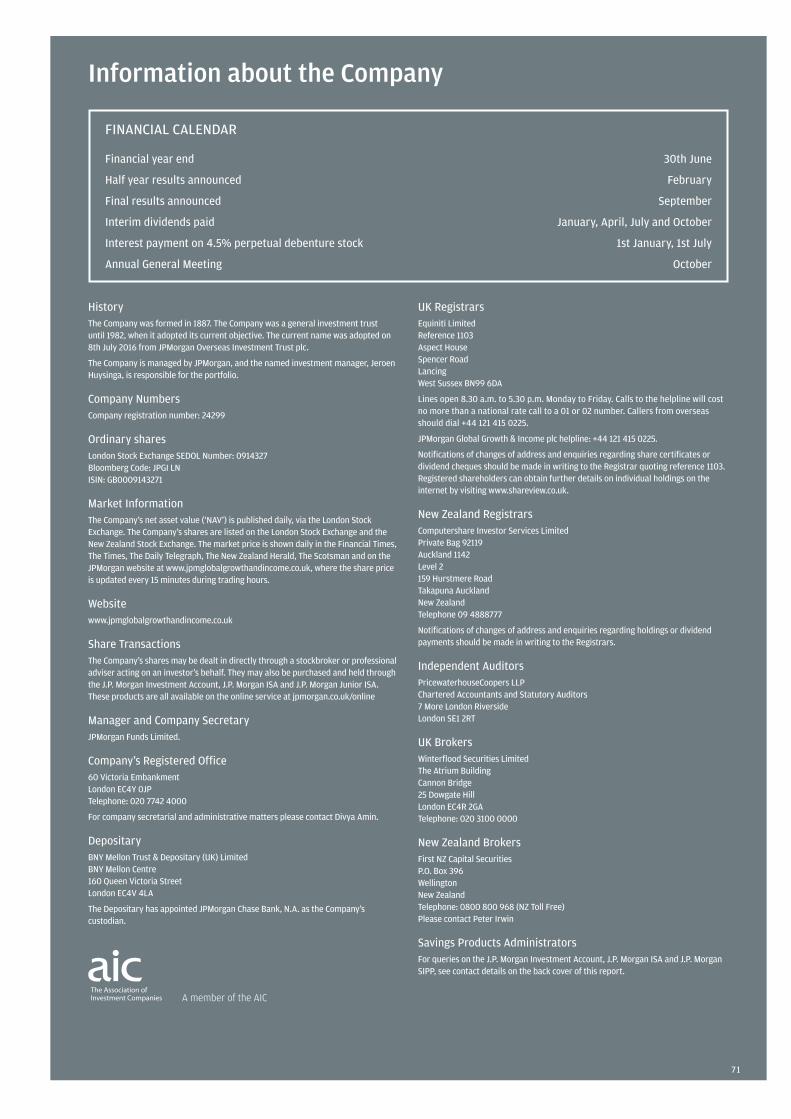
Information about the Company
HistoryThe Company was formed in 1887. The Company was a general investment trustuntil 1982, when it adopted its current objective. The current name was adopted on8th July 2016 from JPMorgan Overseas Investment Trust plc.
The Company is managed by JPMorgan, and the named investment manager, JeroenHuysinga, is responsible for the portfolio.
Company Numbers Company registration number: 24299
Ordinary sharesLondon Stock Exchange SEDOL Number: 0914327Bloomberg Code: JPGI LNISIN: GB0009143271
Market Information The Company’s net asset value (‘NAV’) is published daily, via the London StockExchange. The Company’s shares are listed on the London Stock Exchange and theNew Zealand Stock Exchange. The market price is shown daily in the Financial Times,The Times, The Daily Telegraph, The New Zealand Herald, The Scotsman and on theJPMorgan website at www.jpmglobalgrowthandincome.co.uk, where the share priceis updated every 15 minutes during trading hours.
Website www.jpmglobalgrowthandincome.co.uk
Share Transactions The Company’s shares may be dealt in directly through a stockbroker or professionaladviser acting on an investor’s behalf. They may also be purchased and held throughthe J.P. Morgan Investment Account, J.P. Morgan ISA and J.P. Morgan Junior ISA.These products are all available on the online service at jpmorgan.co.uk/online
Manager and Company Secretary JPMorgan Funds Limited.
Company’s Registered Office 60 Victoria EmbankmentLondon EC4Y 0JPTelephone: 020 7742 4000
For company secretarial and administrative matters please contact Divya Amin.
Depositary BNY Mellon Trust & Depositary (UK) LimitedBNY Mellon Centre160 Queen Victoria StreetLondon EC4V 4LA
The Depositary has appointed JPMorgan Chase Bank, N.A. as the Company’scustodian.
UK Registrars Equiniti LimitedReference 1103Aspect HouseSpencer RoadLancing West Sussex BN99 6DA
Lines open 8.30 a.m. to 5.30 p.m. Monday to Friday. Calls to the helpline will costno more than a national rate call to a 01 or 02 number. Callers from overseasshould dial +44 121 415 0225.
JPMorgan Global Growth & Income plc helpline: +44 121 415 0225.
Notifications of changes of address and enquiries regarding share certificates ordividend cheques should be made in writing to the Registrar quoting reference 1103.Registered shareholders can obtain further details on individual holdings on theinternet by visiting www.shareview.co.uk.
New Zealand Registrars Computershare Investor Services LimitedPrivate Bag 92119Auckland 1142Level 2159 Hurstmere RoadTakapuna AucklandNew ZealandTelephone 09 4888777
Notifications of changes of address and enquiries regarding holdings or dividendpayments should be made in writing to the Registrars.
Independent Auditors PricewaterhouseCoopers LLPChartered Accountants and Statutory Auditors7 More London RiversideLondon SE1 2RT
UK Brokers Winterflood Securities LimitedThe Atrium BuildingCannon Bridge25 Dowgate HillLondon EC4R 2GATelephone: 020 3100 0000
New Zealand Brokers First NZ Capital SecuritiesP.O. Box 396WellingtonNew ZealandTelephone: 0800 800 968 (NZ Toll Free)Please contact Peter Irwin
Savings Products Administrators For queries on the J.P. Morgan Investment Account, J.P. Morgan ISA and J.P. MorganSIPP, see contact details on the back cover of this report.
FINANCIAL CALENDAR
Financial year end 30th June
Half year results announced February
Final results announced September
Interim dividends paid January, April, July and October
Interest payment on 4.5% perpetual debenture stock 1st January, 1st July
Annual General Meeting October
A member of the AIC
71
Global Growth & Income cover A4 19/09/2017 13:26 Page IBC1
www.jpmglobalgrowthandincome.co.uk
Telephone calls may be recorded and monitored for security and training purposes.
GB A122 | 09/17
J.P. MORGAN HELPLINE
Freephone 0800 20 40 20 or +44 (0) 1268 444470.Telephone lines are open Monday to Friday, 9am to 5.30pm.
Global Growth & Income cover A4 19/09/2017 13:26 Page BC2