Embed Size (px)
Citation preview
JPMorgan China Growth & Income plc Half Year Report & Financial Statements for the six months ended 31st March 2020
Chinese HY_cover.qxp 22/05/2020 14:15 Page FC1
K E Y F E A T U R E S
J P M O R G A N C H I N A G R O W T H & I N C O M E P L C . H A L F Y E A R R E P O R T & F I N A N C I A L S T A T E M E N T S 2 0 2 0
Your Company
Objective
To provide long term capital growth by investment in ‘Greater China’ companies.
Investment Policies
To invest in companies in ‘Greater China’ (China, Hong Kong and Taiwan) or which derive a substantial part of their revenues or •profits from these territories. This includes companies which are listed or issue ADRs on other exchanges including the U.S.
To use gearing up to a maximum level of 20% of shareholders’ funds to increase potential returns to shareholders. •
To invest no more than 15% of gross assets in other UK listed investment companies (including investment trusts). •
Benchmark
MSCI China Index, with net dividends reinvested, in sterling terms.
Risk
Investors should note that there can be significant economic and political risks inherent in investing in emerging economies. As such, the Greater China markets can exhibit more volatility than developed markets and this should be taken into consideration when evaluating the suitability of the Company as a potential investment.
Capital Structure
At 31st March 2020, the Company’s issued share capital comprised 77,914,965 Ordinary shares of 25p each, including 5,211,777 shares held in Treasury.
Continuation Vote
In accordance with the Company’s Articles of Association, the Directors are required to propose a resolution that the Company continue as an investment trust at the Annual General Meeting in 2023 and every fifth year thereafter.
Management Company and Company Secretary
The Company employs JPMorgan Funds Limited (‘JPMF’ or the ‘Manager’) as its Alternative Investment Fund Manager and Company Secretary. JPMF delegates the management of the Company’s portfolio to JPMorgan Asset Management (UK) Limited (‘JPMAM’).
FCA regulation of ‘non-mainstream pooled investments’ and MiFID II ‘complex instruments’
The Company currently conducts its affairs so that the shares it issues can be recommended by Independent Financial Advisers to ordinary retail investors in accordance with the rules of the Financial Conduct Authority (‘FCA’) in relation to non-mainstream investment products and intends to continue to do so for the foreseeable future.
The shares are excluded from the FCA’s restrictions which apply to non-mainstream investment products because they are shares in an investment trust. The Company’s shares are not classified as ‘complex instruments’ under the FCA’s revised ‘appropriateness’ criteria adopted in the implementation of MiFID II.
Association of Investment Companies
The Company is a member of the Association of Investment Companies (‘AIC’).
Website
The Company’s website, which can be found at www.jpmchinagrowthandincome.co.uk, includes useful information on the Company, such as daily prices, factsheets and current and historic half year and annual reports.
Chinese HY_cover.qxp 22/05/2020 14:15 Page IFC2

C O N T E N T S
C O N T E N T S | 1
Half Year Performance 3 Financial Highlights
Chairman’s Statement 6 Chairman’s Statement
Investment Review 9 Investment Managers’ Report
13 List of Investments
14 Portfolio Analyses
Financial Statements 16 Statement of Comprehensive Income
17 Statement of Changes in Equity
18 Statement of Financial Position
19 Statement of Cash Flows
20 Notes to the Financial Statements
Interim Management 24 Report
Shareholder Information 26 Glossary of Terms and Alternative
Performance Measures (‘APMs’)
29 Where to buy J.P. Morgan Investment Trusts
30 Shareholder Information
33 Information about the Company
Chinese HY_pp01_04.qxp 22/05/2020 13:53 Page 1

Half Year Performance
Chinese HY_pp01_04.qxp 22/05/2020 13:53 Page 2
F I N A N C I A L H I G H L I G H T S
H A L F Y E A R P E R F O R M A N C E | 3
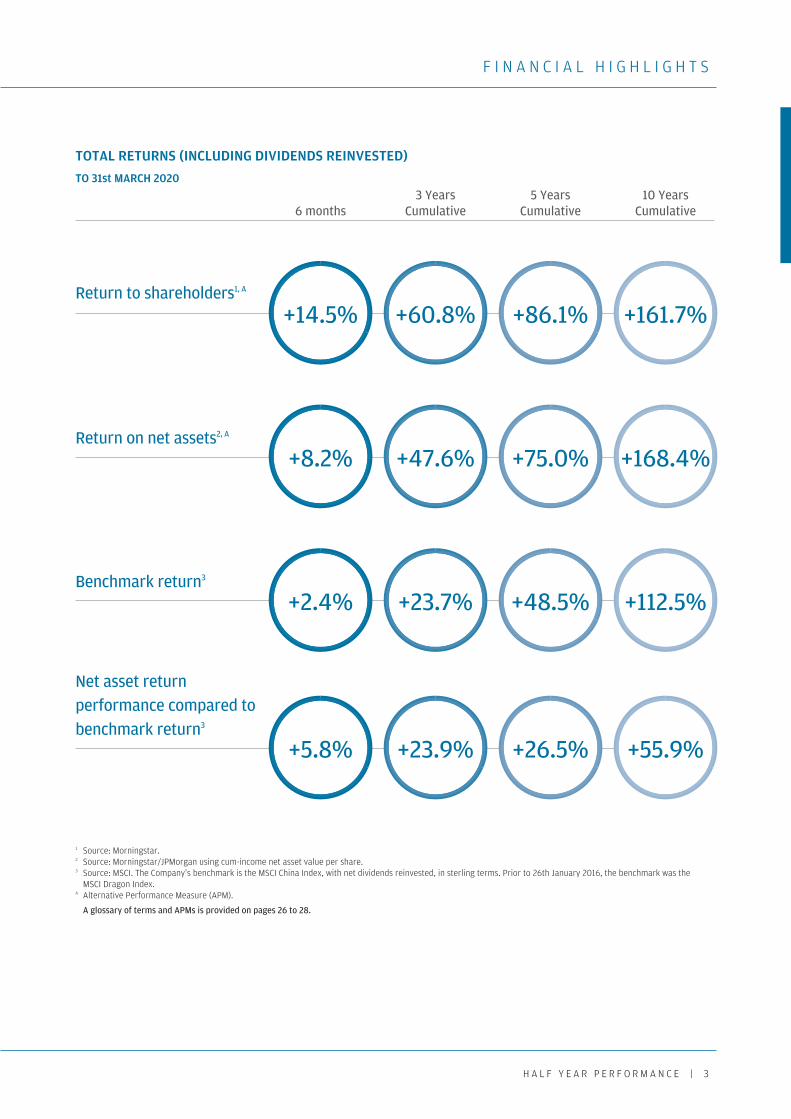
TOTAL RETURNS (INCLUDING DIVIDENDS REINVESTED) TO 31st MARCH 2020
1 Source: Morningstar. 2 Source: Morningstar/JPMorgan using cum-income net asset value per share. 3 Source: MSCI. The Company’s benchmark is the MSCI China Index, with net dividends reinvested, in sterling terms. Prior to 26th January 2016, the benchmark was the
MSCI Dragon Index. A Alternative Performance Measure (APM).
A glossary of terms and APMs is provided on pages 26 to 28.
3 Years 5 Years 10 Years 6 months Cumulative Cumulative Cumulative
Return to shareholders1, A
Return on net assets2, A
Benchmark return3
Net asset return performance compared to benchmark return3
+14.5% +60.8% +86.1% +161.7%
+8.2% +47.6% +75.0% +168.4%
+2.4% +23.7% +48.5% +112.5%
+5.8% +23.9% +26.5% +55.9%
Chinese HY_pp01_04.qxp 22/05/2020 13:53 Page 3
F I N A N C I A L H I G H L I G H T S
4 | J P M O R G A N C H I N A G R O W T H & I N C O M E P L C . H A L F Y E A R R E P O R T & F I N A N C I A L S T A T E M E N T S 2 0 2 0
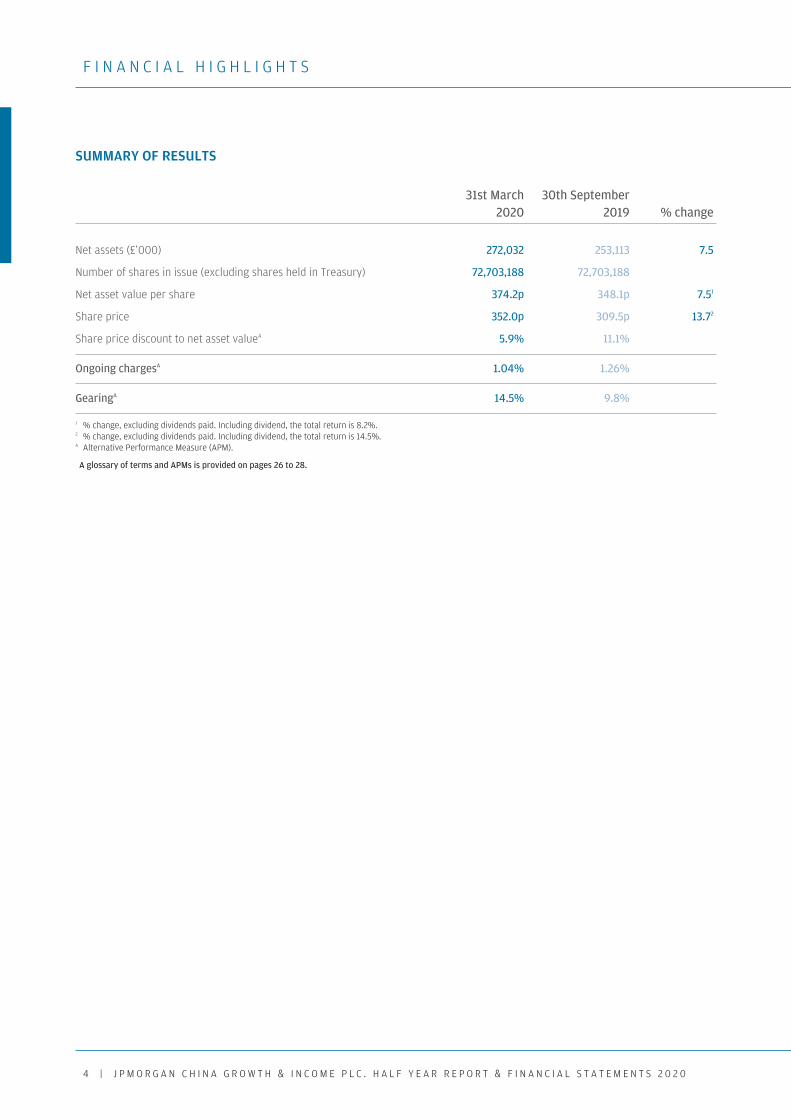
SUMMARY OF RESULTS
31st March 30th September 2020 2019 % change
Net assets (£’000) 272,032 253,113 7.5
Number of shares in issue (excluding shares held in Treasury) 72,703,188 72,703,188
Net asset value per share 374.2p 348.1p 7.51
Share price 352.0p 309.5p 13.72
Share price discount to net asset valueA 5.9% 11.1%
Ongoing chargesA 1.04% 1.26%
GearingA 14.5% 9.8%
1 % change, excluding dividends paid. Including dividend, the total return is 8.2%. 2 % change, excluding dividends paid. Including dividend, the total return is 14.5%. A Alternative Performance Measure (APM).
A glossary of terms and APMs is provided on pages 26 to 28.
Chinese HY_pp01_04.qxp 22/05/2020 13:53 Page 4

Chairman’s Statement
Chinese HY_pp05_07.qxp 22/05/2020 13:52 Page 5
C H A I R M A N ’ S S T A T E M E N T
6 | J P M O R G A N C H I N A G R O W T H & I N C O M E P L C . H A L F Y E A R R E P O R T & F I N A N C I A L S T A T E M E N T S 2 0 2 0
Performance
This has been one of the most exceptional investment periods any of us have witnessed, and despite the market volatility and economic uncertainty caused by the continuing Coronavirus epidemic, I am pleased to report that for the six months period ended 31st March 2020, the Company’s total return on net assets of +8.2% (with net dividend reinvested) outperformed the benchmark, the MSCI China Index, which delivered +2.4% (in sterling terms). The total return to shareholders for this period was +14.5%.
The basis for this performance is explained in the Investment Managers’ report which provides a detailed commentary on the portfolio positioning and the outlook for investing in China.
Loan Facility and Gearing
The Investment Managers have been given the flexibility by the Board to manage the gearing tactically within a range set by the Board of 10% net cash to 20% geared. During the period the Company’s gearing ranged from 7.5% to 16.2%, ending the half year at 14.5% geared. As at 21st May 2020, the Company was 8.8% geared.
On 30th April 2020 the Company extended the £40 million loan facility with Scotiabank for a further three months at an increased margin of 100 bps. The Board will consider extending or renewing the facility in the coming months.
£38.7 million was drawn down on the Company’s loan facility as at 31st March 2020. As at the date of this report, the facility was fully drawn (£40 million).
New Dividend Policy
At the Annual General Meeting in February 2020, shareholders approved an amendment to the Company’s Articles of Association to allow the Company to distribute capital as income to enable the implementation of the revised dividend policy. The Company’s name was also changed to reflect the change to the dividend policy.
On 1st April 2020, the Company announced that two quarterly distributions for the six-month period to 30th September 2020 would be paid on 1st June 2020 and 1st September 2020 based on the Company’s NAV at close of business on 31st March 2020.
Going forward, shareholders are reminded that the target annual dividend of 4% of the Company’s NAV on the last business day of the preceding financial year will be announced at the start of each financial year, to provide clarity to shareholders over the income stream they can expect during the following 12 months. This will be paid by way of four equal interim dividends on the first business day in March, June, September, and December.
Share Repurchases and Issues in the Period
At the time of writing, the Company’s issued share capital consists of 72,703,188 Ordinary shares, excluding 5,211,777 shares held in Treasury. During the six months reporting period the Company did not repurchase or issue any shares.
Board of Directors
Following the appointment of Mrs Alexandra Mackesy in 2018, the Nomination Committee agreed that it was satisfied with this existing Board, which has four directors with a wealth of experience of investing in China and a wide and diverse skill set.
John Misselbrook Chairman
Chinese HY_pp05_07.qxp 22/05/2020 14:34 Page 6

C H A I R M A N ’ S S T A T E M E N T
C H A I R M A N ’ S S T A T E M E N T | 7
Outlook and Strategy
This half-year has demonstrated the volatility that is an inherent risk when investing in China, in large part driven by the continuing trade frictions between China and the U.S., overlaid with the Covid-19 pandemic. Our investment managers, supported by a well-resourced research team, continue to be able to find interesting companies to invest in that are consistent with the structural growth bias of the investment strategy. We remain confident that our investment strategy, combined with the depth of resources in our investment team, will enable us to deliver superior long-term capital growth.
John Misselbrook Chairman 22nd May 2020
Chinese HY_pp05_07.qxp 22/05/2020 13:52 Page 7

Investment Review
Chinese HY_pp08_14.qxp 22/05/2020 13:52 Page 8

I N V E S T M E N T M A N A G E R S ’ R E P O R T
I N V E S T M E N T R E V I E W | 9
Setting the scene
The investment landscape changed materially over the six months to 31st March 2020. A sluggish global economy and ongoing trade wrangles between China and the United States — the world’s two economic powerhouses — challenged markets from the very start of the review period but nobody could have foreseen the devastating impact of the coronavirus (Covid-19) outbreak: this pandemic has dominated hearts and minds since the beginning of the year and remains an ongoing human and global health crisis at the time of writing.
The Company’s review period began in similar fashion to the end of its previous financial year, with uncertainty surrounding the China-US trade negotiations still unnerving Chinese manufacturers and unsettling both domestic and global stock markets. There was a glimmer of hope towards the end of the year with seemingly positive steps forward, leading up to the signing of the Phase I trade deal in January. This bolstered sentiment, particularly as it coincided with a weaker US dollar and signs that Chinese government fiscal initiatives had started to stimulate domestic consumption. However, the escalation of the Covid-19 outbreak later in January crushed that optimism. Apart from the devastating human cost of this global pandemic, the economic repercussions of lockdowns and containment measures were stark and immediate, with share prices around the world tumbling into bear market territory. By March, investors were further spooked by the slump in the oil price, precipitated by the breakdown in OPEC and negotiations endeavouring to cut output. Interest rates fell further, and the U.S. dollar rose but with heightened volatility. The Chinese economy ended the period in turmoil, shrinking 6.8% in the first quarter of 2020, the first quarterly fall in more than four decades. Chinese stock markets slumped in February on the back of the developing crisis but went on to rally strongly in March, perhaps in anticipation that further Shanghai stimulative measures to boost liquidity would follow.
Against this extreme macro backdrop, our focus on higher-quality businesses in sectors where we see structural growth opportunities has proven to be a robust strategy and one that has, once again, delivered outperformance. Over the six months to 31st March 2020, the Company’s return on net assets was +8.2%, outperforming its benchmark, the MSCI China Index which rose by a lesser 2.4% (on a total return, net basis, in sterling terms). The value of the Company’s shares (including dividends) rose by +14.5% over the period.
Spotlight on stocks and sectors
Over the review period, both stock selection and sector allocation contributed to the Company’s outperformance. In this section we highlight specific factors and stock stories of note.
Our overweight position in the Health Care and Information Technology (IT) sectors were the top contributing factors. At a stock level, Health Care names were among the top performers. Wuxi Biologics, Autobio Diagnostics and Shenzhen Mindray all performed well, as markets were optimistic about Covid-19-related potential business opportunities including antibody development, medical diagnostics, and medical equipment capital expenditure. Venus MedTech, a leading cardiovascular-focused medtech company, added to performance due to its strong growth outlook. In Technology, our software picks benefitted from surging data traffic and change in human behaviours with people moving their professional and educational workloads online. Kingdee, a leading enterprise management software company, and Glodon, the largest construction management software vendor in China, outperformed on strong corporate software and data centre demand outlook. In addition, electronic component manufacturer Luxshare Precision continued its strong momentum, thanks to an encouraging Apple product cycle and positive earnings surprise.
Elsewhere, some of our online business holdings, such as technology driven tutoring platform GSX Techedu, gaming company Netease and social e-commerce platform Pinduoduo aided performance as their businesses benefitted from increased online needs, including education, shopping and entertainment, amid Covid-19 containment measures in China. China Mobile, on the other hand, is a stock that we do not own and whose absence from our portfolio was beneficial as its share price was held back by question marks over its short-term outlook.
Rebecca Jiang Investment Manager
Howard Wang Investment Manager
Shumin Huang Head of Research
Chinese HY_pp08_14.qxp 22/05/2020 13:52 Page 9
I N V E S T M E N T M A N A G E R S ’ R E P O R T
1 0 | J P M O R G A N C H I N A G R O W T H & I N C O M E P L C . H A L F Y E A R R E P O R T & F I N A N C I A L S T A T E M E N T S 2 0 2 0
Property management companies Country Garden Services and Poly Property Development both performed strongly on their defensive business nature and solid results. Meanwhile we were underweight in the Energy sector, and energy giant CNOOC specifically, which helped relative performance.
In contrast, our selected investments in Consumer stocks, especially those exposed to global supply chains and travel, suffered from supply and demand disruptions caused by the outbreak. However, we remain confident in our favoured names as we believe that their structural growth trends should remain intact, in spite of the obvious short-term setbacks. We believe they will come back stronger as the economy slowly recovers and industry consolidation takes place.
We are underweight in Financials and this helped performance. Even our core positions in high quality names such as Ping An Bank and Ping An Insurance declined over the period due to the changed interest rate environment in the fallout of Covid-19.
The Company has a risk management policy in place that limits exposure to each individual company to 10% of the Company’s assets, at time of investment. This resulted in forced underweight positions in both Tencent and Alibaba that detracted from overall performance relative to the benchmark; both businesses proved resilient during the outbreak and remain preferred stocks.
Positioning the portfolio for future gains
The portfolio continues to seek out higher-quality businesses in sectors where we see structural growth opportunities, namely in the Consumer, Health Care and IT sectors; we remain confident that secular growth trends here will not be derailed by the Covid-19 pandemic. Short-term disruptions were inevitable in both domestic and global demand and supply. As we write, domestic supply is gradually coming back online, with shops and factories running at close to full capacity, although it will still take time for consumer confidence and demand to recover. However, more importantly, the crisis has accelerated some long-term structural trends, such as increased spending on software and cloud computing as well as on health care, which reinforces the investment thesis behind a broad range of our existing investments.
Notable Health Care positions include Wuxi Biologics and Jiangsu Hengrui Medicine. During the review period, we initiated positions in a few medical diagnostic and vaccine related companies, namely Shenzhen Mindray, Guangzhou Kingmed Diagnostics, and Chongqing Zhifei; we believe that they should all be well-placed as China expands testing, diagnostics and preventive treatments. On the other hand, we exited CSPC Pharma due to its less competitive drug pipeline.
Within the Technology arena, we have Software as a Service (SaaS) providers Kingdee International Software and Glodon amongst our preferred software names, adding to both over the review period. Sunny Optical remains our preferred hardware name. We initiated holdings in cloud service provider Kingsoft and cloud-centric semiconductor provider Aspeed. These purchases were partly funded by profit taking from IT and services business Beijing Thunisoft, network security provider Venustech, and smartphone supplier Luxshare Precision.
In the Consumer space, e-commerce platforms Alibaba and Pinduoduo are our top holdings, along with social and online entertainment names Tencent, Netease, and iQiyi. We added to all but Alibaba and Tencent over the period. We also topped up online dating app Momo, as well as selected offline retail and travel-related names, such as sportswear retailer ANTA Sports and budget hotel chain operator Huazhu, whose share prices corrected meaningfully amid the pandemic concerns yet where the long term outlook remain solid. Elsewhere, we exited Spring Airlines due to the deteriorating outlook for its overseas routes even prior to the virus outbreak. We also exited outdoor advertising media operator Focus Media due to competitiveness concerns and a slowdown in its marketplace.
We increased gearing over the review period, in order to take on investment opportunities created by market correction and volatility.
Chinese HY_pp08_14.qxp 22/05/2020 13:52 Page 10
I N V E S T M E N T M A N A G E R S ’ R E P O R T
I N V E S T M E N T R E V I E W | 1 1
Our approach to ESG engagement
Our investment philosophy centres on identifying quality companies with sustainable growth potential. We believe strongly that Environmental, Social and Governance (ESG) considerations (particularly Governance) need to be a foundation of any investment process supporting long-term investing and that corporate policies at odds with ESG criteria are not sustainable in the long run. We believe that integration of these factors is critical to successful investing across our markets; they are a fundamental part of our research process.
Outlook – our focus on delivering the Company’s long-term strategic goals
The Covid-19 crisis remains fluid and its repercussions present an enormous challenge: short-term disruption to both domestic consumption and the global supply chain is unavoidable. However, we take comfort in the Chinese government’s strong measures to contain the outbreak as well as its proactive countercyclical economic policies to mitigate the negative impact on consumption and employment. At the time of writing, the outbreak seems more contained domestically, but the main concerns are how long the virus will persist, how long the inevitable global recession will last and what that will do for end demand.
With ‘phase two’ trade talks grinding on, and policymakers looking to provide further support, we expect this backdrop will ultimately provide support for Chinese equities. At the time of writing, domestic markets have rallied from their February lows, but we believe they remain at a reasonable level for long-term investors.
Whilst mindful of the short-term challenges and economic worries we face, we remain focused on delivering the Company’s long-term strategic goals. We continue to seek out ‘New China’ companies and sectors that are capitalising on the transition of the country to a more consumer-driven economy. That means identifying quality businesses in sectors where we see structural growth opportunities, namely Health Care (especially services, outsourcing and diagnostics), Technology (especially secular areas in software and semiconductors) and certain investments in the Consumer Staples/Discretionary sectors (on a long-term view). Our strong focus on research capabilities and being on the ground in mainland China is a significant advantage for us in identifying suitable higher-quality businesses.
Over the review period, we have once again demonstrated our ability to deliver positive returns in the most challenging of circumstances. The remainder of the Company’s financial year will inevitably throw up further short-term uncertainties and roadblocks but the long-term case for investing in China remains intact, and we will continue with our proven and disciplined approach.
Howard Wang Rebecca Jiang Shumin Huang Investment Team 22nd May 2020
Chinese HY_pp08_14.qxp 22/05/2020 13:52 Page 11
I N V E S T M E N T M A N A G E R S ’ R E P O R T
1 2 | J P M O R G A N C H I N A G R O W T H & I N C O M E P L C . H A L F Y E A R R E P O R T & F I N A N C I A L S T A T E M E N T S 2 0 2 0
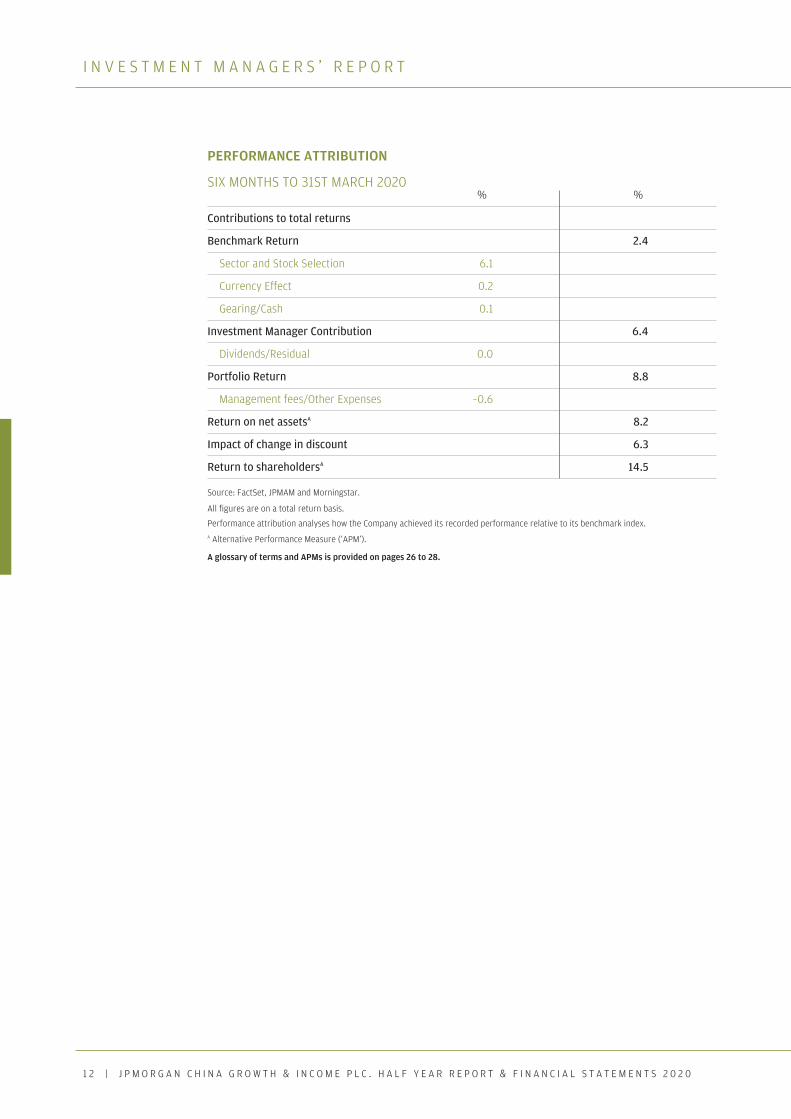
PERFORMANCE ATTRIBUTION
SIX MONTHS TO 31ST MARCH 2020 % %
Contributions to total returns
Benchmark Return 2.4
Sector and Stock Selection 6.1
Currency Effect 0.2
Gearing/Cash 0.1
Investment Manager Contribution 6.4
Dividends/Residual 0.0
Portfolio Return 8.8
Management fees/Other Expenses –0.6
Return on net assetsA 8.2
Impact of change in discount 6.3
Return to shareholdersA 14.5
Source: FactSet, JPMAM and Morningstar.
All figures are on a total return basis.
Performance attribution analyses how the Company achieved its recorded performance relative to its benchmark index. A Alternative Performance Measure (‘APM’).
A glossary of terms and APMs is provided on pages 26 to 28.
Chinese HY_pp08_14.qxp 22/05/2020 13:52 Page 12
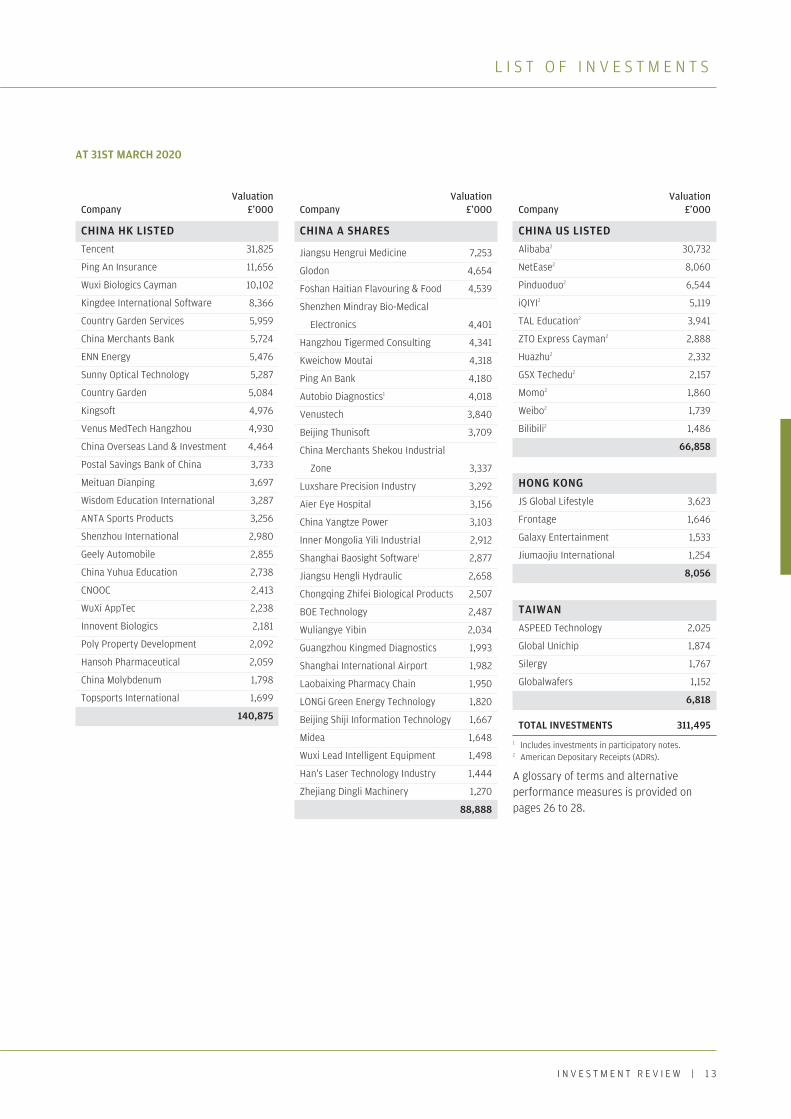
L I S T O F I N V E S T M E N T S
I N V E S T M E N T R E V I E W | 1 3
Valuation Company £’000
Valuation Company £’000
Valuation Company £’000
CHINA HK LISTED Tencent 31,825
Ping An Insurance 11,656
Wuxi Biologics Cayman 10,102
Kingdee International Software 8,366
Country Garden Services 5,959
China Merchants Bank 5,724
ENN Energy 5,476
Sunny Optical Technology 5,287
Country Garden 5,084
Kingsoft 4,976
Venus MedTech Hangzhou 4,930
China Overseas Land & Investment 4,464
Postal Savings Bank of China 3,733
Meituan Dianping 3,697
Wisdom Education International 3,287
ANTA Sports Products 3,256
Shenzhou International 2,980
Geely Automobile 2,855
China Yuhua Education 2,738
CNOOC 2,413
WuXi AppTec 2,238
Innovent Biologics 2,181
Poly Property Development 2,092
Hansoh Pharmaceutical 2,059
China Molybdenum 1,798
Topsports International 1,699
140,875
CHINA A SHARES
Jiangsu Hengrui Medicine 7,253
Glodon 4,654
Foshan Haitian Flavouring & Food 4,539
Shenzhen Mindray Bio-Medical
Electronics 4,401
Hangzhou Tigermed Consulting 4,341
Kweichow Moutai 4,318
Ping An Bank 4,180
Autobio Diagnostics1 4,018
Venustech 3,840
Beijing Thunisoft 3,709
China Merchants Shekou Industrial
Zone 3,337
Luxshare Precision Industry 3,292
Aier Eye Hospital 3,156
China Yangtze Power 3,103
Inner Mongolia Yili Industrial 2,912
Shanghai Baosight Software1 2,877
Jiangsu Hengli Hydraulic 2,658
Chongqing Zhifei Biological Products 2,507
BOE Technology 2,487
Wuliangye Yibin 2,034
Guangzhou Kingmed Diagnostics 1,993
Shanghai International Airport 1,982
Laobaixing Pharmacy Chain 1,950
LONGi Green Energy Technology 1,820
Beijing Shiji Information Technology 1,667
Midea 1,648
Wuxi Lead Intelligent Equipment 1,498
Han's Laser Technology Industry 1,444
Zhejiang Dingli Machinery 1,270
88,888
CHINA US LISTED Alibaba2 30,732
NetEase2 8,060
Pinduoduo2 6,544
iQIYI2 5,119
TAL Education2 3,941
ZTO Express Cayman2 2,888
Huazhu2 2,332
GSX Techedu2 2,157
Momo2 1,860
Weibo2 1,739
Bilibili2 1,486
66,858
HONG KONG JS Global Lifestyle 3,623
Frontage 1,646
Galaxy Entertainment 1,533
Jiumaojiu International 1,254
8,056
TAIWAN
ASPEED Technology 2,025
Global Unichip 1,874
Silergy 1,767
Globalwafers 1,152
6,818
TOTAL INVESTMENTS 311,495 1 Includes investments in participatory notes. 2 American Depositary Receipts (ADRs).
A glossary of terms and alternative performance measures is provided on pages 26 to 28.
AT 31ST MARCH 2020
Chinese HY_pp08_14.qxp 22/05/2020 13:52 Page 13
P O R T F O L I O A N A L Y S E S
1 4 | J P M O R G A N C H I N A G R O W T H & I N C O M E P L C . H A L F Y E A R R E P O R T & F I N A N C I A L S T A T E M E N T S 2 0 2 0
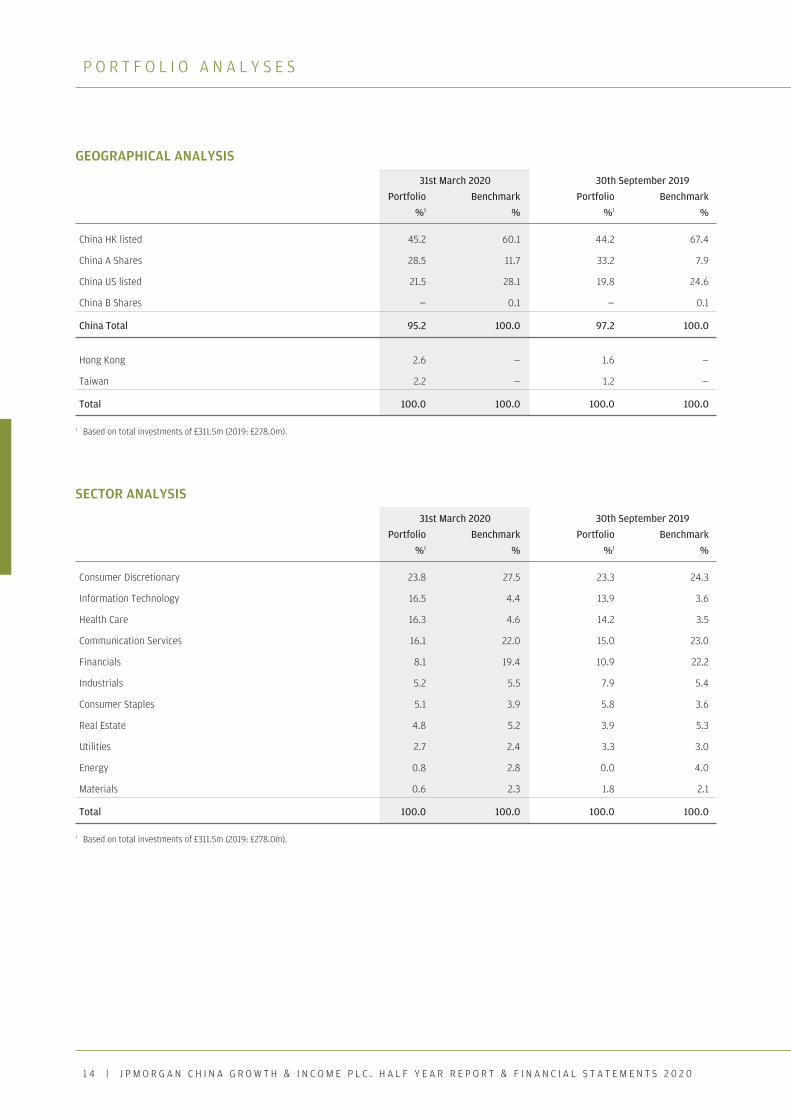
GEOGRAPHICAL ANALYSIS
31st March 2020 30th September 2019 Portfolio Benchmark Portfolio Benchmark %1 % %1 %
China HK listed 45.2 60.1 44.2 67.4
China A Shares 28.5 11.7 33.2 7.9
China US listed 21.5 28.1 19.8 24.6
China B Shares — 0.1 — 0.1
China Total 95.2 100.0 97.2 100.0
Hong Kong 2.6 — 1.6 —
Taiwan 2.2 — 1.2 —
Total 100.0 100.0 100.0 100.0
1 Based on total investments of £311.5m (2019: £278.0m).
SECTOR ANALYSIS
31st March 2020 30th September 2019 Portfolio Benchmark Portfolio Benchmark %1 % %1 %
Consumer Discretionary 23.8 27.5 23.3 24.3
Information Technology 16.5 4.4 13.9 3.6
Health Care 16.3 4.6 14.2 3.5
Communication Services 16.1 22.0 15.0 23.0
Financials 8.1 19.4 10.9 22.2
Industrials 5.2 5.5 7.9 5.4
Consumer Staples 5.1 3.9 5.8 3.6
Real Estate 4.8 5.2 3.9 5.3
Utilities 2.7 2.4 3.3 3.0
Energy 0.8 2.8 0.0 4.0
Materials 0.6 2.3 1.8 2.1
Total 100.0 100.0 100.0 100.0
1 Based on total investments of £311.5m (2019: £278.0m).
Chinese HY_pp08_14.qxp 22/05/2020 13:52 Page 14

Financial Statements
Chinese HY_pp15-22.qxp 22/05/2020 13:52 Page 15
1 6 | J P M O R G A N C H I N A G R O W T H & I N C O M E P L C . H A L F Y E A R R E P O R T & F I N A N C I A L S T A T E M E N T S 2 0 2 0
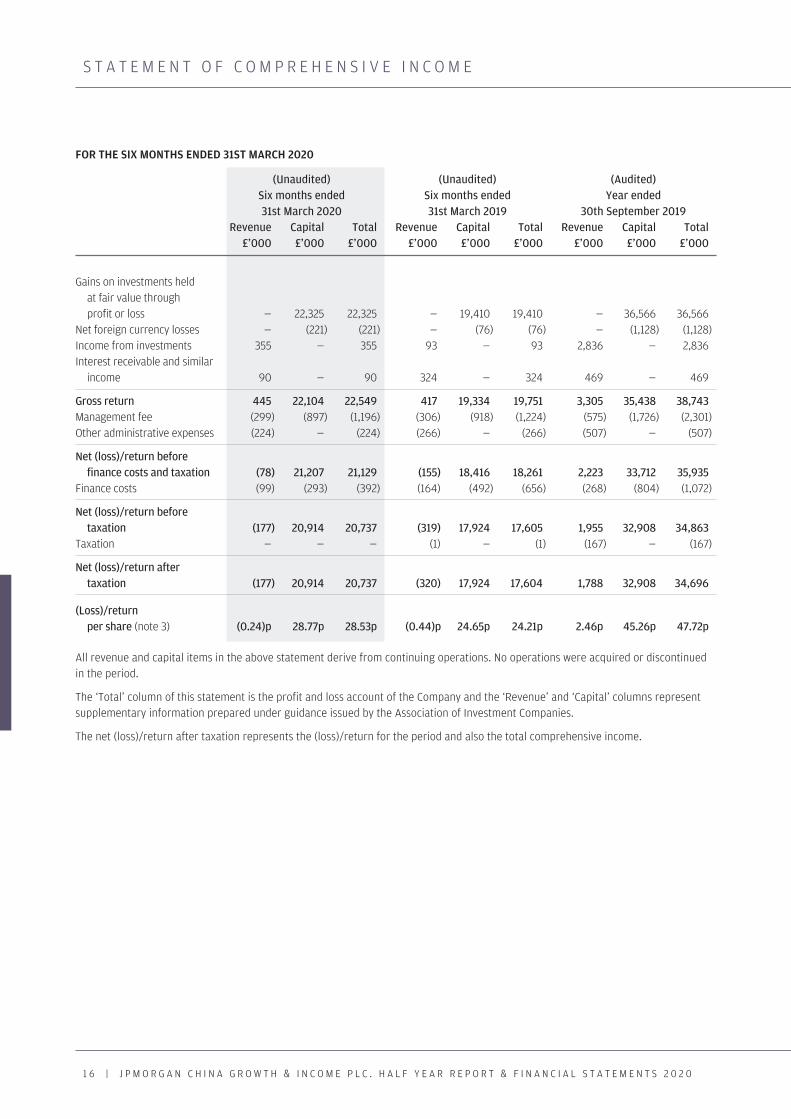
S T A T E M E N T O F C O M P R E H E N S I V E I N C O M E
FOR THE SIX MONTHS ENDED 31ST MARCH 2020
(Unaudited) (Unaudited) (Audited) Six months ended Six months ended Year ended 31st March 2020 31st March 2019 30th September 2019
Revenue Capital Total Revenue Capital Total Revenue Capital Total £’000 £’000 £’000 £’000 £’000 £’000 £’000 £’000 £’000
Gains on investments held at fair value through profit or loss — 22,325 22,325 — 19,410 19,410 — 36,566 36,566 Net foreign currency losses — (221) (221) — (76) (76) — (1,128) (1,128) Income from investments 355 — 355 93 — 93 2,836 — 2,836 Interest receivable and similar income 90 — 90 324 — 324 469 — 469
Gross return 445 22,104 22,549 417 19,334 19,751 3,305 35,438 38,743 Management fee (299) (897) (1,196) (306) (918) (1,224) (575) (1,726) (2,301) Other administrative expenses (224) — (224) (266) — (266) (507) — (507)
Net (loss)/return before finance costs and taxation (78) 21,207 21,129 (155) 18,416 18,261 2,223 33,712 35,935 Finance costs (99) (293) (392) (164) (492) (656) (268) (804) (1,072)
Net (loss)/return before taxation (177) 20,914 20,737 (319) 17,924 17,605 1,955 32,908 34,863 Taxation — — — (1) — (1) (167) — (167)
Net (loss)/return after taxation (177) 20,914 20,737 (320) 17,924 17,604 1,788 32,908 34,696
(Loss)/return per share (note 3) (0.24)p 28.77p 28.53p (0.44)p 24.65p 24.21p 2.46p 45.26p 47.72p
All revenue and capital items in the above statement derive from continuing operations. No operations were acquired or discontinued in the period.
The ‘Total’ column of this statement is the profit and loss account of the Company and the ‘Revenue’ and ‘Capital’ columns represent supplementary information prepared under guidance issued by the Association of Investment Companies.
The net (loss)/return after taxation represents the (loss)/return for the period and also the total comprehensive income.
Chinese HY_pp15-22.qxp 22/05/2020 13:52 Page 16
F I N A N C I A L S T A T E M E N T S | 1 7
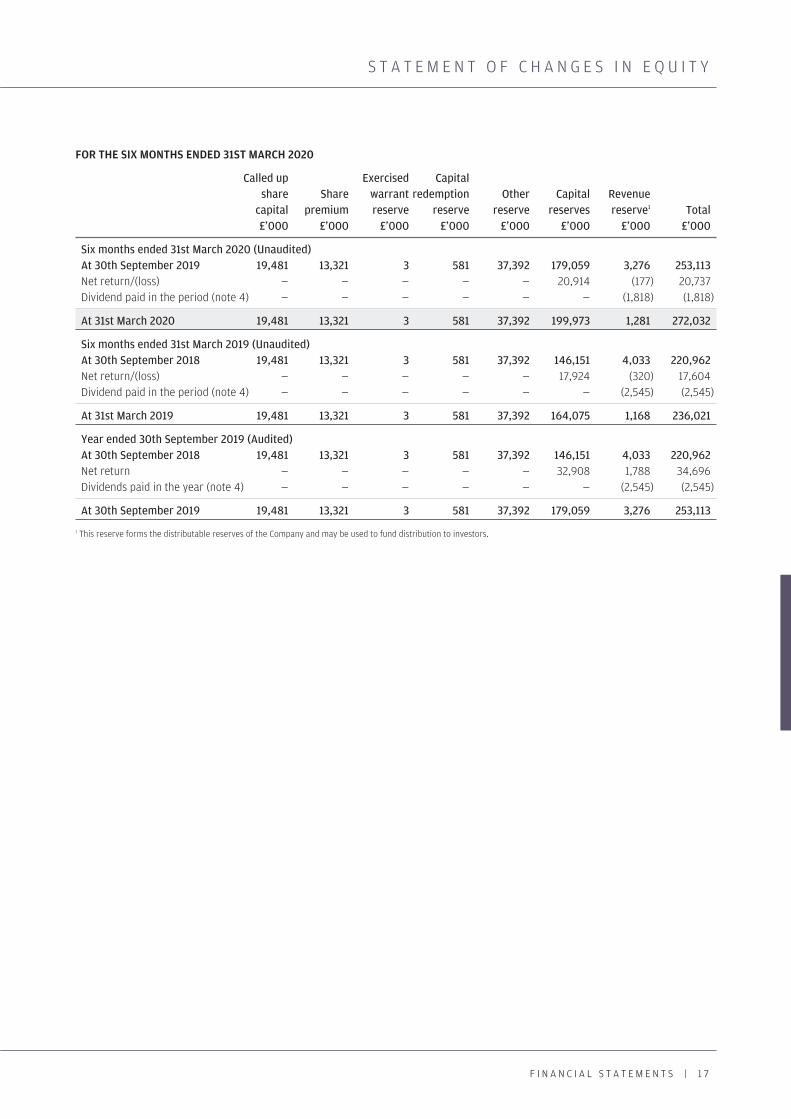
S T A T E M E N T O F C H A N G E S I N E Q U I T Y
FOR THE SIX MONTHS ENDED 31ST MARCH 2020
Called up Exercised Capital share Share warrant redemption Other Capital Revenue capital premium reserve reserve reserve reserves reserve1 Total £’000 £’000 £’000 £’000 £’000 £’000 £’000 £’000
Six months ended 31st March 2020 (Unaudited) At 30th September 2019 19,481 13,321 3 581 37,392 179,059 3,276 253,113 Net return/(loss) — — — — — 20,914 (177) 20,737 Dividend paid in the period (note 4) — — — — — — (1,818) (1,818)
At 31st March 2020 19,481 13,321 3 581 37,392 199,973 1,281 272,032
Six months ended 31st March 2019 (Unaudited) At 30th September 2018 19,481 13,321 3 581 37,392 146,151 4,033 220,962 Net return/(loss) — — — — — 17,924 (320) 17,604 Dividend paid in the period (note 4) — — — — — — (2,545) (2,545)
At 31st March 2019 19,481 13,321 3 581 37,392 164,075 1,168 236,021
Year ended 30th September 2019 (Audited) At 30th September 2018 19,481 13,321 3 581 37,392 146,151 4,033 220,962 Net return — — — — — 32,908 1,788 34,696 Dividends paid in the year (note 4) — — — — — — (2,545) (2,545)
At 30th September 2019 19,481 13,321 3 581 37,392 179,059 3,276 253,113
1 This reserve forms the distributable reserves of the Company and may be used to fund distribution to investors.
Chinese HY_pp15-22.qxp 22/05/2020 13:52 Page 17
1 8 | J P M O R G A N C H I N A G R O W T H & I N C O M E P L C . H A L F Y E A R R E P O R T & F I N A N C I A L S T A T E M E N T S 2 0 2 0
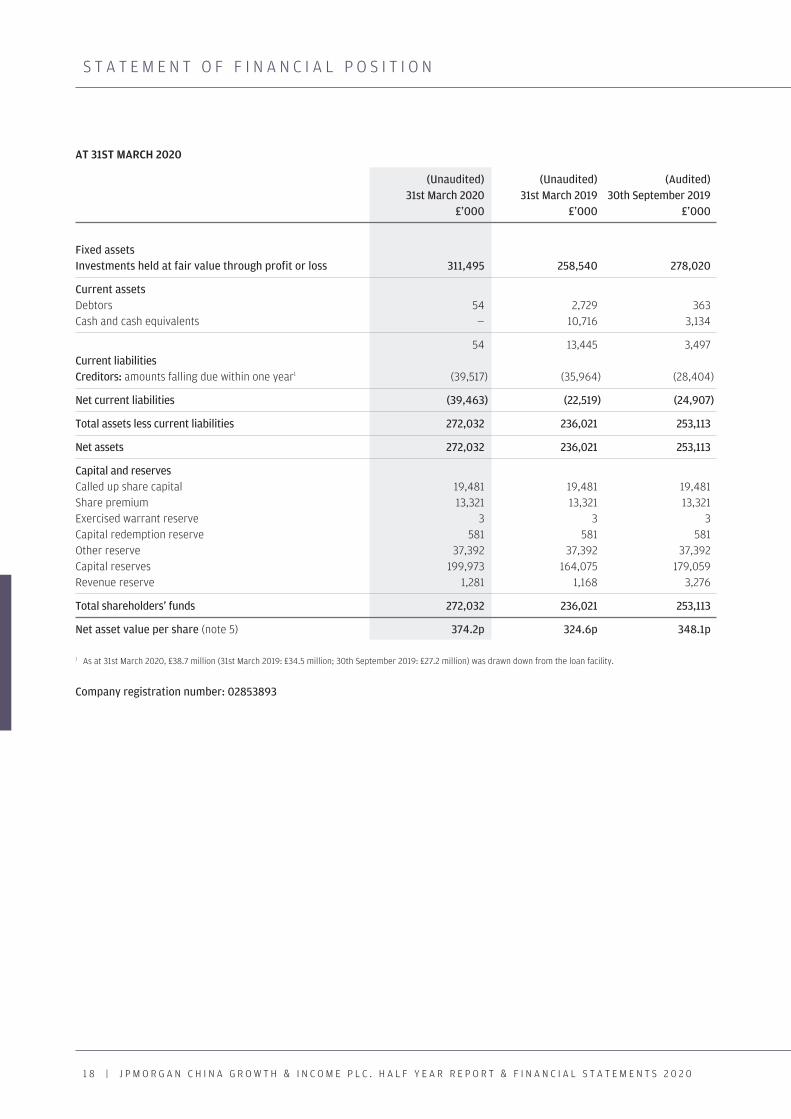
S T A T E M E N T O F F I N A N C I A L P O S I T I O N
AT 31ST MARCH 2020
(Unaudited) (Unaudited) (Audited) 31st March 2020 31st March 2019 30th September 2019
£’000 £’000 £’000
Fixed assets Investments held at fair value through profit or loss 311,495 258,540 278,020
Current assets Debtors 54 2,729 363 Cash and cash equivalents — 10,716 3,134
54 13,445 3,497 Current liabilities Creditors: amounts falling due within one year1 (39,517) (35,964) (28,404)
Net current liabilities (39,463) (22,519) (24,907)
Total assets less current liabilities 272,032 236,021 253,113
Net assets 272,032 236,021 253,113
Capital and reserves Called up share capital 19,481 19,481 19,481 Share premium 13,321 13,321 13,321 Exercised warrant reserve 3 3 3 Capital redemption reserve 581 581 581 Other reserve 37,392 37,392 37,392 Capital reserves 199,973 164,075 179,059 Revenue reserve 1,281 1,168 3,276
Total shareholders’ funds 272,032 236,021 253,113
Net asset value per share (note 5) 374.2p 324.6p 348.1p
1 As at 31st March 2020, £38.7 million (31st March 2019: £34.5 million; 30th September 2019: £27.2 million) was drawn down from the loan facility.
Company registration number: 02853893
Chinese HY_pp15-22.qxp 22/05/2020 13:52 Page 18
F I N A N C I A L S T A T E M E N T S | 1 9
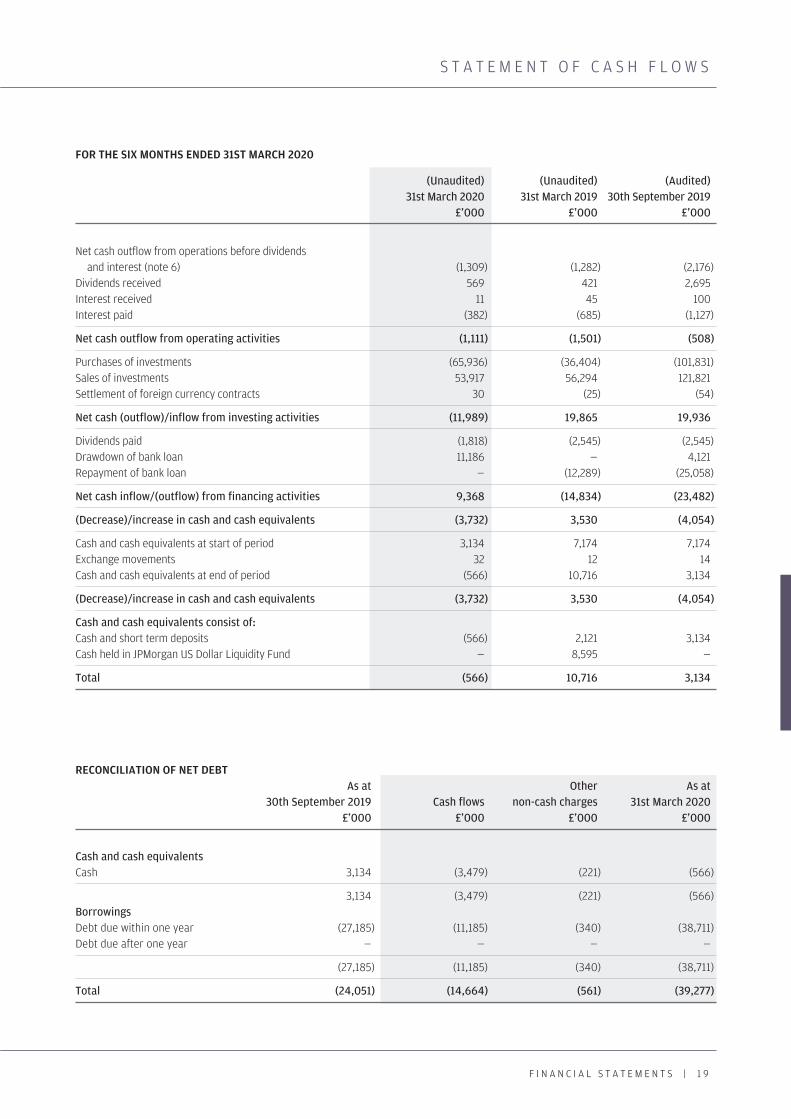
S T A T E M E N T O F C A S H F L O W S
FOR THE SIX MONTHS ENDED 31ST MARCH 2020
(Unaudited) (Unaudited) (Audited) 31st March 2020 31st March 2019 30th September 2019
£’000 £’000 £’000
Net cash outflow from operations before dividends and interest (note 6) (1,309) (1,282) (2,176) Dividends received 569 421 2,695 Interest received 11 45 100 Interest paid (382) (685) (1,127)
Net cash outflow from operating activities (1,111) (1,501) (508)
Purchases of investments (65,936) (36,404) (101,831) Sales of investments 53,917 56,294 121,821 Settlement of foreign currency contracts 30 (25) (54)
Net cash (outflow)/inflow from investing activities (11,989) 19,865 19,936
Dividends paid (1,818) (2,545) (2,545) Drawdown of bank loan 11,186 — 4,121 Repayment of bank loan — (12,289) (25,058)
Net cash inflow/(outflow) from financing activities 9,368 (14,834) (23,482)
(Decrease)/increase in cash and cash equivalents (3,732) 3,530 (4,054)
Cash and cash equivalents at start of period 3,134 7,174 7,174 Exchange movements 32 12 14 Cash and cash equivalents at end of period (566) 10,716 3,134
(Decrease)/increase in cash and cash equivalents (3,732) 3,530 (4,054)
Cash and cash equivalents consist of: Cash and short term deposits (566) 2,121 3,134 Cash held in JPMorgan US Dollar Liquidity Fund — 8,595 —
Total (566) 10,716 3,134
RECONCILIATION OF NET DEBT As at Other As at 30th September 2019 Cash flows non-cash charges 31st March 2020 £’000 £’000 £’000 £’000
Cash and cash equivalents Cash 3,134 (3,479) (221) (566)
3,134 (3,479) (221) (566) Borrowings Debt due within one year (27,185) (11,185) (340) (38,711) Debt due after one year — — — —
(27,185) (11,185) (340) (38,711)
Total (24,051) (14,664) (561) (39,277)
Chinese HY_pp15-22.qxp 22/05/2020 13:52 Page 19
2 0 | J P M O R G A N C H I N A G R O W T H & I N C O M E P L C . H A L F Y E A R R E P O R T & F I N A N C I A L S T A T E M E N T S 2 0 2 0
N O T E S T O T H E F I N A N C I A L S T A T E M E N T S
FOR THE SIX MONTHS ENDED 31ST MARCH 2020
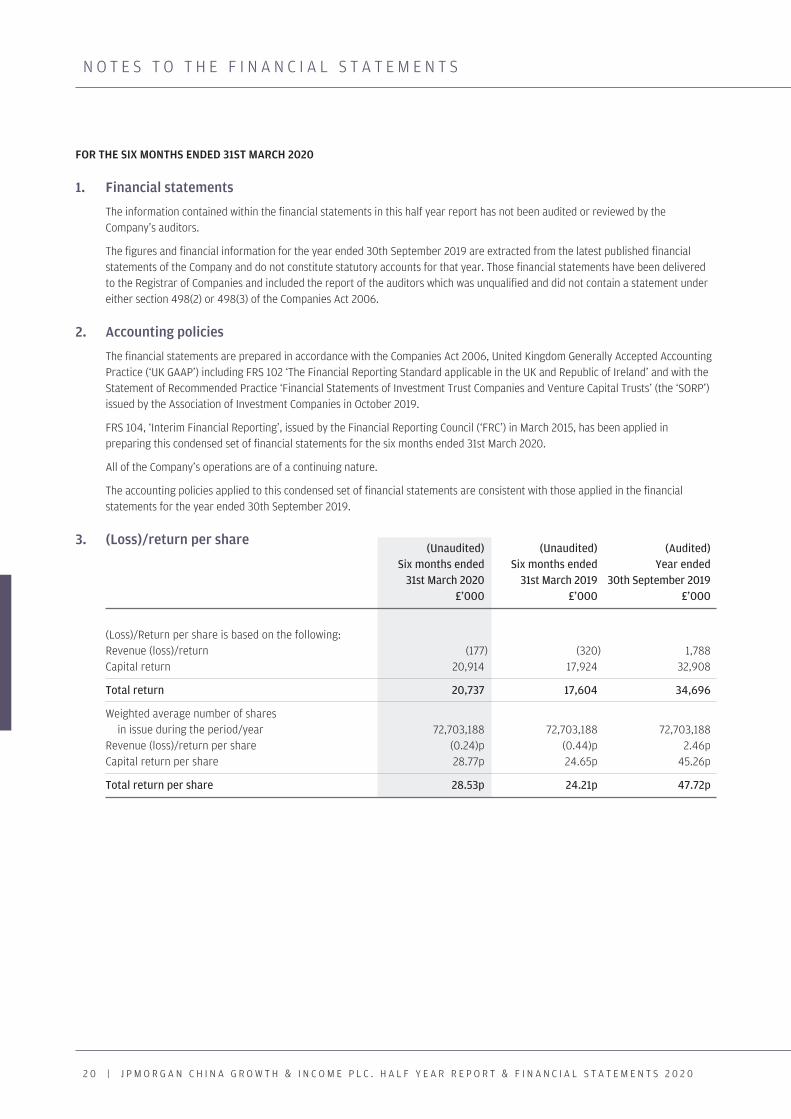
1. Financial statements
The information contained within the financial statements in this half year report has not been audited or reviewed by the Company’s auditors.
The figures and financial information for the year ended 30th September 2019 are extracted from the latest published financial statements of the Company and do not constitute statutory accounts for that year. Those financial statements have been delivered to the Registrar of Companies and included the report of the auditors which was unqualified and did not contain a statement under either section 498(2) or 498(3) of the Companies Act 2006.
2. Accounting policies
The financial statements are prepared in accordance with the Companies Act 2006, United Kingdom Generally Accepted Accounting Practice (‘UK GAAP’) including FRS 102 ‘The Financial Reporting Standard applicable in the UK and Republic of Ireland’ and with the Statement of Recommended Practice ‘Financial Statements of Investment Trust Companies and Venture Capital Trusts’ (the ‘SORP’) issued by the Association of Investment Companies in October 2019.
FRS 104, ‘Interim Financial Reporting’, issued by the Financial Reporting Council (‘FRC’) in March 2015, has been applied in preparing this condensed set of financial statements for the six months ended 31st March 2020.
All of the Company’s operations are of a continuing nature.
The accounting policies applied to this condensed set of financial statements are consistent with those applied in the financial statements for the year ended 30th September 2019.
3. (Loss)/return per share (Unaudited) (Unaudited) (Audited)
Six months ended Six months ended Year ended 31st March 2020 31st March 2019 30th September 2019
£’000 £’000 £’000
(Loss)/Return per share is based on the following: Revenue (loss)/return (177) (320) 1,788 Capital return 20,914 17,924 32,908
Total return 20,737 17,604 34,696
Weighted average number of shares in issue during the period/year 72,703,188 72,703,188 72,703,188 Revenue (loss)/return per share (0.24)p (0.44)p 2.46p Capital return per share 28.77p 24.65p 45.26p
Total return per share 28.53p 24.21p 47.72p
Chinese HY_pp15-22.qxp 22/05/2020 13:52 Page 20
F I N A N C I A L S T A T E M E N T S | 2 1
N O T E S T O T H E F I N A N C I A L S T A T E M E N T S
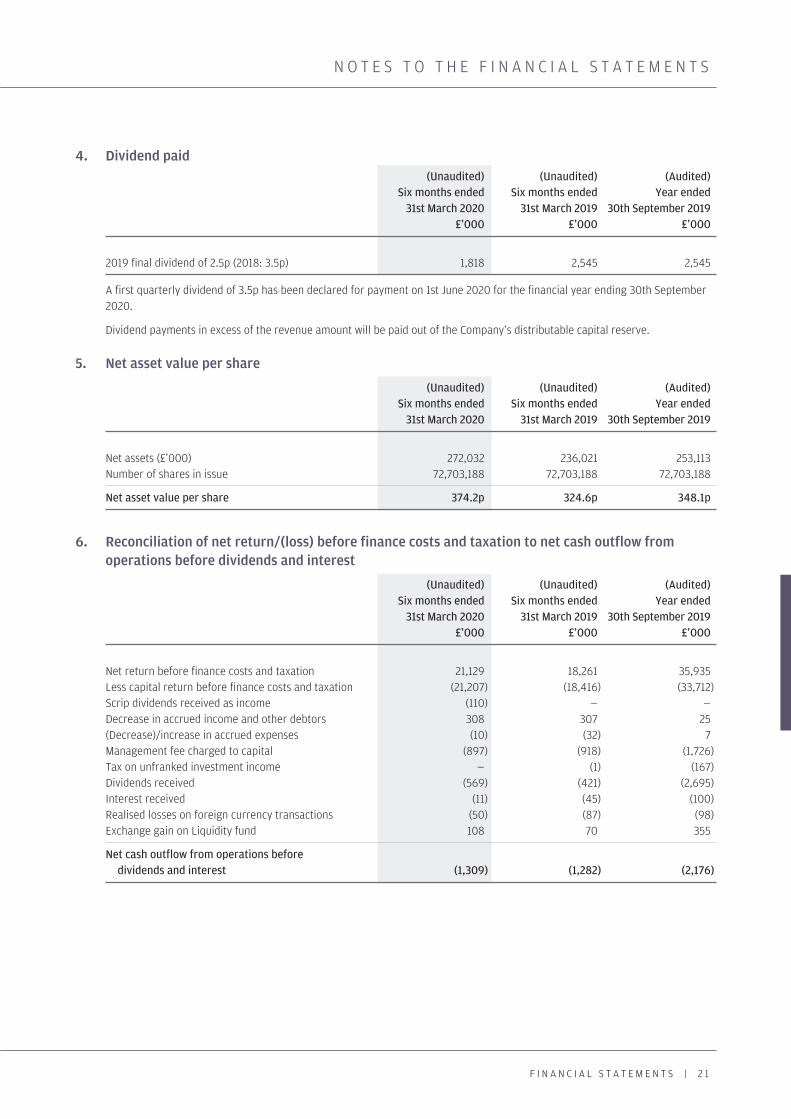
4. Dividend paid (Unaudited) (Unaudited) (Audited)
Six months ended Six months ended Year ended 31st March 2020 31st March 2019 30th September 2019
£’000 £’000 £’000
2019 final dividend of 2.5p (2018: 3.5p) 1,818 2,545 2,545
A first quarterly dividend of 3.5p has been declared for payment on 1st June 2020 for the financial year ending 30th September 2020.
Dividend payments in excess of the revenue amount will be paid out of the Company’s distributable capital reserve.
5. Net asset value per share
(Unaudited) (Unaudited) (Audited) Six months ended Six months ended Year ended
31st March 2020 31st March 2019 30th September 2019
Net assets (£’000) 272,032 236,021 253,113 Number of shares in issue 72,703,188 72,703,188 72,703,188
Net asset value per share 374.2p 324.6p 348.1p
6. Reconciliation of net return/(loss) before finance costs and taxation to net cash outflow from operations before dividends and interest
(Unaudited) (Unaudited) (Audited) Six months ended Six months ended Year ended
31st March 2020 31st March 2019 30th September 2019 £’000 £’000 £’000
Net return before finance costs and taxation 21,129 18,261 35,935 Less capital return before finance costs and taxation (21,207) (18,416) (33,712) Scrip dividends received as income (110) — — Decrease in accrued income and other debtors 308 307 25 (Decrease)/increase in accrued expenses (10) (32) 7 Management fee charged to capital (897) (918) (1,726) Tax on unfranked investment income — (1) (167) Dividends received (569) (421) (2,695) Interest received (11) (45) (100) Realised losses on foreign currency transactions (50) (87) (98) Exchange gain on Liquidity fund 108 70 355
Net cash outflow from operations before dividends and interest (1,309) (1,282) (2,176)
Chinese HY_pp15-22.qxp 22/05/2020 13:52 Page 21
2 2 | J P M O R G A N C H I N A G R O W T H & I N C O M E P L C . H A L F Y E A R R E P O R T & F I N A N C I A L S T A T E M E N T S 2 0 2 0
N O T E S T O T H E F I N A N C I A L S T A T E M E N T S
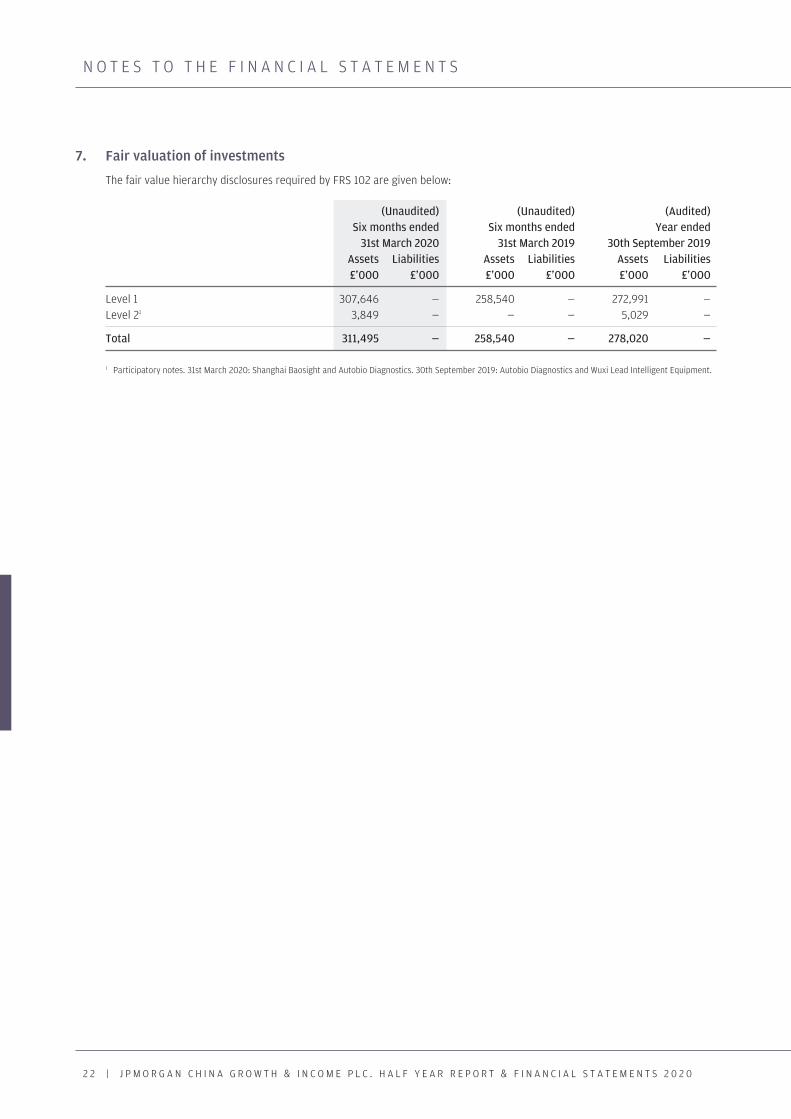
7. Fair valuation of investments
The fair value hierarchy disclosures required by FRS 102 are given below:
(Unaudited) (Unaudited) (Audited) Six months ended Six months ended Year ended
31st March 2020 31st March 2019 30th September 2019 Assets Liabilities Assets Liabilities Assets Liabilities £’000 £’000 £’000 £’000 £’000 £’000
Level 1 307,646 — 258,540 — 272,991 — Level 21 3,849 — — — 5,029 —
Total 311,495 — 258,540 — 278,020 —
1 Participatory notes. 31st March 2020: Shanghai Baosight and Autobio Diagnostics. 30th September 2019: Autobio Diagnostics and Wuxi Lead Intelligent Equipment.
Chinese HY_pp15-22.qxp 22/05/2020 13:52 Page 22
Interim Management Report
Chinese HY_pp23-24.qxp 22/05/2020 13:52 Page 23
2 4 | J P M O R G A N C H I N A G R O W T H & I N C O M E P L C . H A L F Y E A R R E P O R T & F I N A N C I A L S T A T E M E N T S 2 0 2 0
I N T E R I M M A N A G E M E N T R E P O R T
The Company is required to make the following disclosures in its half year report:
Principal and Emerging Risks and Uncertainties
During 2020, the emergence of the virus COVID-19 (coronavirus) has created significant uncertainty for markets, and therefore risk to the value of investments and volatility. Other than this, the principal risks and uncertainties faced by the Company fall into the following broad categories: geopolitical; investment underperformance; strategy and business management; loss of Investment Team or Investment Manager; share price discount; governance; legal and regulatory; corporate governance and shareholder relations; operational risk and cybercrime; and financial. Information on each of these areas is given in the Business Review within the Annual Report and Financial Statements for the year ended 30th September 2019.
Related Parties Transactions
During the first six months of the current financial year, no transactions with related parties have taken place which have materially affected the financial position or the performance of the Company during the period.
Going Concern
The Directors believe, having considered the Company’s investment objectives, risk management policies, capital management policies and procedures, nature of the portfolio and expenditure projections, that the Company has adequate resources, an appropriate financial structure and suitable management arrangements in place to continue in operational existence for the foreseeable future and, more specifically, that there are no material uncertainties pertaining to the Company that would prevent its ability to continue in such operational existence for at least 12 months from the date of the approval of this half yearly financial report. For these reasons, they consider there is reasonable evidence to continue to adopt the going concern basis in preparing the accounts.
Directors’ Responsibilities
The Board of Directors confirms that, to the best of its knowledge:
(i) the condensed set of financial statements contained within the half yearly financial report has been prepared in accordance with FRS 104 ‘Interim Financial Reporting’ and gives a true and fair view of the state of affairs of the Company and of the assets, liabilities, financial position and net return of the Company, as at 31st March 2020, as required by the UK Listing Authority Disclosure and Transparency Rule (‘DTR’) 4.2.4R; and
(ii) the interim management report includes a fair review of the information required by DTR 4.2.7R and DTR 4.2.8R of the UK Listing Authority Disclosure and Transparency Rules.
In order to provide these confirmations, and in preparing these financial statements, the Directors are required to:
• select suitable accounting policies and then apply them consistently;
• make judgements and accounting estimates that are reasonable and prudent;
• state whether applicable UK Accounting Standards have been followed, subject to any material departures disclosed and explained in the financial statements; and
• prepare the financial statements on the going concern basis unless it is inappropriate to presume that the Company will continue in business;
and the Directors confirm that they have done so.
For and on behalf of the Board John Misselbrook Chairman 22nd May 2020
Chinese HY_pp23-24.qxp 22/05/2020 13:52 Page 24
Shareholder Information
Chinese HY_pp25-32.qxp 22/05/2020 13:52 Page 25
GLOSSARY OF TERMS AND ALTERNATIVE PERFORMANCE MEASURES ( ‘APMS’)
2 6 | J P M O R G A N C H I N A G R O W T H & I N C O M E P L C . H A L F Y E A R R E P O R T & F I N A N C I A L S T A T E M E N T S 2 0 2 0
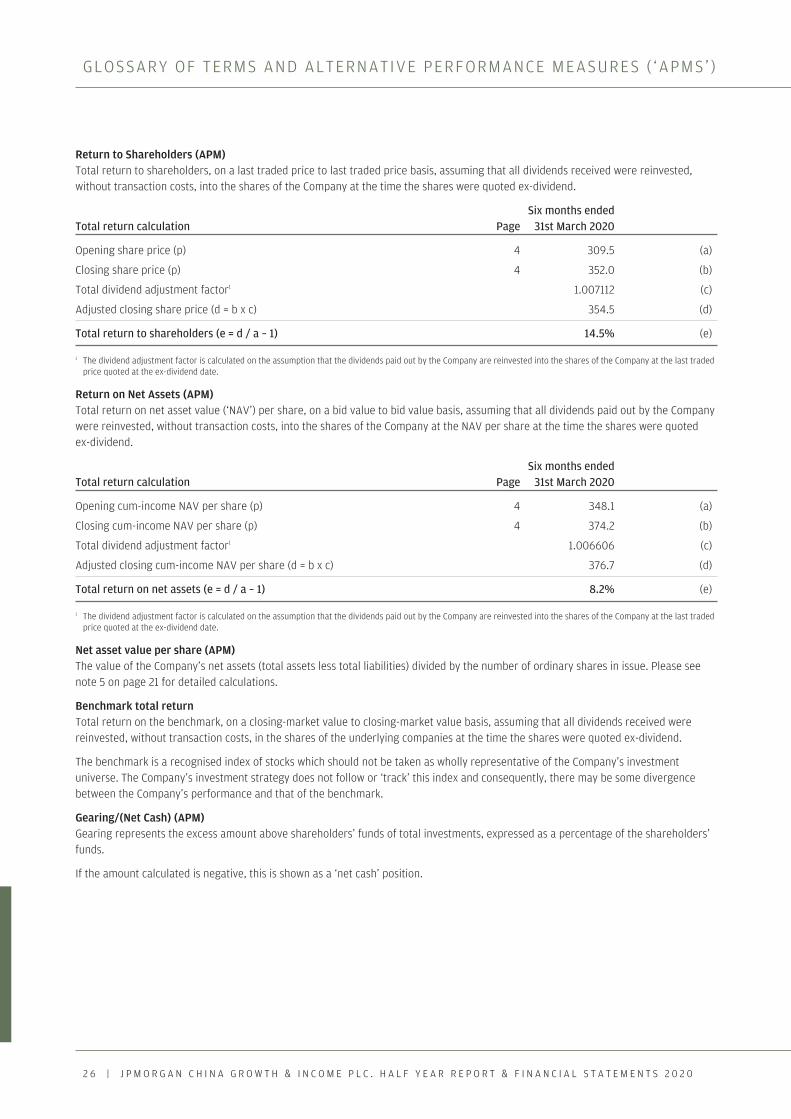
Return to Shareholders (APM) Total return to shareholders, on a last traded price to last traded price basis, assuming that all dividends received were reinvested, without transaction costs, into the shares of the Company at the time the shares were quoted ex-dividend.
Six months ended Total return calculation Page 31st March 2020
Opening share price (p) 4 309.5 (a)
Closing share price (p) 4 352.0 (b)
Total dividend adjustment factor1 1.007112 (c)
Adjusted closing share price (d = b x c) 354.5 (d)
Total return to shareholders (e = d / a – 1) 14.5% (e)
1 The dividend adjustment factor is calculated on the assumption that the dividends paid out by the Company are reinvested into the shares of the Company at the last traded price quoted at the ex-dividend date.
Return on Net Assets (APM) Total return on net asset value (‘NAV’) per share, on a bid value to bid value basis, assuming that all dividends paid out by the Company were reinvested, without transaction costs, into the shares of the Company at the NAV per share at the time the shares were quoted ex-dividend.
Six months ended Total return calculation Page 31st March 2020
Opening cum-income NAV per share (p) 4 348.1 (a)
Closing cum-income NAV per share (p) 4 374.2 (b)
Total dividend adjustment factor1 1.006606 (c)
Adjusted closing cum-income NAV per share (d = b x c) 376.7 (d)
Total return on net assets (e = d / a – 1) 8.2% (e)
1 The dividend adjustment factor is calculated on the assumption that the dividends paid out by the Company are reinvested into the shares of the Company at the last traded price quoted at the ex-dividend date.
Net asset value per share (APM) The value of the Company’s net assets (total assets less total liabilities) divided by the number of ordinary shares in issue. Please see note 5 on page 21 for detailed calculations.
Benchmark total return Total return on the benchmark, on a closing-market value to closing-market value basis, assuming that all dividends received were reinvested, without transaction costs, in the shares of the underlying companies at the time the shares were quoted ex-dividend.
The benchmark is a recognised index of stocks which should not be taken as wholly representative of the Company’s investment universe. The Company’s investment strategy does not follow or ‘track’ this index and consequently, there may be some divergence between the Company’s performance and that of the benchmark.
Gearing/(Net Cash) (APM) Gearing represents the excess amount above shareholders’ funds of total investments, expressed as a percentage of the shareholders’ funds.
If the amount calculated is negative, this is shown as a ‘net cash’ position.
Chinese HY_pp25-32.qxp 22/05/2020 13:52 Page 26
S H A R E H O L D E R I N F O R M A T I O N | 2 7
GLOSSARY OF TERMS AND ALTERNATIVE PERFORMANCE MEASURES ( ‘APMs’ )
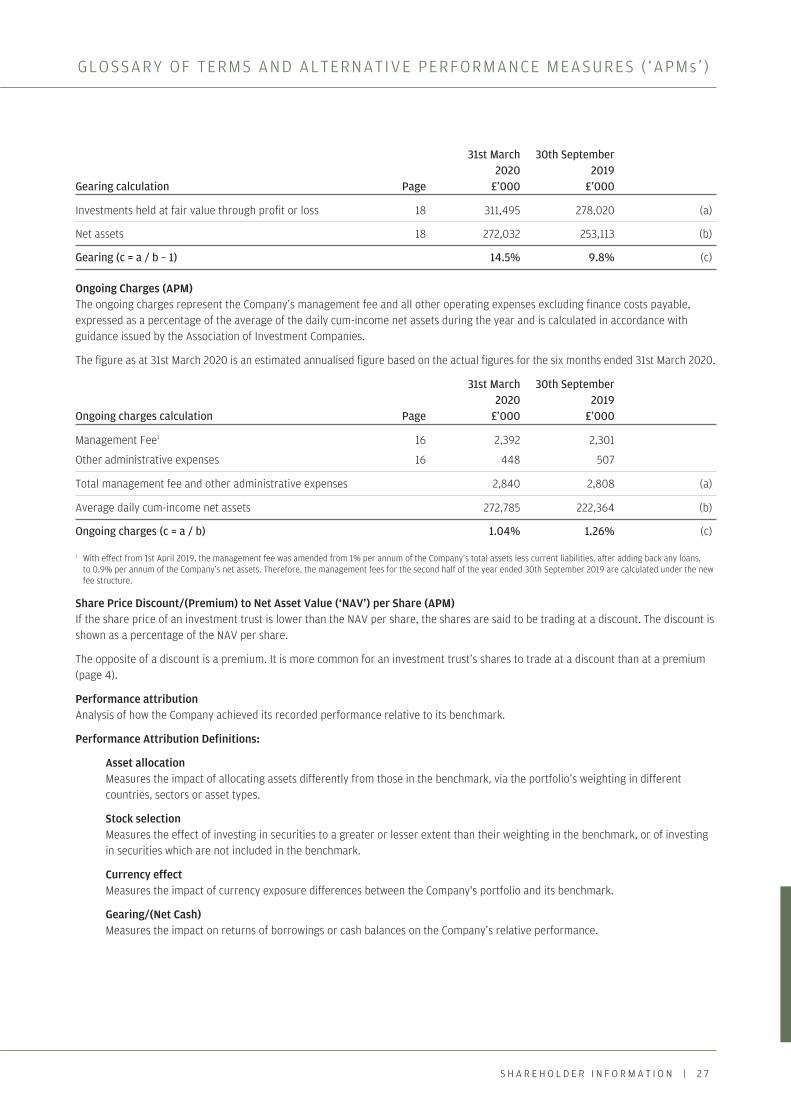
31st March 30th September 2020 2019 Gearing calculation Page £’000 £’000
Investments held at fair value through profit or loss 18 311,495 278,020 (a)
Net assets 18 272,032 253,113 (b)
Gearing (c = a / b – 1) 14.5% 9.8% (c)
Ongoing Charges (APM) The ongoing charges represent the Company’s management fee and all other operating expenses excluding finance costs payable, expressed as a percentage of the average of the daily cum-income net assets during the year and is calculated in accordance with guidance issued by the Association of Investment Companies.
The figure as at 31st March 2020 is an estimated annualised figure based on the actual figures for the six months ended 31st March 2020.
31st March 30th September 2020 2019 Ongoing charges calculation Page £’000 £’000
Management Fee1 16 2,392 2,301
Other administrative expenses 16 448 507
Total management fee and other administrative expenses 2,840 2,808 (a)
Average daily cum-income net assets 272,785 222,364 (b)
Ongoing charges (c = a / b) 1.04% 1.26% (c)
1 With effect from 1st April 2019, the management fee was amended from 1% per annum of the Company’s total assets less current liabilities, after adding back any loans, to 0.9% per annum of the Company’s net assets. Therefore, the management fees for the second half of the year ended 30th September 2019 are calculated under the new fee structure.
Share Price Discount/(Premium) to Net Asset Value (‘NAV’) per Share (APM) If the share price of an investment trust is lower than the NAV per share, the shares are said to be trading at a discount. The discount is shown as a percentage of the NAV per share.
The opposite of a discount is a premium. It is more common for an investment trust’s shares to trade at a discount than at a premium (page 4).
Performance attribution Analysis of how the Company achieved its recorded performance relative to its benchmark.
Performance Attribution Definitions:
Asset allocation Measures the impact of allocating assets differently from those in the benchmark, via the portfolio’s weighting in different countries, sectors or asset types.
Stock selection Measures the effect of investing in securities to a greater or lesser extent than their weighting in the benchmark, or of investing in securities which are not included in the benchmark.
Currency effect Measures the impact of currency exposure differences between the Company's portfolio and its benchmark.
Gearing/(Net Cash) Measures the impact on returns of borrowings or cash balances on the Company’s relative performance.
Chinese HY_pp25-32.qxp 22/05/2020 13:52 Page 27
GLOSSARY OF TERMS AND ALTERNATIVE PERFORMANCE MEASURES ( ‘APMs’ )
2 8 | J P M O R G A N C H I N A G R O W T H & I N C O M E P L C . H A L F Y E A R R E P O R T & F I N A N C I A L S T A T E M E N T S 2 0 2 0
Dividends/Residual Represents timing differences in respect of cash flows and dividends.
Management fee/Other expenses The payment of fees and expenses reduces the level of total assets, and therefore has a negative effect on relative performance.
Share Buyback Measures the enhancement to net asset value per share of buying back the Company’s shares for cancellation at a price which is less than the Company’s net asset value per share.
American Depositary Receipts (ADRs) Certificates that are traded on US stock exchanges representing a specified number of shares in a non-US company. ADRs are denominated and pay dividends in US dollars and may be traded like regular shares of stock.
China A-Shares Companies incorporated in mainland China and which are traded in the mainland A-Share markets. The prices of A-Shares are quoted in renminbi, and currently, only Mainland Chinese Investors and selected Foreign Institutional Investors are allowed to trade A-Shares.
The Company invests directly in China A-Shares and also gains access to the A-Share market by investing into China A-Share access products (participatory notes).
China B-Shares Companies incorporated in mainland China and traded on the mainland B-Share markets. The prices of B-Shares are quoted in US dollars and are available to both Mainland Chinese Investors and Foreign Institutional Investors.
Hong Kong H-Shares Companies incorporated in mainland China and listed in Hong Kong and other foreign stock exchanges.
Shanghai-Hong Kong Stock Connect A cross-boundary investment channel that connects the Shanghai Stock Exchange and the Hong Kong Stock Exchange. Under the program, investors in each market are able to trade shares on the other market using their local brokers and clearing houses.
Shenzhen-Hong Kong Stock Connect A cross-boundary investment channel that connects the Shenzhen Stock Exchange and the Hong Kong Stock Exchange. Under the program, investors in each market are able to trade shares on the other market using their local brokers and clearing houses.
Participatory Notes (or P-Notes) Financial instruments used to gain access to markets with capital controls. The notes are derivative products issued by brokers or other financial institutions that are allowed to invest directly in the restricted market.
Chinese HY_pp25-32.qxp 22/05/2020 13:52 Page 28
S H A R E H O L D E R I N F O R M A T I O N | 2 9
W H E R E T O B U Y J . P . M O R G A N I N V E S T M E N T T R U S T S
You can invest in a J.P. Morgan investment trust through the following:
1. Via a third party provider
Third party providers include:
Please note this list is not exhaustive and the availability of individual trusts may vary depending on the provider. These websites are third party sites and J.P. Morgan Asset Management does not endorse or recommend any. Please observe each site’s privacy and cookie policies as well as their platform charges structure.
The Board encourages all of its shareholders to exercise their rights and notes that many specialist platforms provide shareholders with the ability to receive company documentation, to vote their shares and to attend general meetings, at no cost. Please refer to your investment platform for more details, or visit the Association of Investment Companies’ (‘AIC’) website at www.theaic.co.uk/aic/shareholder-voting-consumer-platforms for information on which platforms support these services and how to utilise them.
2. Through a professional adviser
Professional advisers are usually able to access the products of all the companies in the market and can help you find an investment that suits your individual circumstances. An adviser will let you know the fee for their service before you go ahead. You can find an adviser at unbiased.co.uk
You may also buy investment trusts through stockbrokers, wealth managers and banks.
To familiarise yourself with the Financial Conduct Authority (FCA) adviser charging and commission rules, visit fca.org.uk
AJ Bell Barclays Smart Investor Charles Stanley Direct Fidelity FundsNetwork Halifax
Hargreaves Lansdown Interactive Investor Selftrade The Share Centre
Chinese HY_pp25-32.qxp 22/05/2020 13:52 Page 29

3 0 | J P M O R G A N C H I N A G R O W T H & I N C O M E P L C . H A L F Y E A R R E P O R T & F I N A N C I A L S T A T E M E N T S 2 0 2 0
S H A R E H O L D E R I N F O R M A T I O N
Avoid investment fraud1 Reject cold calls
If you’ve received unsolicited contact about an investment opportunity, chances are it’s a high risk investment or a scam. You should treat the call with extreme caution. The safest thing to do is to hang up.
2 Check the FCA Warning List The FCA Warning List is a list of firms and individuals we know are operating without our authorisation.
3 Get impartial advice Think about getting impartial financial advice before you hand over any money. Seek advice from someone unconnected to the firm that has approached you.
Report a ScamIf you suspect that you have been approached by fraudsters please tell the FCA using the reporting form at www.fca.org.uk/consumers/report-scam-unauthorised-firm. You can also call the FCA Consumer Helpline on 0800 111 6768
If you have lost money to investment fraud, you should report it to Action Fraud on 0300 123 2040 or online at www.actionfraud.police.uk
Find out more at www.fca.org.uk/scamsmart
Investment scams are designed to look like genuine investmentsSpot the warning signs
Have you been:
• contacted out of the blue• promised tempting returns
and told the investment is safe• called repeatedly, or• told the offer is only available
for a limited time?
If so, you might have been contacted by fraudsters. Remember: if it sounds too good to be true,
it probably is!
Be ScamSmart
Chinese HY_pp25-32.qxp 22/05/2020 13:52 Page 30
I N F O R M A T I O N A B O U T T H E C O M P A N Y
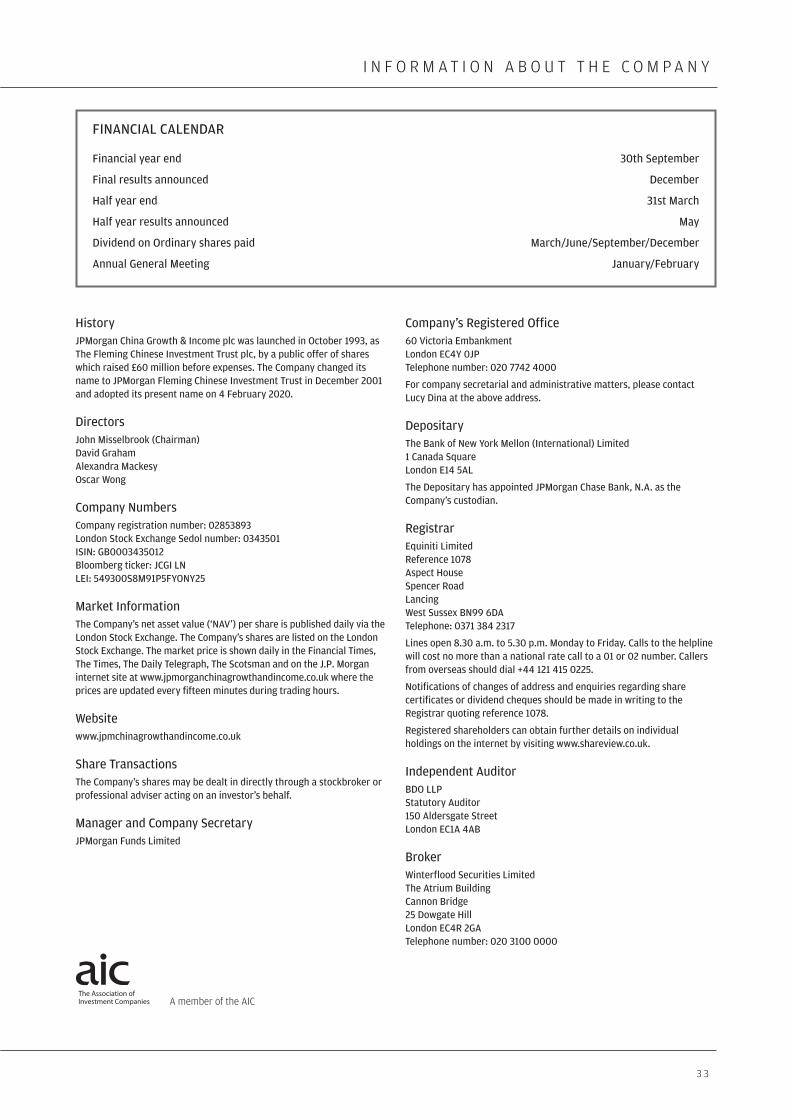
History JPMorgan China Growth & Income plc was launched in October 1993, as The Fleming Chinese Investment Trust plc, by a public offer of shares which raised £60 million before expenses. The Company changed its name to JPMorgan Fleming Chinese Investment Trust in December 2001 and adopted its present name on 4 February 2020.
Directors John Misselbrook (Chairman) David Graham Alexandra Mackesy Oscar Wong
Company Numbers Company registration number: 02853893 London Stock Exchange Sedol number: 0343501 ISIN: GB0003435012 Bloomberg ticker: JCGI LN LEI: 549300S8M91P5FYONY25
Market Information The Company’s net asset value (‘NAV’) per share is published daily via the London Stock Exchange. The Company’s shares are listed on the London Stock Exchange. The market price is shown daily in the Financial Times, The Times, The Daily Telegraph, The Scotsman and on the J.P. Morgan internet site at www.jpmorganchinagrowthandincome.co.uk where the prices are updated every fifteen minutes during trading hours.
Website www.jpmchinagrowthandincome.co.uk
Share Transactions The Company’s shares may be dealt in directly through a stockbroker or professional adviser acting on an investor’s behalf.
Manager and Company Secretary JPMorgan Funds Limited
Company’s Registered Office 60 Victoria Embankment London EC4Y 0JP Telephone number: 020 7742 4000
For company secretarial and administrative matters, please contact Lucy Dina at the above address.
Depositary The Bank of New York Mellon (International) Limited 1 Canada Square London E14 5AL
The Depositary has appointed JPMorgan Chase Bank, N.A. as the Company’s custodian.
Registrar Equiniti Limited Reference 1078 Aspect House Spencer Road Lancing West Sussex BN99 6DA Telephone: 0371 384 2317
Lines open 8.30 a.m. to 5.30 p.m. Monday to Friday. Calls to the helpline will cost no more than a national rate call to a 01 or 02 number. Callers from overseas should dial +44 121 415 0225.
Notifications of changes of address and enquiries regarding share certificates or dividend cheques should be made in writing to the Registrar quoting reference 1078.
Registered shareholders can obtain further details on individual holdings on the internet by visiting www.shareview.co.uk.
Independent Auditor BDO LLP Statutory Auditor 150 Aldersgate Street London EC1A 4AB
Broker Winterflood Securities Limited The Atrium Building Cannon Bridge 25 Dowgate Hill London EC4R 2GA Telephone number: 020 3100 0000
FINANCIAL CALENDAR
Financial year end 30th September
Final results announced December
Half year end 31st March
Half year results announced May
Dividend on Ordinary shares paid March/June/September/December
Annual General Meeting January/February
A member of the AIC
S H A R E H O L D E R I N F O R M A T I O N | 3 3
Chinese HY_cover.qxp 22/05/2020 14:15 Page IBC1
GB I104 | 05/20
CONTACT
60 Victoria Embankment London EC4Y 0JP Tel +44 (0) 20 7742 4000 Website www.jpmchinagrowthandincome.co.uk
100%
Chinese HY_cover.qxp 22/05/2020 14:15 Page BC2