Embed Size (px)
Citation preview

CONFIDENTIAL
June Quarter 2019 Results
August 15, 2019
Disclaimer
2
This presentation contains certain financial measures that are not recognized under generally accepted accounting principles in theUnited States (“GAAP”), including adjusted EBITDA (including adjusted EBITDA margin), adjusted EBITA (including adjusted EBITAmargin), marketplace-based core commerce adjusted EBITA, non-GAAP net income, non-GAAP diluted earnings per share/ADS andfree cash flow. For a reconciliation of these non-GAAP financial measures to the most directly comparable GAAP measures, seeGAAP to Adjusted/Non-GAAP Measures Reconciliation.This announcement contains forward-looking statements. These statements are made under the “safe harbor” provisions of theU.S. Private Securities Litigation Reform Act of 1995. These forward-looking statements can be identified by terminology such as“will,” “expects,” “anticipates,” “future,” “intends,” “plans,” “believes,” “estimates,” “potential,” “continue,” “ongoing,” “targets,”“guidance” and similar statements. Among other things, statements that are not historical facts, including statements aboutAlibaba’s strategies and business plans, Alibaba’s beliefs, expectations and guidance regarding the growth of its business and itsrevenue, the business outlook and quotations from management in this announcement, as well as Alibaba’s strategic andoperational plans, are or contain forward-looking statements. Alibaba may also make forward-looking statements in its periodicreports to the U.S. Securities and Exchange Commission (the “SEC”), in press releases and other written materials and in oralstatements made by its officers, directors or employees to third parties. Forward-looking statements involve inherent risks anduncertainties. A number of factors could cause actual results to differ materially from those contained in any forward-lookingstatement, including but not limited to the following: Alibaba’s expected revenue growth; Alibaba’s goals and strategies; Alibaba’sfuture business development; Alibaba’s ability to maintain the trusted status of its digital economy; risks associated with sustainedinvestments in Alibaba’s business, strategic acquisitions and investments; Alibaba’s ability to maintain or grow its revenue orbusiness, to compete effectively and to maintain and improve the network effect of its digital economy; Alibaba’s ability tomaintain its culture and to continue to innovate; risks associated with Alibaba’s growing business and operations, includinginternational and cross-border business and operations; and fluctuations in general economic and business conditions in China andglobally. Further information regarding these and other risks is included in Alibaba’s filings with the SEC. All information provided inthis results announcement is as of the date of this results announcement and are based on assumptions that we believe to bereasonable as of this date, and Alibaba does not undertake any obligation to update any forward-looking statement, except asrequired under applicable law.

CONFIDENTIAL
Financial Results
4
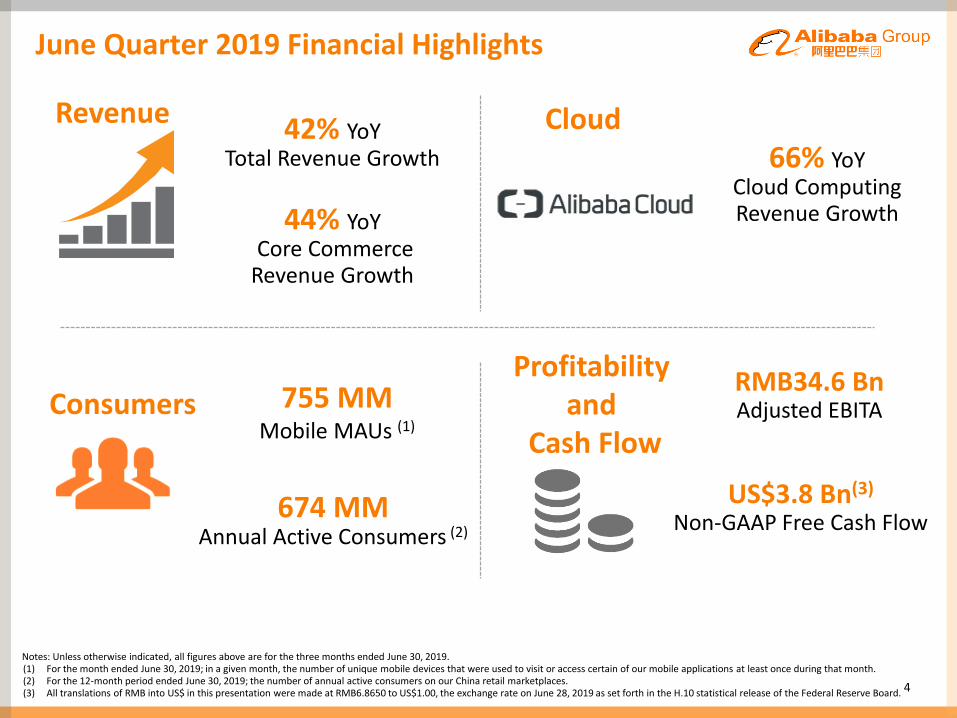
755 MM Mobile MAUs (1)
Notes: Unless otherwise indicated, all figures above are for the three months ended June 30, 2019.(1) For the month ended June 30, 2019; in a given month, the number of unique mobile devices that were used to visit or access certain of our mobile applications at least once during that month.(2) For the 12-month period ended June 30, 2019; the number of annual active consumers on our China retail marketplaces.(3) All translations of RMB into US$ in this presentation were made at RMB6.8650 to US$1.00, the exchange rate on June 28, 2019 as set forth in the H.10 statistical release of the Federal Reserve Board.
June Quarter 2019 Financial Highlights
42% YoY Total Revenue Growth
674 MMAnnual Active Consumers (2)
66% YoYCloud Computing Revenue Growth 44% YoY
Core CommerceRevenue Growth
RMB34.6 BnAdjusted EBITA
Revenue Cloud
Profitability and
Cash FlowConsumers
US$3.8 Bn(3)
Non-GAAP Free Cash Flow
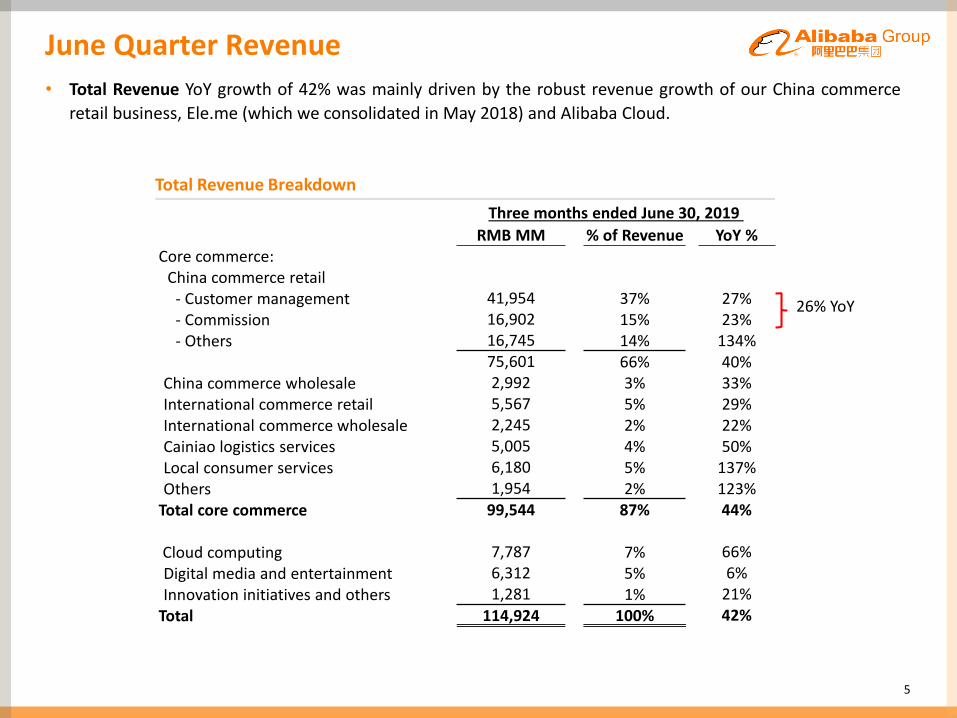
• Total Revenue YoY growth of 42% was mainly driven by the robust revenue growth of our China commerce
retail business, Ele.me (which we consolidated in May 2018) and Alibaba Cloud.
Total Revenue Breakdown
June Quarter Revenue
5
Three months ended June 30, 2019
RMB MM % of Revenue YoY %Core commerce:
China commerce retail- Customer management 41,954 37% 27%- Commission 16,902 15% 23%- Others 16,745 14% 134%
75,601 66% 40%China commerce wholesale 2,992 3% 33%International commerce retail 5,567 5% 29%International commerce wholesale 2,245 2% 22%Cainiao logistics services 5,005 4% 50%Local consumer services 6,180 5% 137%Others 1,954 2% 123%
Total core commerce 99,544 87% 44%
Cloud computing 7,787 7% 66%
Digital media and entertainment 6,312 5% 6%
Innovation initiatives and others 1,281 1% 21%
Total 114,924 100% 42%
26% YoY

2.7
6.0 4.8
Jun 30, 2018 Mar 31, 2019 Jun 30, 2019
6
June Quarter Cost Trends
Cost of Revenue (Excluding SBC) Product Development Expenses (Excluding SBC)
5.0 5.9
7.5
Jun 30, 2018 Mar 31, 2019 Jun 30, 2019
Sales & Marketing Expenses (Excluding SBC)
6.9 8.9 9.8
Jun 30, 2018 Mar 31, 2019 Jun 30, 2019
General & Administrative Expenses (Excluding SBC)
(RMB Bn) (RMB Bn)
(RMB Bn) (RMB Bn)
39.9 53.7 58.2
Jun 30, 2018 Mar 31, 2019 June 30, 2019
58% 51%
Note: For the three months ended on the respective dates.
50%% of Revenue
7%6%% of Revenue
7%
8%8%% of
Revenue9% 4%3%
% of Revenue
6%
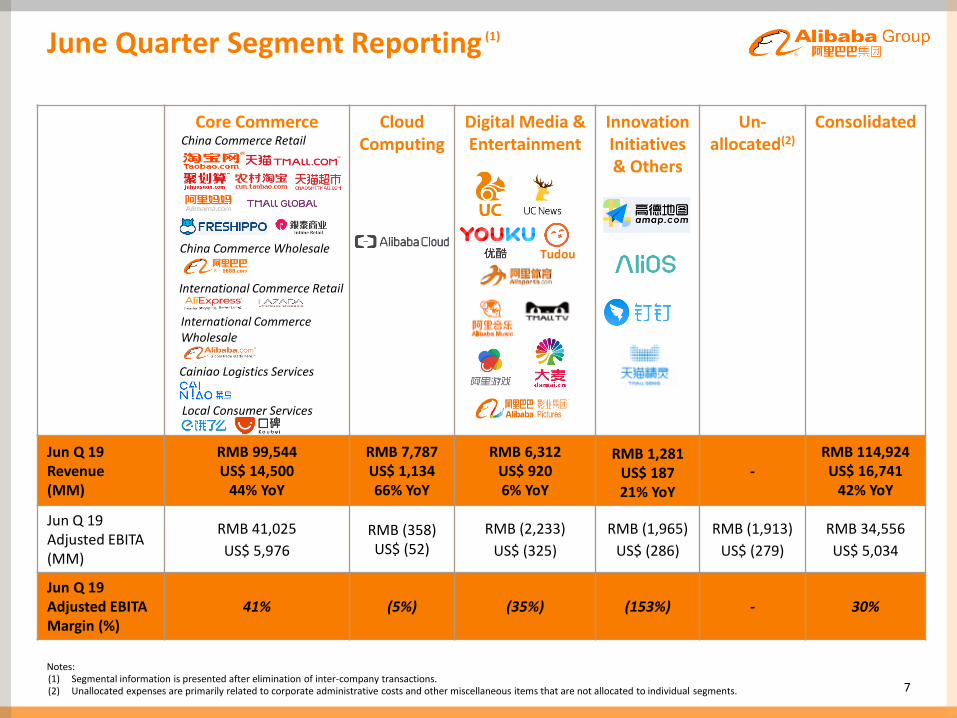
June Quarter Segment Reporting
7
Core Commerce Cloud Computing
Digital Media & Entertainment
Innovation Initiatives& Others
Un-allocated(2)
Consolidated
Jun Q 19 Revenue (MM)
RMB 99,544US$ 14,500
44% YoY
RMB 7,787US$ 1,13466% YoY
RMB 6,312US$ 9206% YoY
RMB 1,281US$ 18721% YoY
-RMB 114,924US$ 16,741
42% YoY
Jun Q 19 Adjusted EBITA (MM)
RMB 41,025
US$ 5,976
RMB (358)US$ (52)
RMB (2,233)
US$ (325)
RMB (1,965)
US$ (286)
RMB (1,913)
US$ (279)
RMB 34,556
US$ 5,034
Jun Q 19 Adjusted EBITA Margin (%)
41% (5%) (35%) (153%) - 30%
International Commerce Wholesale
China Commerce Wholesale
International Commerce Retail
Notes:(1) Segmental information is presented after elimination of inter-company transactions.(2) Unallocated expenses are primarily related to corporate administrative costs and other miscellaneous items that are not allocated to individual segments.
Tudou
China Commerce Retail
Cainiao Logistics Services
Local Consumer Services
(1)
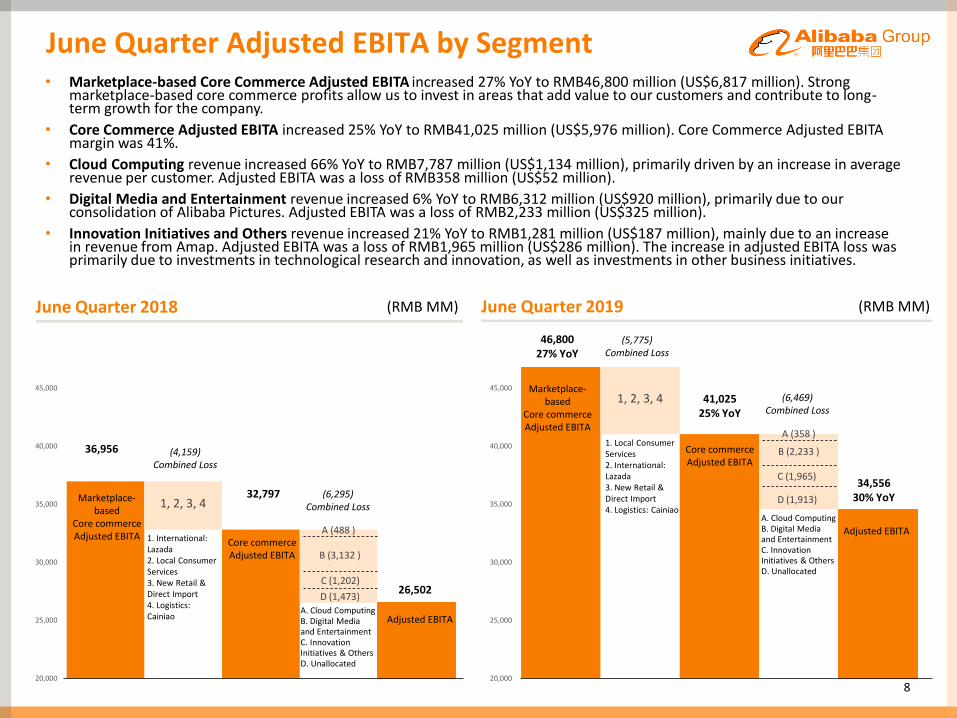
1, 2, 3, 4
B (3,132 )
A (488 )
20,000
25,000
30,000
35,000
40,000
45,000
36,956
Marketplace-based
Core commerceAdjusted EBITA
8
June Quarter 2018 (RMB MM)
A. Cloud ComputingB. Digital Media and EntertainmentC. Innovation Initiatives & Others D. Unallocated
June Quarter Adjusted EBITA by Segment
1. International: Lazada2. Local Consumer Services3. New Retail & Direct Import4. Logistics: Cainiao
Core commerceAdjusted EBITA
Adjusted EBITA
(4,159)Combined Loss
32,797 (6,295)Combined Loss
26,502
1, 2, 3, 4
B (2,233 )
A (358 )
20,000
25,000
30,000
35,000
40,000
45,000
June Quarter 2019 (RMB MM)
46,80027% YoY
A. Cloud ComputingB. Digital Media and EntertainmentC. Innovation Initiatives & Others D. Unallocated
1. Local Consumer Services2. International: Lazada3. New Retail & Direct Import4. Logistics: Cainiao
Core commerceAdjusted EBITA
Adjusted EBITA
Marketplace-based
Core commerceAdjusted EBITA
(5,775)Combined Loss
41,02525% YoY
(6,469)Combined Loss
34,55630% YoY
• Marketplace-based Core Commerce Adjusted EBITA increased 27% YoY to RMB46,800 million (US$6,817 million). Strong marketplace-based core commerce profits allow us to invest in areas that add value to our customers and contribute to long-term growth for the company.
• Core Commerce Adjusted EBITA increased 25% YoY to RMB41,025 million (US$5,976 million). Core Commerce Adjusted EBITA margin was 41%.
• Cloud Computing revenue increased 66% YoY to RMB7,787 million (US$1,134 million), primarily driven by an increase in average revenue per customer. Adjusted EBITA was a loss of RMB358 million (US$52 million).
• Digital Media and Entertainment revenue increased 6% YoY to RMB6,312 million (US$920 million), primarily due to our consolidation of Alibaba Pictures. Adjusted EBITA was a loss of RMB2,233 million (US$325 million).
• Innovation Initiatives and Others revenue increased 21% YoY to RMB1,281 million (US$187 million), mainly due to an increase in revenue from Amap. Adjusted EBITA was a loss of RMB1,965 million (US$286 million). The increase in adjusted EBITA loss was primarily due to investments in technological research and innovation, as well as investments in other business initiatives.
C (1,202)
D (1,473)
C (1,965)
D (1,913)

Free Cash Flow & Capital Expenditures
9
Non-GAAP Free Cash Flow (1)
(RMB Bn)
Notes:(1) Non-GAAP free cash flow represents net cash provided by operating activities as presented in Alibaba Group’s consolidated cash flow statement less purchases of property and equipment
(excluding acquisition of land use rights and construction in progress relating to office campus), licensed copyrights and other intangible assets.(2) Operating CAPEX refers to the purchases of property and equipment (excluding land use rights and construction in progress relating to office campus).
• As of June 30, 2019, cash, cash equivalent and short-term investments were RMB212,189 million (US$30,909 million). The increase from last quarter was primarily due to free cash flow generated from operations, partly offset by net cash used in investment and acquisition activities.
• During the June quarter, we generated operating cash flow of RMB34,612 million (US$5,042 million), a decrease of 4% YoY, which was mainly due to a decrease in annual payment of royalty fees and software technology services fees from Ant Financialand payment of a US$250 million cash settlement of a U.S. federal class action lawsuit that we agreed last quarter. We generated healthy free cash flow of RMB26,361 million (US$3,840 million).
Capital Expenditures, Licensed Copyrights and Other Intangible Assets
(RMB Bn)
26.4 26.4
Jun 30, 2018 Jun 30, 2019
US$3.8 Bn
5.0 5.9
4.8 2.4
1.4
0.5
Jun 30, 2018 Jun 30, 2019
Land Use Rights and Construction in Progress Relating to Office Campus
Licensed Copyrights and Other Intangible Assets
Operating Capex
11.2
8.8
(2)
10
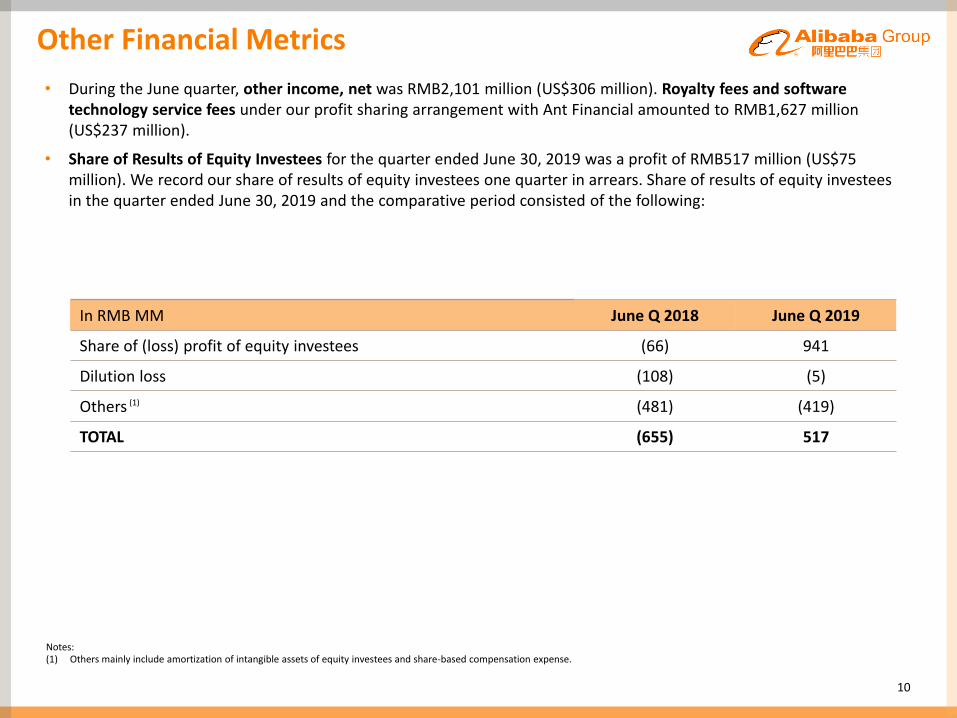
Other Financial Metrics
In RMB MM June Q 2018 June Q 2019
Share of (loss) profit of equity investees (66) 941
Dilution loss (108) (5)
Others (481) (419)
TOTAL (655) 517
• During the June quarter, other income, net was RMB2,101 million (US$306 million). Royalty fees and software technology service fees under our profit sharing arrangement with Ant Financial amounted to RMB1,627 million (US$237 million).
• Share of Results of Equity Investees for the quarter ended June 30, 2019 was a profit of RMB517 million (US$75 million). We record our share of results of equity investees one quarter in arrears. Share of results of equity investees in the quarter ended June 30, 2019 and the comparative period consisted of the following:
Notes:(1) Others mainly include amortization of intangible assets of equity investees and share-based compensation expense.
(1)
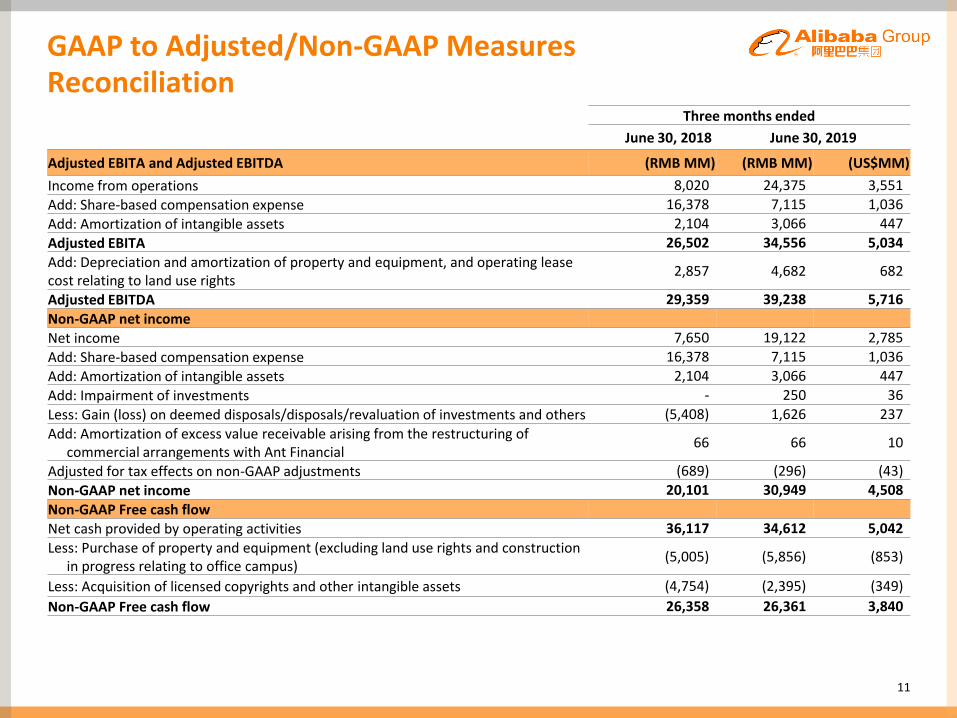
GAAP to Adjusted/Non-GAAP Measures Reconciliation
11
Three months ended
June 30, 2018 June 30, 2019
Adjusted EBITA and Adjusted EBITDA (RMB MM) (RMB MM) (US$MM)
Income from operations 8,020 24,375 3,551
Add: Share-based compensation expense 16,378 7,115 1,036
Add: Amortization of intangible assets 2,104 3,066 447
Adjusted EBITA 26,502 34,556 5,034
Add: Depreciation and amortization of property and equipment, and operating lease cost relating to land use rights
2,857 4,682 682
Adjusted EBITDA 29,359 39,238 5,716
Non-GAAP net incomeNet income 7,650 19,122 2,785
Add: Share-based compensation expense 16,378 7,115 1,036
Add: Amortization of intangible assets 2,104 3,066 447
Add: Impairment of investments - 250 36
Less: Gain (loss) on deemed disposals/disposals/revaluation of investments and others (5,408) 1,626 237
Add: Amortization of excess value receivable arising from the restructuring of commercial arrangements with Ant Financial
66 66 10
Adjusted for tax effects on non-GAAP adjustments (689) (296) (43)
Non-GAAP net income 20,101 30,949 4,508
Non-GAAP Free cash flowNet cash provided by operating activities 36,117 34,612 5,042
Less: Purchase of property and equipment (excluding land use rights and construction in progress relating to office campus)
(5,005) (5,856) (853)
Less: Acquisition of licensed copyrights and other intangible assets (4,754) (2,395) (349)
Non-GAAP Free cash flow 26,358 26,361 3,840
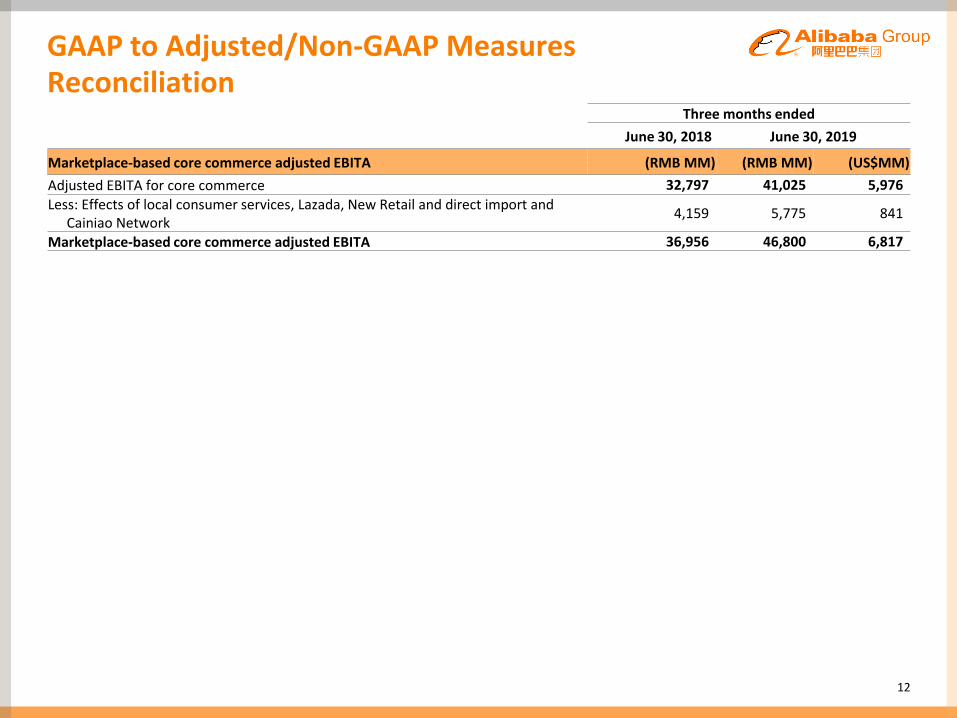
GAAP to Adjusted/Non-GAAP Measures Reconciliation
12
Three months ended
June 30, 2018 June 30, 2019
Marketplace-based core commerce adjusted EBITA (RMB MM) (RMB MM) (US$MM)
Adjusted EBITA for core commerce 32,797 41,025 5,976
Less: Effects of local consumer services, Lazada, New Retail and direct import and Cainiao Network
4,159 5,775 841
Marketplace-based core commerce adjusted EBITA 36,956 46,800 6,817

CONFIDENTIAL